Modelling bituminous surfacing distress data using ... · Modelling bituminous surfacing distress...
12
Modelling bituminous surfacing distress data using logistic regression R. A. Hassan Swinburne University of Technology, Australia Abstract The objective of this paper is to report the modelling of deterioration models for pavement surfacing distresses using logistic regression and present relevant outputs. The data used in this exercise covers a network of 6450 sections with a total length of 8180 lane-km. Distress data used in the modelling include cracking, texture loss and stone loss of different pavement surfacing types. The latter includes dense graded and stone mastic asphalt, open graded asphalt, ultra- thin asphalt, spray seal and geotextile seal (spray seal with geotextile underlay). These condition data are collected using visual inspection surveys. They are conducted every two to three years by experienced personnel following detailed guidelines. The two variables used in the modelling are distress rating and surfacing age. The rating scale used to rate each of the distress categories is: Good = 0, Minor = 1, Moderate = 3 and Extensive =5. Logistic regression is most suited for modelling this type of data as the residuals will not be normally distributed since there are only a few possible values. Most of the models proved to be significant with high success rates in prediction accuracy. A comparison in the performance of the different surfacing types is also provided. Keywords: logistic regression, pavement surface distress, asphalt surfacing, spray seal, flexible pavement. 1 Introduction In different regions of Melbourne/Australia, pavement surface condition data is collected using visual assessment. The subjective rating surveys are conducted by experienced personnel every 2–3 years following detailed guidelines. The collected condition data includes ratings of surface distresses such as cracking, Urban Transport XXI 435 www.witpress.com, ISSN 1743-3509 (on-line) WIT Transactions on The Built Environment, Vol 146, © 2015 WIT Press doi:10.2495/UT150351
-
Upload
duongtuong -
Category
Documents
-
view
223 -
download
0
Transcript of Modelling bituminous surfacing distress data using ... · Modelling bituminous surfacing distress...
Modelling bituminous surfacing distress data using logistic regression
R. A. Hassan Swinburne University of Technology, Australia
Abstract
The objective of this paper is to report the modelling of deterioration models for pavement surfacing distresses using logistic regression and present relevant outputs. The data used in this exercise covers a network of 6450 sections with a total length of 8180 lane-km. Distress data used in the modelling include cracking, texture loss and stone loss of different pavement surfacing types. The latter includes dense graded and stone mastic asphalt, open graded asphalt, ultra-thin asphalt, spray seal and geotextile seal (spray seal with geotextile underlay). These condition data are collected using visual inspection surveys. They are conducted every two to three years by experienced personnel following detailed guidelines. The two variables used in the modelling are distress rating and surfacing age. The rating scale used to rate each of the distress categories is: Good = 0, Minor = 1, Moderate = 3 and Extensive =5. Logistic regression is most suited for modelling this type of data as the residuals will not be normally distributed since there are only a few possible values. Most of the models proved to be significant with high success rates in prediction accuracy. A comparison in the performance of the different surfacing types is also provided. Keywords: logistic regression, pavement surface distress, asphalt surfacing, spray seal, flexible pavement.
1 Introduction
In different regions of Melbourne/Australia, pavement surface condition data is collected using visual assessment. The subjective rating surveys are conducted by experienced personnel every 2–3 years following detailed guidelines. The collected condition data includes ratings of surface distresses such as cracking,
Urban Transport XXI 435
www.witpress.com, ISSN 1743-3509 (on-line) WIT Transactions on The Built Environment, Vol 146, © 2015 WIT Press
doi:10.2495/UT150351
texture loss and patching. This data is used by relevant agencies for triggering and prioritising resurfacing and resealing operations. To enable asset managers forecast network condition and prepare short and long term maintenance programs and estimate budget requirements, there is a need for reliable deterioration models. The aim of this paper is to report the process and outputs of modelling the subjective pavement distress data using probabilistic logistic regression. This approach has been used by others for developing deterioration models of different pavement condition parameters including subjective and objective measures, for network management. Applications of probabilistic logistic regression models for pavement deterioration have been reported in [1–3]. Distress data modelled herein includes cracking (CRK), texture loss (TEXT) and stone loss (STONE). These distresses are considered, by the relevant road agency, as the most important for triggering maintenance programs to preserve the pavement and ensure users’ safety. The following sections provide descriptions of the network and the data sets used in the modelling. This is followed by a description of the application of logistic regression to the data, the outputs and interpretation of results. A discussion is then presented on the suitability of the developed models for implementation. Also provided is a brief comparison of predicted performance of the different surface types available in the sample network.
2 Data preparation
2.1 The network
The sample network consists of mainly flexible granular pavements that are located in similar climatic conditions. Urban pavements have Asphalt surfacing and rural pavements, which carry lower traffic volumes, are sealed with one or double coats of spray seal. Each of these Asphalt and Seal networks can be further divided into the following five sub-networks: Dense Graded and Stone Mastic Asphalt (AC), Ultra-thin Asphalt (UTA), Open graded asphalt (OGA), Spray/chip Seal (SS), Geotextile Seal (GEO, chip seal with geotextile underlay). These surfacing types make up the following proportions of the total network length of 2718 km; 45%, 6.4%, 3.6%, 37.3% and 7.6%, respectively. For deterioration modelling a large sample from each of the five sub-networks has been used in this study. Each sample includes the distress data of through lanes only with surface ages < 25 years. Sections with ages > 25 are considered, by the relevant road agency, to be outliers hence, were removed. The characteristics and data coverage for each sub-network are presented next.
2.2 Condition data
Distress data collected for AC, OGA and UTA include cracking, patching, stone loss, texture loss and deformation. For SS and GEO, they include the aforementioned five distresses in addition to binder level and binder loss. Each distress is rated using a four level scale with ratings of 0, 1, 3 and 5 for
436 Urban Transport XXI
www.witpress.com, ISSN 1743-3509 (on-line) WIT Transactions on The Built Environment, Vol 146, © 2015 WIT Press

nil distress, minor distress, moderate distress and extensive distress, respectively. The assigned rating is based on the combination of severity and extent of the distress and reflects the influence of the level of distress on the estimated remaining life of the surface. A rating of 5 indicates major distress with a strong influence and reduction in remaining life [4]. For the sample networks, the three distresses modelled herein, cracking, texture and stone loss are deemed the most relevant for triggering and planning maintenance programs considering their influence on asset’s remaining life and users’ safety. Surface condition data from 2012 survey was used in the modelling. Data from this survey was the most recent at the time this study was performed. The data set for each sub-network contained a relatively wide range of surface condition ratings at different surface ages for most distresses as can be seen in Table 1.
Table 1: Descriptive information of the 2012 sample data sets for the five sub-networks.
Sub-network
Lane- km Sections
No. Age
range CRK range
STONE range
TEXT range
AC 3258 3848 0–25 0–5 0–5 0–3
OGA 372 67 1–18 0–3 0–3 0–1
UTA 435 282 1–22 0–5 0–5 0–3
SS 3651 1994 0–25 0–5 0–3 0–5
GEO 463 257 0–22 0–3 0–3 0–3
3 Logistic regression
Regression analysis was deemed unsuitable for the type of distress data as it violates the assumption of normally distributed residuals. Since the rating of any distress has only four possible values, the residuals will have only few values for each age then they cannot be normally distributed. Hence logistic regression analysis is used for the modelling herein. Logistic regression builds a linear model based on a transformed variable (the Dependent Variable, DV) using a link function referred to as the Logit function or model, which is the log of the odds that an event occurs. The maximum likelihood estimation procedure is used to obtain the estimates of the regression coefficients by maximising the value of log-likelihood function through an iterative process with the aim of making the likelihood of observed data greater [5]. The number of logistic regression equations required is usually lower by one category because one of the prediction categories is chosen as a reference category. The assumptions considered in the modelling are that all pavements have been designed in accordance with relevant guidelines i.e. variations in traffic loading and subgrade strength have been accounted for in the design of pavement structure. Further, all pavements are subject to similar levels of routine maintenance and located in similar climatic conditions.
Urban Transport XXI 437
www.witpress.com, ISSN 1743-3509 (on-line) WIT Transactions on The Built Environment, Vol 146, © 2015 WIT Press
Considering these assumptions, surface age was used as the only predictor (i.e. independent variable, IV) of distress rating (i.e. DV). The numerical rating data was converted to categorical data i.e. each condition rating was assigned a condition category as shown below. Table 2 presents for each sub-network the actual proportions of sections, in 2012, with different ratings for each of the three distress types. 0 = Very Good (VG) 1 = Good (G) 3 = Poor (P), and 5 = Very Poor (VP)
Table 2: Proportions (%) of sections with different ratings for the three distress types.
Rating VP % P % G % VG % Total No
AC
CRK 5.5 18.9 45.1 30.4 3848
STONE 0.4 12.9 40.1 46.6
TEXT 0 1.2 8.8 90
OGA
CRK 0 11.9 34.3 53.7 67
STONE 0 25.4 32.8 41.8
UTA
CRK 5.7 22.3 57.4 14.5 282
STONE 4.3 34.4 53.5 7.8
TEXT 0 2.5 8.5 89
SS
CRK 1.4 7.5 53.7 37.4 1994
STONE 0 5.4 29.9 64.6
TEXT 1.1 15.1 39.9 43.9
GEO
CRK 0 8.2 60.3 31.5 257
STONE 0 13.2 49.4 37.4
TEXT 0 24.1 31.5 44.4
SPSS statistical software was used to conduct logistic regression analysis. The forms of logistic regression model used herein include ordinal and multinomial as described below [6]. Ordinal logistic regression was in the analysis used except when the resulting models were not significant then multinomial logistic regression was used. Ordinal; used when ordering within DV categories is important. In this
type, the Logits of all DV categories are parallel i.e. it predicts similar regression coefficients but different intercepts for the different DV categories.
Multinomial is similar to ordinal logistic regression, except for that there is no order to the categories of the outcome variable. It is used when the assumption of parallel lines for ordinal logistic regression is not satisfied for the IV. It predicts different intercepts and coefficients for the different DV categories.
438 Urban Transport XXI
www.witpress.com, ISSN 1743-3509 (on-line) WIT Transactions on The Built Environment, Vol 146, © 2015 WIT Press
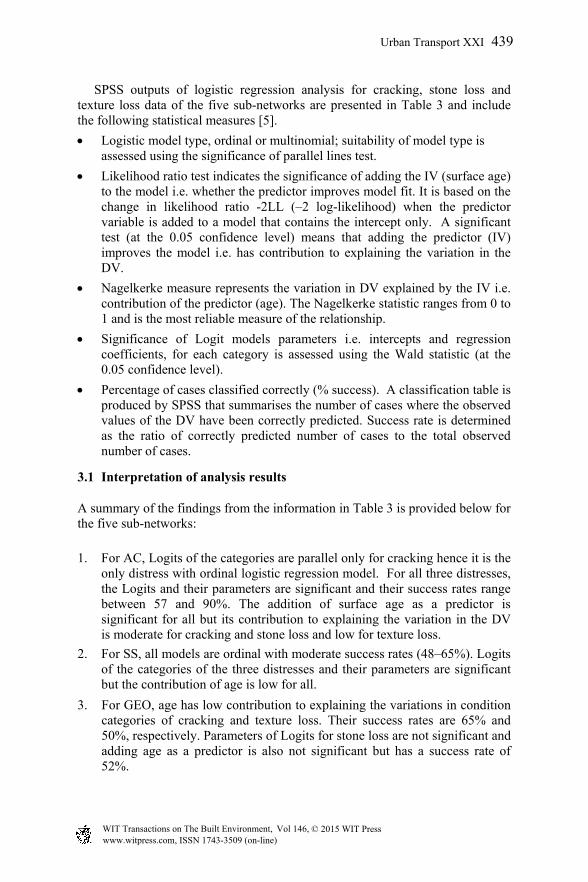
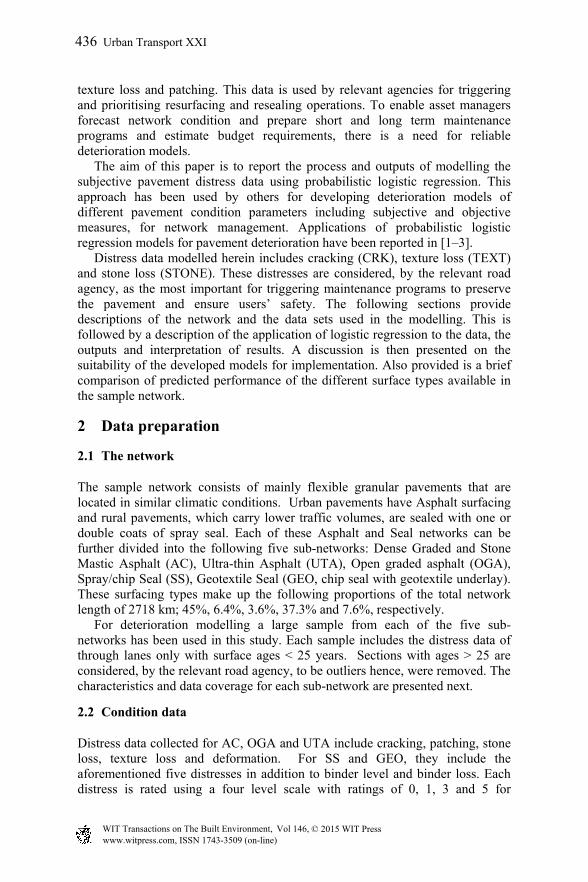
SPSS outputs of logistic regression analysis for cracking, stone loss and texture loss data of the five sub-networks are presented in Table 3 and include the following statistical measures [5].
Logistic model type, ordinal or multinomial; suitability of model type is assessed using the significance of parallel lines test.
Likelihood ratio test indicates the significance of adding the IV (surface age) to the model i.e. whether the predictor improves model fit. It is based on the change in likelihood ratio -2LL (–2 log-likelihood) when the predictor variable is added to a model that contains the intercept only. A significant test (at the 0.05 confidence level) means that adding the predictor (IV) improves the model i.e. has contribution to explaining the variation in the DV.
Nagelkerke measure represents the variation in DV explained by the IV i.e. contribution of the predictor (age). The Nagelkerke statistic ranges from 0 to 1 and is the most reliable measure of the relationship.
Significance of Logit models parameters i.e. intercepts and regression coefficients, for each category is assessed using the Wald statistic (at the 0.05 confidence level).
Percentage of cases classified correctly (% success). A classification table is produced by SPSS that summarises the number of cases where the observed values of the DV have been correctly predicted. Success rate is determined as the ratio of correctly predicted number of cases to the total observed number of cases.
3.1 Interpretation of analysis results
A summary of the findings from the information in Table 3 is provided below for the five sub-networks:
1. For AC, Logits of the categories are parallel only for cracking hence it is the only distress with ordinal logistic regression model. For all three distresses, the Logits and their parameters are significant and their success rates range between 57 and 90%. The addition of surface age as a predictor is significant for all but its contribution to explaining the variation in the DV is moderate for cracking and stone loss and low for texture loss.
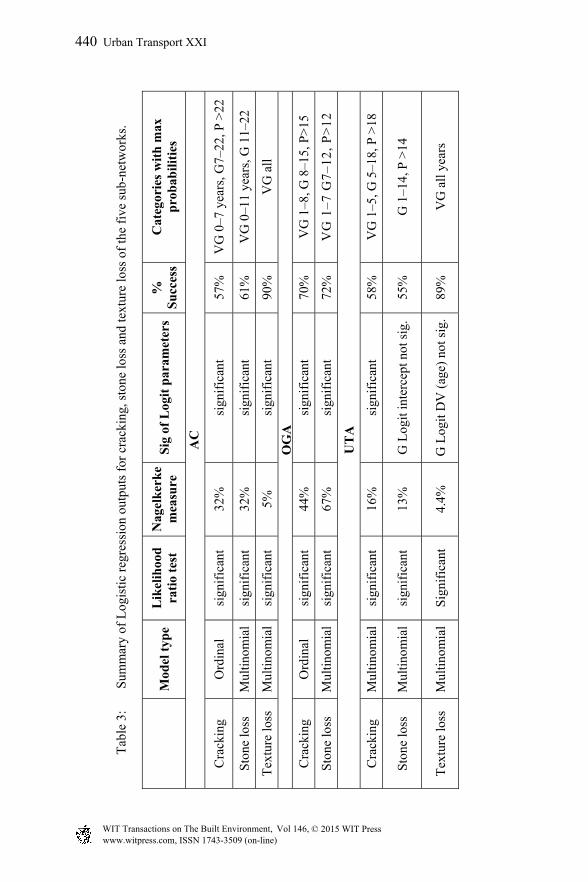
2. For SS, all models are ordinal with moderate success rates (48–65%). Logits of the categories of the three distresses and their parameters are significant but the contribution of age is low for all.
3. For GEO, age has low contribution to explaining the variations in condition categories of cracking and texture loss. Their success rates are 65% and 50%, respectively. Parameters of Logits for stone loss are not significant and adding age as a predictor is also not significant but has a success rate of 52%.
Urban Transport XXI 439
www.witpress.com, ISSN 1743-3509 (on-line) WIT Transactions on The Built Environment, Vol 146, © 2015 WIT Press
Tab
le 3
: S
umm
ary
of L
ogis
tic r
egre
ssio
n ou
tput
s fo
r cr
acki
ng, s
tone
loss
and
text
ure
loss
of
the
five
sub
-net
wor
ks.
M
odel
typ
e L
ikel
ihoo
d ra
tio
test
N
agel
ker
ke
mea
sure
S
ig o
f L
ogit
par
amet
ers
%
Su
cces
sC
ateg
orie
s w
ith
max
p
roba
bili
ties
AC
Cra
ckin
g O
rdin
al
sign
ific
ant
32%
si
gnif
ican
t 57
%
VG
0–7
yea
rs, G
7–22
, P >
22
Sto
ne lo
ss
Mul
tinom
ial
sign
ific
ant
32%
si
gnif
ican
t 61
%
VG
0–1
1 ye
ars,
G 1
1–22
Tex
ture
loss
M
ultin
omia
lsi
gnif
ican
t 5%
si
gnif
ican
t 90
%
VG
all
OG
AC
rack
ing
Ord
inal
si
gnif
ican
t 44
%
sign
ific
ant
70%
V
G 1
–8, G
8–1
5, P
>15
Sto
ne lo
ss
Mul
tinom
ial
sign
ific
ant
67%
si
gnif
ican
t 72
%
VG
1–7
G7–
12,
P>
12
UT
A
Cra
ckin
g M
ultin
omia
lsi
gnif
ican
t 16
%
sign
ific
ant
58%
V
G 1
–5, G
5–1
8, P
>18
Sto
ne lo
ss
Mul
tinom
ial
sign
ific
ant
13%
G
Log
it in
terc
ept n
ot s
ig.
55%
G
1–1
4, P
>14
Tex
ture
loss
M
ultin
omia
lS
igni
fica
nt
4.4%
G
Log
it D
V (
age)
not
sig
.89
%
VG
all
year
s
440 Urban Transport XXI
www.witpress.com, ISSN 1743-3509 (on-line) WIT Transactions on The Built Environment, Vol 146, © 2015 WIT Press
Tab
le 3
: C
ontin
ued.
M
odel
typ
e L
ikel
ihoo
d ra
tio
test
N
agel
ker
ke
mea
sure
S
ig o
f L
ogit
par
amet
ers
%
Su
cces
sC
ateg
orie
s w
ith
max
p
roba
bili
ties
SS
Cra
ckin
g O
rdin
al
Sig
nifi
cant
13
%
sign
ific
ant
61%
V
G 0
–7, G
>7
year
s
Sto
ne lo
ss
Ord
inal
si
gnif
ican
t 0.
4%
sign
ific
ant
65%
V
G a
ll ye
ars
Tex
ture
loss
O
rdin
al
sign
ific
ant
1.6%
si
gnif
ican
t 48
%
VG
1–1
2 ye
ars,
G >
12
GE
O
Cra
ckin
g M
ultin
omia
lsi
gnif
ican
t 13
%
sign
ific
ant
65%
V
G 1
–5, G
>5
yea
rs
Sto
ne lo
ss
Mul
tinom
ial
not
sign
ific
ant
1.3%
no
t sig
nifi
cant
52
%
G 0
–9, P
9–1
4, V
P >
14
Tex
ture
loss
M
ultin
omia
lsi
gnif
ican
t 10
%
sign
ific
ant
50%
V
G 1
–12,
G >
12
Urban Transport XXI 441
www.witpress.com, ISSN 1743-3509 (on-line) WIT Transactions on The Built Environment, Vol 146, © 2015 WIT Press

4. For OGA, the success rates of models for cracking and stone loss are 70% and 72%, respectively. However, their Logits parameters are significant with high contribution from age. No model was developed for texture loss due to limited variation in the DV data across all ages.
5. For UTA, adding the predictor, age, to the models of distresses is significant but with low contribution. However, not all parameters of Logits for stone and texture loss are significant. Cracking, texture loss and stone loss models have success rates of 58%, 89% and 55%, respectively.
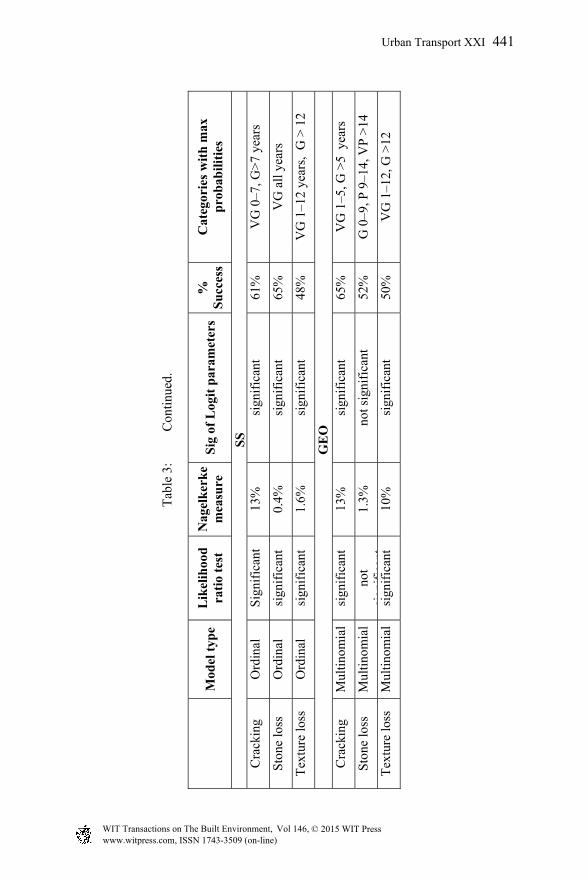
The success rate of logistic models on average is 65% which is similar to the 60% success rate reported in [2] for their data. The output of logistic regression analysis also includes the estimated individual probabilities for each condition category. They are reported in the format shown in Table 4 for SS cracking and presented graphically in Figure 1 using line chart. They present the logistic regression models for the four condition categories i.e. probability of being in one or other category as a function of age. These models can be used to predict, at any age, the probability of a pavement segment to be in any of the four
Table 4: Logistic regression probabilities for SS cracking and weighted average condition values.
Age VG G P VP Average condition 0 0.6844 0.295 0.0176 0.003 0.361 0.6521 0.3242 0.0203 0.0034 0.402 0.6183 0.3543 0.0234 0.004 0.443 0.5834 0.3851 0.0269 0.0046 0.494 0.5476 0.4162 0.031 0.0053 0.545 0.5113 0.447 0.0356 0.0061 0.586 0.4749 0.4772 0.0409 0.0071 0.647 0.4387 0.5062 0.0469 0.0082 0.698 0.4032 0.5337 0.0537 0.0094 0.749 0.3687 0.559 0.0614 0.0109 0.80
10 0.3354 0.5818 0.0702 0.0126 0.8611 0.3037 0.6018 0.08 0.0145 0.9112 0.2738 0.6184 0.091 0.0168 0.9813 0.2458 0.6316 0.1032 0.0194 1.0414 0.2198 0.6411 0.1168 0.0223 1.1015 0.1958 0.6467 0.1318 0.0257 1.1716 0.1739 0.6483 0.1482 0.0297 1.2417 0.1539 0.6459 0.166 0.0342 1.3118 0.1359 0.6396 0.1853 0.0393 1.3919 0.1196 0.6294 0.2058 0.0452 1.4720 0.1051 0.6156 0.2274 0.0519 1.5621 0.0922 0.5982 0.25 0.0596 1.6522 0.0807 0.5777 0.2733 0.0683 1.7423 0.0705 0.5544 0.2969 0.0782 1.8424 0.0615 0.5286 0.3205 0.2613 1.94
442 Urban Transport XXI
www.witpress.com, ISSN 1743-3509 (on-line) WIT Transactions on The Built Environment, Vol 146, © 2015 WIT Press
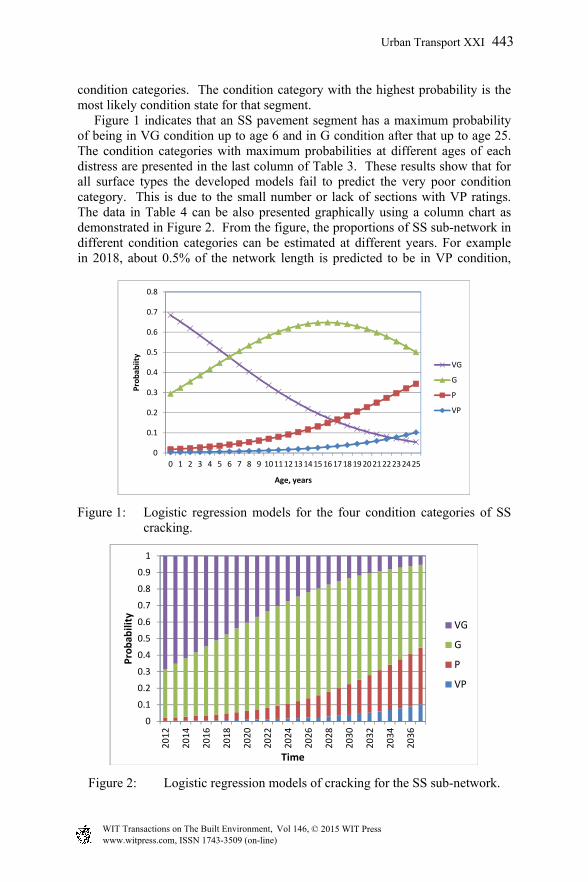
condition categories. The condition category with the highest probability is the most likely condition state for that segment. Figure 1 indicates that an SS pavement segment has a maximum probability of being in VG condition up to age 6 and in G condition after that up to age 25. The condition categories with maximum probabilities at different ages of each distress are presented in the last column of Table 3. These results show that for all surface types the developed models fail to predict the very poor condition category. This is due to the small number or lack of sections with VP ratings. The data in Table 4 can be also presented graphically using a column chart as demonstrated in Figure 2. From the figure, the proportions of SS sub-network in different condition categories can be estimated at different years. For example in 2018, about 0.5% of the network length is predicted to be in VP condition,
Figure 1: Logistic regression models for the four condition categories of SS cracking.
Figure 2: Logistic regression models of cracking for the SS sub-network.
0
0.1
0.2
0.3
0.4
0.5
0.6
0.7
0.8
0 1 2 3 4 5 6 7 8 9 10111213141516171819202122232425
Probab
iity
Age, years
VG
G
P
VP
0
0.1
0.2
0.3
0.4
0.5
0.6
0.7
0.8
0.9
1
2012
2014
2016
2018
2020
2022
2024
2026
2028
2030
2032
2034
2036
Probab
ility
Time
VG
G
P
VP
Urban Transport XXI 443
www.witpress.com, ISSN 1743-3509 (on-line) WIT Transactions on The Built Environment, Vol 146, © 2015 WIT Press
4.5% of the network length is in poor condition, 48% in good condition and the remaining 47% is predicted to be in very good condition.
4 Probabilistic logistic models and validation
Predicted probabilities of logistic models can be presented in terms of the average condition values. The average condition value at any year is determined by taking the weighted average of the probabilities for that year. The probabilities are weighted by the rating of each category. This method of model presentation is most suitable for use in a Pavement Management System. The average condition values are presented in Table 4 for SS cracking logistic probabilities. At age 0, the weighted average probability is calculated as follows:
0.9844*0+ 0.295*1+ 0.0176*3 +0.003*5 = 0.36
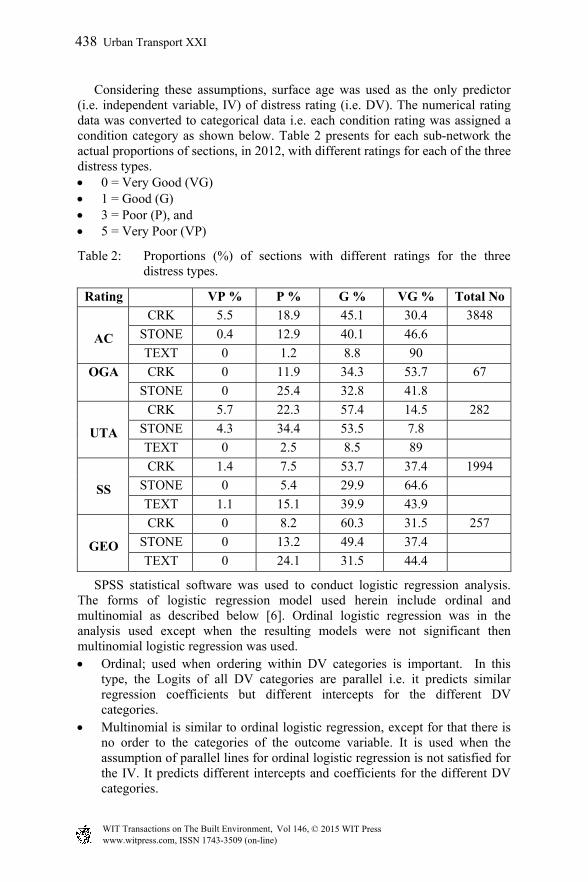
For SS and GEO, stone loss logistic regression models were not developed since the contribution of IV is negligible and/or Logits parameters are not significant. Hence only 12 models of average condition values were developed and have the forms presented in Table 5. All these models are significant at 95% confidence level. The developed models were validated using actual condition data from 2010 and 2012. The criterion adopted is that the predictions are close to the observed average ratings at different ages. For each sub-network the average observed ratings of a distress at each age value was determined and plotted in same graph with the relevant average condition models. Examples are provided for cracking of UTA, stone loss of AC and texture loss of SS in Figure 3.
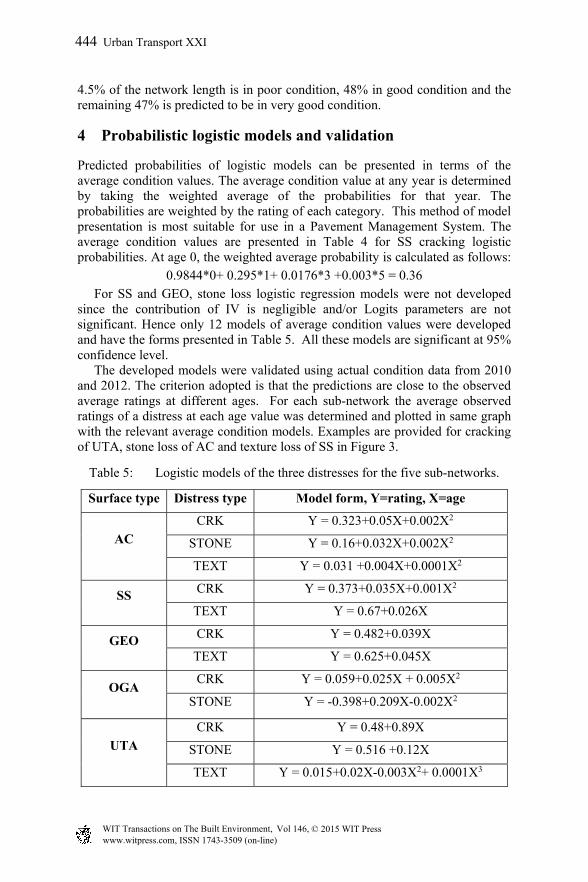
Table 5: Logistic models of the three distresses for the five sub-networks.
Surface type Distress type Model form, Y=rating, X=age
AC CRK Y = 0.323+0.05X+0.002X2
STONE Y = 0.16+0.032X+0.002X2
TEXT Y = 0.031 +0.004X+0.0001X2
SS CRK Y = 0.373+0.035X+0.001X2
TEXT Y = 0.67+0.026X
GEO CRK Y = 0.482+0.039X
TEXT Y = 0.625+0.045X
OGA CRK Y = 0.059+0.025X + 0.005X2
STONE Y = -0.398+0.209X-0.002X2
UTA
CRK Y = 0.48+0.89X
STONE Y = 0.516 +0.12X
TEXT Y = 0.015+0.02X-0.003X2+ 0.0001X3
444 Urban Transport XXI
www.witpress.com, ISSN 1743-3509 (on-line) WIT Transactions on The Built Environment, Vol 146, © 2015 WIT Press
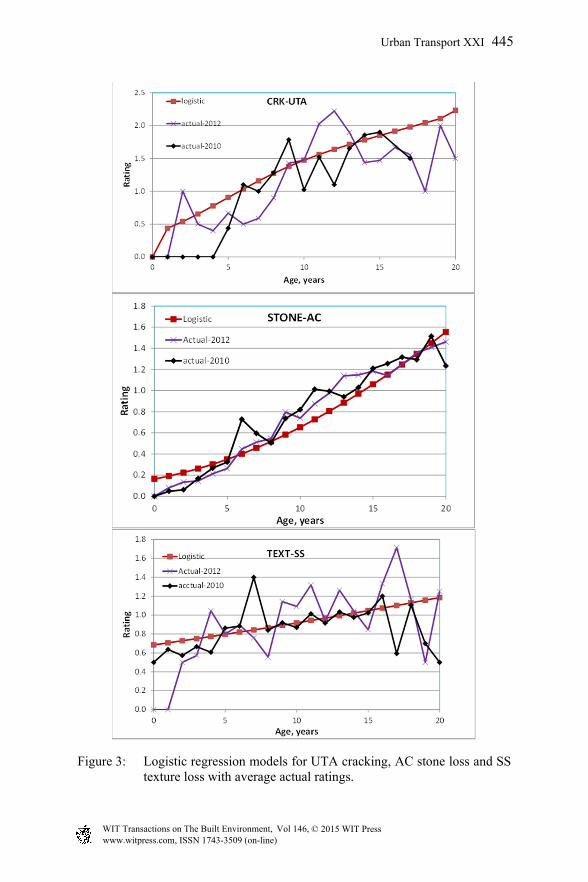
Figure 3: Logistic regression models for UTA cracking, AC stone loss and SS texture loss with average actual ratings.
Urban Transport XXI 445
www.witpress.com, ISSN 1743-3509 (on-line) WIT Transactions on The Built Environment, Vol 146, © 2015 WIT Press
It can be noticed in Figure 3 that the trends of observed and predicted ratings are similar with small differences in values for most age values. This is true for only 10 out of the 12 developed models. When comparing deterioration trends of the three distresses between the five sub-networks, it was observed that cracking is the dominant distress for the asphalt network. As for the seal network, texture loss is the dominant distress. Stone loss is dominant for the smaller sub-networks i.e. OGA, UTA and GEO. The trends in these models also match local knowledge regarding expected service lives of the different surface types.
5 Conclusions
The study reported herein has shown that logistic regression modelling is feasible for developing deterioration models of subjective distress data of pavement surfaces. For the sample data used herein, logistic models provide predictions that are comparable with actual average data. This is true for 10 out of the 12 sets of distress data for all five sub-networks. The models developed herein do not predict ratings that cover the full range i.e. ratings 0-5. This is due to the small number or lack of sections with high ratings in most of the data sets of distresses. Hence, it is recommended that these models be updated when more data becomes available that covers the full range of ratings.
References
[1] Henning, T.F.P., Costello, S.B. & Watson, T.G. 2006, A review of the HDM/dTIMS pavement models based on calibration site data, Land Transport New Zealand, Wellington, New Zealand.
[2] Kaur, D. and Pulugurt, H. 2008, Comparative analysis of fuzzy decision tree and logistic regression methods for pavement treatment prediction, WSEAS transactions on information science & applications, issue 6, volume 5
[3] Li Z. and Zhang Z., 2007 A Probabilistic and Adaptive Approach to Modelling Performance of Pavement Infrastructure, Research Report SWUTC/07/167267-1, Southwest Region University Transportation Centre, Centre for Transportation Research, University of Texas at Austin, Austin, Texas
[4] VicRoads. 2004. Surface Inspection Rating Procedure for pavements surfaced with sprayed seals and asphalt, VicRoads, Melbourne/Australia.
[5] Wuensch K. L. 2011, Binary Logistic Regression with PASW/SPSS. Available from: http://core.ecu.edu/psyc/wuenschk/MV/Multreg/Logistic-SPSS.pdf
[6] Weiss, B.A., Logistic Regression with Polytomous & Ordinal Data. Available from: http://www.education.umd.edu/EDMS/fac/Hancock/Course _Materials/EDMS771/week15/Logistic_Regression_with_Polytomous_&_ OrdinalData.pdf
446 Urban Transport XXI
www.witpress.com, ISSN 1743-3509 (on-line) WIT Transactions on The Built Environment, Vol 146, © 2015 WIT Press