Modelling and Remote Sensing of Canopy Light Interception ...
152
Modelling and Remote Sensing of Canopy Light Interception and Plant Stress in Greenhouses Vaia Sarlikioti
Transcript of Modelling and Remote Sensing of Canopy Light Interception ...
Modelling and Remote Sensing of
Canopy Light Interception and Plant
Stress in Greenhouses
Vaia Sarlikioti
ii
Thesis committee
Thesis supervisors
Prof dr ir LFM Marcelis
Professor of Crop Production in Low-energy Greenhouses Wageningen Univeristy
Prof dr O Van Kooten
Professor of Horticultural Supply Chains Wageningen Univeristy
Thesis co-supervisor
Dr PHB de Visser
Researcher Wageningen UR Greenhouse Horticulture
Other members
Prof dr ir EJ van Henten Wageningen University
Dr ir J Vos Wageningen University
Prof dr C Kittas University of Thessaly Greece
Prof dr H Stuumltzel Leibniz University Hannover Germany
This research was conducted under the auspices of the CT de Wit Graduate School
for Production Ecology and Resource Conservation
iii
Modelling and Remote Sensing of Canopy Light
Interception and Plant Stress in Greenhouses
Vaia Sarlikioti
Thesis
submitted in fulfilment of the requirements for the degree of doctor
at Wageningen University
by the authority of the Rector Magnificus
Prof dr MJ Kropff
in the presence of the
Thesis Committee appointed by the Academic Board
to be defended in public
on Monday 10 October 2011
at 400 pm in the Aula
iv
Vaia Sarlikioti
Modelling and Remote Sensing of Canopy Light Interception and Plant Stress in
Greenhouses
Thesis Wageningen University Wageningen NL (2011)
With references with summaries in English Dutch and Greek
ISBN 978-94-6173-005-3
v
vi
Table of contents
vii
Table of contents
Chapter 1 General Introduction ________________________________________ 1
Chapter 2 Modelling PAR interception and photosynthesis __________________ 9
Chapter 21 Towards a 3D structural tomato model for calculating light interception 9
Chapter 22 Exploring the spatial distribution of canopy light interception and leaf
photosynthesis by means of a functional structural model _____________________ 21
Chapter 23 Searching for the ideal plant structure with a functional-structural plant
model How plant architecture affects light absorption and photosynthesis in
tomato _____________________________________________________________________ 42
Chapter 3 Monitoring PAR interception and photosynthetic stress __________ 62
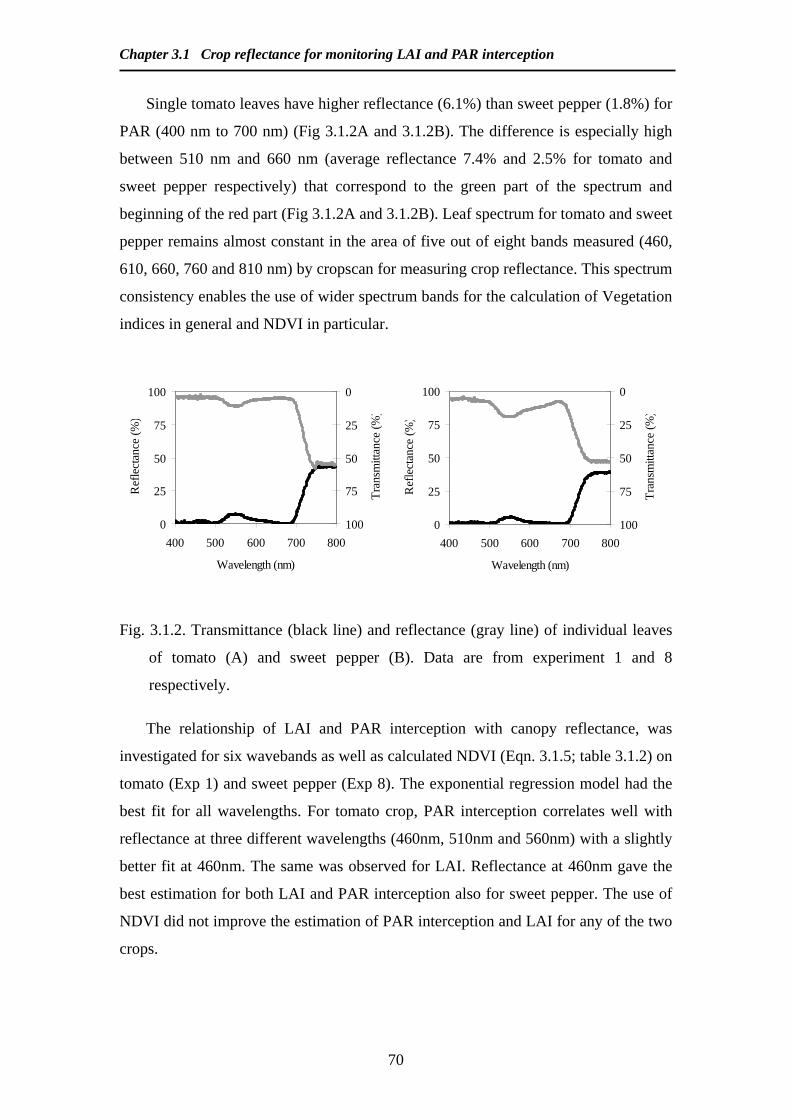
Chapter 31 Crop Reflectance as a Tool for Online Monitoring Of LAI and PAR
Interception in Two Different Greenhouse Crops _____________________________ 62
Chapter 32 Photochemical reflectance index as a mean of monitoring early
photosynthetic stress _______________________________________________________ 78
Chapter 4 General discussion _________________________________________ 95
References ________________________________________________________ 103
Summary _________________________________________________________ 119
Samenvatting ______________________________________________________ 125
Περίληψη _________________________________________________________ 131
Acknowledgements _________________________________________________ 137
Curriculum vitae ___________________________________________________ 139
List of publications _________________________________________________ 140
Chapter 1
General Introduction
Chapter 1 General Introduction
2
Greenhouse horticulture development towards full control
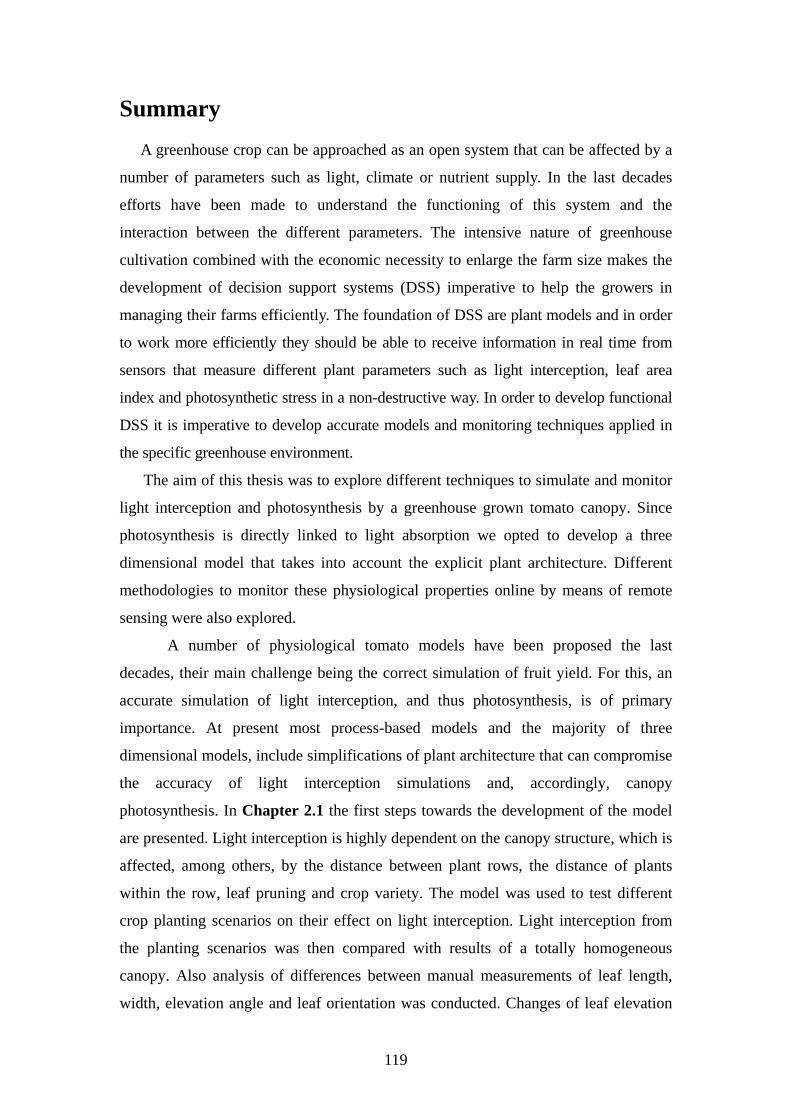
A greenhouse crop can be approached as an open system that can be affected by a
number of parameters such as light climate or nutrient supply The last decades
efforts have been made to understand the function of this system and the interaction of
the different parameters The intensive nature of greenhouse cultivation as such gives
an impetus for the development of decision support systems (DSS) to help the
growers in managing their farm efficiently The foundations of DSS are plant models
(Marcelis et al 2000) Although many models have been proposed during the past
decades their lack in accuracy makes it useless to integrate them yet in day- by- day
decision making for the farm management Accuracy in models can be achieved either
by improving modelling assumptions as such like incorporating the explicit plant
structure instead of using a layer approach when dealing with plant canopy or by
improving the online feed of information to the model by coupling models with remote
sensor data that are taken in real time Since remote sensing is not yet widely used in the
greenhouse a way to incorporate remote sensing in the greenhouse environment should
first be investigated In the following subchapters these two approaches are explicitly
described
Plant modelling
Physiological plant models have become an integrated tool of plant science
research These models describe at different degrees of complexity plant
physiological processes that set light to our understanding of plant functioning and
help us develop new cultivation strategies (Fourcaud et al 2008) A number of
physiological plant models have been proposed during the years (eg Gary et al
1995 Marcelis et al 1998 Heuvelink 1999 Boote and Scholberg 2006) These
models offer an accurate description of plant growth and its interactions with the
environment providing a useful tool in our understanding of plant functioning
Although they make a distinction between different plant organs they do not consider
the plant structure in space Especially functions like light interception environmental
plant adaptation competition within and between species for light or nutrients and
assimilate allocations cannot be easily explained if plant structure in space is not taken
into account
Chapter 1 General Introduction
3
Modelling light interception and photosynthesis
In most process based models leaf area is one of the most important crop
properties which have a strong physiological impact on plant functioning through light
interception and thus photosynthesis In current models leaf area index (LAI) is input as
a single value for the total of the crop canopy This approach although it gives a good
general estimation of light absorption and photosynthesis fails to capture the effect of
the vertical light distribution in the canopy This light distribution is affected by canopy
architecture and its inclusion in the models gives us the necessary accuracy for the day
to day management of the crop
Functional-structural plant models (FSPM) or virtual plant models
(Hanan1997 Sievaumlnen et al 2000 Godin and Sinoquet 2005 Vos et al 2007) are
terms used to refer to models explicitly describing the development in time of the 3D
architecture or structure of plants as driven by physiological processes These
physiological processes are the result of environmental factors Functional-structural
plant models were proposed in the last decade as a means to investigate the function
of plant structure in plant development combining traditional plant modelling with a
3D structure (Vos et al 2007)
Modelling light interception and photosynthesis in a tomato crop
The tomato crop is of high economic importance and one of the most
important horticultural crops Because of the intensity of greenhouse cultivation in the
Netherlands optimum cultivation practices as well as genotypes with specific
characteristics for this type of cultivation are used Since experimentation is quite time
consuming and cost money 3D models can become a central tool in searching the
ideal crop type and management support when it comes to light interception and
photosynthesis Tomato cultivation is using a high-wire system were the plants are
planted in double rows Such a system is intended to optimize the light distribution in
the canopy However a high heterogeneity in the plant canopy still occurs and that
can have an impact on the local light distribution inside the canopy A 3D model can
accurately calculate the vertical as well as the horizontal light and photosynthetic
distribution inside the canopy Also a 3D model can be used to provide answers to
important questions as to which plant architectural characteristics such as leaf size
and shape leaf elevation angle leaf orientation internode length or leaf spatial
distribution would give optimal results when it comes to light interception and canopy
Chapter 1 General Introduction
4
photosynthesis The same answers can be given for cultivation practices such as row
spacing
Online monitoring with sensors
When light reaches a surface a part is absorbed a part is transmitted and a part is
reflected depending on the optical properties of the surface The fraction of light
reflected by a surface can be detected with sensors In plants reflection can be related
to the light emitted during different physiological processes or to morphological
parameters
In the past optical remote sensing has been developed and used for the online
monitoring of parameters such as chlorophyll and nitrogen content plant stress etc in
field grown crops for example in wheat (Gitelson et al 2002) potato (Jongschaap
2006) sugar beets (Clevers 1997) miscanthous (Vargas et al 2002) and rice (Tian et
al 2005) Remote sensing is defined as lsquothe small or large-scale acquisition of
information of an object or phenomenon by the use of either recording or real-time
sensing devices that is not in physical or intimate contact with the object (Lintz amp
Simonett 1976) Remote sensing can be either at close range where the observations
are taken either by sensors positioned on the ground close to the object or long range
where information are gathered by planes or satellites
Attempts to measure leaf area index (LAI) and Photosynthetically Active Radiation
(PAR) interception with the use of remote sensing have been successful in field crops
Different approaches have been used for the data collection with sensors either on
short range (ground) or far range (low flights or satellites) (Bouman et al 1992
Clevers 1997) Efforts in the field to use reflectance measurements for the estimation
of the canopy nitrogen content biomass and photosynthesis in wheat (Gitelson et al
2002) potato (Jongschaap 2006) sugar beets (Clevers 1997) miscanthus (Vargas et
al 2002) and rice (Tian et al 2005) resulted in positive correlations
Many studies aimed at determining combinations of reflectance of different
wavelengths for correcting the effect of disturbing factors (such as old leaves and soil
background) on the relationship between crop reflectance and crop characteristics
such as LAI These combinations of the reflectance at different wavelength bands are
known as vegetation indices (VIrsquos) Vegetation indices are quantitative measures that
are used in an attempt to measure vegetation abundance or vigor (Wang et al 2005)
Chapter 1 General Introduction
5
Some of the vegetation indices proposed during the years are the Weighted
Difference Vegetation Index (WDVI) (Bouman et al 1992) the infrared red (IRR)
ratio and the red edge leaf effect with the most commonly used the simple ratio (SR)
and the Normal Difference Vegetation Index (NVDI) (Wang et al 2005) SR and
NDVI are based on ratios of red (R) to near-infrared (NIR) reflectance where SR=
NIRR and NDVI= (NIRminusR) (NIR+R) R and NIR ratio-based indices are strongly
rooted in the contrasting response of R and NIR reflectance to increases in LAI (Chen
et al 2002)
The core characteristics of remote sensing ie non destructive measurements and
real time plant monitoring indicate it as a highly desirable application for the
greenhouse industry Though remote sensing has been applied quite successfully in
the open field it has hardly been tested in protected cultivations Open-field methods
cannot be directly transported to greenhouses due to complicating conditions such as
existence of greenhouse structure and ground covering with white plastic In this thesis
the conditions under which remote sensing can be applied for plant monitoring inside a
greenhouse will be investigated
New technological advancements in the accuracy of reflectance detection have
led to linking specific wavelengths with specific plant physiological functions In that
respect one of the interesting applications of crop remote sensing is the monitoring of
photosynthetic stress The so-called photochemical reflectance index (PRI = (R531 minus
R570)(R531 + R570) where R531 and R570 are reflectance signals at 531 and 570 nm
respectively has been used to monitor dynamic changes in photosynthesis under
different stress factors (Evain et al 2004) PRI provides a quick and non-destructive
assessment on photosynthesis-related physiological properties of the leaf and canopy
(Penũelas et al 1994 Meacutethy et al 1999 Evain et al 2004 Weng et al 2006) for a
wide range of species (Gamon et al 1997 Guo amp Trotter 2004) One of the
processes that induce photosynthetic stress is the limited water uptake from the soil
Water stress affects the sufficient opening of stomata and consequently
photosynthetic rate starts to decrease as well as the quantum yield of photosystem II
(Chaves et al 2002) As a result of a decreased rate of CO2 assimilation light energy
absorbed by the leaf cannot be used to drive photosynthetic electron transport and a
part of this energy is dissipated as heat increasing the non-photochemical quenching
(Krause and Weis 1991 Baker and Rosenqvist 2004) Therefore water stress can be
defined as the loss of plant photosynthetic activity as a result of water deprivation
Chapter 1 General Introduction
6
PRI can be used as an easy and effective way of online monitoring photosynthetic
stress Nowadays that the production of tomato fruits in greenhouses is a highly
intensive agricultural industry where the cost profit limit is marginal and efficient use
of resources is vital such a timely prediction of plant stress is especially important
and such a solution worth investigating
Key objectives
The general objective of this thesis is to develop an accurate 3D model for light
interception and photosynthesis simulations and to develop methods for an online
monitor of these physiological properties by means of remote sensing
The individual aims as they are presented in this thesis are
bull Development of a functional structural model simulating the light distribution
in a row crop for diffuse and direct light
bull Understanding the role of different plant architectural components in vertical
light distribution and define an optimum plant canopy
bull Developing a procedure to estimate the leaf area index and light interception
for greenhouse grown row crops based on reflectance measurements
bull Developing a procedure to estimate photosynthetic stress in crops based on
reflectance changes at 531nm
Thesis outline
In CHAPTER 1 of this thesis a general description of the problem as well as the
general objective are presented
CHAPTER 21 is presenting a first description of the 3D model The effect of row
spacing on light interception is also investigated
CHAPTER 22 presents in detail the 3D tomato model In the chapter the
development of the model is described and it is used for the exploration of the spatial
light distribution and photosynthesis In this chapter the effect using an explicit 3D
model versus the common modelling approaches for light interception and
photosynthesis is addressed
CHAPTER 23 the effect of plant architectural parameters on light interception
and photosynthesis is explored Sensitivity analysis is performed for leaf azimuth
angle (phyllotaxis) leaf elevation angle leaflet angle leaf length leaf shape leaf
Chapter 1 General Introduction
7
thickness as well as internode length for the impact of their change to both light
interception and photosynthesis Two different architectural ideotypes are proposed
based on the results of the analysis
In CHAPTER 31 a way of online monitoring of light interception and Leaf Area
Index is explored Reflectance in a number of different wavelength bands as well as
NDVI is tested and the best predictor is picked for tomato and sweet pepper crops
In CHAPTER 32 the use of photochemical reflectance index (PRI) as an
indicator of early water stress is presented In that chapter water stress is described as
a function of photosynthetic reduction and the capability of PRI to act as an early
water stress indicator is debated
In CHAPTER 4 the results of this thesis are summarized and put into a more
general context The shortcomings of the methods used as well as the further steps in
this research are discussed
Chapter 2 Modelling PAR interception and photosynthesis
Chapter 21
Towards a 3D structural tomato model for calculating light interception
Published as
Sarlikioti V de Visser PHB Marcelis LFM 2011 Towards a 3D structural
tomato model for calculating light interception Acta Horticulturae 893721-728
Chapter 21 Effect of cultivation strategies on light interception
10
Abstract
A number of physiological tomato models have been proposed the last
decades their main challenge being the correct simulation of fruit yield For this an
accurate simulation of light interception and thus photosynthesis is of primary
importance Light interception is highly dependent of the canopy structure which is
affected amongst others by distance between plant rows distance of plants within the
row leaf pruning and crop variety In order to simulate these processes a functional
structural tomato model for the simulation of light interception on an individual leaf
basis is proposed The 3D model was constructed using L-systems formalism For the
architectural part of the model manual measurements of leaf length width angle of
the leaf main stem to plant stem and leaf orientation were conducted Diurnal pattern
of leaf orientation was also tested The architectural model was coupled with a nested
radiosity model for light calculation Area per individual leaflet served as input of the
light module for calculation of reflection absorption and transmission of light The
model was used to test different crop planting scenarios on their effect on light
interception Results were then compared with light simulation for a totally
homogeneous canopy
Chapter 21 Effect of cultivation strategies on light interception
11
Introduction
A number of tomato models have been proposed during the years (eg Gary et al
1995 Marcelis et al 1998 Heuvelink 1999 Boote and Scholberg 2006) These
models offer an accurate description of plant growth and its interactions with the
environment providing a useful tool in our understanding of plant functioning
Although they make a distinction between different plant organs they do not consider
the plant structure in space Especially functions like light interception environmental
plant adaptation competition within and between species for light or nutrients and
assimilate allocations can not be easily explained if plant structure in space is not
taken into account
Functional-structural plant models (FSPM) or virtual plant models (Hanan1997
Sievaumlnen et al 2000 Godin and Sinoquet 2005 Vos et al 2007) are terms used to
refer to models explicitly describing the development in time of the 3D architecture or
structure of plants as driven by physiological processes These physiological
processes are the result of environmental factors Functional-structural plant models
were proposed the last decade as a mean to investigate the function of plant structure
in plant development combining traditional plant modeling with a 3D structure (Evers
et al 2005 Buck-Sorlin et al 2011) For light extinction in particular the knowledge
of how the plant develops in space is essential So the use of such a model for light
calculations would probably improve our knowledge of light distribution inside the
crop canopy
Light extinction inside a plant canopy can reach up to 60 while for a crop
canopy the light extinction can be up to 90 (Valladares 2003) This variation in
incident light availability inside the crop canopy induces extensive structural and
physiological modifications Light variation has also a big effect in plant
photosynthetic capacity (Amax) which typically decreases two- to four times from top
to the bottom of the canopy (Meir et al 2002)
The aim of this study was to explore the structural variations inside the tomato
plant canopy and use this to develop a structural plant model for tomato Furthermore
with the use of a structural plant model different plant spacing scenarios and their
effect on light distribution inside the canopy were tested
Chapter 21 Effect of cultivation strategies on light interception
12
Materials and Methods
Plant measurements
Experimental set-up
The experiment was carried out in a high-wired tomato cv Aranca crop in a
glasshouse of Improvement Center (52˚N Bleiswijk the Netherlands) Plants were
planted in the greenhouse at the end of January The rows in the greenhouse were
northeast- southwest oriented Two rows of plants were planted in each gully The
distance between the two rows of one gully was 50 cm the path width was 110 cm
and the distance between 2 plants on the same row was 053 m Plant height was 260
m The plants were grown on rockwool (Grodan type Expert) The greenhouse air
was enriched with pure CO2 at 400 ppm during day time The lowest leaves were
removed every week and plants were lowered such that plant height remained the
same throughout the experiment
Structural plant measurements
For a complete picture of plant development detailed measurements of the 3D
stem and leaf curvature were manually performed on 3 plants every other week
Measurements were performed for six weeks from 2 of July to 13 of August 2008 A
protractor and a ruler were used for the measurements The measurements included
leaf elevation angle leaf length leaf width and leaf orientation In our experiment we
defined leaf elevation angle as the angle of leaf petiole to the horizontal where it is
attached to the stem (Boonen et al 2002) The rosette at the top of the plants with
leaves smaller than 2 cm was considered as first node Digitization of the plants was
attempted with the use of a Fastrak 3D digitizer (Polhemus Inc Colchester VT USA)
but was not always possible This was probably due to a powerful disturbance of the
magnetic field of the digitizer due to metallic parts (heating pipes) positioned inside
the canopy
The plant was divided in three zones (upper middle and lower zone) and the
above mentioned structural plant characteristics were measured Every zone had a
length of 90 cm except the lowest one that had a length of 80 cm Measurements were
carried out weekly on 3 randomly picked leaves per zone in 13 replicate plants
Tomato composite leaf consists of a large terminal leaflet and up to 8 lateral
leaflets which can also be compounded Many smaller leaflets or folioles may be
interspersed between the larger leaflets depending on the cultivar (Atherton and
Chapter 21 Effect of cultivation strategies on light interception
13
Rudich 1986) In our cultivar the leaf was composed of a big terminal leaflet 3 pairs
of larger leaflets and two pairs of smaller leaflets alternately placed Measurements of
angles of all leaflets for 10 randomly selected leaves in each plant level were taken in
order to determine a relationship between leaflet angle and leaflet position in the leaf
Leaflet angle was defined as the angle between the leaflet petiole and the leaf petiole
Given that the angle of leaves to the horizontal directly affects the flux of solar
radiation per unit area (Falster and Westoby 2003) measurements to establish the
diurnal pattern of the leaf elevation angles were also made Leaf elevation angles of
15 plants were measured early in the morning (0900 hours) and in the afternoon
(1500 hours)
Light measurements
Incident light was measured with the use of Sunscan (Delta-T UK) The sensor
was positioned perpendicular to the plant row Measurements were taken every 25cm
from the top of the canopy in 8 different spots in the greenhouse
Model description
The model consisted of two modules
bull Structural module In this module the spatial development of the plant
was described in terms of symbols according to L-systems formalism
(Lindenmayer and Prusinkiewicz 1990) The plant was structured as a number
of phytomers in deferent developmental stages A phytomer is defined as the
basic structural unit which for our model consisted of an internode and a
composite leaf Relationships of leaf elevation angle to node number leaf
length to node number and leaf width to node number as well as leaflet area to
leaf area and leaflet angle to petiole node number were determined by
regression analysis These relationships where used as input for the
development of the structural part of the model Leaflets were represented
with rectangular shapes in the model in an approximation of their real shape
Plant and row spacing also served as an input The basic simulation unit of the
model included 20 plants (5 plants per row 4 rows)
bull Light module A nested radiosity model (CARIBU) developed by
Chelle and Andrieu (1998) was used for light calculations The module
Chapter 21 Effect of cultivation strategies on light interception
14
calculates light absorbance on the leaflet level Multiple light scattering on
leafs surface was taken into account for light calculations The model assumed
an infinite plant canopy for the calculations (infinite canopy was achieved by
multiplying the basic simulation unit into space) Reflectance and
transmittance parameters for the upper and lower side of the leaf were input in
the model Output values of light interception were given in leaflet as well as
leaf level Model calculation assumed diffuse light conditions Forty three
virtual light sources were symmetrically arranged around the crop in order to
achieve these conditions
A more detailed description of the model is provided in chapter 22
Lambert- Beer
In many crop models Lambert- Beers law (Monsi and Saeki 1953) is used for the
simulation of PAR interception According to the law in a uniform infinite randomly
distributed canopy of absorbing leaves it can be shown that the amount of
photosynthetically active radiation intercepted (I) by a crop can be given by the
following equation
I= (1-ρ)I0(1-e-kL)100
where ρ stands for canopy reflection coefficient I0 is the radiation level at zero
canopy depth L the leaf area index of the canopy and k is the light extinction
coefficient Extinction coefficient was set to 065 as reported by Papadopoulos and
Pararajasingham 1997) and confirmed by our own measurements (data not shown)
Statistical analysis
Statistical analysis was performed with Genstat 11 software (VSN International
Ltd Herts UK) Differences of leaf elevation angle length and width between three
plant heights were tested with Linear Mixed Model (REML) Leaf elevation angles
were compared between morning and afternoon with General Linear Models repeated
measurement analysis Curves for leaflet angle to leaf petiole and for light
interception to LAI were fitted with Regression Analysis Goodness of fit was
estimated by coefficient of determination (R2) Statistical differences between curves
was tested by testing the statistical differences between the coefficients of the
regression curves P was 005
Chapter 21 Effect of cultivation strategies on light interception
15
Results and Discussion
Structural characteristics of tomato leaves were monitored at three different depths
in the canopy (Fig 211) In the upper part of the plant leaves had on average a
slightly positive angle to the horizontal while leaves in the middle and lower part of
the canopy showed a negative angle to the horizontal The negative value of -25o
found in our experiment correspond to the mean value used in the tomato model of
Higashide (2009) Length and width were smallest in the top part of the canopy as
these leaves were not yet full-grown There was no statistically significant difference
in leaf size between middle and lower part of the canopy
Fig 211 Structural measurements for three different depths in a tomato canopy
Mean values of leaf elevation angle to the horizontal (A) leaf length (B) and leaf
width (C) are presented for the three different canopy depths as well as the relation
between leaflet angle to leaf petiole and leaflet position (1 is most proximal leaflet
to the stem) for top () middle () and lower leaves () (D) Error bars represent
se of the mean Data are averages of 5 weeks 13 plants per week Data for graph
D are averages of 10 leafs per canopy level
Chapter 21 Effect of cultivation strategies on light interception
16
Leaflet angles diminished from a maximum of 40o for the most distal leaflet to 0o
for the most proximal leaflet (Fig 211D) Leaflet angle showed no statistically
significant differences between the three different canopy levels implying that the
leafletsrsquo angle is in fact an internal characteristic of the plant and dependent only on
the position of the leaflet on the leaf
Leaf elevation angle differed significantly between morning and afternoon only
for the upper leaves (average leaf elevation angles were -31o and -76o for morning
and afternoon subsequently) (Fig 212) A diurnal pattern was not observed at the
middle and lower leaves Forseth (1990) observed no diurnal changes in leaf elevation
angles to the horizontal of a number of species (for example cotton beans Solanum)
but he did find significant changes of the plant angle to the azimuth He also linked
this azimuth movement to an increase in light interception and a proportional increase
of productivity Although Forseth does not differentiate leaf elevation angle behavior
between different canopy depths his work is an indication that measurements of only
leaf elevation angle to the horizontal is not adequate to conclude about a diurnal
pattern on tomato leafs Leaf elevation angle changes can also be linked to turgor loss
of plant cells due to daily transpiration So further research is needed as for the causes
of this behavior on upper tomato leafs
-40
-20
0
20
40
-40 -20 0 20 40Leaf angle (o) at 900
Leaf
ang
le (o ) a
t 15
00
Fig 212 Comparison of leaf elevation angle (angle to the horizontal) in the morning
(0900hours) and afternoon (1500hours) at three different heights of the canopy
Symbols diams loz and x refer to upper middle and lower part of the plant
consequently The line is 11
Chapter 21 Effect of cultivation strategies on light interception
17
The above described structural measurements were used to develop a structural
tomato model The accuracy of the model was tested against measured values In
general the difference of the measured values versus the calculated values was of 4
with a maximum difference of 10 at the lowest point The model was used to test
three different crop planting scenarios and compare them to results of Lambert- Beer
equation which is currently used in most crop modeling for light simulation The three
different planting scenarios consisted of i Normal culture Planting distances were
the same as the ones found in the experiment (50cm between the two rows of one
gully and 110 cm of path ii Big path The distance between the rows in the same
gully was reduced to 15 cm and the path width increased to 145cm width iii Even-
distance rows The plants were equally distributed in space (distance between plants at
the same gully as well as the pathway was equal to 80cm) In order to test the
accuracy of the tomatorsquos model light calculations the light interception of a
completely homogeneous crop was compared to Lambert- Beer calculations (Fig
213) Plant density was 41 plants per m2 with 1 stem per plant It was assumed that
plant size and structure was the same in all scenarios
Fig 213 Comparison of light interception () between simulation data for a totally
homogeneous canopy and Lambert- Beer law calculations for the same canopy
Data points are from the top (0 interception) to the bottom of the canopy (100)
In general row structures led to higher light interception in the upper part of the
plants (LAIle15) and lower interception in the lower part compared to homogeneous
crop simulation Light interception reaching at the deeper part of the crop increased
with path width and resulted in 30 light reaching soil level in our ldquobig pathrdquo
Chapter 21 Effect of cultivation strategies on light interception
18
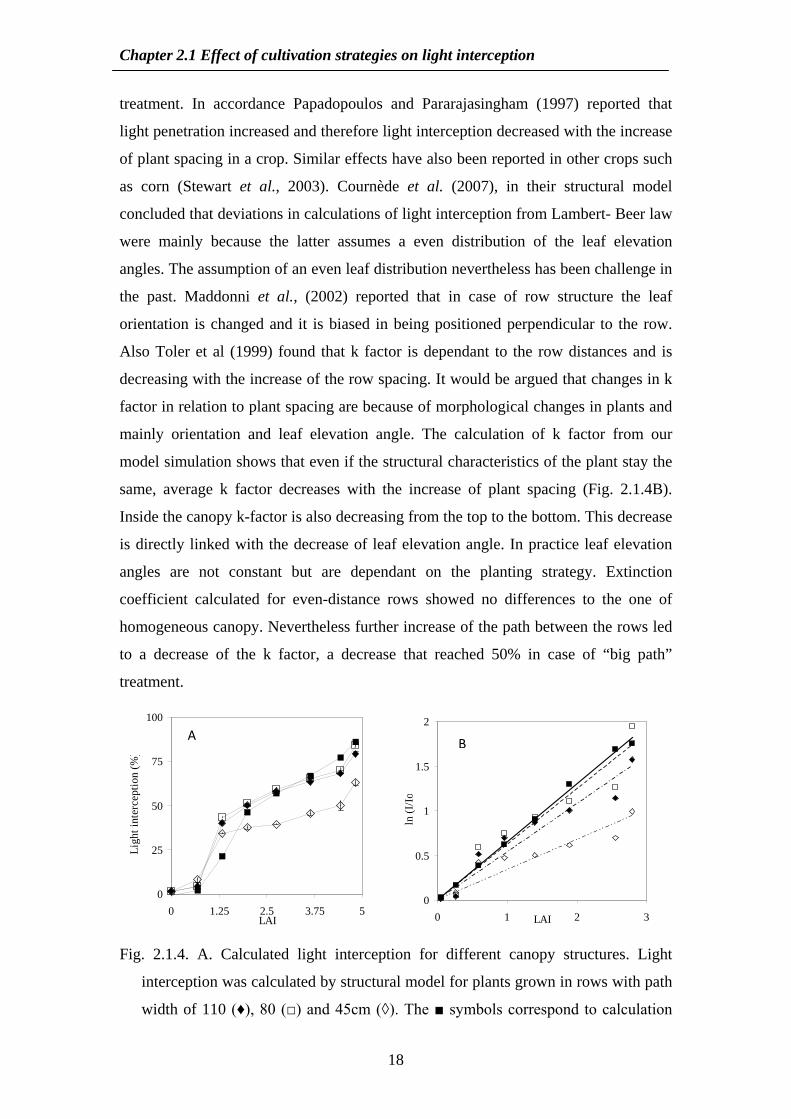
treatment In accordance Papadopoulos and Pararajasingham (1997) reported that
light penetration increased and therefore light interception decreased with the increase
of plant spacing in a crop Similar effects have also been reported in other crops such
as corn (Stewart et al 2003) Cournegravede et al (2007) in their structural model
concluded that deviations in calculations of light interception from Lambert- Beer law
were mainly because the latter assumes a even distribution of the leaf elevation
angles The assumption of an even leaf distribution nevertheless has been challenge in
the past Maddonni et al (2002) reported that in case of row structure the leaf
orientation is changed and it is biased in being positioned perpendicular to the row
Also Toler et al (1999) found that k factor is dependant to the row distances and is
decreasing with the increase of the row spacing It would be argued that changes in k
factor in relation to plant spacing are because of morphological changes in plants and
mainly orientation and leaf elevation angle The calculation of k factor from our
model simulation shows that even if the structural characteristics of the plant stay the
same average k factor decreases with the increase of plant spacing (Fig 214B)
Inside the canopy k-factor is also decreasing from the top to the bottom This decrease
is directly linked with the decrease of leaf elevation angle In practice leaf elevation
angles are not constant but are dependant on the planting strategy Extinction
coefficient calculated for even-distance rows showed no differences to the one of
homogeneous canopy Nevertheless further increase of the path between the rows led
to a decrease of the k factor a decrease that reached 50 in case of ldquobig pathrdquo
treatment
0
25
50
75
100
0 125 25 375 5LAI
Ligh
t int
erce
ptio
n (
)
0
05
1
15
2
0 1 2 3LAI
ln (I
Io
Fig 214 A Calculated light interception for different canopy structures Light
interception was calculated by structural model for plants grown in rows with path
width of 110 (diams) 80 () and 45cm (loz) The symbols correspond to calculation
A B
Chapter 21 Effect of cultivation strategies on light interception
19
from Lambert- Beer B Average extinction coefficients k for the different
treatments LAI refers to cumulative leaf area from top to bottom of plant canopy
CONCLUSIONS
In tomato plants structural differences in leaf can mainly be observed in the upper
90cm of the plant in the still developing zone Changes of structural plant
characteristics affect directly light interception by the crop canopy Nevertheless even
if plant structure stays the same light penetration can be manipulated easily by
changing row spacing in the crop thus affecting light interception and potentially
plant production
Chapter 22
Exploring the spatial distribution of canopy light interception and leaf photosynthesis by means of a functional structural model
Published as
Sarlikioti V de Visser PHB Marcelis LFM 2011 Exploring the spatial
distribution of light interception and photosynthesis of canopies by means of a
functional-structural plant model Annals of Botany 107875-883
Chapter 22 Virtual plant for light interception and photosynthesis
22
Abstract
At present most process-based models and the majority of three dimensional
models include simplifications of plant architecture that can compromise the
accuracy of light interception simulations and accordingly canopy photosynthesis
The aim of this paper is to analyze canopy heterogeneity of an explicitly described
tomato canopy in relation to temporal dynamics of horizontal and vertical light
distribution and photosynthesis under direct and diffuse light conditions Detailed
measurements of canopy architecture light interception and leaf photosynthesis were
carried out on a tomato crop These data were used for the development and
calibration of a functional-structural tomato model The model consisted of an
architectural static virtual plant coupled with a nested radiosity model for light
calculations and a leaf photosynthesis module Different scenarios of horizontal and
vertical distribution of light interception incident light and photosynthesis were
investigated under diffuse and direct light conditions Simulated light interception
showed a good correspondence to the measured values Explicitly described leaf
elevation angles resulted in higher light interception in the middle of the plant canopy
compared to fixed and ellipsoidal leaf elevation angle distribution models although
the total light interception remained the same Fraction of light intercepted at a north-
south orientation of rows differed from east-west orientation by 10 on winter and
23 on summer days The horizontal distribution of photosynthesis differed
significantly between the top middle and lower canopy layer Taking into account the
vertical variation of leaf photosynthetic parameters in the canopy led to ca 8
increase on simulated canopy photosynthesis Leaf elevation angles of heterogeneous
canopies should be explicitly described as they have a big impact both on light
distribution and photosynthesis
Chapter 22 Virtual plant for light interception and photosynthesis
23
Introduction
Physiological plant models have become an integral tool of plant science research
These models describe at varying degrees of complexity plant physiological
processes that improve our understanding of plant functioning and help us develop
new cultivation strategies (Fourcaud et al 2008) Physiological models or process-
based models (PBMs) usually focus on plant production and development by
describing biophysical processes as rates using ordinary differential equations (ODErsquo
s) or stochastic processes (Marcelis et al 1998 Heuvelink 1999 Gayler et al
2006) Light interception is one of the most important functions as it drives
photosynthesis and therefore growth Although highly dependent on canopy structure
(Vos et al 2010) light interception is usually computed in PBMs as a function of leaf
area index (LAI) and extinction coefficient (Lai et al 2000 Baldocchi et al 2000)
In most models the extinction coefficient is determined by fitting a LambertndashBeer law
relation to experimental data or is estimated as a function of a certain leaf elevation
angle distribution Although these approaches give a good estimation of total light
interception of a crop they fail to capture the effect of plant and canopy heterogeneity
on light interception and therefore on photosynthesis (Vos et al 2010) Since plant
architecture is influenced by a number of processes (such as genotype water
availability cultivation practices or diseases) models that explicitly describe the
impact of these processes on plant architecture can be a useful tool in our
understanding of such phenomena for example the effect of wilting on light capture
In recent years techniques have become available for developing functionalndash
structural plant models (FSPMs) which are also called lsquovirtual plantsrsquo that combine
the modelling of physiological processes with the 3D architecture of the plant This
combination boosts the capability of models to simulate the interaction between plants
and their environment (Hanan 1997 Sievaumlnen et al 2000 Godin and Sinoquet
2005 Vos et al 2007) The 3D plant structure is especially important for the
description of light interception and therefore the photosynthetic capacity of plants
Three-dimensional models require a detailed quantification of plant structure in space
(Vos et al 2007) Plants are considered as the sum of distinct units called phytomers
that are formed repeatedly based on a hierarchical system (Bartheacuteleacutemy and Caraglio
2007) Static 3D plants coupled with radiation models have proven to be valuable
tools in investigating the effect of single-plant architecture as well as crop structure on
light interception and canopy photosynthesis (Vos et al 2010) Zheng et al (2008)
Chapter 22 Virtual plant for light interception and photosynthesis
24
showed that certain plant types with steeper leaf elevation angles exhibited a higher
light penetration of the canopy when sun elevation was high Therefore even simple
static virtual plants have a great potential for crop breeding research
Despite the advantage of virtual plant models over PBMs in their explicit
description of plant architecture still in such models we still often need to
approximate 3D structure Leaf elevation angle is assumed either as constant (Najla et
al 2009) or to follow a spherical or ellipsoidal distribution (Rakocevic et al 2000
Farque et al 2001) This approach is mainly due to the tediousness and the time-
consuming nature of the measurements involved (Fourcaud et al 2008) Such an
approach may give robust results in the case of crops that show a particularly regular
and coordinated development such as wheat and rice (Evers et al 2005 Drouet and
Pagegraves 2007 Zheng et al 2008) However in order to fully understand the light
distribution in the plant canopy and explore the full impact of crop architecture on
light interception and photosynthesis of row crops with a high canopy (such as
tomato) functionalndashstructural models should incorporate a detailed description of all
architectural parameters in general and leaf elevation angles in particular
The aim of this research was to analyse the canopy heterogeneity of an explicitly
described tomato canopy on horizontal and vertical light distribution and
photosynthesis under direct and diffuse light conditions at different times of the year
In order to do so a static functional structural tomato model was developed and then
used as a tool for analysing the impact of canopy heterogeneity
Materials and Methods
Experiment
A tomato (Lycopersicum esculentum var Aranca) crop was planted in December
2006 in a commercial greenhouse in Bleiswijk the Netherlands (52o) Measurements
were performed in July and August of 2007 when the plants were 175 m tall During
this period average temperature in the greenhouse was 175oC average daytime CO2
concentration was 371 μmol mol-1 and relative air humidity was set at 73 Daily
outside global radiation was 40 MJ during the time of the experiment Plants were
grown in double rows with rows oriented from north to south The distance between
the double rows was 12 m (path) the distance between each row of the double row
(within the row distance) was 04 m and the distance between plants within the row
was 03 m resulting in a plant density of 41 stemsm2
Chapter 22 Virtual plant for light interception and photosynthesis
25
Measurements of architectural development
Each week for six weeks angle length width internode length and azimuth
orientation of all leaves of five plants were manually measured weekly with a ruler
and a protractor Measurements were made during the morning hours (0900-1300)
Leaf elevation angle was determined as the angle of the leaf petiole with the
horizontal at the leaf insertion point on the stem The first leaf longer than 2 cm was
defined as leaf number 1 Azimuth angle was determined as the leaf horizontal angle
measured clockwise from a constant point defined as ldquonorthrdquo North (or 0 degrees)
was defined as the point perpendicular to the plant rows when facing towards the
inner side of the double row
The tomato plant has composite leaves with 10 to 13 leaflets Leaflet angle was
measured on 10 leaves at different canopy heights on 6 plants in total The angle of
the leaflet to the horizontal at the point that it connects to the petiole was defined as
leaflet angle
The crop leaf area was estimated non-destructively through leaf length and leaf
width measurements at the widest point The relationship between the area of a leaf
and its length and width was estimated by taking photographs against a white
background of 25 randomly chosen leaves from various canopy depths with a digital
camera (Canon IXUS 800 IS) positioned perpendicular to the leaf A ruler was set
next to the leaf for calibration of the image scale during image processing ImageJ
(National Institutes of Health Bethesda MD) was used for image analysis A
relationship was established between leaf length and width and leaf area This
relationship was used to calculate the leaf area index from length and width
measurements on all dates Leaflet length and leaflet area were also measured on
these 25 leaves in order to establish a relationship between the leaflet length and
leaflet area
Light interception measurements
Photosynthetically active radiation (PAR) interception was measured with a 08m
light rod in the crop and a reference sensor above the crop (Sunscan Delta-T UK)
under diffuse light conditions (overcast sky) The light rod was positioned
perpendicular to the row and light interception was measured from the top to the
bottom of the plant at 025m height intervals The measurements were repeated at
eight selected spots in the crop once a week for seven weeks Measurements were
Chapter 22 Virtual plant for light interception and photosynthesis
26
also taken in the middle between the double row and in the middle of the path For
these measurements the sensor was positioned parallel to the crop at three different
plant heights (05 m 1 m and at the base of the plant)
Photosynthesis measurements
Photosynthesis light response curves were measured with the use of a portable
open gas exchange measurement device (LCpro+ ADC UK) PAR levels were set to
0 100 250 500 700 and 1400 μmol m-2 s-1 CO2 concentration and relative humidity
were set to ambient greenhouse values (360 μmol mol-1 CO2 and 73 RH
respectively) On three dates during the experiment measurements were done on a
leaf at two different canopy heights (upper and middle respectively) on six plants and
at three different dates during the experiment Upper middle and bottom canopy
height layers were defined as intervals of 05 m from the top to the bottom of the
canopy
Model Description
The functionalndashstructural model presented here consists of three different modules
(Fig221)
bull The architectural module This is a static model that describes the plant
structure in space and the topology of the various organs using the L-systems
formalism (eg Prusinkiewicz 1999)
bull A nested-radiosity module The input of this module is the 3D plant
architecture and the position and the intensity of the light sources using the
model of Chelle and Andrieu (1998) The light emitted by the light sources is
traced through the canopy and the light absorbed by each leaflet is given as an
output
bull The photosynthesis module This module calculates gross photosynthesis
based on the biochemical model of Farquhar (1980)
Chapter 22 Virtual plant for light interception and photosynthesis
27
Fig 22 1 Model flow chart
Architectural module
The basic structural unit of the module is the phytomer A phytomer consists of an
internode a composite leaf and a bud containing an apex The basic unit is repeated
27 times in order to form a complete plant Every three leaves a generative shoot
forms a flower truss Trusses are not represented in the model In order to account for
the light interception from the trusses a fake truss was inserted every 3 leaves This
fake truss was represented as a small leaf with the same length as the length of the
truss and the same number of leaves as the number of fruits Relationships of the
change of the leaf elevation angle and length to the node number were established for
each date An average internode length of 75 cm was used for all plants
The tomato plant has composite leaves that vary in size Typical leaves consist of
a large terminal leaflet and up to eight large lateral leaflets Many smaller lateral
leaflets may alternate with the large leaflets The leaflets are usually petiolate and
irregularly lobed depending on the genotype (Atheron and Rudich 1986) A
representative leaf structure of the particular genotype in terms of leaflet number was
chosen for the construction of the model and was measured in detail The composite
tomato leaf was modelled as a branch structure in which each leaflet is represented as
a discrete lamina based on equations of leaflet angle (o) and leaflet area (cm2)
Static virtual plant
Light intensity at each leaflet
Photosynthesis at each leaflet
Output
Light module
bullLeaf optical properties
bullLight sources position
bullLight sources intensity Architectural
module
bullLeaf elevation angle
bullLeaf area
bullInternode length
bullLeaflet area
Photosynthesis module
bullPhotosynthetic parameters of Farquhar
model
Chapter 22 Virtual plant for light interception and photosynthesis
28
Relationships of the leaflets angle to the leaf petiole as well as the leaflet length to the
leaf length as determined in the experiment were incorporated in the model
The above mentioned relationships were derived from experimental measurements
as described in the lsquoMeasurements of architectural developmentrsquo section The visual
output of the architectural model is presented in Fig 222
Fig 222 Example of the visual output of the 3D tomato model The basic unit of
the model is two plant rows of five plants each Lines along the path and the
plant canopy represent the visual sensors used for the model calibration
Radiosity module
PAR reaching the crop consists of a direct and a diffuse light component (Spitters
1989) For the simulation of diffuse light conditions 48 directional light sources were
positioned uniformly in a hemisphere around the canopy simulating a uniformly
overcast sky The light intensity of diffuse light conditions was 460 μmol PAR m-2 s-1
For the simulation of direct sunlight a bright sky was simulated with light sources
that were given xyz coordinates similar to the sunrsquos trajectory on two distinct dates
(21 December and 21 June) For direct light conditions the intensity of the light
sources at a half hour time step was derived from the 10-yearly average of light
incidence on these dates under Dutch conditions (daily radiation was equal to 7 MJ d-1
Chapter 22 Virtual plant for light interception and photosynthesis
29
in winter and equal to 50 MJ d-1 in summer) The nested radiosity module calculates
the light absorbed by every leaflet by using a radiosity approach for a basic crop unit
and subsequent nesting of the unit to account for the surrounding canopy (Chelle and
Andrieu 1998) Multiple scattering was calculated on a canopy of 20 plants (as
calculated by the architectural module) These 20 plants formed the basic model unit
In the nested radiosity module the basic unit is multiplied infinitely in space in order
to preclude phenomena associated with border effects (eg too high levels of light
incidence from the sides) Reflectance and transmittance of the full spectrum of the
upper and lower sides of the tomato leaves were measured with the use of an
InstaSpec IV CCD spectrometer (Oriel Stradford CT USA) and a LiCor 1800-12
integrating sphere (LICOR Inc Lincoln NE USA) Twelve leaves from different
canopy heights were measured in total and the average values were inputted into the
model( upper side reflectance= 017 upper side transmittance= 006 lower side
reflectance= 012 lower side transmittance= 003)
In order to validate the model with the measured data we introduced to the model
lsquovirtualrsquo sensors that were situated at the measurement spots These sensors were
represented as surfaces with the same dimensions and optical properties as the
Sunscan sensor and were positioned inside the canopy at the same heights with
measured values
In order to investigate the effect of leaf elevation angle distribution on light
interception and photosynthesis we made comparisons between our model (EXPL)
which explicitly describes leaf elevation angles a 3D model with a fixed leaf
elevation angle (-20o for all leaves in the canopy) (CONST) and a 3D model with an
ellipsoidal leaf elevation angle distribution (ELLIP χ=27 where χ is the ratio of the
horizontal semiaxis length to the vertical semiaxis length of an ellipsoid) were made
Photosynthesis module
Photosynthesis is calculated according to the biochemical model of Farquhar et al
(1980) on the basis of absorbed light The module calculates photosynthetic rate at
leaflet level according to the equation
RDppJA
i
iv minus
Γ+Γminus
=)2(4
(eqn 222)
where pi is the intercellular partial pressure of CO2 in Pa Γ is the CO2
compensation point in Pa RD the dark respiration in μmol CO2 m-2 s-1 and J is the
Chapter 22 Virtual plant for light interception and photosynthesis
30
rate of electron transport rate per unit leaf area and is calculated from the following
equation
θJpαθJpαJ+p(α
=J2
max4maxmax 2 minusminus (eqn 221)
where α and θ are coefficients from the data fitting Jmax the potential electron
transport rate (μmol electrons μmol-1 photons) and p the light absorbed by the leaflet
surface (μmol m-2 s-1) Based on the measurements as described in lsquoPhotosynthesis
measurementsrsquo coefficients of the photosynthesis equations were differed between the
upper and the middle layer of the canopy For the lower canopy we assumed the same
coefficients as in the middle canopy For the upper canopy the coefficient values
were α= 01 θ= 069 and Jmax= 1244 and for the middle and lower canopy layer α=
01 θ= 065 and Jmax= 7518)
Model calculations for photosynthesis calibration showed a good correlation with
the measured data at two different canopy heights (R2= 093 data not shown)
Total canopy photosynthetic rate was compared between the model that explicitly
describes leaf elevation angles (EXPL) a 3D model with a constant leaf elevation
angle (CONST) and a 3D model with an ellipsoidal leaf elevation angle distribution
(ELLIP) For the EXPL and ELLIP models two different scenarios were investigated
in one scenario the photosynthesis parameters of the top of the plant were used for
the whole canopy while in the other scenario we attributed different photosynthetic
parameters for the upper (0-075 m) layer and the middle and the bottom canopy
layers (075 m-18 m) For all canopies LAI was kept constant at 31
Statistical analysis
Statistical analysis was performed with GenStat 12th Edition Regression analysis
was applied to derive the various architectural and biochemical relationships
implemented in the model except for the parameters of the light response curves of
photosynthesis which were derived from a mixed linear model
Results
Developing and calibrating the crop architecture module
Dynamics of structural properties of the crop remained more or less constant
during the two months of the experiment The upper leaves showed a positive leaf
Chapter 22 Virtual plant for light interception and photosynthesis
31
elevation angle with respect to the horizontal while the lower leaves showed a
negative leaf elevation angle Below the tenth youngest phytomer leaf elevation angle
did not vary with phytomer angle (Fig 223A) Leaf length rapidly increased from the
top to the 7th phytomer from 2 to 30 cm and then remained almost constant in the
lower leaves (Fig 223B) However leaf area increased continuously from the top to
the bottom of the canopy (Fig 223C) Most leaves were positioned perpendicular to
the plant row towards the path and the middle of the plant row (Fig 223D)
Fig 223 Relationship between A) leaf elevation angle to the horizontal plane B)
leaf length C) leaf area in relation to phytomere number starting from the top
of the plant and D) leaf azimuth angle distribution Each symbol represents a
specific week in fig3 A-B-C Vertical bars in Fig 3D represent the number of
leaves per leaf orientation class
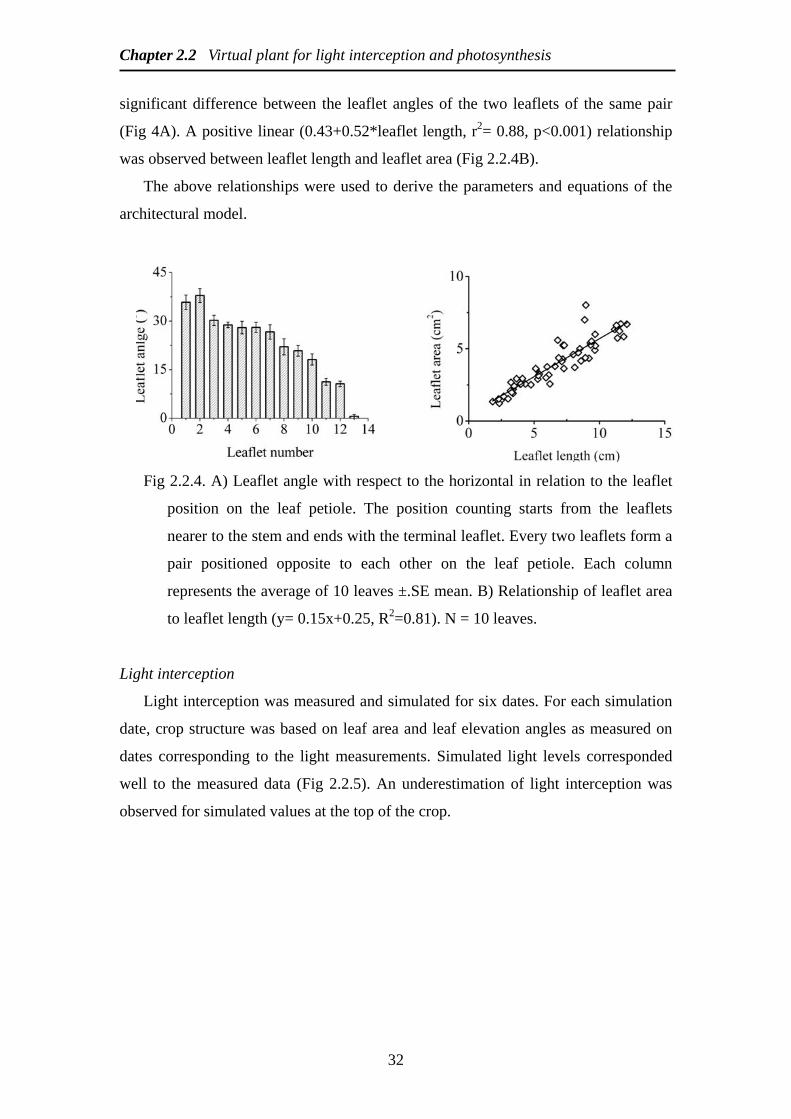
Leaflet angles depended on leaflet position on the leaf petiole The terminal leaflet
had an angle of zero and the leaflets tended to be more erect towards the plant stem
Leaflets in tomato leaves occur in pairs opposite to each other In Fig 224A every
two leaflets represent one pair (ie leaflets 1 and 2 are one pair etc) There was no
Chapter 22 Virtual plant for light interception and photosynthesis
32
significant difference between the leaflet angles of the two leaflets of the same pair
(Fig 4A) A positive linear (043+052leaflet length r2= 088 plt0001) relationship
was observed between leaflet length and leaflet area (Fig 224B)
The above relationships were used to derive the parameters and equations of the
architectural model
Fig 224 A) Leaflet angle with respect to the horizontal in relation to the leaflet
position on the leaf petiole The position counting starts from the leaflets
nearer to the stem and ends with the terminal leaflet Every two leaflets form a
pair positioned opposite to each other on the leaf petiole Each column
represents the average of 10 leaves plusmnSE mean B) Relationship of leaflet area
to leaflet length (y= 015x+025 R2=081) N = 10 leaves
Light interception
Light interception was measured and simulated for six dates For each simulation
date crop structure was based on leaf area and leaf elevation angles as measured on
dates corresponding to the light measurements Simulated light levels corresponded
well to the measured data (Fig 225) An underestimation of light interception was
observed for simulated values at the top of the crop
Chapter 22 Virtual plant for light interception and photosynthesis
33
Fig 225 Measured vs simulated values of light interception Values are from 6
weeks of measurements in 8 different canopy heights Continuous line is 11
In a comparison between EXPL CONST and ELLIP models no differences were
found in total light interception but differences were observed for the middle of the canopy The use of a constant angle led to a 17 underestimation of light interception under diffuse light conditions and a 236 underestimation under direct light conditions compared to the EXPL model Ellipsoidal distribution led to a 76 and an 11 underestimation under diffuse light conditions and direct light conditions respectively (Table 221) These differences were observed only in the middle canopy layer
In order to investigate the effect of the row crop on the horizontal light distribution and the simulation capabilities of the model virtual sensors were
Fig 226 Measured and simulated horizontal light distribution in a row tomato
crop The light intensity is plotted against the plant row length at three different plant canopy heights (50 cm () 100 cm (nabla) and 175 cm ()) Lines represent simulated values while symbols represent measured values plusmn SEmean Plant rows are located at 20cm and 140cm while the middle of the path is located at 80cm
Chapter 22 Virtual plant for light interception and photosynthesis
34
positioned parallel to the crop row in the middle of the space between two rows and
in the middle of the path at three heights (Fig 226) Light intensity decreased from
the top to the bottom of the canopy and from the centre of the path to the row (Fig
226)
Table 221 Comparison of three different leaf elevation angle modelling approaches
with respect to effect on light interception and photosynthesis Values for light
interception and photosynthetic rate are for the total canopy Values in brackets
refer to the middle of the canopy (07 5m-125 m from the top of the plant) where
differences were observed
Leaf elevation
angle
distribution
Light intercepted
()
Photosynthesis with
one set of parameters
(μmol m-2 s-1)
Photosynthesis with
two set of parameters
(μmol m-2 s-1)
Diffuse Direct Diffuse Direct Diffuse Direct
Fixed angle
(CONST)
77
(43)
80
(41)
20
(88)
27
(123)
Ellipsoidal
distribution
(ELLIP)
77
(48)
80
(47)
24
(103)
292
(129)
21
(107)
296
(132)
Explicitly
described leaf
elevation angles
(EXPL)
77
(52)
80
(55)
27
(106)
303
(132)
24
(109)
309
(137)
Direct light was calculated for 21 of June The light intensity for direct light conditions was derived
from the 10-yearly average of light incidence on these dates under Dutch conditions (46 μmol m-2
s-1at sunrise 3109 μmol m-2 s-1 at noon and 23 μmol m-2 s-1 at sunset) For diffuse light conditions
a light intensity of 460 μmol m-2 s-1 was considered Calculations were done when it was assumed
that all leaves of the canopy had the same photosynthetic properties or with two sets of
photosynthetic properties where the properties of the top layer differed from those of the middle
and lower layers
Taking into account the perpendicular positioning of the leaves to the plant row
leaves positioned towards the path absorbed more light per unit leaf area than leaves
positioned towards the middle of the plant row (which received 30 43 and 88
Chapter 22 Virtual plant for light interception and photosynthesis
35
less in the upper middle and bottom canopies respectively) Simulation data showed
an underestimation of the light intensity at the various plant heights compared to the
measured data
Both sun elevation and plant orientation to the sunrsquos trajectory had an effect on
light interception (Fig 227) Fraction of light intercepted was in all cases higher
during winter than summer Light interception increased substantially for plants rows
with a north-south orientation than plant rows with an east-west orientation This
trend was observed for both times of the year
Fig 227 Seasonal variation in light interception for 21st of December (circles)
and 21st June (squares) for a north-south (open symbols) and east-west (closed
symbols) row orientation LAI was 31 Calculations were performed for
exactly the same canopy structure on both dates
Photosynthesis
In order to investigate the horizontal distribution of photosynthesis with the
model leaves pointing towards the path were chosen like those upon which the
manual measurements were performed Leaves located in the higher canopy layer
photosynthesized considerably more than those positioned in the middle or the bottom
of the canopy Differences in simulated photosynthesis were not observed between the
middle and bottom simulated canopy layers because the same photosynthetic
parameters were used for these two layers and light levels were almost equal In the
higher canopy layer photosynthesis increased rapidly from 8 to 35 μmol m-2 s-1 from
Chapter 22 Virtual plant for light interception and photosynthesis
36
the inside leaflets to the outer ones while in the lower canopy layers photosynthesis
ranged from 25 to 148 μmol m-2 s-1 (Fig 228)
Fig 228 Horizontal distribution of photosynthesis in the crop path In this graph
only leaves positioned towards the path at three different canopy heights (05 m
() 1 m () and 175 m ()) are used Each data point is the average of a pair
of leaflets and includes the result from 2-3 leaves per plant from 20 plants
depending on the leaves position Simulation was performed under diffuse light
conditions
The rate of the increase from the inside to the outer leaflets was relatively higher
in the lower layer (43 and 6 for the higher and the lower layer respectively) Total
canopy photosynthesis differed in total 26 (for diffuse light) and 11 (for direct
light) between the EXPL and CONST models (Table 221) Total photosynthesis
differences between the EXPL and ELLIP model were 11 (diffuse) and 4 (direct
light) respectively For light interception differences simulated in the middle canopy
layer the CONST model led to a 16 underestimation of photosynthesis under
diffuse light conditions and to a 7 underestimation under direct light conditions in
comparison with the EXPL model The ELLIP model led to a 3 underestimation
under diffuse and under direct light conditions compared with the EXPL (Table
221) The differences in photosynthetic rate when using the same photosynthetic
parameters for all leaves compared to the use of two sets of photosynthetic parameters
in top and middle leaves was 125 and 13 (for diffuse and direct light
Chapter 22 Virtual plant for light interception and photosynthesis
37
respectively) for the ELLIP model and 11 and 2 (for diffuse and direct light
respectively) for the EXPL
Discussion
The aim of this research was to analyse the temporal dynamics of the horizontal
and vertical light distribution and photosynthesis in relation to canopy heterogeneity
under direct and diffuse light conditions
The spatial position of plant organs has been studied in view of their possible
adaptation to their local environment Such strategies can aim either at maximization
of plant production efficiency or at minimization of the impact of stress-inducing
conditions such as drought or light inhibition (Bjoumlrkman and Powles 1984) Leaf
dimensions and especially leaf elevation angles are important in assessing these plant
strategies as they are directly linked to the acquisition of light Smaller and more
upright leaves are found in the top of the canopy which allows light penetration to the
lower layers while lower leaves have a higher area so as to ensure maximum light
absorption (Pearcy et al 1990) Since leaf elevation angle is an important
architectural phenotypic characteristic of a plant it should be explicitly incorporated
in functionalndashstructural plant models Dong et al (2008) proposed a functionalndash
structural tomato model in which leaf elevation angle is randomized according to an
ellipsoidal distribution Najla et al (2009) and Higashide (2008) used a fixed value to
describe all leaf elevation angles independent of their position in the canopy These
approaches assume a leaf distribution that is not affected by cultivation practices or
the specific plant genotype However Sinoquet et al (2005) showed that this is not
the case and that likely factors for the deviation from the randomness in leaf
positioning in a canopy can be linked to leaf size and angle In this study we
compared three leaf elevation angle distributions (CONST ELLIP and EXPL) and
showed that the previous approaches to modeling leaf elevation angle can lead to an
underestimation of light interception in the middle canopy ranging from 4 to 15
depending on the light conditions Although light interception in the canopy is the
same for all models the change in the middle canopy layer led in photosynthesis
simulation to differences of 3-8 Therefore in order to correctly model the
heterogeneity of plant canopy leaf elevation angles should be explicitly described
Chapter 22 Virtual plant for light interception and photosynthesis
38
Another point of importance in terms of plant architecture is the azimuth leaf
orientation Atheron and Rudich (1986) reported that in a single tomato plant leaves
were evenly distributed around the stem with a phyllotaxis angle of 135o Our data
show that tomato plants grown in a row crop system tend to rearrange their leaves in a
more systematic way namely almost perpendicular to the plant row Similar
phenomena where leaves are turned away from shady spots have been reported for
maize (Maddoni et al 2001) trees (Cournegravede et al 2007) and cucumber (Kahlen et
al 2008) Dauzat et al (2008) observed that branch placement was density-
dependent in cotton and that at high densities sympodial and monopodial branches
tended to orient towards the space between rows This placement of leaves and
branches is probably due to the plantrsquos strategy for maximizing light interception and
should also be taken into account when modelling plant architecture
Row crop systems are the most common cropping systems used in horticultural
and agronomic crops This system which was developed mainly to facilitate harvest
and crop management allows higher light penetration inside the plant canopy In our
experiment light intensity increased towards the middle of the path as also observed
by Stewart et al (2003) in maize and Louarn et al (2008) in grapevines Our
simulation showed that of the amount of light reaching the top of the canopy 50
reaches the ground floor in the middle of the path Light direction combined with light
intensity has a direct effect on light interception A seasonal pattern in fraction of light
intercepted has been reported for many species (Gilbert et al 2003 Cassela and
Sinoquet 2007) Light interception follows a seasonal pattern with on average a
lower fraction of light intercepted during summer than during winter A main factor is
the change in solar elevation changing during the year The higher solar elevation in
summer months results in an orientation of light rays more perpendicular to the plant
canopy resulting in a higher light penetration and lower interception Interestingly
row orientation seems to affect substantially light interception with north-south
orientation giving a higher light interception than east-west orientation The same
phenomenon has been reported by Palmer (1989) and Borger et al (2010) Kahlen et
al 2008 reported that light direction and intensity are linked to a possible growth
advantage of certain plants positions inside the canopy mainly by leaf rearrangement
towards the unshaded patches of the canopy or leaf photosynthetic acclimation to
altered light status Architectural adaptations of plants to the seasonal light patterns
would in this context be worth investigating
Chapter 22 Virtual plant for light interception and photosynthesis
39
Leaf elevation angle and vertical leaf distribution are highly relevant for the daily
amount of photosynthesis as was shown in the results Increase in light in lower
canopy layers resulted in a higher relative increase in photosynthesis A probable
explanation for this is the leaf acclimation to lower light intensities and the
physiological age in lower layers in the canopy (Niinemets 2007) Leaves situated
within the two rows received a substantially lower amount of light than leaves at the
same height situated towards the path If lower photosynthesis is partly an effect of
acclimation to lower light levels it stands to reason that leaves oriented towards the
middle of the plant rows will have a lower photosynthetic rate than leaves at the same
height that are oriented towards the path and very likely different photosynthetic
potential A common experimental approach for photosynthesis is to take
measurements only in the upper and middle canopy and only of leaves oriented
towards the path However model calculations showed that the use of one more set of
photosynthetic parameters can lead to a 7-10 difference in photosynthesis
prediction So it stands to reason that when a significant part of the canopy is oriented
towards the intra-row space with concomitant higher photosynthetic potential
predictions of crop photosynthesis will be inaccurate Virtual plant models are able to
cope with this given the proper data Chelle (2005) also pointed out the need for a
new modelling approach that will combine the organ microclimate with the general
plant environment He demonstrated the temperature differences that can be measured
at various plant organs and how the use of FSPMs can improve our understanding of
the effect of these differences on the plant processes A similar approach should be
used for photosynthesis modelling as it would improve our understanding of the
impact of various crop strategies on photosynthesis
Conclusions
Leaf elevation angles of heterogeneous canopies should be explicitly described as
they have a big impact both on light interception and on photosynthesis Comparisons
between 3D models with explicitly described leaf elevation angles and models with
standard leaf elevation angle distributions resulted in differences of 4-15 depending
on the light conditions and the number of the sets of photosynthetic parameters In this
frame functional-structural models can play an important role in our understanding of
light distribution along vertical and horizontal gradients caused by crop architecture
Such a tool can be useful in practise not only in yield prediction but also in
Chapter 22 Virtual plant for light interception and photosynthesis
40
experimentation planning as well However steps should be taken to move from a
static to a dynamic crop so as to incorporate the seasonal adaptation of the plants
Chapter 23
Searching for the ideal plant structure with a functional-structural plant model How plant architecture affects light absorption and photosynthesis in tomato
Accepted as
Sarlikioti V de Visser PHB Buck-Sorlin GH Marcelis LFM 2011 How
plant architecture affects light absorption and photosynthesis in tomato Towards an
ideotype for plant architecture using a functional-structural plant model Annals of
Botany in press
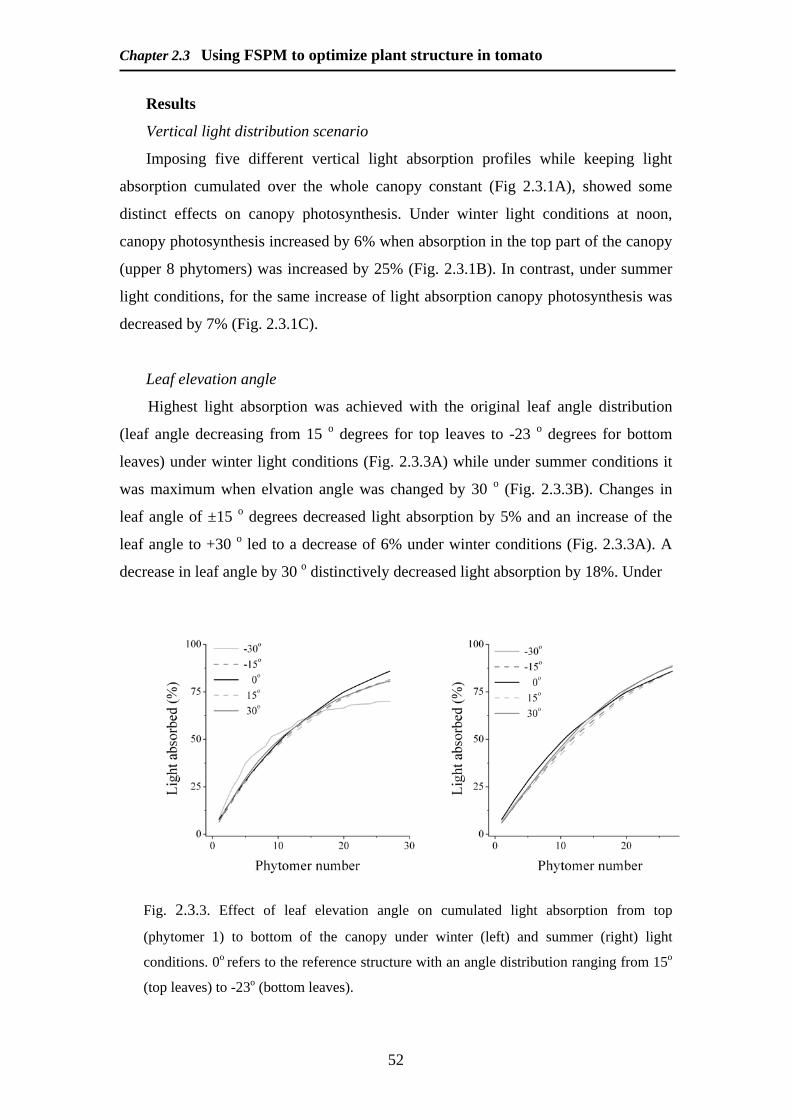
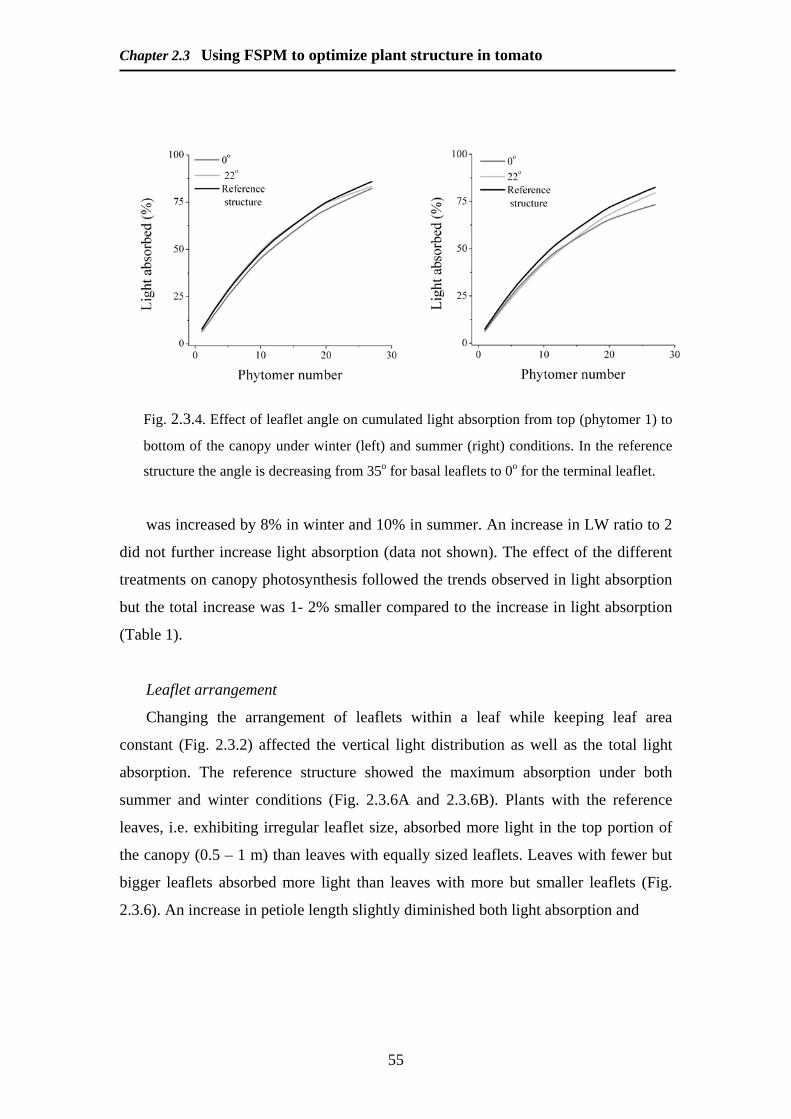
Chapter 23 Using FSPM to optimize plant structure in tomato
43
Abstract
Manipulation of plant structure can strongly affect light distribution in the canopy
and photosynthesis The aim of this paper is to find a plant ideotype for optimization
of light absorption and canopy photosynthesis Using a static functional structural
plant model (FSPM) a range of different plant architectural characteristics was tested
for two different seasons in order to find the optimal architecture with respect to light
absorption and photosynthesis Simulations were performed with a FSPM of a
greenhouse-grown tomato crop Sensitivity analyses were carried out for leaf
elevation angle leaf phyllotaxis leaflet angle leaf shape leaflet arrangement and
internode length From the results of this analysis two possible ideotypes were
proposed Four different vertical light distributions were also tested while light
absorption cumulated over the whole canopy was kept the same Photosynthesis was
augmented by 6 in winter and decreased by 7 in summer when light absorption in
the top part of the canopy was increased by 25 while not changing light absorption
of the canopy as a whole The measured plant structure was already optimal with
respect to leaf elevation angle leaflet angle and leaflet arrangement for both light
absorption and photosynthesis while phyllotaxis had no effect Increasing the length-
to-width ratio of leaves by 15 or increasing internode length from 7 to 12 cm led to
an increase of 6 ndash 10 for light absorption and photosynthesis At high light
intensities (summer) deeper penetration of light in the canopy improves crop
photosynthesis but not at low light intensities (winter) In particular internode length
and leaf shape affect the vertical distribution of light in the canopy A new plant
ideotype with more spacious canopy architecture due to long internodes and long and
narrow leaves led to an increase in crop photosynthesis of up to 10
Chapter 23 Using FSPM to optimize plant structure in tomato
44
Introduction
Light absorption is an important factor for determining crop yield being one of
the driving forces behind plant photosynthesis and at the same time is highly
dependent on single-plant architecture as well as on overall canopy structure
(Niinemets 2007) Plant architectural characteristics (such as the number and
geometry of organs ie their shape and position within the plant and the canopy) are
genotype specific while at the same time highly dependent on the climatic conditions
at the time of their initiation and development (Godin 2000) Falster and Westoby
(2003) have shown that steeper elevation angles in a number of species improve
absorption at higher sun elevations and therefore carbon gain through assimilation as
it allows more light to penetrate to the lower leaves While the importance of leaf
elevation angles for an improved light absorption strategy at the level of the whole
plant has been shown in a number of studies (Pearcy and Yang 1998 Sinoquet et al
2005) reports about the importance of leaf phyllotaxis are contradictory as some
studies did and some did not observe effects on the light absorption of the canopy
(Brites and Valladares 2005) Furthermore aspects such as the elevation angles of the
leaflets of composite leaves have not been to the best of our knowledge previously
investigated Both leaf shape and size are important aspects of leaf morphology
affecting mutual shading of leaves and light absorption of the canopy (Falster and
Westoby 2003)
The quantitative exploration of the specific effects of each plant architectural
characteristic on light absorption and photosynthesis was hardly possible until the
introduction of spatially explicit models considering plant architecture at the organ
level (Vos et al 2010) General crop models are powerful tools towards a better
understanding of plant processes and for testing case scenarios (Marcelis et al 1998
Vos et al 2007) More specifically functional-structural plant models (FSPM) have
been introduced as a relatively recent paradigm in plant modelling where
physiological processes are coupled with an explicit 3D plant structure (Vos et al
2010) often supplied with a mutual feedback between physiology and structure
Modelling on the basis of a 3D structure gives the opportunity to investigate more in-
depth the effect of specific architectural characteristics such as leaf angle leaf length
or leaf shape (Vos et al 2010) Sinoquet et al (2005) used FSPMs to show the effect
of leaf and branch distribution on light absorption of trees Sarlikioti et al (2011)
developed a static tomato FSPM to explore the spatial distribution of light absorption
Chapter 23 Using FSPM to optimize plant structure in tomato
45
and photosynthesis in a tomato canopy They demonstrated the importance of an
explicitly described leaf angle distribution for simulating light absorption and
photosynthesis Accurately calibrated FSPMs can convey a better understanding of
the light distribution inside the canopy and also provide us with a tool to define the
optimal set of architectural characteristics for maximizing canopy photosynthesis
allocation of assimilates to growing organs and ultimately crop yield
Donald (1968) defined the ldquocrop ideotyperdquo in the context of cereal breeding as an
idealized plant type with a specific combination of characteristics favourable for
photosynthesis growth and grain production based on knowledge of plant and crop
physiology and morphology He argued that it would be more efficient to define a
plant type that was theoretically efficient and then breed for this The crop ideotype is
thus an idealized crop consisting of a plant type with a specific combination of
characteristics based on the detailed knowledge of morphological and physiological
plant traits (Peng et al 2008) as well as mutual interactions among plants of the
canopy These traits often are also contributing to plant architecture Modifications of
the arrangement and size of leaves can affect light availability especially in the lower
parts of the canopy and alter leaf photosynthetic activity by adjusting light harvesting
efficiency (Werner et al 2001) As an example a decrease in leaf clustering can
increase light absorption and enhance photosynthetic productivity at canopy level (De
Castro and Fetcher 1999) Morphological characteristics such as leaf inclination and
leaf shape are often inherited as simple traits (ie under the influence of one or a few
major genes) in the plant (Thurling 1991) and can be used to create a more open
canopy structure These breeding traits can be strongly affected by the environment
under stress conditions (Valladares and Niinemets 2007) Tomato (Solanum
lycopersicum L) is a species that exhibits a high variability in vegetative morphology
(Peralta and Spooner 2000) ranging from small leaves with a few leaflets to big ones
with many leaflets Lately studies of the genetic basis of this variation at the leaf level
have shown that there are leaf-specific genes that control its shape and morphology
(Frary et al 2004) This genetic background knowledge in combination with the
detailed information on the effect of leaf topology and geometry on light absorption
and photosynthesis could help to identify or approximate the theoretical optimum of
plant architecture
The objective of this study is to define a plant ideotype for greenhouse-grown
tomato with respect to optimization of light absorption and photosynthesis at the
Chapter 23 Using FSPM to optimize plant structure in tomato
46
canopy level A range of different plant architectural characteristics were tested under
light conditions of a typical summer and winter day in order to define the ideal for
each case We tested two hypotheses 1) The manipulation of plant structure of a
greenhouse-grown tomato crop can lead to substantial improvement in crop
photosynthesis even when leaf area index and leaf photosynthetic characteristics
remain unaltered 2) A more spacious canopy architecture improves crop
photosynthesis For this purpose we used the static functional structural tomato model
developed by Sarlikioti et al (2011)
Material and methods
Model description
Simulations were performed with a functional structural tomato model This
model was built as a parametric open L-system using the cpfg language within the
platform L-Studio (Prusinkiewicz 1999) consisting of three modules (model structure
and parameterization has been described in detail in Sarlikioti et al (2011)
Architectural module
This is essentially a static 3D reconstruction of tomato plant architecture in which
each plant consists of 27 phytomers with the first phytomer being the one at the top of
the plant (basipetal ranking) A phytomer is the basic architectural unit consisting of a
leaf and an internode the leaf itself being made up of a leaf rachis a central midrib
and 13 individual leaflets each one of them consisting of a blade and a petiole of
which one is terminal and 12 are lateral The blade of each leaflet is described as a flat
polygon instead of one with a curvature for reasons of calculation efficiency
Characteristics are leaf elevation angle (defined as the angle between the leaf rachis
at its insertion point to the stem and the horizontal plane) leaf length (defined as the
distance from the leaf insertion point at the stem to the tip of the terminal leaflet) and
leaf width (defined as the distance between the tips of two longest lateral leaflets)
The construction of the leaf leads to a 3D object The architectural model was
parameterized during a summer period for a fully grown tomato crop (Solanum
lycopersicum L var lsquoArancarsquo) grown in a high-wired greenhouse system in
Bleiswijk The Netherlands (52deg01N 4deg32E) with a density of 41 stems m-2 (see
Sarlikioti et al 2011) LAI was equal to 36 m2 of leaf area per m2 floor area Every
week the lowest leaves were removed the plants were lowered and kept at the same
Chapter 23 Using FSPM to optimize plant structure in tomato
47
height throughout the season as it is common practice in the Netherlands Therefore
plant architecture remained ldquostaticrdquo at least during each season (summer winter) For
that reason a static modeling approach was used
Light module
Light calculations are based on a nested radiosity approach developed by Chelle
and Andrieu (1998) The module requires as an input the amount of light absorbed by
each plant organ the leaf transmittance and reflectance coefficients for the upper and
lower side of the leaf (upper side reflectance = 017 upper side transmittance = 006
lower side reflectance = 012 lower side transmittance = 003) and the light from the
light sources that were used to simulate the sky In the Netherlands greenhouses are
usually larger than 1 ha In order to better approach real greenhouse cultivation
conditions an infinite canopy was assumed in which the basic unit is theoretically
reproduced in all directions thus avoiding a border effect during the calculations The
basic unit consisted of 20 plants arranged in two double rows with five plants per row
The distance between the double rows was 12 m (path) the distance between each
row of the double row (within the row distance) was 04 m and the distance between
plants within the row was 03 m
Photosynthesis module
Photosynthesis calculations are based on the biochemical model of Farquhar et al
(1980) This model requires as input the computed light absorbed per leaflet in the
model and photosynthetic parameters that were derived from the experimental data
(Sarlikioti et al 2011) All photosynthetic parameters (Vmax α θ etc) were assumed
invariate with canopy depth except for Jmax which followed a logistic pattern from
the top to the bottom of the canopy (Jmax at the top = 265 micromol e- m-2 s-1 Jmax at the
bottom= 180 micromol e- m-2 s-1)
Case studies
In this study we attempted to define the importance of each architectural
component for optimum light absorption and canopy photosynthesis by performing a
sensitivity analysis of the most important components as they appear in the literature
Each component is described in detail below
Chapter 23 Using FSPM to optimize plant structure in tomato
48
Simulations were performed under summer and winter light conditions and for
two distinctive days (December 21 and June 21) using ten-yearly (2000-2010)
averages with an hourly time step of direct and diffuse light incident at these dates
under Dutch conditions Daily global radiation outside the greenhouse was equal to
35 MJ m-2 d-1 in winter and 26 MJ m-2 d-1 in summer Transmissivity of the
greenhouse was 60 For direct light conditions light sources were given the same
Cartesian co-ordinates as the solar trajectory To simulate diffuse light light sources
were positioned on a virtual hemisphere around the architectural mock-up In total 48
directional light sources were used with daily intensity equal to 15 MJ m-2 d-1 in
winter and 75 MJ m-2 d-1 in summer The fraction of diffuse light was equal to 03 for
winter and 022 for summer Leaf temperature was 23 oC and calculations were
performed for CO2 levels equal to 400 ppm Computed hourly assimilation rates were
integrated to daily amount of assimilates produced
Vertical light distribution scenario
In order to understand the effect of vertical light distribution on canopy
photosynthesis we constructed four light absorption curves (Fig 321A) that were
based on the light absorption of the reference structure for each date Light absorption
was increased and decreased from the first to the 8th phytomer by 10 and 25
respectively while the light absorption of the canopy as a whole remained the same
Canopy photosynthesis was calculated for each curve
Leaf elevation angle
Here we studied the effect of modifying leaf elevation angle with respect to the
original angular distribution As a starting value we assumed an explicitly described
leaf angle distribution (Sarlikioti et al 2011) Simulations were carried out by adding
or subtracting 15 o or 30 o to the measured value of each leaf in the canopy In the
reference crop the leaf angle distribution ranged from -23 o for bottom leaves to 15 o
for top leaves
Chapter 23 Using FSPM to optimize plant structure in tomato
49
Fig 231 Five different vertical light absorption profiles (top graph) were imposed as
treatments for studying the optimal profile for maximum crop photosynthesis The
absorbed light is the cumulated value from top (phytomer 1) to bottom of the canopy
Photosynthesis at 1200 h (g CH2O m-2 h-1) is presented for each treatment for winter
(middle graph) and summer (lower graph) light conditions Treatments for absorption
profile are -25 -10 0 +10 and +25 These values refer to the percentage change
in light absorption in the upper eight phytomers of the canopy while light absorption
cumulated over the whole canopy was kept constant
Chapter 23 Using FSPM to optimize plant structure in tomato
50
Leaf phyllotaxis
The phyllotactic angle is defined as the angle between two subsequent leaves
along the plant stem Atherton and Rudich (1986) reported that tomato plants follow a
common 135 o phyllotaxis In reality however plants tend to rearrange their leaves
thereby deviating from this value In previous experiments we found that phyllotactic
angle on a tomato row crop is about 160 o (Sarlikioti et al 2011) Here we assess the
effect of leaf phyllotaxis for values equal to 110 o 135 o 150 o and 180 o
Leaflet angle
As leaflet angle we define the angle between the leaflet petiole and the leaf rachis
In a composite leaf leaflet angles steadily decrease from the proximal to the terminal
leaflet On average the measured leaflet angle of tomato leaves was 22 o ranging from
35 o for the basal leaflets to 0 o for the terminal leaflet (Sarlikioti et al 2011) In the
present study this original distribution (reference crop) was compared with leaves
having all leaflets oriented at an angle of 22 o or 0 o
Leaf shape
The ratio between leaf length and leaf width was used as a convenient measure of
leaf shape In the model the default value of the length-to-width ratio is equal to 102
Leaf ratios of 05 075 125 15 and 2 times the original ratio were tested for their
effect on light absorption and canopy photosynthesis These ratios resulted in a range
of leaf shapes from wide and short leaves to long and narrow ones For all simulations
the leaf area index per plant was kept constant at 36 m2 leaf area per m-2 floor area
Leaflet arrangement on a leaf
The area of each leaf is equal to the sum of the areas of each of its leaflets In the
leaf of a typical tomato cultivar pairs of big and small leaflets alternate A wide range
of leaf types can be found in tomato We investigated the (crop scale) effect of leaf
types with all leaflets having the same area as well as the effect of having fewer but
bigger leaflets (Fig 232) Also the effect of an increase of petiole length by 20 of
the original value was investigated In all simulations the area per leaf (sum of all
leaflets) was kept the same
Chapter 23 Using FSPM to optimize plant structure in tomato
51
Fig 232 Schematic representation of leaflet arrangement scenarios The total
area per composite leaf was kept constant
Internode length
As internode length we define the distance between the insertion points of two
consecutive plant organs (leaves or trusses) Measured average internode length was
745 cm (stdev= 08) (Sarlikioti et al 2011) Here we investigated the effect of
internode lengths of 3 cm 5 cm 10 cm and 12 cm In all simulations leaf number (13)
and area per leaf (m2) were kept constant
Ideotyping scenarios
After the above assessment of architectural characteristics of the tomato plant we
found that a number of parameters improve the light absorption as well as canopy
photosynthesis Based on these results we designed the following two scenarios
bull Scenario A For this scenario architectural characteristics were chosen
which by themselves had produced a minimum increase in canopy
photosynthesis by 4 Internode length was set to 10 cm length-width
ratio to 15 all other architectural characteristics were kept the same as in
the reference structure
bull Scenario B This scenario aimed at reconstructing an open structure of the
canopy The internode length was again set to 10 cm and for leaflet
arrangement the leaves with longer petioles (Fig 232) were chosen All
other architectural characteristics remained the same as in the reference
structure
Chapter 23 Using FSPM to optimize plant structure in tomato
52
Results
Vertical light distribution scenario
Imposing five different vertical light absorption profiles while keeping light
absorption cumulated over the whole canopy constant (Fig 231A) showed some
distinct effects on canopy photosynthesis Under winter light conditions at noon
canopy photosynthesis increased by 6 when absorption in the top part of the canopy
(upper 8 phytomers) was increased by 25 (Fig 231B) In contrast under summer
light conditions for the same increase of light absorption canopy photosynthesis was
decreased by 7 (Fig 231C)
Leaf elevation angle
Highest light absorption was achieved with the original leaf angle distribution
(leaf angle decreasing from 15 o degrees for top leaves to -23 o degrees for bottom
leaves) under winter light conditions (Fig 233A) while under summer conditions it
was maximum when elvation angle was changed by 30 o (Fig 233B) Changes in
leaf angle of plusmn15 o degrees decreased light absorption by 5 and an increase of the
leaf angle to +30 o led to a decrease of 6 under winter conditions (Fig 233A) A
decrease in leaf angle by 30 o distinctively decreased light absorption by 18 Under
Fig 233 Effect of leaf elevation angle on cumulated light absorption from top
(phytomer 1) to bottom of the canopy under winter (left) and summer (right) light
conditions 0o refers to the reference structure with an angle distribution ranging from 15o
(top leaves) to -23o (bottom leaves)
Chapter 23 Using FSPM to optimize plant structure in tomato
53
summer light conditions (Fig 233B) the increase was equal to 3 for plusmn30 o
treatments Interestingly in winter simulations the decrease in elevation angle by 30 o
did not only decrease light absorption but also changed the vertical distribution of
light absorption leading to a higher absorption at the top part of the canopy (Fig
233)
In general a change in elevation angle decreased canopy photosynthesis by 6 to
7 in winter which is similar to the reduction in light absorption (Table 1) However
when the angle was decreased by 30 o canopy photosynthesis decreased only by 11
while absorption was decreased by 18
Leaf phyllotaxis
Changes in phyllotactic angle hardly affected light absorption (data not shown)
and canopy photosynthesis (Table 1)
Leaflet angle
An increase in leaflet angle from completely horizontal leaflets (0 o) to an angle
of 22 o resulted in an increase in light absorption by 2 in winter (Fig 234A) and
8 (Fig 234B) in summer The subsequent increase in canopy photosynthesis was
2 under winter and 8 under summer light conditions (Table 1) When all leaflet
angles were 22 deg light absorption was 2 lower under winter and 4 under summer
light conditions compared to the reference plants (angle decreasing from 35 deg for
basal leaves to 0 deg for the terminal leaflet) (Fig 234) while canopy photosynthesis
exhibited the same increase for both seasonal conditions
Leaf shape
The simulations showed that longer and narrower leaves (LWgt1) increased
cumulative light absorption of the canopy in comparison to shorter and wider leaves
when leaf area was kept constant LW ratio was positively correlated with light
absorption (Fig 235) Light absorption was decreased by 8 and 12 respectively
in winter (Fig 235A) and 14 and 23 respectively in summer for a leaf ratio
decrease of 025 and 05 (Fig 235B) An increase in the LW ratio to 125 of the
reference value resulted in an increase in light absorption by 5 in winter and 4 in
summer When the ratio was 15 times as high as the reference ratio light absorption
Chapter 23 Using FSPM to optimize plant structure in tomato
54
Table 231 Assimilation rate (g CH2O m-2 d-1) in response to leaf elevation angle phyllotaxis leaflet angle and arrangement leaf length width ratio internode length scenarios as well as the optimized architectures Total canopy photosynthesis Winter Summer Leaf elevation angle -30o 47 405 -15o 5 405 0 (reference structure) 53 42 +15o 5 405 +30o 49 417 Leaf azimuth angle 110o 52 423 135o 53 418 160o (reference structure) 53 42 180o 51 417 Leaflet angle 0o 51 373 22o 52 405 From 35o to 0˚ (reference structure)
53 42
Leaflet arrangement
Longer leaflet petioles 52 394 Same area leaflets 5 393 Fewerbigger leaflets 49 418 reference structure 53 42 Leaf length width ratio 05 47 343 075 48 398 102 (reference structure) 53 42 125 55 442 15 56 446 Internode length 3 cm 43 37 5 cm 5 388 7 cm (reference structure) 53 42 10 cm 56 442 12 cm 57 446 Optimized canopy architecture Scenario A 56 452 Scenario B 59 467
Chapter 23 Using FSPM to optimize plant structure in tomato
55
Fig 234 Effect of leaflet angle on cumulated light absorption from top (phytomer 1) to
bottom of the canopy under winter (left) and summer (right) conditions In the reference
structure the angle is decreasing from 35o for basal leaflets to 0o for the terminal leaflet
was increased by 8 in winter and 10 in summer An increase in LW ratio to 2
did not further increase light absorption (data not shown) The effect of the different
treatments on canopy photosynthesis followed the trends observed in light absorption
but the total increase was 1- 2 smaller compared to the increase in light absorption
(Table 1)
Leaflet arrangement
Changing the arrangement of leaflets within a leaf while keeping leaf area
constant (Fig 232) affected the vertical light distribution as well as the total light
absorption The reference structure showed the maximum absorption under both
summer and winter conditions (Fig 236A and 236B) Plants with the reference
leaves ie exhibiting irregular leaflet size absorbed more light in the top portion of
the canopy (05 ndash 1 m) than leaves with equally sized leaflets Leaves with fewer but
bigger leaflets absorbed more light than leaves with more but smaller leaflets (Fig
236) An increase in petiole length slightly diminished both light absorption and
Chapter 23 Using FSPM to optimize plant structure in tomato
56
Fig 235 Effect of leaf shape on cumulated light absorption from top (phytomer 1) to
bottom of the canopy under winter (left) and summer (right) conditions Leaf shape is
referring to length-to-width ratio with reference structure having a ratio of 1
canopy photosynthesis in both seasonal conditions The effect of the difference in
vertical light distribution between the scenarios was reflected on canopy
photosynthesis where the leaf with leaflets of the same area exhibited 2 less canopy
photosynthesis in winter and 6 in summer than the other two scenarios (Table 1)
Fig 236 Effect of leaflet arrangement on cumulated light absorption from top
(phytomer 1) to bottom of the canopy under winter (left) and summer (right) light
conditions
Chapter 23 Using FSPM to optimize plant structure in tomato
57
Internode length
Light absorption and canopy photosynthesis were strongly affected by internode
length A decrease in the average internode length from 7 to 3 cm reduced cumulative
light absorption by 14 in winter and by 12 in summer An increase in internode
length from 7 cm to 10 cm resulted in an increase of light absorbed of 4 in winter
and 5 in summer while a further increase in internode lengths to 12 cm resulted in a
further increase in light absorption by 2 for each date With respect to canopy
photosynthesis the increase in internode length to 10 cm increased canopy
photosynthesis by 5 to 6 in summer and winter (Table 1) An increase to 12 cm
increased photosynthesis by 8 and 6 for winter and summer respectively
Ideotyping scenarios
According to the above assessment of architectural characteristics of the tomato
plant two ideotyping scenarios were designed In scenario A internode length was set
to 10 cm LW ratio to 15 while all other architectural characteristics were kept the
same as in the reference structure In scenario B plant structure consisted of the same
long internodes (10 cm) and a leaflet arrangement with long leaf petioles was chosen
while all other architectural characters remained the same as in the reference structure
Scenario A improved both light absorption (data not shown) and canopy
photosynthesis by 6 (Table 1) in winter and by 8 in summer respectively In
scenario B the construction of a more open structure of the canopy resulted in an
increase in light absorption of 11 in both winter and summer with a similar increase
in canopy photosynthesis
Discussion
From the result of this work we can conclude that both light absorbed and the
vertical distribution of light in the canopy are very important for crop photosynthesis
Analysing the effects of vertical light distribution showed that these effects strongly
differ between winter and summer light conditions Deep penetration of light into the
canopy has positive effects in summer while these effects are negative in winter
Under summer light conditions photosynthesis of the upper leaves may be close to
saturation which explains the positive effects of deep penetration of light This is in
contrast to the photosynthesis rate of lower leaves which remains unsaturated Under
winter light conditions photosynthesis of the upper leaves is far from saturation With
Chapter 23 Using FSPM to optimize plant structure in tomato
58
the same light intensity at leaf level upper leaves have a higher rate of photosynthesis
than lower leaves (eg Sarlikioti et al 2011) This effect dominates in winter
resulting in the lower crop photosynthesis when the light penetrates deeply into the
canopy
Leaf elevation angles are maybe among the best investigated traits It has been
shown that a change in the elevation angles significantly influences light captured in
different environments (Niinemets and Fleck 2002 Valladares and Pearcy 1998) In
our previous study (Sarlikioti et al 2011) we showed that changes in leaf angles
could have a substantial effect on both light absorption and photosynthesis In the
current study optimal results were achieved when leaf elevation angle distribution
ranged between 15 o (top) and -23 o (bottom) indicating that during the cultivation
period the plant orientates its leaves in such a way as to maximize light absorption and
therefore photosynthesis Deviations from that range failed to distinctly increase both
light absorption and photosynthesis though the vertical light distribution was
affected
Modifying the phyllotactic angle resulted in no improvement of light absorption
and photosynthesis These findings agree with those of Niklas (1998) who reported
that phyllotactic angle in a crop has no effect on light absorption or photosynthesis In
contrast to this Zotz et al (2002) reported that change of leaf phyllotaxis to a golden
angle of 1375 o significantly improved the light capture efficiency in an epiphytic
plant Nevertheless phyllotactic angle is very dependent on light competition
Although a change in the angle as such might have no direct effect on light absorption
and photosynthesis it might be followed by changes in other architectural
characteristics that may lead to an increase in plant efficiency with respect to light
absorption and photosynthesis
In our study we found that an increase in LW ratio of leaves by 05 boosted light
absorption by 8 in winter and 10 in summer In environments where light is not an
inhibiting parameter (eg because of an excess in radiation) structures that avoid
mutual shading of the leaf components as well as the shading between neighbouring
leaves can be advantageous for optimization of light absorption A high leaf LW ratio
has been reported to have a positive effect on light capture and crop photosynthesis in
many species (Falster and Westoby 2003) Other aspects of morphology of composite
leaves such as shape and number of leaflets have to our knowledge hardly been
investigated In forest species it has been shown that the space and degree of overlap
Chapter 23 Using FSPM to optimize plant structure in tomato
59
of the leaves in leaf clusters on the same branch has a significant effect on light
capture (Planchais and Sinoquet 1998)
Takenaka et al (1994) showed that in general an increase in internode length
causes an increase in light absorption and photosynthetic efficiency in nature in fact
hormonally mediated internode elongation is among the most important mechanisms
of the so-called shade avoidance syndrome a set of processes that enable a plant to
avoid shading by neighbouring plants (Smith and Whitelam 1997) Our results
showed that plants with longer internodes exhibited higher light absorption and
photosynthesis both in winter and summer
The combination of different architectural parameters in the ideotype scenarios
resulted in an increase in both light absorption and canopy photosynthesis Both
ideotype scenarios aimed at creating a more open structure with more light absorption
In both cases this combination of characteristics led to an increase in photosynthesis
which in turn could potentially result in a yield increase Modern developments in
plant breeding can use this type of information to produce more efficient genotypes in
terms of canopy photosynthesis On the other hand plant architectural characteristics
are very plastic and plants are usually dynamically adapting to their environment
(Valladares et al 2007) thereby potentially eluding breeding efforts towards a light
absorption ideotype For example during the course of the day leaf movement has
been observed (Kao and Forseth 1992) or plants tend to readjust their position when
facing an intense environmental factor such as for example shading (Kahlen et al
2008) Thus even if this type of static model can give us a good quantification of the
effect of each parameter on light absorption and photosynthesis the ensuing genotype
has to be tested under actual cultivation conditions in order to verify the expectations
In the simulation model photosynthetic parameters decreased from top to the
bottom of the canopy These parameters were not adjusted with the increase or
decrease of light intensities in the middle and lower parts of the canopy In other
words no dynamic adaptation of these parameters to the new light profiles induced by
the case studies was considered In reality leaf photosynthetic potential of course
adapts to the long term light conditions a leaf has been exposed to (Gonzaacuteles-Real et
al 2007) as well as the short term changes in light climate during the day (Schurr et
al 2006) Experimental data describing these phenomena could help to improve the
model calculations by taking into account these adaptations
Chapter 23 Using FSPM to optimize plant structure in tomato
60
Conclusions
The importance of different plant architectural components for light absorption
and photosynthesis was investigated in detail using a static virtual plant Our
simulations lead to the conclusion that the most important architectural traits with
respect to the optimization of light absorption and photosynthesis are internode length
and leaf shape We also assessed the importance of vertical light distribution for
canopy photosynthesis and showed that the advantage of a deeper penetration of light
in the canopy depends on the season
Chapter 3 Monitoring PAR interception and photosynthetic stress
Chapter 31
Crop Reflectance as a Tool for Online Monitoring Of LAI and PAR Interception in Two Different Greenhouse Crops
Published as
Sarlikioti V Meinen E Marcelis LFM 2011 Crop reflectance as a tool for the
online monitoring of LAI and PAR interception in two different greenhouse Crops
Biosystems Engineering 108 113-120
Chapter 31 Crop reflectance for monitoring LAI and PAR interception
63
Abstract
The aim of this study was to explore ways of on-line monitoring of LAI and PAR
interception of the canopy in greenhouse conditions through reflectance
measurements on the PAR part of the spectrum for tomato and sweet pepper LAI and
PAR interception were measured at the same moments as reflectance at six
wavelengths in different plant developmental stages in greenhouses Normalized
Difference Vegetation Index (NDVI) was also calculated Relationships between the
measured parameters were established in experimental greenhouses and subsequently
these were tested in commercial greenhouses The best estimation for LAI and PAR
interception was obtained from reflectance at 460nm for both tomato and sweet
pepper The goodness of the fit validated with data from the commercial greenhouses
was also tested in this study The divergence of the results from the ones reported
from field experiments can be traced on the special greenhouse environment where
more sources of reflectance are added due to construction parts and a white plastic
covered background Thus this new approach of estimating LAI and PAR interception
from 460 nm is promising and can play a role in the decision support systems of
modern greenhouse management
Chapter 31 Crop reflectance for monitoring LAI and PAR interception
64
Introduction
Todayrsquos highly industrialized production of greenhouse crops in combination with
the increasing demand for a more sustainable production are pointing at the necessity of
decision support systems Methods of online monitoring of the major crop properties
should be established Leaf area is one of the most important crop properties which
have a strong physiological impact on plant functioning namely PAR interception and
thus photosynthesis Unfortunately current models of leaf area index (LAI)
development in use are not sufficiently correct and may lead to errors in calculating
light interception (Jonckheere et al 2004) PAR interception can currently be
measured manually A light stick is used to take measurements on the top and bottom
of the canopy In order to gain a reliable estimation of PAR interception many
measurements at different canopy spots are needed This method can therefore be
applied only for experimental purposes and not for commercial application as it is
rather time consuming Therefore the existence of an online monitoring technique
would improve the efficiency of the measurement
Optical remote sensing has been used in the past for the online monitoring of
parameters such as chlorophyll and nitrogen content plant stress etc in field grown
crops Attempts to measure LAI and PAR interception with the use of remote sensing
have been successful in field crops Different approaches have been used for the data
collection with sensors either on low range (ground) or far range (low flights or
satellites) (Bouman et al 1992 Clevers 1997) Efforts in the field to use reflectance
measurements for the estimation of the canopy nitrogen biomass and photosynthesis
in wheat (Gitelson et al 2002) potato (Jongschaap 2006) sugar beets (Clevers
1997) miscanthous (Vargas et al 2002) and rice (Tian et al 2005) were successful
Plant canopy exhibits strong absorption in the red part of the spectrum (around
670nm) where reflectance is less than 3-5 (Gitelson 2002) Low reflectance in this
part of the spectrum is strongly related to high light absorption from chlorophyll and
secondary photosynthetic pigments On the other hand in the near-infrared part of the
spectrum about 50 of the light is reflected 45 is transmitted and only a small part
is absorbed Turner et al 1999) The steep difference of canopy reflectance between
red and near-infrared enables the distinction of vegetation from background materials
(Bouman et al 1992)
Many studies aimed at determining combinations of reflectance of different
wavelengths for correcting the effect of disturbing factors (such as old leaves and soil
Chapter 31 Crop reflectance for monitoring LAI and PAR interception
65
background) on the relationship between crop reflectance and crop characteristics
such as LAI These combinations of the reflectance at different wavelength bands are
known as vegetation indices (VIrsquos) Vegetation indices are quantitative measures that
are used in an attempt to measure vegetation abundance or vigor (Wang et al 2005)
Some of the vegetation indices proposed during the years are the Weighted
Difference Vegetation Index (WDVI) (Bouman et al 1992) the infrared red (IRR)
ratio and the red edge leaf effect with the most commonly used the Normal
Difference Vegetation Index (NDVI) (Wang et al 2005) NDVI is based on ratios of
red (R) to near-infrared (NIR) reflectance where NDVI= (NIRminusR)(NIR+R) R and
NIR ratio-based indices are strongly rooted in the contrasting response of R and NIR
reflectance to increases in LAI (Chen et al 2002)
Though remote sensing has been applied quite successfully in the open field it
has not yet been tested in protected cultivations Open-field methods cannot directly be
transported in greenhouses due to complicating conditions such as existence of
greenhouse structure and ground covering with white plastic So research has yet to be
done to test under which conditions remote sensing can be applied for plant monitoring
inside a greenhouse The aim of this paper is to explore an accurate way for an on-line
estimation of LAI and PAR interception based on reflectance measurements in two
greenhouse grown crops (tomato and sweet pepper)
Materials and methods
Experiments
Seven experiments were conducted with tomato (Lycopersicon esculentum L
Exp 1-7) and two with sweet pepper (Capsicum annuum L Exp 8-9) grown in
greenhouses Experiments were conducted in experimental greenhouses (Exp 1- 4 for
tomato and Exp 8 for sweet pepper) for developing relationships estimating LAI and
PAR interception from canopy reflectance These relationships were afterwards tested
in commercial greenhouses (Exp 5-7 for tomato and Exp 9 for sweet pepper) In Exp
1 plants were evenly distributed in the greenhouse (plants were placed in equal
distances) In the other experiments plants were grown in rows For an overview of
the experiments see Table 311
Chapter 31 Crop reflectance for monitoring LAI and PAR interception
66
Table 311 Overview of set-up of all experiments the type of the measurements
taken and the plant age for the duration of the experiments Experimental
greenhouse refer to university facilities while commercial greenhouse refer to
units managed by growers LAI PAR interception of the crop and crop
reflectance were measured (+) unless otherwise indicated (-)
Measurements were taken every seven to fifteen days depending on the weather
conditions from a week after planting till the end of the cultivation cycle (table 1)
Diffuse radiation conditions were chosen in order to avoid measuring errors occurring
with direct sun conditions such as shadow stripes caused by the construction parts of
the greenhouse as well as low sun azimuth and insufficient cosine correction of the
diffuser
Reflectance measurements
For the reflectance measurements Cropscan MSR87 (CropScan Rochester
USA) sensor was used The downward facing sensor was equipped with eight
Exp No
Crop Plant age (in days from planting)
PAR interception
Reflectance LAI
1 tomato Experimental experiment
0-117 + + -
2 tomato Experimental greenhouse
0-117 + + -
3 tomato Experimental greenhouse
0-126 + + -
4 tomato Experimental greenhouse
0- 80 + + -
5 tomato Commercial greenhouse
2-171
+ + +
6 tomato Commercial greenhouse
180-240 + + -
7 tomato Commercial greenhouse
180-240 + + -
8 sweet pepper
Experimental greenhouse
58-73 + + +
9 sweet pepper
Commercial greenhouse
0-274 + + +
Chapter 31 Crop reflectance for monitoring LAI and PAR interception
67
spectral bands each covering approximately 20nm centered at 460 510 560 610
660 710 760 and 810 nm The data were recorded with a datalogger The sensor was
positioned parallel to the ground at 4m height The viewing angle of 28 degrees
resulted in a viewing area of 3 m2 At each measuring date reflectance was measured
in 8 independent plots of the crop canopy with 2 measurements per plot Data were
averaged per plot The effect of the background reflectance (white plastic) was
investigated with a small trial with new and old sheets of plastic as background The
difference on reflectance of the two treatments was a maximum of 10 when no crop
was present and diminished as the LAI was increasing (data not shown)
PAR interception measurements
PAR interception was measured above and below the canopy in the same spots as
reflectance For each position eight successive readings were taken For PAR
interception measurements a SunScan Canopy Analysis System SS1-UM-105 (Delta-
T Cambridge UK) was used Sunscan sensor consists of a light sensitive stick that is
1 meter long containing 64 photodiodes equally spaced along its length measuring
incident PAR light It was coupled with a Beam Fraction sensor (BFS) that measures
total light as well as PAR light levels The BFS sensor was mounted at the trellis on
the top of the greenhouse measuring the incident light on the canopy at the same time
with the measurements with the stick in the canopy
PAR interception was calculated as follows
PAR interception= 1-(PAR below the canopy PAR above the canopy) Eqn 311
In many crop models Lambert- Beers law (Monsi and Saeki 1953 Marcelis et al
1998) is used for the simulation of PAR interception by the crop It assumes uniform
and infinite canopy of randomly distributed absorbing leaves The amount of
photosynthetically active radiation intercepted (I) by a crop is calculated as
I= (1-ρ)I0(1-e-kL)100 Eqn 312
Where ρ stands for canopy reflection coefficient I0 is the radiation level at zero
canopy depth L the leaf area index of the canopy and k is the light extinction
coefficient of the crop Lambert- Beerrsquos law was applied on the data and the
extinction coefficient was calculated
Chapter 31 Crop reflectance for monitoring LAI and PAR interception
68
k= Ln(IIo) LAI Eqn 313
Leaf Area Index measurements
Leaf Area Index was measured destructively The leaves were sampled on the
same dates as the reflectance and PAR interception measurements and their leaf area
was measured with LI- COR 3100 meter (LICOR Inc Lincoln NE USA) A
minimum of 6 plants was used in each harvest when destructive measurements were
possible Yellowed and brown leaves were not measured
Full spectrum measurements on leaf level
Reflectance and transmittance of the full spectrum between 380nm-1100nm of
individual leaves of tomato and sweet pepper plants were measured with the use of
InstaSpec IV CCD spectrometer (Oriel Stradford CT USA) and LiCor 1800-12
(LICOR Inc Lincoln NE USA) integrating Sphere equipment The measurements
were performed on young and old leaves in a non- destructive way Eight leaves per
category were measured for each plant The measurements were repeated after two
weeks on the same leaves in order to investigate the spectral differences in time as
well as in canopy depth Data were then used to calculate the crop extinction
coefficient
k= kblradic (1-σ) Eqn 314
Where kbl (084) is the extinction coefficient for a crop with spherical leaf elevation
angle distribution when the crop is composed of black leaves and σ is the scattering
coefficient The wavelength dependent scattering coefficient σ equals the sum of
reflection and transmission and was derived from the spectrometer measurements per
wavelength at the leaf level Consequently Eqn 314 scales up this leaf property to
crop level The above methods were derived from and elaborated upon in detail by
Goudriaan and Van Laar (1994) The k values calculated from Eqn 314 where then
compared with the k-values derived from Eqn 313
Vegetation Indices (VIs)
Normal Difference Vegetation Index (NDVI) was calculated from the available
reflectance data NDVI was calculated as (Wang et al 2005)
Chapter 31 Crop reflectance for monitoring LAI and PAR interception
69
NDVI= (R660-R810)(R660+R810) Eqn 315
where R660 and R810 is the reflectance at 660nm and 810nm respectively NDVI
was tested against single wavelength reflectance measurements
Statistical Analysis
For the statistical analysis of the results the GenStat 9th edition software package
was used Regression analysis was applied to the data and linear polynomial and
exponential models were tested in terms of the best fit on the basis of the adjusted R2
and the standardized residuals (plt005)
Results
The natural log of IIo showed a linear relationship with LAI in both tomato and
sweet pepper following the Lambert- Beer law (Eqn 313 Fig 311) The extinction
coefficient derived from these data was 081 for sweet pepper and 068 tomato
Calculation of k from optical properties of individual leaves resulted to a k factor of
08 for sweet pepper and of 07 for tomato respectively (Eqn 314) The higher
extinction coefficient of the sweet pepper crop compared to tomato implies structural
differences between the two species that affect the way incident light is intercepted
Fig 311 Relation between leaf area index and fraction of light intercepted (IIo)
for tomato () and sweet pepper () (1A) The slope of the line represents the
extinction coefficient k Data are from experiment 1-7 for tomato and 8-9 for
sweet pepper
Chapter 31 Crop reflectance for monitoring LAI and PAR interception
70
Single tomato leaves have higher reflectance (61) than sweet pepper (18) for
PAR (400 nm to 700 nm) (Fig 312A and 312B) The difference is especially high
between 510 nm and 660 nm (average reflectance 74 and 25 for tomato and
sweet pepper respectively) that correspond to the green part of the spectrum and
beginning of the red part (Fig 312A and 312B) Leaf spectrum for tomato and sweet
pepper remains almost constant in the area of five out of eight bands measured (460
610 660 760 and 810 nm) by cropscan for measuring crop reflectance This spectrum
consistency enables the use of wider spectrum bands for the calculation of Vegetation
indices in general and NDVI in particular
0
25
50
75
100
400 500 600 700 800
Wavelength (nm)
Ref
lect
ance
()
0
25
50
75
100
Tran
smitt
ance
()
0
25
50
75
100
400 500 600 700 800
Wavelength (nm)
Ref
lect
ance
()
0
25
50
75
100
Tran
smitt
ance
()
Fig 312 Transmittance (black line) and reflectance (gray line) of individual leaves
of tomato (A) and sweet pepper (B) Data are from experiment 1 and 8
respectively
The relationship of LAI and PAR interception with canopy reflectance was
investigated for six wavebands as well as calculated NDVI (Eqn 315 table 312) on
tomato (Exp 1) and sweet pepper (Exp 8) The exponential regression model had the
best fit for all wavelengths For tomato crop PAR interception correlates well with
reflectance at three different wavelengths (460nm 510nm and 560nm) with a slightly
better fit at 460nm The same was observed for LAI Reflectance at 460nm gave the
best estimation for both LAI and PAR interception also for sweet pepper The use of
NDVI did not improve the estimation of PAR interception and LAI for any of the two
crops
Chapter 31 Crop reflectance for monitoring LAI and PAR interception
71
Table 312 Correlation of PAR interception by the crop and LAI (y-values) with crop
reflectance at different wavelengths and Normal Difference Vegetation Index (NDVI)
(x-values) in tomato and sweet pepper Fitted function was y= a+be-kx The R2 and
Root Mean Square Error (RMSE) are presented No of observations was 35 for
tomato (Exp 1) and 26 for sweet pepper (Exp 8)
Tomato Sweet pepper
Wavelengths PAR
Interception
()
LAI PAR
Interception
()
LAI
R2 RMSE R2 RMSE R2 RMSE R2 RMSE
460 978 455 954 029 966 747 884 036
510 976 474 947 032 95 548 857 039
560 977 470 943 045 946 568 833 042
610 854 118 868 068 809 107 618 064
660 954 663 924 060 886 846 745 054
710 932 801 901 079 649 145 453 077
NDVI 873 11 856 052 894 815 79 049
During plant growth LAI increases resulting in an increase of PAR interception
of the crop A decrease in the amount of reflected light exponentially decreased with
the increase of LAI and PAR interception for both crops (Fig 313) Tomato crop
reflects more when LAI is small (lt05) than sweet pepper
Chapter 31 Crop reflectance for monitoring LAI and PAR interception
72
Fig 313 Correlation of reflectance at 460 nm with PAR interception (A B) and LAI
(C D) for tomato (A C) and sweet pepper plants (B D) in experimental trials
Data points are from experiment 1-4 for tomato and experiment 8 for sweet
pepper
The relationships established from the first trials were then tested for data
gathered from commercial greenhouses The diversity of the cultivation practices of
the greenhouses on which those data were taken was a good test for the robustness of
the relationship of reflectance at 460nm with LAI and PAR interception (Fig 314)
For tomato the fit of the established relationships was good for PAR interception (R2=
952 se=635) and LAI (R2= 894 se=051) For sweet pepper the fitting gave
reasonable results for both PAR interception (R2= 894 se=051) and LAI (R2= 798
se=076)
A
C D
B
Chapter 31 Crop reflectance for monitoring LAI and PAR interception
73
Fig 314 Validation of the relationship between reflectance at 460 nm with PAR
interception and LAI for tomato (Fig 4A and 4C respectively) and sweet pepper
(Fig 4B and 4D respectively) plants in commercial greenhouses The lines are from
Fig 3 Based on experimental greenhouses experiments Data points are from
experiment 5-7 for tomato and experiment 9 for sweet pepper
Discussion
This study explores an accurate way for the online estimation of LAI and PAR
interception of the crop through remote reflectance measurements as well as the
robustness of such a method for tomato and sweet pepper grown in a greenhouse For
that reason six different wavelengths covering an area of the spectrum from blue to
red and NDVI were tested Previous studies performed with field crops showed a
correlation of PAR interception and LAI with reflectance in the RNIR region of the
spectrum (Bouman 1994 Clevers 1997) In our study nevertheless the best
correlation was achieved at 460nm for both tomato and sweet pepper A B
A
B
C
D
Chapter 31 Crop reflectance for monitoring LAI and PAR interception
74
The difference between field application results and the ones reported here can
mainly be explained from the added reflectance inside the greenhouse from the
various metallic parts and especially the white plastic that covers the floor These
special characteristics of the greenhouse production system ask for a new approach on
remote monitoring than the ones already used in the open-field and is proposed in this
study Relationships established in this study were further validated with data from
commercial greenhouses The relationship between reflectance PAR interception and
LAI was best described by an inverse exponential curve similar to the types of curves
used in field experiments of potato (Bouman 1994) and miscanthus (Varga et al
2002) for LAI monitoring In this study the relationships between LAI PAR
interception and crop reflectance were established under diffuse light conditions
Corrections for the bidirectional reflectance can be used for sensor corrections for
saturation problems of the sensor under direct light conditions This method can be
successfully applied to the field for remote sensing techniques In the particular case
of the greenhouse measurements under direct light conditions might be highly
variable by shadows caused by the construction parts of the greenhouse and
reflectance from the glass
Light in plants is highly absorbed in the red and a little less in the blue part of the
spectrum It is expected that reflectance in these particular regions will increase with
the growth as usually more LAI indicates more light interception and less light
reflectance The 460 nm wavelength is located on the blue part of the spectrum partly
explaining the good correlation between the data Reflectance at 460 nm was high
(~65) in an empty greenhouse because of the reflectance of the construction parts
and the white plastic on the floor (data not shown) The difference between crop and
background reflectance makes it easier to monitor changes in the leaf area of the
plant inside the greenhouse Also the lack of differences between plastic sheets in
different stages of wear provide an additional robustness to the estimation method
presented on this paper Finally around 460 nm reflectance hardly changes with the
wavelength diminishing any errors arising from the sensor
After both crops reach a LAI of about 3 and PAR interception of about 90
variation is high and an accurate estimation of LAI and therefore PAR interception
from reflectance is no longer possible This variation is mainly due to the fact that in
the visible region of the spectrum only the reflectance of the upper leaf layers
determines the contribution of the canopy to the total measured reflectance So if LAI
Chapter 31 Crop reflectance for monitoring LAI and PAR interception
75
is higher than 3 not much more light is intercepted and therefore reflectance changes
are no longer perceived When LAI is higher than three 90 of PAR is already
intercepted by the canopy and further LAI increase has only a small impact on PAR
interception In this context an accurate knowledge of LAI in the early developmental
stages is more important than in later stages
Increasing LAI lead to increasing PAR interception and following Lambert- Beer
law The k value calculated for the extinction coefficient for tomato was similar to the
values reported in the literature (Atheron and Rudich 1986) Sweet pepper seems to
have a little higher light interception for the same LAI as tomato which is in
accordance with the fact that it also shows lower reflectance both in leaf and canopy
level than tomato plants For sweet pepper a k factor varying from 06 to 145 have
been reported in the literature (Nederhoff and Vegter 1994) The k factor of 081 that
was calculated from our data is within this range Extinction coefficient is an
important input parameter in most crop models Most models assume that extinction
coefficient is constant and the value used as an input is either calculated by
experimental data or from literature Because the extinction coefficient depends on
canopy structure (for example leaf elevation angle) its value can change with the
growth of the plant With our method of estimating LAI and PAR interception it is
possible to calculate extinction coefficient from the start of the cultivation until the
crop is fully grown
The normalized difference vegetation index (NDVI) is widely used in field
applications for the estimation of LAI NDVI is based on plant physiological
processes and particularly in the difference between leaf absorption of red light and
non- absorbance of the NIR light Despite the wide use of this index in the open fields
(Wang et al 2002 Hoffmann and Blomberg 2004 Elwadie et al 2005) single
waveband at 460nm performed better in our case in estimating PAR interception or
LAI in greenhouse conditions The decreased accuracy of NDVI inside the
greenhouse is probably a result of the added reflectance from the construction parts of
the greenhouse as well as the background cover in all part of the spectrum and
especially the red
Conclusions
Reflectance measurements offer a non- destructive way to estimate PAR
interception and LAI (up to the value of 3) in greenhouse production systems The
Chapter 31 Crop reflectance for monitoring LAI and PAR interception
76
relationship established from the current work between reflectance at 460 nm PAR
interception and LAI for both tomato and sweet pepper can become a good tool for
crop online monitoring in greenhouse conditions Furthermore if information from
reflectance sensors are inputted directly into crop models new opportunities for
decision support in greenhouse production could be opened
Chapter 32
Photochemical reflectance index as a mean of monitoring early photosynthetic stress
Published as
Sarlikioti V Driever SM Marcelis LFM 2010 Photochemical reflectance index
as a mean of monitoring early water stress Annals of Applied Biology 157 81-89
Chapter 32 PRI as a mean of monitoring early photosynthetic stress
79
Abstract
Water stress in plants affects a number of physiological processes such as
photosynthetic rate stomatal conductance as well as the operating efficiency of PSII
and non- photochemical quenching Photochemical Reflectance Index (PRI) is
reported to be sensitive to changes of xanthophyll cycle that occur during stress and
could possibly be used to monitor changes in the parameters mentioned before
Therefore the aim of this study was to evaluate the use of PRI as an early water stress
indicator Water stress treatment was imposed in a greenhouse tomato crop CO2
assimilation stomatal conductance light and dark adapted fluorescence as well as PRI
and relative water content of the rooting medium RWCs where repeatedly
measured The same measurements were also performed on well-irrigated plants that
acted as a reference The experiment was repeated in four consecutive weeks Results
showed a strong correlation between RWCs and photosynthetic rate stomatal
conductance non- photochemical quenching and operating efficiency of PSII but not
with PRI when the whole dataset was considered Nevertheless more detailed analysis
revealed that PRI gave a good correlation when light levels where above 700μmol m-2
s-1 Therefore the use of PRI as a water stress indicator cannot be independent of the
ambient light conditions
Chapter 32 PRI as a mean of monitoring early photosynthetic stress
80
Introduction
Plant water status is an important aspect of crop management in greenhouse
cultivation Water stress affects plants water regulation leading to changes in
physiological processes Thornley and Johnson (1990) noted that water stress often
reduces plant growth by reducing leaf area development and increasing carbohydrate
partitioning to the roots According to Foolad et al (2003) when water stress was
imposed during the reproductive stages of tomato plants its effects on these processes
were found to be dependent on the degree of stress Moderate water stress imposed
just before flowering tended to accelerate flowering and fruit setting but high and
severe water stress retarded flowering and fruit setting and reduced the number of
flowers and fruits set per truss Nowadays production of tomato fruits in greenhouses
is a highly intensive agricultural industry where the cost profit limit is marginal and
efficient use of resources is vital The use of fresh water one of the most important
resources for this industry has been predicted to become more scarce in the future
(Hsiao et al 2007) Improving the efficiency of water use for irrigation is therefore
one of the key challenges for tomato growers Although much progress has been made
on optimizing water supply based on greenhouse climate data (Marcelis et al 2006)
only few methods use direct plant-based physiological indicators to detect the
occurrence of water stress An advantage of a reliable plant-based indicator over
model predictions based on greenhouse climate is that when stress can be detected in
an early stage water supply could be optimized
Water stress may occur when the water supply to the plant is not meeting its
transpiration demands Stomata opening is directly affected by water stress (Cornic
2000 Lawlor and Tezara 2009) When stomata are not sufficiently opened
photosynthetic rate starts to decrease as well as the quantum yield of photosystem II
(Chaves et al 2002) As a result of a decreased rate of CO2 assimilation light energy
absorbed by the leaf cannot be used to drive photosynthetic electron transport and a
part of this energy is dissipated as heat increasing the non-photochemical quenching
(Krause and Weis 1991 Baker and Rosenqvist 2004) Researchers have reported
changes in chlorophyll fluorescence corresponding to water stress (Baker and Ort
1992 Lichtenthaler and Babani 2000) Changes in plant physiological processes due
to water stress have also been linked to changes in plant reflectance in specific
wavelengths (Pinter et al 2003)
Chapter 32 PRI as a mean of monitoring early photosynthetic stress
81
Several studies have attempted to quantify water stress through remote sensing
(Bowman 1989 Pentildeuelas et al 1994) Spectral indices have been used to determine
real-time crop coefficients to improve irrigation scheduling (Bausch 1995) The
relationship between reflectance spectra and leaf water status have been studied in
numerous crop species as well as the possibility of estimating relative leaf water
content by reflectance in the range of the near infrared (Danson et al 1992 Danson
and Aldakheel 2000) Pentildeuelas et al (1993) have found that reflectance at 970 nm can
be a useful water status indicator but only when the stress is already well developed
Reflectance at 1400 and 1900 nm has been shown to correspond directly to water
content in plant tissue (Pentildeuelas et al 1997) as well as physical-based studies in short
wave infrared (1400ndash 2500 nm) (Ceccato et al 2001) Graeff and Claupein (2007)
showed that reflectance in the 510780 540780 4901300 and 5401300 nm wavelength
ranges can also become an indicator of plant water status (the values are for the
combination of two different reflectance filters used in the analysis) However
infrared reflected radiation is greatly affected by plant architecture crop density and
leaf structure thus increasing the uncertainty of estimation (Elachi 1987)
In this paper we define plant water stress as the loss of plant photosynthetic
activity induced by water deprivation The so-called photochemical reflectance index
(PRI = (R531 minus R570) (R531 + R570)) where R531 and R570 are reflectance signals
at 531 and 570 nm respectively has been used to monitor dynamic changes in
photosynthesis in water stressed plants (Evain et al 2004) PRI provides a quick and
non-destructive assessment on photosynthesis related physiological properties of the
leaf and canopy (Pentildeuelas et al 1994 Evain et al 2004 Weng et al 2006) for a wide
range of species (Gamon et al 1997 Guo and Trotter 2004) Changes in absorbance
and reflectance values around 531ndash535 nm as a result of nutrient stress have been
related to ΔpH-mediated chloroplast shrinkage and to changes in the aggregation state
of antenna pigmentndashprotein complexes mediated by an accumulation of de-epoxidized
forms of the xanthophyll cycle molecules (Morales et al 1990 Ruban et al
1993)Since we defined water stress as the loss of plant photosynthetic activity
induced by water deprivation it comes to reason that PRI could be used for water
stress monitoring The epoxidation and de-epoxidation of the xanthophyll cycle is also
strongly related to the light environment (Adams et al 1992 Lawlor and Tezara
2009) Although its applicability in detecting plant water stress has been tested in
crops grown under conditions of severe stress it is yet to be tested for early stages of
Chapter 32 PRI as a mean of monitoring early photosynthetic stress
82
water deprivation Therefore the aim of this paper is to evaluate PRI as an indicator of
early water stress
Materials and methods
Plant materials and water stress imposition
Tomato plants (Solanum lycopersicon cv Aranca) were grown on rockwool slabs
(at field capacity contains 80 solution 15 air pore space and 5 rockwool fibers)
in a glasshouse in Bleiswijk the Netherlands (52o 1rsquoN) Two week old plants were
planted on the rockwool slabs with three plants per slab on 16 June After plants
reached a height of 18m (17 July) measurements commenced Each plant was
irrigated by one dripper Plants were watered automatically (water flow 45 lh) with a
nutrient solution [major nutrients K 80 Ca 100 Mg 45 NO3 230 SO4 68 H2PO4
125 (mM) minor elements Fe 25 Mn 7 Zn 7 B 50 Cu 07 Mo 05 (microM)] with a
pH 55 and an EC of 4 mscm At the start of each experiment stress treatment was
applied by withholding water through removal of drippers from a rockwool slab with
three plants (hereafter referred to as stressed plants) Leaf measurements on these
three stressed plants and three normally irrigated plants (hereafter referred to as
reference plants) were performed on the first young fully developed leaf in full
exposure to the sun for three consecutive days after the dripper removal The
experiment was repeated in four consecutive weeks In each repetition drought stress
treatment was applied on a different slab with three new stressed plants and a different
slab was used as reference plants Measurements were performed every day in all
plants of each treatment Each day measurements were taken every half hour or every
hour from 900 till 1500
Growth conditions
Incident light at leaf level was measured every 5 minutes by LI-190 quantum
sensors (Licor Inc Lincoln NE USA) positioned at the same height as the
measured leaf The relative water content (RWCs) in the rooting medium (rockwool
slab) was monitored by WET sensors (Delta-T UK) positioned vertically in the slab
Five WET sensors per slab were used both in reference and stress treatment
Inside greenhouse temperature as well as the vapour pressure deficit (VPD) where
also monitored every 5 min during the experiment (table 321)
Chapter 32 PRI as a mean of monitoring early photosynthetic stress
83
Table 321 Climate conditions in the greenhouse Average values plusmnse of incident
PAR the inside greenhouse temperature (Tairin) and VPD are presented for each
repetition The repetitions were performed in 4 consecutive weeks Each repetition
lasted 3 days
Repetition Day PAR
(μmol m-2 s-1)
Tairin
(Co)
VPD
(kPa)
Rep 1
1 2221 plusmn4179 224 plusmn05 034 plusmn017
2 3486 plusmn455 224 plusmn05 054 plusmn02
3 12882 plusmn1669 212 plusmn012 027 plusmn003
Rep 2
1 7641 plusmn1933 215 plusmn003 114 plusmn008
2 5663 plusmn2866 215 plusmn004 007 plusmn004
3 6525 plusmn2801 235 plusmn003 009 plusmn017
Rep 3
1 5566 plusmn2696 259 plusmn006 01 plusmn005
2 6096 plusmn3341 259 plusmn008 008 plusmn002
3 1996 plusmn3782 256 plusmn009 023 plusmn011
Rep 4
1 4246 plusmn5757 199 plusmn004 011 plusmn020
2 4088 plusmn8597 199 plusmn004 024 plusmn030
3 2211 plusmn2973 205 plusmn054 026 plusmn029
PRI
The photochemical reflectance index of a leaf was measured by a PlantPen PRI
200 instrument (Photon Systems Instruments Ltd Czech Republic) The PlantPen was
clipped to a lateral leaflet Light from an internal dual wavelength light source at 531
and 570 nm was emitted to the leaf and reflectance was measured through a PIN
photodiode with a 500 to 600 nm bandpass filter Data of reflectance at 531 and 570
nm as well as the calculated PRI value was collected Measurements were taken every
half hour from three plants from the stress treatment and three reference plants The
instrument measures an area of 05 cm2 The average of eight measurements from
randomly chosen positions on each selected leaf were taken for a representative
measurement of PRI
Chapter 32 PRI as a mean of monitoring early photosynthetic stress
84
CO2 assimilation rate
The CO2 assimilation rate was measured every half hour with the use of a portable
open gas exchange measurement equipment (LCpro+ ADC UK) The lateral leaflet
of the chosen leaf was clamped in the chamber (625 cm2 leaf area) The measurement
conditions were 800 ppm CO2 and 700 μmol m-2 s-1 PAR with a vapour pressure
deficit (VPD) of 635 kPa Vapour pressure deficit and CO2 concentrations were
similar to those in the greenhouse environment The light intensity given was the
average value of ambient irradiance on a sunny day Constant light was used in the
measurement to ensure that light intensity was sufficiently high and allowed
comparison between treatments Measurements were taken every minute for 12
minutes and CO2 assimilation rate was then calculated as the average of the last three
measured rates (ie the measurements at 10 11 and 12 minutes) The period of the 12
minutes was previously determined as the time needed for stabilization of stomatal
conductance and CO2 assimilation rate
Stomatal conductance
Stomatal conductance of a leaf was measured with an AP4 porometer (Delta-T
UK) The set relative humidity was the same as the greenhouse condition The
porometer was calibrated every 3 hours or when changes in environmental conditions
in the greenhouse prevented accurate measurements (temperature difference plusmn2oC
from calibration temperature) Stomatal conductance was measured every half an
hour Three measurements per leaf from three plants per treatment were taken to
obtain a representative measurement
Chlorophyll Fluorescence
Chlorophyll fluorescence parameters were measured every hour with a Dual-PAM-
100 (Heinz Walz GmpH Germany) A leaflet was clamped into the optical unit and
was continuously illuminated with white actinic light at an irradiance of 700 μmol m-2
s-1 (same level as for CO2 assimilation measurements) The steady-state fluorescence
(Fprime) was recorded after 6 minutes before a saturation pulse was imposed to the leaf in
order to determine the maximal fluorescence level in the light adapted state (Fprimem) The
leaf was then darkened for 25 min thereafter minimal fluorescence (Fo) was
measured During dark adaptation the modulated measuring light was sufficiently
low (lt01 μmol m-2 s-1) not to induce any significantly variable fluorescence
Chapter 32 PRI as a mean of monitoring early photosynthetic stress
85
Maximal fluorescence (Fm) was measured after saturating light was applied for 08s at
3000 μmol m-2 s-1 to the already dark adapted leaf These measurements were used to
calculate the operating efficiency of PSII (FqprimeFprimem = (Fprimem- Fprime)Fprimem) the maximum
quantum efficiency of PSII (FvFm) as a relative measure of the maximum quantum
yield of PSII primary photochemistry (Bjoumlrkman and Demmig 1987) and the non-
photochemical quenching (NPQ calculated as (FmFprimem) minus 1) (Bilger and Bjoumlrkman
1990 Baker 2008)
Statistical analysis
The data were analysed with Genstat 11 software Regression analysis using linear
and polynomial models were used to assess the relationship between RWCs and the
other response variables The significance of model terms was tested using the F-test
at the p = 005 level of significance The goodness of fit of models was considered
using the adjusted (for the number of model terms) R2
Results
Environmental conditions in general and incident light intensity in particular varied
greatly between repetitions (weeks) days of a week and during the course of a day
during the experiment The inside temperature varied as a day average from 20oC to
26oC while VPD fluctuated from 007 to 114 kPa (table 321)
Water stress was induced gradually in tomato plants by withholding water (Fig
321A) Although the way of withholding water was identical for all repetitions the
rate at which the relative water content of the rockwool slab (RWCs) decreased
differed The final RWCs that was reached at the end of each repetition varied from
23 to 75 This variation was due to variable transpiration as a result of the
variation in climatic conditions Light levels varied on average from 1288 μmol m-2 s-
1 to 7641 μmol m-2 s-1(Table 1) Withholding water reduced CO2 assimilation by up to
52 while stomatal conductance was reduced by up to 70 CO2 assimilation (Fig
321A) as well as stomatal conductance (Fig 321B) showed a high and positive
correlation with RWCs
The operating efficiency of the PSII (FprimeqFprimem) was decreased up to 20 (the
percentage is expressing the maximum difference between the lowest (045) and the
maximum value (0525 - 057)) in response to lowered RWCs for all repetitions
Chapter 32 PRI as a mean of monitoring early photosynthetic stress
86
(Fig 321C) while NPQ increased considerably with the decrease of RWCs (Fig
321D) with an increase in the range of 100-216 for the different repetitions
Fig 321 Correlation of CO2 assimilation (se of intercept= 847 of B1= 026 and
B2= 0001 R2= 079 s2= 549 with 10 df) Stomatal conductance (se of
intercept= 24088 of B1= 71 and B2= 0049 R2= 086 s2= 26919 with 9 df)
Quantum yield of PSII efficiency (Fm- F) Fm) (se of intercept= 124 and of
B= 000104 R2= 071 s2= 361 with 8 df) and NPQ (se of intercept= 00826
of B1= and B2= R2= 068 s2= 553 with 11 df) with relative water content of
the rooting medium Data points represent daily averages (n=12 for CO2
assimilation and stomatal conductance n=6 for (Fm- F) Fm and NPQ) Closed
symbols (diams) represent values of plants with imposed water stress and open
symbols represent (loz) control plants Vertical bars indicate standard error of
mean
Chapter 32 PRI as a mean of monitoring early photosynthetic stress
87
Although all chlorophyll fluorescence parameters mentioned above showed a
direct response to reduction of water availability this response was not clearly
observed for PRI (Fig 322) PRI gradually decreased with RWCs
Fig 322 Correlation between PRI and slab relative water content (se of intercept=
00037 and of B1= 5 10-5 R2= 061 s2179 with 10 df) t PRI values correspond
to daily averages (n=12) Closed symbols (diams) represent values of plants with
imposed water stress and open symbols represent (loz) control plants Vertical bars
indicate standard error of mean
Previous studies show that PRI is sensitive to changes in light intensity To
investigate the relationship between RWCs and PRI in relation to light intensity the
data were divided into four different categories on the basis of the occurring light
levels during the repetitions These levels were i 0-299 μmol m-2 s-1 ii 300-499
μmol m-2 s-1 iii 500-699 μmol m-2 s-1 and iv 700-850 μmol m-2 s-1 PRI showed no
statistical relationship with RWCs for light intensities from 0-699 μmol m-2 s-1 (Fig
323A-323C) Nevertheless when radiation was above 700 μmol m-2 s-1 PRI showed
a good correlation with RWCs (R2= 083 plt 001) (Fig 323D) In this category
PRI decreased as much as 35
Chapter 32 PRI as a mean of monitoring early photosynthetic stress
88
Fig 323 Correlation of PRI and slab relative water content for light intensities
varying from 0-299 μmol m-2 s-1 300- 499μmol m-2 s-1 500-699 μmol m-2 s-1 and
700-850 μmol m-2 s-1 (se of intercept= 0015 of B1= 5210-4 and B2= 4110-6
R2= 080 s2= 29810-5 with 12 df) Data points represent half-hour
measurements
For light levels above 700 μmol m2 s-1 PRI showed a statistically significant
correlation with CO2 assimilation (R2= 066 plt001) stomatal conductance (R2=
063 plt 001) the operating efficiency of PSII (R2= 07 plt 001) and NPQ (R2=
069 plt 001) (Fig 324) This correlation was not observed in lower light levels
Chapter 32 PRI as a mean of monitoring early photosynthetic stress
89
Fig 324 Correlation of CO2 assimilation (se of intercept=615 and of B=549 R2=
068 s2= 842 with 14 df) Stomatal conductance (se of intercept=13533 and of
B=12079 R2= 066s2= 40795 with 14 df) Quantum yield of PSII efficiency
(Fm- F) Fm) (se of intercept= 081 of B1= 1445 and B2= 6333 R2= 071 s2=
000155 with 6 df) and NPQ (se of intercept= 445 of B1= 7923 and B2= 347
R2= 068 s2= 0046 with 6 df) with PRI for light intensities of 700-850 μmol m-
2 s-1 Data points represent half-hour measurements for CO2 assimilation and
stomatal conductance and hour measurements for (Fm- F) Fm and NPQ)
Discussion
The objective of this study was to evaluate PRI as a method for early detection of
water stress in a greenhouse tomato crop
The RWCs is a factor regularly used in literature for indication of water stress
imposed on plants In the current study it was shown that when RWCs decreased
plant physiological processes are affected More analytically a reduced RWCs
results in stomatal closure diminishing of the photosynthetic rate and quantum yield
as well as the increase of NPQ These results are in accordance with the observations
of Flexas and Medrano (2002) According to Cornic (2000) the stomatal closure is the
Chapter 32 PRI as a mean of monitoring early photosynthetic stress
90
primary cause of the reduction of photosynthesis under mild water stress and is also
dependent on the environmental conditions during drought (Schulze and Hall 1982)
and the velocity of the drought imposition (Flexas et al 1999) A significant
correlation between CO2 assimilation and stomatal conductance was found in the
currently presented experiment The development of water stress differed between
repetitions and was directly linked to changes in light
Chlorophyll fluorescence parameters have been reported to be sensitive to the plant
water status and plant stress in general (Lichtenthaler and Babani 2000 Baker and
Rosenqvist 2004) Increase of water stress generally decreases the FprimeqFprimem In order to
protect the photosystems from oxidation excess energy is dissipated as heat resulting
in a substantial increase of NPQ (Baker 2008) In the currently presented study NPQ
increased with decreasing RWCs which indicated its sensitivity to plant water stress
The decrease of quantum yield found here was similar to decreases observed by Evain
et al (2004) In stressed conditions excess energy on photosystems is dissipated as
heat from secondary pigments as the xanthophylls in order to protect the
photosystems from damage When fluorescence parameters are changed changes
should also be observed in PRI Sun et al (2007) and Penuẽla et al (1994) reported a
decrease in PRI with time of water withholding Also Suarez et al (2009) reported an
indirect relationship between PRI and water stress through a correlation of PRI with
canopy temperature Contrary to the aforementioned papers a direct effect of water
stress on PRI was not observed in the current study unless light levels were above
700 μmol m-2 s-1
When plants are exposed to abiotic and biotic stresses in the light decreases in
FvFm are frequently observed Zarco-Tejada et al(2000) observed a diurnal pattern in
FvFm Its value decreased during the middle of the day In most studies (Gamon et al
1997 Flexas and Medrano 2002) dark adapted fluorescence parameters are
measured under pre-dawn conditions and assumed to be steady for the rest of the day
Measurements done in the currently presented study showed variability in the dark
adapted maximal PSII efficiency (FvFm) during the day In early morning FvFm was
equal to 082 and decreased up to 10 by 1300 A similar reduction on FvFm values
during the day was also reported by Sobrado (2008) This indicates that the common
practice of measuring FvFm only in predawn conditions in stress experiments is not
representative for the variability of FvFm during the day and hence not suitable for
Chapter 32 PRI as a mean of monitoring early photosynthetic stress
91
calculation of parameters using either dark adapted Fm or Fo which could lead to
errors of estimation
When a plant is under stressed conditions non-photochemical quenching is
increased In the currently described experiment NPQ increased as the stress
progressed indicating a loss of energy from the photosytems as heat (Baker 2008) It
is well established that xanthophyll cycle contributes essentially to the dissipation of
the excess excitation energy in the PSII antenna under stressed plant conditions (Jahns
et al 2009) The increase in NPQ was more pronounced in days with high light levels
(gt700μmol m-2 s-1) indicating that the RWCs plays a synergetic role to light
(photoinhibition) affecting photosynthesis and stomatal conductance Water stress is
often indiscernible from photoinhibition in plants Lu and Zhang (1998) reported that
the extent of photoinhibition became more pronounced when the stress progressed
Similar synergistic effects of water and light stress on the photochemistry of the plants
are reported in the literature (Masojidek et al 1991 Giardi et al 1996 Genty et al
1987 Jefferies 1994) Many authors indeed argue that the degree of the damage to the
photosynthetic properties of the plant by water stress can be amplified by high
irradiancies (Powles 1984 Bjoumlrkman and Powles 1983)
Gamon et al (1990) as well as Ruban et al (1993) showed that PRI corresponds to
fast changes of incident light PRI is connected with the de-epoxidation state of the
xanthophylls in the photosynthetic cycle The xanthophyll cycle role is mainly to
protect the photosystem from damage under stress conditions Therefore the
xanthophyll pool and the epoxidation state of the xanthophyll are also sensitive to the
incident light on the leaf level (Maxwell et al 1994 Schindler and Lichtenthaler
1994) The de- epoxidation cycle starts only when light absorbed by chlorophyll
reaches excessive levels In the Mediterranean region where the light is in abundance
especially in summer period PRI was used to track successfully the crop water status
Gamon et al (1997) reported that PRI correlated well with light use efficiency only
under high light conditions (PPFDlt500μmol m-2 s-1) On the other hand Sims et al
(2006) did not observe a direct correlation between PRI and LUE during the day In
our experiment we showed that PRI is strongly correlating with RWCs only when
PPFD became higher than 700μmol m-2 s-1 indicating that light is of prime
importance when it comes to PRI As Barton and North (2001) showed with a model
PRI is not only dependent on light levels but on plant structure (Suarez et al 2008)
plant optical properties and sun position as well This assumption was confirmed also
Chapter 32 PRI as a mean of monitoring early photosynthetic stress
92
by Peguero-Pina (2008) who indicated that early day measurements of PRI when the
sun is still low do not correlate well with fluorescence as expected Since sun position
plays a role on PRI changes it comes to reason that greenhouse structure prohibits the
correct PRI functioning at certain hours of day Diversion between our data and the
published work at PRI can also be attributed to changes in latitude and consequently
to solar angle
Conclusions
In this paper it was shown that PRI can be used as an early water stress indicator
only when light intensity at crop level is above 700 μmol m-2 s-1 At lower values of
light intensity the relationship of PRI to RWCs was poor in comparison to
photosynthesis or fluorescence parameters that showed a high correlation to RWCs
For that reason we can conclude that PRI as water stress indicator cannot be
independent of the ambient light conditions and its use can make sense only under
conditions of high light
Chapter 4
General discussion
Chapter 4 General Discussion
96
The aim of this thesis was to explore different techniques to simulate and monitor
light interception and photosynthesis by a greenhouse grown tomato canopy For that
purpose a three dimensional model for accurate light interception and photosynthesis
was developed and different methodologies to monitor online these physiological
properties by means of remote sensing were explored In this chapter the advantages
of these approaches in the broader scientific field are discussed as well as their
shortcomings and how these can be surmounted
Modelling light interception and photosynthesis
Modelling light interception and photosynthesis are basic to plant modelling Both
these parameters are highly affected by plant architecture Light absorption is
dependent on both the optical properties of the leaf as well as the leaf position with
respect to the incoming light The importance of leaf position for light absorption is
such that an accurate representation of canopy structure in space is necessary for
correct light absorption simulations This need has been addressed recently by adding
one more dimension in plant modelling (Vos et al 2010)
Adding a dimension in plant modelling involves a number of tedious
measurements of plant architecture that are time consuming Even when the third
dimension is added to the model assumptions are introduced in order to simplify the
structure Leaf positioning towards the incoming light is dependent on the elevation
angle (angle of the single leaf to the horizontal) A common assumption in 3D
modelling however involves the use of an elevation angle distribution on the entire
canopy rather than attribute a specific elevation angle to the leaves that is dependent
on each age and relative rank in the canopy In this thesis (Chapter 22) we showed
clearly that an explicitly described leaf elevation angle distribution can improve
modelling accuracy up to 8 in light absorption in comparison to the ellipsoidal
distribution that is the normal approach of most models (Farque et al 2001)
The importance of a three- dimensional model is not confined to an accurate
simulation output but it can also improve our understanding of the impact of the
chosen experimental approaches on the acquired data In this thesis (Chapter 22) we
used the model to investigate the vertical light distribution inside a double row
canopy The results showed that leaves positioned towards the path absorbed more
light per unit leaf area than leaves positioned towards the middle of the plant row
This difference is important in the context of the common experimental approach to
Chapter 4 General Discussion
97
measure leaf photosynthesis only on leaves facing the path and not in the middle of
the plant row This approach can lead to serious errors of estimation if these data are
used for an estimation of canopy photosynthesis or the calibration of a plant model
The evaluation of experimental techniques through 3D modelling is starting to be
explored in the field since the addition of one more dimension can help improve the
microclimate simulation around different plant organs (Sinoquet et al 2005)
The general characteristics of plant architecture are defined by the plant genotype
Allowing for the environmental plasticity of the structure an ideotype structure can be
identified for each plant grown under certain environmental conditions The idea of a
plant ideotype is hardly new (Donald 1965) but the use of 3D models in exploring
plant phenotypes can prove a very important tool in plant breeding by cutting the time
and costs needed on the traditional approach A plant structure as any architectural
structure is a synthesis of a number of smaller components whose unique topology
and geometry can have a direct effect on light absorption and photosynthesis In the
thesis (Chapter 23) we identified as the main components of tomato architectural
structure the leaf elevation angle phyllotactic angle leaflet angle leaf length to width
ratio leaflet arrangement and internode length Then we proceeded to quantify the
effect of the change of each of these components both on light absorption and
photosynthesis From our analysis we found that the highest impact had the leaf
lengthwidth ratio and internode length depending on the light conditions From the
study we conclude that a more spatial arrangement of architectural components
increased both light absorption and photosynthesis Based on this result we proposed
two types of plant ideotypes for the particular conditions that both aimed at a more
spatial arrangement The model predicted a possible increase of photosynthesis of up
to 10 Highly interesting was the exploration of the effect of the vertical light
absorption profiles on photosynthesis for summer and winter Simulation data
presented in Chapter 23 showed that during summer higher photosynthesis was
expected when more light was absorbed from the lower leaves of the canopy while the
opposite was observed for the winter period This was caused by both overall light
intensity as well as the different light angle fot the different seasons Therefore it
becomes apparent that the vertical light distribution should not be ignored and that
total light interception alone is not enough for simulating photosynthesis
In the two dimensional models plant structure is approached by using the
extinction coefficient (k) as it is defined by Lambert-Beer law Although this factor is
Chapter 4 General Discussion
98
a good approximation it fails to explore the effect of the variations in vertical light
distributions As we showed in this thesis (Chapter 21) the extinction coefficient
changes not only with canopy depth but also with the increase of the row spacing
Therefore a single coefficient cannot be used for one crop or different cultivation
practises
In this thesis we used a static approach in modelling plant structure The choice to
use a static structure was based on the Dutch cultivation system that results in a
uniform plant structure throughout the seasons Nevertheless the model does not take
into account the daily changes of plant structure For example plants tend to rearrange
their structure during the day as well as during the growing season These dynamic
adaptations of plant structure should be taken into account in the model since they are
part of the plant strategy for optimum growth Some possible effects of the dynamic
leaf adaptation during the day are for example under low light conditions an
increasing photosynthetic production or under high light conditions avoiding photo
inhibition Studies have reported leaf movement during the day (Kao and Forseth
1992) These phenomena are quite important for our understanding of plant
interactions with their environment and should therefore be taken into account also in
a modelling approach especially if we use this type of modelling for proposing
possible optimum genotypes for particular environments
Online crop monitoring
Monitoring leaf area index and light interception
Leaf area index as well as light interception is an important component of plant
modelling Experimental methods to measure light interception are usually time
consuming and can only take a snapshot in a certain time period and therefore miss
the dynamics of this component Leaf area index is usually estimated using distractive
measurements which are not always possible to do and they limit the number of
samples being processed In order to avoid these pitfalls an effort has been made to
develop online non- destructive methods Remote sensing that monitors the light that
is reflected from the crop canopy has successfully been applied in the field (Clevers
1997 Gitelson et al 2002) Nevertheless this approach poses special challenges
inside the greenhouse environment as we have to take into account the interference of
scattering light from the construction parts of the greenhouse as well as reflectance
coming from the white plastic covering the soil (Chapter 31) Although it is not
Chapter 4 General Discussion
99
possible to directly apply these methodologies from the field in this thesis we showed
that we can develop new ones that can succesfully measure LAI and light interception
in the greenhouse environment
In field crops it is customary to monitor LAI by using a normalized index based
on the red area of the spectrum ie Normalized Difference Vegetation Index (NDVI)
(Wang et al 2005) The rationale behind using an index based on the red part of the
spectrum is based on the fact that light emitted in this part of the spectrum has a
strong link with structural and physiological processes of the plant In this thesis we
showed that this index cannot be used under greenhouse conditions and that
reflectance in the blue part of the spectrum gives a much better correlation with both
LAI and light interception On the contrary reflectance around 460nm showed a good
correlation with both LAI and light interception in different environments and in
several plant species An application of this findings in a permanent sensor that was
positioned on the top of the greenhouse and took reflectance measurements at 460nm
in real time gave also a good correlation between light interception and reflectance
(Janssen et al 2006) This differentiation between our result and what is usually
applied in the field can have a number of explanations One reason could be the
resolution of the sensor used in this experiment as the broad bands in which
reflectance was measured could miss the subtle changes in the reflectance both during
the day and during the season A sensor with higher resolution could address this
problem Another reason could be the background light scattering in the greenhouse is
so strong that is impossible to monitor reflectance changes in the red part of the
region
Monitoring photosynthetic stress
The ability to monitor photosynthetic activity is important not only for model
parameterisation but also for a dynamic assessment of plant status During the
cultivation period climatic stress parameters such as high light conditions or water
deprivation can cause a decrease in plant photosynthetic efficiency Different non-
destructive methods have been explored in recent years in order to monitor plant
stress for example canopy reflectance (Evain et al 2004) infrared cameras (Langton
et al 2002) fluorescence meters (Rosema et al 1998) pressure probes
(Zimmermann et al 2008) sap flow sensors (de Swaef and Steppe 2010) emitted
plant volatiles (Janssen et al 2009) In this thesis we studied the use of the
Chapter 4 General Discussion
100
photochemical reflectance index (PRI) as photosynthetic stress indicator The
photosynthetic stress was induced by applying water stress on the plants The results
of our experiment were positive under high light conditions where the stress effect
from the water deprivation was enhanced by photoinhibition The results from our
experiments showed that PRI can be used as an indicator of photosynthetic stress in
places where high light conditions occur it could be a useful tool in arid areas with
ubiquitous high irradiance levels however on a regular base its use has a limited
applicability for the relatively short summer period in the Netherlands
PRI uses wavelengths that have been related to the de-epoxidation of
xanthophylls During this process it was found that light is emitted from 500-545nm
The wavelength of 531nm used by PRI is linked with the fast-changes of the
xanthophyll cycle and possible is not the best measure for gradual changes of the
photosynthetic status A few studies have stated that instead of using 531nm a PRI
calculation based on spectra from 521-550nm (Gamon et al 1997 Wu et al 2008)
would give a better correlation with photosynthetic efficiency in some species This
shift in wavelength can be caused by the leaf morphology and the optical properties
(Noomen et al 2006)
Possibilities for further research
In this thesis we presented the advantages of a three-dimensional model approach
as well as the applicability of canopy reflectance as a tool for monitoring non-
destructively the leaf area index light interception and photosynthetic stress in the
plant canopy Based on the results of this thesis further steps to improve this work
and forward the research would include
bull Incorporate a dynamic component in plant architecture so as plant
development can be taken into account As discussed plant structure can
show high plasticity depending on the environmental conditions Functions
that predict plant palsticity would be helpful in our understanding of the
plant adapatation on its environment Such a dynamic adaptive model
could also prove a useful tool for investigating the performance of a
number of phenotypes in different environments for a whole cultivation
season without having to resort to expensive and time consuming
experimental methods
Chapter 4 General Discussion
101
bull In this thesis we measured PRI only in two specific wavelength However
as it was mentioned earlier in the discussion the wavelengths we used to
calculate PRI monitor only the fast kinetic changes of the xanthophylls
while the leaf morphology and the possible effect of the epidermis is not
taken into account Therefore the improvement of PRI efficiency should
be investigated in relation to the wavelengths related to the slow kinetics
of the xanthophyll cycle as well as determine the role of the leaf
morphology
bull Finally the model should be coupled to the monitoring sensors This online
feedback of the model in real time would be a powerful tool to improve the
model accuracy and also boost the efficiency of decision support systems
which in turn will enable the better management of the crop in terms of
yield and quality
References
103
References
Adams WWIII Volk M Hoehn A Demmig- Adams B 1992 Leaf orientation
and the response of the xanthophyll cycle to incident light Oecologia 90 404ndash
410
Atherton JG Rudich J 1986 The tomato crop a scientific basis for improvement
Chapman and Hall London
Baker NR Ort DR 1992 Light and crop photosynthetic performance In Crop
Photosynthesis Spatial and Temporal Determinants pp 289-312 London
Elsevier Science Publishers BV
Baker NR Rosenqvist E 2004 Applications of chlorophyll fluorescence can
improve crop production strategies an examination of future possibilities Journal
of Experimental Botany 55 1607ndash1621
Baker NR 2008 Chlorophyll Fluorescence A Probe of Photosynthesis In Vivo
Annual Review of Plant Biology 59 89ndash113
Baldocchi DD Finnigan JJ Wilson KW Paw KT Falge E 2000 On
measuring net ecosystem carbon exchange in complex terrain over tall vegetation
Boundary Layer Meteorology 96 257-291
Bartheacuteleacutemy D Caraglio Y 2007 Plant architecture a dynamic multilevel and
comprehensive approach to plant form structure and ontogeny Annals of Botany
99 375-407
Barton CVM North PRJ 2001 Remote sensing light use efficiency using the
photochemical reflectance index Remote sensing of Environment 78 264ndash273
Bausch WC 1995 Remote sensing of crop coefficients for improving the irrigation
scheduling of corn Agricultural Water Management 27 55ndash68
Bilger W Bjoumlrkman O 1990 Role of the xanthophylls cycle in photoprotection
elucidated by measurements of light-induced absorbance changes fluorescence
and photosynthesis in Hedera canariensis Photosynthetic Research 25 173ndash85
Bjoumlrkman O Powles B 1984 Inhibition of photosynthetic reactions under water
stress interaction with light level Planta 161 490-504
Bjoumlrkman O Demmig B 1987 Photon yield of O2 evolution and chlorophyll
fluorescence characteristics at 77 K among vascular plants of diverse origins
Planta 170 489ndash504
References
104
Boonen C Samson R Janssens K Pien H Lemeur R Berckmans D 2002
Scaling the spatial distribution of photosynthesis from leaf to canopy in a plant
growth chamber Ecological Modelling 156 201-212
Boote KJ Scholberg JMS 2006 Developing parameterizing and testing of
dynamic crop growth models for horticultural crops Acta Horticulturae 71823-
34
Borger CPD Hashem A Pathan S 2010 Manipulating Crop Row Orientation to
Suppress Weeds and Increase Crop Yield Weed Science 58 174-178
Bouman BAM Uenk D Haverkort AJ 1992 The estimation of ground cover of
potato by reflectance measurements Potato research 35 111- 125
Bouman BAM 1994 A framework to deal with uncertainty in soil and management
parameters in crop yield stimulation A case study in rice Agricultural systems
46 1- 17
Bowman WD 1989 The relationship between leaf water status gas exchange and
spectral reflectance in cotton leaves Remote Sensing of Environment 30 49ndash
255
Brites D Valladares F 2005 Implications of opposite phyllotaxis for light
interception efficiency of Mediterranean woody plants Trees 19 671-679
Buck-Sorlin G de Visser PHB Henke M Sarlikioti V van der Heijden
GWAM Marcelis LFM Vos J 2011 Towards a functional-structural plant
model of cut-rose - simulation of light environment light absorption
photosynthesis and interferences with the plant structure Annals of Botany in
press
Casella E Sinoquet H 2007 Botanical determinants of foliage clumping and light
interception in two-year-old coppice poplar canopies assessment from 3-D plant
mock-ups Annals of Forest Science 64 395- 404
Ceccato P Flasse S Tarantola S Jacquemoud S Gregoire J-M 2001
Detecting vegetation leaf water content using reflectance in the optical domain
Remote Sensing of Environment 77 22ndash33
Chaves MM Pereira JS Maroco J Rodrigues ML Ricardo CPP Osoacuterio
ML Carvalho I Faria T Pinheiro C 2002 How Plants Cope with Water
Stress in the Field Photosynthesis and Growth Annals of Botany 89 907ndash916
Chelle M Andrieu B 1998 The nested radiosity model for the distribution of light
within plant canopies Ecological Modelling 111 75-91
References
105
Chelle M 2005 Phylloclimate or the climate perceived by individual plant organs
What is it How to model it What for New Phytologist 166 781-90
Chen JM Pavlic G Brown L Cihlar J Leblanc SG White HP Hall RJ
Peddle D King DJ Trofymow JA Swift E Van der Sanden J Pellikka P
2002 Validation of Canada-wide leaf area index maps using ground
measurements and high and moderate resolution satellite imagery Remote
Sensing of Enviroment 80 165-184
Clevers JGPW 1997 A simplified approach for yield prediction of sugar beet
based on optical remote sensing data Remote Sensing of Environment 61 221-
228
Cornic G Briantais JM 1991 Portioning of photosynthetic electron flow between
CO2 and O2 reduction in C3 leaf (Phaseolus vulgaris L) at different CO2
concentrantions and during drought stress Planta 183 178ndash184
Cornic G 2000 Drought stress inhibits photosynthesis by decreasing stomatal
aperture- not by affecting ATP synthesis Trends in Plant Science 5 187ndash188
Cournegravede PH Mathieu A Houllier F Bartheacuteleacutemy D de Reffye P 2008
Computing competition for light in the GREENLAB model of plant growth a
contribution to the study of the effects of density on resource acquisition and
architectural development Annals of Botany 101 1207ndash1219
Danson FM Steven MD Malthus TJ Clark JA 1992 High-spectral
resolution data for determining leaf water content International Journal of Remote
Sensing 13 461ndash470
Danson FM Aldakheel YY 2000 Diurnal water stress in sugar beet spectral
reflectance measurements and modeling Agronomie 20 31ndash39
Dauzat J Clouvel P Luquet D Martin P 2008 Using virtual plants to analyse
the light-foraging efficiency of a low-density cotton crop Annals of Botany 101
1153ndash1166
De Castro F Fetcher N 1999 The effect of leaf clustering in the interception of
light in vegetal canopies theoretical considerations Ecological Modelling 116
125-134
de Swaef T Steppe K 2010 Linking stem diameter variations to sap flow turgor
and water potential in tomato Functional Plant Biology 37 429ndash438
Donald CM 1965 The breeding of crop ideotypes Euphytica 17 385-403
References
106
Dong QX Wang XL Yang LL Barczi JF De Reffye F 2007 Greenlab
tomato a 3D architectural model of tomato development New Zealand Journal of
Agricultural Research 50 1229-1233
Drouet JL Pagegraves L 2007 GRAAL-CN A model of Growth Architecture and
Allocation for Carbon and Nitrogen dynamics within whole plants formalized at
the organ level Ecological Modelling 206 231-249
Elachi C 1987 Introduction to the Physics and Techniques of Remote Sensing pp
66ndash71 New York John Wiley
Elwadie ME Pierce FJ Qi J 2005 Remote Sensing of Canopy Dynamics and
Biophysical Variables Estimation of Corn in Michigan Agronomy Journal 97
99-105
Evain S Flexas J Moya I 2004 A new instrument for passive remote sensing 2
Measurement of leaf and canopy reflectance changes at 531 nm and their
relationship with photosynthesis and chlorophyll fluorescence Remote Sensing of
Environment 91 175ndash185
Evers JB Vos J Fournier C Andrieu B Chelle M Struik PC 2005 Towards
a generic architectural model of tillering in Gramineae as exemplified by spring
wheat (Triticum aestivum) New Phytologist 166 801-812
Falster DS Westoby M 2003 Leafs size and angle vary widely across species
what consequences for light interception New Phytologist158 509-525
Farque L Sinoquet H Colin F 2001 Canopy structure and light interception in
Quercus petraea seedlings in relation to light regime and plant density Tree
Physiology 21 1257ndash1267
Farquhar GD von Caemmerer S Berry JA 1980 A biochemical-model of
photosynthetic CO2 assimilation in leaves of C3 species Planta 149 78-90
Flexas J Escalona JM Medrano H 1999 Water stress induces different
photosynthesis and electron transport rate regulation in grapevine Plant Cell and
Environment 22 39ndash48
Flexas J Medrano H 2002 Drought-inhibition of photosynthesis in C3 plants
stomatal and non-stomatal limitations revisited Annals of Botany 89 183ndash189
Foolad MR Zhang LP Subbiah P 2003 Genetics of drought tolerance during
seed germination in tomato Inheritance and QTL mapping Genome 46 536ndash
545
References
107
Forseth N 1990 Function of leaf movements 238ndash261 pp In Satter RL Gorton
HL Vogelmann TC (eds) The pulvinus motor organ for leaf movement
Fourcaud T Zhang X Stokes A Lambers H Koumlrner C 2008 Plant growth
modelling and applications the increasing importance of plant architecture in
growth models Annals of Botany 101 1053-1063
Frary A Fritz LA Tanksley SD 2004 A comparative study of the genetic
basis of natural variation in tomato leaf sepal and petal morphology
Theoretical and Applied Genetics 109 523-533
Gamon JA Field CB Bilger W Bjoumlrkman O Fredeen AL Pentildeuelas J
1990 Remote sensing of the xanthophyll cycle and chlorophyll fluorescence in
sunflower leaves and canopies Oecologia 85 1ndash7
Gamon JA Serrano L Surfus JS 1997 The photochemical reflectance index
An optical indicator of photosynthetic radiation use efficiency across species
functional types and nutrient levels Oecologia 112 492ndash498
Gary C Barczi JF Bertin N Tchamitchian M 1995 Simulations of individual
organ growth and development on a tomato plant a model and user-friendly
interface Acta Horticulturae 399 199ndash205
Gayler S Grams TEE Kozovits AR Winkler JB Luedemann G Priesack
E 2006 Analysis of competition effects in mono- and mixed cultures of juvenile
beech and spruce by means of the plant growth simulation model PLATHO Plant
Biology 8 503-514
Genty B Briantais JM Viera da Silva JB 1987 Effects of drought on primary
photosynthetic processes of cotton leaves Plant Physiology 83 360ndash364
Giardi MT Cona A Geiken B Kucera T Masojidek J Mattoo AK 1996
Long- term drought stress induces structural and functional reorganisation of
photosystem II Planta 199 118ndash125
Gilbert RA Heilman JL Juo ASR 2003 Diurnal and Seasonal Light
Transmission to Cowpea in SorghumndashCowpea Intercrops in Mali Journal of
Agronomy and Crop Science 189 21- 29
Gitelson AA 2002 Wide Dynamic Range Vegetation Index for remote
quantification of biophysical characteristics of Vegetation Journal of Plant
Physiology 161 165-173
Godin C 2000 Representing and encoding plant architecture a review Annals of
Forest Science 57 413-438
References
108
Godin C Sinoquet H 2005 Functional-structural plant modelling New Phytologist
166 705-708
Gonzaacutelez-Real MM Baille A Gutieacuterrez Colomer RP 2007 Leaf photosynthetic
properties and radiation profiles in a rose canopy (Rosa hybrida L) with bent
shoots Scientia Horticulturae 114 177ndash187
Goudriaan J van Laar HH 1994 Modelling potential crop growth processes
Kluwer Academic Publishers Dordrecht
Graeff S Claupein W 2007 Identification and discrimination of water stress in
wheat leaves ( Triticum aestivum L) by means of reflectance measurements
Irrigation Science 26 61ndash70
Guo J Trotter CM 2004 Estimating photosynthetic light-use efficiency using the
photochemical reflectance index variations among species Function Plant
Biology 31 255ndash265
Hanan J 1997 Virtual plants integrating architectural and physiological models
Environmental Modelling and Software 12 35-42
Heuvelink E 1999 Evaluation of a dynamic simulation model for tomato crop
growth and development Annals of Botany 83 413-422
Higashide T 2009 Light interception by tomato plants (Solanum lycopersicum)
grown on a sloped field Agricultural and Forest Meteoreology 149 756-762
Hoffmann CM Blomberg M 2004 Estimation of Leaf Area Index of Beta vulgaris
L Based on Optical Remote Sensing Data Journal of Agronomy and Crop
Science 190 197-204
Hsiao T Steduto P Fereres E 2007 A systematic and quantitative approach to
improve water use efficiency in agriculture Irrigation Science 25 209-231
Jahns P Latowski D Strzalka K 2009 Mechanism and regulation of the
violaxanthin cycle The role of antenna proteins and membrane lipids Biochimica
et biophysica acta-bioenergetics 1787 3ndash14
Jansen RMC Hofstee JW Wildt J Verstappen FWA Bouwmeester HJ
Posthumus MA Van Henten EJV 2009 Health monitoring of plants by their
emitted volatiles trichome damage and cell membrane damage are detectable at
greenhouse scale Annals of Applied Biology 154 441ndash452
Janssen HJJ Sarlikioti V Gieling ThH Meurs EJJ Marcelis LFM Van
Dugteren JR 2008 A prototype sensor for estimating light interception by
plants in a greenhouse Acta Horticulturae 801 621-627
References
109
Jefferies RA 1994 Drought and chlorophyll fluorescence in the fieldgrown potato
(Solanum tuberosum) Physiologia Plantarum 90 93ndash97
Jonckheere I Fleck S Nackaerts K Muys B Coppin P Weiss M Baret F
2004 Review of methods for in situ leaf area index determination Part I
Theories sensors and hemispherical photography Agricultural Forest
Meteorology 121 19- 35
Jongschaap REE 2006 Run- time calibration of simulation models by integrating
remote sensing estimates leaf area index and canopy nitrogen European Journal
of Agronomy 24 316-324
Kahlen K 2006 3D architectural modeling of greenhouse cucumber (Cucumis
sativus l) Using l-systems Acta horticulturae 718 51-58
Kahlen K Wiechers D Stuumltzel H 2008 Modelling leaf phototropism in a
cucumber canopy Functional Plant Biology 35 876-884
Kao WY Forseth IN 1992 Diurnal leaf movement chlorophyll fluorescence and
carbon assimilation in soybean grown under different nitrogen and water
availabilities Plant Cell and Environment 15 703-710
Krause GH Weis E 1991 Chlorophyll Fluorescence and Photosynthesis The
Basics Annual Review Plant Physiology Plant Molecular Biology 42 313ndash349
Lai CT Katul G Ellsworth D Oren R 2000 Modelling vegetationndashatmosphere
CO2 exchange by a coupled eulerianndashlagrangian approach Boundary-Layer
Meteorology 95 91-122
Langton FA Horridge JS Holdsworth MD Hamer PJC 2004 Control and
optimization of the greenhouse environment using infra-red sensors Acta
Horticulturae 633 145ndash152
Lawlor DW Tezara W 2009 Causes of decreased photosynthetic rate and
metabolic capacity in water-deficient leaf cells a critical evaluation of
mechanisms and integration of processes Annals of Botany 103 561-579
Lichtenthaler HK Babani F 2000 Detection of photosynthetic activity and water
stress by imaging the red chlorophyll fluorescence Plant Physiology and
Biochemistry 38 889ndash895
Lindenmayer A Prusinkiewicz P 1990 The algorithmic beauty of plants New
York Springer-Verlag
Lintz J Simonett DS 1976 Remote Sensing of the Environment 713 p Addison-
Wesley Reading Massachusetts
References
110
Louarn G Lecoeur J Lebon E 2008 A three-dimensional statistical
reconstruction model of grapevine (Vitis vinifera) simulating canopy structure
variability within and between cultivartraining system pairs Annals of Botany
1011167ndash1184
Lu C Zhang J 1998 Effects of water stress on photosynthesis chlorophyll
fluorescence and photoinhibition in wheat plants Australian Journal of Plant
Physiology 25 883ndash892
Maddonni GA Otegui ME Andrieu B Chelle M Casal JJ 2002 Maize
Leaves Turn Away from Neighbors Plant Physiology 130 1181-1189
Marcelis LFM Heuvelink E Goudriaan J 1998 Modelling of biomass
production and yield of horticultural crops a review Scientia Horticulturae 74
83-111
Marcelis LFM Van den Boogaard R Meinen E 2000 Control of crop growth
and nutrient supply by the combined use of crop models and plant sensors 351-
356 pp Proc Int Conf Modelling and control in agriculture horticulture and
post-harvested processing IFAC
Marcelis LFM Dieleman JA Kittas C De Groot F Buschmann C Van
Loon A Boulard T Brajeul E Kocsanyi L Garate A Wieringa G 2006
CLOSYS Closed system for water and nutrient management in horticulture Acta
Horticulturae 718 375ndash382
Masojidek J Trivedi S Halshaw L Alexiou A Hall DO 1991 The synergistic
effect of drought and light stresses in sorghum and pearl millet Plant Physiology
96 198ndash207
Maxwell C Griffiths H Young AJ 1994 Photosynthetic acclimation to light
regime and water stress by the C3-CAM epiphyte Guzmania monostachia gas-
exchange characteristics photochemical efficiency and the xanthophyll cycle
Functional Ecology 8 746ndash754
Meir P Kruijt B Broadmeadow M Barbosa E Kull O Carswell F Nobre
A Jarvis PG 2002 Acclimation of photosynthetic capacity to irradiance in tree
canopies in relation to leaf nitrogen concentration and leaf mass per unit area
Plant Cell amp Environment 25 343ndash357
Meacutethy M Joffre R Rambal S 1999 Remote Sensing of Canopy Photosynthetic
Performances Two Complementary Ways for Assessing the Photochemical
Reflectance Index Photosynthetica 37 239ndash247
References
111
Monsi M Saeki T 1953 Uumlber den lichtfaktor in den pflanzengesellschaften und
seine bedeutung fuumlr die stoffproduktion Japanese Journal of Botany 14 22-52
Morales F Abadiacutea A Abadiacutea J 1990 Characterization of the xanthophyll cycle
and other photosynthetic pigment changes induced by iron deficiency in sugar
beet (Beta vulgaris L) Plant Physiology 94 607ndash613
Najla S Vercambre G Pagegraves L Grasselly D Gautier H Geacutenard M 2009
Tomato plant architecture as affected by salinity Descriptive analysis and
integration in a 3-D simulation model Botany 87 893-904
Nederhoff EM Vegter JG 1994 Canopy Photosynthesis of Tomato Cucumber
and Sweet Pepper in Greenhouses Measurements Compared to Models Annals of
Botany 73 421-427
Niinemets Uuml Fleck S 2002 Petiole mechanics leaf inclination morphology and
investment in support in relation to light availability in the canopy of Liriodendron
tulipifera Oecologia 132 21-33
Niinemets U 2007 Photosynthesis and resource distribution through plant canopies
Plant Cell and Environment 30 1052-1071
Niklas KJ 1998 Light harvesting ldquofitness landscapesrdquo for vertical shoots with
different phyllotactic patterns 759-773 pp In Jean RV Barabeacute D eds Symmetry
in plants Singapore World Scientific Publishing Co Pte Ltd
Noomen MF Skidmore AK van der Meer FD Prins HHT 2006 Continuum
removed band depth analysis for detecting the effects of natural gas methane and
ethane on maize reflectance Remote Sensing of Environment 105262ndash270
Palmer JW 1989 The effects of row orientation tree height time or year and
latitude on light interception and distribution in model apple hedgerow canopies
Journal of Horticultural Scence 64 137- 145
Papadopoulos AP Pararajasingham S 1997 The influence of plant spacing on
light interception and use in greenhouse tomato ( Lycopersicon esculentum Mill)
A review Scientia Horticulturae 69 l-29
Pearcy R Roden J Gamon J 1990 Sunfleck dynamics in relation to canopy
structure in a soybean (Glycine max (L) Merr) canopy Agricultural and Forest
Meteorology 52 359-372
Pearcy RW Yang W 1998 The functional morphology of light capture and carbon
gain in the Redwood forest understorey plant Adenocaulon bicolor Hook
Functional Ecology 12 543-552
References
112
Peguero-Pina J Morales F Flexas J Gil-Pelegriacuten E Moya I 2008
Photochemistry remotely sensed physiological reflectance index and de-
epoxidation state of the xanthophyll cycle in Quercus coccifera under intense
drought Oecologia 156 1ndash11
Peng S Khush GS Virk P Tang Q Zou Y 2008 Progress in ideotype breeding
to increase rice yield potential Field Crops Research 108 32-38
Pentildeuelas J Biel C Serrano L Saveacute R 1993 The reflectance at the 950ndash 970 nm
region as an indicator of plant water stress International Journal of Remote
Sensing 14 1887ndash1905
Pentildeuelas J Gamon JA Freeden AL Merino J Field CB 1994 Reflectance
indices associated with physiological changes in nitrogen- and water-limited
sunflower leaves Remote Sensing of Environment 48 135ndash146
Pentildeuelas J Filella I Araus JL 1997 Visible and near-infrared reflectance
assessment of salinity effects on barley Crop Science 37 198ndash202
Peralta IE Spooner DM 2000 Classification of wild tomatoes A review
Kurtziana 28 45-54
Pinter JrPJ Hatfield JL Schepers JS Barnes EM Moran MS Daughtry
CST Upchurch DR 2003 Remote sensing for crop management
Photogrammetric Engineering and Remote Sensing 69 647ndash664
Planchais I Sinoquet H 1998 Foliage determinants of light absorption in sunny
and shaded branches of Fagus sylvatica (L) Agricultural and Forest Meteorology
89 241-253
Powles SB 1984 Photoinhibition of photosynthesis induced by visible light Annual
Review of Plant Physiology 35 15ndash44
Prusinkiewicz P 1999 A look at the visual modelling of plants using L-systems
Agronomie 19 211-224
Rakocevic M Sinoquet H Christophe A Varlet-Grancher C 2000 Assessing
the geometric structure of a white clover (Trifolium repens) canopy using 3D
digitizing Annals of Botany 86519-526
Rosema A Snel JFH Zahn H Buurmeijer WF Van Hove LWA 1998 The
relation between laser-induced chlorophyll fluorescence and photosynthesis
Remote Sensing of Environment 65 143ndash154
Ruban AV Young AJ Horton P 1993 Induction of nonphotochemical energy
dissipation and absorbance changes in leaves Plant Physiology 102 741ndash750
References
113
Schindler C Lichtenthaler HK 1994 Is there a correlation between light induced
zeaxanthin accumulation and quenching of variable chlorophyll a fluorescence
Plant Physiology Biochemistry 32 813ndash823
Schulze E-D Hall AE 1982 Stomatal responses water loss and CO2 assimilation
rates of plants in contrasting environments In Encyclopedia of plant physiology
Vol 12 Physiological plant ecology ecosystem processes 263ndash324 pp Eds OL
Lange PS Nobel CB Osmond and H Ziegler Berlin Germany Springer-Verlag
Schurr U Walter A Rascher U 2006 Functional dynamics of plant growth and
photosynthesis ndash from steady-state to dynamics ndash from homogeneity to
heterogeneity Plant Cell and Environment 29 340ndash352
Sievaumlnen R Nikinmaa E Nygren P Ozier-Lafontaine H Perttunen J Hakula
H 2000 Components of functionalndashstructural tree models Annals of Forest
Science 57 399-412
Sims DA Luo H Hastings S Oechel WC Rahman AF Gamon JA 2006
Parallel adjustments in vegetation greenness and ecosystem CO2 exchange in
response to drought in a Southern California chaparral ecosystem Remote
Sensing of the Environment 103 289-303
Sinoquet H Sonohat G Phattaralerphong J Godin C 2005 Foliage randomness
and light absorption in 3-D digitized trees an analysis from multiscale
discretization of the canopy Plant Cell and Environment 28 1158-1170
Smith H Whitelam GC 1997 The shade avoidance syndrome multiple responses
mediated by multiple phytochromes Plant Cell and Environment 20 840-844
Sobrado MA 2008 Leaf characteristics and diurnal variation of chlorophyll
fluorescence in leaves of the lsquobanarsquo vegetation of the amazon region
Photosynthetica 46 202-207
Stewart DW Costa C Dwyer L M Smith D L Hamilton R I Ma B L
2003 Canopy Structure Light Interception and Photosynthesis in Maize
Agronomie Journal 95 1465-1474
Suaacuterez L Zarco-Tejada PJ Sepulcre-Cantoacute G Peacuterez-Priego O Miller JR
Jimeacutenez-Muntildeoz JC Sobrino J 2008 Assessing canopy PRI for water stress
detection with diurnal airborne imagery Remote Sensing of the Environment
112 560-575
References
114
Suaacuterez L Zarco-Tejada PJ Berni JAJ Gonzalez-Dugo V Ferreres E 2009
Modeling PRI for water stress detection using radiative transfer models Remote
Sensing of the Environment 113 730-744
Sun P Grignetti A Liu S Casacchia R Salvatori R Pietrini F Loreto F
Centritto M 2007 Associated changes in physiological parameters and spectral
reflectance indices in olive (Olea europaea L) leaves in response to different
levels of water stress International Journal of Remote Sensing 29 1725ndash1743
Takenaka A 1994 Effects of leaf blade narrowness and petiole length on the light
capture efficiency of a shoot Ecological Research 9 109-114
Thornley JHM Johnson IR 1990 Plant and Crop Modelling In A Mathematical
Approach to Plant and Crop Physiology 669 pp Oxford UK Clarendon Press
Thurling N 1991 Application of the ideotype concept in breeding for higher yield in
the oilseed brassicas Field Crops Research 26 201-219
Tian YQ Zhu Y Cao W 2005 Monitoring leaf photosynthesis with canopy
spectral reflectance in rice Photosynthetica 43 481-489
Toler JE Murdock EC Stapleton GS Wallace SU 1999 Corn leaf orientation
effects on light interception intraspecific competition and grain yields Journal of
production agriculture 12 396-399
Turner DP Cohen WB Kennedy RE Fassnacht KS Briggs JM 1999
Relationships between Leaf Area Index and Landsat TM Spectral Vegetation
Indices across Three Temperate Zone Sites Remote Sensing of Environment 70
52-68
Valladares F Pearcy RW 1998 The functional ecology of shoot architecture in
sun and shade plants of Heteromeles arbutifolia M Roem a Californian chaparral
shrub Oecologia 114 1-10
Valladares F 2003 Light heterogeneity and plants from ecophysiology to species
coexistence and biodiversity Progress in Botany 439ndash471 pp Springer Verlag
Berlin Germany
Valladares F Gianoli E Goacutemez JM 2007 Ecological limits to plant phenotypic
plasticity New Phytologist 176 749ndash763
Valladares F Niinemets Uuml 2007 The architecture of plant crowns from design
rules to light capture and performance 101-149 pp In Pugnaire F Valladares F
eds Functional plant ecology New York Taylor and Francis
References
115
Vargas LA Andersen MN Jensen CR Joslashrgessen U 2002 Estimation of leaf
area index light interception and biomass of Miscanthus sinensis lsquoGoliathrsquofrom
radiation measurements Biomass and bioenergy 22 1-14
Vos J Marcelis LFM Evers JB 2007 Functional-structural plant modelling in
crop production adding a dimension 1-12 pp In Vos J Marcelis LFM De
Visser PHB Struik PC and Evers JB eds Functional-structural plant
modelling in crop production Springer Dordrecht
Vos J Evers JB Buck-Sorlin GH Andrieu B Chelle M de Visser PHB
2010 Functional-structural plant modelling a new versatile tool in crop science
Journal of Experimental Botany 61 2101-2115
Wang D Wilson C Shannon MC 2002 Interpretation of salinity and irrigation
effects on soybean canopy reflectance in visible and near-infrared spectrum
domain International Journal of Remote Sensing 23 811-824
Wang Q Adiku S Tenhunen J Granier A 2005 On the relationship of NDVI
with leaf area index in a deciduous forest site Remote Sensing of Environment
94 244-255
Weng JH Chen YN Liao TS 2006 Relationships between chlorophyll
fluorescence parameters and photochemical reflectance index of three species
adapted to different temperature regimes Functional Plant Biology 33 241ndash246
Werner C Ryel RJ Correia O Beyschlag W 2001 Structural and functional
variability within the canopy and its relevance for carbon gain and stress
avoidance Acta Oecologica 22 129-138
Zarco-Tejada PJ Miller JR Mohammed GH Noland TL 2000 Chlorophyll
Fluorescence Effects On Vegetation Apparent Reflectance I Leaf-Level
Measurements And Model Simulation Remote Sensing of Environment 74 582ndash
590
Zheng B Shi L Ma Y Deng Q Li B Guo Y 2008 Comparison of architecture
among different cultivars of hybrid rice using a spatial light model based on 3-D
digitizing Functional Plant Biology 35 900-910
Zimmermann D Reuss R Westhoff M Geszligner P Bauer W Bamberg E
Bentrup F-W Zimmermann U 2008 A novel non-invasive online-
monitoring versatile and easy plant-based probe for measuring leaf water status
Journal of Experimental Botany 59 3157ndash3167
References
116
Zotz G Reichling P Valladares F 2002 A simulation study on the importance of
size and related changes in leaf morphology and physiology for carbon gain in an
epiphytic Bromeliad Annals of Botany 90 437-443
119
Summary A greenhouse crop can be approached as an open system that can be affected by a
number of parameters such as light climate or nutrient supply In the last decades
efforts have been made to understand the functioning of this system and the
interaction between the different parameters The intensive nature of greenhouse
cultivation combined with the economic necessity to enlarge the farm size makes the
development of decision support systems (DSS) imperative to help the growers in
managing their farms efficiently The foundation of DSS are plant models and in order
to work more efficiently they should be able to receive information in real time from
sensors that measure different plant parameters such as light interception leaf area
index and photosynthetic stress in a non-destructive way In order to develop functional
DSS it is imperative to develop accurate models and monitoring techniques applied in
the specific greenhouse environment
The aim of this thesis was to explore different techniques to simulate and monitor
light interception and photosynthesis by a greenhouse grown tomato canopy Since
photosynthesis is directly linked to light absorption we opted to develop a three
dimensional model that takes into account the explicit plant architecture Different
methodologies to monitor these physiological properties online by means of remote
sensing were also explored
A number of physiological tomato models have been proposed the last
decades their main challenge being the correct simulation of fruit yield For this an
accurate simulation of light interception and thus photosynthesis is of primary
importance At present most process-based models and the majority of three
dimensional models include simplifications of plant architecture that can compromise
the accuracy of light interception simulations and accordingly canopy
photosynthesis In Chapter 21 the first steps towards the development of the model
are presented Light interception is highly dependent on the canopy structure which is
affected among others by the distance between plant rows the distance of plants
within the row leaf pruning and crop variety The model was used to test different
crop planting scenarios on their effect on light interception Light interception from
the planting scenarios was then compared with results of a totally homogeneous
canopy Also analysis of differences between manual measurements of leaf length
width elevation angle and leaf orientation was conducted Changes of leaf elevation
Summary
120
angles at two different times of the day were also measured In tomato differences in
leaf length width and elevation angle of the leaves were mainly observed in the upper
90cm of the plant in the still developing zone Changes of the architectural
characteristics of structural plant characteristics affected directly light interception by
the crop canopy Nevertheless even if plant structure stayed the same light
penetration could easily be manipulated by changing the row spacing in the crop thus
affecting light interception and potentially plant production
In Chapter 22 the development and calibration of a functional-structural tomato
model is fully described The model was used to investigate the canopy heterogeneity
of an explicitly described tomato canopy in relation to temporal dynamics of
horizontal and vertical light distribution and photosynthesis under direct and diffuse
light conditions The model consists of an architectural static virtual plant coupled
with a nested radiosity model for light absorption and a leaf photosynthesis module
Different scenarios for horizontal and vertical distributions of light interception
incident light and photosynthesis were investigated under diffuse and direct light
conditions Simulated light interception showed a good correspondence to the
measured values Explicitly described leaf elevation angles resulted in higher light
interception in the middle of the plant canopy compared to fixed and ellipsoidal leaf
elevation angle distribution models although the total light interception remained the
same The fraction of light intercepted at a north-south orientation of rows differed
from an east-west orientation by 10 in winter and 23 on summer days The
horizontal distribution of photosynthesis differed significantly between the top
middle and lower canopy layer Taking into account the vertical variation of leaf
photosynthetic parameters in the canopy led to ca 8 increase on simulated canopy
photosynthesis
Manipulation of plant structure can strongly affect light distribution in the canopy
and photosynthesis In Chapter 23 the idea of identifying different plant ideotypes
for optimization of light absorption and photosynthesis was explored Using the
functional-structural tomato model presented in the previous chapters a range of
different plant architectural characteristics were tested for two different seasons in
order to find the optimal architecture with respect to light absorption and
photosynthesis Sensitivity analyses were carried out for leaf elevation angle leaf
phyllotaxis leaflet angle leaf shape leaflet arrangement and internode length From
the results of this analysis two possible ideotypes were proposed Increasing light
Summary
121
absorption in the top part of the canopy by 25 without changing light absorption of
the canopy as a whole augmented photosynthesis by 6 in winter and decreased it
by 7 in summer The measured plant structure was already optimal with respect to
leaf elevation angle leaflet angle and leaflet arrangement for both light absorption and
photosynthesis while phyllotaxis had no effect Increasing the length-to-width ratio of
leaves by 15 or increasing internode length from 7 to 12 cm led to an increase of 7 ndash
10 for light absorption and photosynthesis The most important architectural traits
found were the internode length and the leaf shape as they affect vertical light
distribution in the canopy distinctly A new plant ideotype with more spacious canopy
architecture due to long internodes and long and narrow leaves led to an increase in
photosynthesis of up to 10
In Chapter 31 ways to monitor on-line LAI and PAR interception of the canopy
under greenhouse conditions through reflectance measurements were explored LAI
and PAR interception were measured at the same moments as reflectance at six
wavelengths in different developmental stages of tomato and sweet pepper plants
Normalized Difference Vegetation Index (NDVI) was calculated Relationships
between the measured parameters were established in experimental greenhouses and
subsequently these were tested in commercial greenhouses The best estimation for
LAI and PAR interception was obtained from reflectance at 460nm for both tomato
and sweet pepper The goodness of the fit was validated with data from the
commercial greenhouses and was also tested in this study The divergence of the
results from the ones reported from field experiments can be traced back to the special
greenhouse environment where more sources of reflectance are added due to
construction parts and a white plastic covered background Reflectance measurements
offer a non- destructive way to estimate PAR interception and LAI (up to the value of
3) in greenhouse production systems The relationship established between reflectance
at 460 nm PAR interception and LAI for both tomato and sweet pepper can become a
good tool for crop online monitoring in greenhouse conditions Furthermore if
information from reflectance sensors is used as input directly into the crop models
new opportunities for decision support systems in greenhouse production could be
opened up
Photosynthetic stress induced by water deprivation in plants affects a number of
physiological processes such as photosynthetic rate stomatal conductance as well as
the operating efficiency of PSII and non- photochemical quenching Photochemical
Summary
122
Reflectance Index (PRI) is reported to be sensitive to changes of xanthophyll cycle
that occur during stress and could possibly be used to monitor changes in the
physiological parameters mentioned before In Chapter 32 the use of PRI as an early
photosynthetic stress indicator was evaluated A water stress treatment was imposed
on a greenhouse tomato crop CO2 assimilation stomatal conductance light and dark
adapted fluorescence as well as PRI and relative water content of the rooting medium
RWCs where repeatedly measured The same measurements were also performed on
well-irrigated plants that acted as a reference The experiment was repeated in four
consecutive weeks Results showed that PRI can be used as an early stress indicator
only when light intensity at crop level was above 700μmol m-2 s-1 At lower values of
light intensity the relationship of PRI to RWCs was poor in comparison to
photosynthesis or fluorescence parameters that showed a high correlation to RWCs
For that reason we can conclude that PRI as water stress indicator cannot be
independent of the ambient light conditions and its use can make sense only under
conditions of high light
Finally in Chapter 4 the main achievements and limitations of this study are
discussed and directions for future research are proposed
Samenvatting
125
Samenvatting De afgelopen decennia is kennis over het functioneren van kasgewassen en de
interactie met teeltfactoren sterk toegenomen De intensieve teeltwijze in kassen
gecombineerd met de schaalvergroting maken de ontwikkeling en toepassing van
beslissingsondersteunende systemen ofwel decision support systemen (DSS)
noodzakelijk om telers te ondersteunen bij het verhogen van de doelmatigheid en
efficieumlntie van het teeltproces De basis van een DSS wordt veelal gevormd door een
model Om dit model effectief te laten functioneren zou het real time data moeten
krijgen van sensoren die plant-parameters meten zoals lichtonderschepping
bladoppervlakte-index en fotosynthetische stress op een niet-destructieve wijze Dus
om een goed functionerende DSS te ontwikkelen moeten nauwkeurige modellen en
monitoring technieken voor toepassing in kassen ontwikkeld worden
Het doel van dit proefschrift was om verschillende methodologieeumln te
onderzoeken ten behoeve van het simuleren en monitoren van lichtonderschepping en
fotosynthese van een tomatengewas in de kas Aangezien fotosynthese direct
gekoppeld is aan lichtonderschepping is er voor gekozen om een functioneel-
structureel model te ontwikkelen Een functioneel-structureel model is een model dat
de drie-dimensionale plant architectuur expliciet in beschouwing neemt evenals de
belangrijkste fysiologische processen Verschillende methodologieeumln om
fysiologische eigenschappen on-line en contactloos te meten zijn onderzocht
Afgelopen decennia zijn enkele fysiologische groeimodellen voor tomaat
ontwikkeld om de vruchtproductie te kunnen simuleren Hierbij zijn een nauwkeurige
simulatie van lichtonderschepping en fotosynthese van primair belang Momenteel
bevatten de meeste proces-gebaseerde modellen en zelfs de drie-dimensionale
modellen sterke vereenvoudigingen van de plantarchitectuur die een negatieve invloed
hebben op de nauwkeurigheid van de simulatie van lichtonderschepping en als gevolg
daarvan van gewasfotosynthese
In Hoofdstuk 21 worden de eerste stappen gezet om een functioneel-structureel
tomatenmodel te ontwikkelen Lichtonderschepping is sterk afhankelijk van de
gewasstructuur De gewasstructuur hangt onder andere af van de afstand tussen de
plantrijen de afstand tussen de planten in de rij bladsnoei en ras Het model werd
gebruikt om het effect van verschillende scenariorsquos voor plantafstanden op
lichtonderschepping te testen Lichtonderschepping van deze scenariorsquos werd
Samenvatting
126
vergeleken met een volledig homogeen gewas zonder plantrijen De bladhoek bleek
tijdens de dag te veranderen Deze verandering tijdens de dag werden vooral
waargenomen in de bovenste 90cm van de plant dit is in het deel van de plant dat
zich nog aan het ontwikkelen is Veranderingen van de plant architectuur hadden
direct effect op de lichtonderschepping van het gewas Desalniettemin zelfs als de
plant structuur hetzelfde bleef kon de lichtdoordringing eenvoudig veranderd worden
door bijvoorbeeld de rijafstand te veranderenIn Hoofdstuk 22 wordt de
ontwikkeling en calibratie van een functioneel-structureel tomaten model volledig
uitgewerkt Met het model werd de heterogeniteit van horizontale en verticale
lichtverdeling en fotosynthese in een tomatengewas onderzocht voor zowel direct als
diffuus licht Het model bestond uit een statisch architectuurmodel gekoppeld aan een
lsquonested radiosityrsquo model voor lichtabsorptie en een bladfotosynthesemodel
Verschillende scenariorsquos voor horizontale en verticale verdeling van de
lichtonderschepping invallend licht en fotosynthese werden onderzocht voor direct en
diffuus licht Gesimuleerde lichtonderschepping vertoonde een goede overeenkomst
met gemeten waarden Een expliciete beschrijving van bladhoeken in het model
resulteerden in hogere lichtonderschepping in het midden van het gewas in
vergelijking met een vaste of ellipsoiumldale bladhoekverdeling De totale
lichtonderschepping van het gewas bleef wel gelijk De fractie van het licht dat
onderschept werd door het gewas was bij een noord-zuid orieumlntatie van de gewasrijen
in de winter 10 en in de zomer 23 hoger dan bij oost-west orieumlntatie De
horizontale verdeling van fotosynthese verschilde significant tussen boven midden en
onder in het gewas Door in het model rekening te houden met de verticale verdeling
van bladfotosyntheseparameters in het gewas veranderde de gesimuleerde
gewasfotosynthese met circa 8 Het veranderen van de gewasstructuur kan sterke
invloed hebben op de lichtverdeling in het gewas en de fotosynthese In Hoofdstuk
23 zijn plant ideotypes gezocht met een optimale lichtabsorptie en fotosynthese Met
behulp van het functie-structuurmodel voor tomaat zoals in vorige hoofdstukken
beschreven zijn effecten van een groot aantal architectuureigenschappen van de plant
onderzocht op de lichtabsorptie en fotosynthese in twee verschillende seizoenen
(zomer en winter) Er is een gevoeligheidsanalyse uitgevoerd voor bladhoek van het
blad en van deelblaadjes fyllotaxie lengtebreedte verhouding van bladeren opbouw
van het blad uit deelblaadjes en internodiumlengte Naar aanleiding van de analyse
van deze resultaten werden twee mogelijke ideotypes voor optimale
Samenvatting
127
lichtonderschepping en fotosynthese geformuleerd Als de verticale verdeling van het
geabsorbeerde licht in het gewas werd veranderd waarbij de lichtabsorptie in de top
van het gewas met 25 toenam terwijl de totale licht absorptie van het gewas gelijk
gehouden werd dan nam de gewasfotosynthese met 6 toe in de winter maar nam af
met 7 in de zomer De waargenomen plantstructuur was al optimaal voor
lichtabsorptie en fotosynthese voor zover het ging om de volgende
architectuureigenschappen bladhoek van blad en deelblaadjes en opbouw van het
samengestelde blad De meest belangrijke architectuur eigenschappen van een plant
bleken de internodiumlengte en lengte-breedte verhouding van het blad Verhoging
van de lengte-breedte verhouding van bladeren met 50 of vergroten van
internodiumlengte van 7 naar 12 cm leidde tot een toename van lichtabsorptie en
fotosynthese met 7 tot 10 Een nieuw plant ideotype met een meer open
gewasstructuur als gevolg van langere internodieumln en lange smalle bladeren leidde tot
een toename van de gewasfotosynthese tot 10
In Hoofdstuk 31 zijn methoden onderzocht om onder kascondities de
bladoppervlakte-index (LAI) en lichtonderschepping van het gewas on-line te
monitoren met behulp van reflectiemetingen LAI en lichtonderschepping werden
tegelijk met reflectie van 6 verschillende golflengten gemeten aan paprika- en
tomatenplanten in verschillende ontwikkelingsstadia Relaties tussen de gemeten
parameters werden bepaald in onderzoekskassen en vervolgens werden deze relaties
getest in praktijkkassen De beste schatting voor LAI en lichtonderschepping werd
verkregen met behulp van reflectie van 460nm licht voor zowel tomaat als paprika
Reflectiemetingen bieden hiermee een goede niet-destructieve mogelijkheid om LAI
(tot een waarde van circa 3) en lichtonderschepping te monitoren bij de teelt van
tomaten en paprika in kassen Fotosynthetische stress geiumlnduceerd door watertekort in
planten heeft invloed op een aantal fysiologische processen zoals
fotosynthesesnelheid huidmondjesgeleidbaarheid efficieumlntie van PSII en niet-
fotochemische doving (non-photochemical quenching) De fotochemische reflectie
index (PRI) is gevoelig voor veranderingen in de xanthofyl cycli die optreden tijdens
stress Dit zou mogelijk gebruikt kunnen worden om veranderingen in fysiologische
parameters te kunnen monitoren In Hoofdstuk 32 werd het gebruik van de PRI
meting geeumlvalueerd als vroegtijdige indicator voor fotosynthetische stress Een
behandeling met watertekort werd aangelegd in een kas met een tomatengewas CO2
mol mmicroassimilatie huidmondjesgeleidbaarheid licht en donker geadapteerde
Samenvatting
128
fluorescentie alsmede PRI en relatief watergehalte van het wortelmedium (RWC)
werden gemeten Dezelfde metingen werden verricht aan goed geiumlrrigeerde planten
die dienden als referentiebehandeling Het experiment werd herhaald in vier
opeenvolgende weken De resultaten lieten zien dat PRI alleen gebruikt kan worden
als vroegtijdige stressindicator wanneer lichtintensiteit meer dan 700 -2 s-1 bedraagt
Bij lagere lichtintensiteiten was de relatie tussen PRI en RWC zwak in vergelijking
met de goede relaties tussen RWC en fotosynthese of fluorescentieparameters Op
basis van deze resultaten kan geconcludeerd worden dat PRI als stressindicator niet
onafhankelijk van lichtniveau gebruikt kan worden PRI metingen kunnen alleen als
stressindicator gebruikt worden bij voldoende hoge lichtniveaus
Tenslotte worden in Hoofdstuk 4 de belangrijkste resultaten en de beperkingen
van dit onderzoek bediscussieerd en worden richtingen voor vervolgonderzoek
voorgesteld
Περίληψη
131
Περίληψη Η καλλιέργεια του θερμοκηπίου μπορεί να προσεγγιστεί ως ένα ανοικτό σύστημα
το οποίο μπορεί να επηρεαστεί από μια σειρά παραμέτρων όπως το φως το κλίμα ή η
παροχή θρεπτικών συστατικών Τις τελευταίες δεκαετίες έχουν καταβληθεί
προσπάθειες για την κατανόηση της λειτουργίας του συστήματος αυτού καθώς και
της αλληλεπίδρασης μεταξύ των διαφόρων παραμέτρων Η εντατική φύση της
καλλιέργειας του θερμοκηπίου σε συνδυασμό με την οικονομική ανάγκη να
διευρυνθεί το μέγεθος της γεωργικής εκμετάλλευσης καθιστά επιτακτική την
ανάπτυξη συστημάτων υποστήριξης αποφάσεων (Desicion Support Systems) για την
πιο αποτελεσματική διαχείριση των αγροκτημάτων Βάση των DSS αποτελούν τα
μοντέλα φυτών (plant models) Τα μοντέλα αυτά προκειμένου να είναι
αποτελεσματικά θα πρέπει να μπορούν να λαμβάνουν πληροφορίες σε πραγματικό
χρόνο από αισθητήρες οι οποίοι μετρούν διαφορετικές παραμέτρους όπως η
πρόσληψη φωτός ο δείκτης της φυλλικής επιφάνειας ή το φωτοσυνθετικό στρες με
μη καταστροφικό τρόπο Για την ανάπτυξη λειτουργικών DSS είναι επιτακτική
ανάγκη να αναπτυχθούν ακριβή μοντέλα και τεχνικές παρακολούθησης που μπορούν
να εφαρμόστούν στο συγκεκριμένο θερμοκηπιακό περιβάλλον
Σκοπός αυτής της διατριβής ήταν να διερευνήσει διαφορετικές τεχνικές για την
προσομοίωση και την παρακολούθηση της πρόσληψης του φωτός και της
φωτοσύνθεσης σε μια καλλιέργεια θερμοκηπιακής ντομάτας Δεδομένου ότι η
φωτοσύνθεση είναι άμεσα συνδεδεμένη με την πρόσληψη του φωτός στα πλαίσια
αυτής της μελέτης επιλέχτηκε η ανάπτυξη ενός τρισδιάστατου μοντέλου ντομάτας
που θα λαμβάνει υπόψιν του τη ρητή αρχιτεκτονική των φυτών Σε δεύτερο πλάνο
διευρήνθηκαν και αξιολογήθηκαν κάτω από τις ειδικές συνθήκες του θερμοκηπίου
διαφορετικές μεθοδολογίες για την παρακολούθηση των φυσιολογικών παραμέτρων
των φυτών σε πραγματικό χρόνο μέσω τηλεπισκόπησης
Τις τελευταίες δεκαετίες έχουν προταθεί διάφορα φυσιολογικά μοντέλα ντομάτας
όπου η βασική πρόκληση που αντιμετωπίζουν είναι η σωστή προσομοίωση της
απόδοσης της καλλιέργειας Γι αυτό μια ακριβής προσομοίωση της πρόσληψης
φωτός και συνεπώς και της φωτοσύνθεσης είναι πρωταρχικής σημασίας Προς το
παρόν τα περισσότερα μοντέλα περιλαμβάνουν απλουστεύσεις της αρχιτεκτονικής
του φυτού που θέτει σε κίνδυνο την ακρίβεια της προσομοίωσης της πρόσληψης του
Περίληψη
132
φωτός και κατά συνέπεια της φωτοσύνθεσης Στο Κεφάλαιο 21 παρουσιάζονται τα
πρώτα βήματα για την ανάπτυξη του μοντέλου Η πρόσληψη του φωτός εξαρτάται σε
μεγάλο βαθμό από τη δομή του φυλλώματος και επηρεάζεται μεταξύ άλλων από
την απόσταση μεταξύ των σειρών των φυτών την απόσταση των φυτών στο
εσωτερικό της σειράς το κλάδεμα των φύλλων και την φυτική ποικιλία Το μοντέλο
χρησιμοποιήθηκε για τη μελέτη της επίδρασης διαφόρων σεναρίων φύτευσης στην
πρόσληψη του φωτός Στη συνέχεια πραγματοποιήθηκε σύγκριση αυτών των
σεναρίων με μια καλλιέργεια με ομοιογενές φύλλωμα Πραγματοποιήθηκε επίσης
ανάλυση μετρήσεων του μήκους των φύλλων του πλάτους της γωνίας ανύψωσης και
του προσανατολισμού των φύλλων Η μέτρηση της μεταβολής της γωνίας ανύψωσης
των φύλλων πραγματοποιήθηκε για δύο ώρες της ημέρας Στη ντομάτα οι διαφορές
στο μήκος των φύλλων το πλάτος και τη γωνία ανύψωσης παρατηρήθηκαν κυρίως
στα άνω 90 εκατοστά του φυλλώματος στη ζώνη δηλαδή του φυτού που συνεχίζει να
αναπτύσσεται Αλλαγές των αρχιτεκτονικών χαρακτηριστικών του φυτού επηρεάζουν
άμεσα την πρόσληψη του φωτός από το φύλλωμα Παρ όλα αυτά ακόμη και αν η
αρχιτεκτονική δομή του φυτού παρέμενε η ίδια η πρόσληψη του φωτός θα μπορούσε
εύκολα να χειραγωγηθεί από την αλλαγή της απόστασης των γραμμών φύτευσης
επηρεάζοντας έτσι την πρόσληψη του φωτός και ενδεχομένως τη φυτική παραγωγή
Στο Κεφάλαιο 22 παρουσιάζεται η ανάπτυξη και βαθμονόμηση ενός
τρισδιάστατου μοντέλου ντομάτας Το μοντέλο χρησιμοποιήθηκε για να διερευνηθεί
η επίδραση της ετερογένειας του φυλλώματος στη δυναμική της οριζόντιας και
κάθετης κατανομής του φωτός και της φωτοσύνθεσης κάτω από συνθήκες άμεσου
και διάχυτου φωτισμού Το μοντέλο αποτελείται από τρία υπομοντέλα α) ένα
στατικό αρχιτεκτονικό μοντέλο β) ένα μοντέλο για τον υπολογισμό της πρόσληψης
του φωτός και γ) ένα μοντέλο υπολογισμού της φωτοσύνθεσης σε επίπεδο φύλλου
Διαφορετικά σενάρια για την οριζόντια και κάθετη κατανομή της πρόσληψης του
φωτός της προσπίπτουσας ακτινοβολίας και της φωτοσύνθεσης διερευνήθηκαν κάτω
από συνθήκες άμεσου και διάχετου φωτισμού Η προσομοίωση της πρόσληψης του
φωτός έδωσε μια καλή αντιστοιχία με τις μετρούμενες τιμές Η ρητή περιγραφή των
γωνιών των φύλλων οδήγησε σε υψηλότερη πρόσληψη φωτός σε σύγκριση με
μοντέλα που χρησιμοποιούν σταθερές ή ελλειψοειδείς κατανομές για την περιγραφή
των γωνιών των φύλλων αλλά η συνολική πρόσληψη φωτός παρέμεινε η ίδια Το
ποσοστό του φωτός που προσλήφθηκε ήταν υψηλότερο κατά 10 το χειμώνα και
23 το καλοκαίρι όταν ο προσανατολισμός των σειρών σποράς ήταν από βορρά προς
Περίληψη
133
νότο σε συγκρισή με αυτόν από ανατολή προς δύση Η οριζόντια κατανομή της
φωτοσύνθεσης διέφερε σημαντικά μεταξύ της κορυφής της μέσης και του
χαμηλότερου στρώματος του φυλλώματος
Η χειραγώγηση της αρχιτεκτονικής δομής του φυτού μπορεί να επηρεάσει
σημαντικά την κατανομή του φωτός στο φύλλωμα και τη φωτοσύνθεση Στο
Κεφάλαιο 23 διερευνάται η χρήση φυτικών ιδεοτύπων (ideotypes) για τη
βελτιστοποίηση της απορρόφησης του φωτός και της φωτοσύνθεσης
Χρησιμοποιώντας το μοντέλο της ντομάτας που παρουσιάστηκε στα προηγούμενα
κεφάλαια εξετάζεται ένα φάσμα διαφορετικών φυτικών αρχιτεκτονικών
χαρακτηριστικών για δύο διαφορετικές εποχές του έτους ούτως ώστε να οριστεί η
βέλτιστη αρχιτεκτονική δομή για την απορρόφηση του φωτός και την φωτοσύνθεση
Συγκεκριμένα μελετήθηκαν οι επιδράσεις της γωνίας ανύψωσης των φύλλων της
φυλλοταξίας της γωνίας των φύλλαρίων του σχήματος των φύλλων της διαρύθμισης
των φυλλάριων καθώς και του μήκους του μεσογονατίου διαστήματος Από τα
αποτελέσματα αυτής της ανάλυσης προέκυψαν δύο πιθανοί ιδεότυποι Αύξηση της
απορρόφησης του φωτός στο πάνω μέρος του φυλλώματος κατά 25 χωρίς αλλαγή
της συνολικής απορρόφησης αύξησε τη φωτοσύνθεση κατά 6 το χειμώνα και την
μείωσε κατά 7 το καλοκαίρι Η αρχική αρχιτεκτονική δομή ήταν ήδη βέλτιστη σε
σχέση με τη γωνία ανύψωσης του φύλλου τη γωνία και τη διαρύθμιση του
φυλλαρίου τόσο για την απορρόφηση του φωτός όσο και για τη φωτοσύνθεση ενώ η
φυλλόταξη δεν είχε καμία επίδραση Η αύξηση του μήκους και πλάτους των φύλλων
κατά 15 ή η αύξηση του μήκους των μεσογονατίων διαστημάτων από 7 έως 12 cm
οδήγησε σε αύξηση κατά 7 - 10 για την απορρόφηση του φωτός και τη
φωτοσύνθεση Τα πιο σημαντικά αρχιτεκτονικά χαρακτηριστικά που διαπιστώθηκαν
ήταν το μήκος του μεσογονατίου διαστήματος και το σχήμα των φύλλων που
επηρέασαν σημαντικά την κάθετη κατανομή του φωτός στο φύλλωμα Ο νέος
προτεινόμενος ιδεότυπος με πιο ανοιχτό φύλλωμα λόγω αύξησης των μεσογονάτιων
διαστημάτων και μακριών και λεπτών φύλλων οδήγησε σε αύξηση της
φωτοσύνθεσης μέχρι και 10
Στο Κεφάλαιο 31 μελετήθηκαν τρόποι για παρακολούθηση on-line της φυλλικής
επιφάνειας και της πρόσληψης του φωτός μέσω μετρήσεων ανάκλασης Η φυλλική
επιφάνεια και η πρόσληψη του φωτός μετρήθηκαν την ίδια στιγμή με την ανάκλαση
σε έξι διαφορετικά μήκη κύματος σε διάφορα στάδια της ανάπτυξής φυτών ντομάτας
και πιπεριάς και υπολογίστηκε ο Νormalized Difference Δείκτης Βλάστησης (NDVI)
Περίληψη
134
Οι σχέσεις μεταξύ των μετρούμενων παραμέτρων που βρέθηκαν στις αρχικές
μετρήσεις σε πειραματικά θερμοκήπια στη συνέχεια εξετάστηκαν για την ακρίβεια
τους και σε εμπορικά θερμοκήπια Την καλύτερη σχέση για την εκτίμηση της
φυλλικής επιφάνειας και της πρόσληψης του φωτός έδωσε η ανάκλαση στα 460nm
και για τις δύο καλλιέργειες Η σχέση αυτή επικυρώθηκε και από τα αποτελέσματα
των μετρήσεων από τα εμπορικά θερμοκήπια Αποκλίσεις των αποτελεσμάτων
μεταξύ των εμπορικών και των πειραματικών θερμοκηπίων οφείλονται στο ιδιαίτερο
περιβάλλον του θερμοκηπίου όπου η ανάκλαση μπορεί να προέρχεται επίσης από τα
κατασκευαστικά μέρη του θερμοκηπίου Η σχέση μεταξύ της ανάκλασης στα 460 nm
τον δείκτη φυλλικής επιφάνειας και της πρόσληψης του φωτός μπορεί να αποτελέσει
ένα καλό εργαλείο για την σε πραγματικό χρόνο παρακολούθηση των καλλιεργειών
σε συνθήκες θερμοκηπίου Επιπλέον εάν οι πληροφορίες από τους αισθητήρες
ανάκλασης χρησιμοποιηθούν απευθείας απο τα φυτικά μοντέλα θα άνοιξουν νέες
προοπτικές στα συστήματα υποστήριξης αποφάσεων στην παραγωγή του
θερμοκηπίου
Το φωτοσυνθετικό στρες που προκαλείται από στέρηση νερού στα φυτά
επηρεάζει έναν αριθμό φυσιολογικών διεργασιών όπως ο φωτοσυνθετικός ρυθμός η
στοματική αγωγιμότητα καθώς και η λειτουργική απόδοση του PSII και της μη-
φωτοχημικής απόσβεση(NPQ) O Φωτοχημικός Δείκτης Ανάκλασης (PRI) φέρεται να
είναι ευαίσθητος στις μεταβολές του κύκλου της ξανθοφύλλης που συμβαίνουν κατά
τη διάρκεια του στρες και θα μπορούσε ενδεχομένως να χρησιμοποιηθεί για την
παρακολούθηση των αλλαγών στις φυσιολογικές παραμέτρους που αναφέρθηκαν
παραπάνω Στο Κεφάλαιο 32 αξιολογείται η χρήση του PRI ως μια πρώιμη ένδειξη
φωτοσυνθετικού στρες Για τους σκοπούς αυτής της έρευνας υδατικό στρες
εφαρμόστηκε σε μια καλλιέργεια ντομάτας Κατά τη διάρκεια του πειράματος
μετρήθηκαν η πρόσληψη του CO2 η στοματική αγωγιμότητα ο φθορισμός κάτω από
σθνθήκες φωτός ή μη καθώς και το PRI και η σχετική περιεκτικότητα σε νερό του
ριζώματος επί τοις Οι ίδιες μετρήσεις διεξήχθησαν επίσης σε καλά ποτισμένα
φυτά που ενήργησαν ως σημείο αναφοράς Το πείραμα επαναλήφθηκε τέσσερις
διαδοχικές εβδομάδες Τα αποτελέσματα έδειξαν ότι το PRI μπορεί να
χρησιμοποιηθεί ως μια πρώιμη ένδειξη στρες μόνο όταν η ένταση του φωτός ήταν
πάνω από 700μmol m-2 s-1 Σε χαμηλότερες τιμές της έντασης του φωτός η σχέση
του PRI με τη σχετική περιεκτικότητα σε νερό του ριζώματος επί τοις ήταν φτωχή
σε σύγκριση με τη φωτοσύνθεση ή το φθορισμό με τις οποίες έδειξαν υψηλή
Περίληψη
135
συσχέτιση Για το λόγο αυτό μπορούμε να συμπεράνουμε ότι η χρήση του PRI σαν
δείκτης φυτικού στρες δεν μπορεί να είναι ανεξάρτητη από τις συνθήκες φωτισμού
του περιβάλλοντος και η χρήση του μπορεί να έχει νόημα μόνο σε συνθήκες υψηλού
φωτός
Τέλος το Κεφάλαιο 4 συζητιούνται τα κύρια επιτεύγματα και οι περιορισμούς της
μελέτης αυτής και προτείνονται κατευθύνσεις για μελλοντική έρευνα
Acknowledgments
137
Acknowledgements The PhD thesis is a road with a lot of twists and turns that is impossible to
complete without the input of many people that are all important in their different and
unique way So at this part of the thesis I would like to thank everyone that was there
for me all these years and gave me the strength and support I needed to reach the end
of the road
First of all I would like to thank my promotor and main supervisor prof dr Leo
FM Marcelis for his patience understanding and the fact that he never gave up hope
on my thesis even when the direction was not clear for me Although we did not
always agree I want you to know that I appreciate and always will be grateful for all
your efforts during these years
I would also like to thank my co-promotor prof dr Olaf van Kooten for being a
source of constant support Meetings with you however brief always made me feel
confident with my research and ready to solve any problems ahead
I would like to thank my daily supervisor dr Pieter de Visser foremost for being
the first to teach me about modelling and the fun it can be I much enjoyed all
discussions with you
To my former roommates Bram Julienne Didi Fleur Roberta Andreas and
Pavlos thanks for creating a playground environment for me to work into To Didi
special thanks for all the conversations especially the non scientific ones as they
helped me to relax and go back to work with more energy
I would like to thank my good friend and colleague Gerhard Buck-Sorlin who with
his constant support and faith in my helped me a lot at the final stages of this thesis
Gerhard our talks were literately out of this earth
To all current and former members of the Greenhouse Horticulture thank you for
making me feel like home while at work Time spent with you was always
stimulating Anja thank you for all the good advise you gave me during the years
Steven the collaboration with you was more than productive it was fun To current
and former colleagues of Horticulture Supply Chains Group thank you for the nice
times I had with you at all the outings together I especially appreciated the challenges
to give or attending presentations in your group Also to the members of the FLOP
meeting thank you for all the nice conversations and the good and creative criticism
Acknowledgments
138
on all my writing efforts To the members of the VPN group a big thank you for the
initiating me to the fun of 3D modelling although I did not manage to participate as
much I wanted
To all people that helped me with my experiments during the years I would like to
say a big thank you Especially to Esther that showed me the importance of being
methodical to Johan and Dick from whom I learned a lot about dutch culture and
some not always polite dutch words
I would also like to thank all the numerous friends I made in Wageningen for
making my stay here more pleasant In particular I would like to thank Dimitrios for
introducing me to everyone to Pavlos and Andreas for creating a greek buble inside
the office Niovi and Ioannis for their frendship Yiannis thank you for all those
escapes from the PhD reality when I most needed it and for your constant
encouragement and good advice
Last but not least I would like to thank my parents and brother for never
questioning always trusting always hoping always supporting Thank you for
making me what I am in life today I would have never made it without you
Curriculum vitae
139
Curriculum vitae Vaia Sarlikioti was born on 19th of May 1981 in Amarousio Attikis Greece She
attended secondary school at the 1st Lyceum in Palaio Phaliro where she received her
diploma in 1999 At the same year she started her studies in University of Thessaly
School of Agricultural Sciences Department of Agriculture Crop Production and
Rural Environment where she obtained her Bachelor degree in 2004 and graduating
first of her year In 2004 she started her Msc studies in the Master program of
Agricultural Engineering and Management of Natural Resources were she graduated
in 2006 In May 2006 she started her PhD project in Wageningen University the
Netherlands after receiving a scholarship from the Greek Scholarships Foundation
that focused on modelling and monitoring of canopy light interception and plant stress
in greenhouse crops The project was executed at the institute Wageningen UR
Greenhouse Horticulture and at the Horticultural Supply Chains group of Wageningen
University Since April 2011 Vaia works as a post-doc in INRA Avignon France
List of publications
140
List of publications
Peer-reviewed publications
Buck-Sorlin G de Visser PHB Henke M Sarlikioti V van der Heijden GWAM
Marcelis LFM Vos J 2011 Towards a functional-structural plant model of
cut-rose - simulation of light environment light absorption photosynthesis
and interferences with the plant structure Annals of Botany in press
Sarlikioti V de Visser PHB Buck-Sorlin GH Marcelis LFM How plant
architecture affects light absorption and photosynthesis in tomato Towards an
ideotype for plant architecture using a functional-structural plant model
Submitted (Chapter 23)
Sarlikioti V de Visser PHB Marcelis LFM 2011 Exploring the spatial
distribution of light interception and photosynthesis of canopies by means of a
functional-structural plant model Annals of Botany 107875-883 (Chapter
22)
Sarlikioti V Meinen E Marcelis LFM 2011 Crop reflectance as a tool for
the online monitoring of LAI and PAR interception in two different
greenhouse crops Biosystems Engineering 108 113-120 (Chapter 31)
Sarlikioti V Driever SM Marcelis LFM 2010 Photochemical reflectance
index as a mean of monitoring early water stress Annals of Applied Biology
157 81-89 (Chapter 32)
Conference proceeding and reports
Sarlikioti V de Visser PHB Marcelis LFM 2011 Towards a 3D structural
tomato model for calculating light interception Acta Horticulturae 893721-
728 (Chapter 21)
Janssen HJJ Sarlikioti V Gieling ThH Meurs EJJ Marcelis LFM Van
Dugteren JR 2008 A prototype sensor for estimating light interception by
plants in a greenhouse Acta Horticulturae 801 621-627
Dueck TA Nederhoff EM Nieboer S Scheffers CP Steenhuizen JW
Chizhmak S Uenk D Sarlikioti V de Visser PHB 2010 Verbetering van
List of Publications
141
de lichtonderschepping in een tomatengewas door aanpassing van de rijstructuur
Effecten van de rijstructuur op lichtverdeling fotosynthese en productie 44pp
Rapport GTB-1029 Wageningen UR
PEampRC PhD Education Certificate
With the educational activities listed below the PhD candidate has complied with the educational requirements set by the CT de Wit Graduate School for Production Ecology and Resource Conservation (PEampRC) which comprises of a minimum total of 32 ECTS (= 22 weeks of activities)
Review of literature (45 ECTS)
- Modelling and remote sensing of canopy light interception and plant stress in greenhouses
Writing of project proposal (45 ECTS)
- Modelling and remote sensing of canopy light interception and plant stress in greenhouses
Post-graduate courses (6 ECTS)
- Basic and advanced statistics PEampRC (2007-2008) - The art of modelling PEampRC (2008)
Invited review of (unpublished) journal (2 ECTS)
- Annals of botany 3D modelling (2010) - Journal of horticultural science photosynthesis and biomass production (2011)
Deficiency refresh brush-up courses (105 ECTS)
- Greenhouse technology (2008) - Crop ecology (2009)
Competence strengthening skills courses (3 ECTS)
- The art of writing WGS (2007) - Techniques of writing and presenting a scientific paper WGS (2007)
PEampRC Annual meetings seminars and the PEampRC weekend (18 ECTS) - PEampRC Weekend (2008) - PEampRC Day (2007) - PEampRC Day (2008) - PEampRC Day (2009)
Discussion groups local seminars other scientific meetings (6 ECTS) - Frontier Literature in Plant Physiology (FLOP)
International symposia workshops and conferences (75 ECTS) - Hortimodel Wageningen the Netherlands (2006) - Greensys Quebec Canada (2009) - Greensys Halkidiki Greece
Funding Vaia Sarlikioti received a grant from the Greek State Scholarship Foundation for
conducting the research described in this thesis Additionally the research was
supported by Powerhouse
Financial support for the printing of this thesis by Wageningen Univerisity is
gratefully acknowledged
- Chapter 1
- General Introduction
- Chapter 2 Modelling PAR interception and photosynthesis
-
- Chapter 21
- Towards a 3D structural tomato model for calculating light interception
- Chapter 22
- Exploring the spatial distribution of canopy light interception and leaf photosynthesis by means of a functional structural model
- Chapter 23
- Searching for the ideal plant structure with a functional-structural plant model How plant architecture affects light absorption and photosynthesis in tomato
-
- Abstract
- Introduction
- Material and methods
- Model description
- Architectural module
- Photosynthesis module
- Case studies
- Vertical light distribution scenario
- Leaf elevation angle
- Leaf phyllotaxis
- Leaflet angle
- Leaf shape
- Leaflet arrangement on a leaf
- Internode length
- Ideotyping scenarios
- Results
- Vertical light distribution scenario
- Leaf elevation angle
- Leaf phyllotaxis
- Leaflet angle
- Leaf shape
- Leaflet arrangement
- Internode length
- Ideotyping scenarios
- Discussion
- Chapter 3 Monitoring PAR interception and photosynthetic stress
-
- Chapter 31
- Crop Reflectance as a Tool for Online Monitoring Of LAI and PAR Interception in Two Different Greenhouse Crops
- Chapter 32
- Photochemical reflectance index as a mean of monitoring early photosynthetic stress
-
- Chapter 4
- General discussion
- References
- Summary
- Samenvatting
- Περίληψη
- Acknowledgements
- Curriculum vitae
- List of publications
- PEampRC PhD Education Certificate
-
- PEampRC Annual meetings seminars and the PEampRC weekend (18 ECTS)
- Discussion groups local seminars other scientific meetings (6 ECTS)
- International symposia workshops and conferences (75 ECTS)
-

ii
Thesis committee
Thesis supervisors
Prof dr ir LFM Marcelis
Professor of Crop Production in Low-energy Greenhouses Wageningen Univeristy
Prof dr O Van Kooten
Professor of Horticultural Supply Chains Wageningen Univeristy
Thesis co-supervisor
Dr PHB de Visser
Researcher Wageningen UR Greenhouse Horticulture
Other members
Prof dr ir EJ van Henten Wageningen University
Dr ir J Vos Wageningen University
Prof dr C Kittas University of Thessaly Greece
Prof dr H Stuumltzel Leibniz University Hannover Germany
This research was conducted under the auspices of the CT de Wit Graduate School
for Production Ecology and Resource Conservation
iii
Modelling and Remote Sensing of Canopy Light
Interception and Plant Stress in Greenhouses
Vaia Sarlikioti
Thesis
submitted in fulfilment of the requirements for the degree of doctor
at Wageningen University
by the authority of the Rector Magnificus
Prof dr MJ Kropff
in the presence of the
Thesis Committee appointed by the Academic Board
to be defended in public
on Monday 10 October 2011
at 400 pm in the Aula
iv
Vaia Sarlikioti
Modelling and Remote Sensing of Canopy Light Interception and Plant Stress in
Greenhouses
Thesis Wageningen University Wageningen NL (2011)
With references with summaries in English Dutch and Greek
ISBN 978-94-6173-005-3
v
vi
Table of contents
vii
Table of contents
Chapter 1 General Introduction ________________________________________ 1
Chapter 2 Modelling PAR interception and photosynthesis __________________ 9
Chapter 21 Towards a 3D structural tomato model for calculating light interception 9
Chapter 22 Exploring the spatial distribution of canopy light interception and leaf
photosynthesis by means of a functional structural model _____________________ 21
Chapter 23 Searching for the ideal plant structure with a functional-structural plant
model How plant architecture affects light absorption and photosynthesis in
tomato _____________________________________________________________________ 42
Chapter 3 Monitoring PAR interception and photosynthetic stress __________ 62
Chapter 31 Crop Reflectance as a Tool for Online Monitoring Of LAI and PAR
Interception in Two Different Greenhouse Crops _____________________________ 62
Chapter 32 Photochemical reflectance index as a mean of monitoring early
photosynthetic stress _______________________________________________________ 78
Chapter 4 General discussion _________________________________________ 95
References ________________________________________________________ 103
Summary _________________________________________________________ 119
Samenvatting ______________________________________________________ 125
Περίληψη _________________________________________________________ 131
Acknowledgements _________________________________________________ 137
Curriculum vitae ___________________________________________________ 139
List of publications _________________________________________________ 140
Chapter 1
General Introduction
Chapter 1 General Introduction
2
Greenhouse horticulture development towards full control
A greenhouse crop can be approached as an open system that can be affected by a
number of parameters such as light climate or nutrient supply The last decades
efforts have been made to understand the function of this system and the interaction of
the different parameters The intensive nature of greenhouse cultivation as such gives
an impetus for the development of decision support systems (DSS) to help the
growers in managing their farm efficiently The foundations of DSS are plant models
(Marcelis et al 2000) Although many models have been proposed during the past
decades their lack in accuracy makes it useless to integrate them yet in day- by- day
decision making for the farm management Accuracy in models can be achieved either
by improving modelling assumptions as such like incorporating the explicit plant
structure instead of using a layer approach when dealing with plant canopy or by
improving the online feed of information to the model by coupling models with remote
sensor data that are taken in real time Since remote sensing is not yet widely used in the
greenhouse a way to incorporate remote sensing in the greenhouse environment should
first be investigated In the following subchapters these two approaches are explicitly
described
Plant modelling
Physiological plant models have become an integrated tool of plant science
research These models describe at different degrees of complexity plant
physiological processes that set light to our understanding of plant functioning and
help us develop new cultivation strategies (Fourcaud et al 2008) A number of
physiological plant models have been proposed during the years (eg Gary et al
1995 Marcelis et al 1998 Heuvelink 1999 Boote and Scholberg 2006) These
models offer an accurate description of plant growth and its interactions with the
environment providing a useful tool in our understanding of plant functioning
Although they make a distinction between different plant organs they do not consider
the plant structure in space Especially functions like light interception environmental
plant adaptation competition within and between species for light or nutrients and
assimilate allocations cannot be easily explained if plant structure in space is not taken
into account
Chapter 1 General Introduction
3
Modelling light interception and photosynthesis
In most process based models leaf area is one of the most important crop
properties which have a strong physiological impact on plant functioning through light
interception and thus photosynthesis In current models leaf area index (LAI) is input as
a single value for the total of the crop canopy This approach although it gives a good
general estimation of light absorption and photosynthesis fails to capture the effect of
the vertical light distribution in the canopy This light distribution is affected by canopy
architecture and its inclusion in the models gives us the necessary accuracy for the day
to day management of the crop
Functional-structural plant models (FSPM) or virtual plant models
(Hanan1997 Sievaumlnen et al 2000 Godin and Sinoquet 2005 Vos et al 2007) are
terms used to refer to models explicitly describing the development in time of the 3D
architecture or structure of plants as driven by physiological processes These
physiological processes are the result of environmental factors Functional-structural
plant models were proposed in the last decade as a means to investigate the function
of plant structure in plant development combining traditional plant modelling with a
3D structure (Vos et al 2007)
Modelling light interception and photosynthesis in a tomato crop
The tomato crop is of high economic importance and one of the most
important horticultural crops Because of the intensity of greenhouse cultivation in the
Netherlands optimum cultivation practices as well as genotypes with specific
characteristics for this type of cultivation are used Since experimentation is quite time
consuming and cost money 3D models can become a central tool in searching the
ideal crop type and management support when it comes to light interception and
photosynthesis Tomato cultivation is using a high-wire system were the plants are
planted in double rows Such a system is intended to optimize the light distribution in
the canopy However a high heterogeneity in the plant canopy still occurs and that
can have an impact on the local light distribution inside the canopy A 3D model can
accurately calculate the vertical as well as the horizontal light and photosynthetic
distribution inside the canopy Also a 3D model can be used to provide answers to
important questions as to which plant architectural characteristics such as leaf size
and shape leaf elevation angle leaf orientation internode length or leaf spatial
distribution would give optimal results when it comes to light interception and canopy
Chapter 1 General Introduction
4
photosynthesis The same answers can be given for cultivation practices such as row
spacing
Online monitoring with sensors
When light reaches a surface a part is absorbed a part is transmitted and a part is
reflected depending on the optical properties of the surface The fraction of light
reflected by a surface can be detected with sensors In plants reflection can be related
to the light emitted during different physiological processes or to morphological
parameters
In the past optical remote sensing has been developed and used for the online
monitoring of parameters such as chlorophyll and nitrogen content plant stress etc in
field grown crops for example in wheat (Gitelson et al 2002) potato (Jongschaap
2006) sugar beets (Clevers 1997) miscanthous (Vargas et al 2002) and rice (Tian et
al 2005) Remote sensing is defined as lsquothe small or large-scale acquisition of
information of an object or phenomenon by the use of either recording or real-time
sensing devices that is not in physical or intimate contact with the object (Lintz amp
Simonett 1976) Remote sensing can be either at close range where the observations
are taken either by sensors positioned on the ground close to the object or long range
where information are gathered by planes or satellites
Attempts to measure leaf area index (LAI) and Photosynthetically Active Radiation
(PAR) interception with the use of remote sensing have been successful in field crops
Different approaches have been used for the data collection with sensors either on
short range (ground) or far range (low flights or satellites) (Bouman et al 1992
Clevers 1997) Efforts in the field to use reflectance measurements for the estimation
of the canopy nitrogen content biomass and photosynthesis in wheat (Gitelson et al
2002) potato (Jongschaap 2006) sugar beets (Clevers 1997) miscanthus (Vargas et
al 2002) and rice (Tian et al 2005) resulted in positive correlations
Many studies aimed at determining combinations of reflectance of different
wavelengths for correcting the effect of disturbing factors (such as old leaves and soil
background) on the relationship between crop reflectance and crop characteristics
such as LAI These combinations of the reflectance at different wavelength bands are
known as vegetation indices (VIrsquos) Vegetation indices are quantitative measures that
are used in an attempt to measure vegetation abundance or vigor (Wang et al 2005)
Chapter 1 General Introduction
5
Some of the vegetation indices proposed during the years are the Weighted
Difference Vegetation Index (WDVI) (Bouman et al 1992) the infrared red (IRR)
ratio and the red edge leaf effect with the most commonly used the simple ratio (SR)
and the Normal Difference Vegetation Index (NVDI) (Wang et al 2005) SR and
NDVI are based on ratios of red (R) to near-infrared (NIR) reflectance where SR=
NIRR and NDVI= (NIRminusR) (NIR+R) R and NIR ratio-based indices are strongly
rooted in the contrasting response of R and NIR reflectance to increases in LAI (Chen
et al 2002)
The core characteristics of remote sensing ie non destructive measurements and
real time plant monitoring indicate it as a highly desirable application for the
greenhouse industry Though remote sensing has been applied quite successfully in
the open field it has hardly been tested in protected cultivations Open-field methods
cannot be directly transported to greenhouses due to complicating conditions such as
existence of greenhouse structure and ground covering with white plastic In this thesis
the conditions under which remote sensing can be applied for plant monitoring inside a
greenhouse will be investigated
New technological advancements in the accuracy of reflectance detection have
led to linking specific wavelengths with specific plant physiological functions In that
respect one of the interesting applications of crop remote sensing is the monitoring of
photosynthetic stress The so-called photochemical reflectance index (PRI = (R531 minus
R570)(R531 + R570) where R531 and R570 are reflectance signals at 531 and 570 nm
respectively has been used to monitor dynamic changes in photosynthesis under
different stress factors (Evain et al 2004) PRI provides a quick and non-destructive
assessment on photosynthesis-related physiological properties of the leaf and canopy
(Penũelas et al 1994 Meacutethy et al 1999 Evain et al 2004 Weng et al 2006) for a
wide range of species (Gamon et al 1997 Guo amp Trotter 2004) One of the
processes that induce photosynthetic stress is the limited water uptake from the soil
Water stress affects the sufficient opening of stomata and consequently
photosynthetic rate starts to decrease as well as the quantum yield of photosystem II
(Chaves et al 2002) As a result of a decreased rate of CO2 assimilation light energy
absorbed by the leaf cannot be used to drive photosynthetic electron transport and a
part of this energy is dissipated as heat increasing the non-photochemical quenching
(Krause and Weis 1991 Baker and Rosenqvist 2004) Therefore water stress can be
defined as the loss of plant photosynthetic activity as a result of water deprivation
Chapter 1 General Introduction
6
PRI can be used as an easy and effective way of online monitoring photosynthetic
stress Nowadays that the production of tomato fruits in greenhouses is a highly
intensive agricultural industry where the cost profit limit is marginal and efficient use
of resources is vital such a timely prediction of plant stress is especially important
and such a solution worth investigating
Key objectives
The general objective of this thesis is to develop an accurate 3D model for light
interception and photosynthesis simulations and to develop methods for an online
monitor of these physiological properties by means of remote sensing
The individual aims as they are presented in this thesis are
bull Development of a functional structural model simulating the light distribution
in a row crop for diffuse and direct light
bull Understanding the role of different plant architectural components in vertical
light distribution and define an optimum plant canopy
bull Developing a procedure to estimate the leaf area index and light interception
for greenhouse grown row crops based on reflectance measurements
bull Developing a procedure to estimate photosynthetic stress in crops based on
reflectance changes at 531nm
Thesis outline
In CHAPTER 1 of this thesis a general description of the problem as well as the
general objective are presented
CHAPTER 21 is presenting a first description of the 3D model The effect of row
spacing on light interception is also investigated
CHAPTER 22 presents in detail the 3D tomato model In the chapter the
development of the model is described and it is used for the exploration of the spatial
light distribution and photosynthesis In this chapter the effect using an explicit 3D
model versus the common modelling approaches for light interception and
photosynthesis is addressed
CHAPTER 23 the effect of plant architectural parameters on light interception
and photosynthesis is explored Sensitivity analysis is performed for leaf azimuth
angle (phyllotaxis) leaf elevation angle leaflet angle leaf length leaf shape leaf
Chapter 1 General Introduction
7
thickness as well as internode length for the impact of their change to both light
interception and photosynthesis Two different architectural ideotypes are proposed
based on the results of the analysis
In CHAPTER 31 a way of online monitoring of light interception and Leaf Area
Index is explored Reflectance in a number of different wavelength bands as well as
NDVI is tested and the best predictor is picked for tomato and sweet pepper crops
In CHAPTER 32 the use of photochemical reflectance index (PRI) as an
indicator of early water stress is presented In that chapter water stress is described as
a function of photosynthetic reduction and the capability of PRI to act as an early
water stress indicator is debated
In CHAPTER 4 the results of this thesis are summarized and put into a more
general context The shortcomings of the methods used as well as the further steps in
this research are discussed
Chapter 2 Modelling PAR interception and photosynthesis
Chapter 21
Towards a 3D structural tomato model for calculating light interception
Published as
Sarlikioti V de Visser PHB Marcelis LFM 2011 Towards a 3D structural
tomato model for calculating light interception Acta Horticulturae 893721-728
Chapter 21 Effect of cultivation strategies on light interception
10
Abstract
A number of physiological tomato models have been proposed the last
decades their main challenge being the correct simulation of fruit yield For this an
accurate simulation of light interception and thus photosynthesis is of primary
importance Light interception is highly dependent of the canopy structure which is
affected amongst others by distance between plant rows distance of plants within the
row leaf pruning and crop variety In order to simulate these processes a functional
structural tomato model for the simulation of light interception on an individual leaf
basis is proposed The 3D model was constructed using L-systems formalism For the
architectural part of the model manual measurements of leaf length width angle of
the leaf main stem to plant stem and leaf orientation were conducted Diurnal pattern
of leaf orientation was also tested The architectural model was coupled with a nested
radiosity model for light calculation Area per individual leaflet served as input of the
light module for calculation of reflection absorption and transmission of light The
model was used to test different crop planting scenarios on their effect on light
interception Results were then compared with light simulation for a totally
homogeneous canopy
Chapter 21 Effect of cultivation strategies on light interception
11
Introduction
A number of tomato models have been proposed during the years (eg Gary et al
1995 Marcelis et al 1998 Heuvelink 1999 Boote and Scholberg 2006) These
models offer an accurate description of plant growth and its interactions with the
environment providing a useful tool in our understanding of plant functioning
Although they make a distinction between different plant organs they do not consider
the plant structure in space Especially functions like light interception environmental
plant adaptation competition within and between species for light or nutrients and
assimilate allocations can not be easily explained if plant structure in space is not
taken into account
Functional-structural plant models (FSPM) or virtual plant models (Hanan1997
Sievaumlnen et al 2000 Godin and Sinoquet 2005 Vos et al 2007) are terms used to
refer to models explicitly describing the development in time of the 3D architecture or
structure of plants as driven by physiological processes These physiological
processes are the result of environmental factors Functional-structural plant models
were proposed the last decade as a mean to investigate the function of plant structure
in plant development combining traditional plant modeling with a 3D structure (Evers
et al 2005 Buck-Sorlin et al 2011) For light extinction in particular the knowledge
of how the plant develops in space is essential So the use of such a model for light
calculations would probably improve our knowledge of light distribution inside the
crop canopy
Light extinction inside a plant canopy can reach up to 60 while for a crop
canopy the light extinction can be up to 90 (Valladares 2003) This variation in
incident light availability inside the crop canopy induces extensive structural and
physiological modifications Light variation has also a big effect in plant
photosynthetic capacity (Amax) which typically decreases two- to four times from top
to the bottom of the canopy (Meir et al 2002)
The aim of this study was to explore the structural variations inside the tomato
plant canopy and use this to develop a structural plant model for tomato Furthermore
with the use of a structural plant model different plant spacing scenarios and their
effect on light distribution inside the canopy were tested
Chapter 21 Effect of cultivation strategies on light interception
12
Materials and Methods
Plant measurements
Experimental set-up
The experiment was carried out in a high-wired tomato cv Aranca crop in a
glasshouse of Improvement Center (52˚N Bleiswijk the Netherlands) Plants were
planted in the greenhouse at the end of January The rows in the greenhouse were
northeast- southwest oriented Two rows of plants were planted in each gully The
distance between the two rows of one gully was 50 cm the path width was 110 cm
and the distance between 2 plants on the same row was 053 m Plant height was 260
m The plants were grown on rockwool (Grodan type Expert) The greenhouse air
was enriched with pure CO2 at 400 ppm during day time The lowest leaves were
removed every week and plants were lowered such that plant height remained the
same throughout the experiment
Structural plant measurements
For a complete picture of plant development detailed measurements of the 3D
stem and leaf curvature were manually performed on 3 plants every other week
Measurements were performed for six weeks from 2 of July to 13 of August 2008 A
protractor and a ruler were used for the measurements The measurements included
leaf elevation angle leaf length leaf width and leaf orientation In our experiment we
defined leaf elevation angle as the angle of leaf petiole to the horizontal where it is
attached to the stem (Boonen et al 2002) The rosette at the top of the plants with
leaves smaller than 2 cm was considered as first node Digitization of the plants was
attempted with the use of a Fastrak 3D digitizer (Polhemus Inc Colchester VT USA)
but was not always possible This was probably due to a powerful disturbance of the
magnetic field of the digitizer due to metallic parts (heating pipes) positioned inside
the canopy
The plant was divided in three zones (upper middle and lower zone) and the
above mentioned structural plant characteristics were measured Every zone had a
length of 90 cm except the lowest one that had a length of 80 cm Measurements were
carried out weekly on 3 randomly picked leaves per zone in 13 replicate plants
Tomato composite leaf consists of a large terminal leaflet and up to 8 lateral
leaflets which can also be compounded Many smaller leaflets or folioles may be
interspersed between the larger leaflets depending on the cultivar (Atherton and
Chapter 21 Effect of cultivation strategies on light interception
13
Rudich 1986) In our cultivar the leaf was composed of a big terminal leaflet 3 pairs
of larger leaflets and two pairs of smaller leaflets alternately placed Measurements of
angles of all leaflets for 10 randomly selected leaves in each plant level were taken in
order to determine a relationship between leaflet angle and leaflet position in the leaf
Leaflet angle was defined as the angle between the leaflet petiole and the leaf petiole
Given that the angle of leaves to the horizontal directly affects the flux of solar
radiation per unit area (Falster and Westoby 2003) measurements to establish the
diurnal pattern of the leaf elevation angles were also made Leaf elevation angles of
15 plants were measured early in the morning (0900 hours) and in the afternoon
(1500 hours)
Light measurements
Incident light was measured with the use of Sunscan (Delta-T UK) The sensor
was positioned perpendicular to the plant row Measurements were taken every 25cm
from the top of the canopy in 8 different spots in the greenhouse
Model description
The model consisted of two modules
bull Structural module In this module the spatial development of the plant
was described in terms of symbols according to L-systems formalism
(Lindenmayer and Prusinkiewicz 1990) The plant was structured as a number
of phytomers in deferent developmental stages A phytomer is defined as the
basic structural unit which for our model consisted of an internode and a
composite leaf Relationships of leaf elevation angle to node number leaf
length to node number and leaf width to node number as well as leaflet area to
leaf area and leaflet angle to petiole node number were determined by
regression analysis These relationships where used as input for the
development of the structural part of the model Leaflets were represented
with rectangular shapes in the model in an approximation of their real shape
Plant and row spacing also served as an input The basic simulation unit of the
model included 20 plants (5 plants per row 4 rows)
bull Light module A nested radiosity model (CARIBU) developed by
Chelle and Andrieu (1998) was used for light calculations The module
Chapter 21 Effect of cultivation strategies on light interception
14
calculates light absorbance on the leaflet level Multiple light scattering on
leafs surface was taken into account for light calculations The model assumed
an infinite plant canopy for the calculations (infinite canopy was achieved by
multiplying the basic simulation unit into space) Reflectance and
transmittance parameters for the upper and lower side of the leaf were input in
the model Output values of light interception were given in leaflet as well as
leaf level Model calculation assumed diffuse light conditions Forty three
virtual light sources were symmetrically arranged around the crop in order to
achieve these conditions
A more detailed description of the model is provided in chapter 22
Lambert- Beer
In many crop models Lambert- Beers law (Monsi and Saeki 1953) is used for the
simulation of PAR interception According to the law in a uniform infinite randomly
distributed canopy of absorbing leaves it can be shown that the amount of
photosynthetically active radiation intercepted (I) by a crop can be given by the
following equation
I= (1-ρ)I0(1-e-kL)100
where ρ stands for canopy reflection coefficient I0 is the radiation level at zero
canopy depth L the leaf area index of the canopy and k is the light extinction
coefficient Extinction coefficient was set to 065 as reported by Papadopoulos and
Pararajasingham 1997) and confirmed by our own measurements (data not shown)
Statistical analysis
Statistical analysis was performed with Genstat 11 software (VSN International
Ltd Herts UK) Differences of leaf elevation angle length and width between three
plant heights were tested with Linear Mixed Model (REML) Leaf elevation angles
were compared between morning and afternoon with General Linear Models repeated
measurement analysis Curves for leaflet angle to leaf petiole and for light
interception to LAI were fitted with Regression Analysis Goodness of fit was
estimated by coefficient of determination (R2) Statistical differences between curves
was tested by testing the statistical differences between the coefficients of the
regression curves P was 005
Chapter 21 Effect of cultivation strategies on light interception
15
Results and Discussion
Structural characteristics of tomato leaves were monitored at three different depths
in the canopy (Fig 211) In the upper part of the plant leaves had on average a
slightly positive angle to the horizontal while leaves in the middle and lower part of
the canopy showed a negative angle to the horizontal The negative value of -25o
found in our experiment correspond to the mean value used in the tomato model of
Higashide (2009) Length and width were smallest in the top part of the canopy as
these leaves were not yet full-grown There was no statistically significant difference
in leaf size between middle and lower part of the canopy
Fig 211 Structural measurements for three different depths in a tomato canopy
Mean values of leaf elevation angle to the horizontal (A) leaf length (B) and leaf
width (C) are presented for the three different canopy depths as well as the relation
between leaflet angle to leaf petiole and leaflet position (1 is most proximal leaflet
to the stem) for top () middle () and lower leaves () (D) Error bars represent
se of the mean Data are averages of 5 weeks 13 plants per week Data for graph
D are averages of 10 leafs per canopy level
Chapter 21 Effect of cultivation strategies on light interception
16
Leaflet angles diminished from a maximum of 40o for the most distal leaflet to 0o
for the most proximal leaflet (Fig 211D) Leaflet angle showed no statistically
significant differences between the three different canopy levels implying that the
leafletsrsquo angle is in fact an internal characteristic of the plant and dependent only on
the position of the leaflet on the leaf
Leaf elevation angle differed significantly between morning and afternoon only
for the upper leaves (average leaf elevation angles were -31o and -76o for morning
and afternoon subsequently) (Fig 212) A diurnal pattern was not observed at the
middle and lower leaves Forseth (1990) observed no diurnal changes in leaf elevation
angles to the horizontal of a number of species (for example cotton beans Solanum)
but he did find significant changes of the plant angle to the azimuth He also linked
this azimuth movement to an increase in light interception and a proportional increase
of productivity Although Forseth does not differentiate leaf elevation angle behavior
between different canopy depths his work is an indication that measurements of only
leaf elevation angle to the horizontal is not adequate to conclude about a diurnal
pattern on tomato leafs Leaf elevation angle changes can also be linked to turgor loss
of plant cells due to daily transpiration So further research is needed as for the causes
of this behavior on upper tomato leafs
-40
-20
0
20
40
-40 -20 0 20 40Leaf angle (o) at 900
Leaf
ang
le (o ) a
t 15
00
Fig 212 Comparison of leaf elevation angle (angle to the horizontal) in the morning
(0900hours) and afternoon (1500hours) at three different heights of the canopy
Symbols diams loz and x refer to upper middle and lower part of the plant
consequently The line is 11
Chapter 21 Effect of cultivation strategies on light interception
17
The above described structural measurements were used to develop a structural
tomato model The accuracy of the model was tested against measured values In
general the difference of the measured values versus the calculated values was of 4
with a maximum difference of 10 at the lowest point The model was used to test
three different crop planting scenarios and compare them to results of Lambert- Beer
equation which is currently used in most crop modeling for light simulation The three
different planting scenarios consisted of i Normal culture Planting distances were
the same as the ones found in the experiment (50cm between the two rows of one
gully and 110 cm of path ii Big path The distance between the rows in the same
gully was reduced to 15 cm and the path width increased to 145cm width iii Even-
distance rows The plants were equally distributed in space (distance between plants at
the same gully as well as the pathway was equal to 80cm) In order to test the
accuracy of the tomatorsquos model light calculations the light interception of a
completely homogeneous crop was compared to Lambert- Beer calculations (Fig
213) Plant density was 41 plants per m2 with 1 stem per plant It was assumed that
plant size and structure was the same in all scenarios
Fig 213 Comparison of light interception () between simulation data for a totally
homogeneous canopy and Lambert- Beer law calculations for the same canopy
Data points are from the top (0 interception) to the bottom of the canopy (100)
In general row structures led to higher light interception in the upper part of the
plants (LAIle15) and lower interception in the lower part compared to homogeneous
crop simulation Light interception reaching at the deeper part of the crop increased
with path width and resulted in 30 light reaching soil level in our ldquobig pathrdquo
Chapter 21 Effect of cultivation strategies on light interception
18
treatment In accordance Papadopoulos and Pararajasingham (1997) reported that
light penetration increased and therefore light interception decreased with the increase
of plant spacing in a crop Similar effects have also been reported in other crops such
as corn (Stewart et al 2003) Cournegravede et al (2007) in their structural model
concluded that deviations in calculations of light interception from Lambert- Beer law
were mainly because the latter assumes a even distribution of the leaf elevation
angles The assumption of an even leaf distribution nevertheless has been challenge in
the past Maddonni et al (2002) reported that in case of row structure the leaf
orientation is changed and it is biased in being positioned perpendicular to the row
Also Toler et al (1999) found that k factor is dependant to the row distances and is
decreasing with the increase of the row spacing It would be argued that changes in k
factor in relation to plant spacing are because of morphological changes in plants and
mainly orientation and leaf elevation angle The calculation of k factor from our
model simulation shows that even if the structural characteristics of the plant stay the
same average k factor decreases with the increase of plant spacing (Fig 214B)
Inside the canopy k-factor is also decreasing from the top to the bottom This decrease
is directly linked with the decrease of leaf elevation angle In practice leaf elevation
angles are not constant but are dependant on the planting strategy Extinction
coefficient calculated for even-distance rows showed no differences to the one of
homogeneous canopy Nevertheless further increase of the path between the rows led
to a decrease of the k factor a decrease that reached 50 in case of ldquobig pathrdquo
treatment
0
25
50
75
100
0 125 25 375 5LAI
Ligh
t int
erce
ptio
n (
)
0
05
1
15
2
0 1 2 3LAI
ln (I
Io
Fig 214 A Calculated light interception for different canopy structures Light
interception was calculated by structural model for plants grown in rows with path
width of 110 (diams) 80 () and 45cm (loz) The symbols correspond to calculation
A B
Chapter 21 Effect of cultivation strategies on light interception
19
from Lambert- Beer B Average extinction coefficients k for the different
treatments LAI refers to cumulative leaf area from top to bottom of plant canopy
CONCLUSIONS
In tomato plants structural differences in leaf can mainly be observed in the upper
90cm of the plant in the still developing zone Changes of structural plant
characteristics affect directly light interception by the crop canopy Nevertheless even
if plant structure stays the same light penetration can be manipulated easily by
changing row spacing in the crop thus affecting light interception and potentially
plant production
Chapter 22
Exploring the spatial distribution of canopy light interception and leaf photosynthesis by means of a functional structural model
Published as
Sarlikioti V de Visser PHB Marcelis LFM 2011 Exploring the spatial
distribution of light interception and photosynthesis of canopies by means of a
functional-structural plant model Annals of Botany 107875-883
Chapter 22 Virtual plant for light interception and photosynthesis
22
Abstract
At present most process-based models and the majority of three dimensional
models include simplifications of plant architecture that can compromise the
accuracy of light interception simulations and accordingly canopy photosynthesis
The aim of this paper is to analyze canopy heterogeneity of an explicitly described
tomato canopy in relation to temporal dynamics of horizontal and vertical light
distribution and photosynthesis under direct and diffuse light conditions Detailed
measurements of canopy architecture light interception and leaf photosynthesis were
carried out on a tomato crop These data were used for the development and
calibration of a functional-structural tomato model The model consisted of an
architectural static virtual plant coupled with a nested radiosity model for light
calculations and a leaf photosynthesis module Different scenarios of horizontal and
vertical distribution of light interception incident light and photosynthesis were
investigated under diffuse and direct light conditions Simulated light interception
showed a good correspondence to the measured values Explicitly described leaf
elevation angles resulted in higher light interception in the middle of the plant canopy
compared to fixed and ellipsoidal leaf elevation angle distribution models although
the total light interception remained the same Fraction of light intercepted at a north-
south orientation of rows differed from east-west orientation by 10 on winter and
23 on summer days The horizontal distribution of photosynthesis differed
significantly between the top middle and lower canopy layer Taking into account the
vertical variation of leaf photosynthetic parameters in the canopy led to ca 8
increase on simulated canopy photosynthesis Leaf elevation angles of heterogeneous
canopies should be explicitly described as they have a big impact both on light
distribution and photosynthesis
Chapter 22 Virtual plant for light interception and photosynthesis
23
Introduction
Physiological plant models have become an integral tool of plant science research
These models describe at varying degrees of complexity plant physiological
processes that improve our understanding of plant functioning and help us develop
new cultivation strategies (Fourcaud et al 2008) Physiological models or process-
based models (PBMs) usually focus on plant production and development by
describing biophysical processes as rates using ordinary differential equations (ODErsquo
s) or stochastic processes (Marcelis et al 1998 Heuvelink 1999 Gayler et al
2006) Light interception is one of the most important functions as it drives
photosynthesis and therefore growth Although highly dependent on canopy structure
(Vos et al 2010) light interception is usually computed in PBMs as a function of leaf
area index (LAI) and extinction coefficient (Lai et al 2000 Baldocchi et al 2000)
In most models the extinction coefficient is determined by fitting a LambertndashBeer law
relation to experimental data or is estimated as a function of a certain leaf elevation
angle distribution Although these approaches give a good estimation of total light
interception of a crop they fail to capture the effect of plant and canopy heterogeneity
on light interception and therefore on photosynthesis (Vos et al 2010) Since plant
architecture is influenced by a number of processes (such as genotype water
availability cultivation practices or diseases) models that explicitly describe the
impact of these processes on plant architecture can be a useful tool in our
understanding of such phenomena for example the effect of wilting on light capture
In recent years techniques have become available for developing functionalndash
structural plant models (FSPMs) which are also called lsquovirtual plantsrsquo that combine
the modelling of physiological processes with the 3D architecture of the plant This
combination boosts the capability of models to simulate the interaction between plants
and their environment (Hanan 1997 Sievaumlnen et al 2000 Godin and Sinoquet
2005 Vos et al 2007) The 3D plant structure is especially important for the
description of light interception and therefore the photosynthetic capacity of plants
Three-dimensional models require a detailed quantification of plant structure in space
(Vos et al 2007) Plants are considered as the sum of distinct units called phytomers
that are formed repeatedly based on a hierarchical system (Bartheacuteleacutemy and Caraglio
2007) Static 3D plants coupled with radiation models have proven to be valuable
tools in investigating the effect of single-plant architecture as well as crop structure on
light interception and canopy photosynthesis (Vos et al 2010) Zheng et al (2008)
Chapter 22 Virtual plant for light interception and photosynthesis
24
showed that certain plant types with steeper leaf elevation angles exhibited a higher
light penetration of the canopy when sun elevation was high Therefore even simple
static virtual plants have a great potential for crop breeding research
Despite the advantage of virtual plant models over PBMs in their explicit
description of plant architecture still in such models we still often need to
approximate 3D structure Leaf elevation angle is assumed either as constant (Najla et
al 2009) or to follow a spherical or ellipsoidal distribution (Rakocevic et al 2000
Farque et al 2001) This approach is mainly due to the tediousness and the time-
consuming nature of the measurements involved (Fourcaud et al 2008) Such an
approach may give robust results in the case of crops that show a particularly regular
and coordinated development such as wheat and rice (Evers et al 2005 Drouet and
Pagegraves 2007 Zheng et al 2008) However in order to fully understand the light
distribution in the plant canopy and explore the full impact of crop architecture on
light interception and photosynthesis of row crops with a high canopy (such as
tomato) functionalndashstructural models should incorporate a detailed description of all
architectural parameters in general and leaf elevation angles in particular
The aim of this research was to analyse the canopy heterogeneity of an explicitly
described tomato canopy on horizontal and vertical light distribution and
photosynthesis under direct and diffuse light conditions at different times of the year
In order to do so a static functional structural tomato model was developed and then
used as a tool for analysing the impact of canopy heterogeneity
Materials and Methods
Experiment
A tomato (Lycopersicum esculentum var Aranca) crop was planted in December
2006 in a commercial greenhouse in Bleiswijk the Netherlands (52o) Measurements
were performed in July and August of 2007 when the plants were 175 m tall During
this period average temperature in the greenhouse was 175oC average daytime CO2
concentration was 371 μmol mol-1 and relative air humidity was set at 73 Daily
outside global radiation was 40 MJ during the time of the experiment Plants were
grown in double rows with rows oriented from north to south The distance between
the double rows was 12 m (path) the distance between each row of the double row
(within the row distance) was 04 m and the distance between plants within the row
was 03 m resulting in a plant density of 41 stemsm2
Chapter 22 Virtual plant for light interception and photosynthesis
25
Measurements of architectural development
Each week for six weeks angle length width internode length and azimuth
orientation of all leaves of five plants were manually measured weekly with a ruler
and a protractor Measurements were made during the morning hours (0900-1300)
Leaf elevation angle was determined as the angle of the leaf petiole with the
horizontal at the leaf insertion point on the stem The first leaf longer than 2 cm was
defined as leaf number 1 Azimuth angle was determined as the leaf horizontal angle
measured clockwise from a constant point defined as ldquonorthrdquo North (or 0 degrees)
was defined as the point perpendicular to the plant rows when facing towards the
inner side of the double row
The tomato plant has composite leaves with 10 to 13 leaflets Leaflet angle was
measured on 10 leaves at different canopy heights on 6 plants in total The angle of
the leaflet to the horizontal at the point that it connects to the petiole was defined as
leaflet angle
The crop leaf area was estimated non-destructively through leaf length and leaf
width measurements at the widest point The relationship between the area of a leaf
and its length and width was estimated by taking photographs against a white
background of 25 randomly chosen leaves from various canopy depths with a digital
camera (Canon IXUS 800 IS) positioned perpendicular to the leaf A ruler was set
next to the leaf for calibration of the image scale during image processing ImageJ
(National Institutes of Health Bethesda MD) was used for image analysis A
relationship was established between leaf length and width and leaf area This
relationship was used to calculate the leaf area index from length and width
measurements on all dates Leaflet length and leaflet area were also measured on
these 25 leaves in order to establish a relationship between the leaflet length and
leaflet area
Light interception measurements
Photosynthetically active radiation (PAR) interception was measured with a 08m
light rod in the crop and a reference sensor above the crop (Sunscan Delta-T UK)
under diffuse light conditions (overcast sky) The light rod was positioned
perpendicular to the row and light interception was measured from the top to the
bottom of the plant at 025m height intervals The measurements were repeated at
eight selected spots in the crop once a week for seven weeks Measurements were
Chapter 22 Virtual plant for light interception and photosynthesis
26
also taken in the middle between the double row and in the middle of the path For
these measurements the sensor was positioned parallel to the crop at three different
plant heights (05 m 1 m and at the base of the plant)
Photosynthesis measurements
Photosynthesis light response curves were measured with the use of a portable
open gas exchange measurement device (LCpro+ ADC UK) PAR levels were set to
0 100 250 500 700 and 1400 μmol m-2 s-1 CO2 concentration and relative humidity
were set to ambient greenhouse values (360 μmol mol-1 CO2 and 73 RH
respectively) On three dates during the experiment measurements were done on a
leaf at two different canopy heights (upper and middle respectively) on six plants and
at three different dates during the experiment Upper middle and bottom canopy
height layers were defined as intervals of 05 m from the top to the bottom of the
canopy
Model Description
The functionalndashstructural model presented here consists of three different modules
(Fig221)
bull The architectural module This is a static model that describes the plant
structure in space and the topology of the various organs using the L-systems
formalism (eg Prusinkiewicz 1999)
bull A nested-radiosity module The input of this module is the 3D plant
architecture and the position and the intensity of the light sources using the
model of Chelle and Andrieu (1998) The light emitted by the light sources is
traced through the canopy and the light absorbed by each leaflet is given as an
output
bull The photosynthesis module This module calculates gross photosynthesis
based on the biochemical model of Farquhar (1980)
Chapter 22 Virtual plant for light interception and photosynthesis
27
Fig 22 1 Model flow chart
Architectural module
The basic structural unit of the module is the phytomer A phytomer consists of an
internode a composite leaf and a bud containing an apex The basic unit is repeated
27 times in order to form a complete plant Every three leaves a generative shoot
forms a flower truss Trusses are not represented in the model In order to account for
the light interception from the trusses a fake truss was inserted every 3 leaves This
fake truss was represented as a small leaf with the same length as the length of the
truss and the same number of leaves as the number of fruits Relationships of the
change of the leaf elevation angle and length to the node number were established for
each date An average internode length of 75 cm was used for all plants
The tomato plant has composite leaves that vary in size Typical leaves consist of
a large terminal leaflet and up to eight large lateral leaflets Many smaller lateral
leaflets may alternate with the large leaflets The leaflets are usually petiolate and
irregularly lobed depending on the genotype (Atheron and Rudich 1986) A
representative leaf structure of the particular genotype in terms of leaflet number was
chosen for the construction of the model and was measured in detail The composite
tomato leaf was modelled as a branch structure in which each leaflet is represented as
a discrete lamina based on equations of leaflet angle (o) and leaflet area (cm2)
Static virtual plant
Light intensity at each leaflet
Photosynthesis at each leaflet
Output
Light module
bullLeaf optical properties
bullLight sources position
bullLight sources intensity Architectural
module
bullLeaf elevation angle
bullLeaf area
bullInternode length
bullLeaflet area
Photosynthesis module
bullPhotosynthetic parameters of Farquhar
model
Chapter 22 Virtual plant for light interception and photosynthesis
28
Relationships of the leaflets angle to the leaf petiole as well as the leaflet length to the
leaf length as determined in the experiment were incorporated in the model
The above mentioned relationships were derived from experimental measurements
as described in the lsquoMeasurements of architectural developmentrsquo section The visual
output of the architectural model is presented in Fig 222
Fig 222 Example of the visual output of the 3D tomato model The basic unit of
the model is two plant rows of five plants each Lines along the path and the
plant canopy represent the visual sensors used for the model calibration
Radiosity module
PAR reaching the crop consists of a direct and a diffuse light component (Spitters
1989) For the simulation of diffuse light conditions 48 directional light sources were
positioned uniformly in a hemisphere around the canopy simulating a uniformly
overcast sky The light intensity of diffuse light conditions was 460 μmol PAR m-2 s-1
For the simulation of direct sunlight a bright sky was simulated with light sources
that were given xyz coordinates similar to the sunrsquos trajectory on two distinct dates
(21 December and 21 June) For direct light conditions the intensity of the light
sources at a half hour time step was derived from the 10-yearly average of light
incidence on these dates under Dutch conditions (daily radiation was equal to 7 MJ d-1
Chapter 22 Virtual plant for light interception and photosynthesis
29
in winter and equal to 50 MJ d-1 in summer) The nested radiosity module calculates
the light absorbed by every leaflet by using a radiosity approach for a basic crop unit
and subsequent nesting of the unit to account for the surrounding canopy (Chelle and
Andrieu 1998) Multiple scattering was calculated on a canopy of 20 plants (as
calculated by the architectural module) These 20 plants formed the basic model unit
In the nested radiosity module the basic unit is multiplied infinitely in space in order
to preclude phenomena associated with border effects (eg too high levels of light
incidence from the sides) Reflectance and transmittance of the full spectrum of the
upper and lower sides of the tomato leaves were measured with the use of an
InstaSpec IV CCD spectrometer (Oriel Stradford CT USA) and a LiCor 1800-12
integrating sphere (LICOR Inc Lincoln NE USA) Twelve leaves from different
canopy heights were measured in total and the average values were inputted into the
model( upper side reflectance= 017 upper side transmittance= 006 lower side
reflectance= 012 lower side transmittance= 003)
In order to validate the model with the measured data we introduced to the model
lsquovirtualrsquo sensors that were situated at the measurement spots These sensors were
represented as surfaces with the same dimensions and optical properties as the
Sunscan sensor and were positioned inside the canopy at the same heights with
measured values
In order to investigate the effect of leaf elevation angle distribution on light
interception and photosynthesis we made comparisons between our model (EXPL)
which explicitly describes leaf elevation angles a 3D model with a fixed leaf
elevation angle (-20o for all leaves in the canopy) (CONST) and a 3D model with an
ellipsoidal leaf elevation angle distribution (ELLIP χ=27 where χ is the ratio of the
horizontal semiaxis length to the vertical semiaxis length of an ellipsoid) were made
Photosynthesis module
Photosynthesis is calculated according to the biochemical model of Farquhar et al
(1980) on the basis of absorbed light The module calculates photosynthetic rate at
leaflet level according to the equation
RDppJA
i
iv minus
Γ+Γminus
=)2(4
(eqn 222)
where pi is the intercellular partial pressure of CO2 in Pa Γ is the CO2
compensation point in Pa RD the dark respiration in μmol CO2 m-2 s-1 and J is the
Chapter 22 Virtual plant for light interception and photosynthesis
30
rate of electron transport rate per unit leaf area and is calculated from the following
equation
θJpαθJpαJ+p(α
=J2
max4maxmax 2 minusminus (eqn 221)
where α and θ are coefficients from the data fitting Jmax the potential electron
transport rate (μmol electrons μmol-1 photons) and p the light absorbed by the leaflet
surface (μmol m-2 s-1) Based on the measurements as described in lsquoPhotosynthesis
measurementsrsquo coefficients of the photosynthesis equations were differed between the
upper and the middle layer of the canopy For the lower canopy we assumed the same
coefficients as in the middle canopy For the upper canopy the coefficient values
were α= 01 θ= 069 and Jmax= 1244 and for the middle and lower canopy layer α=
01 θ= 065 and Jmax= 7518)
Model calculations for photosynthesis calibration showed a good correlation with
the measured data at two different canopy heights (R2= 093 data not shown)
Total canopy photosynthetic rate was compared between the model that explicitly
describes leaf elevation angles (EXPL) a 3D model with a constant leaf elevation
angle (CONST) and a 3D model with an ellipsoidal leaf elevation angle distribution
(ELLIP) For the EXPL and ELLIP models two different scenarios were investigated
in one scenario the photosynthesis parameters of the top of the plant were used for
the whole canopy while in the other scenario we attributed different photosynthetic
parameters for the upper (0-075 m) layer and the middle and the bottom canopy
layers (075 m-18 m) For all canopies LAI was kept constant at 31
Statistical analysis
Statistical analysis was performed with GenStat 12th Edition Regression analysis
was applied to derive the various architectural and biochemical relationships
implemented in the model except for the parameters of the light response curves of
photosynthesis which were derived from a mixed linear model
Results
Developing and calibrating the crop architecture module
Dynamics of structural properties of the crop remained more or less constant
during the two months of the experiment The upper leaves showed a positive leaf
Chapter 22 Virtual plant for light interception and photosynthesis
31
elevation angle with respect to the horizontal while the lower leaves showed a
negative leaf elevation angle Below the tenth youngest phytomer leaf elevation angle
did not vary with phytomer angle (Fig 223A) Leaf length rapidly increased from the
top to the 7th phytomer from 2 to 30 cm and then remained almost constant in the
lower leaves (Fig 223B) However leaf area increased continuously from the top to
the bottom of the canopy (Fig 223C) Most leaves were positioned perpendicular to
the plant row towards the path and the middle of the plant row (Fig 223D)
Fig 223 Relationship between A) leaf elevation angle to the horizontal plane B)
leaf length C) leaf area in relation to phytomere number starting from the top
of the plant and D) leaf azimuth angle distribution Each symbol represents a
specific week in fig3 A-B-C Vertical bars in Fig 3D represent the number of
leaves per leaf orientation class
Leaflet angles depended on leaflet position on the leaf petiole The terminal leaflet
had an angle of zero and the leaflets tended to be more erect towards the plant stem
Leaflets in tomato leaves occur in pairs opposite to each other In Fig 224A every
two leaflets represent one pair (ie leaflets 1 and 2 are one pair etc) There was no
Chapter 22 Virtual plant for light interception and photosynthesis
32
significant difference between the leaflet angles of the two leaflets of the same pair
(Fig 4A) A positive linear (043+052leaflet length r2= 088 plt0001) relationship
was observed between leaflet length and leaflet area (Fig 224B)
The above relationships were used to derive the parameters and equations of the
architectural model
Fig 224 A) Leaflet angle with respect to the horizontal in relation to the leaflet
position on the leaf petiole The position counting starts from the leaflets
nearer to the stem and ends with the terminal leaflet Every two leaflets form a
pair positioned opposite to each other on the leaf petiole Each column
represents the average of 10 leaves plusmnSE mean B) Relationship of leaflet area
to leaflet length (y= 015x+025 R2=081) N = 10 leaves
Light interception
Light interception was measured and simulated for six dates For each simulation
date crop structure was based on leaf area and leaf elevation angles as measured on
dates corresponding to the light measurements Simulated light levels corresponded
well to the measured data (Fig 225) An underestimation of light interception was
observed for simulated values at the top of the crop
Chapter 22 Virtual plant for light interception and photosynthesis
33
Fig 225 Measured vs simulated values of light interception Values are from 6
weeks of measurements in 8 different canopy heights Continuous line is 11
In a comparison between EXPL CONST and ELLIP models no differences were
found in total light interception but differences were observed for the middle of the canopy The use of a constant angle led to a 17 underestimation of light interception under diffuse light conditions and a 236 underestimation under direct light conditions compared to the EXPL model Ellipsoidal distribution led to a 76 and an 11 underestimation under diffuse light conditions and direct light conditions respectively (Table 221) These differences were observed only in the middle canopy layer
In order to investigate the effect of the row crop on the horizontal light distribution and the simulation capabilities of the model virtual sensors were
Fig 226 Measured and simulated horizontal light distribution in a row tomato
crop The light intensity is plotted against the plant row length at three different plant canopy heights (50 cm () 100 cm (nabla) and 175 cm ()) Lines represent simulated values while symbols represent measured values plusmn SEmean Plant rows are located at 20cm and 140cm while the middle of the path is located at 80cm
Chapter 22 Virtual plant for light interception and photosynthesis
34
positioned parallel to the crop row in the middle of the space between two rows and
in the middle of the path at three heights (Fig 226) Light intensity decreased from
the top to the bottom of the canopy and from the centre of the path to the row (Fig
226)
Table 221 Comparison of three different leaf elevation angle modelling approaches
with respect to effect on light interception and photosynthesis Values for light
interception and photosynthetic rate are for the total canopy Values in brackets
refer to the middle of the canopy (07 5m-125 m from the top of the plant) where
differences were observed
Leaf elevation
angle
distribution
Light intercepted
()
Photosynthesis with
one set of parameters
(μmol m-2 s-1)
Photosynthesis with
two set of parameters
(μmol m-2 s-1)
Diffuse Direct Diffuse Direct Diffuse Direct
Fixed angle
(CONST)
77
(43)
80
(41)
20
(88)
27
(123)
Ellipsoidal
distribution
(ELLIP)
77
(48)
80
(47)
24
(103)
292
(129)
21
(107)
296
(132)
Explicitly
described leaf
elevation angles
(EXPL)
77
(52)
80
(55)
27
(106)
303
(132)
24
(109)
309
(137)
Direct light was calculated for 21 of June The light intensity for direct light conditions was derived
from the 10-yearly average of light incidence on these dates under Dutch conditions (46 μmol m-2
s-1at sunrise 3109 μmol m-2 s-1 at noon and 23 μmol m-2 s-1 at sunset) For diffuse light conditions
a light intensity of 460 μmol m-2 s-1 was considered Calculations were done when it was assumed
that all leaves of the canopy had the same photosynthetic properties or with two sets of
photosynthetic properties where the properties of the top layer differed from those of the middle
and lower layers
Taking into account the perpendicular positioning of the leaves to the plant row
leaves positioned towards the path absorbed more light per unit leaf area than leaves
positioned towards the middle of the plant row (which received 30 43 and 88
Chapter 22 Virtual plant for light interception and photosynthesis
35
less in the upper middle and bottom canopies respectively) Simulation data showed
an underestimation of the light intensity at the various plant heights compared to the
measured data
Both sun elevation and plant orientation to the sunrsquos trajectory had an effect on
light interception (Fig 227) Fraction of light intercepted was in all cases higher
during winter than summer Light interception increased substantially for plants rows
with a north-south orientation than plant rows with an east-west orientation This
trend was observed for both times of the year
Fig 227 Seasonal variation in light interception for 21st of December (circles)
and 21st June (squares) for a north-south (open symbols) and east-west (closed
symbols) row orientation LAI was 31 Calculations were performed for
exactly the same canopy structure on both dates
Photosynthesis
In order to investigate the horizontal distribution of photosynthesis with the
model leaves pointing towards the path were chosen like those upon which the
manual measurements were performed Leaves located in the higher canopy layer
photosynthesized considerably more than those positioned in the middle or the bottom
of the canopy Differences in simulated photosynthesis were not observed between the
middle and bottom simulated canopy layers because the same photosynthetic
parameters were used for these two layers and light levels were almost equal In the
higher canopy layer photosynthesis increased rapidly from 8 to 35 μmol m-2 s-1 from
Chapter 22 Virtual plant for light interception and photosynthesis
36
the inside leaflets to the outer ones while in the lower canopy layers photosynthesis
ranged from 25 to 148 μmol m-2 s-1 (Fig 228)
Fig 228 Horizontal distribution of photosynthesis in the crop path In this graph
only leaves positioned towards the path at three different canopy heights (05 m
() 1 m () and 175 m ()) are used Each data point is the average of a pair
of leaflets and includes the result from 2-3 leaves per plant from 20 plants
depending on the leaves position Simulation was performed under diffuse light
conditions
The rate of the increase from the inside to the outer leaflets was relatively higher
in the lower layer (43 and 6 for the higher and the lower layer respectively) Total
canopy photosynthesis differed in total 26 (for diffuse light) and 11 (for direct
light) between the EXPL and CONST models (Table 221) Total photosynthesis
differences between the EXPL and ELLIP model were 11 (diffuse) and 4 (direct
light) respectively For light interception differences simulated in the middle canopy
layer the CONST model led to a 16 underestimation of photosynthesis under
diffuse light conditions and to a 7 underestimation under direct light conditions in
comparison with the EXPL model The ELLIP model led to a 3 underestimation
under diffuse and under direct light conditions compared with the EXPL (Table
221) The differences in photosynthetic rate when using the same photosynthetic
parameters for all leaves compared to the use of two sets of photosynthetic parameters
in top and middle leaves was 125 and 13 (for diffuse and direct light
Chapter 22 Virtual plant for light interception and photosynthesis
37
respectively) for the ELLIP model and 11 and 2 (for diffuse and direct light
respectively) for the EXPL
Discussion
The aim of this research was to analyse the temporal dynamics of the horizontal
and vertical light distribution and photosynthesis in relation to canopy heterogeneity
under direct and diffuse light conditions
The spatial position of plant organs has been studied in view of their possible
adaptation to their local environment Such strategies can aim either at maximization
of plant production efficiency or at minimization of the impact of stress-inducing
conditions such as drought or light inhibition (Bjoumlrkman and Powles 1984) Leaf
dimensions and especially leaf elevation angles are important in assessing these plant
strategies as they are directly linked to the acquisition of light Smaller and more
upright leaves are found in the top of the canopy which allows light penetration to the
lower layers while lower leaves have a higher area so as to ensure maximum light
absorption (Pearcy et al 1990) Since leaf elevation angle is an important
architectural phenotypic characteristic of a plant it should be explicitly incorporated
in functionalndashstructural plant models Dong et al (2008) proposed a functionalndash
structural tomato model in which leaf elevation angle is randomized according to an
ellipsoidal distribution Najla et al (2009) and Higashide (2008) used a fixed value to
describe all leaf elevation angles independent of their position in the canopy These
approaches assume a leaf distribution that is not affected by cultivation practices or
the specific plant genotype However Sinoquet et al (2005) showed that this is not
the case and that likely factors for the deviation from the randomness in leaf
positioning in a canopy can be linked to leaf size and angle In this study we
compared three leaf elevation angle distributions (CONST ELLIP and EXPL) and
showed that the previous approaches to modeling leaf elevation angle can lead to an
underestimation of light interception in the middle canopy ranging from 4 to 15
depending on the light conditions Although light interception in the canopy is the
same for all models the change in the middle canopy layer led in photosynthesis
simulation to differences of 3-8 Therefore in order to correctly model the
heterogeneity of plant canopy leaf elevation angles should be explicitly described
Chapter 22 Virtual plant for light interception and photosynthesis
38
Another point of importance in terms of plant architecture is the azimuth leaf
orientation Atheron and Rudich (1986) reported that in a single tomato plant leaves
were evenly distributed around the stem with a phyllotaxis angle of 135o Our data
show that tomato plants grown in a row crop system tend to rearrange their leaves in a
more systematic way namely almost perpendicular to the plant row Similar
phenomena where leaves are turned away from shady spots have been reported for
maize (Maddoni et al 2001) trees (Cournegravede et al 2007) and cucumber (Kahlen et
al 2008) Dauzat et al (2008) observed that branch placement was density-
dependent in cotton and that at high densities sympodial and monopodial branches
tended to orient towards the space between rows This placement of leaves and
branches is probably due to the plantrsquos strategy for maximizing light interception and
should also be taken into account when modelling plant architecture
Row crop systems are the most common cropping systems used in horticultural
and agronomic crops This system which was developed mainly to facilitate harvest
and crop management allows higher light penetration inside the plant canopy In our
experiment light intensity increased towards the middle of the path as also observed
by Stewart et al (2003) in maize and Louarn et al (2008) in grapevines Our
simulation showed that of the amount of light reaching the top of the canopy 50
reaches the ground floor in the middle of the path Light direction combined with light
intensity has a direct effect on light interception A seasonal pattern in fraction of light
intercepted has been reported for many species (Gilbert et al 2003 Cassela and
Sinoquet 2007) Light interception follows a seasonal pattern with on average a
lower fraction of light intercepted during summer than during winter A main factor is
the change in solar elevation changing during the year The higher solar elevation in
summer months results in an orientation of light rays more perpendicular to the plant
canopy resulting in a higher light penetration and lower interception Interestingly
row orientation seems to affect substantially light interception with north-south
orientation giving a higher light interception than east-west orientation The same
phenomenon has been reported by Palmer (1989) and Borger et al (2010) Kahlen et
al 2008 reported that light direction and intensity are linked to a possible growth
advantage of certain plants positions inside the canopy mainly by leaf rearrangement
towards the unshaded patches of the canopy or leaf photosynthetic acclimation to
altered light status Architectural adaptations of plants to the seasonal light patterns
would in this context be worth investigating
Chapter 22 Virtual plant for light interception and photosynthesis
39
Leaf elevation angle and vertical leaf distribution are highly relevant for the daily
amount of photosynthesis as was shown in the results Increase in light in lower
canopy layers resulted in a higher relative increase in photosynthesis A probable
explanation for this is the leaf acclimation to lower light intensities and the
physiological age in lower layers in the canopy (Niinemets 2007) Leaves situated
within the two rows received a substantially lower amount of light than leaves at the
same height situated towards the path If lower photosynthesis is partly an effect of
acclimation to lower light levels it stands to reason that leaves oriented towards the
middle of the plant rows will have a lower photosynthetic rate than leaves at the same
height that are oriented towards the path and very likely different photosynthetic
potential A common experimental approach for photosynthesis is to take
measurements only in the upper and middle canopy and only of leaves oriented
towards the path However model calculations showed that the use of one more set of
photosynthetic parameters can lead to a 7-10 difference in photosynthesis
prediction So it stands to reason that when a significant part of the canopy is oriented
towards the intra-row space with concomitant higher photosynthetic potential
predictions of crop photosynthesis will be inaccurate Virtual plant models are able to
cope with this given the proper data Chelle (2005) also pointed out the need for a
new modelling approach that will combine the organ microclimate with the general
plant environment He demonstrated the temperature differences that can be measured
at various plant organs and how the use of FSPMs can improve our understanding of
the effect of these differences on the plant processes A similar approach should be
used for photosynthesis modelling as it would improve our understanding of the
impact of various crop strategies on photosynthesis
Conclusions
Leaf elevation angles of heterogeneous canopies should be explicitly described as
they have a big impact both on light interception and on photosynthesis Comparisons
between 3D models with explicitly described leaf elevation angles and models with
standard leaf elevation angle distributions resulted in differences of 4-15 depending
on the light conditions and the number of the sets of photosynthetic parameters In this
frame functional-structural models can play an important role in our understanding of
light distribution along vertical and horizontal gradients caused by crop architecture
Such a tool can be useful in practise not only in yield prediction but also in
Chapter 22 Virtual plant for light interception and photosynthesis
40
experimentation planning as well However steps should be taken to move from a
static to a dynamic crop so as to incorporate the seasonal adaptation of the plants
Chapter 23
Searching for the ideal plant structure with a functional-structural plant model How plant architecture affects light absorption and photosynthesis in tomato
Accepted as
Sarlikioti V de Visser PHB Buck-Sorlin GH Marcelis LFM 2011 How
plant architecture affects light absorption and photosynthesis in tomato Towards an
ideotype for plant architecture using a functional-structural plant model Annals of
Botany in press
Chapter 23 Using FSPM to optimize plant structure in tomato
43
Abstract
Manipulation of plant structure can strongly affect light distribution in the canopy
and photosynthesis The aim of this paper is to find a plant ideotype for optimization
of light absorption and canopy photosynthesis Using a static functional structural
plant model (FSPM) a range of different plant architectural characteristics was tested
for two different seasons in order to find the optimal architecture with respect to light
absorption and photosynthesis Simulations were performed with a FSPM of a
greenhouse-grown tomato crop Sensitivity analyses were carried out for leaf
elevation angle leaf phyllotaxis leaflet angle leaf shape leaflet arrangement and
internode length From the results of this analysis two possible ideotypes were
proposed Four different vertical light distributions were also tested while light
absorption cumulated over the whole canopy was kept the same Photosynthesis was
augmented by 6 in winter and decreased by 7 in summer when light absorption in
the top part of the canopy was increased by 25 while not changing light absorption
of the canopy as a whole The measured plant structure was already optimal with
respect to leaf elevation angle leaflet angle and leaflet arrangement for both light
absorption and photosynthesis while phyllotaxis had no effect Increasing the length-
to-width ratio of leaves by 15 or increasing internode length from 7 to 12 cm led to
an increase of 6 ndash 10 for light absorption and photosynthesis At high light
intensities (summer) deeper penetration of light in the canopy improves crop
photosynthesis but not at low light intensities (winter) In particular internode length
and leaf shape affect the vertical distribution of light in the canopy A new plant
ideotype with more spacious canopy architecture due to long internodes and long and
narrow leaves led to an increase in crop photosynthesis of up to 10
Chapter 23 Using FSPM to optimize plant structure in tomato
44
Introduction
Light absorption is an important factor for determining crop yield being one of
the driving forces behind plant photosynthesis and at the same time is highly
dependent on single-plant architecture as well as on overall canopy structure
(Niinemets 2007) Plant architectural characteristics (such as the number and
geometry of organs ie their shape and position within the plant and the canopy) are
genotype specific while at the same time highly dependent on the climatic conditions
at the time of their initiation and development (Godin 2000) Falster and Westoby
(2003) have shown that steeper elevation angles in a number of species improve
absorption at higher sun elevations and therefore carbon gain through assimilation as
it allows more light to penetrate to the lower leaves While the importance of leaf
elevation angles for an improved light absorption strategy at the level of the whole
plant has been shown in a number of studies (Pearcy and Yang 1998 Sinoquet et al
2005) reports about the importance of leaf phyllotaxis are contradictory as some
studies did and some did not observe effects on the light absorption of the canopy
(Brites and Valladares 2005) Furthermore aspects such as the elevation angles of the
leaflets of composite leaves have not been to the best of our knowledge previously
investigated Both leaf shape and size are important aspects of leaf morphology
affecting mutual shading of leaves and light absorption of the canopy (Falster and
Westoby 2003)
The quantitative exploration of the specific effects of each plant architectural
characteristic on light absorption and photosynthesis was hardly possible until the
introduction of spatially explicit models considering plant architecture at the organ
level (Vos et al 2010) General crop models are powerful tools towards a better
understanding of plant processes and for testing case scenarios (Marcelis et al 1998
Vos et al 2007) More specifically functional-structural plant models (FSPM) have
been introduced as a relatively recent paradigm in plant modelling where
physiological processes are coupled with an explicit 3D plant structure (Vos et al
2010) often supplied with a mutual feedback between physiology and structure
Modelling on the basis of a 3D structure gives the opportunity to investigate more in-
depth the effect of specific architectural characteristics such as leaf angle leaf length
or leaf shape (Vos et al 2010) Sinoquet et al (2005) used FSPMs to show the effect
of leaf and branch distribution on light absorption of trees Sarlikioti et al (2011)
developed a static tomato FSPM to explore the spatial distribution of light absorption
Chapter 23 Using FSPM to optimize plant structure in tomato
45
and photosynthesis in a tomato canopy They demonstrated the importance of an
explicitly described leaf angle distribution for simulating light absorption and
photosynthesis Accurately calibrated FSPMs can convey a better understanding of
the light distribution inside the canopy and also provide us with a tool to define the
optimal set of architectural characteristics for maximizing canopy photosynthesis
allocation of assimilates to growing organs and ultimately crop yield
Donald (1968) defined the ldquocrop ideotyperdquo in the context of cereal breeding as an
idealized plant type with a specific combination of characteristics favourable for
photosynthesis growth and grain production based on knowledge of plant and crop
physiology and morphology He argued that it would be more efficient to define a
plant type that was theoretically efficient and then breed for this The crop ideotype is
thus an idealized crop consisting of a plant type with a specific combination of
characteristics based on the detailed knowledge of morphological and physiological
plant traits (Peng et al 2008) as well as mutual interactions among plants of the
canopy These traits often are also contributing to plant architecture Modifications of
the arrangement and size of leaves can affect light availability especially in the lower
parts of the canopy and alter leaf photosynthetic activity by adjusting light harvesting
efficiency (Werner et al 2001) As an example a decrease in leaf clustering can
increase light absorption and enhance photosynthetic productivity at canopy level (De
Castro and Fetcher 1999) Morphological characteristics such as leaf inclination and
leaf shape are often inherited as simple traits (ie under the influence of one or a few
major genes) in the plant (Thurling 1991) and can be used to create a more open
canopy structure These breeding traits can be strongly affected by the environment
under stress conditions (Valladares and Niinemets 2007) Tomato (Solanum
lycopersicum L) is a species that exhibits a high variability in vegetative morphology
(Peralta and Spooner 2000) ranging from small leaves with a few leaflets to big ones
with many leaflets Lately studies of the genetic basis of this variation at the leaf level
have shown that there are leaf-specific genes that control its shape and morphology
(Frary et al 2004) This genetic background knowledge in combination with the
detailed information on the effect of leaf topology and geometry on light absorption
and photosynthesis could help to identify or approximate the theoretical optimum of
plant architecture
The objective of this study is to define a plant ideotype for greenhouse-grown
tomato with respect to optimization of light absorption and photosynthesis at the
Chapter 23 Using FSPM to optimize plant structure in tomato
46
canopy level A range of different plant architectural characteristics were tested under
light conditions of a typical summer and winter day in order to define the ideal for
each case We tested two hypotheses 1) The manipulation of plant structure of a
greenhouse-grown tomato crop can lead to substantial improvement in crop
photosynthesis even when leaf area index and leaf photosynthetic characteristics
remain unaltered 2) A more spacious canopy architecture improves crop
photosynthesis For this purpose we used the static functional structural tomato model
developed by Sarlikioti et al (2011)
Material and methods
Model description
Simulations were performed with a functional structural tomato model This
model was built as a parametric open L-system using the cpfg language within the
platform L-Studio (Prusinkiewicz 1999) consisting of three modules (model structure
and parameterization has been described in detail in Sarlikioti et al (2011)
Architectural module
This is essentially a static 3D reconstruction of tomato plant architecture in which
each plant consists of 27 phytomers with the first phytomer being the one at the top of
the plant (basipetal ranking) A phytomer is the basic architectural unit consisting of a
leaf and an internode the leaf itself being made up of a leaf rachis a central midrib
and 13 individual leaflets each one of them consisting of a blade and a petiole of
which one is terminal and 12 are lateral The blade of each leaflet is described as a flat
polygon instead of one with a curvature for reasons of calculation efficiency
Characteristics are leaf elevation angle (defined as the angle between the leaf rachis
at its insertion point to the stem and the horizontal plane) leaf length (defined as the
distance from the leaf insertion point at the stem to the tip of the terminal leaflet) and
leaf width (defined as the distance between the tips of two longest lateral leaflets)
The construction of the leaf leads to a 3D object The architectural model was
parameterized during a summer period for a fully grown tomato crop (Solanum
lycopersicum L var lsquoArancarsquo) grown in a high-wired greenhouse system in
Bleiswijk The Netherlands (52deg01N 4deg32E) with a density of 41 stems m-2 (see
Sarlikioti et al 2011) LAI was equal to 36 m2 of leaf area per m2 floor area Every
week the lowest leaves were removed the plants were lowered and kept at the same
Chapter 23 Using FSPM to optimize plant structure in tomato
47
height throughout the season as it is common practice in the Netherlands Therefore
plant architecture remained ldquostaticrdquo at least during each season (summer winter) For
that reason a static modeling approach was used
Light module
Light calculations are based on a nested radiosity approach developed by Chelle
and Andrieu (1998) The module requires as an input the amount of light absorbed by
each plant organ the leaf transmittance and reflectance coefficients for the upper and
lower side of the leaf (upper side reflectance = 017 upper side transmittance = 006
lower side reflectance = 012 lower side transmittance = 003) and the light from the
light sources that were used to simulate the sky In the Netherlands greenhouses are
usually larger than 1 ha In order to better approach real greenhouse cultivation
conditions an infinite canopy was assumed in which the basic unit is theoretically
reproduced in all directions thus avoiding a border effect during the calculations The
basic unit consisted of 20 plants arranged in two double rows with five plants per row
The distance between the double rows was 12 m (path) the distance between each
row of the double row (within the row distance) was 04 m and the distance between
plants within the row was 03 m
Photosynthesis module
Photosynthesis calculations are based on the biochemical model of Farquhar et al
(1980) This model requires as input the computed light absorbed per leaflet in the
model and photosynthetic parameters that were derived from the experimental data
(Sarlikioti et al 2011) All photosynthetic parameters (Vmax α θ etc) were assumed
invariate with canopy depth except for Jmax which followed a logistic pattern from
the top to the bottom of the canopy (Jmax at the top = 265 micromol e- m-2 s-1 Jmax at the
bottom= 180 micromol e- m-2 s-1)
Case studies
In this study we attempted to define the importance of each architectural
component for optimum light absorption and canopy photosynthesis by performing a
sensitivity analysis of the most important components as they appear in the literature
Each component is described in detail below
Chapter 23 Using FSPM to optimize plant structure in tomato
48
Simulations were performed under summer and winter light conditions and for
two distinctive days (December 21 and June 21) using ten-yearly (2000-2010)
averages with an hourly time step of direct and diffuse light incident at these dates
under Dutch conditions Daily global radiation outside the greenhouse was equal to
35 MJ m-2 d-1 in winter and 26 MJ m-2 d-1 in summer Transmissivity of the
greenhouse was 60 For direct light conditions light sources were given the same
Cartesian co-ordinates as the solar trajectory To simulate diffuse light light sources
were positioned on a virtual hemisphere around the architectural mock-up In total 48
directional light sources were used with daily intensity equal to 15 MJ m-2 d-1 in
winter and 75 MJ m-2 d-1 in summer The fraction of diffuse light was equal to 03 for
winter and 022 for summer Leaf temperature was 23 oC and calculations were
performed for CO2 levels equal to 400 ppm Computed hourly assimilation rates were
integrated to daily amount of assimilates produced
Vertical light distribution scenario
In order to understand the effect of vertical light distribution on canopy
photosynthesis we constructed four light absorption curves (Fig 321A) that were
based on the light absorption of the reference structure for each date Light absorption
was increased and decreased from the first to the 8th phytomer by 10 and 25
respectively while the light absorption of the canopy as a whole remained the same
Canopy photosynthesis was calculated for each curve
Leaf elevation angle
Here we studied the effect of modifying leaf elevation angle with respect to the
original angular distribution As a starting value we assumed an explicitly described
leaf angle distribution (Sarlikioti et al 2011) Simulations were carried out by adding
or subtracting 15 o or 30 o to the measured value of each leaf in the canopy In the
reference crop the leaf angle distribution ranged from -23 o for bottom leaves to 15 o
for top leaves
Chapter 23 Using FSPM to optimize plant structure in tomato
49
Fig 231 Five different vertical light absorption profiles (top graph) were imposed as
treatments for studying the optimal profile for maximum crop photosynthesis The
absorbed light is the cumulated value from top (phytomer 1) to bottom of the canopy
Photosynthesis at 1200 h (g CH2O m-2 h-1) is presented for each treatment for winter
(middle graph) and summer (lower graph) light conditions Treatments for absorption
profile are -25 -10 0 +10 and +25 These values refer to the percentage change
in light absorption in the upper eight phytomers of the canopy while light absorption
cumulated over the whole canopy was kept constant
Chapter 23 Using FSPM to optimize plant structure in tomato
50
Leaf phyllotaxis
The phyllotactic angle is defined as the angle between two subsequent leaves
along the plant stem Atherton and Rudich (1986) reported that tomato plants follow a
common 135 o phyllotaxis In reality however plants tend to rearrange their leaves
thereby deviating from this value In previous experiments we found that phyllotactic
angle on a tomato row crop is about 160 o (Sarlikioti et al 2011) Here we assess the
effect of leaf phyllotaxis for values equal to 110 o 135 o 150 o and 180 o
Leaflet angle
As leaflet angle we define the angle between the leaflet petiole and the leaf rachis
In a composite leaf leaflet angles steadily decrease from the proximal to the terminal
leaflet On average the measured leaflet angle of tomato leaves was 22 o ranging from
35 o for the basal leaflets to 0 o for the terminal leaflet (Sarlikioti et al 2011) In the
present study this original distribution (reference crop) was compared with leaves
having all leaflets oriented at an angle of 22 o or 0 o
Leaf shape
The ratio between leaf length and leaf width was used as a convenient measure of
leaf shape In the model the default value of the length-to-width ratio is equal to 102
Leaf ratios of 05 075 125 15 and 2 times the original ratio were tested for their
effect on light absorption and canopy photosynthesis These ratios resulted in a range
of leaf shapes from wide and short leaves to long and narrow ones For all simulations
the leaf area index per plant was kept constant at 36 m2 leaf area per m-2 floor area
Leaflet arrangement on a leaf
The area of each leaf is equal to the sum of the areas of each of its leaflets In the
leaf of a typical tomato cultivar pairs of big and small leaflets alternate A wide range
of leaf types can be found in tomato We investigated the (crop scale) effect of leaf
types with all leaflets having the same area as well as the effect of having fewer but
bigger leaflets (Fig 232) Also the effect of an increase of petiole length by 20 of
the original value was investigated In all simulations the area per leaf (sum of all
leaflets) was kept the same
Chapter 23 Using FSPM to optimize plant structure in tomato
51
Fig 232 Schematic representation of leaflet arrangement scenarios The total
area per composite leaf was kept constant
Internode length
As internode length we define the distance between the insertion points of two
consecutive plant organs (leaves or trusses) Measured average internode length was
745 cm (stdev= 08) (Sarlikioti et al 2011) Here we investigated the effect of
internode lengths of 3 cm 5 cm 10 cm and 12 cm In all simulations leaf number (13)
and area per leaf (m2) were kept constant
Ideotyping scenarios
After the above assessment of architectural characteristics of the tomato plant we
found that a number of parameters improve the light absorption as well as canopy
photosynthesis Based on these results we designed the following two scenarios
bull Scenario A For this scenario architectural characteristics were chosen
which by themselves had produced a minimum increase in canopy
photosynthesis by 4 Internode length was set to 10 cm length-width
ratio to 15 all other architectural characteristics were kept the same as in
the reference structure
bull Scenario B This scenario aimed at reconstructing an open structure of the
canopy The internode length was again set to 10 cm and for leaflet
arrangement the leaves with longer petioles (Fig 232) were chosen All
other architectural characteristics remained the same as in the reference
structure
Chapter 23 Using FSPM to optimize plant structure in tomato
52
Results
Vertical light distribution scenario
Imposing five different vertical light absorption profiles while keeping light
absorption cumulated over the whole canopy constant (Fig 231A) showed some
distinct effects on canopy photosynthesis Under winter light conditions at noon
canopy photosynthesis increased by 6 when absorption in the top part of the canopy
(upper 8 phytomers) was increased by 25 (Fig 231B) In contrast under summer
light conditions for the same increase of light absorption canopy photosynthesis was
decreased by 7 (Fig 231C)
Leaf elevation angle
Highest light absorption was achieved with the original leaf angle distribution
(leaf angle decreasing from 15 o degrees for top leaves to -23 o degrees for bottom
leaves) under winter light conditions (Fig 233A) while under summer conditions it
was maximum when elvation angle was changed by 30 o (Fig 233B) Changes in
leaf angle of plusmn15 o degrees decreased light absorption by 5 and an increase of the
leaf angle to +30 o led to a decrease of 6 under winter conditions (Fig 233A) A
decrease in leaf angle by 30 o distinctively decreased light absorption by 18 Under
Fig 233 Effect of leaf elevation angle on cumulated light absorption from top
(phytomer 1) to bottom of the canopy under winter (left) and summer (right) light
conditions 0o refers to the reference structure with an angle distribution ranging from 15o
(top leaves) to -23o (bottom leaves)
Chapter 23 Using FSPM to optimize plant structure in tomato
53
summer light conditions (Fig 233B) the increase was equal to 3 for plusmn30 o
treatments Interestingly in winter simulations the decrease in elevation angle by 30 o
did not only decrease light absorption but also changed the vertical distribution of
light absorption leading to a higher absorption at the top part of the canopy (Fig
233)
In general a change in elevation angle decreased canopy photosynthesis by 6 to
7 in winter which is similar to the reduction in light absorption (Table 1) However
when the angle was decreased by 30 o canopy photosynthesis decreased only by 11
while absorption was decreased by 18
Leaf phyllotaxis
Changes in phyllotactic angle hardly affected light absorption (data not shown)
and canopy photosynthesis (Table 1)
Leaflet angle
An increase in leaflet angle from completely horizontal leaflets (0 o) to an angle
of 22 o resulted in an increase in light absorption by 2 in winter (Fig 234A) and
8 (Fig 234B) in summer The subsequent increase in canopy photosynthesis was
2 under winter and 8 under summer light conditions (Table 1) When all leaflet
angles were 22 deg light absorption was 2 lower under winter and 4 under summer
light conditions compared to the reference plants (angle decreasing from 35 deg for
basal leaves to 0 deg for the terminal leaflet) (Fig 234) while canopy photosynthesis
exhibited the same increase for both seasonal conditions
Leaf shape
The simulations showed that longer and narrower leaves (LWgt1) increased
cumulative light absorption of the canopy in comparison to shorter and wider leaves
when leaf area was kept constant LW ratio was positively correlated with light
absorption (Fig 235) Light absorption was decreased by 8 and 12 respectively
in winter (Fig 235A) and 14 and 23 respectively in summer for a leaf ratio
decrease of 025 and 05 (Fig 235B) An increase in the LW ratio to 125 of the
reference value resulted in an increase in light absorption by 5 in winter and 4 in
summer When the ratio was 15 times as high as the reference ratio light absorption
Chapter 23 Using FSPM to optimize plant structure in tomato
54
Table 231 Assimilation rate (g CH2O m-2 d-1) in response to leaf elevation angle phyllotaxis leaflet angle and arrangement leaf length width ratio internode length scenarios as well as the optimized architectures Total canopy photosynthesis Winter Summer Leaf elevation angle -30o 47 405 -15o 5 405 0 (reference structure) 53 42 +15o 5 405 +30o 49 417 Leaf azimuth angle 110o 52 423 135o 53 418 160o (reference structure) 53 42 180o 51 417 Leaflet angle 0o 51 373 22o 52 405 From 35o to 0˚ (reference structure)
53 42
Leaflet arrangement
Longer leaflet petioles 52 394 Same area leaflets 5 393 Fewerbigger leaflets 49 418 reference structure 53 42 Leaf length width ratio 05 47 343 075 48 398 102 (reference structure) 53 42 125 55 442 15 56 446 Internode length 3 cm 43 37 5 cm 5 388 7 cm (reference structure) 53 42 10 cm 56 442 12 cm 57 446 Optimized canopy architecture Scenario A 56 452 Scenario B 59 467
Chapter 23 Using FSPM to optimize plant structure in tomato
55
Fig 234 Effect of leaflet angle on cumulated light absorption from top (phytomer 1) to
bottom of the canopy under winter (left) and summer (right) conditions In the reference
structure the angle is decreasing from 35o for basal leaflets to 0o for the terminal leaflet
was increased by 8 in winter and 10 in summer An increase in LW ratio to 2
did not further increase light absorption (data not shown) The effect of the different
treatments on canopy photosynthesis followed the trends observed in light absorption
but the total increase was 1- 2 smaller compared to the increase in light absorption
(Table 1)
Leaflet arrangement
Changing the arrangement of leaflets within a leaf while keeping leaf area
constant (Fig 232) affected the vertical light distribution as well as the total light
absorption The reference structure showed the maximum absorption under both
summer and winter conditions (Fig 236A and 236B) Plants with the reference
leaves ie exhibiting irregular leaflet size absorbed more light in the top portion of
the canopy (05 ndash 1 m) than leaves with equally sized leaflets Leaves with fewer but
bigger leaflets absorbed more light than leaves with more but smaller leaflets (Fig
236) An increase in petiole length slightly diminished both light absorption and
Chapter 23 Using FSPM to optimize plant structure in tomato
56
Fig 235 Effect of leaf shape on cumulated light absorption from top (phytomer 1) to
bottom of the canopy under winter (left) and summer (right) conditions Leaf shape is
referring to length-to-width ratio with reference structure having a ratio of 1
canopy photosynthesis in both seasonal conditions The effect of the difference in
vertical light distribution between the scenarios was reflected on canopy
photosynthesis where the leaf with leaflets of the same area exhibited 2 less canopy
photosynthesis in winter and 6 in summer than the other two scenarios (Table 1)
Fig 236 Effect of leaflet arrangement on cumulated light absorption from top
(phytomer 1) to bottom of the canopy under winter (left) and summer (right) light
conditions
Chapter 23 Using FSPM to optimize plant structure in tomato
57
Internode length
Light absorption and canopy photosynthesis were strongly affected by internode
length A decrease in the average internode length from 7 to 3 cm reduced cumulative
light absorption by 14 in winter and by 12 in summer An increase in internode
length from 7 cm to 10 cm resulted in an increase of light absorbed of 4 in winter
and 5 in summer while a further increase in internode lengths to 12 cm resulted in a
further increase in light absorption by 2 for each date With respect to canopy
photosynthesis the increase in internode length to 10 cm increased canopy
photosynthesis by 5 to 6 in summer and winter (Table 1) An increase to 12 cm
increased photosynthesis by 8 and 6 for winter and summer respectively
Ideotyping scenarios
According to the above assessment of architectural characteristics of the tomato
plant two ideotyping scenarios were designed In scenario A internode length was set
to 10 cm LW ratio to 15 while all other architectural characteristics were kept the
same as in the reference structure In scenario B plant structure consisted of the same
long internodes (10 cm) and a leaflet arrangement with long leaf petioles was chosen
while all other architectural characters remained the same as in the reference structure
Scenario A improved both light absorption (data not shown) and canopy
photosynthesis by 6 (Table 1) in winter and by 8 in summer respectively In
scenario B the construction of a more open structure of the canopy resulted in an
increase in light absorption of 11 in both winter and summer with a similar increase
in canopy photosynthesis
Discussion
From the result of this work we can conclude that both light absorbed and the
vertical distribution of light in the canopy are very important for crop photosynthesis
Analysing the effects of vertical light distribution showed that these effects strongly
differ between winter and summer light conditions Deep penetration of light into the
canopy has positive effects in summer while these effects are negative in winter
Under summer light conditions photosynthesis of the upper leaves may be close to
saturation which explains the positive effects of deep penetration of light This is in
contrast to the photosynthesis rate of lower leaves which remains unsaturated Under
winter light conditions photosynthesis of the upper leaves is far from saturation With
Chapter 23 Using FSPM to optimize plant structure in tomato
58
the same light intensity at leaf level upper leaves have a higher rate of photosynthesis
than lower leaves (eg Sarlikioti et al 2011) This effect dominates in winter
resulting in the lower crop photosynthesis when the light penetrates deeply into the
canopy
Leaf elevation angles are maybe among the best investigated traits It has been
shown that a change in the elevation angles significantly influences light captured in
different environments (Niinemets and Fleck 2002 Valladares and Pearcy 1998) In
our previous study (Sarlikioti et al 2011) we showed that changes in leaf angles
could have a substantial effect on both light absorption and photosynthesis In the
current study optimal results were achieved when leaf elevation angle distribution
ranged between 15 o (top) and -23 o (bottom) indicating that during the cultivation
period the plant orientates its leaves in such a way as to maximize light absorption and
therefore photosynthesis Deviations from that range failed to distinctly increase both
light absorption and photosynthesis though the vertical light distribution was
affected
Modifying the phyllotactic angle resulted in no improvement of light absorption
and photosynthesis These findings agree with those of Niklas (1998) who reported
that phyllotactic angle in a crop has no effect on light absorption or photosynthesis In
contrast to this Zotz et al (2002) reported that change of leaf phyllotaxis to a golden
angle of 1375 o significantly improved the light capture efficiency in an epiphytic
plant Nevertheless phyllotactic angle is very dependent on light competition
Although a change in the angle as such might have no direct effect on light absorption
and photosynthesis it might be followed by changes in other architectural
characteristics that may lead to an increase in plant efficiency with respect to light
absorption and photosynthesis
In our study we found that an increase in LW ratio of leaves by 05 boosted light
absorption by 8 in winter and 10 in summer In environments where light is not an
inhibiting parameter (eg because of an excess in radiation) structures that avoid
mutual shading of the leaf components as well as the shading between neighbouring
leaves can be advantageous for optimization of light absorption A high leaf LW ratio
has been reported to have a positive effect on light capture and crop photosynthesis in
many species (Falster and Westoby 2003) Other aspects of morphology of composite
leaves such as shape and number of leaflets have to our knowledge hardly been
investigated In forest species it has been shown that the space and degree of overlap
Chapter 23 Using FSPM to optimize plant structure in tomato
59
of the leaves in leaf clusters on the same branch has a significant effect on light
capture (Planchais and Sinoquet 1998)
Takenaka et al (1994) showed that in general an increase in internode length
causes an increase in light absorption and photosynthetic efficiency in nature in fact
hormonally mediated internode elongation is among the most important mechanisms
of the so-called shade avoidance syndrome a set of processes that enable a plant to
avoid shading by neighbouring plants (Smith and Whitelam 1997) Our results
showed that plants with longer internodes exhibited higher light absorption and
photosynthesis both in winter and summer
The combination of different architectural parameters in the ideotype scenarios
resulted in an increase in both light absorption and canopy photosynthesis Both
ideotype scenarios aimed at creating a more open structure with more light absorption
In both cases this combination of characteristics led to an increase in photosynthesis
which in turn could potentially result in a yield increase Modern developments in
plant breeding can use this type of information to produce more efficient genotypes in
terms of canopy photosynthesis On the other hand plant architectural characteristics
are very plastic and plants are usually dynamically adapting to their environment
(Valladares et al 2007) thereby potentially eluding breeding efforts towards a light
absorption ideotype For example during the course of the day leaf movement has
been observed (Kao and Forseth 1992) or plants tend to readjust their position when
facing an intense environmental factor such as for example shading (Kahlen et al
2008) Thus even if this type of static model can give us a good quantification of the
effect of each parameter on light absorption and photosynthesis the ensuing genotype
has to be tested under actual cultivation conditions in order to verify the expectations
In the simulation model photosynthetic parameters decreased from top to the
bottom of the canopy These parameters were not adjusted with the increase or
decrease of light intensities in the middle and lower parts of the canopy In other
words no dynamic adaptation of these parameters to the new light profiles induced by
the case studies was considered In reality leaf photosynthetic potential of course
adapts to the long term light conditions a leaf has been exposed to (Gonzaacuteles-Real et
al 2007) as well as the short term changes in light climate during the day (Schurr et
al 2006) Experimental data describing these phenomena could help to improve the
model calculations by taking into account these adaptations
Chapter 23 Using FSPM to optimize plant structure in tomato
60
Conclusions
The importance of different plant architectural components for light absorption
and photosynthesis was investigated in detail using a static virtual plant Our
simulations lead to the conclusion that the most important architectural traits with
respect to the optimization of light absorption and photosynthesis are internode length
and leaf shape We also assessed the importance of vertical light distribution for
canopy photosynthesis and showed that the advantage of a deeper penetration of light
in the canopy depends on the season
Chapter 3 Monitoring PAR interception and photosynthetic stress
Chapter 31
Crop Reflectance as a Tool for Online Monitoring Of LAI and PAR Interception in Two Different Greenhouse Crops
Published as
Sarlikioti V Meinen E Marcelis LFM 2011 Crop reflectance as a tool for the
online monitoring of LAI and PAR interception in two different greenhouse Crops
Biosystems Engineering 108 113-120
Chapter 31 Crop reflectance for monitoring LAI and PAR interception
63
Abstract
The aim of this study was to explore ways of on-line monitoring of LAI and PAR
interception of the canopy in greenhouse conditions through reflectance
measurements on the PAR part of the spectrum for tomato and sweet pepper LAI and
PAR interception were measured at the same moments as reflectance at six
wavelengths in different plant developmental stages in greenhouses Normalized
Difference Vegetation Index (NDVI) was also calculated Relationships between the
measured parameters were established in experimental greenhouses and subsequently
these were tested in commercial greenhouses The best estimation for LAI and PAR
interception was obtained from reflectance at 460nm for both tomato and sweet
pepper The goodness of the fit validated with data from the commercial greenhouses
was also tested in this study The divergence of the results from the ones reported
from field experiments can be traced on the special greenhouse environment where
more sources of reflectance are added due to construction parts and a white plastic
covered background Thus this new approach of estimating LAI and PAR interception
from 460 nm is promising and can play a role in the decision support systems of
modern greenhouse management
Chapter 31 Crop reflectance for monitoring LAI and PAR interception
64
Introduction
Todayrsquos highly industrialized production of greenhouse crops in combination with
the increasing demand for a more sustainable production are pointing at the necessity of
decision support systems Methods of online monitoring of the major crop properties
should be established Leaf area is one of the most important crop properties which
have a strong physiological impact on plant functioning namely PAR interception and
thus photosynthesis Unfortunately current models of leaf area index (LAI)
development in use are not sufficiently correct and may lead to errors in calculating
light interception (Jonckheere et al 2004) PAR interception can currently be
measured manually A light stick is used to take measurements on the top and bottom
of the canopy In order to gain a reliable estimation of PAR interception many
measurements at different canopy spots are needed This method can therefore be
applied only for experimental purposes and not for commercial application as it is
rather time consuming Therefore the existence of an online monitoring technique
would improve the efficiency of the measurement
Optical remote sensing has been used in the past for the online monitoring of
parameters such as chlorophyll and nitrogen content plant stress etc in field grown
crops Attempts to measure LAI and PAR interception with the use of remote sensing
have been successful in field crops Different approaches have been used for the data
collection with sensors either on low range (ground) or far range (low flights or
satellites) (Bouman et al 1992 Clevers 1997) Efforts in the field to use reflectance
measurements for the estimation of the canopy nitrogen biomass and photosynthesis
in wheat (Gitelson et al 2002) potato (Jongschaap 2006) sugar beets (Clevers
1997) miscanthous (Vargas et al 2002) and rice (Tian et al 2005) were successful
Plant canopy exhibits strong absorption in the red part of the spectrum (around
670nm) where reflectance is less than 3-5 (Gitelson 2002) Low reflectance in this
part of the spectrum is strongly related to high light absorption from chlorophyll and
secondary photosynthetic pigments On the other hand in the near-infrared part of the
spectrum about 50 of the light is reflected 45 is transmitted and only a small part
is absorbed Turner et al 1999) The steep difference of canopy reflectance between
red and near-infrared enables the distinction of vegetation from background materials
(Bouman et al 1992)
Many studies aimed at determining combinations of reflectance of different
wavelengths for correcting the effect of disturbing factors (such as old leaves and soil
Chapter 31 Crop reflectance for monitoring LAI and PAR interception
65
background) on the relationship between crop reflectance and crop characteristics
such as LAI These combinations of the reflectance at different wavelength bands are
known as vegetation indices (VIrsquos) Vegetation indices are quantitative measures that
are used in an attempt to measure vegetation abundance or vigor (Wang et al 2005)
Some of the vegetation indices proposed during the years are the Weighted
Difference Vegetation Index (WDVI) (Bouman et al 1992) the infrared red (IRR)
ratio and the red edge leaf effect with the most commonly used the Normal
Difference Vegetation Index (NDVI) (Wang et al 2005) NDVI is based on ratios of
red (R) to near-infrared (NIR) reflectance where NDVI= (NIRminusR)(NIR+R) R and
NIR ratio-based indices are strongly rooted in the contrasting response of R and NIR
reflectance to increases in LAI (Chen et al 2002)
Though remote sensing has been applied quite successfully in the open field it
has not yet been tested in protected cultivations Open-field methods cannot directly be
transported in greenhouses due to complicating conditions such as existence of
greenhouse structure and ground covering with white plastic So research has yet to be
done to test under which conditions remote sensing can be applied for plant monitoring
inside a greenhouse The aim of this paper is to explore an accurate way for an on-line
estimation of LAI and PAR interception based on reflectance measurements in two
greenhouse grown crops (tomato and sweet pepper)
Materials and methods
Experiments
Seven experiments were conducted with tomato (Lycopersicon esculentum L
Exp 1-7) and two with sweet pepper (Capsicum annuum L Exp 8-9) grown in
greenhouses Experiments were conducted in experimental greenhouses (Exp 1- 4 for
tomato and Exp 8 for sweet pepper) for developing relationships estimating LAI and
PAR interception from canopy reflectance These relationships were afterwards tested
in commercial greenhouses (Exp 5-7 for tomato and Exp 9 for sweet pepper) In Exp
1 plants were evenly distributed in the greenhouse (plants were placed in equal
distances) In the other experiments plants were grown in rows For an overview of
the experiments see Table 311
Chapter 31 Crop reflectance for monitoring LAI and PAR interception
66
Table 311 Overview of set-up of all experiments the type of the measurements
taken and the plant age for the duration of the experiments Experimental
greenhouse refer to university facilities while commercial greenhouse refer to
units managed by growers LAI PAR interception of the crop and crop
reflectance were measured (+) unless otherwise indicated (-)
Measurements were taken every seven to fifteen days depending on the weather
conditions from a week after planting till the end of the cultivation cycle (table 1)
Diffuse radiation conditions were chosen in order to avoid measuring errors occurring
with direct sun conditions such as shadow stripes caused by the construction parts of
the greenhouse as well as low sun azimuth and insufficient cosine correction of the
diffuser
Reflectance measurements
For the reflectance measurements Cropscan MSR87 (CropScan Rochester
USA) sensor was used The downward facing sensor was equipped with eight
Exp No
Crop Plant age (in days from planting)
PAR interception
Reflectance LAI
1 tomato Experimental experiment
0-117 + + -
2 tomato Experimental greenhouse
0-117 + + -
3 tomato Experimental greenhouse
0-126 + + -
4 tomato Experimental greenhouse
0- 80 + + -
5 tomato Commercial greenhouse
2-171
+ + +
6 tomato Commercial greenhouse
180-240 + + -
7 tomato Commercial greenhouse
180-240 + + -
8 sweet pepper
Experimental greenhouse
58-73 + + +
9 sweet pepper
Commercial greenhouse
0-274 + + +
Chapter 31 Crop reflectance for monitoring LAI and PAR interception
67
spectral bands each covering approximately 20nm centered at 460 510 560 610
660 710 760 and 810 nm The data were recorded with a datalogger The sensor was
positioned parallel to the ground at 4m height The viewing angle of 28 degrees
resulted in a viewing area of 3 m2 At each measuring date reflectance was measured
in 8 independent plots of the crop canopy with 2 measurements per plot Data were
averaged per plot The effect of the background reflectance (white plastic) was
investigated with a small trial with new and old sheets of plastic as background The
difference on reflectance of the two treatments was a maximum of 10 when no crop
was present and diminished as the LAI was increasing (data not shown)
PAR interception measurements
PAR interception was measured above and below the canopy in the same spots as
reflectance For each position eight successive readings were taken For PAR
interception measurements a SunScan Canopy Analysis System SS1-UM-105 (Delta-
T Cambridge UK) was used Sunscan sensor consists of a light sensitive stick that is
1 meter long containing 64 photodiodes equally spaced along its length measuring
incident PAR light It was coupled with a Beam Fraction sensor (BFS) that measures
total light as well as PAR light levels The BFS sensor was mounted at the trellis on
the top of the greenhouse measuring the incident light on the canopy at the same time
with the measurements with the stick in the canopy
PAR interception was calculated as follows
PAR interception= 1-(PAR below the canopy PAR above the canopy) Eqn 311
In many crop models Lambert- Beers law (Monsi and Saeki 1953 Marcelis et al
1998) is used for the simulation of PAR interception by the crop It assumes uniform
and infinite canopy of randomly distributed absorbing leaves The amount of
photosynthetically active radiation intercepted (I) by a crop is calculated as
I= (1-ρ)I0(1-e-kL)100 Eqn 312
Where ρ stands for canopy reflection coefficient I0 is the radiation level at zero
canopy depth L the leaf area index of the canopy and k is the light extinction
coefficient of the crop Lambert- Beerrsquos law was applied on the data and the
extinction coefficient was calculated
Chapter 31 Crop reflectance for monitoring LAI and PAR interception
68
k= Ln(IIo) LAI Eqn 313
Leaf Area Index measurements
Leaf Area Index was measured destructively The leaves were sampled on the
same dates as the reflectance and PAR interception measurements and their leaf area
was measured with LI- COR 3100 meter (LICOR Inc Lincoln NE USA) A
minimum of 6 plants was used in each harvest when destructive measurements were
possible Yellowed and brown leaves were not measured
Full spectrum measurements on leaf level
Reflectance and transmittance of the full spectrum between 380nm-1100nm of
individual leaves of tomato and sweet pepper plants were measured with the use of
InstaSpec IV CCD spectrometer (Oriel Stradford CT USA) and LiCor 1800-12
(LICOR Inc Lincoln NE USA) integrating Sphere equipment The measurements
were performed on young and old leaves in a non- destructive way Eight leaves per
category were measured for each plant The measurements were repeated after two
weeks on the same leaves in order to investigate the spectral differences in time as
well as in canopy depth Data were then used to calculate the crop extinction
coefficient
k= kblradic (1-σ) Eqn 314
Where kbl (084) is the extinction coefficient for a crop with spherical leaf elevation
angle distribution when the crop is composed of black leaves and σ is the scattering
coefficient The wavelength dependent scattering coefficient σ equals the sum of
reflection and transmission and was derived from the spectrometer measurements per
wavelength at the leaf level Consequently Eqn 314 scales up this leaf property to
crop level The above methods were derived from and elaborated upon in detail by
Goudriaan and Van Laar (1994) The k values calculated from Eqn 314 where then
compared with the k-values derived from Eqn 313
Vegetation Indices (VIs)
Normal Difference Vegetation Index (NDVI) was calculated from the available
reflectance data NDVI was calculated as (Wang et al 2005)
Chapter 31 Crop reflectance for monitoring LAI and PAR interception
69
NDVI= (R660-R810)(R660+R810) Eqn 315
where R660 and R810 is the reflectance at 660nm and 810nm respectively NDVI
was tested against single wavelength reflectance measurements
Statistical Analysis
For the statistical analysis of the results the GenStat 9th edition software package
was used Regression analysis was applied to the data and linear polynomial and
exponential models were tested in terms of the best fit on the basis of the adjusted R2
and the standardized residuals (plt005)
Results
The natural log of IIo showed a linear relationship with LAI in both tomato and
sweet pepper following the Lambert- Beer law (Eqn 313 Fig 311) The extinction
coefficient derived from these data was 081 for sweet pepper and 068 tomato
Calculation of k from optical properties of individual leaves resulted to a k factor of
08 for sweet pepper and of 07 for tomato respectively (Eqn 314) The higher
extinction coefficient of the sweet pepper crop compared to tomato implies structural
differences between the two species that affect the way incident light is intercepted
Fig 311 Relation between leaf area index and fraction of light intercepted (IIo)
for tomato () and sweet pepper () (1A) The slope of the line represents the
extinction coefficient k Data are from experiment 1-7 for tomato and 8-9 for
sweet pepper
Chapter 31 Crop reflectance for monitoring LAI and PAR interception
70
Single tomato leaves have higher reflectance (61) than sweet pepper (18) for
PAR (400 nm to 700 nm) (Fig 312A and 312B) The difference is especially high
between 510 nm and 660 nm (average reflectance 74 and 25 for tomato and
sweet pepper respectively) that correspond to the green part of the spectrum and
beginning of the red part (Fig 312A and 312B) Leaf spectrum for tomato and sweet
pepper remains almost constant in the area of five out of eight bands measured (460
610 660 760 and 810 nm) by cropscan for measuring crop reflectance This spectrum
consistency enables the use of wider spectrum bands for the calculation of Vegetation
indices in general and NDVI in particular
0
25
50
75
100
400 500 600 700 800
Wavelength (nm)
Ref
lect
ance
()
0
25
50
75
100
Tran
smitt
ance
()
0
25
50
75
100
400 500 600 700 800
Wavelength (nm)
Ref
lect
ance
()
0
25
50
75
100
Tran
smitt
ance
()
Fig 312 Transmittance (black line) and reflectance (gray line) of individual leaves
of tomato (A) and sweet pepper (B) Data are from experiment 1 and 8
respectively
The relationship of LAI and PAR interception with canopy reflectance was
investigated for six wavebands as well as calculated NDVI (Eqn 315 table 312) on
tomato (Exp 1) and sweet pepper (Exp 8) The exponential regression model had the
best fit for all wavelengths For tomato crop PAR interception correlates well with
reflectance at three different wavelengths (460nm 510nm and 560nm) with a slightly
better fit at 460nm The same was observed for LAI Reflectance at 460nm gave the
best estimation for both LAI and PAR interception also for sweet pepper The use of
NDVI did not improve the estimation of PAR interception and LAI for any of the two
crops
Chapter 31 Crop reflectance for monitoring LAI and PAR interception
71
Table 312 Correlation of PAR interception by the crop and LAI (y-values) with crop
reflectance at different wavelengths and Normal Difference Vegetation Index (NDVI)
(x-values) in tomato and sweet pepper Fitted function was y= a+be-kx The R2 and
Root Mean Square Error (RMSE) are presented No of observations was 35 for
tomato (Exp 1) and 26 for sweet pepper (Exp 8)
Tomato Sweet pepper
Wavelengths PAR
Interception
()
LAI PAR
Interception
()
LAI
R2 RMSE R2 RMSE R2 RMSE R2 RMSE
460 978 455 954 029 966 747 884 036
510 976 474 947 032 95 548 857 039
560 977 470 943 045 946 568 833 042
610 854 118 868 068 809 107 618 064
660 954 663 924 060 886 846 745 054
710 932 801 901 079 649 145 453 077
NDVI 873 11 856 052 894 815 79 049
During plant growth LAI increases resulting in an increase of PAR interception
of the crop A decrease in the amount of reflected light exponentially decreased with
the increase of LAI and PAR interception for both crops (Fig 313) Tomato crop
reflects more when LAI is small (lt05) than sweet pepper
Chapter 31 Crop reflectance for monitoring LAI and PAR interception
72
Fig 313 Correlation of reflectance at 460 nm with PAR interception (A B) and LAI
(C D) for tomato (A C) and sweet pepper plants (B D) in experimental trials
Data points are from experiment 1-4 for tomato and experiment 8 for sweet
pepper
The relationships established from the first trials were then tested for data
gathered from commercial greenhouses The diversity of the cultivation practices of
the greenhouses on which those data were taken was a good test for the robustness of
the relationship of reflectance at 460nm with LAI and PAR interception (Fig 314)
For tomato the fit of the established relationships was good for PAR interception (R2=
952 se=635) and LAI (R2= 894 se=051) For sweet pepper the fitting gave
reasonable results for both PAR interception (R2= 894 se=051) and LAI (R2= 798
se=076)
A
C D
B
Chapter 31 Crop reflectance for monitoring LAI and PAR interception
73
Fig 314 Validation of the relationship between reflectance at 460 nm with PAR
interception and LAI for tomato (Fig 4A and 4C respectively) and sweet pepper
(Fig 4B and 4D respectively) plants in commercial greenhouses The lines are from
Fig 3 Based on experimental greenhouses experiments Data points are from
experiment 5-7 for tomato and experiment 9 for sweet pepper
Discussion
This study explores an accurate way for the online estimation of LAI and PAR
interception of the crop through remote reflectance measurements as well as the
robustness of such a method for tomato and sweet pepper grown in a greenhouse For
that reason six different wavelengths covering an area of the spectrum from blue to
red and NDVI were tested Previous studies performed with field crops showed a
correlation of PAR interception and LAI with reflectance in the RNIR region of the
spectrum (Bouman 1994 Clevers 1997) In our study nevertheless the best
correlation was achieved at 460nm for both tomato and sweet pepper A B
A
B
C
D
Chapter 31 Crop reflectance for monitoring LAI and PAR interception
74
The difference between field application results and the ones reported here can
mainly be explained from the added reflectance inside the greenhouse from the
various metallic parts and especially the white plastic that covers the floor These
special characteristics of the greenhouse production system ask for a new approach on
remote monitoring than the ones already used in the open-field and is proposed in this
study Relationships established in this study were further validated with data from
commercial greenhouses The relationship between reflectance PAR interception and
LAI was best described by an inverse exponential curve similar to the types of curves
used in field experiments of potato (Bouman 1994) and miscanthus (Varga et al
2002) for LAI monitoring In this study the relationships between LAI PAR
interception and crop reflectance were established under diffuse light conditions
Corrections for the bidirectional reflectance can be used for sensor corrections for
saturation problems of the sensor under direct light conditions This method can be
successfully applied to the field for remote sensing techniques In the particular case
of the greenhouse measurements under direct light conditions might be highly
variable by shadows caused by the construction parts of the greenhouse and
reflectance from the glass
Light in plants is highly absorbed in the red and a little less in the blue part of the
spectrum It is expected that reflectance in these particular regions will increase with
the growth as usually more LAI indicates more light interception and less light
reflectance The 460 nm wavelength is located on the blue part of the spectrum partly
explaining the good correlation between the data Reflectance at 460 nm was high
(~65) in an empty greenhouse because of the reflectance of the construction parts
and the white plastic on the floor (data not shown) The difference between crop and
background reflectance makes it easier to monitor changes in the leaf area of the
plant inside the greenhouse Also the lack of differences between plastic sheets in
different stages of wear provide an additional robustness to the estimation method
presented on this paper Finally around 460 nm reflectance hardly changes with the
wavelength diminishing any errors arising from the sensor
After both crops reach a LAI of about 3 and PAR interception of about 90
variation is high and an accurate estimation of LAI and therefore PAR interception
from reflectance is no longer possible This variation is mainly due to the fact that in
the visible region of the spectrum only the reflectance of the upper leaf layers
determines the contribution of the canopy to the total measured reflectance So if LAI
Chapter 31 Crop reflectance for monitoring LAI and PAR interception
75
is higher than 3 not much more light is intercepted and therefore reflectance changes
are no longer perceived When LAI is higher than three 90 of PAR is already
intercepted by the canopy and further LAI increase has only a small impact on PAR
interception In this context an accurate knowledge of LAI in the early developmental
stages is more important than in later stages
Increasing LAI lead to increasing PAR interception and following Lambert- Beer
law The k value calculated for the extinction coefficient for tomato was similar to the
values reported in the literature (Atheron and Rudich 1986) Sweet pepper seems to
have a little higher light interception for the same LAI as tomato which is in
accordance with the fact that it also shows lower reflectance both in leaf and canopy
level than tomato plants For sweet pepper a k factor varying from 06 to 145 have
been reported in the literature (Nederhoff and Vegter 1994) The k factor of 081 that
was calculated from our data is within this range Extinction coefficient is an
important input parameter in most crop models Most models assume that extinction
coefficient is constant and the value used as an input is either calculated by
experimental data or from literature Because the extinction coefficient depends on
canopy structure (for example leaf elevation angle) its value can change with the
growth of the plant With our method of estimating LAI and PAR interception it is
possible to calculate extinction coefficient from the start of the cultivation until the
crop is fully grown
The normalized difference vegetation index (NDVI) is widely used in field
applications for the estimation of LAI NDVI is based on plant physiological
processes and particularly in the difference between leaf absorption of red light and
non- absorbance of the NIR light Despite the wide use of this index in the open fields
(Wang et al 2002 Hoffmann and Blomberg 2004 Elwadie et al 2005) single
waveband at 460nm performed better in our case in estimating PAR interception or
LAI in greenhouse conditions The decreased accuracy of NDVI inside the
greenhouse is probably a result of the added reflectance from the construction parts of
the greenhouse as well as the background cover in all part of the spectrum and
especially the red
Conclusions
Reflectance measurements offer a non- destructive way to estimate PAR
interception and LAI (up to the value of 3) in greenhouse production systems The
Chapter 31 Crop reflectance for monitoring LAI and PAR interception
76
relationship established from the current work between reflectance at 460 nm PAR
interception and LAI for both tomato and sweet pepper can become a good tool for
crop online monitoring in greenhouse conditions Furthermore if information from
reflectance sensors are inputted directly into crop models new opportunities for
decision support in greenhouse production could be opened
Chapter 32
Photochemical reflectance index as a mean of monitoring early photosynthetic stress
Published as
Sarlikioti V Driever SM Marcelis LFM 2010 Photochemical reflectance index
as a mean of monitoring early water stress Annals of Applied Biology 157 81-89
Chapter 32 PRI as a mean of monitoring early photosynthetic stress
79
Abstract
Water stress in plants affects a number of physiological processes such as
photosynthetic rate stomatal conductance as well as the operating efficiency of PSII
and non- photochemical quenching Photochemical Reflectance Index (PRI) is
reported to be sensitive to changes of xanthophyll cycle that occur during stress and
could possibly be used to monitor changes in the parameters mentioned before
Therefore the aim of this study was to evaluate the use of PRI as an early water stress
indicator Water stress treatment was imposed in a greenhouse tomato crop CO2
assimilation stomatal conductance light and dark adapted fluorescence as well as PRI
and relative water content of the rooting medium RWCs where repeatedly
measured The same measurements were also performed on well-irrigated plants that
acted as a reference The experiment was repeated in four consecutive weeks Results
showed a strong correlation between RWCs and photosynthetic rate stomatal
conductance non- photochemical quenching and operating efficiency of PSII but not
with PRI when the whole dataset was considered Nevertheless more detailed analysis
revealed that PRI gave a good correlation when light levels where above 700μmol m-2
s-1 Therefore the use of PRI as a water stress indicator cannot be independent of the
ambient light conditions
Chapter 32 PRI as a mean of monitoring early photosynthetic stress
80
Introduction
Plant water status is an important aspect of crop management in greenhouse
cultivation Water stress affects plants water regulation leading to changes in
physiological processes Thornley and Johnson (1990) noted that water stress often
reduces plant growth by reducing leaf area development and increasing carbohydrate
partitioning to the roots According to Foolad et al (2003) when water stress was
imposed during the reproductive stages of tomato plants its effects on these processes
were found to be dependent on the degree of stress Moderate water stress imposed
just before flowering tended to accelerate flowering and fruit setting but high and
severe water stress retarded flowering and fruit setting and reduced the number of
flowers and fruits set per truss Nowadays production of tomato fruits in greenhouses
is a highly intensive agricultural industry where the cost profit limit is marginal and
efficient use of resources is vital The use of fresh water one of the most important
resources for this industry has been predicted to become more scarce in the future
(Hsiao et al 2007) Improving the efficiency of water use for irrigation is therefore
one of the key challenges for tomato growers Although much progress has been made
on optimizing water supply based on greenhouse climate data (Marcelis et al 2006)
only few methods use direct plant-based physiological indicators to detect the
occurrence of water stress An advantage of a reliable plant-based indicator over
model predictions based on greenhouse climate is that when stress can be detected in
an early stage water supply could be optimized
Water stress may occur when the water supply to the plant is not meeting its
transpiration demands Stomata opening is directly affected by water stress (Cornic
2000 Lawlor and Tezara 2009) When stomata are not sufficiently opened
photosynthetic rate starts to decrease as well as the quantum yield of photosystem II
(Chaves et al 2002) As a result of a decreased rate of CO2 assimilation light energy
absorbed by the leaf cannot be used to drive photosynthetic electron transport and a
part of this energy is dissipated as heat increasing the non-photochemical quenching
(Krause and Weis 1991 Baker and Rosenqvist 2004) Researchers have reported
changes in chlorophyll fluorescence corresponding to water stress (Baker and Ort
1992 Lichtenthaler and Babani 2000) Changes in plant physiological processes due
to water stress have also been linked to changes in plant reflectance in specific
wavelengths (Pinter et al 2003)
Chapter 32 PRI as a mean of monitoring early photosynthetic stress
81
Several studies have attempted to quantify water stress through remote sensing
(Bowman 1989 Pentildeuelas et al 1994) Spectral indices have been used to determine
real-time crop coefficients to improve irrigation scheduling (Bausch 1995) The
relationship between reflectance spectra and leaf water status have been studied in
numerous crop species as well as the possibility of estimating relative leaf water
content by reflectance in the range of the near infrared (Danson et al 1992 Danson
and Aldakheel 2000) Pentildeuelas et al (1993) have found that reflectance at 970 nm can
be a useful water status indicator but only when the stress is already well developed
Reflectance at 1400 and 1900 nm has been shown to correspond directly to water
content in plant tissue (Pentildeuelas et al 1997) as well as physical-based studies in short
wave infrared (1400ndash 2500 nm) (Ceccato et al 2001) Graeff and Claupein (2007)
showed that reflectance in the 510780 540780 4901300 and 5401300 nm wavelength
ranges can also become an indicator of plant water status (the values are for the
combination of two different reflectance filters used in the analysis) However
infrared reflected radiation is greatly affected by plant architecture crop density and
leaf structure thus increasing the uncertainty of estimation (Elachi 1987)
In this paper we define plant water stress as the loss of plant photosynthetic
activity induced by water deprivation The so-called photochemical reflectance index
(PRI = (R531 minus R570) (R531 + R570)) where R531 and R570 are reflectance signals
at 531 and 570 nm respectively has been used to monitor dynamic changes in
photosynthesis in water stressed plants (Evain et al 2004) PRI provides a quick and
non-destructive assessment on photosynthesis related physiological properties of the
leaf and canopy (Pentildeuelas et al 1994 Evain et al 2004 Weng et al 2006) for a wide
range of species (Gamon et al 1997 Guo and Trotter 2004) Changes in absorbance
and reflectance values around 531ndash535 nm as a result of nutrient stress have been
related to ΔpH-mediated chloroplast shrinkage and to changes in the aggregation state
of antenna pigmentndashprotein complexes mediated by an accumulation of de-epoxidized
forms of the xanthophyll cycle molecules (Morales et al 1990 Ruban et al
1993)Since we defined water stress as the loss of plant photosynthetic activity
induced by water deprivation it comes to reason that PRI could be used for water
stress monitoring The epoxidation and de-epoxidation of the xanthophyll cycle is also
strongly related to the light environment (Adams et al 1992 Lawlor and Tezara
2009) Although its applicability in detecting plant water stress has been tested in
crops grown under conditions of severe stress it is yet to be tested for early stages of
Chapter 32 PRI as a mean of monitoring early photosynthetic stress
82
water deprivation Therefore the aim of this paper is to evaluate PRI as an indicator of
early water stress
Materials and methods
Plant materials and water stress imposition
Tomato plants (Solanum lycopersicon cv Aranca) were grown on rockwool slabs
(at field capacity contains 80 solution 15 air pore space and 5 rockwool fibers)
in a glasshouse in Bleiswijk the Netherlands (52o 1rsquoN) Two week old plants were
planted on the rockwool slabs with three plants per slab on 16 June After plants
reached a height of 18m (17 July) measurements commenced Each plant was
irrigated by one dripper Plants were watered automatically (water flow 45 lh) with a
nutrient solution [major nutrients K 80 Ca 100 Mg 45 NO3 230 SO4 68 H2PO4
125 (mM) minor elements Fe 25 Mn 7 Zn 7 B 50 Cu 07 Mo 05 (microM)] with a
pH 55 and an EC of 4 mscm At the start of each experiment stress treatment was
applied by withholding water through removal of drippers from a rockwool slab with
three plants (hereafter referred to as stressed plants) Leaf measurements on these
three stressed plants and three normally irrigated plants (hereafter referred to as
reference plants) were performed on the first young fully developed leaf in full
exposure to the sun for three consecutive days after the dripper removal The
experiment was repeated in four consecutive weeks In each repetition drought stress
treatment was applied on a different slab with three new stressed plants and a different
slab was used as reference plants Measurements were performed every day in all
plants of each treatment Each day measurements were taken every half hour or every
hour from 900 till 1500
Growth conditions
Incident light at leaf level was measured every 5 minutes by LI-190 quantum
sensors (Licor Inc Lincoln NE USA) positioned at the same height as the
measured leaf The relative water content (RWCs) in the rooting medium (rockwool
slab) was monitored by WET sensors (Delta-T UK) positioned vertically in the slab
Five WET sensors per slab were used both in reference and stress treatment
Inside greenhouse temperature as well as the vapour pressure deficit (VPD) where
also monitored every 5 min during the experiment (table 321)
Chapter 32 PRI as a mean of monitoring early photosynthetic stress
83
Table 321 Climate conditions in the greenhouse Average values plusmnse of incident
PAR the inside greenhouse temperature (Tairin) and VPD are presented for each
repetition The repetitions were performed in 4 consecutive weeks Each repetition
lasted 3 days
Repetition Day PAR
(μmol m-2 s-1)
Tairin
(Co)
VPD
(kPa)
Rep 1
1 2221 plusmn4179 224 plusmn05 034 plusmn017
2 3486 plusmn455 224 plusmn05 054 plusmn02
3 12882 plusmn1669 212 plusmn012 027 plusmn003
Rep 2
1 7641 plusmn1933 215 plusmn003 114 plusmn008
2 5663 plusmn2866 215 plusmn004 007 plusmn004
3 6525 plusmn2801 235 plusmn003 009 plusmn017
Rep 3
1 5566 plusmn2696 259 plusmn006 01 plusmn005
2 6096 plusmn3341 259 plusmn008 008 plusmn002
3 1996 plusmn3782 256 plusmn009 023 plusmn011
Rep 4
1 4246 plusmn5757 199 plusmn004 011 plusmn020
2 4088 plusmn8597 199 plusmn004 024 plusmn030
3 2211 plusmn2973 205 plusmn054 026 plusmn029
PRI
The photochemical reflectance index of a leaf was measured by a PlantPen PRI
200 instrument (Photon Systems Instruments Ltd Czech Republic) The PlantPen was
clipped to a lateral leaflet Light from an internal dual wavelength light source at 531
and 570 nm was emitted to the leaf and reflectance was measured through a PIN
photodiode with a 500 to 600 nm bandpass filter Data of reflectance at 531 and 570
nm as well as the calculated PRI value was collected Measurements were taken every
half hour from three plants from the stress treatment and three reference plants The
instrument measures an area of 05 cm2 The average of eight measurements from
randomly chosen positions on each selected leaf were taken for a representative
measurement of PRI
Chapter 32 PRI as a mean of monitoring early photosynthetic stress
84
CO2 assimilation rate
The CO2 assimilation rate was measured every half hour with the use of a portable
open gas exchange measurement equipment (LCpro+ ADC UK) The lateral leaflet
of the chosen leaf was clamped in the chamber (625 cm2 leaf area) The measurement
conditions were 800 ppm CO2 and 700 μmol m-2 s-1 PAR with a vapour pressure
deficit (VPD) of 635 kPa Vapour pressure deficit and CO2 concentrations were
similar to those in the greenhouse environment The light intensity given was the
average value of ambient irradiance on a sunny day Constant light was used in the
measurement to ensure that light intensity was sufficiently high and allowed
comparison between treatments Measurements were taken every minute for 12
minutes and CO2 assimilation rate was then calculated as the average of the last three
measured rates (ie the measurements at 10 11 and 12 minutes) The period of the 12
minutes was previously determined as the time needed for stabilization of stomatal
conductance and CO2 assimilation rate
Stomatal conductance
Stomatal conductance of a leaf was measured with an AP4 porometer (Delta-T
UK) The set relative humidity was the same as the greenhouse condition The
porometer was calibrated every 3 hours or when changes in environmental conditions
in the greenhouse prevented accurate measurements (temperature difference plusmn2oC
from calibration temperature) Stomatal conductance was measured every half an
hour Three measurements per leaf from three plants per treatment were taken to
obtain a representative measurement
Chlorophyll Fluorescence
Chlorophyll fluorescence parameters were measured every hour with a Dual-PAM-
100 (Heinz Walz GmpH Germany) A leaflet was clamped into the optical unit and
was continuously illuminated with white actinic light at an irradiance of 700 μmol m-2
s-1 (same level as for CO2 assimilation measurements) The steady-state fluorescence
(Fprime) was recorded after 6 minutes before a saturation pulse was imposed to the leaf in
order to determine the maximal fluorescence level in the light adapted state (Fprimem) The
leaf was then darkened for 25 min thereafter minimal fluorescence (Fo) was
measured During dark adaptation the modulated measuring light was sufficiently
low (lt01 μmol m-2 s-1) not to induce any significantly variable fluorescence
Chapter 32 PRI as a mean of monitoring early photosynthetic stress
85
Maximal fluorescence (Fm) was measured after saturating light was applied for 08s at
3000 μmol m-2 s-1 to the already dark adapted leaf These measurements were used to
calculate the operating efficiency of PSII (FqprimeFprimem = (Fprimem- Fprime)Fprimem) the maximum
quantum efficiency of PSII (FvFm) as a relative measure of the maximum quantum
yield of PSII primary photochemistry (Bjoumlrkman and Demmig 1987) and the non-
photochemical quenching (NPQ calculated as (FmFprimem) minus 1) (Bilger and Bjoumlrkman
1990 Baker 2008)
Statistical analysis
The data were analysed with Genstat 11 software Regression analysis using linear
and polynomial models were used to assess the relationship between RWCs and the
other response variables The significance of model terms was tested using the F-test
at the p = 005 level of significance The goodness of fit of models was considered
using the adjusted (for the number of model terms) R2
Results
Environmental conditions in general and incident light intensity in particular varied
greatly between repetitions (weeks) days of a week and during the course of a day
during the experiment The inside temperature varied as a day average from 20oC to
26oC while VPD fluctuated from 007 to 114 kPa (table 321)
Water stress was induced gradually in tomato plants by withholding water (Fig
321A) Although the way of withholding water was identical for all repetitions the
rate at which the relative water content of the rockwool slab (RWCs) decreased
differed The final RWCs that was reached at the end of each repetition varied from
23 to 75 This variation was due to variable transpiration as a result of the
variation in climatic conditions Light levels varied on average from 1288 μmol m-2 s-
1 to 7641 μmol m-2 s-1(Table 1) Withholding water reduced CO2 assimilation by up to
52 while stomatal conductance was reduced by up to 70 CO2 assimilation (Fig
321A) as well as stomatal conductance (Fig 321B) showed a high and positive
correlation with RWCs
The operating efficiency of the PSII (FprimeqFprimem) was decreased up to 20 (the
percentage is expressing the maximum difference between the lowest (045) and the
maximum value (0525 - 057)) in response to lowered RWCs for all repetitions
Chapter 32 PRI as a mean of monitoring early photosynthetic stress
86
(Fig 321C) while NPQ increased considerably with the decrease of RWCs (Fig
321D) with an increase in the range of 100-216 for the different repetitions
Fig 321 Correlation of CO2 assimilation (se of intercept= 847 of B1= 026 and
B2= 0001 R2= 079 s2= 549 with 10 df) Stomatal conductance (se of
intercept= 24088 of B1= 71 and B2= 0049 R2= 086 s2= 26919 with 9 df)
Quantum yield of PSII efficiency (Fm- F) Fm) (se of intercept= 124 and of
B= 000104 R2= 071 s2= 361 with 8 df) and NPQ (se of intercept= 00826
of B1= and B2= R2= 068 s2= 553 with 11 df) with relative water content of
the rooting medium Data points represent daily averages (n=12 for CO2
assimilation and stomatal conductance n=6 for (Fm- F) Fm and NPQ) Closed
symbols (diams) represent values of plants with imposed water stress and open
symbols represent (loz) control plants Vertical bars indicate standard error of
mean
Chapter 32 PRI as a mean of monitoring early photosynthetic stress
87
Although all chlorophyll fluorescence parameters mentioned above showed a
direct response to reduction of water availability this response was not clearly
observed for PRI (Fig 322) PRI gradually decreased with RWCs
Fig 322 Correlation between PRI and slab relative water content (se of intercept=
00037 and of B1= 5 10-5 R2= 061 s2179 with 10 df) t PRI values correspond
to daily averages (n=12) Closed symbols (diams) represent values of plants with
imposed water stress and open symbols represent (loz) control plants Vertical bars
indicate standard error of mean
Previous studies show that PRI is sensitive to changes in light intensity To
investigate the relationship between RWCs and PRI in relation to light intensity the
data were divided into four different categories on the basis of the occurring light
levels during the repetitions These levels were i 0-299 μmol m-2 s-1 ii 300-499
μmol m-2 s-1 iii 500-699 μmol m-2 s-1 and iv 700-850 μmol m-2 s-1 PRI showed no
statistical relationship with RWCs for light intensities from 0-699 μmol m-2 s-1 (Fig
323A-323C) Nevertheless when radiation was above 700 μmol m-2 s-1 PRI showed
a good correlation with RWCs (R2= 083 plt 001) (Fig 323D) In this category
PRI decreased as much as 35
Chapter 32 PRI as a mean of monitoring early photosynthetic stress
88
Fig 323 Correlation of PRI and slab relative water content for light intensities
varying from 0-299 μmol m-2 s-1 300- 499μmol m-2 s-1 500-699 μmol m-2 s-1 and
700-850 μmol m-2 s-1 (se of intercept= 0015 of B1= 5210-4 and B2= 4110-6
R2= 080 s2= 29810-5 with 12 df) Data points represent half-hour
measurements
For light levels above 700 μmol m2 s-1 PRI showed a statistically significant
correlation with CO2 assimilation (R2= 066 plt001) stomatal conductance (R2=
063 plt 001) the operating efficiency of PSII (R2= 07 plt 001) and NPQ (R2=
069 plt 001) (Fig 324) This correlation was not observed in lower light levels
Chapter 32 PRI as a mean of monitoring early photosynthetic stress
89
Fig 324 Correlation of CO2 assimilation (se of intercept=615 and of B=549 R2=
068 s2= 842 with 14 df) Stomatal conductance (se of intercept=13533 and of
B=12079 R2= 066s2= 40795 with 14 df) Quantum yield of PSII efficiency
(Fm- F) Fm) (se of intercept= 081 of B1= 1445 and B2= 6333 R2= 071 s2=
000155 with 6 df) and NPQ (se of intercept= 445 of B1= 7923 and B2= 347
R2= 068 s2= 0046 with 6 df) with PRI for light intensities of 700-850 μmol m-
2 s-1 Data points represent half-hour measurements for CO2 assimilation and
stomatal conductance and hour measurements for (Fm- F) Fm and NPQ)
Discussion
The objective of this study was to evaluate PRI as a method for early detection of
water stress in a greenhouse tomato crop
The RWCs is a factor regularly used in literature for indication of water stress
imposed on plants In the current study it was shown that when RWCs decreased
plant physiological processes are affected More analytically a reduced RWCs
results in stomatal closure diminishing of the photosynthetic rate and quantum yield
as well as the increase of NPQ These results are in accordance with the observations
of Flexas and Medrano (2002) According to Cornic (2000) the stomatal closure is the
Chapter 32 PRI as a mean of monitoring early photosynthetic stress
90
primary cause of the reduction of photosynthesis under mild water stress and is also
dependent on the environmental conditions during drought (Schulze and Hall 1982)
and the velocity of the drought imposition (Flexas et al 1999) A significant
correlation between CO2 assimilation and stomatal conductance was found in the
currently presented experiment The development of water stress differed between
repetitions and was directly linked to changes in light
Chlorophyll fluorescence parameters have been reported to be sensitive to the plant
water status and plant stress in general (Lichtenthaler and Babani 2000 Baker and
Rosenqvist 2004) Increase of water stress generally decreases the FprimeqFprimem In order to
protect the photosystems from oxidation excess energy is dissipated as heat resulting
in a substantial increase of NPQ (Baker 2008) In the currently presented study NPQ
increased with decreasing RWCs which indicated its sensitivity to plant water stress
The decrease of quantum yield found here was similar to decreases observed by Evain
et al (2004) In stressed conditions excess energy on photosystems is dissipated as
heat from secondary pigments as the xanthophylls in order to protect the
photosystems from damage When fluorescence parameters are changed changes
should also be observed in PRI Sun et al (2007) and Penuẽla et al (1994) reported a
decrease in PRI with time of water withholding Also Suarez et al (2009) reported an
indirect relationship between PRI and water stress through a correlation of PRI with
canopy temperature Contrary to the aforementioned papers a direct effect of water
stress on PRI was not observed in the current study unless light levels were above
700 μmol m-2 s-1
When plants are exposed to abiotic and biotic stresses in the light decreases in
FvFm are frequently observed Zarco-Tejada et al(2000) observed a diurnal pattern in
FvFm Its value decreased during the middle of the day In most studies (Gamon et al
1997 Flexas and Medrano 2002) dark adapted fluorescence parameters are
measured under pre-dawn conditions and assumed to be steady for the rest of the day
Measurements done in the currently presented study showed variability in the dark
adapted maximal PSII efficiency (FvFm) during the day In early morning FvFm was
equal to 082 and decreased up to 10 by 1300 A similar reduction on FvFm values
during the day was also reported by Sobrado (2008) This indicates that the common
practice of measuring FvFm only in predawn conditions in stress experiments is not
representative for the variability of FvFm during the day and hence not suitable for
Chapter 32 PRI as a mean of monitoring early photosynthetic stress
91
calculation of parameters using either dark adapted Fm or Fo which could lead to
errors of estimation
When a plant is under stressed conditions non-photochemical quenching is
increased In the currently described experiment NPQ increased as the stress
progressed indicating a loss of energy from the photosytems as heat (Baker 2008) It
is well established that xanthophyll cycle contributes essentially to the dissipation of
the excess excitation energy in the PSII antenna under stressed plant conditions (Jahns
et al 2009) The increase in NPQ was more pronounced in days with high light levels
(gt700μmol m-2 s-1) indicating that the RWCs plays a synergetic role to light
(photoinhibition) affecting photosynthesis and stomatal conductance Water stress is
often indiscernible from photoinhibition in plants Lu and Zhang (1998) reported that
the extent of photoinhibition became more pronounced when the stress progressed
Similar synergistic effects of water and light stress on the photochemistry of the plants
are reported in the literature (Masojidek et al 1991 Giardi et al 1996 Genty et al
1987 Jefferies 1994) Many authors indeed argue that the degree of the damage to the
photosynthetic properties of the plant by water stress can be amplified by high
irradiancies (Powles 1984 Bjoumlrkman and Powles 1983)
Gamon et al (1990) as well as Ruban et al (1993) showed that PRI corresponds to
fast changes of incident light PRI is connected with the de-epoxidation state of the
xanthophylls in the photosynthetic cycle The xanthophyll cycle role is mainly to
protect the photosystem from damage under stress conditions Therefore the
xanthophyll pool and the epoxidation state of the xanthophyll are also sensitive to the
incident light on the leaf level (Maxwell et al 1994 Schindler and Lichtenthaler
1994) The de- epoxidation cycle starts only when light absorbed by chlorophyll
reaches excessive levels In the Mediterranean region where the light is in abundance
especially in summer period PRI was used to track successfully the crop water status
Gamon et al (1997) reported that PRI correlated well with light use efficiency only
under high light conditions (PPFDlt500μmol m-2 s-1) On the other hand Sims et al
(2006) did not observe a direct correlation between PRI and LUE during the day In
our experiment we showed that PRI is strongly correlating with RWCs only when
PPFD became higher than 700μmol m-2 s-1 indicating that light is of prime
importance when it comes to PRI As Barton and North (2001) showed with a model
PRI is not only dependent on light levels but on plant structure (Suarez et al 2008)
plant optical properties and sun position as well This assumption was confirmed also
Chapter 32 PRI as a mean of monitoring early photosynthetic stress
92
by Peguero-Pina (2008) who indicated that early day measurements of PRI when the
sun is still low do not correlate well with fluorescence as expected Since sun position
plays a role on PRI changes it comes to reason that greenhouse structure prohibits the
correct PRI functioning at certain hours of day Diversion between our data and the
published work at PRI can also be attributed to changes in latitude and consequently
to solar angle
Conclusions
In this paper it was shown that PRI can be used as an early water stress indicator
only when light intensity at crop level is above 700 μmol m-2 s-1 At lower values of
light intensity the relationship of PRI to RWCs was poor in comparison to
photosynthesis or fluorescence parameters that showed a high correlation to RWCs
For that reason we can conclude that PRI as water stress indicator cannot be
independent of the ambient light conditions and its use can make sense only under
conditions of high light
Chapter 4
General discussion
Chapter 4 General Discussion
96
The aim of this thesis was to explore different techniques to simulate and monitor
light interception and photosynthesis by a greenhouse grown tomato canopy For that
purpose a three dimensional model for accurate light interception and photosynthesis
was developed and different methodologies to monitor online these physiological
properties by means of remote sensing were explored In this chapter the advantages
of these approaches in the broader scientific field are discussed as well as their
shortcomings and how these can be surmounted
Modelling light interception and photosynthesis
Modelling light interception and photosynthesis are basic to plant modelling Both
these parameters are highly affected by plant architecture Light absorption is
dependent on both the optical properties of the leaf as well as the leaf position with
respect to the incoming light The importance of leaf position for light absorption is
such that an accurate representation of canopy structure in space is necessary for
correct light absorption simulations This need has been addressed recently by adding
one more dimension in plant modelling (Vos et al 2010)
Adding a dimension in plant modelling involves a number of tedious
measurements of plant architecture that are time consuming Even when the third
dimension is added to the model assumptions are introduced in order to simplify the
structure Leaf positioning towards the incoming light is dependent on the elevation
angle (angle of the single leaf to the horizontal) A common assumption in 3D
modelling however involves the use of an elevation angle distribution on the entire
canopy rather than attribute a specific elevation angle to the leaves that is dependent
on each age and relative rank in the canopy In this thesis (Chapter 22) we showed
clearly that an explicitly described leaf elevation angle distribution can improve
modelling accuracy up to 8 in light absorption in comparison to the ellipsoidal
distribution that is the normal approach of most models (Farque et al 2001)
The importance of a three- dimensional model is not confined to an accurate
simulation output but it can also improve our understanding of the impact of the
chosen experimental approaches on the acquired data In this thesis (Chapter 22) we
used the model to investigate the vertical light distribution inside a double row
canopy The results showed that leaves positioned towards the path absorbed more
light per unit leaf area than leaves positioned towards the middle of the plant row
This difference is important in the context of the common experimental approach to
Chapter 4 General Discussion
97
measure leaf photosynthesis only on leaves facing the path and not in the middle of
the plant row This approach can lead to serious errors of estimation if these data are
used for an estimation of canopy photosynthesis or the calibration of a plant model
The evaluation of experimental techniques through 3D modelling is starting to be
explored in the field since the addition of one more dimension can help improve the
microclimate simulation around different plant organs (Sinoquet et al 2005)
The general characteristics of plant architecture are defined by the plant genotype
Allowing for the environmental plasticity of the structure an ideotype structure can be
identified for each plant grown under certain environmental conditions The idea of a
plant ideotype is hardly new (Donald 1965) but the use of 3D models in exploring
plant phenotypes can prove a very important tool in plant breeding by cutting the time
and costs needed on the traditional approach A plant structure as any architectural
structure is a synthesis of a number of smaller components whose unique topology
and geometry can have a direct effect on light absorption and photosynthesis In the
thesis (Chapter 23) we identified as the main components of tomato architectural
structure the leaf elevation angle phyllotactic angle leaflet angle leaf length to width
ratio leaflet arrangement and internode length Then we proceeded to quantify the
effect of the change of each of these components both on light absorption and
photosynthesis From our analysis we found that the highest impact had the leaf
lengthwidth ratio and internode length depending on the light conditions From the
study we conclude that a more spatial arrangement of architectural components
increased both light absorption and photosynthesis Based on this result we proposed
two types of plant ideotypes for the particular conditions that both aimed at a more
spatial arrangement The model predicted a possible increase of photosynthesis of up
to 10 Highly interesting was the exploration of the effect of the vertical light
absorption profiles on photosynthesis for summer and winter Simulation data
presented in Chapter 23 showed that during summer higher photosynthesis was
expected when more light was absorbed from the lower leaves of the canopy while the
opposite was observed for the winter period This was caused by both overall light
intensity as well as the different light angle fot the different seasons Therefore it
becomes apparent that the vertical light distribution should not be ignored and that
total light interception alone is not enough for simulating photosynthesis
In the two dimensional models plant structure is approached by using the
extinction coefficient (k) as it is defined by Lambert-Beer law Although this factor is
Chapter 4 General Discussion
98
a good approximation it fails to explore the effect of the variations in vertical light
distributions As we showed in this thesis (Chapter 21) the extinction coefficient
changes not only with canopy depth but also with the increase of the row spacing
Therefore a single coefficient cannot be used for one crop or different cultivation
practises
In this thesis we used a static approach in modelling plant structure The choice to
use a static structure was based on the Dutch cultivation system that results in a
uniform plant structure throughout the seasons Nevertheless the model does not take
into account the daily changes of plant structure For example plants tend to rearrange
their structure during the day as well as during the growing season These dynamic
adaptations of plant structure should be taken into account in the model since they are
part of the plant strategy for optimum growth Some possible effects of the dynamic
leaf adaptation during the day are for example under low light conditions an
increasing photosynthetic production or under high light conditions avoiding photo
inhibition Studies have reported leaf movement during the day (Kao and Forseth
1992) These phenomena are quite important for our understanding of plant
interactions with their environment and should therefore be taken into account also in
a modelling approach especially if we use this type of modelling for proposing
possible optimum genotypes for particular environments
Online crop monitoring
Monitoring leaf area index and light interception
Leaf area index as well as light interception is an important component of plant
modelling Experimental methods to measure light interception are usually time
consuming and can only take a snapshot in a certain time period and therefore miss
the dynamics of this component Leaf area index is usually estimated using distractive
measurements which are not always possible to do and they limit the number of
samples being processed In order to avoid these pitfalls an effort has been made to
develop online non- destructive methods Remote sensing that monitors the light that
is reflected from the crop canopy has successfully been applied in the field (Clevers
1997 Gitelson et al 2002) Nevertheless this approach poses special challenges
inside the greenhouse environment as we have to take into account the interference of
scattering light from the construction parts of the greenhouse as well as reflectance
coming from the white plastic covering the soil (Chapter 31) Although it is not
Chapter 4 General Discussion
99
possible to directly apply these methodologies from the field in this thesis we showed
that we can develop new ones that can succesfully measure LAI and light interception
in the greenhouse environment
In field crops it is customary to monitor LAI by using a normalized index based
on the red area of the spectrum ie Normalized Difference Vegetation Index (NDVI)
(Wang et al 2005) The rationale behind using an index based on the red part of the
spectrum is based on the fact that light emitted in this part of the spectrum has a
strong link with structural and physiological processes of the plant In this thesis we
showed that this index cannot be used under greenhouse conditions and that
reflectance in the blue part of the spectrum gives a much better correlation with both
LAI and light interception On the contrary reflectance around 460nm showed a good
correlation with both LAI and light interception in different environments and in
several plant species An application of this findings in a permanent sensor that was
positioned on the top of the greenhouse and took reflectance measurements at 460nm
in real time gave also a good correlation between light interception and reflectance
(Janssen et al 2006) This differentiation between our result and what is usually
applied in the field can have a number of explanations One reason could be the
resolution of the sensor used in this experiment as the broad bands in which
reflectance was measured could miss the subtle changes in the reflectance both during
the day and during the season A sensor with higher resolution could address this
problem Another reason could be the background light scattering in the greenhouse is
so strong that is impossible to monitor reflectance changes in the red part of the
region
Monitoring photosynthetic stress
The ability to monitor photosynthetic activity is important not only for model
parameterisation but also for a dynamic assessment of plant status During the
cultivation period climatic stress parameters such as high light conditions or water
deprivation can cause a decrease in plant photosynthetic efficiency Different non-
destructive methods have been explored in recent years in order to monitor plant
stress for example canopy reflectance (Evain et al 2004) infrared cameras (Langton
et al 2002) fluorescence meters (Rosema et al 1998) pressure probes
(Zimmermann et al 2008) sap flow sensors (de Swaef and Steppe 2010) emitted
plant volatiles (Janssen et al 2009) In this thesis we studied the use of the
Chapter 4 General Discussion
100
photochemical reflectance index (PRI) as photosynthetic stress indicator The
photosynthetic stress was induced by applying water stress on the plants The results
of our experiment were positive under high light conditions where the stress effect
from the water deprivation was enhanced by photoinhibition The results from our
experiments showed that PRI can be used as an indicator of photosynthetic stress in
places where high light conditions occur it could be a useful tool in arid areas with
ubiquitous high irradiance levels however on a regular base its use has a limited
applicability for the relatively short summer period in the Netherlands
PRI uses wavelengths that have been related to the de-epoxidation of
xanthophylls During this process it was found that light is emitted from 500-545nm
The wavelength of 531nm used by PRI is linked with the fast-changes of the
xanthophyll cycle and possible is not the best measure for gradual changes of the
photosynthetic status A few studies have stated that instead of using 531nm a PRI
calculation based on spectra from 521-550nm (Gamon et al 1997 Wu et al 2008)
would give a better correlation with photosynthetic efficiency in some species This
shift in wavelength can be caused by the leaf morphology and the optical properties
(Noomen et al 2006)
Possibilities for further research
In this thesis we presented the advantages of a three-dimensional model approach
as well as the applicability of canopy reflectance as a tool for monitoring non-
destructively the leaf area index light interception and photosynthetic stress in the
plant canopy Based on the results of this thesis further steps to improve this work
and forward the research would include
bull Incorporate a dynamic component in plant architecture so as plant
development can be taken into account As discussed plant structure can
show high plasticity depending on the environmental conditions Functions
that predict plant palsticity would be helpful in our understanding of the
plant adapatation on its environment Such a dynamic adaptive model
could also prove a useful tool for investigating the performance of a
number of phenotypes in different environments for a whole cultivation
season without having to resort to expensive and time consuming
experimental methods
Chapter 4 General Discussion
101
bull In this thesis we measured PRI only in two specific wavelength However
as it was mentioned earlier in the discussion the wavelengths we used to
calculate PRI monitor only the fast kinetic changes of the xanthophylls
while the leaf morphology and the possible effect of the epidermis is not
taken into account Therefore the improvement of PRI efficiency should
be investigated in relation to the wavelengths related to the slow kinetics
of the xanthophyll cycle as well as determine the role of the leaf
morphology
bull Finally the model should be coupled to the monitoring sensors This online
feedback of the model in real time would be a powerful tool to improve the
model accuracy and also boost the efficiency of decision support systems
which in turn will enable the better management of the crop in terms of
yield and quality
References
103
References
Adams WWIII Volk M Hoehn A Demmig- Adams B 1992 Leaf orientation
and the response of the xanthophyll cycle to incident light Oecologia 90 404ndash
410
Atherton JG Rudich J 1986 The tomato crop a scientific basis for improvement
Chapman and Hall London
Baker NR Ort DR 1992 Light and crop photosynthetic performance In Crop
Photosynthesis Spatial and Temporal Determinants pp 289-312 London
Elsevier Science Publishers BV
Baker NR Rosenqvist E 2004 Applications of chlorophyll fluorescence can
improve crop production strategies an examination of future possibilities Journal
of Experimental Botany 55 1607ndash1621
Baker NR 2008 Chlorophyll Fluorescence A Probe of Photosynthesis In Vivo
Annual Review of Plant Biology 59 89ndash113
Baldocchi DD Finnigan JJ Wilson KW Paw KT Falge E 2000 On
measuring net ecosystem carbon exchange in complex terrain over tall vegetation
Boundary Layer Meteorology 96 257-291
Bartheacuteleacutemy D Caraglio Y 2007 Plant architecture a dynamic multilevel and
comprehensive approach to plant form structure and ontogeny Annals of Botany
99 375-407
Barton CVM North PRJ 2001 Remote sensing light use efficiency using the
photochemical reflectance index Remote sensing of Environment 78 264ndash273
Bausch WC 1995 Remote sensing of crop coefficients for improving the irrigation
scheduling of corn Agricultural Water Management 27 55ndash68
Bilger W Bjoumlrkman O 1990 Role of the xanthophylls cycle in photoprotection
elucidated by measurements of light-induced absorbance changes fluorescence
and photosynthesis in Hedera canariensis Photosynthetic Research 25 173ndash85
Bjoumlrkman O Powles B 1984 Inhibition of photosynthetic reactions under water
stress interaction with light level Planta 161 490-504
Bjoumlrkman O Demmig B 1987 Photon yield of O2 evolution and chlorophyll
fluorescence characteristics at 77 K among vascular plants of diverse origins
Planta 170 489ndash504
References
104
Boonen C Samson R Janssens K Pien H Lemeur R Berckmans D 2002
Scaling the spatial distribution of photosynthesis from leaf to canopy in a plant
growth chamber Ecological Modelling 156 201-212
Boote KJ Scholberg JMS 2006 Developing parameterizing and testing of
dynamic crop growth models for horticultural crops Acta Horticulturae 71823-
34
Borger CPD Hashem A Pathan S 2010 Manipulating Crop Row Orientation to
Suppress Weeds and Increase Crop Yield Weed Science 58 174-178
Bouman BAM Uenk D Haverkort AJ 1992 The estimation of ground cover of
potato by reflectance measurements Potato research 35 111- 125
Bouman BAM 1994 A framework to deal with uncertainty in soil and management
parameters in crop yield stimulation A case study in rice Agricultural systems
46 1- 17
Bowman WD 1989 The relationship between leaf water status gas exchange and
spectral reflectance in cotton leaves Remote Sensing of Environment 30 49ndash
255
Brites D Valladares F 2005 Implications of opposite phyllotaxis for light
interception efficiency of Mediterranean woody plants Trees 19 671-679
Buck-Sorlin G de Visser PHB Henke M Sarlikioti V van der Heijden
GWAM Marcelis LFM Vos J 2011 Towards a functional-structural plant
model of cut-rose - simulation of light environment light absorption
photosynthesis and interferences with the plant structure Annals of Botany in
press
Casella E Sinoquet H 2007 Botanical determinants of foliage clumping and light
interception in two-year-old coppice poplar canopies assessment from 3-D plant
mock-ups Annals of Forest Science 64 395- 404
Ceccato P Flasse S Tarantola S Jacquemoud S Gregoire J-M 2001
Detecting vegetation leaf water content using reflectance in the optical domain
Remote Sensing of Environment 77 22ndash33
Chaves MM Pereira JS Maroco J Rodrigues ML Ricardo CPP Osoacuterio
ML Carvalho I Faria T Pinheiro C 2002 How Plants Cope with Water
Stress in the Field Photosynthesis and Growth Annals of Botany 89 907ndash916
Chelle M Andrieu B 1998 The nested radiosity model for the distribution of light
within plant canopies Ecological Modelling 111 75-91
References
105
Chelle M 2005 Phylloclimate or the climate perceived by individual plant organs
What is it How to model it What for New Phytologist 166 781-90
Chen JM Pavlic G Brown L Cihlar J Leblanc SG White HP Hall RJ
Peddle D King DJ Trofymow JA Swift E Van der Sanden J Pellikka P
2002 Validation of Canada-wide leaf area index maps using ground
measurements and high and moderate resolution satellite imagery Remote
Sensing of Enviroment 80 165-184
Clevers JGPW 1997 A simplified approach for yield prediction of sugar beet
based on optical remote sensing data Remote Sensing of Environment 61 221-
228
Cornic G Briantais JM 1991 Portioning of photosynthetic electron flow between
CO2 and O2 reduction in C3 leaf (Phaseolus vulgaris L) at different CO2
concentrantions and during drought stress Planta 183 178ndash184
Cornic G 2000 Drought stress inhibits photosynthesis by decreasing stomatal
aperture- not by affecting ATP synthesis Trends in Plant Science 5 187ndash188
Cournegravede PH Mathieu A Houllier F Bartheacuteleacutemy D de Reffye P 2008
Computing competition for light in the GREENLAB model of plant growth a
contribution to the study of the effects of density on resource acquisition and
architectural development Annals of Botany 101 1207ndash1219
Danson FM Steven MD Malthus TJ Clark JA 1992 High-spectral
resolution data for determining leaf water content International Journal of Remote
Sensing 13 461ndash470
Danson FM Aldakheel YY 2000 Diurnal water stress in sugar beet spectral
reflectance measurements and modeling Agronomie 20 31ndash39
Dauzat J Clouvel P Luquet D Martin P 2008 Using virtual plants to analyse
the light-foraging efficiency of a low-density cotton crop Annals of Botany 101
1153ndash1166
De Castro F Fetcher N 1999 The effect of leaf clustering in the interception of
light in vegetal canopies theoretical considerations Ecological Modelling 116
125-134
de Swaef T Steppe K 2010 Linking stem diameter variations to sap flow turgor
and water potential in tomato Functional Plant Biology 37 429ndash438
Donald CM 1965 The breeding of crop ideotypes Euphytica 17 385-403
References
106
Dong QX Wang XL Yang LL Barczi JF De Reffye F 2007 Greenlab
tomato a 3D architectural model of tomato development New Zealand Journal of
Agricultural Research 50 1229-1233
Drouet JL Pagegraves L 2007 GRAAL-CN A model of Growth Architecture and
Allocation for Carbon and Nitrogen dynamics within whole plants formalized at
the organ level Ecological Modelling 206 231-249
Elachi C 1987 Introduction to the Physics and Techniques of Remote Sensing pp
66ndash71 New York John Wiley
Elwadie ME Pierce FJ Qi J 2005 Remote Sensing of Canopy Dynamics and
Biophysical Variables Estimation of Corn in Michigan Agronomy Journal 97
99-105
Evain S Flexas J Moya I 2004 A new instrument for passive remote sensing 2
Measurement of leaf and canopy reflectance changes at 531 nm and their
relationship with photosynthesis and chlorophyll fluorescence Remote Sensing of
Environment 91 175ndash185
Evers JB Vos J Fournier C Andrieu B Chelle M Struik PC 2005 Towards
a generic architectural model of tillering in Gramineae as exemplified by spring
wheat (Triticum aestivum) New Phytologist 166 801-812
Falster DS Westoby M 2003 Leafs size and angle vary widely across species
what consequences for light interception New Phytologist158 509-525
Farque L Sinoquet H Colin F 2001 Canopy structure and light interception in
Quercus petraea seedlings in relation to light regime and plant density Tree
Physiology 21 1257ndash1267
Farquhar GD von Caemmerer S Berry JA 1980 A biochemical-model of
photosynthetic CO2 assimilation in leaves of C3 species Planta 149 78-90
Flexas J Escalona JM Medrano H 1999 Water stress induces different
photosynthesis and electron transport rate regulation in grapevine Plant Cell and
Environment 22 39ndash48
Flexas J Medrano H 2002 Drought-inhibition of photosynthesis in C3 plants
stomatal and non-stomatal limitations revisited Annals of Botany 89 183ndash189
Foolad MR Zhang LP Subbiah P 2003 Genetics of drought tolerance during
seed germination in tomato Inheritance and QTL mapping Genome 46 536ndash
545
References
107
Forseth N 1990 Function of leaf movements 238ndash261 pp In Satter RL Gorton
HL Vogelmann TC (eds) The pulvinus motor organ for leaf movement
Fourcaud T Zhang X Stokes A Lambers H Koumlrner C 2008 Plant growth
modelling and applications the increasing importance of plant architecture in
growth models Annals of Botany 101 1053-1063
Frary A Fritz LA Tanksley SD 2004 A comparative study of the genetic
basis of natural variation in tomato leaf sepal and petal morphology
Theoretical and Applied Genetics 109 523-533
Gamon JA Field CB Bilger W Bjoumlrkman O Fredeen AL Pentildeuelas J
1990 Remote sensing of the xanthophyll cycle and chlorophyll fluorescence in
sunflower leaves and canopies Oecologia 85 1ndash7
Gamon JA Serrano L Surfus JS 1997 The photochemical reflectance index
An optical indicator of photosynthetic radiation use efficiency across species
functional types and nutrient levels Oecologia 112 492ndash498
Gary C Barczi JF Bertin N Tchamitchian M 1995 Simulations of individual
organ growth and development on a tomato plant a model and user-friendly
interface Acta Horticulturae 399 199ndash205
Gayler S Grams TEE Kozovits AR Winkler JB Luedemann G Priesack
E 2006 Analysis of competition effects in mono- and mixed cultures of juvenile
beech and spruce by means of the plant growth simulation model PLATHO Plant
Biology 8 503-514
Genty B Briantais JM Viera da Silva JB 1987 Effects of drought on primary
photosynthetic processes of cotton leaves Plant Physiology 83 360ndash364
Giardi MT Cona A Geiken B Kucera T Masojidek J Mattoo AK 1996
Long- term drought stress induces structural and functional reorganisation of
photosystem II Planta 199 118ndash125
Gilbert RA Heilman JL Juo ASR 2003 Diurnal and Seasonal Light
Transmission to Cowpea in SorghumndashCowpea Intercrops in Mali Journal of
Agronomy and Crop Science 189 21- 29
Gitelson AA 2002 Wide Dynamic Range Vegetation Index for remote
quantification of biophysical characteristics of Vegetation Journal of Plant
Physiology 161 165-173
Godin C 2000 Representing and encoding plant architecture a review Annals of
Forest Science 57 413-438
References
108
Godin C Sinoquet H 2005 Functional-structural plant modelling New Phytologist
166 705-708
Gonzaacutelez-Real MM Baille A Gutieacuterrez Colomer RP 2007 Leaf photosynthetic
properties and radiation profiles in a rose canopy (Rosa hybrida L) with bent
shoots Scientia Horticulturae 114 177ndash187
Goudriaan J van Laar HH 1994 Modelling potential crop growth processes
Kluwer Academic Publishers Dordrecht
Graeff S Claupein W 2007 Identification and discrimination of water stress in
wheat leaves ( Triticum aestivum L) by means of reflectance measurements
Irrigation Science 26 61ndash70
Guo J Trotter CM 2004 Estimating photosynthetic light-use efficiency using the
photochemical reflectance index variations among species Function Plant
Biology 31 255ndash265
Hanan J 1997 Virtual plants integrating architectural and physiological models
Environmental Modelling and Software 12 35-42
Heuvelink E 1999 Evaluation of a dynamic simulation model for tomato crop
growth and development Annals of Botany 83 413-422
Higashide T 2009 Light interception by tomato plants (Solanum lycopersicum)
grown on a sloped field Agricultural and Forest Meteoreology 149 756-762
Hoffmann CM Blomberg M 2004 Estimation of Leaf Area Index of Beta vulgaris
L Based on Optical Remote Sensing Data Journal of Agronomy and Crop
Science 190 197-204
Hsiao T Steduto P Fereres E 2007 A systematic and quantitative approach to
improve water use efficiency in agriculture Irrigation Science 25 209-231
Jahns P Latowski D Strzalka K 2009 Mechanism and regulation of the
violaxanthin cycle The role of antenna proteins and membrane lipids Biochimica
et biophysica acta-bioenergetics 1787 3ndash14
Jansen RMC Hofstee JW Wildt J Verstappen FWA Bouwmeester HJ
Posthumus MA Van Henten EJV 2009 Health monitoring of plants by their
emitted volatiles trichome damage and cell membrane damage are detectable at
greenhouse scale Annals of Applied Biology 154 441ndash452
Janssen HJJ Sarlikioti V Gieling ThH Meurs EJJ Marcelis LFM Van
Dugteren JR 2008 A prototype sensor for estimating light interception by
plants in a greenhouse Acta Horticulturae 801 621-627
References
109
Jefferies RA 1994 Drought and chlorophyll fluorescence in the fieldgrown potato
(Solanum tuberosum) Physiologia Plantarum 90 93ndash97
Jonckheere I Fleck S Nackaerts K Muys B Coppin P Weiss M Baret F
2004 Review of methods for in situ leaf area index determination Part I
Theories sensors and hemispherical photography Agricultural Forest
Meteorology 121 19- 35
Jongschaap REE 2006 Run- time calibration of simulation models by integrating
remote sensing estimates leaf area index and canopy nitrogen European Journal
of Agronomy 24 316-324
Kahlen K 2006 3D architectural modeling of greenhouse cucumber (Cucumis
sativus l) Using l-systems Acta horticulturae 718 51-58
Kahlen K Wiechers D Stuumltzel H 2008 Modelling leaf phototropism in a
cucumber canopy Functional Plant Biology 35 876-884
Kao WY Forseth IN 1992 Diurnal leaf movement chlorophyll fluorescence and
carbon assimilation in soybean grown under different nitrogen and water
availabilities Plant Cell and Environment 15 703-710
Krause GH Weis E 1991 Chlorophyll Fluorescence and Photosynthesis The
Basics Annual Review Plant Physiology Plant Molecular Biology 42 313ndash349
Lai CT Katul G Ellsworth D Oren R 2000 Modelling vegetationndashatmosphere
CO2 exchange by a coupled eulerianndashlagrangian approach Boundary-Layer
Meteorology 95 91-122
Langton FA Horridge JS Holdsworth MD Hamer PJC 2004 Control and
optimization of the greenhouse environment using infra-red sensors Acta
Horticulturae 633 145ndash152
Lawlor DW Tezara W 2009 Causes of decreased photosynthetic rate and
metabolic capacity in water-deficient leaf cells a critical evaluation of
mechanisms and integration of processes Annals of Botany 103 561-579
Lichtenthaler HK Babani F 2000 Detection of photosynthetic activity and water
stress by imaging the red chlorophyll fluorescence Plant Physiology and
Biochemistry 38 889ndash895
Lindenmayer A Prusinkiewicz P 1990 The algorithmic beauty of plants New
York Springer-Verlag
Lintz J Simonett DS 1976 Remote Sensing of the Environment 713 p Addison-
Wesley Reading Massachusetts
References
110
Louarn G Lecoeur J Lebon E 2008 A three-dimensional statistical
reconstruction model of grapevine (Vitis vinifera) simulating canopy structure
variability within and between cultivartraining system pairs Annals of Botany
1011167ndash1184
Lu C Zhang J 1998 Effects of water stress on photosynthesis chlorophyll
fluorescence and photoinhibition in wheat plants Australian Journal of Plant
Physiology 25 883ndash892
Maddonni GA Otegui ME Andrieu B Chelle M Casal JJ 2002 Maize
Leaves Turn Away from Neighbors Plant Physiology 130 1181-1189
Marcelis LFM Heuvelink E Goudriaan J 1998 Modelling of biomass
production and yield of horticultural crops a review Scientia Horticulturae 74
83-111
Marcelis LFM Van den Boogaard R Meinen E 2000 Control of crop growth
and nutrient supply by the combined use of crop models and plant sensors 351-
356 pp Proc Int Conf Modelling and control in agriculture horticulture and
post-harvested processing IFAC
Marcelis LFM Dieleman JA Kittas C De Groot F Buschmann C Van
Loon A Boulard T Brajeul E Kocsanyi L Garate A Wieringa G 2006
CLOSYS Closed system for water and nutrient management in horticulture Acta
Horticulturae 718 375ndash382
Masojidek J Trivedi S Halshaw L Alexiou A Hall DO 1991 The synergistic
effect of drought and light stresses in sorghum and pearl millet Plant Physiology
96 198ndash207
Maxwell C Griffiths H Young AJ 1994 Photosynthetic acclimation to light
regime and water stress by the C3-CAM epiphyte Guzmania monostachia gas-
exchange characteristics photochemical efficiency and the xanthophyll cycle
Functional Ecology 8 746ndash754
Meir P Kruijt B Broadmeadow M Barbosa E Kull O Carswell F Nobre
A Jarvis PG 2002 Acclimation of photosynthetic capacity to irradiance in tree
canopies in relation to leaf nitrogen concentration and leaf mass per unit area
Plant Cell amp Environment 25 343ndash357
Meacutethy M Joffre R Rambal S 1999 Remote Sensing of Canopy Photosynthetic
Performances Two Complementary Ways for Assessing the Photochemical
Reflectance Index Photosynthetica 37 239ndash247
References
111
Monsi M Saeki T 1953 Uumlber den lichtfaktor in den pflanzengesellschaften und
seine bedeutung fuumlr die stoffproduktion Japanese Journal of Botany 14 22-52
Morales F Abadiacutea A Abadiacutea J 1990 Characterization of the xanthophyll cycle
and other photosynthetic pigment changes induced by iron deficiency in sugar
beet (Beta vulgaris L) Plant Physiology 94 607ndash613
Najla S Vercambre G Pagegraves L Grasselly D Gautier H Geacutenard M 2009
Tomato plant architecture as affected by salinity Descriptive analysis and
integration in a 3-D simulation model Botany 87 893-904
Nederhoff EM Vegter JG 1994 Canopy Photosynthesis of Tomato Cucumber
and Sweet Pepper in Greenhouses Measurements Compared to Models Annals of
Botany 73 421-427
Niinemets Uuml Fleck S 2002 Petiole mechanics leaf inclination morphology and
investment in support in relation to light availability in the canopy of Liriodendron
tulipifera Oecologia 132 21-33
Niinemets U 2007 Photosynthesis and resource distribution through plant canopies
Plant Cell and Environment 30 1052-1071
Niklas KJ 1998 Light harvesting ldquofitness landscapesrdquo for vertical shoots with
different phyllotactic patterns 759-773 pp In Jean RV Barabeacute D eds Symmetry
in plants Singapore World Scientific Publishing Co Pte Ltd
Noomen MF Skidmore AK van der Meer FD Prins HHT 2006 Continuum
removed band depth analysis for detecting the effects of natural gas methane and
ethane on maize reflectance Remote Sensing of Environment 105262ndash270
Palmer JW 1989 The effects of row orientation tree height time or year and
latitude on light interception and distribution in model apple hedgerow canopies
Journal of Horticultural Scence 64 137- 145
Papadopoulos AP Pararajasingham S 1997 The influence of plant spacing on
light interception and use in greenhouse tomato ( Lycopersicon esculentum Mill)
A review Scientia Horticulturae 69 l-29
Pearcy R Roden J Gamon J 1990 Sunfleck dynamics in relation to canopy
structure in a soybean (Glycine max (L) Merr) canopy Agricultural and Forest
Meteorology 52 359-372
Pearcy RW Yang W 1998 The functional morphology of light capture and carbon
gain in the Redwood forest understorey plant Adenocaulon bicolor Hook
Functional Ecology 12 543-552
References
112
Peguero-Pina J Morales F Flexas J Gil-Pelegriacuten E Moya I 2008
Photochemistry remotely sensed physiological reflectance index and de-
epoxidation state of the xanthophyll cycle in Quercus coccifera under intense
drought Oecologia 156 1ndash11
Peng S Khush GS Virk P Tang Q Zou Y 2008 Progress in ideotype breeding
to increase rice yield potential Field Crops Research 108 32-38
Pentildeuelas J Biel C Serrano L Saveacute R 1993 The reflectance at the 950ndash 970 nm
region as an indicator of plant water stress International Journal of Remote
Sensing 14 1887ndash1905
Pentildeuelas J Gamon JA Freeden AL Merino J Field CB 1994 Reflectance
indices associated with physiological changes in nitrogen- and water-limited
sunflower leaves Remote Sensing of Environment 48 135ndash146
Pentildeuelas J Filella I Araus JL 1997 Visible and near-infrared reflectance
assessment of salinity effects on barley Crop Science 37 198ndash202
Peralta IE Spooner DM 2000 Classification of wild tomatoes A review
Kurtziana 28 45-54
Pinter JrPJ Hatfield JL Schepers JS Barnes EM Moran MS Daughtry
CST Upchurch DR 2003 Remote sensing for crop management
Photogrammetric Engineering and Remote Sensing 69 647ndash664
Planchais I Sinoquet H 1998 Foliage determinants of light absorption in sunny
and shaded branches of Fagus sylvatica (L) Agricultural and Forest Meteorology
89 241-253
Powles SB 1984 Photoinhibition of photosynthesis induced by visible light Annual
Review of Plant Physiology 35 15ndash44
Prusinkiewicz P 1999 A look at the visual modelling of plants using L-systems
Agronomie 19 211-224
Rakocevic M Sinoquet H Christophe A Varlet-Grancher C 2000 Assessing
the geometric structure of a white clover (Trifolium repens) canopy using 3D
digitizing Annals of Botany 86519-526
Rosema A Snel JFH Zahn H Buurmeijer WF Van Hove LWA 1998 The
relation between laser-induced chlorophyll fluorescence and photosynthesis
Remote Sensing of Environment 65 143ndash154
Ruban AV Young AJ Horton P 1993 Induction of nonphotochemical energy
dissipation and absorbance changes in leaves Plant Physiology 102 741ndash750
References
113
Schindler C Lichtenthaler HK 1994 Is there a correlation between light induced
zeaxanthin accumulation and quenching of variable chlorophyll a fluorescence
Plant Physiology Biochemistry 32 813ndash823
Schulze E-D Hall AE 1982 Stomatal responses water loss and CO2 assimilation
rates of plants in contrasting environments In Encyclopedia of plant physiology
Vol 12 Physiological plant ecology ecosystem processes 263ndash324 pp Eds OL
Lange PS Nobel CB Osmond and H Ziegler Berlin Germany Springer-Verlag
Schurr U Walter A Rascher U 2006 Functional dynamics of plant growth and
photosynthesis ndash from steady-state to dynamics ndash from homogeneity to
heterogeneity Plant Cell and Environment 29 340ndash352
Sievaumlnen R Nikinmaa E Nygren P Ozier-Lafontaine H Perttunen J Hakula
H 2000 Components of functionalndashstructural tree models Annals of Forest
Science 57 399-412
Sims DA Luo H Hastings S Oechel WC Rahman AF Gamon JA 2006
Parallel adjustments in vegetation greenness and ecosystem CO2 exchange in
response to drought in a Southern California chaparral ecosystem Remote
Sensing of the Environment 103 289-303
Sinoquet H Sonohat G Phattaralerphong J Godin C 2005 Foliage randomness
and light absorption in 3-D digitized trees an analysis from multiscale
discretization of the canopy Plant Cell and Environment 28 1158-1170
Smith H Whitelam GC 1997 The shade avoidance syndrome multiple responses
mediated by multiple phytochromes Plant Cell and Environment 20 840-844
Sobrado MA 2008 Leaf characteristics and diurnal variation of chlorophyll
fluorescence in leaves of the lsquobanarsquo vegetation of the amazon region
Photosynthetica 46 202-207
Stewart DW Costa C Dwyer L M Smith D L Hamilton R I Ma B L
2003 Canopy Structure Light Interception and Photosynthesis in Maize
Agronomie Journal 95 1465-1474
Suaacuterez L Zarco-Tejada PJ Sepulcre-Cantoacute G Peacuterez-Priego O Miller JR
Jimeacutenez-Muntildeoz JC Sobrino J 2008 Assessing canopy PRI for water stress
detection with diurnal airborne imagery Remote Sensing of the Environment
112 560-575
References
114
Suaacuterez L Zarco-Tejada PJ Berni JAJ Gonzalez-Dugo V Ferreres E 2009
Modeling PRI for water stress detection using radiative transfer models Remote
Sensing of the Environment 113 730-744
Sun P Grignetti A Liu S Casacchia R Salvatori R Pietrini F Loreto F
Centritto M 2007 Associated changes in physiological parameters and spectral
reflectance indices in olive (Olea europaea L) leaves in response to different
levels of water stress International Journal of Remote Sensing 29 1725ndash1743
Takenaka A 1994 Effects of leaf blade narrowness and petiole length on the light
capture efficiency of a shoot Ecological Research 9 109-114
Thornley JHM Johnson IR 1990 Plant and Crop Modelling In A Mathematical
Approach to Plant and Crop Physiology 669 pp Oxford UK Clarendon Press
Thurling N 1991 Application of the ideotype concept in breeding for higher yield in
the oilseed brassicas Field Crops Research 26 201-219
Tian YQ Zhu Y Cao W 2005 Monitoring leaf photosynthesis with canopy
spectral reflectance in rice Photosynthetica 43 481-489
Toler JE Murdock EC Stapleton GS Wallace SU 1999 Corn leaf orientation
effects on light interception intraspecific competition and grain yields Journal of
production agriculture 12 396-399
Turner DP Cohen WB Kennedy RE Fassnacht KS Briggs JM 1999
Relationships between Leaf Area Index and Landsat TM Spectral Vegetation
Indices across Three Temperate Zone Sites Remote Sensing of Environment 70
52-68
Valladares F Pearcy RW 1998 The functional ecology of shoot architecture in
sun and shade plants of Heteromeles arbutifolia M Roem a Californian chaparral
shrub Oecologia 114 1-10
Valladares F 2003 Light heterogeneity and plants from ecophysiology to species
coexistence and biodiversity Progress in Botany 439ndash471 pp Springer Verlag
Berlin Germany
Valladares F Gianoli E Goacutemez JM 2007 Ecological limits to plant phenotypic
plasticity New Phytologist 176 749ndash763
Valladares F Niinemets Uuml 2007 The architecture of plant crowns from design
rules to light capture and performance 101-149 pp In Pugnaire F Valladares F
eds Functional plant ecology New York Taylor and Francis
References
115
Vargas LA Andersen MN Jensen CR Joslashrgessen U 2002 Estimation of leaf
area index light interception and biomass of Miscanthus sinensis lsquoGoliathrsquofrom
radiation measurements Biomass and bioenergy 22 1-14
Vos J Marcelis LFM Evers JB 2007 Functional-structural plant modelling in
crop production adding a dimension 1-12 pp In Vos J Marcelis LFM De
Visser PHB Struik PC and Evers JB eds Functional-structural plant
modelling in crop production Springer Dordrecht
Vos J Evers JB Buck-Sorlin GH Andrieu B Chelle M de Visser PHB
2010 Functional-structural plant modelling a new versatile tool in crop science
Journal of Experimental Botany 61 2101-2115
Wang D Wilson C Shannon MC 2002 Interpretation of salinity and irrigation
effects on soybean canopy reflectance in visible and near-infrared spectrum
domain International Journal of Remote Sensing 23 811-824
Wang Q Adiku S Tenhunen J Granier A 2005 On the relationship of NDVI
with leaf area index in a deciduous forest site Remote Sensing of Environment
94 244-255
Weng JH Chen YN Liao TS 2006 Relationships between chlorophyll
fluorescence parameters and photochemical reflectance index of three species
adapted to different temperature regimes Functional Plant Biology 33 241ndash246
Werner C Ryel RJ Correia O Beyschlag W 2001 Structural and functional
variability within the canopy and its relevance for carbon gain and stress
avoidance Acta Oecologica 22 129-138
Zarco-Tejada PJ Miller JR Mohammed GH Noland TL 2000 Chlorophyll
Fluorescence Effects On Vegetation Apparent Reflectance I Leaf-Level
Measurements And Model Simulation Remote Sensing of Environment 74 582ndash
590
Zheng B Shi L Ma Y Deng Q Li B Guo Y 2008 Comparison of architecture
among different cultivars of hybrid rice using a spatial light model based on 3-D
digitizing Functional Plant Biology 35 900-910
Zimmermann D Reuss R Westhoff M Geszligner P Bauer W Bamberg E
Bentrup F-W Zimmermann U 2008 A novel non-invasive online-
monitoring versatile and easy plant-based probe for measuring leaf water status
Journal of Experimental Botany 59 3157ndash3167
References
116
Zotz G Reichling P Valladares F 2002 A simulation study on the importance of
size and related changes in leaf morphology and physiology for carbon gain in an
epiphytic Bromeliad Annals of Botany 90 437-443
119
Summary A greenhouse crop can be approached as an open system that can be affected by a
number of parameters such as light climate or nutrient supply In the last decades
efforts have been made to understand the functioning of this system and the
interaction between the different parameters The intensive nature of greenhouse
cultivation combined with the economic necessity to enlarge the farm size makes the
development of decision support systems (DSS) imperative to help the growers in
managing their farms efficiently The foundation of DSS are plant models and in order
to work more efficiently they should be able to receive information in real time from
sensors that measure different plant parameters such as light interception leaf area
index and photosynthetic stress in a non-destructive way In order to develop functional
DSS it is imperative to develop accurate models and monitoring techniques applied in
the specific greenhouse environment
The aim of this thesis was to explore different techniques to simulate and monitor
light interception and photosynthesis by a greenhouse grown tomato canopy Since
photosynthesis is directly linked to light absorption we opted to develop a three
dimensional model that takes into account the explicit plant architecture Different
methodologies to monitor these physiological properties online by means of remote
sensing were also explored
A number of physiological tomato models have been proposed the last
decades their main challenge being the correct simulation of fruit yield For this an
accurate simulation of light interception and thus photosynthesis is of primary
importance At present most process-based models and the majority of three
dimensional models include simplifications of plant architecture that can compromise
the accuracy of light interception simulations and accordingly canopy
photosynthesis In Chapter 21 the first steps towards the development of the model
are presented Light interception is highly dependent on the canopy structure which is
affected among others by the distance between plant rows the distance of plants
within the row leaf pruning and crop variety The model was used to test different
crop planting scenarios on their effect on light interception Light interception from
the planting scenarios was then compared with results of a totally homogeneous
canopy Also analysis of differences between manual measurements of leaf length
width elevation angle and leaf orientation was conducted Changes of leaf elevation
Summary
120
angles at two different times of the day were also measured In tomato differences in
leaf length width and elevation angle of the leaves were mainly observed in the upper
90cm of the plant in the still developing zone Changes of the architectural
characteristics of structural plant characteristics affected directly light interception by
the crop canopy Nevertheless even if plant structure stayed the same light
penetration could easily be manipulated by changing the row spacing in the crop thus
affecting light interception and potentially plant production
In Chapter 22 the development and calibration of a functional-structural tomato
model is fully described The model was used to investigate the canopy heterogeneity
of an explicitly described tomato canopy in relation to temporal dynamics of
horizontal and vertical light distribution and photosynthesis under direct and diffuse
light conditions The model consists of an architectural static virtual plant coupled
with a nested radiosity model for light absorption and a leaf photosynthesis module
Different scenarios for horizontal and vertical distributions of light interception
incident light and photosynthesis were investigated under diffuse and direct light
conditions Simulated light interception showed a good correspondence to the
measured values Explicitly described leaf elevation angles resulted in higher light
interception in the middle of the plant canopy compared to fixed and ellipsoidal leaf
elevation angle distribution models although the total light interception remained the
same The fraction of light intercepted at a north-south orientation of rows differed
from an east-west orientation by 10 in winter and 23 on summer days The
horizontal distribution of photosynthesis differed significantly between the top
middle and lower canopy layer Taking into account the vertical variation of leaf
photosynthetic parameters in the canopy led to ca 8 increase on simulated canopy
photosynthesis
Manipulation of plant structure can strongly affect light distribution in the canopy
and photosynthesis In Chapter 23 the idea of identifying different plant ideotypes
for optimization of light absorption and photosynthesis was explored Using the
functional-structural tomato model presented in the previous chapters a range of
different plant architectural characteristics were tested for two different seasons in
order to find the optimal architecture with respect to light absorption and
photosynthesis Sensitivity analyses were carried out for leaf elevation angle leaf
phyllotaxis leaflet angle leaf shape leaflet arrangement and internode length From
the results of this analysis two possible ideotypes were proposed Increasing light
Summary
121
absorption in the top part of the canopy by 25 without changing light absorption of
the canopy as a whole augmented photosynthesis by 6 in winter and decreased it
by 7 in summer The measured plant structure was already optimal with respect to
leaf elevation angle leaflet angle and leaflet arrangement for both light absorption and
photosynthesis while phyllotaxis had no effect Increasing the length-to-width ratio of
leaves by 15 or increasing internode length from 7 to 12 cm led to an increase of 7 ndash
10 for light absorption and photosynthesis The most important architectural traits
found were the internode length and the leaf shape as they affect vertical light
distribution in the canopy distinctly A new plant ideotype with more spacious canopy
architecture due to long internodes and long and narrow leaves led to an increase in
photosynthesis of up to 10
In Chapter 31 ways to monitor on-line LAI and PAR interception of the canopy
under greenhouse conditions through reflectance measurements were explored LAI
and PAR interception were measured at the same moments as reflectance at six
wavelengths in different developmental stages of tomato and sweet pepper plants
Normalized Difference Vegetation Index (NDVI) was calculated Relationships
between the measured parameters were established in experimental greenhouses and
subsequently these were tested in commercial greenhouses The best estimation for
LAI and PAR interception was obtained from reflectance at 460nm for both tomato
and sweet pepper The goodness of the fit was validated with data from the
commercial greenhouses and was also tested in this study The divergence of the
results from the ones reported from field experiments can be traced back to the special
greenhouse environment where more sources of reflectance are added due to
construction parts and a white plastic covered background Reflectance measurements
offer a non- destructive way to estimate PAR interception and LAI (up to the value of
3) in greenhouse production systems The relationship established between reflectance
at 460 nm PAR interception and LAI for both tomato and sweet pepper can become a
good tool for crop online monitoring in greenhouse conditions Furthermore if
information from reflectance sensors is used as input directly into the crop models
new opportunities for decision support systems in greenhouse production could be
opened up
Photosynthetic stress induced by water deprivation in plants affects a number of
physiological processes such as photosynthetic rate stomatal conductance as well as
the operating efficiency of PSII and non- photochemical quenching Photochemical
Summary
122
Reflectance Index (PRI) is reported to be sensitive to changes of xanthophyll cycle
that occur during stress and could possibly be used to monitor changes in the
physiological parameters mentioned before In Chapter 32 the use of PRI as an early
photosynthetic stress indicator was evaluated A water stress treatment was imposed
on a greenhouse tomato crop CO2 assimilation stomatal conductance light and dark
adapted fluorescence as well as PRI and relative water content of the rooting medium
RWCs where repeatedly measured The same measurements were also performed on
well-irrigated plants that acted as a reference The experiment was repeated in four
consecutive weeks Results showed that PRI can be used as an early stress indicator
only when light intensity at crop level was above 700μmol m-2 s-1 At lower values of
light intensity the relationship of PRI to RWCs was poor in comparison to
photosynthesis or fluorescence parameters that showed a high correlation to RWCs
For that reason we can conclude that PRI as water stress indicator cannot be
independent of the ambient light conditions and its use can make sense only under
conditions of high light
Finally in Chapter 4 the main achievements and limitations of this study are
discussed and directions for future research are proposed
Samenvatting
125
Samenvatting De afgelopen decennia is kennis over het functioneren van kasgewassen en de
interactie met teeltfactoren sterk toegenomen De intensieve teeltwijze in kassen
gecombineerd met de schaalvergroting maken de ontwikkeling en toepassing van
beslissingsondersteunende systemen ofwel decision support systemen (DSS)
noodzakelijk om telers te ondersteunen bij het verhogen van de doelmatigheid en
efficieumlntie van het teeltproces De basis van een DSS wordt veelal gevormd door een
model Om dit model effectief te laten functioneren zou het real time data moeten
krijgen van sensoren die plant-parameters meten zoals lichtonderschepping
bladoppervlakte-index en fotosynthetische stress op een niet-destructieve wijze Dus
om een goed functionerende DSS te ontwikkelen moeten nauwkeurige modellen en
monitoring technieken voor toepassing in kassen ontwikkeld worden
Het doel van dit proefschrift was om verschillende methodologieeumln te
onderzoeken ten behoeve van het simuleren en monitoren van lichtonderschepping en
fotosynthese van een tomatengewas in de kas Aangezien fotosynthese direct
gekoppeld is aan lichtonderschepping is er voor gekozen om een functioneel-
structureel model te ontwikkelen Een functioneel-structureel model is een model dat
de drie-dimensionale plant architectuur expliciet in beschouwing neemt evenals de
belangrijkste fysiologische processen Verschillende methodologieeumln om
fysiologische eigenschappen on-line en contactloos te meten zijn onderzocht
Afgelopen decennia zijn enkele fysiologische groeimodellen voor tomaat
ontwikkeld om de vruchtproductie te kunnen simuleren Hierbij zijn een nauwkeurige
simulatie van lichtonderschepping en fotosynthese van primair belang Momenteel
bevatten de meeste proces-gebaseerde modellen en zelfs de drie-dimensionale
modellen sterke vereenvoudigingen van de plantarchitectuur die een negatieve invloed
hebben op de nauwkeurigheid van de simulatie van lichtonderschepping en als gevolg
daarvan van gewasfotosynthese
In Hoofdstuk 21 worden de eerste stappen gezet om een functioneel-structureel
tomatenmodel te ontwikkelen Lichtonderschepping is sterk afhankelijk van de
gewasstructuur De gewasstructuur hangt onder andere af van de afstand tussen de
plantrijen de afstand tussen de planten in de rij bladsnoei en ras Het model werd
gebruikt om het effect van verschillende scenariorsquos voor plantafstanden op
lichtonderschepping te testen Lichtonderschepping van deze scenariorsquos werd
Samenvatting
126
vergeleken met een volledig homogeen gewas zonder plantrijen De bladhoek bleek
tijdens de dag te veranderen Deze verandering tijdens de dag werden vooral
waargenomen in de bovenste 90cm van de plant dit is in het deel van de plant dat
zich nog aan het ontwikkelen is Veranderingen van de plant architectuur hadden
direct effect op de lichtonderschepping van het gewas Desalniettemin zelfs als de
plant structuur hetzelfde bleef kon de lichtdoordringing eenvoudig veranderd worden
door bijvoorbeeld de rijafstand te veranderenIn Hoofdstuk 22 wordt de
ontwikkeling en calibratie van een functioneel-structureel tomaten model volledig
uitgewerkt Met het model werd de heterogeniteit van horizontale en verticale
lichtverdeling en fotosynthese in een tomatengewas onderzocht voor zowel direct als
diffuus licht Het model bestond uit een statisch architectuurmodel gekoppeld aan een
lsquonested radiosityrsquo model voor lichtabsorptie en een bladfotosynthesemodel
Verschillende scenariorsquos voor horizontale en verticale verdeling van de
lichtonderschepping invallend licht en fotosynthese werden onderzocht voor direct en
diffuus licht Gesimuleerde lichtonderschepping vertoonde een goede overeenkomst
met gemeten waarden Een expliciete beschrijving van bladhoeken in het model
resulteerden in hogere lichtonderschepping in het midden van het gewas in
vergelijking met een vaste of ellipsoiumldale bladhoekverdeling De totale
lichtonderschepping van het gewas bleef wel gelijk De fractie van het licht dat
onderschept werd door het gewas was bij een noord-zuid orieumlntatie van de gewasrijen
in de winter 10 en in de zomer 23 hoger dan bij oost-west orieumlntatie De
horizontale verdeling van fotosynthese verschilde significant tussen boven midden en
onder in het gewas Door in het model rekening te houden met de verticale verdeling
van bladfotosyntheseparameters in het gewas veranderde de gesimuleerde
gewasfotosynthese met circa 8 Het veranderen van de gewasstructuur kan sterke
invloed hebben op de lichtverdeling in het gewas en de fotosynthese In Hoofdstuk
23 zijn plant ideotypes gezocht met een optimale lichtabsorptie en fotosynthese Met
behulp van het functie-structuurmodel voor tomaat zoals in vorige hoofdstukken
beschreven zijn effecten van een groot aantal architectuureigenschappen van de plant
onderzocht op de lichtabsorptie en fotosynthese in twee verschillende seizoenen
(zomer en winter) Er is een gevoeligheidsanalyse uitgevoerd voor bladhoek van het
blad en van deelblaadjes fyllotaxie lengtebreedte verhouding van bladeren opbouw
van het blad uit deelblaadjes en internodiumlengte Naar aanleiding van de analyse
van deze resultaten werden twee mogelijke ideotypes voor optimale
Samenvatting
127
lichtonderschepping en fotosynthese geformuleerd Als de verticale verdeling van het
geabsorbeerde licht in het gewas werd veranderd waarbij de lichtabsorptie in de top
van het gewas met 25 toenam terwijl de totale licht absorptie van het gewas gelijk
gehouden werd dan nam de gewasfotosynthese met 6 toe in de winter maar nam af
met 7 in de zomer De waargenomen plantstructuur was al optimaal voor
lichtabsorptie en fotosynthese voor zover het ging om de volgende
architectuureigenschappen bladhoek van blad en deelblaadjes en opbouw van het
samengestelde blad De meest belangrijke architectuur eigenschappen van een plant
bleken de internodiumlengte en lengte-breedte verhouding van het blad Verhoging
van de lengte-breedte verhouding van bladeren met 50 of vergroten van
internodiumlengte van 7 naar 12 cm leidde tot een toename van lichtabsorptie en
fotosynthese met 7 tot 10 Een nieuw plant ideotype met een meer open
gewasstructuur als gevolg van langere internodieumln en lange smalle bladeren leidde tot
een toename van de gewasfotosynthese tot 10
In Hoofdstuk 31 zijn methoden onderzocht om onder kascondities de
bladoppervlakte-index (LAI) en lichtonderschepping van het gewas on-line te
monitoren met behulp van reflectiemetingen LAI en lichtonderschepping werden
tegelijk met reflectie van 6 verschillende golflengten gemeten aan paprika- en
tomatenplanten in verschillende ontwikkelingsstadia Relaties tussen de gemeten
parameters werden bepaald in onderzoekskassen en vervolgens werden deze relaties
getest in praktijkkassen De beste schatting voor LAI en lichtonderschepping werd
verkregen met behulp van reflectie van 460nm licht voor zowel tomaat als paprika
Reflectiemetingen bieden hiermee een goede niet-destructieve mogelijkheid om LAI
(tot een waarde van circa 3) en lichtonderschepping te monitoren bij de teelt van
tomaten en paprika in kassen Fotosynthetische stress geiumlnduceerd door watertekort in
planten heeft invloed op een aantal fysiologische processen zoals
fotosynthesesnelheid huidmondjesgeleidbaarheid efficieumlntie van PSII en niet-
fotochemische doving (non-photochemical quenching) De fotochemische reflectie
index (PRI) is gevoelig voor veranderingen in de xanthofyl cycli die optreden tijdens
stress Dit zou mogelijk gebruikt kunnen worden om veranderingen in fysiologische
parameters te kunnen monitoren In Hoofdstuk 32 werd het gebruik van de PRI
meting geeumlvalueerd als vroegtijdige indicator voor fotosynthetische stress Een
behandeling met watertekort werd aangelegd in een kas met een tomatengewas CO2
mol mmicroassimilatie huidmondjesgeleidbaarheid licht en donker geadapteerde
Samenvatting
128
fluorescentie alsmede PRI en relatief watergehalte van het wortelmedium (RWC)
werden gemeten Dezelfde metingen werden verricht aan goed geiumlrrigeerde planten
die dienden als referentiebehandeling Het experiment werd herhaald in vier
opeenvolgende weken De resultaten lieten zien dat PRI alleen gebruikt kan worden
als vroegtijdige stressindicator wanneer lichtintensiteit meer dan 700 -2 s-1 bedraagt
Bij lagere lichtintensiteiten was de relatie tussen PRI en RWC zwak in vergelijking
met de goede relaties tussen RWC en fotosynthese of fluorescentieparameters Op
basis van deze resultaten kan geconcludeerd worden dat PRI als stressindicator niet
onafhankelijk van lichtniveau gebruikt kan worden PRI metingen kunnen alleen als
stressindicator gebruikt worden bij voldoende hoge lichtniveaus
Tenslotte worden in Hoofdstuk 4 de belangrijkste resultaten en de beperkingen
van dit onderzoek bediscussieerd en worden richtingen voor vervolgonderzoek
voorgesteld
Περίληψη
131
Περίληψη Η καλλιέργεια του θερμοκηπίου μπορεί να προσεγγιστεί ως ένα ανοικτό σύστημα
το οποίο μπορεί να επηρεαστεί από μια σειρά παραμέτρων όπως το φως το κλίμα ή η
παροχή θρεπτικών συστατικών Τις τελευταίες δεκαετίες έχουν καταβληθεί
προσπάθειες για την κατανόηση της λειτουργίας του συστήματος αυτού καθώς και
της αλληλεπίδρασης μεταξύ των διαφόρων παραμέτρων Η εντατική φύση της
καλλιέργειας του θερμοκηπίου σε συνδυασμό με την οικονομική ανάγκη να
διευρυνθεί το μέγεθος της γεωργικής εκμετάλλευσης καθιστά επιτακτική την
ανάπτυξη συστημάτων υποστήριξης αποφάσεων (Desicion Support Systems) για την
πιο αποτελεσματική διαχείριση των αγροκτημάτων Βάση των DSS αποτελούν τα
μοντέλα φυτών (plant models) Τα μοντέλα αυτά προκειμένου να είναι
αποτελεσματικά θα πρέπει να μπορούν να λαμβάνουν πληροφορίες σε πραγματικό
χρόνο από αισθητήρες οι οποίοι μετρούν διαφορετικές παραμέτρους όπως η
πρόσληψη φωτός ο δείκτης της φυλλικής επιφάνειας ή το φωτοσυνθετικό στρες με
μη καταστροφικό τρόπο Για την ανάπτυξη λειτουργικών DSS είναι επιτακτική
ανάγκη να αναπτυχθούν ακριβή μοντέλα και τεχνικές παρακολούθησης που μπορούν
να εφαρμόστούν στο συγκεκριμένο θερμοκηπιακό περιβάλλον
Σκοπός αυτής της διατριβής ήταν να διερευνήσει διαφορετικές τεχνικές για την
προσομοίωση και την παρακολούθηση της πρόσληψης του φωτός και της
φωτοσύνθεσης σε μια καλλιέργεια θερμοκηπιακής ντομάτας Δεδομένου ότι η
φωτοσύνθεση είναι άμεσα συνδεδεμένη με την πρόσληψη του φωτός στα πλαίσια
αυτής της μελέτης επιλέχτηκε η ανάπτυξη ενός τρισδιάστατου μοντέλου ντομάτας
που θα λαμβάνει υπόψιν του τη ρητή αρχιτεκτονική των φυτών Σε δεύτερο πλάνο
διευρήνθηκαν και αξιολογήθηκαν κάτω από τις ειδικές συνθήκες του θερμοκηπίου
διαφορετικές μεθοδολογίες για την παρακολούθηση των φυσιολογικών παραμέτρων
των φυτών σε πραγματικό χρόνο μέσω τηλεπισκόπησης
Τις τελευταίες δεκαετίες έχουν προταθεί διάφορα φυσιολογικά μοντέλα ντομάτας
όπου η βασική πρόκληση που αντιμετωπίζουν είναι η σωστή προσομοίωση της
απόδοσης της καλλιέργειας Γι αυτό μια ακριβής προσομοίωση της πρόσληψης
φωτός και συνεπώς και της φωτοσύνθεσης είναι πρωταρχικής σημασίας Προς το
παρόν τα περισσότερα μοντέλα περιλαμβάνουν απλουστεύσεις της αρχιτεκτονικής
του φυτού που θέτει σε κίνδυνο την ακρίβεια της προσομοίωσης της πρόσληψης του
Περίληψη
132
φωτός και κατά συνέπεια της φωτοσύνθεσης Στο Κεφάλαιο 21 παρουσιάζονται τα
πρώτα βήματα για την ανάπτυξη του μοντέλου Η πρόσληψη του φωτός εξαρτάται σε
μεγάλο βαθμό από τη δομή του φυλλώματος και επηρεάζεται μεταξύ άλλων από
την απόσταση μεταξύ των σειρών των φυτών την απόσταση των φυτών στο
εσωτερικό της σειράς το κλάδεμα των φύλλων και την φυτική ποικιλία Το μοντέλο
χρησιμοποιήθηκε για τη μελέτη της επίδρασης διαφόρων σεναρίων φύτευσης στην
πρόσληψη του φωτός Στη συνέχεια πραγματοποιήθηκε σύγκριση αυτών των
σεναρίων με μια καλλιέργεια με ομοιογενές φύλλωμα Πραγματοποιήθηκε επίσης
ανάλυση μετρήσεων του μήκους των φύλλων του πλάτους της γωνίας ανύψωσης και
του προσανατολισμού των φύλλων Η μέτρηση της μεταβολής της γωνίας ανύψωσης
των φύλλων πραγματοποιήθηκε για δύο ώρες της ημέρας Στη ντομάτα οι διαφορές
στο μήκος των φύλλων το πλάτος και τη γωνία ανύψωσης παρατηρήθηκαν κυρίως
στα άνω 90 εκατοστά του φυλλώματος στη ζώνη δηλαδή του φυτού που συνεχίζει να
αναπτύσσεται Αλλαγές των αρχιτεκτονικών χαρακτηριστικών του φυτού επηρεάζουν
άμεσα την πρόσληψη του φωτός από το φύλλωμα Παρ όλα αυτά ακόμη και αν η
αρχιτεκτονική δομή του φυτού παρέμενε η ίδια η πρόσληψη του φωτός θα μπορούσε
εύκολα να χειραγωγηθεί από την αλλαγή της απόστασης των γραμμών φύτευσης
επηρεάζοντας έτσι την πρόσληψη του φωτός και ενδεχομένως τη φυτική παραγωγή
Στο Κεφάλαιο 22 παρουσιάζεται η ανάπτυξη και βαθμονόμηση ενός
τρισδιάστατου μοντέλου ντομάτας Το μοντέλο χρησιμοποιήθηκε για να διερευνηθεί
η επίδραση της ετερογένειας του φυλλώματος στη δυναμική της οριζόντιας και
κάθετης κατανομής του φωτός και της φωτοσύνθεσης κάτω από συνθήκες άμεσου
και διάχυτου φωτισμού Το μοντέλο αποτελείται από τρία υπομοντέλα α) ένα
στατικό αρχιτεκτονικό μοντέλο β) ένα μοντέλο για τον υπολογισμό της πρόσληψης
του φωτός και γ) ένα μοντέλο υπολογισμού της φωτοσύνθεσης σε επίπεδο φύλλου
Διαφορετικά σενάρια για την οριζόντια και κάθετη κατανομή της πρόσληψης του
φωτός της προσπίπτουσας ακτινοβολίας και της φωτοσύνθεσης διερευνήθηκαν κάτω
από συνθήκες άμεσου και διάχετου φωτισμού Η προσομοίωση της πρόσληψης του
φωτός έδωσε μια καλή αντιστοιχία με τις μετρούμενες τιμές Η ρητή περιγραφή των
γωνιών των φύλλων οδήγησε σε υψηλότερη πρόσληψη φωτός σε σύγκριση με
μοντέλα που χρησιμοποιούν σταθερές ή ελλειψοειδείς κατανομές για την περιγραφή
των γωνιών των φύλλων αλλά η συνολική πρόσληψη φωτός παρέμεινε η ίδια Το
ποσοστό του φωτός που προσλήφθηκε ήταν υψηλότερο κατά 10 το χειμώνα και
23 το καλοκαίρι όταν ο προσανατολισμός των σειρών σποράς ήταν από βορρά προς
Περίληψη
133
νότο σε συγκρισή με αυτόν από ανατολή προς δύση Η οριζόντια κατανομή της
φωτοσύνθεσης διέφερε σημαντικά μεταξύ της κορυφής της μέσης και του
χαμηλότερου στρώματος του φυλλώματος
Η χειραγώγηση της αρχιτεκτονικής δομής του φυτού μπορεί να επηρεάσει
σημαντικά την κατανομή του φωτός στο φύλλωμα και τη φωτοσύνθεση Στο
Κεφάλαιο 23 διερευνάται η χρήση φυτικών ιδεοτύπων (ideotypes) για τη
βελτιστοποίηση της απορρόφησης του φωτός και της φωτοσύνθεσης
Χρησιμοποιώντας το μοντέλο της ντομάτας που παρουσιάστηκε στα προηγούμενα
κεφάλαια εξετάζεται ένα φάσμα διαφορετικών φυτικών αρχιτεκτονικών
χαρακτηριστικών για δύο διαφορετικές εποχές του έτους ούτως ώστε να οριστεί η
βέλτιστη αρχιτεκτονική δομή για την απορρόφηση του φωτός και την φωτοσύνθεση
Συγκεκριμένα μελετήθηκαν οι επιδράσεις της γωνίας ανύψωσης των φύλλων της
φυλλοταξίας της γωνίας των φύλλαρίων του σχήματος των φύλλων της διαρύθμισης
των φυλλάριων καθώς και του μήκους του μεσογονατίου διαστήματος Από τα
αποτελέσματα αυτής της ανάλυσης προέκυψαν δύο πιθανοί ιδεότυποι Αύξηση της
απορρόφησης του φωτός στο πάνω μέρος του φυλλώματος κατά 25 χωρίς αλλαγή
της συνολικής απορρόφησης αύξησε τη φωτοσύνθεση κατά 6 το χειμώνα και την
μείωσε κατά 7 το καλοκαίρι Η αρχική αρχιτεκτονική δομή ήταν ήδη βέλτιστη σε
σχέση με τη γωνία ανύψωσης του φύλλου τη γωνία και τη διαρύθμιση του
φυλλαρίου τόσο για την απορρόφηση του φωτός όσο και για τη φωτοσύνθεση ενώ η
φυλλόταξη δεν είχε καμία επίδραση Η αύξηση του μήκους και πλάτους των φύλλων
κατά 15 ή η αύξηση του μήκους των μεσογονατίων διαστημάτων από 7 έως 12 cm
οδήγησε σε αύξηση κατά 7 - 10 για την απορρόφηση του φωτός και τη
φωτοσύνθεση Τα πιο σημαντικά αρχιτεκτονικά χαρακτηριστικά που διαπιστώθηκαν
ήταν το μήκος του μεσογονατίου διαστήματος και το σχήμα των φύλλων που
επηρέασαν σημαντικά την κάθετη κατανομή του φωτός στο φύλλωμα Ο νέος
προτεινόμενος ιδεότυπος με πιο ανοιχτό φύλλωμα λόγω αύξησης των μεσογονάτιων
διαστημάτων και μακριών και λεπτών φύλλων οδήγησε σε αύξηση της
φωτοσύνθεσης μέχρι και 10
Στο Κεφάλαιο 31 μελετήθηκαν τρόποι για παρακολούθηση on-line της φυλλικής
επιφάνειας και της πρόσληψης του φωτός μέσω μετρήσεων ανάκλασης Η φυλλική
επιφάνεια και η πρόσληψη του φωτός μετρήθηκαν την ίδια στιγμή με την ανάκλαση
σε έξι διαφορετικά μήκη κύματος σε διάφορα στάδια της ανάπτυξής φυτών ντομάτας
και πιπεριάς και υπολογίστηκε ο Νormalized Difference Δείκτης Βλάστησης (NDVI)
Περίληψη
134
Οι σχέσεις μεταξύ των μετρούμενων παραμέτρων που βρέθηκαν στις αρχικές
μετρήσεις σε πειραματικά θερμοκήπια στη συνέχεια εξετάστηκαν για την ακρίβεια
τους και σε εμπορικά θερμοκήπια Την καλύτερη σχέση για την εκτίμηση της
φυλλικής επιφάνειας και της πρόσληψης του φωτός έδωσε η ανάκλαση στα 460nm
και για τις δύο καλλιέργειες Η σχέση αυτή επικυρώθηκε και από τα αποτελέσματα
των μετρήσεων από τα εμπορικά θερμοκήπια Αποκλίσεις των αποτελεσμάτων
μεταξύ των εμπορικών και των πειραματικών θερμοκηπίων οφείλονται στο ιδιαίτερο
περιβάλλον του θερμοκηπίου όπου η ανάκλαση μπορεί να προέρχεται επίσης από τα
κατασκευαστικά μέρη του θερμοκηπίου Η σχέση μεταξύ της ανάκλασης στα 460 nm
τον δείκτη φυλλικής επιφάνειας και της πρόσληψης του φωτός μπορεί να αποτελέσει
ένα καλό εργαλείο για την σε πραγματικό χρόνο παρακολούθηση των καλλιεργειών
σε συνθήκες θερμοκηπίου Επιπλέον εάν οι πληροφορίες από τους αισθητήρες
ανάκλασης χρησιμοποιηθούν απευθείας απο τα φυτικά μοντέλα θα άνοιξουν νέες
προοπτικές στα συστήματα υποστήριξης αποφάσεων στην παραγωγή του
θερμοκηπίου
Το φωτοσυνθετικό στρες που προκαλείται από στέρηση νερού στα φυτά
επηρεάζει έναν αριθμό φυσιολογικών διεργασιών όπως ο φωτοσυνθετικός ρυθμός η
στοματική αγωγιμότητα καθώς και η λειτουργική απόδοση του PSII και της μη-
φωτοχημικής απόσβεση(NPQ) O Φωτοχημικός Δείκτης Ανάκλασης (PRI) φέρεται να
είναι ευαίσθητος στις μεταβολές του κύκλου της ξανθοφύλλης που συμβαίνουν κατά
τη διάρκεια του στρες και θα μπορούσε ενδεχομένως να χρησιμοποιηθεί για την
παρακολούθηση των αλλαγών στις φυσιολογικές παραμέτρους που αναφέρθηκαν
παραπάνω Στο Κεφάλαιο 32 αξιολογείται η χρήση του PRI ως μια πρώιμη ένδειξη
φωτοσυνθετικού στρες Για τους σκοπούς αυτής της έρευνας υδατικό στρες
εφαρμόστηκε σε μια καλλιέργεια ντομάτας Κατά τη διάρκεια του πειράματος
μετρήθηκαν η πρόσληψη του CO2 η στοματική αγωγιμότητα ο φθορισμός κάτω από
σθνθήκες φωτός ή μη καθώς και το PRI και η σχετική περιεκτικότητα σε νερό του
ριζώματος επί τοις Οι ίδιες μετρήσεις διεξήχθησαν επίσης σε καλά ποτισμένα
φυτά που ενήργησαν ως σημείο αναφοράς Το πείραμα επαναλήφθηκε τέσσερις
διαδοχικές εβδομάδες Τα αποτελέσματα έδειξαν ότι το PRI μπορεί να
χρησιμοποιηθεί ως μια πρώιμη ένδειξη στρες μόνο όταν η ένταση του φωτός ήταν
πάνω από 700μmol m-2 s-1 Σε χαμηλότερες τιμές της έντασης του φωτός η σχέση
του PRI με τη σχετική περιεκτικότητα σε νερό του ριζώματος επί τοις ήταν φτωχή
σε σύγκριση με τη φωτοσύνθεση ή το φθορισμό με τις οποίες έδειξαν υψηλή
Περίληψη
135
συσχέτιση Για το λόγο αυτό μπορούμε να συμπεράνουμε ότι η χρήση του PRI σαν
δείκτης φυτικού στρες δεν μπορεί να είναι ανεξάρτητη από τις συνθήκες φωτισμού
του περιβάλλοντος και η χρήση του μπορεί να έχει νόημα μόνο σε συνθήκες υψηλού
φωτός
Τέλος το Κεφάλαιο 4 συζητιούνται τα κύρια επιτεύγματα και οι περιορισμούς της
μελέτης αυτής και προτείνονται κατευθύνσεις για μελλοντική έρευνα
Acknowledgments
137
Acknowledgements The PhD thesis is a road with a lot of twists and turns that is impossible to
complete without the input of many people that are all important in their different and
unique way So at this part of the thesis I would like to thank everyone that was there
for me all these years and gave me the strength and support I needed to reach the end
of the road
First of all I would like to thank my promotor and main supervisor prof dr Leo
FM Marcelis for his patience understanding and the fact that he never gave up hope
on my thesis even when the direction was not clear for me Although we did not
always agree I want you to know that I appreciate and always will be grateful for all
your efforts during these years
I would also like to thank my co-promotor prof dr Olaf van Kooten for being a
source of constant support Meetings with you however brief always made me feel
confident with my research and ready to solve any problems ahead
I would like to thank my daily supervisor dr Pieter de Visser foremost for being
the first to teach me about modelling and the fun it can be I much enjoyed all
discussions with you
To my former roommates Bram Julienne Didi Fleur Roberta Andreas and
Pavlos thanks for creating a playground environment for me to work into To Didi
special thanks for all the conversations especially the non scientific ones as they
helped me to relax and go back to work with more energy
I would like to thank my good friend and colleague Gerhard Buck-Sorlin who with
his constant support and faith in my helped me a lot at the final stages of this thesis
Gerhard our talks were literately out of this earth
To all current and former members of the Greenhouse Horticulture thank you for
making me feel like home while at work Time spent with you was always
stimulating Anja thank you for all the good advise you gave me during the years
Steven the collaboration with you was more than productive it was fun To current
and former colleagues of Horticulture Supply Chains Group thank you for the nice
times I had with you at all the outings together I especially appreciated the challenges
to give or attending presentations in your group Also to the members of the FLOP
meeting thank you for all the nice conversations and the good and creative criticism
Acknowledgments
138
on all my writing efforts To the members of the VPN group a big thank you for the
initiating me to the fun of 3D modelling although I did not manage to participate as
much I wanted
To all people that helped me with my experiments during the years I would like to
say a big thank you Especially to Esther that showed me the importance of being
methodical to Johan and Dick from whom I learned a lot about dutch culture and
some not always polite dutch words
I would also like to thank all the numerous friends I made in Wageningen for
making my stay here more pleasant In particular I would like to thank Dimitrios for
introducing me to everyone to Pavlos and Andreas for creating a greek buble inside
the office Niovi and Ioannis for their frendship Yiannis thank you for all those
escapes from the PhD reality when I most needed it and for your constant
encouragement and good advice
Last but not least I would like to thank my parents and brother for never
questioning always trusting always hoping always supporting Thank you for
making me what I am in life today I would have never made it without you
Curriculum vitae
139
Curriculum vitae Vaia Sarlikioti was born on 19th of May 1981 in Amarousio Attikis Greece She
attended secondary school at the 1st Lyceum in Palaio Phaliro where she received her
diploma in 1999 At the same year she started her studies in University of Thessaly
School of Agricultural Sciences Department of Agriculture Crop Production and
Rural Environment where she obtained her Bachelor degree in 2004 and graduating
first of her year In 2004 she started her Msc studies in the Master program of
Agricultural Engineering and Management of Natural Resources were she graduated
in 2006 In May 2006 she started her PhD project in Wageningen University the
Netherlands after receiving a scholarship from the Greek Scholarships Foundation
that focused on modelling and monitoring of canopy light interception and plant stress
in greenhouse crops The project was executed at the institute Wageningen UR
Greenhouse Horticulture and at the Horticultural Supply Chains group of Wageningen
University Since April 2011 Vaia works as a post-doc in INRA Avignon France
List of publications
140
List of publications
Peer-reviewed publications
Buck-Sorlin G de Visser PHB Henke M Sarlikioti V van der Heijden GWAM
Marcelis LFM Vos J 2011 Towards a functional-structural plant model of
cut-rose - simulation of light environment light absorption photosynthesis
and interferences with the plant structure Annals of Botany in press
Sarlikioti V de Visser PHB Buck-Sorlin GH Marcelis LFM How plant
architecture affects light absorption and photosynthesis in tomato Towards an
ideotype for plant architecture using a functional-structural plant model
Submitted (Chapter 23)
Sarlikioti V de Visser PHB Marcelis LFM 2011 Exploring the spatial
distribution of light interception and photosynthesis of canopies by means of a
functional-structural plant model Annals of Botany 107875-883 (Chapter
22)
Sarlikioti V Meinen E Marcelis LFM 2011 Crop reflectance as a tool for
the online monitoring of LAI and PAR interception in two different
greenhouse crops Biosystems Engineering 108 113-120 (Chapter 31)
Sarlikioti V Driever SM Marcelis LFM 2010 Photochemical reflectance
index as a mean of monitoring early water stress Annals of Applied Biology
157 81-89 (Chapter 32)
Conference proceeding and reports
Sarlikioti V de Visser PHB Marcelis LFM 2011 Towards a 3D structural
tomato model for calculating light interception Acta Horticulturae 893721-
728 (Chapter 21)
Janssen HJJ Sarlikioti V Gieling ThH Meurs EJJ Marcelis LFM Van
Dugteren JR 2008 A prototype sensor for estimating light interception by
plants in a greenhouse Acta Horticulturae 801 621-627
Dueck TA Nederhoff EM Nieboer S Scheffers CP Steenhuizen JW
Chizhmak S Uenk D Sarlikioti V de Visser PHB 2010 Verbetering van
List of Publications
141
de lichtonderschepping in een tomatengewas door aanpassing van de rijstructuur
Effecten van de rijstructuur op lichtverdeling fotosynthese en productie 44pp
Rapport GTB-1029 Wageningen UR
PEampRC PhD Education Certificate
With the educational activities listed below the PhD candidate has complied with the educational requirements set by the CT de Wit Graduate School for Production Ecology and Resource Conservation (PEampRC) which comprises of a minimum total of 32 ECTS (= 22 weeks of activities)
Review of literature (45 ECTS)
- Modelling and remote sensing of canopy light interception and plant stress in greenhouses
Writing of project proposal (45 ECTS)
- Modelling and remote sensing of canopy light interception and plant stress in greenhouses
Post-graduate courses (6 ECTS)
- Basic and advanced statistics PEampRC (2007-2008) - The art of modelling PEampRC (2008)
Invited review of (unpublished) journal (2 ECTS)
- Annals of botany 3D modelling (2010) - Journal of horticultural science photosynthesis and biomass production (2011)
Deficiency refresh brush-up courses (105 ECTS)
- Greenhouse technology (2008) - Crop ecology (2009)
Competence strengthening skills courses (3 ECTS)
- The art of writing WGS (2007) - Techniques of writing and presenting a scientific paper WGS (2007)
PEampRC Annual meetings seminars and the PEampRC weekend (18 ECTS) - PEampRC Weekend (2008) - PEampRC Day (2007) - PEampRC Day (2008) - PEampRC Day (2009)
Discussion groups local seminars other scientific meetings (6 ECTS) - Frontier Literature in Plant Physiology (FLOP)
International symposia workshops and conferences (75 ECTS) - Hortimodel Wageningen the Netherlands (2006) - Greensys Quebec Canada (2009) - Greensys Halkidiki Greece
Funding Vaia Sarlikioti received a grant from the Greek State Scholarship Foundation for
conducting the research described in this thesis Additionally the research was
supported by Powerhouse
Financial support for the printing of this thesis by Wageningen Univerisity is
gratefully acknowledged
- Chapter 1
- General Introduction
- Chapter 2 Modelling PAR interception and photosynthesis
-
- Chapter 21
- Towards a 3D structural tomato model for calculating light interception
- Chapter 22
- Exploring the spatial distribution of canopy light interception and leaf photosynthesis by means of a functional structural model
- Chapter 23
- Searching for the ideal plant structure with a functional-structural plant model How plant architecture affects light absorption and photosynthesis in tomato
-
- Abstract
- Introduction
- Material and methods
- Model description
- Architectural module
- Photosynthesis module
- Case studies
- Vertical light distribution scenario
- Leaf elevation angle
- Leaf phyllotaxis
- Leaflet angle
- Leaf shape
- Leaflet arrangement on a leaf
- Internode length
- Ideotyping scenarios
- Results
- Vertical light distribution scenario
- Leaf elevation angle
- Leaf phyllotaxis
- Leaflet angle
- Leaf shape
- Leaflet arrangement
- Internode length
- Ideotyping scenarios
- Discussion
- Chapter 3 Monitoring PAR interception and photosynthetic stress
-
- Chapter 31
- Crop Reflectance as a Tool for Online Monitoring Of LAI and PAR Interception in Two Different Greenhouse Crops
- Chapter 32
- Photochemical reflectance index as a mean of monitoring early photosynthetic stress
-
- Chapter 4
- General discussion
- References
- Summary
- Samenvatting
- Περίληψη
- Acknowledgements
- Curriculum vitae
- List of publications
- PEampRC PhD Education Certificate
-
- PEampRC Annual meetings seminars and the PEampRC weekend (18 ECTS)
- Discussion groups local seminars other scientific meetings (6 ECTS)
- International symposia workshops and conferences (75 ECTS)
-
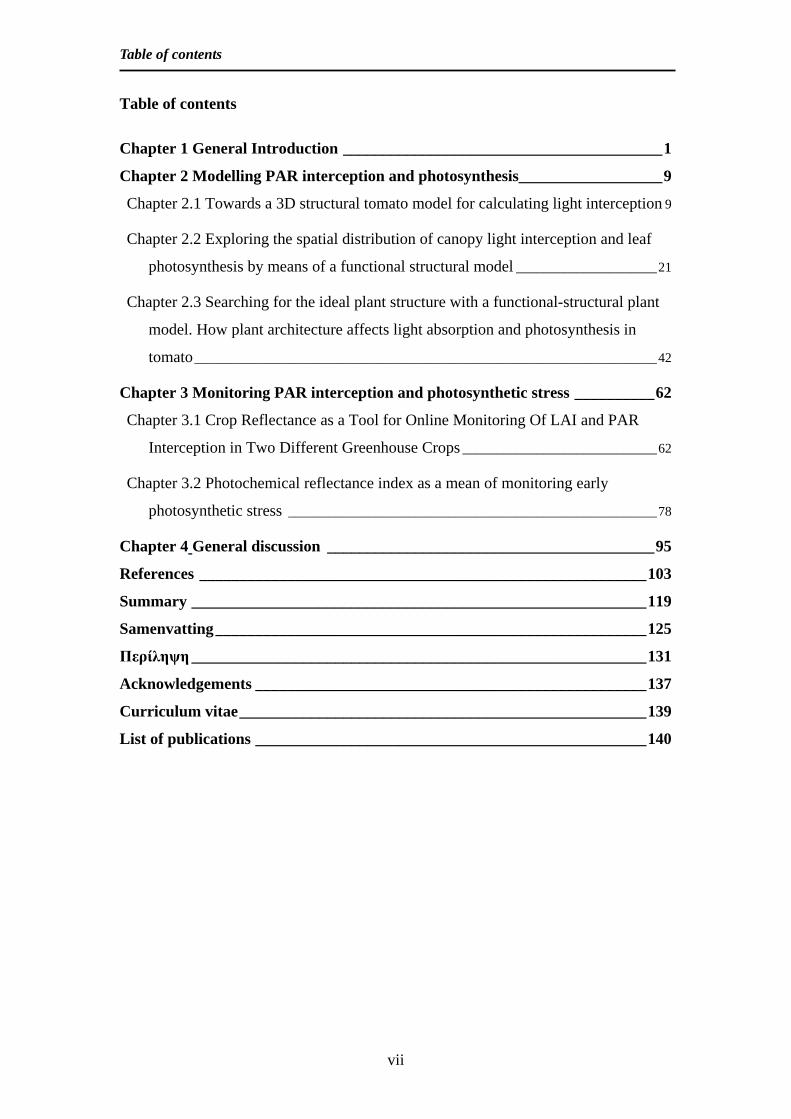
Table of contents
vii
Table of contents
Chapter 1 General Introduction ________________________________________ 1
Chapter 2 Modelling PAR interception and photosynthesis __________________ 9
Chapter 21 Towards a 3D structural tomato model for calculating light interception 9
Chapter 22 Exploring the spatial distribution of canopy light interception and leaf
photosynthesis by means of a functional structural model _____________________ 21
Chapter 23 Searching for the ideal plant structure with a functional-structural plant
model How plant architecture affects light absorption and photosynthesis in
tomato _____________________________________________________________________ 42
Chapter 3 Monitoring PAR interception and photosynthetic stress __________ 62
Chapter 31 Crop Reflectance as a Tool for Online Monitoring Of LAI and PAR
Interception in Two Different Greenhouse Crops _____________________________ 62
Chapter 32 Photochemical reflectance index as a mean of monitoring early
photosynthetic stress _______________________________________________________ 78
Chapter 4 General discussion _________________________________________ 95
References ________________________________________________________ 103
Summary _________________________________________________________ 119
Samenvatting ______________________________________________________ 125
Περίληψη _________________________________________________________ 131
Acknowledgements _________________________________________________ 137
Curriculum vitae ___________________________________________________ 139
List of publications _________________________________________________ 140
Chapter 1
General Introduction
Chapter 1 General Introduction
2
Greenhouse horticulture development towards full control
A greenhouse crop can be approached as an open system that can be affected by a
number of parameters such as light climate or nutrient supply The last decades
efforts have been made to understand the function of this system and the interaction of
the different parameters The intensive nature of greenhouse cultivation as such gives
an impetus for the development of decision support systems (DSS) to help the
growers in managing their farm efficiently The foundations of DSS are plant models
(Marcelis et al 2000) Although many models have been proposed during the past
decades their lack in accuracy makes it useless to integrate them yet in day- by- day
decision making for the farm management Accuracy in models can be achieved either
by improving modelling assumptions as such like incorporating the explicit plant
structure instead of using a layer approach when dealing with plant canopy or by
improving the online feed of information to the model by coupling models with remote
sensor data that are taken in real time Since remote sensing is not yet widely used in the
greenhouse a way to incorporate remote sensing in the greenhouse environment should
first be investigated In the following subchapters these two approaches are explicitly
described
Plant modelling
Physiological plant models have become an integrated tool of plant science
research These models describe at different degrees of complexity plant
physiological processes that set light to our understanding of plant functioning and
help us develop new cultivation strategies (Fourcaud et al 2008) A number of
physiological plant models have been proposed during the years (eg Gary et al
1995 Marcelis et al 1998 Heuvelink 1999 Boote and Scholberg 2006) These
models offer an accurate description of plant growth and its interactions with the
environment providing a useful tool in our understanding of plant functioning
Although they make a distinction between different plant organs they do not consider
the plant structure in space Especially functions like light interception environmental
plant adaptation competition within and between species for light or nutrients and
assimilate allocations cannot be easily explained if plant structure in space is not taken
into account
Chapter 1 General Introduction
3
Modelling light interception and photosynthesis
In most process based models leaf area is one of the most important crop
properties which have a strong physiological impact on plant functioning through light
interception and thus photosynthesis In current models leaf area index (LAI) is input as
a single value for the total of the crop canopy This approach although it gives a good
general estimation of light absorption and photosynthesis fails to capture the effect of
the vertical light distribution in the canopy This light distribution is affected by canopy
architecture and its inclusion in the models gives us the necessary accuracy for the day
to day management of the crop
Functional-structural plant models (FSPM) or virtual plant models
(Hanan1997 Sievaumlnen et al 2000 Godin and Sinoquet 2005 Vos et al 2007) are
terms used to refer to models explicitly describing the development in time of the 3D
architecture or structure of plants as driven by physiological processes These
physiological processes are the result of environmental factors Functional-structural
plant models were proposed in the last decade as a means to investigate the function
of plant structure in plant development combining traditional plant modelling with a
3D structure (Vos et al 2007)
Modelling light interception and photosynthesis in a tomato crop
The tomato crop is of high economic importance and one of the most
important horticultural crops Because of the intensity of greenhouse cultivation in the
Netherlands optimum cultivation practices as well as genotypes with specific
characteristics for this type of cultivation are used Since experimentation is quite time
consuming and cost money 3D models can become a central tool in searching the
ideal crop type and management support when it comes to light interception and
photosynthesis Tomato cultivation is using a high-wire system were the plants are
planted in double rows Such a system is intended to optimize the light distribution in
the canopy However a high heterogeneity in the plant canopy still occurs and that
can have an impact on the local light distribution inside the canopy A 3D model can
accurately calculate the vertical as well as the horizontal light and photosynthetic
distribution inside the canopy Also a 3D model can be used to provide answers to
important questions as to which plant architectural characteristics such as leaf size
and shape leaf elevation angle leaf orientation internode length or leaf spatial
distribution would give optimal results when it comes to light interception and canopy
Chapter 1 General Introduction
4
photosynthesis The same answers can be given for cultivation practices such as row
spacing
Online monitoring with sensors
When light reaches a surface a part is absorbed a part is transmitted and a part is
reflected depending on the optical properties of the surface The fraction of light
reflected by a surface can be detected with sensors In plants reflection can be related
to the light emitted during different physiological processes or to morphological
parameters
In the past optical remote sensing has been developed and used for the online
monitoring of parameters such as chlorophyll and nitrogen content plant stress etc in
field grown crops for example in wheat (Gitelson et al 2002) potato (Jongschaap
2006) sugar beets (Clevers 1997) miscanthous (Vargas et al 2002) and rice (Tian et
al 2005) Remote sensing is defined as lsquothe small or large-scale acquisition of
information of an object or phenomenon by the use of either recording or real-time
sensing devices that is not in physical or intimate contact with the object (Lintz amp
Simonett 1976) Remote sensing can be either at close range where the observations
are taken either by sensors positioned on the ground close to the object or long range
where information are gathered by planes or satellites
Attempts to measure leaf area index (LAI) and Photosynthetically Active Radiation
(PAR) interception with the use of remote sensing have been successful in field crops
Different approaches have been used for the data collection with sensors either on
short range (ground) or far range (low flights or satellites) (Bouman et al 1992
Clevers 1997) Efforts in the field to use reflectance measurements for the estimation
of the canopy nitrogen content biomass and photosynthesis in wheat (Gitelson et al
2002) potato (Jongschaap 2006) sugar beets (Clevers 1997) miscanthus (Vargas et
al 2002) and rice (Tian et al 2005) resulted in positive correlations
Many studies aimed at determining combinations of reflectance of different
wavelengths for correcting the effect of disturbing factors (such as old leaves and soil
background) on the relationship between crop reflectance and crop characteristics
such as LAI These combinations of the reflectance at different wavelength bands are
known as vegetation indices (VIrsquos) Vegetation indices are quantitative measures that
are used in an attempt to measure vegetation abundance or vigor (Wang et al 2005)
Chapter 1 General Introduction
5
Some of the vegetation indices proposed during the years are the Weighted
Difference Vegetation Index (WDVI) (Bouman et al 1992) the infrared red (IRR)
ratio and the red edge leaf effect with the most commonly used the simple ratio (SR)
and the Normal Difference Vegetation Index (NVDI) (Wang et al 2005) SR and
NDVI are based on ratios of red (R) to near-infrared (NIR) reflectance where SR=
NIRR and NDVI= (NIRminusR) (NIR+R) R and NIR ratio-based indices are strongly
rooted in the contrasting response of R and NIR reflectance to increases in LAI (Chen
et al 2002)
The core characteristics of remote sensing ie non destructive measurements and
real time plant monitoring indicate it as a highly desirable application for the
greenhouse industry Though remote sensing has been applied quite successfully in
the open field it has hardly been tested in protected cultivations Open-field methods
cannot be directly transported to greenhouses due to complicating conditions such as
existence of greenhouse structure and ground covering with white plastic In this thesis
the conditions under which remote sensing can be applied for plant monitoring inside a
greenhouse will be investigated
New technological advancements in the accuracy of reflectance detection have
led to linking specific wavelengths with specific plant physiological functions In that
respect one of the interesting applications of crop remote sensing is the monitoring of
photosynthetic stress The so-called photochemical reflectance index (PRI = (R531 minus
R570)(R531 + R570) where R531 and R570 are reflectance signals at 531 and 570 nm
respectively has been used to monitor dynamic changes in photosynthesis under
different stress factors (Evain et al 2004) PRI provides a quick and non-destructive
assessment on photosynthesis-related physiological properties of the leaf and canopy
(Penũelas et al 1994 Meacutethy et al 1999 Evain et al 2004 Weng et al 2006) for a
wide range of species (Gamon et al 1997 Guo amp Trotter 2004) One of the
processes that induce photosynthetic stress is the limited water uptake from the soil
Water stress affects the sufficient opening of stomata and consequently
photosynthetic rate starts to decrease as well as the quantum yield of photosystem II
(Chaves et al 2002) As a result of a decreased rate of CO2 assimilation light energy
absorbed by the leaf cannot be used to drive photosynthetic electron transport and a
part of this energy is dissipated as heat increasing the non-photochemical quenching
(Krause and Weis 1991 Baker and Rosenqvist 2004) Therefore water stress can be
defined as the loss of plant photosynthetic activity as a result of water deprivation
Chapter 1 General Introduction
6
PRI can be used as an easy and effective way of online monitoring photosynthetic
stress Nowadays that the production of tomato fruits in greenhouses is a highly
intensive agricultural industry where the cost profit limit is marginal and efficient use
of resources is vital such a timely prediction of plant stress is especially important
and such a solution worth investigating
Key objectives
The general objective of this thesis is to develop an accurate 3D model for light
interception and photosynthesis simulations and to develop methods for an online
monitor of these physiological properties by means of remote sensing
The individual aims as they are presented in this thesis are
bull Development of a functional structural model simulating the light distribution
in a row crop for diffuse and direct light
bull Understanding the role of different plant architectural components in vertical
light distribution and define an optimum plant canopy
bull Developing a procedure to estimate the leaf area index and light interception
for greenhouse grown row crops based on reflectance measurements
bull Developing a procedure to estimate photosynthetic stress in crops based on
reflectance changes at 531nm
Thesis outline
In CHAPTER 1 of this thesis a general description of the problem as well as the
general objective are presented
CHAPTER 21 is presenting a first description of the 3D model The effect of row
spacing on light interception is also investigated
CHAPTER 22 presents in detail the 3D tomato model In the chapter the
development of the model is described and it is used for the exploration of the spatial
light distribution and photosynthesis In this chapter the effect using an explicit 3D
model versus the common modelling approaches for light interception and
photosynthesis is addressed
CHAPTER 23 the effect of plant architectural parameters on light interception
and photosynthesis is explored Sensitivity analysis is performed for leaf azimuth
angle (phyllotaxis) leaf elevation angle leaflet angle leaf length leaf shape leaf
Chapter 1 General Introduction
7
thickness as well as internode length for the impact of their change to both light
interception and photosynthesis Two different architectural ideotypes are proposed
based on the results of the analysis
In CHAPTER 31 a way of online monitoring of light interception and Leaf Area
Index is explored Reflectance in a number of different wavelength bands as well as
NDVI is tested and the best predictor is picked for tomato and sweet pepper crops
In CHAPTER 32 the use of photochemical reflectance index (PRI) as an
indicator of early water stress is presented In that chapter water stress is described as
a function of photosynthetic reduction and the capability of PRI to act as an early
water stress indicator is debated
In CHAPTER 4 the results of this thesis are summarized and put into a more
general context The shortcomings of the methods used as well as the further steps in
this research are discussed
Chapter 2 Modelling PAR interception and photosynthesis
Chapter 21
Towards a 3D structural tomato model for calculating light interception
Published as
Sarlikioti V de Visser PHB Marcelis LFM 2011 Towards a 3D structural
tomato model for calculating light interception Acta Horticulturae 893721-728
Chapter 21 Effect of cultivation strategies on light interception
10
Abstract
A number of physiological tomato models have been proposed the last
decades their main challenge being the correct simulation of fruit yield For this an
accurate simulation of light interception and thus photosynthesis is of primary
importance Light interception is highly dependent of the canopy structure which is
affected amongst others by distance between plant rows distance of plants within the
row leaf pruning and crop variety In order to simulate these processes a functional
structural tomato model for the simulation of light interception on an individual leaf
basis is proposed The 3D model was constructed using L-systems formalism For the
architectural part of the model manual measurements of leaf length width angle of
the leaf main stem to plant stem and leaf orientation were conducted Diurnal pattern
of leaf orientation was also tested The architectural model was coupled with a nested
radiosity model for light calculation Area per individual leaflet served as input of the
light module for calculation of reflection absorption and transmission of light The
model was used to test different crop planting scenarios on their effect on light
interception Results were then compared with light simulation for a totally
homogeneous canopy
Chapter 21 Effect of cultivation strategies on light interception
11
Introduction
A number of tomato models have been proposed during the years (eg Gary et al
1995 Marcelis et al 1998 Heuvelink 1999 Boote and Scholberg 2006) These
models offer an accurate description of plant growth and its interactions with the
environment providing a useful tool in our understanding of plant functioning
Although they make a distinction between different plant organs they do not consider
the plant structure in space Especially functions like light interception environmental
plant adaptation competition within and between species for light or nutrients and
assimilate allocations can not be easily explained if plant structure in space is not
taken into account
Functional-structural plant models (FSPM) or virtual plant models (Hanan1997
Sievaumlnen et al 2000 Godin and Sinoquet 2005 Vos et al 2007) are terms used to
refer to models explicitly describing the development in time of the 3D architecture or
structure of plants as driven by physiological processes These physiological
processes are the result of environmental factors Functional-structural plant models
were proposed the last decade as a mean to investigate the function of plant structure
in plant development combining traditional plant modeling with a 3D structure (Evers
et al 2005 Buck-Sorlin et al 2011) For light extinction in particular the knowledge
of how the plant develops in space is essential So the use of such a model for light
calculations would probably improve our knowledge of light distribution inside the
crop canopy
Light extinction inside a plant canopy can reach up to 60 while for a crop
canopy the light extinction can be up to 90 (Valladares 2003) This variation in
incident light availability inside the crop canopy induces extensive structural and
physiological modifications Light variation has also a big effect in plant
photosynthetic capacity (Amax) which typically decreases two- to four times from top
to the bottom of the canopy (Meir et al 2002)
The aim of this study was to explore the structural variations inside the tomato
plant canopy and use this to develop a structural plant model for tomato Furthermore
with the use of a structural plant model different plant spacing scenarios and their
effect on light distribution inside the canopy were tested
Chapter 21 Effect of cultivation strategies on light interception
12
Materials and Methods
Plant measurements
Experimental set-up
The experiment was carried out in a high-wired tomato cv Aranca crop in a
glasshouse of Improvement Center (52˚N Bleiswijk the Netherlands) Plants were
planted in the greenhouse at the end of January The rows in the greenhouse were
northeast- southwest oriented Two rows of plants were planted in each gully The
distance between the two rows of one gully was 50 cm the path width was 110 cm
and the distance between 2 plants on the same row was 053 m Plant height was 260
m The plants were grown on rockwool (Grodan type Expert) The greenhouse air
was enriched with pure CO2 at 400 ppm during day time The lowest leaves were
removed every week and plants were lowered such that plant height remained the
same throughout the experiment
Structural plant measurements
For a complete picture of plant development detailed measurements of the 3D
stem and leaf curvature were manually performed on 3 plants every other week
Measurements were performed for six weeks from 2 of July to 13 of August 2008 A
protractor and a ruler were used for the measurements The measurements included
leaf elevation angle leaf length leaf width and leaf orientation In our experiment we
defined leaf elevation angle as the angle of leaf petiole to the horizontal where it is
attached to the stem (Boonen et al 2002) The rosette at the top of the plants with
leaves smaller than 2 cm was considered as first node Digitization of the plants was
attempted with the use of a Fastrak 3D digitizer (Polhemus Inc Colchester VT USA)
but was not always possible This was probably due to a powerful disturbance of the
magnetic field of the digitizer due to metallic parts (heating pipes) positioned inside
the canopy
The plant was divided in three zones (upper middle and lower zone) and the
above mentioned structural plant characteristics were measured Every zone had a
length of 90 cm except the lowest one that had a length of 80 cm Measurements were
carried out weekly on 3 randomly picked leaves per zone in 13 replicate plants
Tomato composite leaf consists of a large terminal leaflet and up to 8 lateral
leaflets which can also be compounded Many smaller leaflets or folioles may be
interspersed between the larger leaflets depending on the cultivar (Atherton and
Chapter 21 Effect of cultivation strategies on light interception
13
Rudich 1986) In our cultivar the leaf was composed of a big terminal leaflet 3 pairs
of larger leaflets and two pairs of smaller leaflets alternately placed Measurements of
angles of all leaflets for 10 randomly selected leaves in each plant level were taken in
order to determine a relationship between leaflet angle and leaflet position in the leaf
Leaflet angle was defined as the angle between the leaflet petiole and the leaf petiole
Given that the angle of leaves to the horizontal directly affects the flux of solar
radiation per unit area (Falster and Westoby 2003) measurements to establish the
diurnal pattern of the leaf elevation angles were also made Leaf elevation angles of
15 plants were measured early in the morning (0900 hours) and in the afternoon
(1500 hours)
Light measurements
Incident light was measured with the use of Sunscan (Delta-T UK) The sensor
was positioned perpendicular to the plant row Measurements were taken every 25cm
from the top of the canopy in 8 different spots in the greenhouse
Model description
The model consisted of two modules
bull Structural module In this module the spatial development of the plant
was described in terms of symbols according to L-systems formalism
(Lindenmayer and Prusinkiewicz 1990) The plant was structured as a number
of phytomers in deferent developmental stages A phytomer is defined as the
basic structural unit which for our model consisted of an internode and a
composite leaf Relationships of leaf elevation angle to node number leaf
length to node number and leaf width to node number as well as leaflet area to
leaf area and leaflet angle to petiole node number were determined by
regression analysis These relationships where used as input for the
development of the structural part of the model Leaflets were represented
with rectangular shapes in the model in an approximation of their real shape
Plant and row spacing also served as an input The basic simulation unit of the
model included 20 plants (5 plants per row 4 rows)
bull Light module A nested radiosity model (CARIBU) developed by
Chelle and Andrieu (1998) was used for light calculations The module
Chapter 21 Effect of cultivation strategies on light interception
14
calculates light absorbance on the leaflet level Multiple light scattering on
leafs surface was taken into account for light calculations The model assumed
an infinite plant canopy for the calculations (infinite canopy was achieved by
multiplying the basic simulation unit into space) Reflectance and
transmittance parameters for the upper and lower side of the leaf were input in
the model Output values of light interception were given in leaflet as well as
leaf level Model calculation assumed diffuse light conditions Forty three
virtual light sources were symmetrically arranged around the crop in order to
achieve these conditions
A more detailed description of the model is provided in chapter 22
Lambert- Beer
In many crop models Lambert- Beers law (Monsi and Saeki 1953) is used for the
simulation of PAR interception According to the law in a uniform infinite randomly
distributed canopy of absorbing leaves it can be shown that the amount of
photosynthetically active radiation intercepted (I) by a crop can be given by the
following equation
I= (1-ρ)I0(1-e-kL)100
where ρ stands for canopy reflection coefficient I0 is the radiation level at zero
canopy depth L the leaf area index of the canopy and k is the light extinction
coefficient Extinction coefficient was set to 065 as reported by Papadopoulos and
Pararajasingham 1997) and confirmed by our own measurements (data not shown)
Statistical analysis
Statistical analysis was performed with Genstat 11 software (VSN International
Ltd Herts UK) Differences of leaf elevation angle length and width between three
plant heights were tested with Linear Mixed Model (REML) Leaf elevation angles
were compared between morning and afternoon with General Linear Models repeated
measurement analysis Curves for leaflet angle to leaf petiole and for light
interception to LAI were fitted with Regression Analysis Goodness of fit was
estimated by coefficient of determination (R2) Statistical differences between curves
was tested by testing the statistical differences between the coefficients of the
regression curves P was 005
Chapter 21 Effect of cultivation strategies on light interception
15
Results and Discussion
Structural characteristics of tomato leaves were monitored at three different depths
in the canopy (Fig 211) In the upper part of the plant leaves had on average a
slightly positive angle to the horizontal while leaves in the middle and lower part of
the canopy showed a negative angle to the horizontal The negative value of -25o
found in our experiment correspond to the mean value used in the tomato model of
Higashide (2009) Length and width were smallest in the top part of the canopy as
these leaves were not yet full-grown There was no statistically significant difference
in leaf size between middle and lower part of the canopy
Fig 211 Structural measurements for three different depths in a tomato canopy
Mean values of leaf elevation angle to the horizontal (A) leaf length (B) and leaf
width (C) are presented for the three different canopy depths as well as the relation
between leaflet angle to leaf petiole and leaflet position (1 is most proximal leaflet
to the stem) for top () middle () and lower leaves () (D) Error bars represent
se of the mean Data are averages of 5 weeks 13 plants per week Data for graph
D are averages of 10 leafs per canopy level
Chapter 21 Effect of cultivation strategies on light interception
16
Leaflet angles diminished from a maximum of 40o for the most distal leaflet to 0o
for the most proximal leaflet (Fig 211D) Leaflet angle showed no statistically
significant differences between the three different canopy levels implying that the
leafletsrsquo angle is in fact an internal characteristic of the plant and dependent only on
the position of the leaflet on the leaf
Leaf elevation angle differed significantly between morning and afternoon only
for the upper leaves (average leaf elevation angles were -31o and -76o for morning
and afternoon subsequently) (Fig 212) A diurnal pattern was not observed at the
middle and lower leaves Forseth (1990) observed no diurnal changes in leaf elevation
angles to the horizontal of a number of species (for example cotton beans Solanum)
but he did find significant changes of the plant angle to the azimuth He also linked
this azimuth movement to an increase in light interception and a proportional increase
of productivity Although Forseth does not differentiate leaf elevation angle behavior
between different canopy depths his work is an indication that measurements of only
leaf elevation angle to the horizontal is not adequate to conclude about a diurnal
pattern on tomato leafs Leaf elevation angle changes can also be linked to turgor loss
of plant cells due to daily transpiration So further research is needed as for the causes
of this behavior on upper tomato leafs
-40
-20
0
20
40
-40 -20 0 20 40Leaf angle (o) at 900
Leaf
ang
le (o ) a
t 15
00
Fig 212 Comparison of leaf elevation angle (angle to the horizontal) in the morning
(0900hours) and afternoon (1500hours) at three different heights of the canopy
Symbols diams loz and x refer to upper middle and lower part of the plant
consequently The line is 11
Chapter 21 Effect of cultivation strategies on light interception
17
The above described structural measurements were used to develop a structural
tomato model The accuracy of the model was tested against measured values In
general the difference of the measured values versus the calculated values was of 4
with a maximum difference of 10 at the lowest point The model was used to test
three different crop planting scenarios and compare them to results of Lambert- Beer
equation which is currently used in most crop modeling for light simulation The three
different planting scenarios consisted of i Normal culture Planting distances were
the same as the ones found in the experiment (50cm between the two rows of one
gully and 110 cm of path ii Big path The distance between the rows in the same
gully was reduced to 15 cm and the path width increased to 145cm width iii Even-
distance rows The plants were equally distributed in space (distance between plants at
the same gully as well as the pathway was equal to 80cm) In order to test the
accuracy of the tomatorsquos model light calculations the light interception of a
completely homogeneous crop was compared to Lambert- Beer calculations (Fig
213) Plant density was 41 plants per m2 with 1 stem per plant It was assumed that
plant size and structure was the same in all scenarios
Fig 213 Comparison of light interception () between simulation data for a totally
homogeneous canopy and Lambert- Beer law calculations for the same canopy
Data points are from the top (0 interception) to the bottom of the canopy (100)
In general row structures led to higher light interception in the upper part of the
plants (LAIle15) and lower interception in the lower part compared to homogeneous
crop simulation Light interception reaching at the deeper part of the crop increased
with path width and resulted in 30 light reaching soil level in our ldquobig pathrdquo
Chapter 21 Effect of cultivation strategies on light interception
18
treatment In accordance Papadopoulos and Pararajasingham (1997) reported that
light penetration increased and therefore light interception decreased with the increase
of plant spacing in a crop Similar effects have also been reported in other crops such
as corn (Stewart et al 2003) Cournegravede et al (2007) in their structural model
concluded that deviations in calculations of light interception from Lambert- Beer law
were mainly because the latter assumes a even distribution of the leaf elevation
angles The assumption of an even leaf distribution nevertheless has been challenge in
the past Maddonni et al (2002) reported that in case of row structure the leaf
orientation is changed and it is biased in being positioned perpendicular to the row
Also Toler et al (1999) found that k factor is dependant to the row distances and is
decreasing with the increase of the row spacing It would be argued that changes in k
factor in relation to plant spacing are because of morphological changes in plants and
mainly orientation and leaf elevation angle The calculation of k factor from our
model simulation shows that even if the structural characteristics of the plant stay the
same average k factor decreases with the increase of plant spacing (Fig 214B)
Inside the canopy k-factor is also decreasing from the top to the bottom This decrease
is directly linked with the decrease of leaf elevation angle In practice leaf elevation
angles are not constant but are dependant on the planting strategy Extinction
coefficient calculated for even-distance rows showed no differences to the one of
homogeneous canopy Nevertheless further increase of the path between the rows led
to a decrease of the k factor a decrease that reached 50 in case of ldquobig pathrdquo
treatment
0
25
50
75
100
0 125 25 375 5LAI
Ligh
t int
erce
ptio
n (
)
0
05
1
15
2
0 1 2 3LAI
ln (I
Io
Fig 214 A Calculated light interception for different canopy structures Light
interception was calculated by structural model for plants grown in rows with path
width of 110 (diams) 80 () and 45cm (loz) The symbols correspond to calculation
A B
Chapter 21 Effect of cultivation strategies on light interception
19
from Lambert- Beer B Average extinction coefficients k for the different
treatments LAI refers to cumulative leaf area from top to bottom of plant canopy
CONCLUSIONS
In tomato plants structural differences in leaf can mainly be observed in the upper
90cm of the plant in the still developing zone Changes of structural plant
characteristics affect directly light interception by the crop canopy Nevertheless even
if plant structure stays the same light penetration can be manipulated easily by
changing row spacing in the crop thus affecting light interception and potentially
plant production
Chapter 22
Exploring the spatial distribution of canopy light interception and leaf photosynthesis by means of a functional structural model
Published as
Sarlikioti V de Visser PHB Marcelis LFM 2011 Exploring the spatial
distribution of light interception and photosynthesis of canopies by means of a
functional-structural plant model Annals of Botany 107875-883
Chapter 22 Virtual plant for light interception and photosynthesis
22
Abstract
At present most process-based models and the majority of three dimensional
models include simplifications of plant architecture that can compromise the
accuracy of light interception simulations and accordingly canopy photosynthesis
The aim of this paper is to analyze canopy heterogeneity of an explicitly described
tomato canopy in relation to temporal dynamics of horizontal and vertical light
distribution and photosynthesis under direct and diffuse light conditions Detailed
measurements of canopy architecture light interception and leaf photosynthesis were
carried out on a tomato crop These data were used for the development and
calibration of a functional-structural tomato model The model consisted of an
architectural static virtual plant coupled with a nested radiosity model for light
calculations and a leaf photosynthesis module Different scenarios of horizontal and
vertical distribution of light interception incident light and photosynthesis were
investigated under diffuse and direct light conditions Simulated light interception
showed a good correspondence to the measured values Explicitly described leaf
elevation angles resulted in higher light interception in the middle of the plant canopy
compared to fixed and ellipsoidal leaf elevation angle distribution models although
the total light interception remained the same Fraction of light intercepted at a north-
south orientation of rows differed from east-west orientation by 10 on winter and
23 on summer days The horizontal distribution of photosynthesis differed
significantly between the top middle and lower canopy layer Taking into account the
vertical variation of leaf photosynthetic parameters in the canopy led to ca 8
increase on simulated canopy photosynthesis Leaf elevation angles of heterogeneous
canopies should be explicitly described as they have a big impact both on light
distribution and photosynthesis
Chapter 22 Virtual plant for light interception and photosynthesis
23
Introduction
Physiological plant models have become an integral tool of plant science research
These models describe at varying degrees of complexity plant physiological
processes that improve our understanding of plant functioning and help us develop
new cultivation strategies (Fourcaud et al 2008) Physiological models or process-
based models (PBMs) usually focus on plant production and development by
describing biophysical processes as rates using ordinary differential equations (ODErsquo
s) or stochastic processes (Marcelis et al 1998 Heuvelink 1999 Gayler et al
2006) Light interception is one of the most important functions as it drives
photosynthesis and therefore growth Although highly dependent on canopy structure
(Vos et al 2010) light interception is usually computed in PBMs as a function of leaf
area index (LAI) and extinction coefficient (Lai et al 2000 Baldocchi et al 2000)
In most models the extinction coefficient is determined by fitting a LambertndashBeer law
relation to experimental data or is estimated as a function of a certain leaf elevation
angle distribution Although these approaches give a good estimation of total light
interception of a crop they fail to capture the effect of plant and canopy heterogeneity
on light interception and therefore on photosynthesis (Vos et al 2010) Since plant
architecture is influenced by a number of processes (such as genotype water
availability cultivation practices or diseases) models that explicitly describe the
impact of these processes on plant architecture can be a useful tool in our
understanding of such phenomena for example the effect of wilting on light capture
In recent years techniques have become available for developing functionalndash
structural plant models (FSPMs) which are also called lsquovirtual plantsrsquo that combine
the modelling of physiological processes with the 3D architecture of the plant This
combination boosts the capability of models to simulate the interaction between plants
and their environment (Hanan 1997 Sievaumlnen et al 2000 Godin and Sinoquet
2005 Vos et al 2007) The 3D plant structure is especially important for the
description of light interception and therefore the photosynthetic capacity of plants
Three-dimensional models require a detailed quantification of plant structure in space
(Vos et al 2007) Plants are considered as the sum of distinct units called phytomers
that are formed repeatedly based on a hierarchical system (Bartheacuteleacutemy and Caraglio
2007) Static 3D plants coupled with radiation models have proven to be valuable
tools in investigating the effect of single-plant architecture as well as crop structure on
light interception and canopy photosynthesis (Vos et al 2010) Zheng et al (2008)
Chapter 22 Virtual plant for light interception and photosynthesis
24
showed that certain plant types with steeper leaf elevation angles exhibited a higher
light penetration of the canopy when sun elevation was high Therefore even simple
static virtual plants have a great potential for crop breeding research
Despite the advantage of virtual plant models over PBMs in their explicit
description of plant architecture still in such models we still often need to
approximate 3D structure Leaf elevation angle is assumed either as constant (Najla et
al 2009) or to follow a spherical or ellipsoidal distribution (Rakocevic et al 2000
Farque et al 2001) This approach is mainly due to the tediousness and the time-
consuming nature of the measurements involved (Fourcaud et al 2008) Such an
approach may give robust results in the case of crops that show a particularly regular
and coordinated development such as wheat and rice (Evers et al 2005 Drouet and
Pagegraves 2007 Zheng et al 2008) However in order to fully understand the light
distribution in the plant canopy and explore the full impact of crop architecture on
light interception and photosynthesis of row crops with a high canopy (such as
tomato) functionalndashstructural models should incorporate a detailed description of all
architectural parameters in general and leaf elevation angles in particular
The aim of this research was to analyse the canopy heterogeneity of an explicitly
described tomato canopy on horizontal and vertical light distribution and
photosynthesis under direct and diffuse light conditions at different times of the year
In order to do so a static functional structural tomato model was developed and then
used as a tool for analysing the impact of canopy heterogeneity
Materials and Methods
Experiment
A tomato (Lycopersicum esculentum var Aranca) crop was planted in December
2006 in a commercial greenhouse in Bleiswijk the Netherlands (52o) Measurements
were performed in July and August of 2007 when the plants were 175 m tall During
this period average temperature in the greenhouse was 175oC average daytime CO2
concentration was 371 μmol mol-1 and relative air humidity was set at 73 Daily
outside global radiation was 40 MJ during the time of the experiment Plants were
grown in double rows with rows oriented from north to south The distance between
the double rows was 12 m (path) the distance between each row of the double row
(within the row distance) was 04 m and the distance between plants within the row
was 03 m resulting in a plant density of 41 stemsm2
Chapter 22 Virtual plant for light interception and photosynthesis
25
Measurements of architectural development
Each week for six weeks angle length width internode length and azimuth
orientation of all leaves of five plants were manually measured weekly with a ruler
and a protractor Measurements were made during the morning hours (0900-1300)
Leaf elevation angle was determined as the angle of the leaf petiole with the
horizontal at the leaf insertion point on the stem The first leaf longer than 2 cm was
defined as leaf number 1 Azimuth angle was determined as the leaf horizontal angle
measured clockwise from a constant point defined as ldquonorthrdquo North (or 0 degrees)
was defined as the point perpendicular to the plant rows when facing towards the
inner side of the double row
The tomato plant has composite leaves with 10 to 13 leaflets Leaflet angle was
measured on 10 leaves at different canopy heights on 6 plants in total The angle of
the leaflet to the horizontal at the point that it connects to the petiole was defined as
leaflet angle
The crop leaf area was estimated non-destructively through leaf length and leaf
width measurements at the widest point The relationship between the area of a leaf
and its length and width was estimated by taking photographs against a white
background of 25 randomly chosen leaves from various canopy depths with a digital
camera (Canon IXUS 800 IS) positioned perpendicular to the leaf A ruler was set
next to the leaf for calibration of the image scale during image processing ImageJ
(National Institutes of Health Bethesda MD) was used for image analysis A
relationship was established between leaf length and width and leaf area This
relationship was used to calculate the leaf area index from length and width
measurements on all dates Leaflet length and leaflet area were also measured on
these 25 leaves in order to establish a relationship between the leaflet length and
leaflet area
Light interception measurements
Photosynthetically active radiation (PAR) interception was measured with a 08m
light rod in the crop and a reference sensor above the crop (Sunscan Delta-T UK)
under diffuse light conditions (overcast sky) The light rod was positioned
perpendicular to the row and light interception was measured from the top to the
bottom of the plant at 025m height intervals The measurements were repeated at
eight selected spots in the crop once a week for seven weeks Measurements were
Chapter 22 Virtual plant for light interception and photosynthesis
26
also taken in the middle between the double row and in the middle of the path For
these measurements the sensor was positioned parallel to the crop at three different
plant heights (05 m 1 m and at the base of the plant)
Photosynthesis measurements
Photosynthesis light response curves were measured with the use of a portable
open gas exchange measurement device (LCpro+ ADC UK) PAR levels were set to
0 100 250 500 700 and 1400 μmol m-2 s-1 CO2 concentration and relative humidity
were set to ambient greenhouse values (360 μmol mol-1 CO2 and 73 RH
respectively) On three dates during the experiment measurements were done on a
leaf at two different canopy heights (upper and middle respectively) on six plants and
at three different dates during the experiment Upper middle and bottom canopy
height layers were defined as intervals of 05 m from the top to the bottom of the
canopy
Model Description
The functionalndashstructural model presented here consists of three different modules
(Fig221)
bull The architectural module This is a static model that describes the plant
structure in space and the topology of the various organs using the L-systems
formalism (eg Prusinkiewicz 1999)
bull A nested-radiosity module The input of this module is the 3D plant
architecture and the position and the intensity of the light sources using the
model of Chelle and Andrieu (1998) The light emitted by the light sources is
traced through the canopy and the light absorbed by each leaflet is given as an
output
bull The photosynthesis module This module calculates gross photosynthesis
based on the biochemical model of Farquhar (1980)
Chapter 22 Virtual plant for light interception and photosynthesis
27
Fig 22 1 Model flow chart
Architectural module
The basic structural unit of the module is the phytomer A phytomer consists of an
internode a composite leaf and a bud containing an apex The basic unit is repeated
27 times in order to form a complete plant Every three leaves a generative shoot
forms a flower truss Trusses are not represented in the model In order to account for
the light interception from the trusses a fake truss was inserted every 3 leaves This
fake truss was represented as a small leaf with the same length as the length of the
truss and the same number of leaves as the number of fruits Relationships of the
change of the leaf elevation angle and length to the node number were established for
each date An average internode length of 75 cm was used for all plants
The tomato plant has composite leaves that vary in size Typical leaves consist of
a large terminal leaflet and up to eight large lateral leaflets Many smaller lateral
leaflets may alternate with the large leaflets The leaflets are usually petiolate and
irregularly lobed depending on the genotype (Atheron and Rudich 1986) A
representative leaf structure of the particular genotype in terms of leaflet number was
chosen for the construction of the model and was measured in detail The composite
tomato leaf was modelled as a branch structure in which each leaflet is represented as
a discrete lamina based on equations of leaflet angle (o) and leaflet area (cm2)
Static virtual plant
Light intensity at each leaflet
Photosynthesis at each leaflet
Output
Light module
bullLeaf optical properties
bullLight sources position
bullLight sources intensity Architectural
module
bullLeaf elevation angle
bullLeaf area
bullInternode length
bullLeaflet area
Photosynthesis module
bullPhotosynthetic parameters of Farquhar
model
Chapter 22 Virtual plant for light interception and photosynthesis
28
Relationships of the leaflets angle to the leaf petiole as well as the leaflet length to the
leaf length as determined in the experiment were incorporated in the model
The above mentioned relationships were derived from experimental measurements
as described in the lsquoMeasurements of architectural developmentrsquo section The visual
output of the architectural model is presented in Fig 222
Fig 222 Example of the visual output of the 3D tomato model The basic unit of
the model is two plant rows of five plants each Lines along the path and the
plant canopy represent the visual sensors used for the model calibration
Radiosity module
PAR reaching the crop consists of a direct and a diffuse light component (Spitters
1989) For the simulation of diffuse light conditions 48 directional light sources were
positioned uniformly in a hemisphere around the canopy simulating a uniformly
overcast sky The light intensity of diffuse light conditions was 460 μmol PAR m-2 s-1
For the simulation of direct sunlight a bright sky was simulated with light sources
that were given xyz coordinates similar to the sunrsquos trajectory on two distinct dates
(21 December and 21 June) For direct light conditions the intensity of the light
sources at a half hour time step was derived from the 10-yearly average of light
incidence on these dates under Dutch conditions (daily radiation was equal to 7 MJ d-1
Chapter 22 Virtual plant for light interception and photosynthesis
29
in winter and equal to 50 MJ d-1 in summer) The nested radiosity module calculates
the light absorbed by every leaflet by using a radiosity approach for a basic crop unit
and subsequent nesting of the unit to account for the surrounding canopy (Chelle and
Andrieu 1998) Multiple scattering was calculated on a canopy of 20 plants (as
calculated by the architectural module) These 20 plants formed the basic model unit
In the nested radiosity module the basic unit is multiplied infinitely in space in order
to preclude phenomena associated with border effects (eg too high levels of light
incidence from the sides) Reflectance and transmittance of the full spectrum of the
upper and lower sides of the tomato leaves were measured with the use of an
InstaSpec IV CCD spectrometer (Oriel Stradford CT USA) and a LiCor 1800-12
integrating sphere (LICOR Inc Lincoln NE USA) Twelve leaves from different
canopy heights were measured in total and the average values were inputted into the
model( upper side reflectance= 017 upper side transmittance= 006 lower side
reflectance= 012 lower side transmittance= 003)
In order to validate the model with the measured data we introduced to the model
lsquovirtualrsquo sensors that were situated at the measurement spots These sensors were
represented as surfaces with the same dimensions and optical properties as the
Sunscan sensor and were positioned inside the canopy at the same heights with
measured values
In order to investigate the effect of leaf elevation angle distribution on light
interception and photosynthesis we made comparisons between our model (EXPL)
which explicitly describes leaf elevation angles a 3D model with a fixed leaf
elevation angle (-20o for all leaves in the canopy) (CONST) and a 3D model with an
ellipsoidal leaf elevation angle distribution (ELLIP χ=27 where χ is the ratio of the
horizontal semiaxis length to the vertical semiaxis length of an ellipsoid) were made
Photosynthesis module
Photosynthesis is calculated according to the biochemical model of Farquhar et al
(1980) on the basis of absorbed light The module calculates photosynthetic rate at
leaflet level according to the equation
RDppJA
i
iv minus
Γ+Γminus
=)2(4
(eqn 222)
where pi is the intercellular partial pressure of CO2 in Pa Γ is the CO2
compensation point in Pa RD the dark respiration in μmol CO2 m-2 s-1 and J is the
Chapter 22 Virtual plant for light interception and photosynthesis
30
rate of electron transport rate per unit leaf area and is calculated from the following
equation
θJpαθJpαJ+p(α
=J2
max4maxmax 2 minusminus (eqn 221)
where α and θ are coefficients from the data fitting Jmax the potential electron
transport rate (μmol electrons μmol-1 photons) and p the light absorbed by the leaflet
surface (μmol m-2 s-1) Based on the measurements as described in lsquoPhotosynthesis
measurementsrsquo coefficients of the photosynthesis equations were differed between the
upper and the middle layer of the canopy For the lower canopy we assumed the same
coefficients as in the middle canopy For the upper canopy the coefficient values
were α= 01 θ= 069 and Jmax= 1244 and for the middle and lower canopy layer α=
01 θ= 065 and Jmax= 7518)
Model calculations for photosynthesis calibration showed a good correlation with
the measured data at two different canopy heights (R2= 093 data not shown)
Total canopy photosynthetic rate was compared between the model that explicitly
describes leaf elevation angles (EXPL) a 3D model with a constant leaf elevation
angle (CONST) and a 3D model with an ellipsoidal leaf elevation angle distribution
(ELLIP) For the EXPL and ELLIP models two different scenarios were investigated
in one scenario the photosynthesis parameters of the top of the plant were used for
the whole canopy while in the other scenario we attributed different photosynthetic
parameters for the upper (0-075 m) layer and the middle and the bottom canopy
layers (075 m-18 m) For all canopies LAI was kept constant at 31
Statistical analysis
Statistical analysis was performed with GenStat 12th Edition Regression analysis
was applied to derive the various architectural and biochemical relationships
implemented in the model except for the parameters of the light response curves of
photosynthesis which were derived from a mixed linear model
Results
Developing and calibrating the crop architecture module
Dynamics of structural properties of the crop remained more or less constant
during the two months of the experiment The upper leaves showed a positive leaf
Chapter 22 Virtual plant for light interception and photosynthesis
31
elevation angle with respect to the horizontal while the lower leaves showed a
negative leaf elevation angle Below the tenth youngest phytomer leaf elevation angle
did not vary with phytomer angle (Fig 223A) Leaf length rapidly increased from the
top to the 7th phytomer from 2 to 30 cm and then remained almost constant in the
lower leaves (Fig 223B) However leaf area increased continuously from the top to
the bottom of the canopy (Fig 223C) Most leaves were positioned perpendicular to
the plant row towards the path and the middle of the plant row (Fig 223D)
Fig 223 Relationship between A) leaf elevation angle to the horizontal plane B)
leaf length C) leaf area in relation to phytomere number starting from the top
of the plant and D) leaf azimuth angle distribution Each symbol represents a
specific week in fig3 A-B-C Vertical bars in Fig 3D represent the number of
leaves per leaf orientation class
Leaflet angles depended on leaflet position on the leaf petiole The terminal leaflet
had an angle of zero and the leaflets tended to be more erect towards the plant stem
Leaflets in tomato leaves occur in pairs opposite to each other In Fig 224A every
two leaflets represent one pair (ie leaflets 1 and 2 are one pair etc) There was no
Chapter 22 Virtual plant for light interception and photosynthesis
32
significant difference between the leaflet angles of the two leaflets of the same pair
(Fig 4A) A positive linear (043+052leaflet length r2= 088 plt0001) relationship
was observed between leaflet length and leaflet area (Fig 224B)
The above relationships were used to derive the parameters and equations of the
architectural model
Fig 224 A) Leaflet angle with respect to the horizontal in relation to the leaflet
position on the leaf petiole The position counting starts from the leaflets
nearer to the stem and ends with the terminal leaflet Every two leaflets form a
pair positioned opposite to each other on the leaf petiole Each column
represents the average of 10 leaves plusmnSE mean B) Relationship of leaflet area
to leaflet length (y= 015x+025 R2=081) N = 10 leaves
Light interception
Light interception was measured and simulated for six dates For each simulation
date crop structure was based on leaf area and leaf elevation angles as measured on
dates corresponding to the light measurements Simulated light levels corresponded
well to the measured data (Fig 225) An underestimation of light interception was
observed for simulated values at the top of the crop
Chapter 22 Virtual plant for light interception and photosynthesis
33
Fig 225 Measured vs simulated values of light interception Values are from 6
weeks of measurements in 8 different canopy heights Continuous line is 11
In a comparison between EXPL CONST and ELLIP models no differences were
found in total light interception but differences were observed for the middle of the canopy The use of a constant angle led to a 17 underestimation of light interception under diffuse light conditions and a 236 underestimation under direct light conditions compared to the EXPL model Ellipsoidal distribution led to a 76 and an 11 underestimation under diffuse light conditions and direct light conditions respectively (Table 221) These differences were observed only in the middle canopy layer
In order to investigate the effect of the row crop on the horizontal light distribution and the simulation capabilities of the model virtual sensors were
Fig 226 Measured and simulated horizontal light distribution in a row tomato
crop The light intensity is plotted against the plant row length at three different plant canopy heights (50 cm () 100 cm (nabla) and 175 cm ()) Lines represent simulated values while symbols represent measured values plusmn SEmean Plant rows are located at 20cm and 140cm while the middle of the path is located at 80cm
Chapter 22 Virtual plant for light interception and photosynthesis
34
positioned parallel to the crop row in the middle of the space between two rows and
in the middle of the path at three heights (Fig 226) Light intensity decreased from
the top to the bottom of the canopy and from the centre of the path to the row (Fig
226)
Table 221 Comparison of three different leaf elevation angle modelling approaches
with respect to effect on light interception and photosynthesis Values for light
interception and photosynthetic rate are for the total canopy Values in brackets
refer to the middle of the canopy (07 5m-125 m from the top of the plant) where
differences were observed
Leaf elevation
angle
distribution
Light intercepted
()
Photosynthesis with
one set of parameters
(μmol m-2 s-1)
Photosynthesis with
two set of parameters
(μmol m-2 s-1)
Diffuse Direct Diffuse Direct Diffuse Direct
Fixed angle
(CONST)
77
(43)
80
(41)
20
(88)
27
(123)
Ellipsoidal
distribution
(ELLIP)
77
(48)
80
(47)
24
(103)
292
(129)
21
(107)
296
(132)
Explicitly
described leaf
elevation angles
(EXPL)
77
(52)
80
(55)
27
(106)
303
(132)
24
(109)
309
(137)
Direct light was calculated for 21 of June The light intensity for direct light conditions was derived
from the 10-yearly average of light incidence on these dates under Dutch conditions (46 μmol m-2
s-1at sunrise 3109 μmol m-2 s-1 at noon and 23 μmol m-2 s-1 at sunset) For diffuse light conditions
a light intensity of 460 μmol m-2 s-1 was considered Calculations were done when it was assumed
that all leaves of the canopy had the same photosynthetic properties or with two sets of
photosynthetic properties where the properties of the top layer differed from those of the middle
and lower layers
Taking into account the perpendicular positioning of the leaves to the plant row
leaves positioned towards the path absorbed more light per unit leaf area than leaves
positioned towards the middle of the plant row (which received 30 43 and 88
Chapter 22 Virtual plant for light interception and photosynthesis
35
less in the upper middle and bottom canopies respectively) Simulation data showed
an underestimation of the light intensity at the various plant heights compared to the
measured data
Both sun elevation and plant orientation to the sunrsquos trajectory had an effect on
light interception (Fig 227) Fraction of light intercepted was in all cases higher
during winter than summer Light interception increased substantially for plants rows
with a north-south orientation than plant rows with an east-west orientation This
trend was observed for both times of the year
Fig 227 Seasonal variation in light interception for 21st of December (circles)
and 21st June (squares) for a north-south (open symbols) and east-west (closed
symbols) row orientation LAI was 31 Calculations were performed for
exactly the same canopy structure on both dates
Photosynthesis
In order to investigate the horizontal distribution of photosynthesis with the
model leaves pointing towards the path were chosen like those upon which the
manual measurements were performed Leaves located in the higher canopy layer
photosynthesized considerably more than those positioned in the middle or the bottom
of the canopy Differences in simulated photosynthesis were not observed between the
middle and bottom simulated canopy layers because the same photosynthetic
parameters were used for these two layers and light levels were almost equal In the
higher canopy layer photosynthesis increased rapidly from 8 to 35 μmol m-2 s-1 from
Chapter 22 Virtual plant for light interception and photosynthesis
36
the inside leaflets to the outer ones while in the lower canopy layers photosynthesis
ranged from 25 to 148 μmol m-2 s-1 (Fig 228)
Fig 228 Horizontal distribution of photosynthesis in the crop path In this graph
only leaves positioned towards the path at three different canopy heights (05 m
() 1 m () and 175 m ()) are used Each data point is the average of a pair
of leaflets and includes the result from 2-3 leaves per plant from 20 plants
depending on the leaves position Simulation was performed under diffuse light
conditions
The rate of the increase from the inside to the outer leaflets was relatively higher
in the lower layer (43 and 6 for the higher and the lower layer respectively) Total
canopy photosynthesis differed in total 26 (for diffuse light) and 11 (for direct
light) between the EXPL and CONST models (Table 221) Total photosynthesis
differences between the EXPL and ELLIP model were 11 (diffuse) and 4 (direct
light) respectively For light interception differences simulated in the middle canopy
layer the CONST model led to a 16 underestimation of photosynthesis under
diffuse light conditions and to a 7 underestimation under direct light conditions in
comparison with the EXPL model The ELLIP model led to a 3 underestimation
under diffuse and under direct light conditions compared with the EXPL (Table
221) The differences in photosynthetic rate when using the same photosynthetic
parameters for all leaves compared to the use of two sets of photosynthetic parameters
in top and middle leaves was 125 and 13 (for diffuse and direct light
Chapter 22 Virtual plant for light interception and photosynthesis
37
respectively) for the ELLIP model and 11 and 2 (for diffuse and direct light
respectively) for the EXPL
Discussion
The aim of this research was to analyse the temporal dynamics of the horizontal
and vertical light distribution and photosynthesis in relation to canopy heterogeneity
under direct and diffuse light conditions
The spatial position of plant organs has been studied in view of their possible
adaptation to their local environment Such strategies can aim either at maximization
of plant production efficiency or at minimization of the impact of stress-inducing
conditions such as drought or light inhibition (Bjoumlrkman and Powles 1984) Leaf
dimensions and especially leaf elevation angles are important in assessing these plant
strategies as they are directly linked to the acquisition of light Smaller and more
upright leaves are found in the top of the canopy which allows light penetration to the
lower layers while lower leaves have a higher area so as to ensure maximum light
absorption (Pearcy et al 1990) Since leaf elevation angle is an important
architectural phenotypic characteristic of a plant it should be explicitly incorporated
in functionalndashstructural plant models Dong et al (2008) proposed a functionalndash
structural tomato model in which leaf elevation angle is randomized according to an
ellipsoidal distribution Najla et al (2009) and Higashide (2008) used a fixed value to
describe all leaf elevation angles independent of their position in the canopy These
approaches assume a leaf distribution that is not affected by cultivation practices or
the specific plant genotype However Sinoquet et al (2005) showed that this is not
the case and that likely factors for the deviation from the randomness in leaf
positioning in a canopy can be linked to leaf size and angle In this study we
compared three leaf elevation angle distributions (CONST ELLIP and EXPL) and
showed that the previous approaches to modeling leaf elevation angle can lead to an
underestimation of light interception in the middle canopy ranging from 4 to 15
depending on the light conditions Although light interception in the canopy is the
same for all models the change in the middle canopy layer led in photosynthesis
simulation to differences of 3-8 Therefore in order to correctly model the
heterogeneity of plant canopy leaf elevation angles should be explicitly described
Chapter 22 Virtual plant for light interception and photosynthesis
38
Another point of importance in terms of plant architecture is the azimuth leaf
orientation Atheron and Rudich (1986) reported that in a single tomato plant leaves
were evenly distributed around the stem with a phyllotaxis angle of 135o Our data
show that tomato plants grown in a row crop system tend to rearrange their leaves in a
more systematic way namely almost perpendicular to the plant row Similar
phenomena where leaves are turned away from shady spots have been reported for
maize (Maddoni et al 2001) trees (Cournegravede et al 2007) and cucumber (Kahlen et
al 2008) Dauzat et al (2008) observed that branch placement was density-
dependent in cotton and that at high densities sympodial and monopodial branches
tended to orient towards the space between rows This placement of leaves and
branches is probably due to the plantrsquos strategy for maximizing light interception and
should also be taken into account when modelling plant architecture
Row crop systems are the most common cropping systems used in horticultural
and agronomic crops This system which was developed mainly to facilitate harvest
and crop management allows higher light penetration inside the plant canopy In our
experiment light intensity increased towards the middle of the path as also observed
by Stewart et al (2003) in maize and Louarn et al (2008) in grapevines Our
simulation showed that of the amount of light reaching the top of the canopy 50
reaches the ground floor in the middle of the path Light direction combined with light
intensity has a direct effect on light interception A seasonal pattern in fraction of light
intercepted has been reported for many species (Gilbert et al 2003 Cassela and
Sinoquet 2007) Light interception follows a seasonal pattern with on average a
lower fraction of light intercepted during summer than during winter A main factor is
the change in solar elevation changing during the year The higher solar elevation in
summer months results in an orientation of light rays more perpendicular to the plant
canopy resulting in a higher light penetration and lower interception Interestingly
row orientation seems to affect substantially light interception with north-south
orientation giving a higher light interception than east-west orientation The same
phenomenon has been reported by Palmer (1989) and Borger et al (2010) Kahlen et
al 2008 reported that light direction and intensity are linked to a possible growth
advantage of certain plants positions inside the canopy mainly by leaf rearrangement
towards the unshaded patches of the canopy or leaf photosynthetic acclimation to
altered light status Architectural adaptations of plants to the seasonal light patterns
would in this context be worth investigating
Chapter 22 Virtual plant for light interception and photosynthesis
39
Leaf elevation angle and vertical leaf distribution are highly relevant for the daily
amount of photosynthesis as was shown in the results Increase in light in lower
canopy layers resulted in a higher relative increase in photosynthesis A probable
explanation for this is the leaf acclimation to lower light intensities and the
physiological age in lower layers in the canopy (Niinemets 2007) Leaves situated
within the two rows received a substantially lower amount of light than leaves at the
same height situated towards the path If lower photosynthesis is partly an effect of
acclimation to lower light levels it stands to reason that leaves oriented towards the
middle of the plant rows will have a lower photosynthetic rate than leaves at the same
height that are oriented towards the path and very likely different photosynthetic
potential A common experimental approach for photosynthesis is to take
measurements only in the upper and middle canopy and only of leaves oriented
towards the path However model calculations showed that the use of one more set of
photosynthetic parameters can lead to a 7-10 difference in photosynthesis
prediction So it stands to reason that when a significant part of the canopy is oriented
towards the intra-row space with concomitant higher photosynthetic potential
predictions of crop photosynthesis will be inaccurate Virtual plant models are able to
cope with this given the proper data Chelle (2005) also pointed out the need for a
new modelling approach that will combine the organ microclimate with the general
plant environment He demonstrated the temperature differences that can be measured
at various plant organs and how the use of FSPMs can improve our understanding of
the effect of these differences on the plant processes A similar approach should be
used for photosynthesis modelling as it would improve our understanding of the
impact of various crop strategies on photosynthesis
Conclusions
Leaf elevation angles of heterogeneous canopies should be explicitly described as
they have a big impact both on light interception and on photosynthesis Comparisons
between 3D models with explicitly described leaf elevation angles and models with
standard leaf elevation angle distributions resulted in differences of 4-15 depending
on the light conditions and the number of the sets of photosynthetic parameters In this
frame functional-structural models can play an important role in our understanding of
light distribution along vertical and horizontal gradients caused by crop architecture
Such a tool can be useful in practise not only in yield prediction but also in
Chapter 22 Virtual plant for light interception and photosynthesis
40
experimentation planning as well However steps should be taken to move from a
static to a dynamic crop so as to incorporate the seasonal adaptation of the plants
Chapter 23
Searching for the ideal plant structure with a functional-structural plant model How plant architecture affects light absorption and photosynthesis in tomato
Accepted as
Sarlikioti V de Visser PHB Buck-Sorlin GH Marcelis LFM 2011 How
plant architecture affects light absorption and photosynthesis in tomato Towards an
ideotype for plant architecture using a functional-structural plant model Annals of
Botany in press
Chapter 23 Using FSPM to optimize plant structure in tomato
43
Abstract
Manipulation of plant structure can strongly affect light distribution in the canopy
and photosynthesis The aim of this paper is to find a plant ideotype for optimization
of light absorption and canopy photosynthesis Using a static functional structural
plant model (FSPM) a range of different plant architectural characteristics was tested
for two different seasons in order to find the optimal architecture with respect to light
absorption and photosynthesis Simulations were performed with a FSPM of a
greenhouse-grown tomato crop Sensitivity analyses were carried out for leaf
elevation angle leaf phyllotaxis leaflet angle leaf shape leaflet arrangement and
internode length From the results of this analysis two possible ideotypes were
proposed Four different vertical light distributions were also tested while light
absorption cumulated over the whole canopy was kept the same Photosynthesis was
augmented by 6 in winter and decreased by 7 in summer when light absorption in
the top part of the canopy was increased by 25 while not changing light absorption
of the canopy as a whole The measured plant structure was already optimal with
respect to leaf elevation angle leaflet angle and leaflet arrangement for both light
absorption and photosynthesis while phyllotaxis had no effect Increasing the length-
to-width ratio of leaves by 15 or increasing internode length from 7 to 12 cm led to
an increase of 6 ndash 10 for light absorption and photosynthesis At high light
intensities (summer) deeper penetration of light in the canopy improves crop
photosynthesis but not at low light intensities (winter) In particular internode length
and leaf shape affect the vertical distribution of light in the canopy A new plant
ideotype with more spacious canopy architecture due to long internodes and long and
narrow leaves led to an increase in crop photosynthesis of up to 10
Chapter 23 Using FSPM to optimize plant structure in tomato
44
Introduction
Light absorption is an important factor for determining crop yield being one of
the driving forces behind plant photosynthesis and at the same time is highly
dependent on single-plant architecture as well as on overall canopy structure
(Niinemets 2007) Plant architectural characteristics (such as the number and
geometry of organs ie their shape and position within the plant and the canopy) are
genotype specific while at the same time highly dependent on the climatic conditions
at the time of their initiation and development (Godin 2000) Falster and Westoby
(2003) have shown that steeper elevation angles in a number of species improve
absorption at higher sun elevations and therefore carbon gain through assimilation as
it allows more light to penetrate to the lower leaves While the importance of leaf
elevation angles for an improved light absorption strategy at the level of the whole
plant has been shown in a number of studies (Pearcy and Yang 1998 Sinoquet et al
2005) reports about the importance of leaf phyllotaxis are contradictory as some
studies did and some did not observe effects on the light absorption of the canopy
(Brites and Valladares 2005) Furthermore aspects such as the elevation angles of the
leaflets of composite leaves have not been to the best of our knowledge previously
investigated Both leaf shape and size are important aspects of leaf morphology
affecting mutual shading of leaves and light absorption of the canopy (Falster and
Westoby 2003)
The quantitative exploration of the specific effects of each plant architectural
characteristic on light absorption and photosynthesis was hardly possible until the
introduction of spatially explicit models considering plant architecture at the organ
level (Vos et al 2010) General crop models are powerful tools towards a better
understanding of plant processes and for testing case scenarios (Marcelis et al 1998
Vos et al 2007) More specifically functional-structural plant models (FSPM) have
been introduced as a relatively recent paradigm in plant modelling where
physiological processes are coupled with an explicit 3D plant structure (Vos et al
2010) often supplied with a mutual feedback between physiology and structure
Modelling on the basis of a 3D structure gives the opportunity to investigate more in-
depth the effect of specific architectural characteristics such as leaf angle leaf length
or leaf shape (Vos et al 2010) Sinoquet et al (2005) used FSPMs to show the effect
of leaf and branch distribution on light absorption of trees Sarlikioti et al (2011)
developed a static tomato FSPM to explore the spatial distribution of light absorption
Chapter 23 Using FSPM to optimize plant structure in tomato
45
and photosynthesis in a tomato canopy They demonstrated the importance of an
explicitly described leaf angle distribution for simulating light absorption and
photosynthesis Accurately calibrated FSPMs can convey a better understanding of
the light distribution inside the canopy and also provide us with a tool to define the
optimal set of architectural characteristics for maximizing canopy photosynthesis
allocation of assimilates to growing organs and ultimately crop yield
Donald (1968) defined the ldquocrop ideotyperdquo in the context of cereal breeding as an
idealized plant type with a specific combination of characteristics favourable for
photosynthesis growth and grain production based on knowledge of plant and crop
physiology and morphology He argued that it would be more efficient to define a
plant type that was theoretically efficient and then breed for this The crop ideotype is
thus an idealized crop consisting of a plant type with a specific combination of
characteristics based on the detailed knowledge of morphological and physiological
plant traits (Peng et al 2008) as well as mutual interactions among plants of the
canopy These traits often are also contributing to plant architecture Modifications of
the arrangement and size of leaves can affect light availability especially in the lower
parts of the canopy and alter leaf photosynthetic activity by adjusting light harvesting
efficiency (Werner et al 2001) As an example a decrease in leaf clustering can
increase light absorption and enhance photosynthetic productivity at canopy level (De
Castro and Fetcher 1999) Morphological characteristics such as leaf inclination and
leaf shape are often inherited as simple traits (ie under the influence of one or a few
major genes) in the plant (Thurling 1991) and can be used to create a more open
canopy structure These breeding traits can be strongly affected by the environment
under stress conditions (Valladares and Niinemets 2007) Tomato (Solanum
lycopersicum L) is a species that exhibits a high variability in vegetative morphology
(Peralta and Spooner 2000) ranging from small leaves with a few leaflets to big ones
with many leaflets Lately studies of the genetic basis of this variation at the leaf level
have shown that there are leaf-specific genes that control its shape and morphology
(Frary et al 2004) This genetic background knowledge in combination with the
detailed information on the effect of leaf topology and geometry on light absorption
and photosynthesis could help to identify or approximate the theoretical optimum of
plant architecture
The objective of this study is to define a plant ideotype for greenhouse-grown
tomato with respect to optimization of light absorption and photosynthesis at the
Chapter 23 Using FSPM to optimize plant structure in tomato
46
canopy level A range of different plant architectural characteristics were tested under
light conditions of a typical summer and winter day in order to define the ideal for
each case We tested two hypotheses 1) The manipulation of plant structure of a
greenhouse-grown tomato crop can lead to substantial improvement in crop
photosynthesis even when leaf area index and leaf photosynthetic characteristics
remain unaltered 2) A more spacious canopy architecture improves crop
photosynthesis For this purpose we used the static functional structural tomato model
developed by Sarlikioti et al (2011)
Material and methods
Model description
Simulations were performed with a functional structural tomato model This
model was built as a parametric open L-system using the cpfg language within the
platform L-Studio (Prusinkiewicz 1999) consisting of three modules (model structure
and parameterization has been described in detail in Sarlikioti et al (2011)
Architectural module
This is essentially a static 3D reconstruction of tomato plant architecture in which
each plant consists of 27 phytomers with the first phytomer being the one at the top of
the plant (basipetal ranking) A phytomer is the basic architectural unit consisting of a
leaf and an internode the leaf itself being made up of a leaf rachis a central midrib
and 13 individual leaflets each one of them consisting of a blade and a petiole of
which one is terminal and 12 are lateral The blade of each leaflet is described as a flat
polygon instead of one with a curvature for reasons of calculation efficiency
Characteristics are leaf elevation angle (defined as the angle between the leaf rachis
at its insertion point to the stem and the horizontal plane) leaf length (defined as the
distance from the leaf insertion point at the stem to the tip of the terminal leaflet) and
leaf width (defined as the distance between the tips of two longest lateral leaflets)
The construction of the leaf leads to a 3D object The architectural model was
parameterized during a summer period for a fully grown tomato crop (Solanum
lycopersicum L var lsquoArancarsquo) grown in a high-wired greenhouse system in
Bleiswijk The Netherlands (52deg01N 4deg32E) with a density of 41 stems m-2 (see
Sarlikioti et al 2011) LAI was equal to 36 m2 of leaf area per m2 floor area Every
week the lowest leaves were removed the plants were lowered and kept at the same
Chapter 23 Using FSPM to optimize plant structure in tomato
47
height throughout the season as it is common practice in the Netherlands Therefore
plant architecture remained ldquostaticrdquo at least during each season (summer winter) For
that reason a static modeling approach was used
Light module
Light calculations are based on a nested radiosity approach developed by Chelle
and Andrieu (1998) The module requires as an input the amount of light absorbed by
each plant organ the leaf transmittance and reflectance coefficients for the upper and
lower side of the leaf (upper side reflectance = 017 upper side transmittance = 006
lower side reflectance = 012 lower side transmittance = 003) and the light from the
light sources that were used to simulate the sky In the Netherlands greenhouses are
usually larger than 1 ha In order to better approach real greenhouse cultivation
conditions an infinite canopy was assumed in which the basic unit is theoretically
reproduced in all directions thus avoiding a border effect during the calculations The
basic unit consisted of 20 plants arranged in two double rows with five plants per row
The distance between the double rows was 12 m (path) the distance between each
row of the double row (within the row distance) was 04 m and the distance between
plants within the row was 03 m
Photosynthesis module
Photosynthesis calculations are based on the biochemical model of Farquhar et al
(1980) This model requires as input the computed light absorbed per leaflet in the
model and photosynthetic parameters that were derived from the experimental data
(Sarlikioti et al 2011) All photosynthetic parameters (Vmax α θ etc) were assumed
invariate with canopy depth except for Jmax which followed a logistic pattern from
the top to the bottom of the canopy (Jmax at the top = 265 micromol e- m-2 s-1 Jmax at the
bottom= 180 micromol e- m-2 s-1)
Case studies
In this study we attempted to define the importance of each architectural
component for optimum light absorption and canopy photosynthesis by performing a
sensitivity analysis of the most important components as they appear in the literature
Each component is described in detail below
Chapter 23 Using FSPM to optimize plant structure in tomato
48
Simulations were performed under summer and winter light conditions and for
two distinctive days (December 21 and June 21) using ten-yearly (2000-2010)
averages with an hourly time step of direct and diffuse light incident at these dates
under Dutch conditions Daily global radiation outside the greenhouse was equal to
35 MJ m-2 d-1 in winter and 26 MJ m-2 d-1 in summer Transmissivity of the
greenhouse was 60 For direct light conditions light sources were given the same
Cartesian co-ordinates as the solar trajectory To simulate diffuse light light sources
were positioned on a virtual hemisphere around the architectural mock-up In total 48
directional light sources were used with daily intensity equal to 15 MJ m-2 d-1 in
winter and 75 MJ m-2 d-1 in summer The fraction of diffuse light was equal to 03 for
winter and 022 for summer Leaf temperature was 23 oC and calculations were
performed for CO2 levels equal to 400 ppm Computed hourly assimilation rates were
integrated to daily amount of assimilates produced
Vertical light distribution scenario
In order to understand the effect of vertical light distribution on canopy
photosynthesis we constructed four light absorption curves (Fig 321A) that were
based on the light absorption of the reference structure for each date Light absorption
was increased and decreased from the first to the 8th phytomer by 10 and 25
respectively while the light absorption of the canopy as a whole remained the same
Canopy photosynthesis was calculated for each curve
Leaf elevation angle
Here we studied the effect of modifying leaf elevation angle with respect to the
original angular distribution As a starting value we assumed an explicitly described
leaf angle distribution (Sarlikioti et al 2011) Simulations were carried out by adding
or subtracting 15 o or 30 o to the measured value of each leaf in the canopy In the
reference crop the leaf angle distribution ranged from -23 o for bottom leaves to 15 o
for top leaves
Chapter 23 Using FSPM to optimize plant structure in tomato
49
Fig 231 Five different vertical light absorption profiles (top graph) were imposed as
treatments for studying the optimal profile for maximum crop photosynthesis The
absorbed light is the cumulated value from top (phytomer 1) to bottom of the canopy
Photosynthesis at 1200 h (g CH2O m-2 h-1) is presented for each treatment for winter
(middle graph) and summer (lower graph) light conditions Treatments for absorption
profile are -25 -10 0 +10 and +25 These values refer to the percentage change
in light absorption in the upper eight phytomers of the canopy while light absorption
cumulated over the whole canopy was kept constant
Chapter 23 Using FSPM to optimize plant structure in tomato
50
Leaf phyllotaxis
The phyllotactic angle is defined as the angle between two subsequent leaves
along the plant stem Atherton and Rudich (1986) reported that tomato plants follow a
common 135 o phyllotaxis In reality however plants tend to rearrange their leaves
thereby deviating from this value In previous experiments we found that phyllotactic
angle on a tomato row crop is about 160 o (Sarlikioti et al 2011) Here we assess the
effect of leaf phyllotaxis for values equal to 110 o 135 o 150 o and 180 o
Leaflet angle
As leaflet angle we define the angle between the leaflet petiole and the leaf rachis
In a composite leaf leaflet angles steadily decrease from the proximal to the terminal
leaflet On average the measured leaflet angle of tomato leaves was 22 o ranging from
35 o for the basal leaflets to 0 o for the terminal leaflet (Sarlikioti et al 2011) In the
present study this original distribution (reference crop) was compared with leaves
having all leaflets oriented at an angle of 22 o or 0 o
Leaf shape
The ratio between leaf length and leaf width was used as a convenient measure of
leaf shape In the model the default value of the length-to-width ratio is equal to 102
Leaf ratios of 05 075 125 15 and 2 times the original ratio were tested for their
effect on light absorption and canopy photosynthesis These ratios resulted in a range
of leaf shapes from wide and short leaves to long and narrow ones For all simulations
the leaf area index per plant was kept constant at 36 m2 leaf area per m-2 floor area
Leaflet arrangement on a leaf
The area of each leaf is equal to the sum of the areas of each of its leaflets In the
leaf of a typical tomato cultivar pairs of big and small leaflets alternate A wide range
of leaf types can be found in tomato We investigated the (crop scale) effect of leaf
types with all leaflets having the same area as well as the effect of having fewer but
bigger leaflets (Fig 232) Also the effect of an increase of petiole length by 20 of
the original value was investigated In all simulations the area per leaf (sum of all
leaflets) was kept the same
Chapter 23 Using FSPM to optimize plant structure in tomato
51
Fig 232 Schematic representation of leaflet arrangement scenarios The total
area per composite leaf was kept constant
Internode length
As internode length we define the distance between the insertion points of two
consecutive plant organs (leaves or trusses) Measured average internode length was
745 cm (stdev= 08) (Sarlikioti et al 2011) Here we investigated the effect of
internode lengths of 3 cm 5 cm 10 cm and 12 cm In all simulations leaf number (13)
and area per leaf (m2) were kept constant
Ideotyping scenarios
After the above assessment of architectural characteristics of the tomato plant we
found that a number of parameters improve the light absorption as well as canopy
photosynthesis Based on these results we designed the following two scenarios
bull Scenario A For this scenario architectural characteristics were chosen
which by themselves had produced a minimum increase in canopy
photosynthesis by 4 Internode length was set to 10 cm length-width
ratio to 15 all other architectural characteristics were kept the same as in
the reference structure
bull Scenario B This scenario aimed at reconstructing an open structure of the
canopy The internode length was again set to 10 cm and for leaflet
arrangement the leaves with longer petioles (Fig 232) were chosen All
other architectural characteristics remained the same as in the reference
structure
Chapter 23 Using FSPM to optimize plant structure in tomato
52
Results
Vertical light distribution scenario
Imposing five different vertical light absorption profiles while keeping light
absorption cumulated over the whole canopy constant (Fig 231A) showed some
distinct effects on canopy photosynthesis Under winter light conditions at noon
canopy photosynthesis increased by 6 when absorption in the top part of the canopy
(upper 8 phytomers) was increased by 25 (Fig 231B) In contrast under summer
light conditions for the same increase of light absorption canopy photosynthesis was
decreased by 7 (Fig 231C)
Leaf elevation angle
Highest light absorption was achieved with the original leaf angle distribution
(leaf angle decreasing from 15 o degrees for top leaves to -23 o degrees for bottom
leaves) under winter light conditions (Fig 233A) while under summer conditions it
was maximum when elvation angle was changed by 30 o (Fig 233B) Changes in
leaf angle of plusmn15 o degrees decreased light absorption by 5 and an increase of the
leaf angle to +30 o led to a decrease of 6 under winter conditions (Fig 233A) A
decrease in leaf angle by 30 o distinctively decreased light absorption by 18 Under
Fig 233 Effect of leaf elevation angle on cumulated light absorption from top
(phytomer 1) to bottom of the canopy under winter (left) and summer (right) light
conditions 0o refers to the reference structure with an angle distribution ranging from 15o
(top leaves) to -23o (bottom leaves)
Chapter 23 Using FSPM to optimize plant structure in tomato
53
summer light conditions (Fig 233B) the increase was equal to 3 for plusmn30 o
treatments Interestingly in winter simulations the decrease in elevation angle by 30 o
did not only decrease light absorption but also changed the vertical distribution of
light absorption leading to a higher absorption at the top part of the canopy (Fig
233)
In general a change in elevation angle decreased canopy photosynthesis by 6 to
7 in winter which is similar to the reduction in light absorption (Table 1) However
when the angle was decreased by 30 o canopy photosynthesis decreased only by 11
while absorption was decreased by 18
Leaf phyllotaxis
Changes in phyllotactic angle hardly affected light absorption (data not shown)
and canopy photosynthesis (Table 1)
Leaflet angle
An increase in leaflet angle from completely horizontal leaflets (0 o) to an angle
of 22 o resulted in an increase in light absorption by 2 in winter (Fig 234A) and
8 (Fig 234B) in summer The subsequent increase in canopy photosynthesis was
2 under winter and 8 under summer light conditions (Table 1) When all leaflet
angles were 22 deg light absorption was 2 lower under winter and 4 under summer
light conditions compared to the reference plants (angle decreasing from 35 deg for
basal leaves to 0 deg for the terminal leaflet) (Fig 234) while canopy photosynthesis
exhibited the same increase for both seasonal conditions
Leaf shape
The simulations showed that longer and narrower leaves (LWgt1) increased
cumulative light absorption of the canopy in comparison to shorter and wider leaves
when leaf area was kept constant LW ratio was positively correlated with light
absorption (Fig 235) Light absorption was decreased by 8 and 12 respectively
in winter (Fig 235A) and 14 and 23 respectively in summer for a leaf ratio
decrease of 025 and 05 (Fig 235B) An increase in the LW ratio to 125 of the
reference value resulted in an increase in light absorption by 5 in winter and 4 in
summer When the ratio was 15 times as high as the reference ratio light absorption
Chapter 23 Using FSPM to optimize plant structure in tomato
54
Table 231 Assimilation rate (g CH2O m-2 d-1) in response to leaf elevation angle phyllotaxis leaflet angle and arrangement leaf length width ratio internode length scenarios as well as the optimized architectures Total canopy photosynthesis Winter Summer Leaf elevation angle -30o 47 405 -15o 5 405 0 (reference structure) 53 42 +15o 5 405 +30o 49 417 Leaf azimuth angle 110o 52 423 135o 53 418 160o (reference structure) 53 42 180o 51 417 Leaflet angle 0o 51 373 22o 52 405 From 35o to 0˚ (reference structure)
53 42
Leaflet arrangement
Longer leaflet petioles 52 394 Same area leaflets 5 393 Fewerbigger leaflets 49 418 reference structure 53 42 Leaf length width ratio 05 47 343 075 48 398 102 (reference structure) 53 42 125 55 442 15 56 446 Internode length 3 cm 43 37 5 cm 5 388 7 cm (reference structure) 53 42 10 cm 56 442 12 cm 57 446 Optimized canopy architecture Scenario A 56 452 Scenario B 59 467
Chapter 23 Using FSPM to optimize plant structure in tomato
55
Fig 234 Effect of leaflet angle on cumulated light absorption from top (phytomer 1) to
bottom of the canopy under winter (left) and summer (right) conditions In the reference
structure the angle is decreasing from 35o for basal leaflets to 0o for the terminal leaflet
was increased by 8 in winter and 10 in summer An increase in LW ratio to 2
did not further increase light absorption (data not shown) The effect of the different
treatments on canopy photosynthesis followed the trends observed in light absorption
but the total increase was 1- 2 smaller compared to the increase in light absorption
(Table 1)
Leaflet arrangement
Changing the arrangement of leaflets within a leaf while keeping leaf area
constant (Fig 232) affected the vertical light distribution as well as the total light
absorption The reference structure showed the maximum absorption under both
summer and winter conditions (Fig 236A and 236B) Plants with the reference
leaves ie exhibiting irregular leaflet size absorbed more light in the top portion of
the canopy (05 ndash 1 m) than leaves with equally sized leaflets Leaves with fewer but
bigger leaflets absorbed more light than leaves with more but smaller leaflets (Fig
236) An increase in petiole length slightly diminished both light absorption and
Chapter 23 Using FSPM to optimize plant structure in tomato
56
Fig 235 Effect of leaf shape on cumulated light absorption from top (phytomer 1) to
bottom of the canopy under winter (left) and summer (right) conditions Leaf shape is
referring to length-to-width ratio with reference structure having a ratio of 1
canopy photosynthesis in both seasonal conditions The effect of the difference in
vertical light distribution between the scenarios was reflected on canopy
photosynthesis where the leaf with leaflets of the same area exhibited 2 less canopy
photosynthesis in winter and 6 in summer than the other two scenarios (Table 1)
Fig 236 Effect of leaflet arrangement on cumulated light absorption from top
(phytomer 1) to bottom of the canopy under winter (left) and summer (right) light
conditions
Chapter 23 Using FSPM to optimize plant structure in tomato
57
Internode length
Light absorption and canopy photosynthesis were strongly affected by internode
length A decrease in the average internode length from 7 to 3 cm reduced cumulative
light absorption by 14 in winter and by 12 in summer An increase in internode
length from 7 cm to 10 cm resulted in an increase of light absorbed of 4 in winter
and 5 in summer while a further increase in internode lengths to 12 cm resulted in a
further increase in light absorption by 2 for each date With respect to canopy
photosynthesis the increase in internode length to 10 cm increased canopy
photosynthesis by 5 to 6 in summer and winter (Table 1) An increase to 12 cm
increased photosynthesis by 8 and 6 for winter and summer respectively
Ideotyping scenarios
According to the above assessment of architectural characteristics of the tomato
plant two ideotyping scenarios were designed In scenario A internode length was set
to 10 cm LW ratio to 15 while all other architectural characteristics were kept the
same as in the reference structure In scenario B plant structure consisted of the same
long internodes (10 cm) and a leaflet arrangement with long leaf petioles was chosen
while all other architectural characters remained the same as in the reference structure
Scenario A improved both light absorption (data not shown) and canopy
photosynthesis by 6 (Table 1) in winter and by 8 in summer respectively In
scenario B the construction of a more open structure of the canopy resulted in an
increase in light absorption of 11 in both winter and summer with a similar increase
in canopy photosynthesis
Discussion
From the result of this work we can conclude that both light absorbed and the
vertical distribution of light in the canopy are very important for crop photosynthesis
Analysing the effects of vertical light distribution showed that these effects strongly
differ between winter and summer light conditions Deep penetration of light into the
canopy has positive effects in summer while these effects are negative in winter
Under summer light conditions photosynthesis of the upper leaves may be close to
saturation which explains the positive effects of deep penetration of light This is in
contrast to the photosynthesis rate of lower leaves which remains unsaturated Under
winter light conditions photosynthesis of the upper leaves is far from saturation With
Chapter 23 Using FSPM to optimize plant structure in tomato
58
the same light intensity at leaf level upper leaves have a higher rate of photosynthesis
than lower leaves (eg Sarlikioti et al 2011) This effect dominates in winter
resulting in the lower crop photosynthesis when the light penetrates deeply into the
canopy
Leaf elevation angles are maybe among the best investigated traits It has been
shown that a change in the elevation angles significantly influences light captured in
different environments (Niinemets and Fleck 2002 Valladares and Pearcy 1998) In
our previous study (Sarlikioti et al 2011) we showed that changes in leaf angles
could have a substantial effect on both light absorption and photosynthesis In the
current study optimal results were achieved when leaf elevation angle distribution
ranged between 15 o (top) and -23 o (bottom) indicating that during the cultivation
period the plant orientates its leaves in such a way as to maximize light absorption and
therefore photosynthesis Deviations from that range failed to distinctly increase both
light absorption and photosynthesis though the vertical light distribution was
affected
Modifying the phyllotactic angle resulted in no improvement of light absorption
and photosynthesis These findings agree with those of Niklas (1998) who reported
that phyllotactic angle in a crop has no effect on light absorption or photosynthesis In
contrast to this Zotz et al (2002) reported that change of leaf phyllotaxis to a golden
angle of 1375 o significantly improved the light capture efficiency in an epiphytic
plant Nevertheless phyllotactic angle is very dependent on light competition
Although a change in the angle as such might have no direct effect on light absorption
and photosynthesis it might be followed by changes in other architectural
characteristics that may lead to an increase in plant efficiency with respect to light
absorption and photosynthesis
In our study we found that an increase in LW ratio of leaves by 05 boosted light
absorption by 8 in winter and 10 in summer In environments where light is not an
inhibiting parameter (eg because of an excess in radiation) structures that avoid
mutual shading of the leaf components as well as the shading between neighbouring
leaves can be advantageous for optimization of light absorption A high leaf LW ratio
has been reported to have a positive effect on light capture and crop photosynthesis in
many species (Falster and Westoby 2003) Other aspects of morphology of composite
leaves such as shape and number of leaflets have to our knowledge hardly been
investigated In forest species it has been shown that the space and degree of overlap
Chapter 23 Using FSPM to optimize plant structure in tomato
59
of the leaves in leaf clusters on the same branch has a significant effect on light
capture (Planchais and Sinoquet 1998)
Takenaka et al (1994) showed that in general an increase in internode length
causes an increase in light absorption and photosynthetic efficiency in nature in fact
hormonally mediated internode elongation is among the most important mechanisms
of the so-called shade avoidance syndrome a set of processes that enable a plant to
avoid shading by neighbouring plants (Smith and Whitelam 1997) Our results
showed that plants with longer internodes exhibited higher light absorption and
photosynthesis both in winter and summer
The combination of different architectural parameters in the ideotype scenarios
resulted in an increase in both light absorption and canopy photosynthesis Both
ideotype scenarios aimed at creating a more open structure with more light absorption
In both cases this combination of characteristics led to an increase in photosynthesis
which in turn could potentially result in a yield increase Modern developments in
plant breeding can use this type of information to produce more efficient genotypes in
terms of canopy photosynthesis On the other hand plant architectural characteristics
are very plastic and plants are usually dynamically adapting to their environment
(Valladares et al 2007) thereby potentially eluding breeding efforts towards a light
absorption ideotype For example during the course of the day leaf movement has
been observed (Kao and Forseth 1992) or plants tend to readjust their position when
facing an intense environmental factor such as for example shading (Kahlen et al
2008) Thus even if this type of static model can give us a good quantification of the
effect of each parameter on light absorption and photosynthesis the ensuing genotype
has to be tested under actual cultivation conditions in order to verify the expectations
In the simulation model photosynthetic parameters decreased from top to the
bottom of the canopy These parameters were not adjusted with the increase or
decrease of light intensities in the middle and lower parts of the canopy In other
words no dynamic adaptation of these parameters to the new light profiles induced by
the case studies was considered In reality leaf photosynthetic potential of course
adapts to the long term light conditions a leaf has been exposed to (Gonzaacuteles-Real et
al 2007) as well as the short term changes in light climate during the day (Schurr et
al 2006) Experimental data describing these phenomena could help to improve the
model calculations by taking into account these adaptations
Chapter 23 Using FSPM to optimize plant structure in tomato
60
Conclusions
The importance of different plant architectural components for light absorption
and photosynthesis was investigated in detail using a static virtual plant Our
simulations lead to the conclusion that the most important architectural traits with
respect to the optimization of light absorption and photosynthesis are internode length
and leaf shape We also assessed the importance of vertical light distribution for
canopy photosynthesis and showed that the advantage of a deeper penetration of light
in the canopy depends on the season
Chapter 3 Monitoring PAR interception and photosynthetic stress
Chapter 31
Crop Reflectance as a Tool for Online Monitoring Of LAI and PAR Interception in Two Different Greenhouse Crops
Published as
Sarlikioti V Meinen E Marcelis LFM 2011 Crop reflectance as a tool for the
online monitoring of LAI and PAR interception in two different greenhouse Crops
Biosystems Engineering 108 113-120
Chapter 31 Crop reflectance for monitoring LAI and PAR interception
63
Abstract
The aim of this study was to explore ways of on-line monitoring of LAI and PAR
interception of the canopy in greenhouse conditions through reflectance
measurements on the PAR part of the spectrum for tomato and sweet pepper LAI and
PAR interception were measured at the same moments as reflectance at six
wavelengths in different plant developmental stages in greenhouses Normalized
Difference Vegetation Index (NDVI) was also calculated Relationships between the
measured parameters were established in experimental greenhouses and subsequently
these were tested in commercial greenhouses The best estimation for LAI and PAR
interception was obtained from reflectance at 460nm for both tomato and sweet
pepper The goodness of the fit validated with data from the commercial greenhouses
was also tested in this study The divergence of the results from the ones reported
from field experiments can be traced on the special greenhouse environment where
more sources of reflectance are added due to construction parts and a white plastic
covered background Thus this new approach of estimating LAI and PAR interception
from 460 nm is promising and can play a role in the decision support systems of
modern greenhouse management
Chapter 31 Crop reflectance for monitoring LAI and PAR interception
64
Introduction
Todayrsquos highly industrialized production of greenhouse crops in combination with
the increasing demand for a more sustainable production are pointing at the necessity of
decision support systems Methods of online monitoring of the major crop properties
should be established Leaf area is one of the most important crop properties which
have a strong physiological impact on plant functioning namely PAR interception and
thus photosynthesis Unfortunately current models of leaf area index (LAI)
development in use are not sufficiently correct and may lead to errors in calculating
light interception (Jonckheere et al 2004) PAR interception can currently be
measured manually A light stick is used to take measurements on the top and bottom
of the canopy In order to gain a reliable estimation of PAR interception many
measurements at different canopy spots are needed This method can therefore be
applied only for experimental purposes and not for commercial application as it is
rather time consuming Therefore the existence of an online monitoring technique
would improve the efficiency of the measurement
Optical remote sensing has been used in the past for the online monitoring of
parameters such as chlorophyll and nitrogen content plant stress etc in field grown
crops Attempts to measure LAI and PAR interception with the use of remote sensing
have been successful in field crops Different approaches have been used for the data
collection with sensors either on low range (ground) or far range (low flights or
satellites) (Bouman et al 1992 Clevers 1997) Efforts in the field to use reflectance
measurements for the estimation of the canopy nitrogen biomass and photosynthesis
in wheat (Gitelson et al 2002) potato (Jongschaap 2006) sugar beets (Clevers
1997) miscanthous (Vargas et al 2002) and rice (Tian et al 2005) were successful
Plant canopy exhibits strong absorption in the red part of the spectrum (around
670nm) where reflectance is less than 3-5 (Gitelson 2002) Low reflectance in this
part of the spectrum is strongly related to high light absorption from chlorophyll and
secondary photosynthetic pigments On the other hand in the near-infrared part of the
spectrum about 50 of the light is reflected 45 is transmitted and only a small part
is absorbed Turner et al 1999) The steep difference of canopy reflectance between
red and near-infrared enables the distinction of vegetation from background materials
(Bouman et al 1992)
Many studies aimed at determining combinations of reflectance of different
wavelengths for correcting the effect of disturbing factors (such as old leaves and soil
Chapter 31 Crop reflectance for monitoring LAI and PAR interception
65
background) on the relationship between crop reflectance and crop characteristics
such as LAI These combinations of the reflectance at different wavelength bands are
known as vegetation indices (VIrsquos) Vegetation indices are quantitative measures that
are used in an attempt to measure vegetation abundance or vigor (Wang et al 2005)
Some of the vegetation indices proposed during the years are the Weighted
Difference Vegetation Index (WDVI) (Bouman et al 1992) the infrared red (IRR)
ratio and the red edge leaf effect with the most commonly used the Normal
Difference Vegetation Index (NDVI) (Wang et al 2005) NDVI is based on ratios of
red (R) to near-infrared (NIR) reflectance where NDVI= (NIRminusR)(NIR+R) R and
NIR ratio-based indices are strongly rooted in the contrasting response of R and NIR
reflectance to increases in LAI (Chen et al 2002)
Though remote sensing has been applied quite successfully in the open field it
has not yet been tested in protected cultivations Open-field methods cannot directly be
transported in greenhouses due to complicating conditions such as existence of
greenhouse structure and ground covering with white plastic So research has yet to be
done to test under which conditions remote sensing can be applied for plant monitoring
inside a greenhouse The aim of this paper is to explore an accurate way for an on-line
estimation of LAI and PAR interception based on reflectance measurements in two
greenhouse grown crops (tomato and sweet pepper)
Materials and methods
Experiments
Seven experiments were conducted with tomato (Lycopersicon esculentum L
Exp 1-7) and two with sweet pepper (Capsicum annuum L Exp 8-9) grown in
greenhouses Experiments were conducted in experimental greenhouses (Exp 1- 4 for
tomato and Exp 8 for sweet pepper) for developing relationships estimating LAI and
PAR interception from canopy reflectance These relationships were afterwards tested
in commercial greenhouses (Exp 5-7 for tomato and Exp 9 for sweet pepper) In Exp
1 plants were evenly distributed in the greenhouse (plants were placed in equal
distances) In the other experiments plants were grown in rows For an overview of
the experiments see Table 311
Chapter 31 Crop reflectance for monitoring LAI and PAR interception
66
Table 311 Overview of set-up of all experiments the type of the measurements
taken and the plant age for the duration of the experiments Experimental
greenhouse refer to university facilities while commercial greenhouse refer to
units managed by growers LAI PAR interception of the crop and crop
reflectance were measured (+) unless otherwise indicated (-)
Measurements were taken every seven to fifteen days depending on the weather
conditions from a week after planting till the end of the cultivation cycle (table 1)
Diffuse radiation conditions were chosen in order to avoid measuring errors occurring
with direct sun conditions such as shadow stripes caused by the construction parts of
the greenhouse as well as low sun azimuth and insufficient cosine correction of the
diffuser
Reflectance measurements
For the reflectance measurements Cropscan MSR87 (CropScan Rochester
USA) sensor was used The downward facing sensor was equipped with eight
Exp No
Crop Plant age (in days from planting)
PAR interception
Reflectance LAI
1 tomato Experimental experiment
0-117 + + -
2 tomato Experimental greenhouse
0-117 + + -
3 tomato Experimental greenhouse
0-126 + + -
4 tomato Experimental greenhouse
0- 80 + + -
5 tomato Commercial greenhouse
2-171
+ + +
6 tomato Commercial greenhouse
180-240 + + -
7 tomato Commercial greenhouse
180-240 + + -
8 sweet pepper
Experimental greenhouse
58-73 + + +
9 sweet pepper
Commercial greenhouse
0-274 + + +
Chapter 31 Crop reflectance for monitoring LAI and PAR interception
67
spectral bands each covering approximately 20nm centered at 460 510 560 610
660 710 760 and 810 nm The data were recorded with a datalogger The sensor was
positioned parallel to the ground at 4m height The viewing angle of 28 degrees
resulted in a viewing area of 3 m2 At each measuring date reflectance was measured
in 8 independent plots of the crop canopy with 2 measurements per plot Data were
averaged per plot The effect of the background reflectance (white plastic) was
investigated with a small trial with new and old sheets of plastic as background The
difference on reflectance of the two treatments was a maximum of 10 when no crop
was present and diminished as the LAI was increasing (data not shown)
PAR interception measurements
PAR interception was measured above and below the canopy in the same spots as
reflectance For each position eight successive readings were taken For PAR
interception measurements a SunScan Canopy Analysis System SS1-UM-105 (Delta-
T Cambridge UK) was used Sunscan sensor consists of a light sensitive stick that is
1 meter long containing 64 photodiodes equally spaced along its length measuring
incident PAR light It was coupled with a Beam Fraction sensor (BFS) that measures
total light as well as PAR light levels The BFS sensor was mounted at the trellis on
the top of the greenhouse measuring the incident light on the canopy at the same time
with the measurements with the stick in the canopy
PAR interception was calculated as follows
PAR interception= 1-(PAR below the canopy PAR above the canopy) Eqn 311
In many crop models Lambert- Beers law (Monsi and Saeki 1953 Marcelis et al
1998) is used for the simulation of PAR interception by the crop It assumes uniform
and infinite canopy of randomly distributed absorbing leaves The amount of
photosynthetically active radiation intercepted (I) by a crop is calculated as
I= (1-ρ)I0(1-e-kL)100 Eqn 312
Where ρ stands for canopy reflection coefficient I0 is the radiation level at zero
canopy depth L the leaf area index of the canopy and k is the light extinction
coefficient of the crop Lambert- Beerrsquos law was applied on the data and the
extinction coefficient was calculated
Chapter 31 Crop reflectance for monitoring LAI and PAR interception
68
k= Ln(IIo) LAI Eqn 313
Leaf Area Index measurements
Leaf Area Index was measured destructively The leaves were sampled on the
same dates as the reflectance and PAR interception measurements and their leaf area
was measured with LI- COR 3100 meter (LICOR Inc Lincoln NE USA) A
minimum of 6 plants was used in each harvest when destructive measurements were
possible Yellowed and brown leaves were not measured
Full spectrum measurements on leaf level
Reflectance and transmittance of the full spectrum between 380nm-1100nm of
individual leaves of tomato and sweet pepper plants were measured with the use of
InstaSpec IV CCD spectrometer (Oriel Stradford CT USA) and LiCor 1800-12
(LICOR Inc Lincoln NE USA) integrating Sphere equipment The measurements
were performed on young and old leaves in a non- destructive way Eight leaves per
category were measured for each plant The measurements were repeated after two
weeks on the same leaves in order to investigate the spectral differences in time as
well as in canopy depth Data were then used to calculate the crop extinction
coefficient
k= kblradic (1-σ) Eqn 314
Where kbl (084) is the extinction coefficient for a crop with spherical leaf elevation
angle distribution when the crop is composed of black leaves and σ is the scattering
coefficient The wavelength dependent scattering coefficient σ equals the sum of
reflection and transmission and was derived from the spectrometer measurements per
wavelength at the leaf level Consequently Eqn 314 scales up this leaf property to
crop level The above methods were derived from and elaborated upon in detail by
Goudriaan and Van Laar (1994) The k values calculated from Eqn 314 where then
compared with the k-values derived from Eqn 313
Vegetation Indices (VIs)
Normal Difference Vegetation Index (NDVI) was calculated from the available
reflectance data NDVI was calculated as (Wang et al 2005)
Chapter 31 Crop reflectance for monitoring LAI and PAR interception
69
NDVI= (R660-R810)(R660+R810) Eqn 315
where R660 and R810 is the reflectance at 660nm and 810nm respectively NDVI
was tested against single wavelength reflectance measurements
Statistical Analysis
For the statistical analysis of the results the GenStat 9th edition software package
was used Regression analysis was applied to the data and linear polynomial and
exponential models were tested in terms of the best fit on the basis of the adjusted R2
and the standardized residuals (plt005)
Results
The natural log of IIo showed a linear relationship with LAI in both tomato and
sweet pepper following the Lambert- Beer law (Eqn 313 Fig 311) The extinction
coefficient derived from these data was 081 for sweet pepper and 068 tomato
Calculation of k from optical properties of individual leaves resulted to a k factor of
08 for sweet pepper and of 07 for tomato respectively (Eqn 314) The higher
extinction coefficient of the sweet pepper crop compared to tomato implies structural
differences between the two species that affect the way incident light is intercepted
Fig 311 Relation between leaf area index and fraction of light intercepted (IIo)
for tomato () and sweet pepper () (1A) The slope of the line represents the
extinction coefficient k Data are from experiment 1-7 for tomato and 8-9 for
sweet pepper
Chapter 31 Crop reflectance for monitoring LAI and PAR interception
70
Single tomato leaves have higher reflectance (61) than sweet pepper (18) for
PAR (400 nm to 700 nm) (Fig 312A and 312B) The difference is especially high
between 510 nm and 660 nm (average reflectance 74 and 25 for tomato and
sweet pepper respectively) that correspond to the green part of the spectrum and
beginning of the red part (Fig 312A and 312B) Leaf spectrum for tomato and sweet
pepper remains almost constant in the area of five out of eight bands measured (460
610 660 760 and 810 nm) by cropscan for measuring crop reflectance This spectrum
consistency enables the use of wider spectrum bands for the calculation of Vegetation
indices in general and NDVI in particular
0
25
50
75
100
400 500 600 700 800
Wavelength (nm)
Ref
lect
ance
()
0
25
50
75
100
Tran
smitt
ance
()
0
25
50
75
100
400 500 600 700 800
Wavelength (nm)
Ref
lect
ance
()
0
25
50
75
100
Tran
smitt
ance
()
Fig 312 Transmittance (black line) and reflectance (gray line) of individual leaves
of tomato (A) and sweet pepper (B) Data are from experiment 1 and 8
respectively
The relationship of LAI and PAR interception with canopy reflectance was
investigated for six wavebands as well as calculated NDVI (Eqn 315 table 312) on
tomato (Exp 1) and sweet pepper (Exp 8) The exponential regression model had the
best fit for all wavelengths For tomato crop PAR interception correlates well with
reflectance at three different wavelengths (460nm 510nm and 560nm) with a slightly
better fit at 460nm The same was observed for LAI Reflectance at 460nm gave the
best estimation for both LAI and PAR interception also for sweet pepper The use of
NDVI did not improve the estimation of PAR interception and LAI for any of the two
crops
Chapter 31 Crop reflectance for monitoring LAI and PAR interception
71
Table 312 Correlation of PAR interception by the crop and LAI (y-values) with crop
reflectance at different wavelengths and Normal Difference Vegetation Index (NDVI)
(x-values) in tomato and sweet pepper Fitted function was y= a+be-kx The R2 and
Root Mean Square Error (RMSE) are presented No of observations was 35 for
tomato (Exp 1) and 26 for sweet pepper (Exp 8)
Tomato Sweet pepper
Wavelengths PAR
Interception
()
LAI PAR
Interception
()
LAI
R2 RMSE R2 RMSE R2 RMSE R2 RMSE
460 978 455 954 029 966 747 884 036
510 976 474 947 032 95 548 857 039
560 977 470 943 045 946 568 833 042
610 854 118 868 068 809 107 618 064
660 954 663 924 060 886 846 745 054
710 932 801 901 079 649 145 453 077
NDVI 873 11 856 052 894 815 79 049
During plant growth LAI increases resulting in an increase of PAR interception
of the crop A decrease in the amount of reflected light exponentially decreased with
the increase of LAI and PAR interception for both crops (Fig 313) Tomato crop
reflects more when LAI is small (lt05) than sweet pepper
Chapter 31 Crop reflectance for monitoring LAI and PAR interception
72
Fig 313 Correlation of reflectance at 460 nm with PAR interception (A B) and LAI
(C D) for tomato (A C) and sweet pepper plants (B D) in experimental trials
Data points are from experiment 1-4 for tomato and experiment 8 for sweet
pepper
The relationships established from the first trials were then tested for data
gathered from commercial greenhouses The diversity of the cultivation practices of
the greenhouses on which those data were taken was a good test for the robustness of
the relationship of reflectance at 460nm with LAI and PAR interception (Fig 314)
For tomato the fit of the established relationships was good for PAR interception (R2=
952 se=635) and LAI (R2= 894 se=051) For sweet pepper the fitting gave
reasonable results for both PAR interception (R2= 894 se=051) and LAI (R2= 798
se=076)
A
C D
B
Chapter 31 Crop reflectance for monitoring LAI and PAR interception
73
Fig 314 Validation of the relationship between reflectance at 460 nm with PAR
interception and LAI for tomato (Fig 4A and 4C respectively) and sweet pepper
(Fig 4B and 4D respectively) plants in commercial greenhouses The lines are from
Fig 3 Based on experimental greenhouses experiments Data points are from
experiment 5-7 for tomato and experiment 9 for sweet pepper
Discussion
This study explores an accurate way for the online estimation of LAI and PAR
interception of the crop through remote reflectance measurements as well as the
robustness of such a method for tomato and sweet pepper grown in a greenhouse For
that reason six different wavelengths covering an area of the spectrum from blue to
red and NDVI were tested Previous studies performed with field crops showed a
correlation of PAR interception and LAI with reflectance in the RNIR region of the
spectrum (Bouman 1994 Clevers 1997) In our study nevertheless the best
correlation was achieved at 460nm for both tomato and sweet pepper A B
A
B
C
D
Chapter 31 Crop reflectance for monitoring LAI and PAR interception
74
The difference between field application results and the ones reported here can
mainly be explained from the added reflectance inside the greenhouse from the
various metallic parts and especially the white plastic that covers the floor These
special characteristics of the greenhouse production system ask for a new approach on
remote monitoring than the ones already used in the open-field and is proposed in this
study Relationships established in this study were further validated with data from
commercial greenhouses The relationship between reflectance PAR interception and
LAI was best described by an inverse exponential curve similar to the types of curves
used in field experiments of potato (Bouman 1994) and miscanthus (Varga et al
2002) for LAI monitoring In this study the relationships between LAI PAR
interception and crop reflectance were established under diffuse light conditions
Corrections for the bidirectional reflectance can be used for sensor corrections for
saturation problems of the sensor under direct light conditions This method can be
successfully applied to the field for remote sensing techniques In the particular case
of the greenhouse measurements under direct light conditions might be highly
variable by shadows caused by the construction parts of the greenhouse and
reflectance from the glass
Light in plants is highly absorbed in the red and a little less in the blue part of the
spectrum It is expected that reflectance in these particular regions will increase with
the growth as usually more LAI indicates more light interception and less light
reflectance The 460 nm wavelength is located on the blue part of the spectrum partly
explaining the good correlation between the data Reflectance at 460 nm was high
(~65) in an empty greenhouse because of the reflectance of the construction parts
and the white plastic on the floor (data not shown) The difference between crop and
background reflectance makes it easier to monitor changes in the leaf area of the
plant inside the greenhouse Also the lack of differences between plastic sheets in
different stages of wear provide an additional robustness to the estimation method
presented on this paper Finally around 460 nm reflectance hardly changes with the
wavelength diminishing any errors arising from the sensor
After both crops reach a LAI of about 3 and PAR interception of about 90
variation is high and an accurate estimation of LAI and therefore PAR interception
from reflectance is no longer possible This variation is mainly due to the fact that in
the visible region of the spectrum only the reflectance of the upper leaf layers
determines the contribution of the canopy to the total measured reflectance So if LAI
Chapter 31 Crop reflectance for monitoring LAI and PAR interception
75
is higher than 3 not much more light is intercepted and therefore reflectance changes
are no longer perceived When LAI is higher than three 90 of PAR is already
intercepted by the canopy and further LAI increase has only a small impact on PAR
interception In this context an accurate knowledge of LAI in the early developmental
stages is more important than in later stages
Increasing LAI lead to increasing PAR interception and following Lambert- Beer
law The k value calculated for the extinction coefficient for tomato was similar to the
values reported in the literature (Atheron and Rudich 1986) Sweet pepper seems to
have a little higher light interception for the same LAI as tomato which is in
accordance with the fact that it also shows lower reflectance both in leaf and canopy
level than tomato plants For sweet pepper a k factor varying from 06 to 145 have
been reported in the literature (Nederhoff and Vegter 1994) The k factor of 081 that
was calculated from our data is within this range Extinction coefficient is an
important input parameter in most crop models Most models assume that extinction
coefficient is constant and the value used as an input is either calculated by
experimental data or from literature Because the extinction coefficient depends on
canopy structure (for example leaf elevation angle) its value can change with the
growth of the plant With our method of estimating LAI and PAR interception it is
possible to calculate extinction coefficient from the start of the cultivation until the
crop is fully grown
The normalized difference vegetation index (NDVI) is widely used in field
applications for the estimation of LAI NDVI is based on plant physiological
processes and particularly in the difference between leaf absorption of red light and
non- absorbance of the NIR light Despite the wide use of this index in the open fields
(Wang et al 2002 Hoffmann and Blomberg 2004 Elwadie et al 2005) single
waveband at 460nm performed better in our case in estimating PAR interception or
LAI in greenhouse conditions The decreased accuracy of NDVI inside the
greenhouse is probably a result of the added reflectance from the construction parts of
the greenhouse as well as the background cover in all part of the spectrum and
especially the red
Conclusions
Reflectance measurements offer a non- destructive way to estimate PAR
interception and LAI (up to the value of 3) in greenhouse production systems The
Chapter 31 Crop reflectance for monitoring LAI and PAR interception
76
relationship established from the current work between reflectance at 460 nm PAR
interception and LAI for both tomato and sweet pepper can become a good tool for
crop online monitoring in greenhouse conditions Furthermore if information from
reflectance sensors are inputted directly into crop models new opportunities for
decision support in greenhouse production could be opened
Chapter 32
Photochemical reflectance index as a mean of monitoring early photosynthetic stress
Published as
Sarlikioti V Driever SM Marcelis LFM 2010 Photochemical reflectance index
as a mean of monitoring early water stress Annals of Applied Biology 157 81-89
Chapter 32 PRI as a mean of monitoring early photosynthetic stress
79
Abstract
Water stress in plants affects a number of physiological processes such as
photosynthetic rate stomatal conductance as well as the operating efficiency of PSII
and non- photochemical quenching Photochemical Reflectance Index (PRI) is
reported to be sensitive to changes of xanthophyll cycle that occur during stress and
could possibly be used to monitor changes in the parameters mentioned before
Therefore the aim of this study was to evaluate the use of PRI as an early water stress
indicator Water stress treatment was imposed in a greenhouse tomato crop CO2
assimilation stomatal conductance light and dark adapted fluorescence as well as PRI
and relative water content of the rooting medium RWCs where repeatedly
measured The same measurements were also performed on well-irrigated plants that
acted as a reference The experiment was repeated in four consecutive weeks Results
showed a strong correlation between RWCs and photosynthetic rate stomatal
conductance non- photochemical quenching and operating efficiency of PSII but not
with PRI when the whole dataset was considered Nevertheless more detailed analysis
revealed that PRI gave a good correlation when light levels where above 700μmol m-2
s-1 Therefore the use of PRI as a water stress indicator cannot be independent of the
ambient light conditions
Chapter 32 PRI as a mean of monitoring early photosynthetic stress
80
Introduction
Plant water status is an important aspect of crop management in greenhouse
cultivation Water stress affects plants water regulation leading to changes in
physiological processes Thornley and Johnson (1990) noted that water stress often
reduces plant growth by reducing leaf area development and increasing carbohydrate
partitioning to the roots According to Foolad et al (2003) when water stress was
imposed during the reproductive stages of tomato plants its effects on these processes
were found to be dependent on the degree of stress Moderate water stress imposed
just before flowering tended to accelerate flowering and fruit setting but high and
severe water stress retarded flowering and fruit setting and reduced the number of
flowers and fruits set per truss Nowadays production of tomato fruits in greenhouses
is a highly intensive agricultural industry where the cost profit limit is marginal and
efficient use of resources is vital The use of fresh water one of the most important
resources for this industry has been predicted to become more scarce in the future
(Hsiao et al 2007) Improving the efficiency of water use for irrigation is therefore
one of the key challenges for tomato growers Although much progress has been made
on optimizing water supply based on greenhouse climate data (Marcelis et al 2006)
only few methods use direct plant-based physiological indicators to detect the
occurrence of water stress An advantage of a reliable plant-based indicator over
model predictions based on greenhouse climate is that when stress can be detected in
an early stage water supply could be optimized
Water stress may occur when the water supply to the plant is not meeting its
transpiration demands Stomata opening is directly affected by water stress (Cornic
2000 Lawlor and Tezara 2009) When stomata are not sufficiently opened
photosynthetic rate starts to decrease as well as the quantum yield of photosystem II
(Chaves et al 2002) As a result of a decreased rate of CO2 assimilation light energy
absorbed by the leaf cannot be used to drive photosynthetic electron transport and a
part of this energy is dissipated as heat increasing the non-photochemical quenching
(Krause and Weis 1991 Baker and Rosenqvist 2004) Researchers have reported
changes in chlorophyll fluorescence corresponding to water stress (Baker and Ort
1992 Lichtenthaler and Babani 2000) Changes in plant physiological processes due
to water stress have also been linked to changes in plant reflectance in specific
wavelengths (Pinter et al 2003)
Chapter 32 PRI as a mean of monitoring early photosynthetic stress
81
Several studies have attempted to quantify water stress through remote sensing
(Bowman 1989 Pentildeuelas et al 1994) Spectral indices have been used to determine
real-time crop coefficients to improve irrigation scheduling (Bausch 1995) The
relationship between reflectance spectra and leaf water status have been studied in
numerous crop species as well as the possibility of estimating relative leaf water
content by reflectance in the range of the near infrared (Danson et al 1992 Danson
and Aldakheel 2000) Pentildeuelas et al (1993) have found that reflectance at 970 nm can
be a useful water status indicator but only when the stress is already well developed
Reflectance at 1400 and 1900 nm has been shown to correspond directly to water
content in plant tissue (Pentildeuelas et al 1997) as well as physical-based studies in short
wave infrared (1400ndash 2500 nm) (Ceccato et al 2001) Graeff and Claupein (2007)
showed that reflectance in the 510780 540780 4901300 and 5401300 nm wavelength
ranges can also become an indicator of plant water status (the values are for the
combination of two different reflectance filters used in the analysis) However
infrared reflected radiation is greatly affected by plant architecture crop density and
leaf structure thus increasing the uncertainty of estimation (Elachi 1987)
In this paper we define plant water stress as the loss of plant photosynthetic
activity induced by water deprivation The so-called photochemical reflectance index
(PRI = (R531 minus R570) (R531 + R570)) where R531 and R570 are reflectance signals
at 531 and 570 nm respectively has been used to monitor dynamic changes in
photosynthesis in water stressed plants (Evain et al 2004) PRI provides a quick and
non-destructive assessment on photosynthesis related physiological properties of the
leaf and canopy (Pentildeuelas et al 1994 Evain et al 2004 Weng et al 2006) for a wide
range of species (Gamon et al 1997 Guo and Trotter 2004) Changes in absorbance
and reflectance values around 531ndash535 nm as a result of nutrient stress have been
related to ΔpH-mediated chloroplast shrinkage and to changes in the aggregation state
of antenna pigmentndashprotein complexes mediated by an accumulation of de-epoxidized
forms of the xanthophyll cycle molecules (Morales et al 1990 Ruban et al
1993)Since we defined water stress as the loss of plant photosynthetic activity
induced by water deprivation it comes to reason that PRI could be used for water
stress monitoring The epoxidation and de-epoxidation of the xanthophyll cycle is also
strongly related to the light environment (Adams et al 1992 Lawlor and Tezara
2009) Although its applicability in detecting plant water stress has been tested in
crops grown under conditions of severe stress it is yet to be tested for early stages of
Chapter 32 PRI as a mean of monitoring early photosynthetic stress
82
water deprivation Therefore the aim of this paper is to evaluate PRI as an indicator of
early water stress
Materials and methods
Plant materials and water stress imposition
Tomato plants (Solanum lycopersicon cv Aranca) were grown on rockwool slabs
(at field capacity contains 80 solution 15 air pore space and 5 rockwool fibers)
in a glasshouse in Bleiswijk the Netherlands (52o 1rsquoN) Two week old plants were
planted on the rockwool slabs with three plants per slab on 16 June After plants
reached a height of 18m (17 July) measurements commenced Each plant was
irrigated by one dripper Plants were watered automatically (water flow 45 lh) with a
nutrient solution [major nutrients K 80 Ca 100 Mg 45 NO3 230 SO4 68 H2PO4
125 (mM) minor elements Fe 25 Mn 7 Zn 7 B 50 Cu 07 Mo 05 (microM)] with a
pH 55 and an EC of 4 mscm At the start of each experiment stress treatment was
applied by withholding water through removal of drippers from a rockwool slab with
three plants (hereafter referred to as stressed plants) Leaf measurements on these
three stressed plants and three normally irrigated plants (hereafter referred to as
reference plants) were performed on the first young fully developed leaf in full
exposure to the sun for three consecutive days after the dripper removal The
experiment was repeated in four consecutive weeks In each repetition drought stress
treatment was applied on a different slab with three new stressed plants and a different
slab was used as reference plants Measurements were performed every day in all
plants of each treatment Each day measurements were taken every half hour or every
hour from 900 till 1500
Growth conditions
Incident light at leaf level was measured every 5 minutes by LI-190 quantum
sensors (Licor Inc Lincoln NE USA) positioned at the same height as the
measured leaf The relative water content (RWCs) in the rooting medium (rockwool
slab) was monitored by WET sensors (Delta-T UK) positioned vertically in the slab
Five WET sensors per slab were used both in reference and stress treatment
Inside greenhouse temperature as well as the vapour pressure deficit (VPD) where
also monitored every 5 min during the experiment (table 321)
Chapter 32 PRI as a mean of monitoring early photosynthetic stress
83
Table 321 Climate conditions in the greenhouse Average values plusmnse of incident
PAR the inside greenhouse temperature (Tairin) and VPD are presented for each
repetition The repetitions were performed in 4 consecutive weeks Each repetition
lasted 3 days
Repetition Day PAR
(μmol m-2 s-1)
Tairin
(Co)
VPD
(kPa)
Rep 1
1 2221 plusmn4179 224 plusmn05 034 plusmn017
2 3486 plusmn455 224 plusmn05 054 plusmn02
3 12882 plusmn1669 212 plusmn012 027 plusmn003
Rep 2
1 7641 plusmn1933 215 plusmn003 114 plusmn008
2 5663 plusmn2866 215 plusmn004 007 plusmn004
3 6525 plusmn2801 235 plusmn003 009 plusmn017
Rep 3
1 5566 plusmn2696 259 plusmn006 01 plusmn005
2 6096 plusmn3341 259 plusmn008 008 plusmn002
3 1996 plusmn3782 256 plusmn009 023 plusmn011
Rep 4
1 4246 plusmn5757 199 plusmn004 011 plusmn020
2 4088 plusmn8597 199 plusmn004 024 plusmn030
3 2211 plusmn2973 205 plusmn054 026 plusmn029
PRI
The photochemical reflectance index of a leaf was measured by a PlantPen PRI
200 instrument (Photon Systems Instruments Ltd Czech Republic) The PlantPen was
clipped to a lateral leaflet Light from an internal dual wavelength light source at 531
and 570 nm was emitted to the leaf and reflectance was measured through a PIN
photodiode with a 500 to 600 nm bandpass filter Data of reflectance at 531 and 570
nm as well as the calculated PRI value was collected Measurements were taken every
half hour from three plants from the stress treatment and three reference plants The
instrument measures an area of 05 cm2 The average of eight measurements from
randomly chosen positions on each selected leaf were taken for a representative
measurement of PRI
Chapter 32 PRI as a mean of monitoring early photosynthetic stress
84
CO2 assimilation rate
The CO2 assimilation rate was measured every half hour with the use of a portable
open gas exchange measurement equipment (LCpro+ ADC UK) The lateral leaflet
of the chosen leaf was clamped in the chamber (625 cm2 leaf area) The measurement
conditions were 800 ppm CO2 and 700 μmol m-2 s-1 PAR with a vapour pressure
deficit (VPD) of 635 kPa Vapour pressure deficit and CO2 concentrations were
similar to those in the greenhouse environment The light intensity given was the
average value of ambient irradiance on a sunny day Constant light was used in the
measurement to ensure that light intensity was sufficiently high and allowed
comparison between treatments Measurements were taken every minute for 12
minutes and CO2 assimilation rate was then calculated as the average of the last three
measured rates (ie the measurements at 10 11 and 12 minutes) The period of the 12
minutes was previously determined as the time needed for stabilization of stomatal
conductance and CO2 assimilation rate
Stomatal conductance
Stomatal conductance of a leaf was measured with an AP4 porometer (Delta-T
UK) The set relative humidity was the same as the greenhouse condition The
porometer was calibrated every 3 hours or when changes in environmental conditions
in the greenhouse prevented accurate measurements (temperature difference plusmn2oC
from calibration temperature) Stomatal conductance was measured every half an
hour Three measurements per leaf from three plants per treatment were taken to
obtain a representative measurement
Chlorophyll Fluorescence
Chlorophyll fluorescence parameters were measured every hour with a Dual-PAM-
100 (Heinz Walz GmpH Germany) A leaflet was clamped into the optical unit and
was continuously illuminated with white actinic light at an irradiance of 700 μmol m-2
s-1 (same level as for CO2 assimilation measurements) The steady-state fluorescence
(Fprime) was recorded after 6 minutes before a saturation pulse was imposed to the leaf in
order to determine the maximal fluorescence level in the light adapted state (Fprimem) The
leaf was then darkened for 25 min thereafter minimal fluorescence (Fo) was
measured During dark adaptation the modulated measuring light was sufficiently
low (lt01 μmol m-2 s-1) not to induce any significantly variable fluorescence
Chapter 32 PRI as a mean of monitoring early photosynthetic stress
85
Maximal fluorescence (Fm) was measured after saturating light was applied for 08s at
3000 μmol m-2 s-1 to the already dark adapted leaf These measurements were used to
calculate the operating efficiency of PSII (FqprimeFprimem = (Fprimem- Fprime)Fprimem) the maximum
quantum efficiency of PSII (FvFm) as a relative measure of the maximum quantum
yield of PSII primary photochemistry (Bjoumlrkman and Demmig 1987) and the non-
photochemical quenching (NPQ calculated as (FmFprimem) minus 1) (Bilger and Bjoumlrkman
1990 Baker 2008)
Statistical analysis
The data were analysed with Genstat 11 software Regression analysis using linear
and polynomial models were used to assess the relationship between RWCs and the
other response variables The significance of model terms was tested using the F-test
at the p = 005 level of significance The goodness of fit of models was considered
using the adjusted (for the number of model terms) R2
Results
Environmental conditions in general and incident light intensity in particular varied
greatly between repetitions (weeks) days of a week and during the course of a day
during the experiment The inside temperature varied as a day average from 20oC to
26oC while VPD fluctuated from 007 to 114 kPa (table 321)
Water stress was induced gradually in tomato plants by withholding water (Fig
321A) Although the way of withholding water was identical for all repetitions the
rate at which the relative water content of the rockwool slab (RWCs) decreased
differed The final RWCs that was reached at the end of each repetition varied from
23 to 75 This variation was due to variable transpiration as a result of the
variation in climatic conditions Light levels varied on average from 1288 μmol m-2 s-
1 to 7641 μmol m-2 s-1(Table 1) Withholding water reduced CO2 assimilation by up to
52 while stomatal conductance was reduced by up to 70 CO2 assimilation (Fig
321A) as well as stomatal conductance (Fig 321B) showed a high and positive
correlation with RWCs
The operating efficiency of the PSII (FprimeqFprimem) was decreased up to 20 (the
percentage is expressing the maximum difference between the lowest (045) and the
maximum value (0525 - 057)) in response to lowered RWCs for all repetitions
Chapter 32 PRI as a mean of monitoring early photosynthetic stress
86
(Fig 321C) while NPQ increased considerably with the decrease of RWCs (Fig
321D) with an increase in the range of 100-216 for the different repetitions
Fig 321 Correlation of CO2 assimilation (se of intercept= 847 of B1= 026 and
B2= 0001 R2= 079 s2= 549 with 10 df) Stomatal conductance (se of
intercept= 24088 of B1= 71 and B2= 0049 R2= 086 s2= 26919 with 9 df)
Quantum yield of PSII efficiency (Fm- F) Fm) (se of intercept= 124 and of
B= 000104 R2= 071 s2= 361 with 8 df) and NPQ (se of intercept= 00826
of B1= and B2= R2= 068 s2= 553 with 11 df) with relative water content of
the rooting medium Data points represent daily averages (n=12 for CO2
assimilation and stomatal conductance n=6 for (Fm- F) Fm and NPQ) Closed
symbols (diams) represent values of plants with imposed water stress and open
symbols represent (loz) control plants Vertical bars indicate standard error of
mean
Chapter 32 PRI as a mean of monitoring early photosynthetic stress
87
Although all chlorophyll fluorescence parameters mentioned above showed a
direct response to reduction of water availability this response was not clearly
observed for PRI (Fig 322) PRI gradually decreased with RWCs
Fig 322 Correlation between PRI and slab relative water content (se of intercept=
00037 and of B1= 5 10-5 R2= 061 s2179 with 10 df) t PRI values correspond
to daily averages (n=12) Closed symbols (diams) represent values of plants with
imposed water stress and open symbols represent (loz) control plants Vertical bars
indicate standard error of mean
Previous studies show that PRI is sensitive to changes in light intensity To
investigate the relationship between RWCs and PRI in relation to light intensity the
data were divided into four different categories on the basis of the occurring light
levels during the repetitions These levels were i 0-299 μmol m-2 s-1 ii 300-499
μmol m-2 s-1 iii 500-699 μmol m-2 s-1 and iv 700-850 μmol m-2 s-1 PRI showed no
statistical relationship with RWCs for light intensities from 0-699 μmol m-2 s-1 (Fig
323A-323C) Nevertheless when radiation was above 700 μmol m-2 s-1 PRI showed
a good correlation with RWCs (R2= 083 plt 001) (Fig 323D) In this category
PRI decreased as much as 35
Chapter 32 PRI as a mean of monitoring early photosynthetic stress
88
Fig 323 Correlation of PRI and slab relative water content for light intensities
varying from 0-299 μmol m-2 s-1 300- 499μmol m-2 s-1 500-699 μmol m-2 s-1 and
700-850 μmol m-2 s-1 (se of intercept= 0015 of B1= 5210-4 and B2= 4110-6
R2= 080 s2= 29810-5 with 12 df) Data points represent half-hour
measurements
For light levels above 700 μmol m2 s-1 PRI showed a statistically significant
correlation with CO2 assimilation (R2= 066 plt001) stomatal conductance (R2=
063 plt 001) the operating efficiency of PSII (R2= 07 plt 001) and NPQ (R2=
069 plt 001) (Fig 324) This correlation was not observed in lower light levels
Chapter 32 PRI as a mean of monitoring early photosynthetic stress
89
Fig 324 Correlation of CO2 assimilation (se of intercept=615 and of B=549 R2=
068 s2= 842 with 14 df) Stomatal conductance (se of intercept=13533 and of
B=12079 R2= 066s2= 40795 with 14 df) Quantum yield of PSII efficiency
(Fm- F) Fm) (se of intercept= 081 of B1= 1445 and B2= 6333 R2= 071 s2=
000155 with 6 df) and NPQ (se of intercept= 445 of B1= 7923 and B2= 347
R2= 068 s2= 0046 with 6 df) with PRI for light intensities of 700-850 μmol m-
2 s-1 Data points represent half-hour measurements for CO2 assimilation and
stomatal conductance and hour measurements for (Fm- F) Fm and NPQ)
Discussion
The objective of this study was to evaluate PRI as a method for early detection of
water stress in a greenhouse tomato crop
The RWCs is a factor regularly used in literature for indication of water stress
imposed on plants In the current study it was shown that when RWCs decreased
plant physiological processes are affected More analytically a reduced RWCs
results in stomatal closure diminishing of the photosynthetic rate and quantum yield
as well as the increase of NPQ These results are in accordance with the observations
of Flexas and Medrano (2002) According to Cornic (2000) the stomatal closure is the
Chapter 32 PRI as a mean of monitoring early photosynthetic stress
90
primary cause of the reduction of photosynthesis under mild water stress and is also
dependent on the environmental conditions during drought (Schulze and Hall 1982)
and the velocity of the drought imposition (Flexas et al 1999) A significant
correlation between CO2 assimilation and stomatal conductance was found in the
currently presented experiment The development of water stress differed between
repetitions and was directly linked to changes in light
Chlorophyll fluorescence parameters have been reported to be sensitive to the plant
water status and plant stress in general (Lichtenthaler and Babani 2000 Baker and
Rosenqvist 2004) Increase of water stress generally decreases the FprimeqFprimem In order to
protect the photosystems from oxidation excess energy is dissipated as heat resulting
in a substantial increase of NPQ (Baker 2008) In the currently presented study NPQ
increased with decreasing RWCs which indicated its sensitivity to plant water stress
The decrease of quantum yield found here was similar to decreases observed by Evain
et al (2004) In stressed conditions excess energy on photosystems is dissipated as
heat from secondary pigments as the xanthophylls in order to protect the
photosystems from damage When fluorescence parameters are changed changes
should also be observed in PRI Sun et al (2007) and Penuẽla et al (1994) reported a
decrease in PRI with time of water withholding Also Suarez et al (2009) reported an
indirect relationship between PRI and water stress through a correlation of PRI with
canopy temperature Contrary to the aforementioned papers a direct effect of water
stress on PRI was not observed in the current study unless light levels were above
700 μmol m-2 s-1
When plants are exposed to abiotic and biotic stresses in the light decreases in
FvFm are frequently observed Zarco-Tejada et al(2000) observed a diurnal pattern in
FvFm Its value decreased during the middle of the day In most studies (Gamon et al
1997 Flexas and Medrano 2002) dark adapted fluorescence parameters are
measured under pre-dawn conditions and assumed to be steady for the rest of the day
Measurements done in the currently presented study showed variability in the dark
adapted maximal PSII efficiency (FvFm) during the day In early morning FvFm was
equal to 082 and decreased up to 10 by 1300 A similar reduction on FvFm values
during the day was also reported by Sobrado (2008) This indicates that the common
practice of measuring FvFm only in predawn conditions in stress experiments is not
representative for the variability of FvFm during the day and hence not suitable for
Chapter 32 PRI as a mean of monitoring early photosynthetic stress
91
calculation of parameters using either dark adapted Fm or Fo which could lead to
errors of estimation
When a plant is under stressed conditions non-photochemical quenching is
increased In the currently described experiment NPQ increased as the stress
progressed indicating a loss of energy from the photosytems as heat (Baker 2008) It
is well established that xanthophyll cycle contributes essentially to the dissipation of
the excess excitation energy in the PSII antenna under stressed plant conditions (Jahns
et al 2009) The increase in NPQ was more pronounced in days with high light levels
(gt700μmol m-2 s-1) indicating that the RWCs plays a synergetic role to light
(photoinhibition) affecting photosynthesis and stomatal conductance Water stress is
often indiscernible from photoinhibition in plants Lu and Zhang (1998) reported that
the extent of photoinhibition became more pronounced when the stress progressed
Similar synergistic effects of water and light stress on the photochemistry of the plants
are reported in the literature (Masojidek et al 1991 Giardi et al 1996 Genty et al
1987 Jefferies 1994) Many authors indeed argue that the degree of the damage to the
photosynthetic properties of the plant by water stress can be amplified by high
irradiancies (Powles 1984 Bjoumlrkman and Powles 1983)
Gamon et al (1990) as well as Ruban et al (1993) showed that PRI corresponds to
fast changes of incident light PRI is connected with the de-epoxidation state of the
xanthophylls in the photosynthetic cycle The xanthophyll cycle role is mainly to
protect the photosystem from damage under stress conditions Therefore the
xanthophyll pool and the epoxidation state of the xanthophyll are also sensitive to the
incident light on the leaf level (Maxwell et al 1994 Schindler and Lichtenthaler
1994) The de- epoxidation cycle starts only when light absorbed by chlorophyll
reaches excessive levels In the Mediterranean region where the light is in abundance
especially in summer period PRI was used to track successfully the crop water status
Gamon et al (1997) reported that PRI correlated well with light use efficiency only
under high light conditions (PPFDlt500μmol m-2 s-1) On the other hand Sims et al
(2006) did not observe a direct correlation between PRI and LUE during the day In
our experiment we showed that PRI is strongly correlating with RWCs only when
PPFD became higher than 700μmol m-2 s-1 indicating that light is of prime
importance when it comes to PRI As Barton and North (2001) showed with a model
PRI is not only dependent on light levels but on plant structure (Suarez et al 2008)
plant optical properties and sun position as well This assumption was confirmed also
Chapter 32 PRI as a mean of monitoring early photosynthetic stress
92
by Peguero-Pina (2008) who indicated that early day measurements of PRI when the
sun is still low do not correlate well with fluorescence as expected Since sun position
plays a role on PRI changes it comes to reason that greenhouse structure prohibits the
correct PRI functioning at certain hours of day Diversion between our data and the
published work at PRI can also be attributed to changes in latitude and consequently
to solar angle
Conclusions
In this paper it was shown that PRI can be used as an early water stress indicator
only when light intensity at crop level is above 700 μmol m-2 s-1 At lower values of
light intensity the relationship of PRI to RWCs was poor in comparison to
photosynthesis or fluorescence parameters that showed a high correlation to RWCs
For that reason we can conclude that PRI as water stress indicator cannot be
independent of the ambient light conditions and its use can make sense only under
conditions of high light
Chapter 4
General discussion
Chapter 4 General Discussion
96
The aim of this thesis was to explore different techniques to simulate and monitor
light interception and photosynthesis by a greenhouse grown tomato canopy For that
purpose a three dimensional model for accurate light interception and photosynthesis
was developed and different methodologies to monitor online these physiological
properties by means of remote sensing were explored In this chapter the advantages
of these approaches in the broader scientific field are discussed as well as their
shortcomings and how these can be surmounted
Modelling light interception and photosynthesis
Modelling light interception and photosynthesis are basic to plant modelling Both
these parameters are highly affected by plant architecture Light absorption is
dependent on both the optical properties of the leaf as well as the leaf position with
respect to the incoming light The importance of leaf position for light absorption is
such that an accurate representation of canopy structure in space is necessary for
correct light absorption simulations This need has been addressed recently by adding
one more dimension in plant modelling (Vos et al 2010)
Adding a dimension in plant modelling involves a number of tedious
measurements of plant architecture that are time consuming Even when the third
dimension is added to the model assumptions are introduced in order to simplify the
structure Leaf positioning towards the incoming light is dependent on the elevation
angle (angle of the single leaf to the horizontal) A common assumption in 3D
modelling however involves the use of an elevation angle distribution on the entire
canopy rather than attribute a specific elevation angle to the leaves that is dependent
on each age and relative rank in the canopy In this thesis (Chapter 22) we showed
clearly that an explicitly described leaf elevation angle distribution can improve
modelling accuracy up to 8 in light absorption in comparison to the ellipsoidal
distribution that is the normal approach of most models (Farque et al 2001)
The importance of a three- dimensional model is not confined to an accurate
simulation output but it can also improve our understanding of the impact of the
chosen experimental approaches on the acquired data In this thesis (Chapter 22) we
used the model to investigate the vertical light distribution inside a double row
canopy The results showed that leaves positioned towards the path absorbed more
light per unit leaf area than leaves positioned towards the middle of the plant row
This difference is important in the context of the common experimental approach to
Chapter 4 General Discussion
97
measure leaf photosynthesis only on leaves facing the path and not in the middle of
the plant row This approach can lead to serious errors of estimation if these data are
used for an estimation of canopy photosynthesis or the calibration of a plant model
The evaluation of experimental techniques through 3D modelling is starting to be
explored in the field since the addition of one more dimension can help improve the
microclimate simulation around different plant organs (Sinoquet et al 2005)
The general characteristics of plant architecture are defined by the plant genotype
Allowing for the environmental plasticity of the structure an ideotype structure can be
identified for each plant grown under certain environmental conditions The idea of a
plant ideotype is hardly new (Donald 1965) but the use of 3D models in exploring
plant phenotypes can prove a very important tool in plant breeding by cutting the time
and costs needed on the traditional approach A plant structure as any architectural
structure is a synthesis of a number of smaller components whose unique topology
and geometry can have a direct effect on light absorption and photosynthesis In the
thesis (Chapter 23) we identified as the main components of tomato architectural
structure the leaf elevation angle phyllotactic angle leaflet angle leaf length to width
ratio leaflet arrangement and internode length Then we proceeded to quantify the
effect of the change of each of these components both on light absorption and
photosynthesis From our analysis we found that the highest impact had the leaf
lengthwidth ratio and internode length depending on the light conditions From the
study we conclude that a more spatial arrangement of architectural components
increased both light absorption and photosynthesis Based on this result we proposed
two types of plant ideotypes for the particular conditions that both aimed at a more
spatial arrangement The model predicted a possible increase of photosynthesis of up
to 10 Highly interesting was the exploration of the effect of the vertical light
absorption profiles on photosynthesis for summer and winter Simulation data
presented in Chapter 23 showed that during summer higher photosynthesis was
expected when more light was absorbed from the lower leaves of the canopy while the
opposite was observed for the winter period This was caused by both overall light
intensity as well as the different light angle fot the different seasons Therefore it
becomes apparent that the vertical light distribution should not be ignored and that
total light interception alone is not enough for simulating photosynthesis
In the two dimensional models plant structure is approached by using the
extinction coefficient (k) as it is defined by Lambert-Beer law Although this factor is
Chapter 4 General Discussion
98
a good approximation it fails to explore the effect of the variations in vertical light
distributions As we showed in this thesis (Chapter 21) the extinction coefficient
changes not only with canopy depth but also with the increase of the row spacing
Therefore a single coefficient cannot be used for one crop or different cultivation
practises
In this thesis we used a static approach in modelling plant structure The choice to
use a static structure was based on the Dutch cultivation system that results in a
uniform plant structure throughout the seasons Nevertheless the model does not take
into account the daily changes of plant structure For example plants tend to rearrange
their structure during the day as well as during the growing season These dynamic
adaptations of plant structure should be taken into account in the model since they are
part of the plant strategy for optimum growth Some possible effects of the dynamic
leaf adaptation during the day are for example under low light conditions an
increasing photosynthetic production or under high light conditions avoiding photo
inhibition Studies have reported leaf movement during the day (Kao and Forseth
1992) These phenomena are quite important for our understanding of plant
interactions with their environment and should therefore be taken into account also in
a modelling approach especially if we use this type of modelling for proposing
possible optimum genotypes for particular environments
Online crop monitoring
Monitoring leaf area index and light interception
Leaf area index as well as light interception is an important component of plant
modelling Experimental methods to measure light interception are usually time
consuming and can only take a snapshot in a certain time period and therefore miss
the dynamics of this component Leaf area index is usually estimated using distractive
measurements which are not always possible to do and they limit the number of
samples being processed In order to avoid these pitfalls an effort has been made to
develop online non- destructive methods Remote sensing that monitors the light that
is reflected from the crop canopy has successfully been applied in the field (Clevers
1997 Gitelson et al 2002) Nevertheless this approach poses special challenges
inside the greenhouse environment as we have to take into account the interference of
scattering light from the construction parts of the greenhouse as well as reflectance
coming from the white plastic covering the soil (Chapter 31) Although it is not
Chapter 4 General Discussion
99
possible to directly apply these methodologies from the field in this thesis we showed
that we can develop new ones that can succesfully measure LAI and light interception
in the greenhouse environment
In field crops it is customary to monitor LAI by using a normalized index based
on the red area of the spectrum ie Normalized Difference Vegetation Index (NDVI)
(Wang et al 2005) The rationale behind using an index based on the red part of the
spectrum is based on the fact that light emitted in this part of the spectrum has a
strong link with structural and physiological processes of the plant In this thesis we
showed that this index cannot be used under greenhouse conditions and that
reflectance in the blue part of the spectrum gives a much better correlation with both
LAI and light interception On the contrary reflectance around 460nm showed a good
correlation with both LAI and light interception in different environments and in
several plant species An application of this findings in a permanent sensor that was
positioned on the top of the greenhouse and took reflectance measurements at 460nm
in real time gave also a good correlation between light interception and reflectance
(Janssen et al 2006) This differentiation between our result and what is usually
applied in the field can have a number of explanations One reason could be the
resolution of the sensor used in this experiment as the broad bands in which
reflectance was measured could miss the subtle changes in the reflectance both during
the day and during the season A sensor with higher resolution could address this
problem Another reason could be the background light scattering in the greenhouse is
so strong that is impossible to monitor reflectance changes in the red part of the
region
Monitoring photosynthetic stress
The ability to monitor photosynthetic activity is important not only for model
parameterisation but also for a dynamic assessment of plant status During the
cultivation period climatic stress parameters such as high light conditions or water
deprivation can cause a decrease in plant photosynthetic efficiency Different non-
destructive methods have been explored in recent years in order to monitor plant
stress for example canopy reflectance (Evain et al 2004) infrared cameras (Langton
et al 2002) fluorescence meters (Rosema et al 1998) pressure probes
(Zimmermann et al 2008) sap flow sensors (de Swaef and Steppe 2010) emitted
plant volatiles (Janssen et al 2009) In this thesis we studied the use of the
Chapter 4 General Discussion
100
photochemical reflectance index (PRI) as photosynthetic stress indicator The
photosynthetic stress was induced by applying water stress on the plants The results
of our experiment were positive under high light conditions where the stress effect
from the water deprivation was enhanced by photoinhibition The results from our
experiments showed that PRI can be used as an indicator of photosynthetic stress in
places where high light conditions occur it could be a useful tool in arid areas with
ubiquitous high irradiance levels however on a regular base its use has a limited
applicability for the relatively short summer period in the Netherlands
PRI uses wavelengths that have been related to the de-epoxidation of
xanthophylls During this process it was found that light is emitted from 500-545nm
The wavelength of 531nm used by PRI is linked with the fast-changes of the
xanthophyll cycle and possible is not the best measure for gradual changes of the
photosynthetic status A few studies have stated that instead of using 531nm a PRI
calculation based on spectra from 521-550nm (Gamon et al 1997 Wu et al 2008)
would give a better correlation with photosynthetic efficiency in some species This
shift in wavelength can be caused by the leaf morphology and the optical properties
(Noomen et al 2006)
Possibilities for further research
In this thesis we presented the advantages of a three-dimensional model approach
as well as the applicability of canopy reflectance as a tool for monitoring non-
destructively the leaf area index light interception and photosynthetic stress in the
plant canopy Based on the results of this thesis further steps to improve this work
and forward the research would include
bull Incorporate a dynamic component in plant architecture so as plant
development can be taken into account As discussed plant structure can
show high plasticity depending on the environmental conditions Functions
that predict plant palsticity would be helpful in our understanding of the
plant adapatation on its environment Such a dynamic adaptive model
could also prove a useful tool for investigating the performance of a
number of phenotypes in different environments for a whole cultivation
season without having to resort to expensive and time consuming
experimental methods
Chapter 4 General Discussion
101
bull In this thesis we measured PRI only in two specific wavelength However
as it was mentioned earlier in the discussion the wavelengths we used to
calculate PRI monitor only the fast kinetic changes of the xanthophylls
while the leaf morphology and the possible effect of the epidermis is not
taken into account Therefore the improvement of PRI efficiency should
be investigated in relation to the wavelengths related to the slow kinetics
of the xanthophyll cycle as well as determine the role of the leaf
morphology
bull Finally the model should be coupled to the monitoring sensors This online
feedback of the model in real time would be a powerful tool to improve the
model accuracy and also boost the efficiency of decision support systems
which in turn will enable the better management of the crop in terms of
yield and quality
References
103
References
Adams WWIII Volk M Hoehn A Demmig- Adams B 1992 Leaf orientation
and the response of the xanthophyll cycle to incident light Oecologia 90 404ndash
410
Atherton JG Rudich J 1986 The tomato crop a scientific basis for improvement
Chapman and Hall London
Baker NR Ort DR 1992 Light and crop photosynthetic performance In Crop
Photosynthesis Spatial and Temporal Determinants pp 289-312 London
Elsevier Science Publishers BV
Baker NR Rosenqvist E 2004 Applications of chlorophyll fluorescence can
improve crop production strategies an examination of future possibilities Journal
of Experimental Botany 55 1607ndash1621
Baker NR 2008 Chlorophyll Fluorescence A Probe of Photosynthesis In Vivo
Annual Review of Plant Biology 59 89ndash113
Baldocchi DD Finnigan JJ Wilson KW Paw KT Falge E 2000 On
measuring net ecosystem carbon exchange in complex terrain over tall vegetation
Boundary Layer Meteorology 96 257-291
Bartheacuteleacutemy D Caraglio Y 2007 Plant architecture a dynamic multilevel and
comprehensive approach to plant form structure and ontogeny Annals of Botany
99 375-407
Barton CVM North PRJ 2001 Remote sensing light use efficiency using the
photochemical reflectance index Remote sensing of Environment 78 264ndash273
Bausch WC 1995 Remote sensing of crop coefficients for improving the irrigation
scheduling of corn Agricultural Water Management 27 55ndash68
Bilger W Bjoumlrkman O 1990 Role of the xanthophylls cycle in photoprotection
elucidated by measurements of light-induced absorbance changes fluorescence
and photosynthesis in Hedera canariensis Photosynthetic Research 25 173ndash85
Bjoumlrkman O Powles B 1984 Inhibition of photosynthetic reactions under water
stress interaction with light level Planta 161 490-504
Bjoumlrkman O Demmig B 1987 Photon yield of O2 evolution and chlorophyll
fluorescence characteristics at 77 K among vascular plants of diverse origins
Planta 170 489ndash504
References
104
Boonen C Samson R Janssens K Pien H Lemeur R Berckmans D 2002
Scaling the spatial distribution of photosynthesis from leaf to canopy in a plant
growth chamber Ecological Modelling 156 201-212
Boote KJ Scholberg JMS 2006 Developing parameterizing and testing of
dynamic crop growth models for horticultural crops Acta Horticulturae 71823-
34
Borger CPD Hashem A Pathan S 2010 Manipulating Crop Row Orientation to
Suppress Weeds and Increase Crop Yield Weed Science 58 174-178
Bouman BAM Uenk D Haverkort AJ 1992 The estimation of ground cover of
potato by reflectance measurements Potato research 35 111- 125
Bouman BAM 1994 A framework to deal with uncertainty in soil and management
parameters in crop yield stimulation A case study in rice Agricultural systems
46 1- 17
Bowman WD 1989 The relationship between leaf water status gas exchange and
spectral reflectance in cotton leaves Remote Sensing of Environment 30 49ndash
255
Brites D Valladares F 2005 Implications of opposite phyllotaxis for light
interception efficiency of Mediterranean woody plants Trees 19 671-679
Buck-Sorlin G de Visser PHB Henke M Sarlikioti V van der Heijden
GWAM Marcelis LFM Vos J 2011 Towards a functional-structural plant
model of cut-rose - simulation of light environment light absorption
photosynthesis and interferences with the plant structure Annals of Botany in
press
Casella E Sinoquet H 2007 Botanical determinants of foliage clumping and light
interception in two-year-old coppice poplar canopies assessment from 3-D plant
mock-ups Annals of Forest Science 64 395- 404
Ceccato P Flasse S Tarantola S Jacquemoud S Gregoire J-M 2001
Detecting vegetation leaf water content using reflectance in the optical domain
Remote Sensing of Environment 77 22ndash33
Chaves MM Pereira JS Maroco J Rodrigues ML Ricardo CPP Osoacuterio
ML Carvalho I Faria T Pinheiro C 2002 How Plants Cope with Water
Stress in the Field Photosynthesis and Growth Annals of Botany 89 907ndash916
Chelle M Andrieu B 1998 The nested radiosity model for the distribution of light
within plant canopies Ecological Modelling 111 75-91
References
105
Chelle M 2005 Phylloclimate or the climate perceived by individual plant organs
What is it How to model it What for New Phytologist 166 781-90
Chen JM Pavlic G Brown L Cihlar J Leblanc SG White HP Hall RJ
Peddle D King DJ Trofymow JA Swift E Van der Sanden J Pellikka P
2002 Validation of Canada-wide leaf area index maps using ground
measurements and high and moderate resolution satellite imagery Remote
Sensing of Enviroment 80 165-184
Clevers JGPW 1997 A simplified approach for yield prediction of sugar beet
based on optical remote sensing data Remote Sensing of Environment 61 221-
228
Cornic G Briantais JM 1991 Portioning of photosynthetic electron flow between
CO2 and O2 reduction in C3 leaf (Phaseolus vulgaris L) at different CO2
concentrantions and during drought stress Planta 183 178ndash184
Cornic G 2000 Drought stress inhibits photosynthesis by decreasing stomatal
aperture- not by affecting ATP synthesis Trends in Plant Science 5 187ndash188
Cournegravede PH Mathieu A Houllier F Bartheacuteleacutemy D de Reffye P 2008
Computing competition for light in the GREENLAB model of plant growth a
contribution to the study of the effects of density on resource acquisition and
architectural development Annals of Botany 101 1207ndash1219
Danson FM Steven MD Malthus TJ Clark JA 1992 High-spectral
resolution data for determining leaf water content International Journal of Remote
Sensing 13 461ndash470
Danson FM Aldakheel YY 2000 Diurnal water stress in sugar beet spectral
reflectance measurements and modeling Agronomie 20 31ndash39
Dauzat J Clouvel P Luquet D Martin P 2008 Using virtual plants to analyse
the light-foraging efficiency of a low-density cotton crop Annals of Botany 101
1153ndash1166
De Castro F Fetcher N 1999 The effect of leaf clustering in the interception of
light in vegetal canopies theoretical considerations Ecological Modelling 116
125-134
de Swaef T Steppe K 2010 Linking stem diameter variations to sap flow turgor
and water potential in tomato Functional Plant Biology 37 429ndash438
Donald CM 1965 The breeding of crop ideotypes Euphytica 17 385-403
References
106
Dong QX Wang XL Yang LL Barczi JF De Reffye F 2007 Greenlab
tomato a 3D architectural model of tomato development New Zealand Journal of
Agricultural Research 50 1229-1233
Drouet JL Pagegraves L 2007 GRAAL-CN A model of Growth Architecture and
Allocation for Carbon and Nitrogen dynamics within whole plants formalized at
the organ level Ecological Modelling 206 231-249
Elachi C 1987 Introduction to the Physics and Techniques of Remote Sensing pp
66ndash71 New York John Wiley
Elwadie ME Pierce FJ Qi J 2005 Remote Sensing of Canopy Dynamics and
Biophysical Variables Estimation of Corn in Michigan Agronomy Journal 97
99-105
Evain S Flexas J Moya I 2004 A new instrument for passive remote sensing 2
Measurement of leaf and canopy reflectance changes at 531 nm and their
relationship with photosynthesis and chlorophyll fluorescence Remote Sensing of
Environment 91 175ndash185
Evers JB Vos J Fournier C Andrieu B Chelle M Struik PC 2005 Towards
a generic architectural model of tillering in Gramineae as exemplified by spring
wheat (Triticum aestivum) New Phytologist 166 801-812
Falster DS Westoby M 2003 Leafs size and angle vary widely across species
what consequences for light interception New Phytologist158 509-525
Farque L Sinoquet H Colin F 2001 Canopy structure and light interception in
Quercus petraea seedlings in relation to light regime and plant density Tree
Physiology 21 1257ndash1267
Farquhar GD von Caemmerer S Berry JA 1980 A biochemical-model of
photosynthetic CO2 assimilation in leaves of C3 species Planta 149 78-90
Flexas J Escalona JM Medrano H 1999 Water stress induces different
photosynthesis and electron transport rate regulation in grapevine Plant Cell and
Environment 22 39ndash48
Flexas J Medrano H 2002 Drought-inhibition of photosynthesis in C3 plants
stomatal and non-stomatal limitations revisited Annals of Botany 89 183ndash189
Foolad MR Zhang LP Subbiah P 2003 Genetics of drought tolerance during
seed germination in tomato Inheritance and QTL mapping Genome 46 536ndash
545
References
107
Forseth N 1990 Function of leaf movements 238ndash261 pp In Satter RL Gorton
HL Vogelmann TC (eds) The pulvinus motor organ for leaf movement
Fourcaud T Zhang X Stokes A Lambers H Koumlrner C 2008 Plant growth
modelling and applications the increasing importance of plant architecture in
growth models Annals of Botany 101 1053-1063
Frary A Fritz LA Tanksley SD 2004 A comparative study of the genetic
basis of natural variation in tomato leaf sepal and petal morphology
Theoretical and Applied Genetics 109 523-533
Gamon JA Field CB Bilger W Bjoumlrkman O Fredeen AL Pentildeuelas J
1990 Remote sensing of the xanthophyll cycle and chlorophyll fluorescence in
sunflower leaves and canopies Oecologia 85 1ndash7
Gamon JA Serrano L Surfus JS 1997 The photochemical reflectance index
An optical indicator of photosynthetic radiation use efficiency across species
functional types and nutrient levels Oecologia 112 492ndash498
Gary C Barczi JF Bertin N Tchamitchian M 1995 Simulations of individual
organ growth and development on a tomato plant a model and user-friendly
interface Acta Horticulturae 399 199ndash205
Gayler S Grams TEE Kozovits AR Winkler JB Luedemann G Priesack
E 2006 Analysis of competition effects in mono- and mixed cultures of juvenile
beech and spruce by means of the plant growth simulation model PLATHO Plant
Biology 8 503-514
Genty B Briantais JM Viera da Silva JB 1987 Effects of drought on primary
photosynthetic processes of cotton leaves Plant Physiology 83 360ndash364
Giardi MT Cona A Geiken B Kucera T Masojidek J Mattoo AK 1996
Long- term drought stress induces structural and functional reorganisation of
photosystem II Planta 199 118ndash125
Gilbert RA Heilman JL Juo ASR 2003 Diurnal and Seasonal Light
Transmission to Cowpea in SorghumndashCowpea Intercrops in Mali Journal of
Agronomy and Crop Science 189 21- 29
Gitelson AA 2002 Wide Dynamic Range Vegetation Index for remote
quantification of biophysical characteristics of Vegetation Journal of Plant
Physiology 161 165-173
Godin C 2000 Representing and encoding plant architecture a review Annals of
Forest Science 57 413-438
References
108
Godin C Sinoquet H 2005 Functional-structural plant modelling New Phytologist
166 705-708
Gonzaacutelez-Real MM Baille A Gutieacuterrez Colomer RP 2007 Leaf photosynthetic
properties and radiation profiles in a rose canopy (Rosa hybrida L) with bent
shoots Scientia Horticulturae 114 177ndash187
Goudriaan J van Laar HH 1994 Modelling potential crop growth processes
Kluwer Academic Publishers Dordrecht
Graeff S Claupein W 2007 Identification and discrimination of water stress in
wheat leaves ( Triticum aestivum L) by means of reflectance measurements
Irrigation Science 26 61ndash70
Guo J Trotter CM 2004 Estimating photosynthetic light-use efficiency using the
photochemical reflectance index variations among species Function Plant
Biology 31 255ndash265
Hanan J 1997 Virtual plants integrating architectural and physiological models
Environmental Modelling and Software 12 35-42
Heuvelink E 1999 Evaluation of a dynamic simulation model for tomato crop
growth and development Annals of Botany 83 413-422
Higashide T 2009 Light interception by tomato plants (Solanum lycopersicum)
grown on a sloped field Agricultural and Forest Meteoreology 149 756-762
Hoffmann CM Blomberg M 2004 Estimation of Leaf Area Index of Beta vulgaris
L Based on Optical Remote Sensing Data Journal of Agronomy and Crop
Science 190 197-204
Hsiao T Steduto P Fereres E 2007 A systematic and quantitative approach to
improve water use efficiency in agriculture Irrigation Science 25 209-231
Jahns P Latowski D Strzalka K 2009 Mechanism and regulation of the
violaxanthin cycle The role of antenna proteins and membrane lipids Biochimica
et biophysica acta-bioenergetics 1787 3ndash14
Jansen RMC Hofstee JW Wildt J Verstappen FWA Bouwmeester HJ
Posthumus MA Van Henten EJV 2009 Health monitoring of plants by their
emitted volatiles trichome damage and cell membrane damage are detectable at
greenhouse scale Annals of Applied Biology 154 441ndash452
Janssen HJJ Sarlikioti V Gieling ThH Meurs EJJ Marcelis LFM Van
Dugteren JR 2008 A prototype sensor for estimating light interception by
plants in a greenhouse Acta Horticulturae 801 621-627
References
109
Jefferies RA 1994 Drought and chlorophyll fluorescence in the fieldgrown potato
(Solanum tuberosum) Physiologia Plantarum 90 93ndash97
Jonckheere I Fleck S Nackaerts K Muys B Coppin P Weiss M Baret F
2004 Review of methods for in situ leaf area index determination Part I
Theories sensors and hemispherical photography Agricultural Forest
Meteorology 121 19- 35
Jongschaap REE 2006 Run- time calibration of simulation models by integrating
remote sensing estimates leaf area index and canopy nitrogen European Journal
of Agronomy 24 316-324
Kahlen K 2006 3D architectural modeling of greenhouse cucumber (Cucumis
sativus l) Using l-systems Acta horticulturae 718 51-58
Kahlen K Wiechers D Stuumltzel H 2008 Modelling leaf phototropism in a
cucumber canopy Functional Plant Biology 35 876-884
Kao WY Forseth IN 1992 Diurnal leaf movement chlorophyll fluorescence and
carbon assimilation in soybean grown under different nitrogen and water
availabilities Plant Cell and Environment 15 703-710
Krause GH Weis E 1991 Chlorophyll Fluorescence and Photosynthesis The
Basics Annual Review Plant Physiology Plant Molecular Biology 42 313ndash349
Lai CT Katul G Ellsworth D Oren R 2000 Modelling vegetationndashatmosphere
CO2 exchange by a coupled eulerianndashlagrangian approach Boundary-Layer
Meteorology 95 91-122
Langton FA Horridge JS Holdsworth MD Hamer PJC 2004 Control and
optimization of the greenhouse environment using infra-red sensors Acta
Horticulturae 633 145ndash152
Lawlor DW Tezara W 2009 Causes of decreased photosynthetic rate and
metabolic capacity in water-deficient leaf cells a critical evaluation of
mechanisms and integration of processes Annals of Botany 103 561-579
Lichtenthaler HK Babani F 2000 Detection of photosynthetic activity and water
stress by imaging the red chlorophyll fluorescence Plant Physiology and
Biochemistry 38 889ndash895
Lindenmayer A Prusinkiewicz P 1990 The algorithmic beauty of plants New
York Springer-Verlag
Lintz J Simonett DS 1976 Remote Sensing of the Environment 713 p Addison-
Wesley Reading Massachusetts
References
110
Louarn G Lecoeur J Lebon E 2008 A three-dimensional statistical
reconstruction model of grapevine (Vitis vinifera) simulating canopy structure
variability within and between cultivartraining system pairs Annals of Botany
1011167ndash1184
Lu C Zhang J 1998 Effects of water stress on photosynthesis chlorophyll
fluorescence and photoinhibition in wheat plants Australian Journal of Plant
Physiology 25 883ndash892
Maddonni GA Otegui ME Andrieu B Chelle M Casal JJ 2002 Maize
Leaves Turn Away from Neighbors Plant Physiology 130 1181-1189
Marcelis LFM Heuvelink E Goudriaan J 1998 Modelling of biomass
production and yield of horticultural crops a review Scientia Horticulturae 74
83-111
Marcelis LFM Van den Boogaard R Meinen E 2000 Control of crop growth
and nutrient supply by the combined use of crop models and plant sensors 351-
356 pp Proc Int Conf Modelling and control in agriculture horticulture and
post-harvested processing IFAC
Marcelis LFM Dieleman JA Kittas C De Groot F Buschmann C Van
Loon A Boulard T Brajeul E Kocsanyi L Garate A Wieringa G 2006
CLOSYS Closed system for water and nutrient management in horticulture Acta
Horticulturae 718 375ndash382
Masojidek J Trivedi S Halshaw L Alexiou A Hall DO 1991 The synergistic
effect of drought and light stresses in sorghum and pearl millet Plant Physiology
96 198ndash207
Maxwell C Griffiths H Young AJ 1994 Photosynthetic acclimation to light
regime and water stress by the C3-CAM epiphyte Guzmania monostachia gas-
exchange characteristics photochemical efficiency and the xanthophyll cycle
Functional Ecology 8 746ndash754
Meir P Kruijt B Broadmeadow M Barbosa E Kull O Carswell F Nobre
A Jarvis PG 2002 Acclimation of photosynthetic capacity to irradiance in tree
canopies in relation to leaf nitrogen concentration and leaf mass per unit area
Plant Cell amp Environment 25 343ndash357
Meacutethy M Joffre R Rambal S 1999 Remote Sensing of Canopy Photosynthetic
Performances Two Complementary Ways for Assessing the Photochemical
Reflectance Index Photosynthetica 37 239ndash247
References
111
Monsi M Saeki T 1953 Uumlber den lichtfaktor in den pflanzengesellschaften und
seine bedeutung fuumlr die stoffproduktion Japanese Journal of Botany 14 22-52
Morales F Abadiacutea A Abadiacutea J 1990 Characterization of the xanthophyll cycle
and other photosynthetic pigment changes induced by iron deficiency in sugar
beet (Beta vulgaris L) Plant Physiology 94 607ndash613
Najla S Vercambre G Pagegraves L Grasselly D Gautier H Geacutenard M 2009
Tomato plant architecture as affected by salinity Descriptive analysis and
integration in a 3-D simulation model Botany 87 893-904
Nederhoff EM Vegter JG 1994 Canopy Photosynthesis of Tomato Cucumber
and Sweet Pepper in Greenhouses Measurements Compared to Models Annals of
Botany 73 421-427
Niinemets Uuml Fleck S 2002 Petiole mechanics leaf inclination morphology and
investment in support in relation to light availability in the canopy of Liriodendron
tulipifera Oecologia 132 21-33
Niinemets U 2007 Photosynthesis and resource distribution through plant canopies
Plant Cell and Environment 30 1052-1071
Niklas KJ 1998 Light harvesting ldquofitness landscapesrdquo for vertical shoots with
different phyllotactic patterns 759-773 pp In Jean RV Barabeacute D eds Symmetry
in plants Singapore World Scientific Publishing Co Pte Ltd
Noomen MF Skidmore AK van der Meer FD Prins HHT 2006 Continuum
removed band depth analysis for detecting the effects of natural gas methane and
ethane on maize reflectance Remote Sensing of Environment 105262ndash270
Palmer JW 1989 The effects of row orientation tree height time or year and
latitude on light interception and distribution in model apple hedgerow canopies
Journal of Horticultural Scence 64 137- 145
Papadopoulos AP Pararajasingham S 1997 The influence of plant spacing on
light interception and use in greenhouse tomato ( Lycopersicon esculentum Mill)
A review Scientia Horticulturae 69 l-29
Pearcy R Roden J Gamon J 1990 Sunfleck dynamics in relation to canopy
structure in a soybean (Glycine max (L) Merr) canopy Agricultural and Forest
Meteorology 52 359-372
Pearcy RW Yang W 1998 The functional morphology of light capture and carbon
gain in the Redwood forest understorey plant Adenocaulon bicolor Hook
Functional Ecology 12 543-552
References
112
Peguero-Pina J Morales F Flexas J Gil-Pelegriacuten E Moya I 2008
Photochemistry remotely sensed physiological reflectance index and de-
epoxidation state of the xanthophyll cycle in Quercus coccifera under intense
drought Oecologia 156 1ndash11
Peng S Khush GS Virk P Tang Q Zou Y 2008 Progress in ideotype breeding
to increase rice yield potential Field Crops Research 108 32-38
Pentildeuelas J Biel C Serrano L Saveacute R 1993 The reflectance at the 950ndash 970 nm
region as an indicator of plant water stress International Journal of Remote
Sensing 14 1887ndash1905
Pentildeuelas J Gamon JA Freeden AL Merino J Field CB 1994 Reflectance
indices associated with physiological changes in nitrogen- and water-limited
sunflower leaves Remote Sensing of Environment 48 135ndash146
Pentildeuelas J Filella I Araus JL 1997 Visible and near-infrared reflectance
assessment of salinity effects on barley Crop Science 37 198ndash202
Peralta IE Spooner DM 2000 Classification of wild tomatoes A review
Kurtziana 28 45-54
Pinter JrPJ Hatfield JL Schepers JS Barnes EM Moran MS Daughtry
CST Upchurch DR 2003 Remote sensing for crop management
Photogrammetric Engineering and Remote Sensing 69 647ndash664
Planchais I Sinoquet H 1998 Foliage determinants of light absorption in sunny
and shaded branches of Fagus sylvatica (L) Agricultural and Forest Meteorology
89 241-253
Powles SB 1984 Photoinhibition of photosynthesis induced by visible light Annual
Review of Plant Physiology 35 15ndash44
Prusinkiewicz P 1999 A look at the visual modelling of plants using L-systems
Agronomie 19 211-224
Rakocevic M Sinoquet H Christophe A Varlet-Grancher C 2000 Assessing
the geometric structure of a white clover (Trifolium repens) canopy using 3D
digitizing Annals of Botany 86519-526
Rosema A Snel JFH Zahn H Buurmeijer WF Van Hove LWA 1998 The
relation between laser-induced chlorophyll fluorescence and photosynthesis
Remote Sensing of Environment 65 143ndash154
Ruban AV Young AJ Horton P 1993 Induction of nonphotochemical energy
dissipation and absorbance changes in leaves Plant Physiology 102 741ndash750
References
113
Schindler C Lichtenthaler HK 1994 Is there a correlation between light induced
zeaxanthin accumulation and quenching of variable chlorophyll a fluorescence
Plant Physiology Biochemistry 32 813ndash823
Schulze E-D Hall AE 1982 Stomatal responses water loss and CO2 assimilation
rates of plants in contrasting environments In Encyclopedia of plant physiology
Vol 12 Physiological plant ecology ecosystem processes 263ndash324 pp Eds OL
Lange PS Nobel CB Osmond and H Ziegler Berlin Germany Springer-Verlag
Schurr U Walter A Rascher U 2006 Functional dynamics of plant growth and
photosynthesis ndash from steady-state to dynamics ndash from homogeneity to
heterogeneity Plant Cell and Environment 29 340ndash352
Sievaumlnen R Nikinmaa E Nygren P Ozier-Lafontaine H Perttunen J Hakula
H 2000 Components of functionalndashstructural tree models Annals of Forest
Science 57 399-412
Sims DA Luo H Hastings S Oechel WC Rahman AF Gamon JA 2006
Parallel adjustments in vegetation greenness and ecosystem CO2 exchange in
response to drought in a Southern California chaparral ecosystem Remote
Sensing of the Environment 103 289-303
Sinoquet H Sonohat G Phattaralerphong J Godin C 2005 Foliage randomness
and light absorption in 3-D digitized trees an analysis from multiscale
discretization of the canopy Plant Cell and Environment 28 1158-1170
Smith H Whitelam GC 1997 The shade avoidance syndrome multiple responses
mediated by multiple phytochromes Plant Cell and Environment 20 840-844
Sobrado MA 2008 Leaf characteristics and diurnal variation of chlorophyll
fluorescence in leaves of the lsquobanarsquo vegetation of the amazon region
Photosynthetica 46 202-207
Stewart DW Costa C Dwyer L M Smith D L Hamilton R I Ma B L
2003 Canopy Structure Light Interception and Photosynthesis in Maize
Agronomie Journal 95 1465-1474
Suaacuterez L Zarco-Tejada PJ Sepulcre-Cantoacute G Peacuterez-Priego O Miller JR
Jimeacutenez-Muntildeoz JC Sobrino J 2008 Assessing canopy PRI for water stress
detection with diurnal airborne imagery Remote Sensing of the Environment
112 560-575
References
114
Suaacuterez L Zarco-Tejada PJ Berni JAJ Gonzalez-Dugo V Ferreres E 2009
Modeling PRI for water stress detection using radiative transfer models Remote
Sensing of the Environment 113 730-744
Sun P Grignetti A Liu S Casacchia R Salvatori R Pietrini F Loreto F
Centritto M 2007 Associated changes in physiological parameters and spectral
reflectance indices in olive (Olea europaea L) leaves in response to different
levels of water stress International Journal of Remote Sensing 29 1725ndash1743
Takenaka A 1994 Effects of leaf blade narrowness and petiole length on the light
capture efficiency of a shoot Ecological Research 9 109-114
Thornley JHM Johnson IR 1990 Plant and Crop Modelling In A Mathematical
Approach to Plant and Crop Physiology 669 pp Oxford UK Clarendon Press
Thurling N 1991 Application of the ideotype concept in breeding for higher yield in
the oilseed brassicas Field Crops Research 26 201-219
Tian YQ Zhu Y Cao W 2005 Monitoring leaf photosynthesis with canopy
spectral reflectance in rice Photosynthetica 43 481-489
Toler JE Murdock EC Stapleton GS Wallace SU 1999 Corn leaf orientation
effects on light interception intraspecific competition and grain yields Journal of
production agriculture 12 396-399
Turner DP Cohen WB Kennedy RE Fassnacht KS Briggs JM 1999
Relationships between Leaf Area Index and Landsat TM Spectral Vegetation
Indices across Three Temperate Zone Sites Remote Sensing of Environment 70
52-68
Valladares F Pearcy RW 1998 The functional ecology of shoot architecture in
sun and shade plants of Heteromeles arbutifolia M Roem a Californian chaparral
shrub Oecologia 114 1-10
Valladares F 2003 Light heterogeneity and plants from ecophysiology to species
coexistence and biodiversity Progress in Botany 439ndash471 pp Springer Verlag
Berlin Germany
Valladares F Gianoli E Goacutemez JM 2007 Ecological limits to plant phenotypic
plasticity New Phytologist 176 749ndash763
Valladares F Niinemets Uuml 2007 The architecture of plant crowns from design
rules to light capture and performance 101-149 pp In Pugnaire F Valladares F
eds Functional plant ecology New York Taylor and Francis
References
115
Vargas LA Andersen MN Jensen CR Joslashrgessen U 2002 Estimation of leaf
area index light interception and biomass of Miscanthus sinensis lsquoGoliathrsquofrom
radiation measurements Biomass and bioenergy 22 1-14
Vos J Marcelis LFM Evers JB 2007 Functional-structural plant modelling in
crop production adding a dimension 1-12 pp In Vos J Marcelis LFM De
Visser PHB Struik PC and Evers JB eds Functional-structural plant
modelling in crop production Springer Dordrecht
Vos J Evers JB Buck-Sorlin GH Andrieu B Chelle M de Visser PHB
2010 Functional-structural plant modelling a new versatile tool in crop science
Journal of Experimental Botany 61 2101-2115
Wang D Wilson C Shannon MC 2002 Interpretation of salinity and irrigation
effects on soybean canopy reflectance in visible and near-infrared spectrum
domain International Journal of Remote Sensing 23 811-824
Wang Q Adiku S Tenhunen J Granier A 2005 On the relationship of NDVI
with leaf area index in a deciduous forest site Remote Sensing of Environment
94 244-255
Weng JH Chen YN Liao TS 2006 Relationships between chlorophyll
fluorescence parameters and photochemical reflectance index of three species
adapted to different temperature regimes Functional Plant Biology 33 241ndash246
Werner C Ryel RJ Correia O Beyschlag W 2001 Structural and functional
variability within the canopy and its relevance for carbon gain and stress
avoidance Acta Oecologica 22 129-138
Zarco-Tejada PJ Miller JR Mohammed GH Noland TL 2000 Chlorophyll
Fluorescence Effects On Vegetation Apparent Reflectance I Leaf-Level
Measurements And Model Simulation Remote Sensing of Environment 74 582ndash
590
Zheng B Shi L Ma Y Deng Q Li B Guo Y 2008 Comparison of architecture
among different cultivars of hybrid rice using a spatial light model based on 3-D
digitizing Functional Plant Biology 35 900-910
Zimmermann D Reuss R Westhoff M Geszligner P Bauer W Bamberg E
Bentrup F-W Zimmermann U 2008 A novel non-invasive online-
monitoring versatile and easy plant-based probe for measuring leaf water status
Journal of Experimental Botany 59 3157ndash3167
References
116
Zotz G Reichling P Valladares F 2002 A simulation study on the importance of
size and related changes in leaf morphology and physiology for carbon gain in an
epiphytic Bromeliad Annals of Botany 90 437-443
119
Summary A greenhouse crop can be approached as an open system that can be affected by a
number of parameters such as light climate or nutrient supply In the last decades
efforts have been made to understand the functioning of this system and the
interaction between the different parameters The intensive nature of greenhouse
cultivation combined with the economic necessity to enlarge the farm size makes the
development of decision support systems (DSS) imperative to help the growers in
managing their farms efficiently The foundation of DSS are plant models and in order
to work more efficiently they should be able to receive information in real time from
sensors that measure different plant parameters such as light interception leaf area
index and photosynthetic stress in a non-destructive way In order to develop functional
DSS it is imperative to develop accurate models and monitoring techniques applied in
the specific greenhouse environment
The aim of this thesis was to explore different techniques to simulate and monitor
light interception and photosynthesis by a greenhouse grown tomato canopy Since
photosynthesis is directly linked to light absorption we opted to develop a three
dimensional model that takes into account the explicit plant architecture Different
methodologies to monitor these physiological properties online by means of remote
sensing were also explored
A number of physiological tomato models have been proposed the last
decades their main challenge being the correct simulation of fruit yield For this an
accurate simulation of light interception and thus photosynthesis is of primary
importance At present most process-based models and the majority of three
dimensional models include simplifications of plant architecture that can compromise
the accuracy of light interception simulations and accordingly canopy
photosynthesis In Chapter 21 the first steps towards the development of the model
are presented Light interception is highly dependent on the canopy structure which is
affected among others by the distance between plant rows the distance of plants
within the row leaf pruning and crop variety The model was used to test different
crop planting scenarios on their effect on light interception Light interception from
the planting scenarios was then compared with results of a totally homogeneous
canopy Also analysis of differences between manual measurements of leaf length
width elevation angle and leaf orientation was conducted Changes of leaf elevation
Summary
120
angles at two different times of the day were also measured In tomato differences in
leaf length width and elevation angle of the leaves were mainly observed in the upper
90cm of the plant in the still developing zone Changes of the architectural
characteristics of structural plant characteristics affected directly light interception by
the crop canopy Nevertheless even if plant structure stayed the same light
penetration could easily be manipulated by changing the row spacing in the crop thus
affecting light interception and potentially plant production
In Chapter 22 the development and calibration of a functional-structural tomato
model is fully described The model was used to investigate the canopy heterogeneity
of an explicitly described tomato canopy in relation to temporal dynamics of
horizontal and vertical light distribution and photosynthesis under direct and diffuse
light conditions The model consists of an architectural static virtual plant coupled
with a nested radiosity model for light absorption and a leaf photosynthesis module
Different scenarios for horizontal and vertical distributions of light interception
incident light and photosynthesis were investigated under diffuse and direct light
conditions Simulated light interception showed a good correspondence to the
measured values Explicitly described leaf elevation angles resulted in higher light
interception in the middle of the plant canopy compared to fixed and ellipsoidal leaf
elevation angle distribution models although the total light interception remained the
same The fraction of light intercepted at a north-south orientation of rows differed
from an east-west orientation by 10 in winter and 23 on summer days The
horizontal distribution of photosynthesis differed significantly between the top
middle and lower canopy layer Taking into account the vertical variation of leaf
photosynthetic parameters in the canopy led to ca 8 increase on simulated canopy
photosynthesis
Manipulation of plant structure can strongly affect light distribution in the canopy
and photosynthesis In Chapter 23 the idea of identifying different plant ideotypes
for optimization of light absorption and photosynthesis was explored Using the
functional-structural tomato model presented in the previous chapters a range of
different plant architectural characteristics were tested for two different seasons in
order to find the optimal architecture with respect to light absorption and
photosynthesis Sensitivity analyses were carried out for leaf elevation angle leaf
phyllotaxis leaflet angle leaf shape leaflet arrangement and internode length From
the results of this analysis two possible ideotypes were proposed Increasing light
Summary
121
absorption in the top part of the canopy by 25 without changing light absorption of
the canopy as a whole augmented photosynthesis by 6 in winter and decreased it
by 7 in summer The measured plant structure was already optimal with respect to
leaf elevation angle leaflet angle and leaflet arrangement for both light absorption and
photosynthesis while phyllotaxis had no effect Increasing the length-to-width ratio of
leaves by 15 or increasing internode length from 7 to 12 cm led to an increase of 7 ndash
10 for light absorption and photosynthesis The most important architectural traits
found were the internode length and the leaf shape as they affect vertical light
distribution in the canopy distinctly A new plant ideotype with more spacious canopy
architecture due to long internodes and long and narrow leaves led to an increase in
photosynthesis of up to 10
In Chapter 31 ways to monitor on-line LAI and PAR interception of the canopy
under greenhouse conditions through reflectance measurements were explored LAI
and PAR interception were measured at the same moments as reflectance at six
wavelengths in different developmental stages of tomato and sweet pepper plants
Normalized Difference Vegetation Index (NDVI) was calculated Relationships
between the measured parameters were established in experimental greenhouses and
subsequently these were tested in commercial greenhouses The best estimation for
LAI and PAR interception was obtained from reflectance at 460nm for both tomato
and sweet pepper The goodness of the fit was validated with data from the
commercial greenhouses and was also tested in this study The divergence of the
results from the ones reported from field experiments can be traced back to the special
greenhouse environment where more sources of reflectance are added due to
construction parts and a white plastic covered background Reflectance measurements
offer a non- destructive way to estimate PAR interception and LAI (up to the value of
3) in greenhouse production systems The relationship established between reflectance
at 460 nm PAR interception and LAI for both tomato and sweet pepper can become a
good tool for crop online monitoring in greenhouse conditions Furthermore if
information from reflectance sensors is used as input directly into the crop models
new opportunities for decision support systems in greenhouse production could be
opened up
Photosynthetic stress induced by water deprivation in plants affects a number of
physiological processes such as photosynthetic rate stomatal conductance as well as
the operating efficiency of PSII and non- photochemical quenching Photochemical
Summary
122
Reflectance Index (PRI) is reported to be sensitive to changes of xanthophyll cycle
that occur during stress and could possibly be used to monitor changes in the
physiological parameters mentioned before In Chapter 32 the use of PRI as an early
photosynthetic stress indicator was evaluated A water stress treatment was imposed
on a greenhouse tomato crop CO2 assimilation stomatal conductance light and dark
adapted fluorescence as well as PRI and relative water content of the rooting medium
RWCs where repeatedly measured The same measurements were also performed on
well-irrigated plants that acted as a reference The experiment was repeated in four
consecutive weeks Results showed that PRI can be used as an early stress indicator
only when light intensity at crop level was above 700μmol m-2 s-1 At lower values of
light intensity the relationship of PRI to RWCs was poor in comparison to
photosynthesis or fluorescence parameters that showed a high correlation to RWCs
For that reason we can conclude that PRI as water stress indicator cannot be
independent of the ambient light conditions and its use can make sense only under
conditions of high light
Finally in Chapter 4 the main achievements and limitations of this study are
discussed and directions for future research are proposed
Samenvatting
125
Samenvatting De afgelopen decennia is kennis over het functioneren van kasgewassen en de
interactie met teeltfactoren sterk toegenomen De intensieve teeltwijze in kassen
gecombineerd met de schaalvergroting maken de ontwikkeling en toepassing van
beslissingsondersteunende systemen ofwel decision support systemen (DSS)
noodzakelijk om telers te ondersteunen bij het verhogen van de doelmatigheid en
efficieumlntie van het teeltproces De basis van een DSS wordt veelal gevormd door een
model Om dit model effectief te laten functioneren zou het real time data moeten
krijgen van sensoren die plant-parameters meten zoals lichtonderschepping
bladoppervlakte-index en fotosynthetische stress op een niet-destructieve wijze Dus
om een goed functionerende DSS te ontwikkelen moeten nauwkeurige modellen en
monitoring technieken voor toepassing in kassen ontwikkeld worden
Het doel van dit proefschrift was om verschillende methodologieeumln te
onderzoeken ten behoeve van het simuleren en monitoren van lichtonderschepping en
fotosynthese van een tomatengewas in de kas Aangezien fotosynthese direct
gekoppeld is aan lichtonderschepping is er voor gekozen om een functioneel-
structureel model te ontwikkelen Een functioneel-structureel model is een model dat
de drie-dimensionale plant architectuur expliciet in beschouwing neemt evenals de
belangrijkste fysiologische processen Verschillende methodologieeumln om
fysiologische eigenschappen on-line en contactloos te meten zijn onderzocht
Afgelopen decennia zijn enkele fysiologische groeimodellen voor tomaat
ontwikkeld om de vruchtproductie te kunnen simuleren Hierbij zijn een nauwkeurige
simulatie van lichtonderschepping en fotosynthese van primair belang Momenteel
bevatten de meeste proces-gebaseerde modellen en zelfs de drie-dimensionale
modellen sterke vereenvoudigingen van de plantarchitectuur die een negatieve invloed
hebben op de nauwkeurigheid van de simulatie van lichtonderschepping en als gevolg
daarvan van gewasfotosynthese
In Hoofdstuk 21 worden de eerste stappen gezet om een functioneel-structureel
tomatenmodel te ontwikkelen Lichtonderschepping is sterk afhankelijk van de
gewasstructuur De gewasstructuur hangt onder andere af van de afstand tussen de
plantrijen de afstand tussen de planten in de rij bladsnoei en ras Het model werd
gebruikt om het effect van verschillende scenariorsquos voor plantafstanden op
lichtonderschepping te testen Lichtonderschepping van deze scenariorsquos werd
Samenvatting
126
vergeleken met een volledig homogeen gewas zonder plantrijen De bladhoek bleek
tijdens de dag te veranderen Deze verandering tijdens de dag werden vooral
waargenomen in de bovenste 90cm van de plant dit is in het deel van de plant dat
zich nog aan het ontwikkelen is Veranderingen van de plant architectuur hadden
direct effect op de lichtonderschepping van het gewas Desalniettemin zelfs als de
plant structuur hetzelfde bleef kon de lichtdoordringing eenvoudig veranderd worden
door bijvoorbeeld de rijafstand te veranderenIn Hoofdstuk 22 wordt de
ontwikkeling en calibratie van een functioneel-structureel tomaten model volledig
uitgewerkt Met het model werd de heterogeniteit van horizontale en verticale
lichtverdeling en fotosynthese in een tomatengewas onderzocht voor zowel direct als
diffuus licht Het model bestond uit een statisch architectuurmodel gekoppeld aan een
lsquonested radiosityrsquo model voor lichtabsorptie en een bladfotosynthesemodel
Verschillende scenariorsquos voor horizontale en verticale verdeling van de
lichtonderschepping invallend licht en fotosynthese werden onderzocht voor direct en
diffuus licht Gesimuleerde lichtonderschepping vertoonde een goede overeenkomst
met gemeten waarden Een expliciete beschrijving van bladhoeken in het model
resulteerden in hogere lichtonderschepping in het midden van het gewas in
vergelijking met een vaste of ellipsoiumldale bladhoekverdeling De totale
lichtonderschepping van het gewas bleef wel gelijk De fractie van het licht dat
onderschept werd door het gewas was bij een noord-zuid orieumlntatie van de gewasrijen
in de winter 10 en in de zomer 23 hoger dan bij oost-west orieumlntatie De
horizontale verdeling van fotosynthese verschilde significant tussen boven midden en
onder in het gewas Door in het model rekening te houden met de verticale verdeling
van bladfotosyntheseparameters in het gewas veranderde de gesimuleerde
gewasfotosynthese met circa 8 Het veranderen van de gewasstructuur kan sterke
invloed hebben op de lichtverdeling in het gewas en de fotosynthese In Hoofdstuk
23 zijn plant ideotypes gezocht met een optimale lichtabsorptie en fotosynthese Met
behulp van het functie-structuurmodel voor tomaat zoals in vorige hoofdstukken
beschreven zijn effecten van een groot aantal architectuureigenschappen van de plant
onderzocht op de lichtabsorptie en fotosynthese in twee verschillende seizoenen
(zomer en winter) Er is een gevoeligheidsanalyse uitgevoerd voor bladhoek van het
blad en van deelblaadjes fyllotaxie lengtebreedte verhouding van bladeren opbouw
van het blad uit deelblaadjes en internodiumlengte Naar aanleiding van de analyse
van deze resultaten werden twee mogelijke ideotypes voor optimale
Samenvatting
127
lichtonderschepping en fotosynthese geformuleerd Als de verticale verdeling van het
geabsorbeerde licht in het gewas werd veranderd waarbij de lichtabsorptie in de top
van het gewas met 25 toenam terwijl de totale licht absorptie van het gewas gelijk
gehouden werd dan nam de gewasfotosynthese met 6 toe in de winter maar nam af
met 7 in de zomer De waargenomen plantstructuur was al optimaal voor
lichtabsorptie en fotosynthese voor zover het ging om de volgende
architectuureigenschappen bladhoek van blad en deelblaadjes en opbouw van het
samengestelde blad De meest belangrijke architectuur eigenschappen van een plant
bleken de internodiumlengte en lengte-breedte verhouding van het blad Verhoging
van de lengte-breedte verhouding van bladeren met 50 of vergroten van
internodiumlengte van 7 naar 12 cm leidde tot een toename van lichtabsorptie en
fotosynthese met 7 tot 10 Een nieuw plant ideotype met een meer open
gewasstructuur als gevolg van langere internodieumln en lange smalle bladeren leidde tot
een toename van de gewasfotosynthese tot 10
In Hoofdstuk 31 zijn methoden onderzocht om onder kascondities de
bladoppervlakte-index (LAI) en lichtonderschepping van het gewas on-line te
monitoren met behulp van reflectiemetingen LAI en lichtonderschepping werden
tegelijk met reflectie van 6 verschillende golflengten gemeten aan paprika- en
tomatenplanten in verschillende ontwikkelingsstadia Relaties tussen de gemeten
parameters werden bepaald in onderzoekskassen en vervolgens werden deze relaties
getest in praktijkkassen De beste schatting voor LAI en lichtonderschepping werd
verkregen met behulp van reflectie van 460nm licht voor zowel tomaat als paprika
Reflectiemetingen bieden hiermee een goede niet-destructieve mogelijkheid om LAI
(tot een waarde van circa 3) en lichtonderschepping te monitoren bij de teelt van
tomaten en paprika in kassen Fotosynthetische stress geiumlnduceerd door watertekort in
planten heeft invloed op een aantal fysiologische processen zoals
fotosynthesesnelheid huidmondjesgeleidbaarheid efficieumlntie van PSII en niet-
fotochemische doving (non-photochemical quenching) De fotochemische reflectie
index (PRI) is gevoelig voor veranderingen in de xanthofyl cycli die optreden tijdens
stress Dit zou mogelijk gebruikt kunnen worden om veranderingen in fysiologische
parameters te kunnen monitoren In Hoofdstuk 32 werd het gebruik van de PRI
meting geeumlvalueerd als vroegtijdige indicator voor fotosynthetische stress Een
behandeling met watertekort werd aangelegd in een kas met een tomatengewas CO2
mol mmicroassimilatie huidmondjesgeleidbaarheid licht en donker geadapteerde
Samenvatting
128
fluorescentie alsmede PRI en relatief watergehalte van het wortelmedium (RWC)
werden gemeten Dezelfde metingen werden verricht aan goed geiumlrrigeerde planten
die dienden als referentiebehandeling Het experiment werd herhaald in vier
opeenvolgende weken De resultaten lieten zien dat PRI alleen gebruikt kan worden
als vroegtijdige stressindicator wanneer lichtintensiteit meer dan 700 -2 s-1 bedraagt
Bij lagere lichtintensiteiten was de relatie tussen PRI en RWC zwak in vergelijking
met de goede relaties tussen RWC en fotosynthese of fluorescentieparameters Op
basis van deze resultaten kan geconcludeerd worden dat PRI als stressindicator niet
onafhankelijk van lichtniveau gebruikt kan worden PRI metingen kunnen alleen als
stressindicator gebruikt worden bij voldoende hoge lichtniveaus
Tenslotte worden in Hoofdstuk 4 de belangrijkste resultaten en de beperkingen
van dit onderzoek bediscussieerd en worden richtingen voor vervolgonderzoek
voorgesteld
Περίληψη
131
Περίληψη Η καλλιέργεια του θερμοκηπίου μπορεί να προσεγγιστεί ως ένα ανοικτό σύστημα
το οποίο μπορεί να επηρεαστεί από μια σειρά παραμέτρων όπως το φως το κλίμα ή η
παροχή θρεπτικών συστατικών Τις τελευταίες δεκαετίες έχουν καταβληθεί
προσπάθειες για την κατανόηση της λειτουργίας του συστήματος αυτού καθώς και
της αλληλεπίδρασης μεταξύ των διαφόρων παραμέτρων Η εντατική φύση της
καλλιέργειας του θερμοκηπίου σε συνδυασμό με την οικονομική ανάγκη να
διευρυνθεί το μέγεθος της γεωργικής εκμετάλλευσης καθιστά επιτακτική την
ανάπτυξη συστημάτων υποστήριξης αποφάσεων (Desicion Support Systems) για την
πιο αποτελεσματική διαχείριση των αγροκτημάτων Βάση των DSS αποτελούν τα
μοντέλα φυτών (plant models) Τα μοντέλα αυτά προκειμένου να είναι
αποτελεσματικά θα πρέπει να μπορούν να λαμβάνουν πληροφορίες σε πραγματικό
χρόνο από αισθητήρες οι οποίοι μετρούν διαφορετικές παραμέτρους όπως η
πρόσληψη φωτός ο δείκτης της φυλλικής επιφάνειας ή το φωτοσυνθετικό στρες με
μη καταστροφικό τρόπο Για την ανάπτυξη λειτουργικών DSS είναι επιτακτική
ανάγκη να αναπτυχθούν ακριβή μοντέλα και τεχνικές παρακολούθησης που μπορούν
να εφαρμόστούν στο συγκεκριμένο θερμοκηπιακό περιβάλλον
Σκοπός αυτής της διατριβής ήταν να διερευνήσει διαφορετικές τεχνικές για την
προσομοίωση και την παρακολούθηση της πρόσληψης του φωτός και της
φωτοσύνθεσης σε μια καλλιέργεια θερμοκηπιακής ντομάτας Δεδομένου ότι η
φωτοσύνθεση είναι άμεσα συνδεδεμένη με την πρόσληψη του φωτός στα πλαίσια
αυτής της μελέτης επιλέχτηκε η ανάπτυξη ενός τρισδιάστατου μοντέλου ντομάτας
που θα λαμβάνει υπόψιν του τη ρητή αρχιτεκτονική των φυτών Σε δεύτερο πλάνο
διευρήνθηκαν και αξιολογήθηκαν κάτω από τις ειδικές συνθήκες του θερμοκηπίου
διαφορετικές μεθοδολογίες για την παρακολούθηση των φυσιολογικών παραμέτρων
των φυτών σε πραγματικό χρόνο μέσω τηλεπισκόπησης
Τις τελευταίες δεκαετίες έχουν προταθεί διάφορα φυσιολογικά μοντέλα ντομάτας
όπου η βασική πρόκληση που αντιμετωπίζουν είναι η σωστή προσομοίωση της
απόδοσης της καλλιέργειας Γι αυτό μια ακριβής προσομοίωση της πρόσληψης
φωτός και συνεπώς και της φωτοσύνθεσης είναι πρωταρχικής σημασίας Προς το
παρόν τα περισσότερα μοντέλα περιλαμβάνουν απλουστεύσεις της αρχιτεκτονικής
του φυτού που θέτει σε κίνδυνο την ακρίβεια της προσομοίωσης της πρόσληψης του
Περίληψη
132
φωτός και κατά συνέπεια της φωτοσύνθεσης Στο Κεφάλαιο 21 παρουσιάζονται τα
πρώτα βήματα για την ανάπτυξη του μοντέλου Η πρόσληψη του φωτός εξαρτάται σε
μεγάλο βαθμό από τη δομή του φυλλώματος και επηρεάζεται μεταξύ άλλων από
την απόσταση μεταξύ των σειρών των φυτών την απόσταση των φυτών στο
εσωτερικό της σειράς το κλάδεμα των φύλλων και την φυτική ποικιλία Το μοντέλο
χρησιμοποιήθηκε για τη μελέτη της επίδρασης διαφόρων σεναρίων φύτευσης στην
πρόσληψη του φωτός Στη συνέχεια πραγματοποιήθηκε σύγκριση αυτών των
σεναρίων με μια καλλιέργεια με ομοιογενές φύλλωμα Πραγματοποιήθηκε επίσης
ανάλυση μετρήσεων του μήκους των φύλλων του πλάτους της γωνίας ανύψωσης και
του προσανατολισμού των φύλλων Η μέτρηση της μεταβολής της γωνίας ανύψωσης
των φύλλων πραγματοποιήθηκε για δύο ώρες της ημέρας Στη ντομάτα οι διαφορές
στο μήκος των φύλλων το πλάτος και τη γωνία ανύψωσης παρατηρήθηκαν κυρίως
στα άνω 90 εκατοστά του φυλλώματος στη ζώνη δηλαδή του φυτού που συνεχίζει να
αναπτύσσεται Αλλαγές των αρχιτεκτονικών χαρακτηριστικών του φυτού επηρεάζουν
άμεσα την πρόσληψη του φωτός από το φύλλωμα Παρ όλα αυτά ακόμη και αν η
αρχιτεκτονική δομή του φυτού παρέμενε η ίδια η πρόσληψη του φωτός θα μπορούσε
εύκολα να χειραγωγηθεί από την αλλαγή της απόστασης των γραμμών φύτευσης
επηρεάζοντας έτσι την πρόσληψη του φωτός και ενδεχομένως τη φυτική παραγωγή
Στο Κεφάλαιο 22 παρουσιάζεται η ανάπτυξη και βαθμονόμηση ενός
τρισδιάστατου μοντέλου ντομάτας Το μοντέλο χρησιμοποιήθηκε για να διερευνηθεί
η επίδραση της ετερογένειας του φυλλώματος στη δυναμική της οριζόντιας και
κάθετης κατανομής του φωτός και της φωτοσύνθεσης κάτω από συνθήκες άμεσου
και διάχυτου φωτισμού Το μοντέλο αποτελείται από τρία υπομοντέλα α) ένα
στατικό αρχιτεκτονικό μοντέλο β) ένα μοντέλο για τον υπολογισμό της πρόσληψης
του φωτός και γ) ένα μοντέλο υπολογισμού της φωτοσύνθεσης σε επίπεδο φύλλου
Διαφορετικά σενάρια για την οριζόντια και κάθετη κατανομή της πρόσληψης του
φωτός της προσπίπτουσας ακτινοβολίας και της φωτοσύνθεσης διερευνήθηκαν κάτω
από συνθήκες άμεσου και διάχετου φωτισμού Η προσομοίωση της πρόσληψης του
φωτός έδωσε μια καλή αντιστοιχία με τις μετρούμενες τιμές Η ρητή περιγραφή των
γωνιών των φύλλων οδήγησε σε υψηλότερη πρόσληψη φωτός σε σύγκριση με
μοντέλα που χρησιμοποιούν σταθερές ή ελλειψοειδείς κατανομές για την περιγραφή
των γωνιών των φύλλων αλλά η συνολική πρόσληψη φωτός παρέμεινε η ίδια Το
ποσοστό του φωτός που προσλήφθηκε ήταν υψηλότερο κατά 10 το χειμώνα και
23 το καλοκαίρι όταν ο προσανατολισμός των σειρών σποράς ήταν από βορρά προς
Περίληψη
133
νότο σε συγκρισή με αυτόν από ανατολή προς δύση Η οριζόντια κατανομή της
φωτοσύνθεσης διέφερε σημαντικά μεταξύ της κορυφής της μέσης και του
χαμηλότερου στρώματος του φυλλώματος
Η χειραγώγηση της αρχιτεκτονικής δομής του φυτού μπορεί να επηρεάσει
σημαντικά την κατανομή του φωτός στο φύλλωμα και τη φωτοσύνθεση Στο
Κεφάλαιο 23 διερευνάται η χρήση φυτικών ιδεοτύπων (ideotypes) για τη
βελτιστοποίηση της απορρόφησης του φωτός και της φωτοσύνθεσης
Χρησιμοποιώντας το μοντέλο της ντομάτας που παρουσιάστηκε στα προηγούμενα
κεφάλαια εξετάζεται ένα φάσμα διαφορετικών φυτικών αρχιτεκτονικών
χαρακτηριστικών για δύο διαφορετικές εποχές του έτους ούτως ώστε να οριστεί η
βέλτιστη αρχιτεκτονική δομή για την απορρόφηση του φωτός και την φωτοσύνθεση
Συγκεκριμένα μελετήθηκαν οι επιδράσεις της γωνίας ανύψωσης των φύλλων της
φυλλοταξίας της γωνίας των φύλλαρίων του σχήματος των φύλλων της διαρύθμισης
των φυλλάριων καθώς και του μήκους του μεσογονατίου διαστήματος Από τα
αποτελέσματα αυτής της ανάλυσης προέκυψαν δύο πιθανοί ιδεότυποι Αύξηση της
απορρόφησης του φωτός στο πάνω μέρος του φυλλώματος κατά 25 χωρίς αλλαγή
της συνολικής απορρόφησης αύξησε τη φωτοσύνθεση κατά 6 το χειμώνα και την
μείωσε κατά 7 το καλοκαίρι Η αρχική αρχιτεκτονική δομή ήταν ήδη βέλτιστη σε
σχέση με τη γωνία ανύψωσης του φύλλου τη γωνία και τη διαρύθμιση του
φυλλαρίου τόσο για την απορρόφηση του φωτός όσο και για τη φωτοσύνθεση ενώ η
φυλλόταξη δεν είχε καμία επίδραση Η αύξηση του μήκους και πλάτους των φύλλων
κατά 15 ή η αύξηση του μήκους των μεσογονατίων διαστημάτων από 7 έως 12 cm
οδήγησε σε αύξηση κατά 7 - 10 για την απορρόφηση του φωτός και τη
φωτοσύνθεση Τα πιο σημαντικά αρχιτεκτονικά χαρακτηριστικά που διαπιστώθηκαν
ήταν το μήκος του μεσογονατίου διαστήματος και το σχήμα των φύλλων που
επηρέασαν σημαντικά την κάθετη κατανομή του φωτός στο φύλλωμα Ο νέος
προτεινόμενος ιδεότυπος με πιο ανοιχτό φύλλωμα λόγω αύξησης των μεσογονάτιων
διαστημάτων και μακριών και λεπτών φύλλων οδήγησε σε αύξηση της
φωτοσύνθεσης μέχρι και 10
Στο Κεφάλαιο 31 μελετήθηκαν τρόποι για παρακολούθηση on-line της φυλλικής
επιφάνειας και της πρόσληψης του φωτός μέσω μετρήσεων ανάκλασης Η φυλλική
επιφάνεια και η πρόσληψη του φωτός μετρήθηκαν την ίδια στιγμή με την ανάκλαση
σε έξι διαφορετικά μήκη κύματος σε διάφορα στάδια της ανάπτυξής φυτών ντομάτας
και πιπεριάς και υπολογίστηκε ο Νormalized Difference Δείκτης Βλάστησης (NDVI)
Περίληψη
134
Οι σχέσεις μεταξύ των μετρούμενων παραμέτρων που βρέθηκαν στις αρχικές
μετρήσεις σε πειραματικά θερμοκήπια στη συνέχεια εξετάστηκαν για την ακρίβεια
τους και σε εμπορικά θερμοκήπια Την καλύτερη σχέση για την εκτίμηση της
φυλλικής επιφάνειας και της πρόσληψης του φωτός έδωσε η ανάκλαση στα 460nm
και για τις δύο καλλιέργειες Η σχέση αυτή επικυρώθηκε και από τα αποτελέσματα
των μετρήσεων από τα εμπορικά θερμοκήπια Αποκλίσεις των αποτελεσμάτων
μεταξύ των εμπορικών και των πειραματικών θερμοκηπίων οφείλονται στο ιδιαίτερο
περιβάλλον του θερμοκηπίου όπου η ανάκλαση μπορεί να προέρχεται επίσης από τα
κατασκευαστικά μέρη του θερμοκηπίου Η σχέση μεταξύ της ανάκλασης στα 460 nm
τον δείκτη φυλλικής επιφάνειας και της πρόσληψης του φωτός μπορεί να αποτελέσει
ένα καλό εργαλείο για την σε πραγματικό χρόνο παρακολούθηση των καλλιεργειών
σε συνθήκες θερμοκηπίου Επιπλέον εάν οι πληροφορίες από τους αισθητήρες
ανάκλασης χρησιμοποιηθούν απευθείας απο τα φυτικά μοντέλα θα άνοιξουν νέες
προοπτικές στα συστήματα υποστήριξης αποφάσεων στην παραγωγή του
θερμοκηπίου
Το φωτοσυνθετικό στρες που προκαλείται από στέρηση νερού στα φυτά
επηρεάζει έναν αριθμό φυσιολογικών διεργασιών όπως ο φωτοσυνθετικός ρυθμός η
στοματική αγωγιμότητα καθώς και η λειτουργική απόδοση του PSII και της μη-
φωτοχημικής απόσβεση(NPQ) O Φωτοχημικός Δείκτης Ανάκλασης (PRI) φέρεται να
είναι ευαίσθητος στις μεταβολές του κύκλου της ξανθοφύλλης που συμβαίνουν κατά
τη διάρκεια του στρες και θα μπορούσε ενδεχομένως να χρησιμοποιηθεί για την
παρακολούθηση των αλλαγών στις φυσιολογικές παραμέτρους που αναφέρθηκαν
παραπάνω Στο Κεφάλαιο 32 αξιολογείται η χρήση του PRI ως μια πρώιμη ένδειξη
φωτοσυνθετικού στρες Για τους σκοπούς αυτής της έρευνας υδατικό στρες
εφαρμόστηκε σε μια καλλιέργεια ντομάτας Κατά τη διάρκεια του πειράματος
μετρήθηκαν η πρόσληψη του CO2 η στοματική αγωγιμότητα ο φθορισμός κάτω από
σθνθήκες φωτός ή μη καθώς και το PRI και η σχετική περιεκτικότητα σε νερό του
ριζώματος επί τοις Οι ίδιες μετρήσεις διεξήχθησαν επίσης σε καλά ποτισμένα
φυτά που ενήργησαν ως σημείο αναφοράς Το πείραμα επαναλήφθηκε τέσσερις
διαδοχικές εβδομάδες Τα αποτελέσματα έδειξαν ότι το PRI μπορεί να
χρησιμοποιηθεί ως μια πρώιμη ένδειξη στρες μόνο όταν η ένταση του φωτός ήταν
πάνω από 700μmol m-2 s-1 Σε χαμηλότερες τιμές της έντασης του φωτός η σχέση
του PRI με τη σχετική περιεκτικότητα σε νερό του ριζώματος επί τοις ήταν φτωχή
σε σύγκριση με τη φωτοσύνθεση ή το φθορισμό με τις οποίες έδειξαν υψηλή
Περίληψη
135
συσχέτιση Για το λόγο αυτό μπορούμε να συμπεράνουμε ότι η χρήση του PRI σαν
δείκτης φυτικού στρες δεν μπορεί να είναι ανεξάρτητη από τις συνθήκες φωτισμού
του περιβάλλοντος και η χρήση του μπορεί να έχει νόημα μόνο σε συνθήκες υψηλού
φωτός
Τέλος το Κεφάλαιο 4 συζητιούνται τα κύρια επιτεύγματα και οι περιορισμούς της
μελέτης αυτής και προτείνονται κατευθύνσεις για μελλοντική έρευνα
Acknowledgments
137
Acknowledgements The PhD thesis is a road with a lot of twists and turns that is impossible to
complete without the input of many people that are all important in their different and
unique way So at this part of the thesis I would like to thank everyone that was there
for me all these years and gave me the strength and support I needed to reach the end
of the road
First of all I would like to thank my promotor and main supervisor prof dr Leo
FM Marcelis for his patience understanding and the fact that he never gave up hope
on my thesis even when the direction was not clear for me Although we did not
always agree I want you to know that I appreciate and always will be grateful for all
your efforts during these years
I would also like to thank my co-promotor prof dr Olaf van Kooten for being a
source of constant support Meetings with you however brief always made me feel
confident with my research and ready to solve any problems ahead
I would like to thank my daily supervisor dr Pieter de Visser foremost for being
the first to teach me about modelling and the fun it can be I much enjoyed all
discussions with you
To my former roommates Bram Julienne Didi Fleur Roberta Andreas and
Pavlos thanks for creating a playground environment for me to work into To Didi
special thanks for all the conversations especially the non scientific ones as they
helped me to relax and go back to work with more energy
I would like to thank my good friend and colleague Gerhard Buck-Sorlin who with
his constant support and faith in my helped me a lot at the final stages of this thesis
Gerhard our talks were literately out of this earth
To all current and former members of the Greenhouse Horticulture thank you for
making me feel like home while at work Time spent with you was always
stimulating Anja thank you for all the good advise you gave me during the years
Steven the collaboration with you was more than productive it was fun To current
and former colleagues of Horticulture Supply Chains Group thank you for the nice
times I had with you at all the outings together I especially appreciated the challenges
to give or attending presentations in your group Also to the members of the FLOP
meeting thank you for all the nice conversations and the good and creative criticism
Acknowledgments
138
on all my writing efforts To the members of the VPN group a big thank you for the
initiating me to the fun of 3D modelling although I did not manage to participate as
much I wanted
To all people that helped me with my experiments during the years I would like to
say a big thank you Especially to Esther that showed me the importance of being
methodical to Johan and Dick from whom I learned a lot about dutch culture and
some not always polite dutch words
I would also like to thank all the numerous friends I made in Wageningen for
making my stay here more pleasant In particular I would like to thank Dimitrios for
introducing me to everyone to Pavlos and Andreas for creating a greek buble inside
the office Niovi and Ioannis for their frendship Yiannis thank you for all those
escapes from the PhD reality when I most needed it and for your constant
encouragement and good advice
Last but not least I would like to thank my parents and brother for never
questioning always trusting always hoping always supporting Thank you for
making me what I am in life today I would have never made it without you
Curriculum vitae
139
Curriculum vitae Vaia Sarlikioti was born on 19th of May 1981 in Amarousio Attikis Greece She
attended secondary school at the 1st Lyceum in Palaio Phaliro where she received her
diploma in 1999 At the same year she started her studies in University of Thessaly
School of Agricultural Sciences Department of Agriculture Crop Production and
Rural Environment where she obtained her Bachelor degree in 2004 and graduating
first of her year In 2004 she started her Msc studies in the Master program of
Agricultural Engineering and Management of Natural Resources were she graduated
in 2006 In May 2006 she started her PhD project in Wageningen University the
Netherlands after receiving a scholarship from the Greek Scholarships Foundation
that focused on modelling and monitoring of canopy light interception and plant stress
in greenhouse crops The project was executed at the institute Wageningen UR
Greenhouse Horticulture and at the Horticultural Supply Chains group of Wageningen
University Since April 2011 Vaia works as a post-doc in INRA Avignon France
List of publications
140
List of publications
Peer-reviewed publications
Buck-Sorlin G de Visser PHB Henke M Sarlikioti V van der Heijden GWAM
Marcelis LFM Vos J 2011 Towards a functional-structural plant model of
cut-rose - simulation of light environment light absorption photosynthesis
and interferences with the plant structure Annals of Botany in press
Sarlikioti V de Visser PHB Buck-Sorlin GH Marcelis LFM How plant
architecture affects light absorption and photosynthesis in tomato Towards an
ideotype for plant architecture using a functional-structural plant model
Submitted (Chapter 23)
Sarlikioti V de Visser PHB Marcelis LFM 2011 Exploring the spatial
distribution of light interception and photosynthesis of canopies by means of a
functional-structural plant model Annals of Botany 107875-883 (Chapter
22)
Sarlikioti V Meinen E Marcelis LFM 2011 Crop reflectance as a tool for
the online monitoring of LAI and PAR interception in two different
greenhouse crops Biosystems Engineering 108 113-120 (Chapter 31)
Sarlikioti V Driever SM Marcelis LFM 2010 Photochemical reflectance
index as a mean of monitoring early water stress Annals of Applied Biology
157 81-89 (Chapter 32)
Conference proceeding and reports
Sarlikioti V de Visser PHB Marcelis LFM 2011 Towards a 3D structural
tomato model for calculating light interception Acta Horticulturae 893721-
728 (Chapter 21)
Janssen HJJ Sarlikioti V Gieling ThH Meurs EJJ Marcelis LFM Van
Dugteren JR 2008 A prototype sensor for estimating light interception by
plants in a greenhouse Acta Horticulturae 801 621-627
Dueck TA Nederhoff EM Nieboer S Scheffers CP Steenhuizen JW
Chizhmak S Uenk D Sarlikioti V de Visser PHB 2010 Verbetering van
List of Publications
141
de lichtonderschepping in een tomatengewas door aanpassing van de rijstructuur
Effecten van de rijstructuur op lichtverdeling fotosynthese en productie 44pp
Rapport GTB-1029 Wageningen UR
PEampRC PhD Education Certificate
With the educational activities listed below the PhD candidate has complied with the educational requirements set by the CT de Wit Graduate School for Production Ecology and Resource Conservation (PEampRC) which comprises of a minimum total of 32 ECTS (= 22 weeks of activities)
Review of literature (45 ECTS)
- Modelling and remote sensing of canopy light interception and plant stress in greenhouses
Writing of project proposal (45 ECTS)
- Modelling and remote sensing of canopy light interception and plant stress in greenhouses
Post-graduate courses (6 ECTS)
- Basic and advanced statistics PEampRC (2007-2008) - The art of modelling PEampRC (2008)
Invited review of (unpublished) journal (2 ECTS)
- Annals of botany 3D modelling (2010) - Journal of horticultural science photosynthesis and biomass production (2011)
Deficiency refresh brush-up courses (105 ECTS)
- Greenhouse technology (2008) - Crop ecology (2009)
Competence strengthening skills courses (3 ECTS)
- The art of writing WGS (2007) - Techniques of writing and presenting a scientific paper WGS (2007)
PEampRC Annual meetings seminars and the PEampRC weekend (18 ECTS) - PEampRC Weekend (2008) - PEampRC Day (2007) - PEampRC Day (2008) - PEampRC Day (2009)
Discussion groups local seminars other scientific meetings (6 ECTS) - Frontier Literature in Plant Physiology (FLOP)
International symposia workshops and conferences (75 ECTS) - Hortimodel Wageningen the Netherlands (2006) - Greensys Quebec Canada (2009) - Greensys Halkidiki Greece
Funding Vaia Sarlikioti received a grant from the Greek State Scholarship Foundation for
conducting the research described in this thesis Additionally the research was
supported by Powerhouse
Financial support for the printing of this thesis by Wageningen Univerisity is
gratefully acknowledged
- Chapter 1
- General Introduction
- Chapter 2 Modelling PAR interception and photosynthesis
-
- Chapter 21
- Towards a 3D structural tomato model for calculating light interception
- Chapter 22
- Exploring the spatial distribution of canopy light interception and leaf photosynthesis by means of a functional structural model
- Chapter 23
- Searching for the ideal plant structure with a functional-structural plant model How plant architecture affects light absorption and photosynthesis in tomato
-
- Abstract
- Introduction
- Material and methods
- Model description
- Architectural module
- Photosynthesis module
- Case studies
- Vertical light distribution scenario
- Leaf elevation angle
- Leaf phyllotaxis
- Leaflet angle
- Leaf shape
- Leaflet arrangement on a leaf
- Internode length
- Ideotyping scenarios
- Results
- Vertical light distribution scenario
- Leaf elevation angle
- Leaf phyllotaxis
- Leaflet angle
- Leaf shape
- Leaflet arrangement
- Internode length
- Ideotyping scenarios
- Discussion
- Chapter 3 Monitoring PAR interception and photosynthetic stress
-
- Chapter 31
- Crop Reflectance as a Tool for Online Monitoring Of LAI and PAR Interception in Two Different Greenhouse Crops
- Chapter 32
- Photochemical reflectance index as a mean of monitoring early photosynthetic stress
-
- Chapter 4
- General discussion
- References
- Summary
- Samenvatting
- Περίληψη
- Acknowledgements
- Curriculum vitae
- List of publications
- PEampRC PhD Education Certificate
-
- PEampRC Annual meetings seminars and the PEampRC weekend (18 ECTS)
- Discussion groups local seminars other scientific meetings (6 ECTS)
- International symposia workshops and conferences (75 ECTS)
-