Modeling Urea-Water Solution Droplet Evaporation · Modeling Urea-Water Solution Droplet...
18
Emiss. Control Sci. Technol. (2015) 1:80–97 DOI 10.1007/s40825-014-0006-3 Modeling Urea-Water Solution Droplet Evaporation Douglas T. Ryddner · Mario F. Trujillo Received: 2 September 2014 / Accepted: 1 December 2014 / Published online: 16 January 2015 © Springer SIP, AG 2015 Abstract A computational solver has been developed for the calculation of urea-water-solution (UWS) droplet vaporization. It is based on the solution of the mass den- sity, chemical species transport, and energy within the droplet, and it is fully coupled to the jump conditions for species and energy transport at the droplet interface, and the phase-equilibrium conditions. Pressure-volume- temperature relationships and fugacities are predicted using the Peng-Robinson equation of state. The numerical code is validated by testing its ability to resolve the dynamics of internal species and temperature fields during phase change, predict phase equilibrium for UWS and hydrocarbon sys- tems, and predict vaporization for C 7 H 16 ,C 7 H 16 /C 10 H 22 , and UWS droplets. Results show that UWS droplet vapor- ization can be divided into three different phases consisting of (i) temperature rise at nearly constant composition, (ii) overall urea enrichment at nearly constant temperature, and (iii) simultaneous overall heating and urea enrichment of the entire droplet. The third phase is typically characterized by solidification of the gas-liquid interface, producing a urea shell, a state that can potentially lead to micro-explosions. Higher ambient temperatures are shown to promote urea solidification more readily than lower temperatures to the decreasing role of liquid species diffusion with increasing temperature. Keywords Urea · UWS · Droplet vaporization D. T. Ryddner · M. F. Trujillo () Department of Mechanical Engineering, University of Wisconsin, Madison, WI 53706, USA e-mail: [email protected] Nomenclature Normal symbols are used for scalars and boldfaced symbols for vectors Symbol Description A Peng-Robinson parameter a m Peng-Robinson parameter b m Peng-Robinson parameter B Nu Nusselt number parameter b Computational cell displacement rate D ab Liquid diffusion between species D i Initial diameter D wire Diameter of wire f Fugacity H f Change in enthalpy L Length L vap Latent heat of vaporization M Molar mass N sp Number of species N cells Number of cells in domain Pr Prandtl number ˙ R s Droplet surface regression rate R Specific gas constant Sc Schmidt number S Surface area t Time U Thermal expansion velocity v Specific volume
Transcript of Modeling Urea-Water Solution Droplet Evaporation · Modeling Urea-Water Solution Droplet...

Emiss. Control Sci. Technol. (2015) 1:80–97DOI 10.1007/s40825-014-0006-3
Modeling Urea-Water Solution Droplet Evaporation
Douglas T. Ryddner · Mario F. Trujillo
Received: 2 September 2014 / Accepted: 1 December 2014 / Published online: 16 January 2015© Springer SIP, AG 2015
Abstract A computational solver has been developedfor the calculation of urea-water-solution (UWS) dropletvaporization. It is based on the solution of the mass den-sity, chemical species transport, and energy within thedroplet, and it is fully coupled to the jump conditionsfor species and energy transport at the droplet interface,and the phase-equilibrium conditions. Pressure-volume-temperature relationships and fugacities are predicted usingthe Peng-Robinson equation of state. The numerical codeis validated by testing its ability to resolve the dynamics ofinternal species and temperature fields during phase change,predict phase equilibrium for UWS and hydrocarbon sys-tems, and predict vaporization for C7H16, C7H16/C10H22,and UWS droplets. Results show that UWS droplet vapor-ization can be divided into three different phases consistingof (i) temperature rise at nearly constant composition, (ii)overall urea enrichment at nearly constant temperature, and(iii) simultaneous overall heating and urea enrichment of theentire droplet. The third phase is typically characterized bysolidification of the gas-liquid interface, producing a ureashell, a state that can potentially lead to micro-explosions.Higher ambient temperatures are shown to promote ureasolidification more readily than lower temperatures to thedecreasing role of liquid species diffusion with increasingtemperature.
Keywords Urea · UWS · Droplet vaporization
D. T. Ryddner · M. F. Trujillo (�)Department of Mechanical Engineering, University of Wisconsin,Madison, WI 53706, USAe-mail: [email protected]
Nomenclature
Normal symbols are used for scalars and boldfaced symbolsfor vectors
Symbol Description
A Peng-Robinson parameter
am Peng-Robinson parameter
bm Peng-Robinson parameter
BNu Nusselt number parameter
b Computational cell displacementrate
Dab Liquid diffusion between speciesDi Initial diameterDwire Diameter of wiref Fugacity�Hf Change in enthalpyL LengthLvap Latent heat of vaporizationM Molar massNsp Number of speciesNcells Number of cells in domainPr Prandtl numberRs Droplet surface regression rateR Specific gas constant
Sc Schmidt number
S Surface area
t Time
U Thermal expansion velocity
v Specific volume
Emiss. Control Sci. Technol. (2015) 1:80–97 81
dX(t)dt
Rate of change of position
Z Compressiblity = PvRT
aj Peng-Robinson parameterB Peng-Robinson parameterBSh,a Sherwood number parameter for
species abj Peng-Robinson parameterCp Specific heat of mixtureD DiameterDdrop Diameter of experimental dropleter Radial unit vectorHα Enthalpyk Thermal conductivityLf us Latent heat of fusionLe Lewis numberm Peng-Robinson function of ω
Nu Nusselt numberP PressureQ Heat of reactionRuniv Gas constantSh Sherwood numberT Temperatureu Local fluid velocity that results
directly from thermal expansionV VolumeX Mole fractionY Mass fraction
Greek Symbols
Symbol Descriptionα Thermal diffusivityν Kinematic viscosityτ Stress tensorτdiff Species diffusion time scaleφ Peng-Robinson function of fugacityχ Variable from Abramzon and Sirig-
nano [1]j Computational cellω Acentric factorκ Notation for shorthand governing
equations, Table 1λ Notation from Kucera and Hill [24]ρ DensityτCIS Change in slope timeτvap Vaporization time scaleϕ Notation for shorthand governing
equations, Table 1� Notation for shorthand governing
equations, Table 1∂j Surface of computational cell
Sub/Superscripts
Symbol Descriptiona Species acrit Critical propertyg Gasl Liquidmod Modified equationr Reduced value, i.e., T/Tcrit
sat Value at saturation pressurespecies Equation governed by species valuesurea Ureaair Aireff Effective propertyH2O Watermix Corresponding to a mixturepartial Partial pressures Value at the gas-liquid interfacesol Solidthermal Corresponding to thermal properties∞ Properties at infinity
1 Introduction
With ever-tightening pollutant emission regulations [20], acommon procedure for removing one of the major com-ponents of diesel engine emissions, namely nitric oxides(NOx), is urea-water-solution (UWS)-based selective cat-alytic reduction (SCR) [4, 20, 38]. In this method, the UWSspray droplets are exposed to the combustion exhaust streamand are subsequently vaporized producing ammonia (NH3)and isocyanic acid (HNCO) through a thermolysis reaction[32]. It is the NH3 which serves as a reducing agent to trans-form NOx into N2 on the catalyst. Schaber et al. [32] alsomentions other reactions which occur within the desiredtemperature regime as well, including creation of undesir-able chemical compounds; biuret, cyanuric acid, ammelide,and ammeline complexes. One of the strongest benefits ofthis procedure is the safe storage of NH3 within the UWS.Due to their potential, UWS and urea have been the subjectof extensive research [5, 14, 15, 27, 32, 39] with regards to
Table 1 Variables for the generalized conservation law
Equations κ ϕ �
Mass 1 1 0
Species 1 Ya ρDab∇Ya
Energy cp T k∇T

82 Emiss. Control Sci. Technol. (2015) 1:80–97
physical characteristics, chemical decomposition pathways,evaporation time, and gas phase properties.
In conjunction with the aforementioned experimentalstudies, a number of computational efforts have also beenpresented [2, 3, 7, 11, 21, 25, 26, 35], particularly in thelast few years. One common topic of investigation is thechoice between depletion models, which includes a vapor-ization treatment for both urea and water, and a vaporiza-tion treatment for water followed by direct thermolysis ofurea. It has been shown, in the work of Abu-Ramadan et al.[3], that the vaporization approach generates more accuratepredictions. Furthermore, the treatment of direct thermol-ysis from the aqueous state into the gas phase has beencriticized by Lundstrom et al. [25] as predicting droplettemperatures that were excessively high. More evidencefavoring the vaporization route has also been presented bythe experiments of Bernhard et al. [5], where they advo-cate the consideration of gaseous urea in computationalmodels.
A common view adopted in many of the modeling effortsdescribes the gasification of urea from UWS droplets asoccurring in two phases, as documented by Kim et al.[21]. In the first phase, water is completely vaporizedfrom the droplet in a process that ignores the presenceof urea. Once the water has been vaporized, the secondphase considers the gasification of urea, which takes placeas low as 406 K according to data from Bernhard et al.[5] and Emel’yanenko et al. [14]. This physical picture isadopted in the work of Birkhold et al. [7], Strom et al.[35], Munnannur and Liu [26], Ebrahimian et al. [11], andLundstrom et al. [25]. In a recent publication, Abu-Ramadan et al. [3] raises questions regarding the validity ofthis interpretation; the authors provide a compelling phys-ical explanation of the gradual enrichment of urea at thegas-liquid interface as water vaporizes preferentially, dueto its lower boiling point. Eventually, this leads to precipi-tation of urea at the gas-liquid interface, which essentiallytraps a fraction of the water inside the droplet. This resultsin a subsequent increase in the surface temperature of thedroplet in combination with vaporization of urea. Hence, thewater is not fully vaporized prior to the initiation of ureagasification.
Associated with the notion of a complete water vapor-ization phase followed by a gasification of urea, Birkholdet al. [7] presented some insightful results contrasting thevaporization behavior between the diffusion-limited (DL)model and the rapid-mixing (RM) model. These approacheshad been presented earlier, but within the context of mul-ticomponent droplet vaporization aimed at hydrocarbonmixtures, as elaborated by Sirignano [33]. Birkhold et al.[7] conclude that both of these models give predictionsthat are very similar to each other, especially with regards
to D2 (t) histories, but since the RM model is signifi-cantly computationally cheaper, their results provide anattractive reason for adopting it. Unfortunately, the RMmodel is essentially an infinite diffusivity assumption,and as such is incapable of predicting the preferentialconcentration of urea at the gas-liquid interface. As animportant consequence, it cannot predict the entrapment ofwater caused by the precipitation of urea at the dropletsurface. Furthermore, the discrepancy between models isonly negligible while water is still actively vaporizingfrom the interface. As soon as the urea shell is formed, thediscrepancy becomes significant.
In the present effort, we adopt a multicomponent treat-ment of the UWS droplet, where both urea and waterare resolved within the droplet. This treatment is thencoupled to the jump conditions for species and energy at thegas-liquid interface, and to a set of vapor-liquid equilibriumrelations for each of the chemical species. Results fromthe calculations clearly show the evolution of the massfraction profiles at each radial location, leading to a com-plete enrichment of urea at the gas-liquid interface, whichis also seen by Abu-Ramadan et al. [3]. Predictions fromour calculations agree well with single species dropletvaporization studies of C7H16 from Nomura et al. [28],the multicomponent fuel droplet results from Daif et al.[10], and experimental data of UWS droplet vaporizationfrom Wang et al. [39]. This work then explores the phys-ical processes that can lead to micro-explosions inside thedroplet.
Though the nature of this work bears similarities withthe previous work on UWS vaporization, including workof Abu-Ramadan et al. [3], Ebrahimian et al. [11], andLundstrom et al. [25], notable improvements and addi-tions are included. Explicitly, these are as follows: (i)the evolution of the thermodynamic state of the dropletis presented as a spatially dependent quantity within theurea-water phase diagram, (ii) the numerical algorithmsolves the entire interfacial system simultaneously (jumpconditions and phase equilibrium) fully coupled to the cor-responding droplet internal numerical solution, (iii) themulticomponent system is described by the Peng-Robinsonequation of state, providing solutions for the phase equilib-rium conditions, as well as predicting the pressure-volume-temperature (PVT) relations, (iv) the surface solidificationof urea is tracked for the droplet lifetime, and (v) theeffect of internal mixing resulting from aerodynamic drag isstudied.
In the following subsections, the relevant governingequations are presented along with the equation of state,and the thermophysical properties. The interfacial con-straints, which include the jump conditions and phaseequilibrium relations are described. This is followed by
Emiss. Control Sci. Technol. (2015) 1:80–97 83
a description of the numerical algorithm, which is subse-quently verified against analytical results. Validation of thecode is presented for UWS phase-equilibrium calculations,C7H16 droplet vaporization, and C7H16/C10H22 bi-component droplet vaporization. Finally, the UWS dropletvaporization computations are contrasted with experi-mental findings from Wang et al. [39]. This leads into ananalysis of the evolution of thermodynamic states withinthe droplet. The main findings are then summarized in theconclusion.
2 Governing Equations
The following conservation equations for mass, species, andenergy for a multicomponent liquid mixture [6] apply withinthe droplet:
∂ρ
∂t+ ∇ · (ρu) = 0, (1a)
∂ (ρYa)
∂t+ ∇ · (ρYau) = ∇ · (ρDab∇Ya) , (1b)
ρCp
DT
Dt= ∂(lnυ)
∂(lnT )
∣∣∣∣P,Ya
DP
Dt+ τ : ∇u
+∇ · (k∇T )
+Nsp∑
a=1
(ρDab∇Ya) · ∇Hα. (1c)
Additionally, the following constraints are enforced in eitherthe liquid or gas phase
Nsp∑
a=1
Xg,la = 1 and
Nsp∑
a=1
Yg,la = 1, (2)
where the relation between mass and molar fractions is
Ya = MaXa∑Nsp
i=1 MiXi
. (3)
The contribution of the viscous dissipation term can beconsidered to be negligible in the energy equation. TheLagrangian derivative for pressure is negligible as well,as the droplet considered experiences no external forces.Additionally, earlier computations for the type of systemsconsidered here, i.e., UWS, showed that the enthalpy diffu-sion term can also be neglected. With these simplificationsand rewriting, the left-hand side of the energy equation inconservative form yields
Cp
[∂(ρT )
∂t+ ∇ · (ρuT )
]
= ∇ · (kl∇T ). (4)
A spherically symmetric system is employed in our work,where the effects of internal liquid mixing are incorporated
with the effective species and heat diffusion models of[1, 33]:
Dab,eff = (χspecies)Dab, (5a)
kleff = (χthermal)k
l, where (5b)
χspecies = 1.86 + 0.86 tanh
(
2.225log10
(RelSc
30
))
, and (5c)
χthermal = 1.86 + 0.86 tanh
(
2.225log10
(RelP r
30
))
. (5d)
The non-dimensional quantities are given by,
Rel = 2Rsu
ν, Sc = ν
Dab
, and Pr = ν
α. (6)
This transforms the previous form of the governing equa-tions to the following set
∂ρ
∂t+ ∇ · (ρu) = 0, (7a)
∂ (ρYa)
∂t+ ∇ · (ρYau) = ∇ · (
ρDab,eff ∇Ya
)
, (7b)
Cp
[∂(ρT )
∂t+ ∇ · (ρT u)
]
= ∇ · (kleff ∇T ). (7c)
This is the group of equations that is subsequently dis-cretized and solved in the present work. The advection termis kept in the solution procedure, since it accounts for ther-mal expansion. This effect is noticeable in the initial thermaltransient when the droplet is undergoing significant heating.
2.1 Peng-Robinson Equation of State
The Peng-Robinson equation of state (PR-EOS) isemployed [29] in the present work to predict pressure-volume-temperature (PVT) relationships for both gas andliquid phases, and to predict fugacities needed for phaseequilibrium calculations. The PR-EOS is chosen due toits favorable balance between computational simplicity andaccuracy [19, 41]. Its behavior for our particular problem istested in Section 4.2. The cubic form of the Peng-RobinsonEOS is given in terms of the compressibility factor (Z =Pυ/(RT )) as [22, 37]
Z3−(1 − B) Z2+(
A − 3B2 − 2B)
Z−(
AB − B2 − B3)
= 0, (8)
where A, B, and all other relevant PR-EOS variables aredefined in Appendix A. Densities are directly calculatedfrom Z. Phase equilibrium is calculated by equating liquidand gas fugacities, where the fugacity for either gas or liquidis given respectively as
fga = φ
gaPX
ga,s, or f l
a = φlaPXl
a,s, (9)

84 Emiss. Control Sci. Technol. (2015) 1:80–97
for some chemical species a. The associated fugacity coef-ficient, for instance the liquid one, is defined as
ln(
φla
)
= ba
blm
(
Zl − 1)
− log(
Zl − Bl)
−(
Al
2√
2Bl
)
⎛
⎝
Nsp∑
j=1
Nsp∑
k=1
2Xlm,j
(
1 − kjk
)
(√ajak
alm,
− bj
blm,
)⎞
⎠
log
⎛
⎝
Zl +(√
2 + 1)
Bl
Zl −(√
2 − 1)
Bl
⎞
⎠ . (10)
The same expression holds for the gas phase fugacitycoefficient with the gas quantities substituted in place of theliquid ones.
2.2 Interfacial Constraints
The equations solved at the droplet surface form a set of sixcoupled, nonlinear equations, namely three for the phaseequilibrium conditions for urea, water, and air, one forthe energy-jump condition, and two for the species jumpcondition for urea and water. The equations are:
φgureaX
gurea,sP = φl
ureaXlurea,sP , (11a)
φgH2O
XgH2O,sP = φl
H2OXl
H2O,sP, (11b)
φgair
(
1 − XgH2O,s − X
gurea,s
)
P = φlair
(
1 − XlH2O,s − Xl
urea,s
)
P, (11c)
ρl(
Rs − Us
)
Lvap,mix =[
klmix
dT
dr
]l
r=Rs
− Nu
2Rs
kgmix (Ts − T∞) , (11d)
ρls
(
Ygurea,s − Y l
urea,s
) (
Rs − Us
) = −(
ρgs D
gurea,air
Sh
2Rs
(
Ygurea,∞ − Y
gurea,s
) − ρlsD
lurea,H20
dYs,urea
dr
∣∣∣∣
l
r=Rs
)
, (11e)
ρls
(
YgH2O,s − Y l
H2O,s
) (
Rs − Us
) = −(
ρgs D
gH2O,air
Sh
2Rs
(
YgH2O,∞ − Y
gH2O,s
)
− ρlsD
lurea,H20
dYs,H2O
dr
∣∣∣∣
l
r=Rs
)
, (11f)
where pressure cancels in the phase equilibrium relations,and the gradients from the gas-side of the interface havebeen expressed using
∂T
∂r
]g
r=Rs
= Nu
2Rs
kgmix (Ts − T∞) , (12a)
ρgs D
gab
∂Ya
∂r
∣∣∣∣
g
r=Rs
= ρgs D
gab
Sh
2Rs
(
Yg∞,a − Y
gs,a
)
. (12b)
The Nusselt and Sherwood numbers are given by,
Nu = 2log (1 + BNu)
BNu
, and Sha = 2log(
1 + BSh,a
)
BSh,a
,
(13)
where [33]
BNu = Cp (T∞ − Ts)
Leff
, and BSh,a = Yga
1 − Yga
.
(14)
The property values in the above non-dimensional numbers,which correspond to the gas phase, are calculated at thetemperature and species mass fraction corresponding to thearithmetic mean rule,
T g = Ts + Ar (T∞ − Ts) , Y g = Ys + Ar (Y∞ − Ys) ,
(15)
where Ar is either 1/2 or 1/3 [9]. In the calculations pre-sented here, we employ Ar = 1/3.
The resulting system (11a–f) introduces ten unknowns,namely,
[
Ts, Rs , Xls,H2O, X
gs,H2O, Xl
s,urea, Xgs,urea, X
ls,air , X
gs,air , ρ
ls , ρ
gs
]
.
(16)
The PR-EOS, (8), provides a solution for the liquid and gasphase density, reducing the unknowns to eight. The con-servation of species from Eq. 2 provides two additionalconstraints, Xl,g
air = 1−Xl,gH2O
− Xl,gurea , for gas and liquid,
reducing the unknowns to
[
Ts, Xls,H2O
, Xgs,H2O
, Xls,urea, X
gs,urea, Rs
]
. (17)
At the center of the droplet (r = 0), both radial derivativesof temperature and species mass fraction are set to zero.
2.3 Modifications to the Latent Heat of Vaporization
Due to the short time lapse between urea vaporization[5] and decomposition [32] into NH3 and HNCO, andthe fact that the decomposition represents an endothermicprocess, we model both of these process as taking place

Emiss. Control Sci. Technol. (2015) 1:80–97 85
simultaneously. This implies that in the gasification treat-ment, a modified latent heat is employed, which is given by
Lvap,urea,mod = Qdecomposition + Lvap,urea. (18)
The enthalpy of decomposition, Qdecomposition, correspondsto the following reaction
[CH4N2O]g → [NH3 + HNCO]g (endothermic) , (19)
and is calculated from
Qdecomposition = [
�Hf,urea + Cp,urea�T]
− [
�Hf,NH3 + Cp,NH3�T
+ �Hf,HNCO + Cp,HNCO�T]
. (20)
This relation represents the difference between heat of theproducts and reactants. �Hf,a pertains to the heat of for-mation for chemical species a, and �T = Ts − To, whereTo = 297 K is a reference temperature. A method simi-lar to this is implemented by both Birkhold et al. [7] andStrom et al. [35]. We also note that applying the endother-mic process of decomposition to the latent heat of vapor-ization simulates the process of the decomposition reactiontaking energy out of the system in the boundary layer of thedroplet.
2.4 Modeling the Solidification Front of Urea
UWS droplet vaporization experiments by Kontin et al. [23],Musa et al. [27], and Wang et al. [39] provide evidence forthe solidifying urea on the surface of the droplet. This studytakes the solidification of urea into account while numeri-cally calculating the vaporization of the droplet. The processis modeled by changing the physical properties of a liquidmixture to one corresponding to a liquid-solid mixture, con-sistent with the urea-solidification region (see Fig. 9 andsurrounding text, as well as Appendix B). The correspond-ing computational cell-averaged physical properties, whichare the ones needed in the solution of governing equations,are obtained from the lever rule [13].
3 Numerical Solution
The conservation Eqs. 7a, 7b, and 7c can be written in thefollowing general form
∂(ρϕ)
∂t+ ∇ · (ρϕu) = 1
κ∇ · �, (21)
where the dependent variables are given in Table 1. Inte-gration of this general conservation law over an arbitrarycomputational cell, (j ) gives∫
j
∂(ρϕ)
∂tdV +
∫
∂j
ρϕu · ndS =∫
j
1
κ∇ · �dV. (22)
The numerical solution is based on a combinationof finite volume discretization combined with Arbitrary-Lagrangian-Eulerian procedure for treating the unsteadyand advection terms [36]. Following this procedure, wedefine an arbitrary velocity field (spherically symmetric) as
b(r, t) =(
r
Rs
)
Rser . (23)
The Lagrangian derivative following b is then given by
D
Dt
∣∣∣∣b
(∫
j
ρϕdV
)
=∫
j
∂(ρϕ)
∂tdV +
∫
∂j
ρϕb · ndS.
(24)
With the help of this relation, we can rewrite (22) as
D
Dt
∣∣∣∣b
(∫
j
ρϕdV
)
+∫
∂j
ρϕ(u − b) · ndS =∫
j
1
κ∇ · �dV,
(25)
or in discretized form as
(ρϕV )n+1j − (ρϕV )nj
�t= {ρϕ(b − u)S}
∣∣∣j+1/2,n
j−1/2,n
+ 1
κ{�S}
∣∣∣∣
j+1/2,n
j−1/2,n
, (26)
where V nj is defined as
V nj =
[
r3j+1/2 − r3
j−1/2
3
]n
. (27)
Here, an explicit Euler time stepping scheme has beenemployed with time level being indicated by n. The com-putational cell index is j ∈ (0, Ncells) and correspondsto the cell center. Indices (j + 1/2) or (j − 1/2) cor-respond to cell faces (Fig. 1). Additionally, an arithmeticmean value for (1/κ) is performed to reduce the diffu-sion flux term to the presented discretized form. FromEq. 26, the explicit expressions for density, mass fraction,and temperature become:
ρn+1j = V n
j
V nj+1
ρnj + �t
V nj+1
{ρ(b − u)S}∣∣∣j+1/2,n
j−1/2,n , (28a)
Yn+1j,a = (ρYaV )nj
(ρV )n+1j
+ �t
(ρV )n+1j
(
{ρYa(b − u)S}∣∣∣
j+1/2,n
j−1/2,n
+ 1
κ{(ρDab∇Ya)S}
∣∣∣
j+1/2,n
j−1/2,n
)
, (28b)
T n+1j = (ρT V )nj
(ρV )n+1j
+ �t
(ρV )n+1j
(
{ρT (b − u)S}∣∣∣
j+1/2,n
j−1/2,n
+ 1
κ{(k∇T )S}
∣∣∣
j+1/2,n
j−1/2,n
)
. (28c)

86 Emiss. Control Sci. Technol. (2015) 1:80–97
Fig. 1 Graphical representationof the arrangement of variableswithin the spherically symmetricgrid. Temperature, species massfraction, and density arecell-centered, and grid nodedisplacement and flow velocityare defined at the faces
The resulting algorithm employed in the calculations canbe summarized as follows:
I. Velocity field is initialized uniformly to zero. Theurea and water mass fraction are also uniformly setto their eutectic values, namely Yurea = 0.325 andYH20 = 0.675. Within the droplet, the temperaturehas a constant value equal to 300 K and the pressureis set to 1 atm. The PR-EOS is employed to calcu-late the density field. All thermophysical quantities arecalculated.
II. The interfacial system described by Eqs. 11a–f is com-puted resulting in new values for surface temperatureand chemical compositions on both the liquid andgas side of the interface, as well as a new surfaceregression rate, Rs .
III. Based on the calculated Rs , the flow field b(r, t) (23)is updated to calculate V n+1
j (27).IV. Mass density iteration
a. Density field is calculated based on the PR-EOS,namely ρn+1
j = PR − EOS(Yn+1j,a , T n+1
j,a , P ).1
Using the mass density (28a) and this computedvalue for ρn+1
j , the flow field uj±1/2 is calculated,where u1/2 = 0.
b. Compute Yn+1j,a from Eq. 28b.
c. Compute T n+1j from Eq. 28c.
d. Check whether the maximum fractional change indensity between successive iterations and corre-sponding to all computational cells exceeds 10−10.If it does return to (a). Otherwise, exit mass den-sity iteration loop.
V. If the calculation has completed the required numberof time iterations, exit. Otherwise, return to II above.
1In the first iteration ρn+1j = PR − EOS
(
Ynj,a, T
nj,a, P
)
The computations take approximately 0.09 s per time step,and the maximum number of time steps used is around 0.5million for the entire droplet vaporization (this algorithmis not presently optimized for speed). Due to the explicit-ness of the scheme, time step size is modified to remainstable with respect to diffusion discretization and the CFLcondition.
4 Results
Prior to the calculations of UWS droplet gasification,the various aspects of the solver are systematically testedand presented in the following sections. First, the solu-tion pertaining to the internal fields is tested againstanalytical solutions in Section 4.1. This is followedby an assessment of phase equilibrium predictions inSection 4.2. Validation for droplet vaporization predic-tions are presented for single liquid species (C7H16) andbinary liquid species systems in Sections 4.3 and 4.4,respectively.
4.1 Phase Change and Heat Transfer Validation
To evaluate the internal solution methodology, a compari-son is made against two heat transfer problems with phasechange [24]. The first problem consists of a planar 1D sys-tem in a domain −∞ < z ≤ L, where a solid mediumexists at some uniform initial temperature Ti . Immediatelyafter t = 0, the temperature at z = L, i.e., T (L, t > 0) is setequal to Ta , where Ta is greater than the fusion temperature(Tf us). This produces a liquid region, where the liquid-solid interface is tracked by X(t). For the second problem,a spherically symmetric domain is considered, 0 ≤ z ≤ L,where again a solid medium exists at a uniform tempera-ture Ti . At t+ = 0, T (L, t > 0) = Ta and the melt layer
Emiss. Control Sci. Technol. (2015) 1:80–97 87
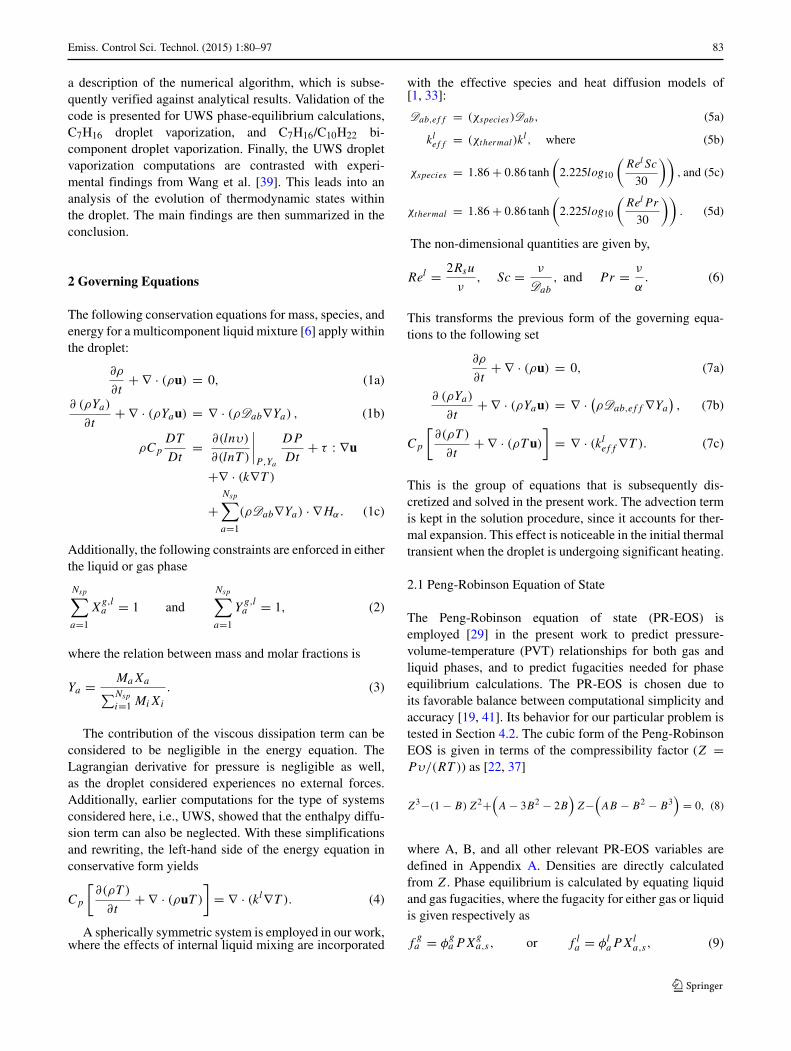
Fig. 2 Comparison oftemperature predictions againstanalytical solutions from Kuceraand Hill [24] corresponding tothe a planar case (t = 2.2×10⁻⁵
s) and b spherical case(t = 1.45 × 10⁻⁵ s)
propagates inwardly. The governing equations for bothproblems are given by
∂T
∂t= kl
ρC
(
∂2T
∂z2+ λ
z
∂T
∂z
)
for X(t) ≤ z < L (liquid) (29a)
∂T
∂t= ksol
ρC
(
∂2T
∂z2+ λ
z
∂T
∂z
)
for z ≤ X(t)(solid). (29b)
For the Cartesian and Spherical systems, λ = 0 or λ = 2,respectively. These partial differential equations are coupledto the energy jump condition,(
kl ∂T
∂z
∣∣∣∣(X(t),t)
− ksol ∂T
∂z
∣∣∣∣(X(t),t)
)
= ρLf us
dX(t)
dt. (30)
Both density and specific heats are the same in both liq-uid and solid regions. Conductivity is the only property thatvaries.
Analytical solutions for the planar and spherical systemsare described in detail by Kucera and Hill [24], and due totheir elaborate form are not reproduced here. The compar-isons between the predictions of our numerical system andthese analytical solutions are shown in Fig. 2 for both Carte-sian and Spherical systems. In our numerical predictions,we extend the numerical discretization of the temperaturefield on both sides of the interface using the same schemepresented in Section 3. In these calculations, the followingquantities are used: Ta = 1100 K, Tf us = 406 K, Ti = 373 K,
ρ = 1320 kg/m3, and C = 1450 J/kg-K. For the planarcase ksol = 0.28 W/m-K, kl = 0.33 W/m-K, and Lf us =2.31×10⁵ J/kg are used; while for the spherical case ksol =kl = 1.0 W/m-K, and Lf us = 1 × 10³ J/kg. As shown inFig. 2, good agreement is achieved between the numericaland analytical solutions. Furthermore, the discontinuity inthe gradient of temperature at the interface is well capturedby the present numerical method.
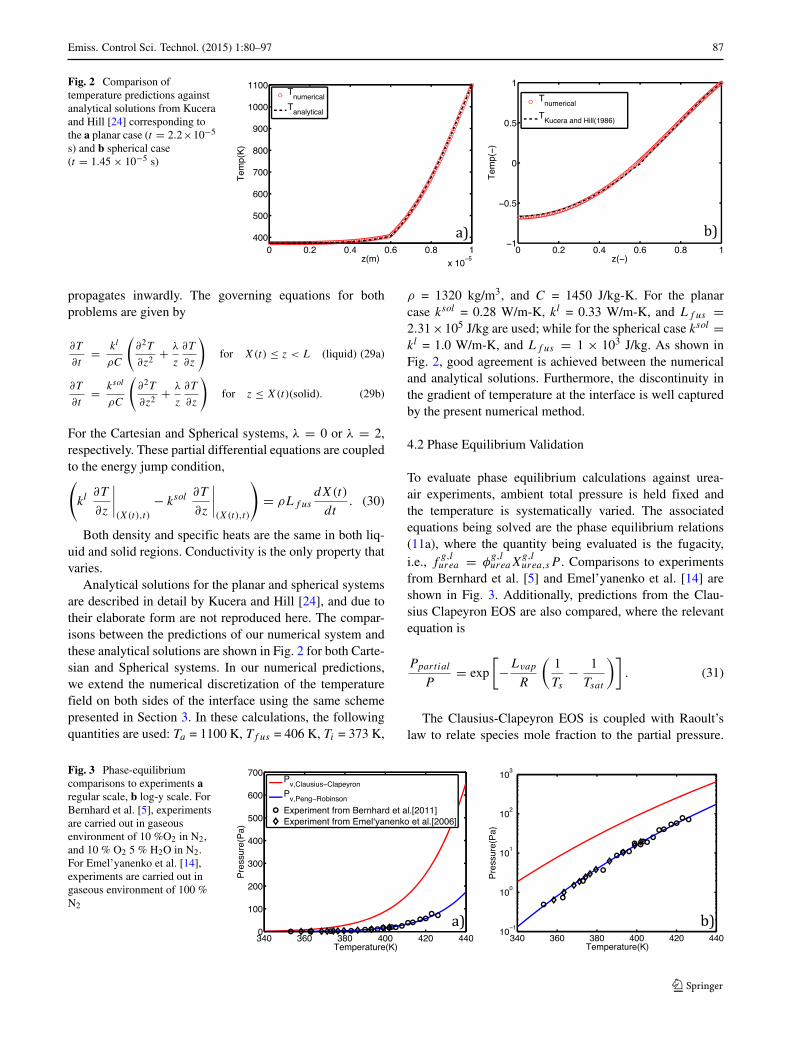
4.2 Phase Equilibrium Validation
To evaluate phase equilibrium calculations against urea-air experiments, ambient total pressure is held fixed andthe temperature is systematically varied. The associatedequations being solved are the phase equilibrium relations(11a), where the quantity being evaluated is the fugacity,i.e., f
g,lurea = φ
g,lureaX
g,lurea,sP . Comparisons to experiments
from Bernhard et al. [5] and Emel’yanenko et al. [14] areshown in Fig. 3. Additionally, predictions from the Clau-sius Clapeyron EOS are also compared, where the relevantequation is
Ppartial
P= exp
[
−Lvap
R
(1
Ts
− 1
Tsat
)]
. (31)
The Clausius-Clapeyron EOS is coupled with Raoult’slaw to relate species mole fraction to the partial pressure.
Fig. 3 Phase-equilibriumcomparisons to experiments aregular scale, b log-y scale. ForBernhard et al. [5], experimentsare carried out in gaseousenvironment of 10 %O2 in N2,and 10 % O2 5 % H2O in N2.For Emel’yanenko et al. [14],experiments are carried out ingaseous environment of 100 %N2
88 Emiss. Control Sci. Technol. (2015) 1:80–97
260 280 300 320 340 360 3800
2
4
6
8
10
12x 10
4
Temperature(K)
Pre
ssur
e(P
a)Computational ResultsExperiment from Smyth and Engel[1929]
Fig. 4 Phase-equilibrium comparisons for nHeptane-air system
The results are compared against data and shown in Fig. 3a,b, respectively, revealing that the PR-EOS is able to pre-dict fairly well phase equilibrium conditions in comparisonto the more ideal treatment given by Clausius-Clapeyronequation. A further comparison is made against the partialpressure data of Smyth and Engel [34] for C7H16, shown inFig. 4, with excellent agreement with PR-EOS predictions.Additionally, a comparison against steam table partial pres-sure data has also been made resulting in good agreement;however, these results are excluded for brevity.
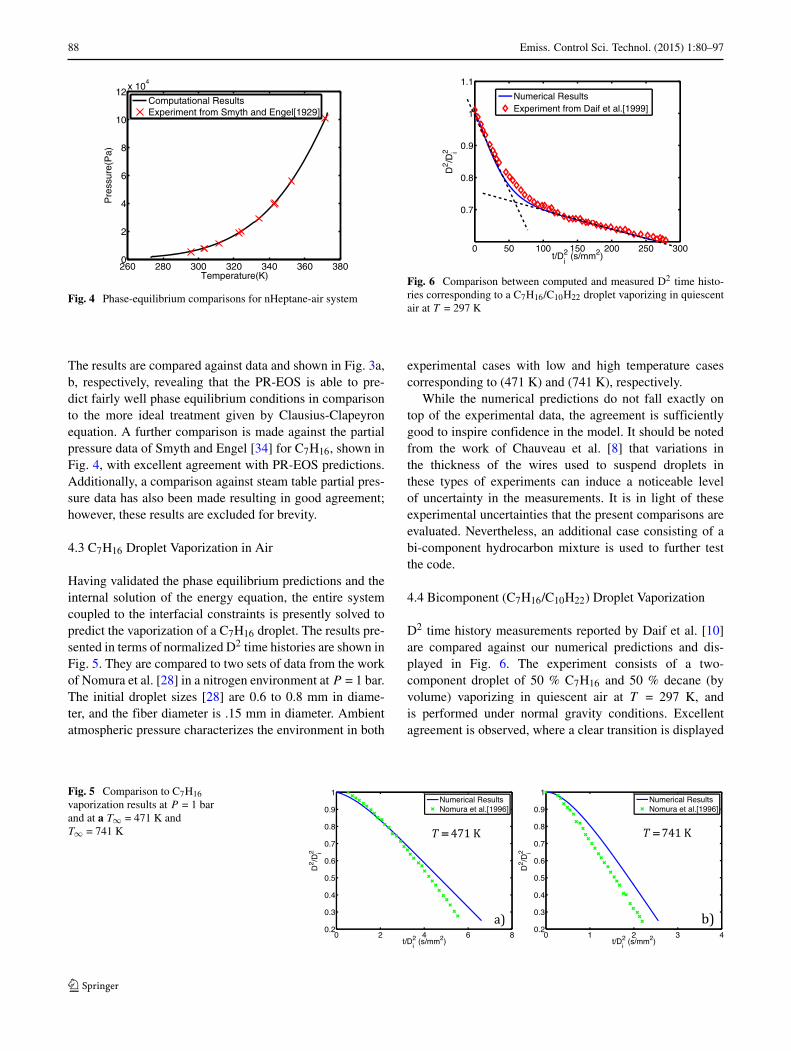
4.3 C7H16 Droplet Vaporization in Air
Having validated the phase equilibrium predictions and theinternal solution of the energy equation, the entire systemcoupled to the interfacial constraints is presently solved topredict the vaporization of a C7H16 droplet. The results pre-sented in terms of normalized D2 time histories are shown inFig. 5. They are compared to two sets of data from the workof Nomura et al. [28] in a nitrogen environment at P = 1 bar.The initial droplet sizes [28] are 0.6 to 0.8 mm in diame-ter, and the fiber diameter is .15 mm in diameter. Ambientatmospheric pressure characterizes the environment in both
Fig. 6 Comparison between computed and measured D2 time histo-ries corresponding to a C7H16/C10H22 droplet vaporizing in quiescentair at T = 297 K
experimental cases with low and high temperature casescorresponding to (471 K) and (741 K), respectively.
While the numerical predictions do not fall exactly ontop of the experimental data, the agreement is sufficientlygood to inspire confidence in the model. It should be notedfrom the work of Chauveau et al. [8] that variations inthe thickness of the wires used to suspend droplets inthese types of experiments can induce a noticeable levelof uncertainty in the measurements. It is in light of theseexperimental uncertainties that the present comparisons areevaluated. Nevertheless, an additional case consisting of abi-component hydrocarbon mixture is used to further testthe code.
4.4 Bicomponent (C7H16/C10H22) Droplet Vaporization
D2 time history measurements reported by Daif et al. [10]are compared against our numerical predictions and dis-played in Fig. 6. The experiment consists of a two-component droplet of 50 % C7H16 and 50 % decane (byvolume) vaporizing in quiescent air at T = 297 K, andis performed under normal gravity conditions. Excellentagreement is observed, where a clear transition is displayed
Fig. 5 Comparison to C7H16vaporization results at P = 1 barand at a T∞ = 471 K andT∞ = 741 K
Emiss. Control Sci. Technol. (2015) 1:80–97 89
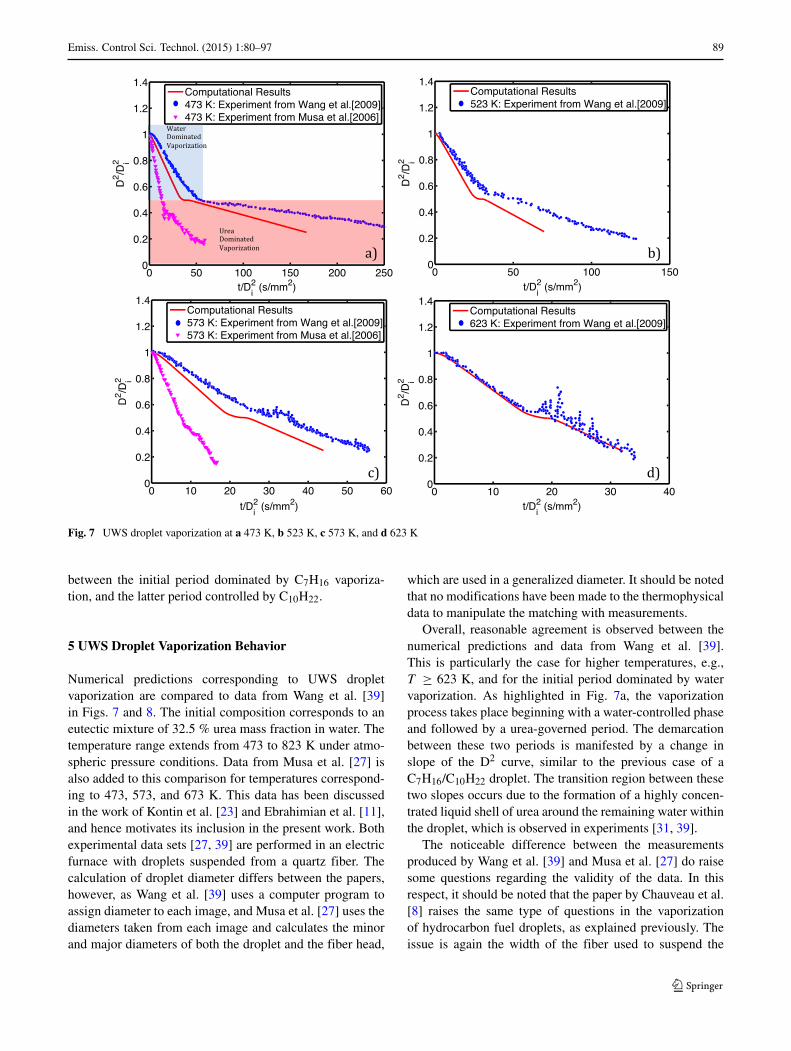
Fig. 7 UWS droplet vaporization at a 473 K, b 523 K, c 573 K, and d 623 K
between the initial period dominated by C7H16 vaporiza-tion, and the latter period controlled by C10H22.
5 UWS Droplet Vaporization Behavior
Numerical predictions corresponding to UWS dropletvaporization are compared to data from Wang et al. [39]in Figs. 7 and 8. The initial composition corresponds to aneutectic mixture of 32.5 % urea mass fraction in water. Thetemperature range extends from 473 to 823 K under atmo-spheric pressure conditions. Data from Musa et al. [27] isalso added to this comparison for temperatures correspond-ing to 473, 573, and 673 K. This data has been discussedin the work of Kontin et al. [23] and Ebrahimian et al. [11],and hence motivates its inclusion in the present work. Bothexperimental data sets [27, 39] are performed in an electricfurnace with droplets suspended from a quartz fiber. Thecalculation of droplet diameter differs between the papers,however, as Wang et al. [39] uses a computer program toassign diameter to each image, and Musa et al. [27] uses thediameters taken from each image and calculates the minorand major diameters of both the droplet and the fiber head,
which are used in a generalized diameter. It should be notedthat no modifications have been made to the thermophysicaldata to manipulate the matching with measurements.
Overall, reasonable agreement is observed between thenumerical predictions and data from Wang et al. [39].This is particularly the case for higher temperatures, e.g.,T ≥ 623 K, and for the initial period dominated by watervaporization. As highlighted in Fig. 7a, the vaporizationprocess takes place beginning with a water-controlled phaseand followed by a urea-governed period. The demarcationbetween these two periods is manifested by a change inslope of the D2 curve, similar to the previous case of aC7H16/C10H22 droplet. The transition region between thesetwo slopes occurs due to the formation of a highly concen-trated liquid shell of urea around the remaining water withinthe droplet, which is observed in experiments [31, 39].
The noticeable difference between the measurementsproduced by Wang et al. [39] and Musa et al. [27] do raisesome questions regarding the validity of the data. In thisrespect, it should be noted that the paper by Chauveau et al.[8] raises the same type of questions in the vaporizationof hydrocarbon fuel droplets, as explained previously. Theissue is again the width of the fiber used to suspend the
90 Emiss. Control Sci. Technol. (2015) 1:80–97
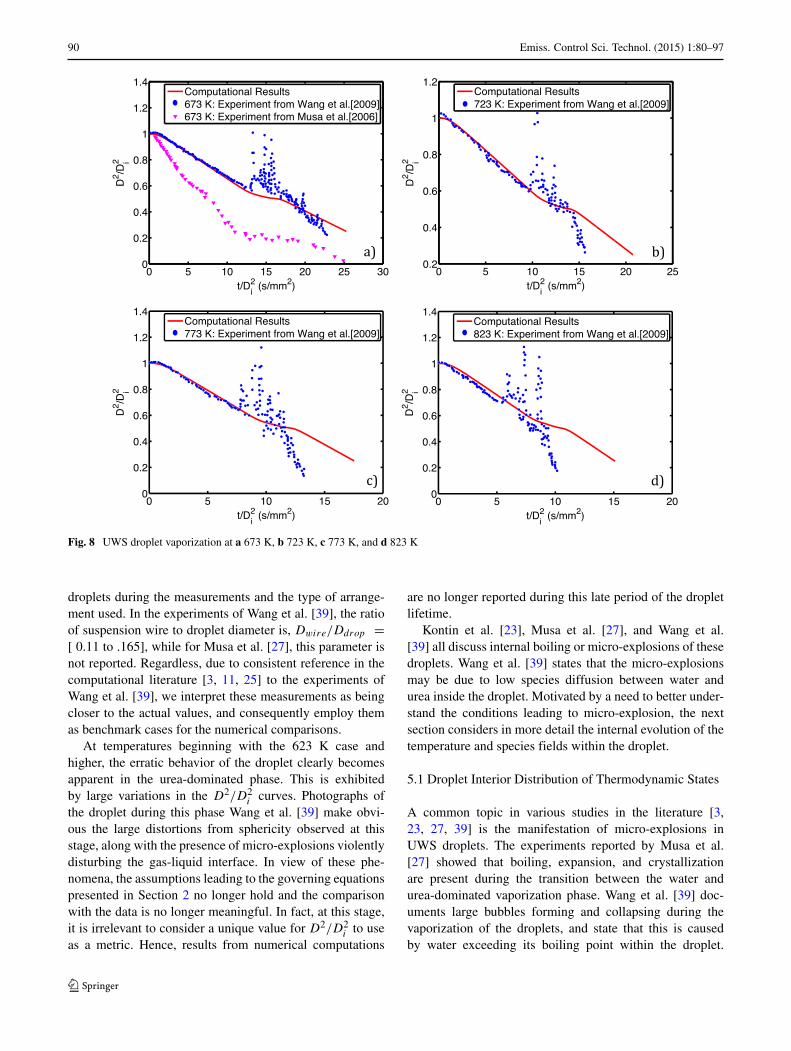
Fig. 8 UWS droplet vaporization at a 673 K, b 723 K, c 773 K, and d 823 K
droplets during the measurements and the type of arrange-ment used. In the experiments of Wang et al. [39], the ratioof suspension wire to droplet diameter is, Dwire/Ddrop =[ 0.11 to .165], while for Musa et al. [27], this parameter isnot reported. Regardless, due to consistent reference in thecomputational literature [3, 11, 25] to the experiments ofWang et al. [39], we interpret these measurements as beingcloser to the actual values, and consequently employ themas benchmark cases for the numerical comparisons.
At temperatures beginning with the 623 K case andhigher, the erratic behavior of the droplet clearly becomesapparent in the urea-dominated phase. This is exhibitedby large variations in the D2/D2
i curves. Photographs ofthe droplet during this phase Wang et al. [39] make obvi-ous the large distortions from sphericity observed at thisstage, along with the presence of micro-explosions violentlydisturbing the gas-liquid interface. In view of these phe-nomena, the assumptions leading to the governing equationspresented in Section 2 no longer hold and the comparisonwith the data is no longer meaningful. In fact, at this stage,it is irrelevant to consider a unique value for D2/D2
i to useas a metric. Hence, results from numerical computations
are no longer reported during this late period of the dropletlifetime.
Kontin et al. [23], Musa et al. [27], and Wang et al.[39] all discuss internal boiling or micro-explosions of thesedroplets. Wang et al. [39] states that the micro-explosionsmay be due to low species diffusion between water andurea inside the droplet. Motivated by a need to better under-stand the conditions leading to micro-explosion, the nextsection considers in more detail the internal evolution of thetemperature and species fields within the droplet.
5.1 Droplet Interior Distribution of Thermodynamic States
A common topic in various studies in the literature [3,23, 27, 39] is the manifestation of micro-explosions inUWS droplets. The experiments reported by Musa et al.[27] showed that boiling, expansion, and crystallizationare present during the transition between the water andurea-dominated vaporization phase. Wang et al. [39] doc-uments large bubbles forming and collapsing during thevaporization of the droplets, and state that this is causedby water exceeding its boiling point within the droplet.
Emiss. Control Sci. Technol. (2015) 1:80–97 91
They also note that this process may be aggravated bydiffusional resistance between the water and urea. Kon-tin et al. [23] reports urea solidification on the surface ofthe droplet in their experiment. In each of these experi-ments, a solid urea shell is reported forming on the surface,following by the superheating of water and the resultingnucleation and micro-explosion. Abu-Ramadan et al. [3]studied this phenomena, testing the viability using Raoult’slaw to measure effective boiling temperature of the waterat the center. They concluded that the nucleation rate wastoo low when compared to the diffusional transportationrate to cause micro-explosions. However, the overwhelmingexperimental evidence of micro-explosion from the resultsof Musa et al. [27] and Wang et al. [39] is in contradictionof this conclusion.
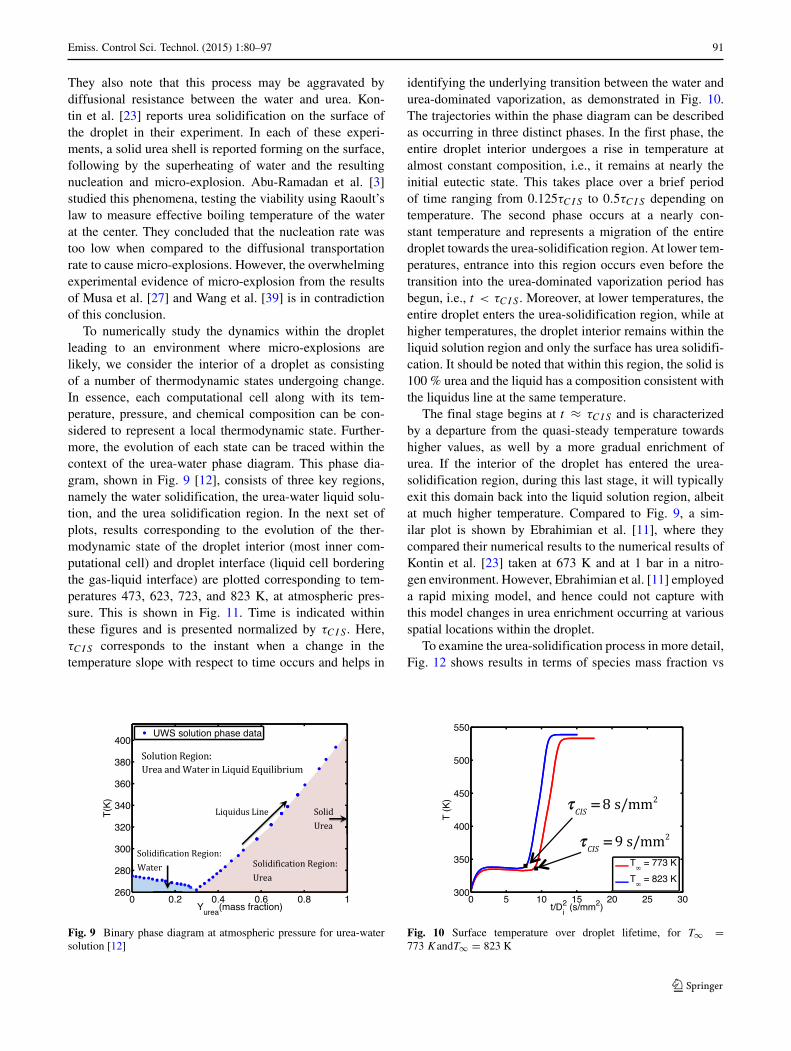
To numerically study the dynamics within the dropletleading to an environment where micro-explosions arelikely, we consider the interior of a droplet as consistingof a number of thermodynamic states undergoing change.In essence, each computational cell along with its tem-perature, pressure, and chemical composition can be con-sidered to represent a local thermodynamic state. Further-more, the evolution of each state can be traced within thecontext of the urea-water phase diagram. This phase dia-gram, shown in Fig. 9 [12], consists of three key regions,namely the water solidification, the urea-water liquid solu-tion, and the urea solidification region. In the next set ofplots, results corresponding to the evolution of the ther-modynamic state of the droplet interior (most inner com-putational cell) and droplet interface (liquid cell borderingthe gas-liquid interface) are plotted corresponding to tem-peratures 473, 623, 723, and 823 K, at atmospheric pres-sure. This is shown in Fig. 11. Time is indicated withinthese figures and is presented normalized by τCIS . Here,τCIS corresponds to the instant when a change in thetemperature slope with respect to time occurs and helps in
Fig. 9 Binary phase diagram at atmospheric pressure for urea-watersolution [12]
identifying the underlying transition between the water andurea-dominated vaporization, as demonstrated in Fig. 10.The trajectories within the phase diagram can be describedas occurring in three distinct phases. In the first phase, theentire droplet interior undergoes a rise in temperature atalmost constant composition, i.e., it remains at nearly theinitial eutectic state. This takes place over a brief periodof time ranging from 0.125τCIS to 0.5τCIS depending ontemperature. The second phase occurs at a nearly con-stant temperature and represents a migration of the entiredroplet towards the urea-solidification region. At lower tem-peratures, entrance into this region occurs even before thetransition into the urea-dominated vaporization period hasbegun, i.e., t < τCIS . Moreover, at lower temperatures, theentire droplet enters the urea-solidification region, while athigher temperatures, the droplet interior remains within theliquid solution region and only the surface has urea solidifi-cation. It should be noted that within this region, the solid is100 % urea and the liquid has a composition consistent withthe liquidus line at the same temperature.
The final stage begins at t ≈ τCIS and is characterizedby a departure from the quasi-steady temperature towardshigher values, as well by a more gradual enrichment ofurea. If the interior of the droplet has entered the urea-solidification region, during this last stage, it will typicallyexit this domain back into the liquid solution region, albeitat much higher temperature. Compared to Fig. 9, a sim-ilar plot is shown by Ebrahimian et al. [11], where theycompared their numerical results to the numerical results ofKontin et al. [23] taken at 673 K and at 1 bar in a nitro-gen environment. However, Ebrahimian et al. [11] employeda rapid mixing model, and hence could not capture withthis model changes in urea enrichment occurring at variousspatial locations within the droplet.
To examine the urea-solidification process in more detail,Fig. 12 shows results in terms of species mass fraction vs
Fig. 10 Surface temperature over droplet lifetime, for T∞ =773 KandT∞ = 823 K

92 Emiss. Control Sci. Technol. (2015) 1:80–97
Fig. 11 Evolution of dropletinterior and free surfacethermodynamic states
dimensionless radius as a function of time. The blue linesindicate that the local thermodynamic state falls within theliquid solution region, while a red “X” indicates that thestate is within the urea solidification region. The first appar-ent trend in this plot is the enrichment of urea throughoutthe entire droplet with time. A second observation is thatwith increasing ambient temperature, a smaller fraction ofthe droplet enters the solidification region. This becomesobvious when considering the shrinkage of the red “X”area at higher temperatures. Beyond a threshold temperature
ranging between 623 and 723 K, the central core of thedroplet only sees a solution region, i.e., it never solidifies.
The entrapment of liquid in the central region of thedroplet, particularly at higher temperature is evident fromthis figure, is accompanied by a large increase in tempera-ture (see Fig. 11). The consequence is an associated increasein pressure, since the external surface of the droplet hassolidified and hence the pressure cannot easily equilibrate.To estimate the rise in pressure associated with this phe-nomena, we compute the change in pressure considering
Fig. 12 Evolution of thedistribution of thermodynamicstate of the droplet at variousambient temperatures

Emiss. Control Sci. Technol. (2015) 1:80–97 93
Fig. 13 Comparison of D2
slope vs time (623 K) withvarying Re
that the density remains fixed (assuming the external ureashell cannot expand) and that the temperature rises as indi-cated in Fig. 11. The calculations employ the PR-EOS andthe estimated pressure difference is ≈ 10,000 Pa. This canbe interpreted as the likely culprit in the generation ofmicro-explosions.
If the rapid mixing model considered in the literature[2, 3, 11, 25] did apply, the thermodynamic state trajecto-ries between the surface and center of the droplet wouldcoincide perfectly. This would render the case of liquidentrapment within the droplet an unattainable situation andwould remove the possibility of internal pressure rise. Con-sequently, the driving force leading to the micro-explosionwould not be present. As shown in Figs. 11 and 12, therapid mixing state does not occur and significant differ-ences between urea mass fraction within the droplet areestablished.
An alternative view of the non-uniformity of the ureamass fraction profiles, given the rise to the entrapmentand subsequent potential micro-explosion, is examined byconsidering the time scales involved. An estimate of thevaporization time scale of vaporization can be formed byconsidering the jump condition for energy in the quasi-steady vaporization state (11d). In this state, the heat fluxoriginating from the liquid side and the liquid velocityat the interface can be considered to be negligible (D2
law conditions), and hence the time scale for vaporizationbecomes
τvap = 2ρlR2s Lvap,mix
Nukair (T∞ − Ts). (32)
The species diffusion time scale can be approximated byτdiff = (2Rs)
2/Dab. The ratio between these times scalesτvap/τdiff ranges from approximately 0.9 to 0.3 corre-sponding to T∞ = 473 and 823 K, respectively. Hence,the vaporization time scale is always smaller than the diffu-sion time scale and becomes even smaller at higher ambienttemperatures. This implies that with increasing tempera-ture, the presence of a sharper urea concentration gradientbecomes more pronounced, which eventually leads to urea
solidification at the interface. Results corroborating thisassertion can be found in Figs. 11 and 12.
5.2 Mixing
The effect of hydrodynamic mixing on the droplet vapor-ization characteristics is accounted in the present work byincorporating the models advanced by Sirignano [33] andAbramzon and Sirignano [1] for both heat and mass diffu-sion (through Dab,eff and kl
eff ). To gauge the impact thatthe mixing produced by aerodynamics effects has on thedroplet vaporization behavior, various values of the (liquid)Reynolds numbers, Rel = 0.1, 1, and 10 are considered. Theresults are shown in Fig. 13 revealing that liquid internalmixing has a minor role in the vaporization characteris-tics. This is due to the low species diffusion value, Dab,eff ,when compared to the thermal diffusivity, αl
eff , yielding aneffective Lewis number that is always greater than 10 forlower Rel values and reaches a value approximately equalto 30 for Rel = 10. With this high value for Lewis num-ber, the dynamics for mass diffusion are considerably slowerthan those from heat diffusion, even at this relatively largevalue of Rel . The consequence is again a sharp gradient inurea mass fraction, urea solidification, and the conditionsconducive of micro-explosion. It should be noted that thisstudy was only for internal mixing, which influences boththe species mass fraction and the internal energy governingequations.
6 Conclusion
After systematically verifying and validating the compu-tational solver used in droplet vaporization calculation,it has been employed in the study of the physics gov-erning urea-water-solution droplet vaporization. The focusof this work provides fundamental knowledge towardsthe improvement or development of more macroscopiccomputational models involving urea-water-solution spraysand their dynamics within a UREA-SCR after-treatmentconfiguration. The main findings from this work are

94 Emiss. Control Sci. Technol. (2015) 1:80–97
summarized as follows along with suggestions for futureresearch:
1. Reasonable agreement is achieved with the D2 datafrom Wang et al. [39], with the model being able to cap-ture relatively well the water-dominated and subsequenturea-dominated vaporization period.
2. By considering the evolution of thermodynamic stateswithin the droplet, it is possible to characterize UWSdroplet vaporization as occurring in three distinctphases: (1) an overall rise in temperature at essentiallyconstant composition, (2) an overall enrichment in ureaat almost constant temperature, and (3) departure from aquasi-steady temperature of the second phase and grad-ual enrichment of urea, particularly near the interface,leading to solidification conditions.
3. The ambient temperature plays a particularly strongrole in shaping the local mass fraction and temperaturestate particularly during the third phase of vaporization.At higher temperatures, internal species gradients areslow to equilibrate, resulting in large urea mass frac-tion gradients and solidification of urea at the interface.Thus, the entrapment of urea becomes more noticeableat these higher temperatures.
4. D2 time histories have historically been used to assessvaporization models. As noted in the literature [8],the arrangement used in suspending the droplets dur-ing experimental measurements can add a considerableamount of uncertainty in the results due to conductiveheat transfer process taking place between the suspen-sion wires and the droplet. This has important implica-tions in UWS droplet vaporization due to the fact that inaddition to vaporization, a solidification process is alsotaking place, which is highly sensitive to heat transfer.More experimental data sets for UWS droplet vaporiza-tion paying careful attention to this aspect would benefitfuture model validation efforts.
5. Even though the rapid mixing model for droplet vapor-ization, used for instance in [2, 3, 25], may produce D2
time histories that agree reasonably well with experi-mental data, it is unable to generate the gradients inurea mass fraction that lead to urea solidification at theinterface. This solidification is reported here and has
been also reported in the experimental works of Musaet al. [27], Wang et al. [39], and Kontin et al. [23].We believe along with others [39] that it is a necessarycondition for the production of micro-explosions.
6. The effect of aerodynamic forcing caused by the move-ment of UWS droplets has been studied within thecontext of effective diffusivity models [1, 33]. It isreported that internal mixing has a negligible effecton the D2 time history curves, even at relatively highvalues for Rel .
Acknowledgments We are grateful to support from the U.S. Depart-ment of Energy, award no. DE-EE0000202.
Appendix A: Peng-Robinson Equation of State
Coefficients A and B are given by
A = amP
(RunivT )2and B = bmP
RunivT. (33)
The mixing rules, am and bm, are defined using purecomponent parameters, and at most one binary interactionparameter,
am =Nsp∑
j
Nsp∑
k
XjXk√
aj ak
(
1 − kjkP)
and bm =Nsp∑
j=1
Xjbj .
(34)
The binary interaction coefficient, kjk , is,
kjk = 1 −[
2(
vcrit,j vcrit,j
)1/6
(
vcrit,j
)1/3 (
vcrit,k
)1/3
]
, (35)
and the pure component parameters aj and bj are definedusing the critical temperature and pressure of species j. Theyare
aj = 0.45724
(
RunivTcrit,j
)2
Pcrit,j
αPR,j
(36)
and bj = 0.07780RunivTcrit,j
Pcrit,j
. (37)
Table 2 Parameters corresponding to the Peng-Robinson Equation of State solution
Critical properties nHeptane Decane Water Urea Air Nitrogen
Tcrit (K) 540.26 617.70 647.13 892 132.65 126.1
Pcrit (bar) 27.36 21.10 220.55 90.50 37.71 33.94
vcrit
(cm3
mol
)
431.9 624 56 218 92.35 90.1
M( g
mol
)
100.204 142.285 18.06 60.06 28.96 28.013
ω (−) 0.351 0.492 0.345 0.620 0.040 0.040

Emiss. Control Sci. Technol. (2015) 1:80–97 95
The parameter αPR,j in turn is equal to unity at the criticaltemperature and is a function of ω, reduced temperature, andmj , given as
√αPR,j = 1 + mj
(
1 − √
Tr,j
)
. (38)
Here, mj is an empirical function of the acentric factorand Tr is the reduced temperature, respectively, given by
mj = 0.37464 + 1.54226ωj + 0.26992ω2j
and Tr = T
Tcrit,j
. (39)
The critical properties and the acentric factor for urea,water, air, nitrogen, C7H16, and decane, barring the criticaltemperature of urea, were taken from Yaws [40].
Appendix B: Thermophysical Equations
Latent heat of vaporization, thermal conductivities, and spe-cific heats are provided in the following set of equations.For the latent heat of vaporization, we employ:
Lvap,urea = (
ALu (1 − T/BLu)nLu
)
, (39a)
Lvap,H2O = (
ALw (1 − T/BLw)nLw)
, (39b)
Lvap,C7H16 = (
ALh (1 − T/BLh)nLh
)
, (39c)
Lvap,dec = (
ALh (1 − T/BLh)nLh
)
. (39d)
For the liquid thermal conductivities:
kl,C7H16 = (((((fklhT + eklh) T
+dklh) T + cklh) T + bklh) T + aklh) , (40a)
kl,decane = Akld + BkldT + CkldT 2, (40b)
kl,urea = Aklu + BkluT + CkluT2, (40c)
kl,H2O = (((((fklwT + eklw) T
+dklw) T + cklw) T + bklw) T + aklw) . (40d)
For the gas thermal conductivities:
kg,nitrogen =(
Akn + BknTg + CknT2g
)
, (41a)
kg,air =(
Aka + BkaTg + CkaT2g
)
, (41b)
kg,decane =(
Akgd + BkgdTg + Ckgd . ∗ Tg.2 + DkgdTg.3)
, (41c)
kg,C7H16 =(
Akgh + BkghTg + CkghTg.2 + DkghTg.3)
, (41d)
kg,urea =(
Akgu + BkguTg + CkguT2g + DkguT
3g
)
, (41e)
kg,H2O =(
Akgw + BkgwTg + CkgwT 2g + DkgwT 3
g
)
. (41f)
Lastly, for the specific heats:
cp,C7H16 = ach + bchT + cchT 2 + dchT 3, (42a)
cp,decane = Acd + BcdT + CcdT 2 + DcdT 3 + EcdT .4, (42b)
cp,urea = Acu + BcuT + CcuT 2 + DcuT 3, (42c)
cp,H2O = ((((fcwT + ecw)T + dcw)T + ccw)T + bcw)T + acw.(42d)
where the constants for all of these equations can be foundin Yaws [40].
B.1 Thermophysical Properties
The diffusion coefficients for both liquid and gas phasewere calculated using the general hard sphere diffusionassumption found in Poling et al. [30]. For the liquid, wehave,
D l,oab = 7.4 • 10−8(�Mb)
1/2T
ηbV 0.6a
, (43)
where ηb is the viscosity of solvent b, Va is the molar vol-ume of solute A at its normal boiling temperature, and � isthe association factor of solvent b which is 2.6 for water,as noted in Poling et al. [30]. To calculate the diffusioncoefficient for a binary mixture, the following equation isused
D lab =
[(
D l,oab
)xb(
D l,oba
)xa]
α, (44)
where α is a correction factor used for liquids. Note that allcases considered have at most two chemical species in theliquid. Air is only considered in the phase equations, and itsmass fraction in liquid is essentially zero and therefore notcalculated within the droplet.
The gas diffusion equation, as shown in Poling et al. [30],Fuller and Giddings [17], Fuller et al. [18], and Fuller et al.[16] is
Dgab = 14.3e − 4 • T 1.75
1/3law •√
1/MH2O or urea + 1/Mair
patm
(
�1/3H2O or urea + �
1/3air
)2. (45)
The critical temperature for urea was calculated, basedon data from Emel’yanenko et al. [14], as well asBernhard et al. [5], using
Tcrit = Tboil
⎡
⎣0.584 + 0.965∑
k
Nk (tck) −(
∑
k
Nk (tck)
)2⎤
⎦
−1
,
(46)
which is the Joback method, discussed in Poling et al. [30].The governing equations generally pertain to mixtures
of different chemical species. In this context, the follow-ing variables need to be prescribed for the mixture and arecalculated as follows:
Lvap,mix =
Nsp∑
i
Lvap,iXvi
Nsp∑
i
Xvi
, (47)
klmix =Yaka +Ybkb −αkl
mix(kb − ka)
[
1 − (kb)1/2
]
kb, (48)

96 Emiss. Control Sci. Technol. (2015) 1:80–97
kair,mix =(
XgH2O
kgH2O
+ Xgureak
gurea + X
gairk
gair
)
(
XgH2O
(
Au,w + Aa,w
) + Xgurea
(
Aw,u + Aa,u
) + Xgair
(
Aw,a + Au,a
)) , (49)
and
Cp,mix =∑
k
YkCp,k, for k = 1 : Nsp. (50)
References
1. Abramzon, B., Sirignano, W.: Droplet vaporization model forspray combustion calculations. Int. J. Heat. Mass Transfer. 32,1605–1618 (1989)
2. Abu-Ramadan, E., Saha, K., Li, X.: Modeling of the injection anddecomposition processes of urea-water-solution spray in automo-tive scr systems. SAE International (2011)
3. Abu-Ramadan, E., Saha, K., Li, X.: Modeling the depleting mech-anism of urea-water-solution droplet for automotive selectivecatalytic reduction systems. AIChE 57(11), 3210–3225 (2011)
4. ACEA: Acea report on selective catalytic reduction: the mostpromising technology to comply with imminent euro iv and eurov emissions standards for hd engines. Technical report (2003)
5. Bernhard, A.M., Czekaj, I., Elsener, M., Wokaun, A., Krocher,O.: Evaporation of urea at atmospheric pressure. J. Phys. Chem. A115, 2581–2589 (2011)
6. Byron Bird, R., Stewart, W.E., Lightfoot, E.N.: Transport Phe-nomena. 2nd. John Wiley (2002)
7. Birkhold, F., Meingast, U., Wassermann, P., Deutschmann, O.:Modeling and simulation of the injection of urea-water-solutionfor automotive scr denox-systems. Appl. Catal. B Environ. 70,119–127 (2007)
8. Chauveau, C., Halter, F., Lalonde, A., Gokalp, I.: An experimen-tal study on the droplet vaporization: effects of heat conductionthrough the support fiber. ILASS-EUROPE (2008)
9. Coulson, J.M., Richardson, J.F., Backhurst, J.R., Harker, J.H.Coulson and Richardson’s Chemical Engineering Volume 1 FluidFlow,Heat Transfer and Mass Transfer, 6th. Elsevier (1999)
10. Daif, A., Bouaziz, M., Chesneau, X., Ali Cherif, A.: Comparisonof multicomponent fuel droplet vaporization experiments in forcedconvection with the sirignano model. Exp. Thermal Fluid Sci. 18,282–290 (1999)
11. Ebrahimian, V., Nicolle, A., Habchi, C.: Detailed modeling of theevaporation and thermal decomposition of urea-water solution inscr systems. AIChE (2011)
12. Egal, M.: Structure and properties of cellulose / NAOH aque-ous solutions, gels and regenerated objectS. PhD thesis, ecole desmines de PARIS (2006)
13. Elliot, J.R., Lira, C.T.: Introductory Chemical Engineering Ther-modynamics.Prentice Hall (2012)
14. Emel’yanenko, V.N., Kabo, G.J., Verevkin, S.P.: Measurement andprediction of thermochemical properties: improved increments forthe estimation of enthalpies of sublimation and standard enthalpiesof formation of alkyl derivatives ofurea. J. Chem. Eng. Data 51,79–87 (2006)
15. Fang, H.L., Dacosta, H.F.M.: Urea thermolysis and nox reductionwith and without scr catalysts. Appl. Catal. B: Environmen. 46,17–34 (2003)
16. Fuller, E.N., Ensley, K., Giddings, J.C.: Diffusion of halogenatedhydrocarbons in helium. The effect of structure on collision crosssections. J. Phys. Chem. 73 (1969)
17. Fuller, E.N., Giddings, J.C.: A comparison of methods for pre-dicting gaseous diffusion coefficients. J. Gas Chromatogr. 3(222)(1965)
18. Fuller, E.N., Schettler, P.D., Giddings, J.C.: New method for pre-diction of binary gas-phase diffusion coefficients. Ind. Eng. Chem.58(5), 18 (1966)
19. Givler, S., Abraham, J.: Supercritical droplet vaporizationand combustion studies. Prog. Energy Combst. Sci. 22, 1–28(1996)
20. Johnson, T.V.: Diesel emissions in review. SAE Int. J. Engines4(1), 143–157 (2011)
21. Kim, J.Y., Ryu, S.H., Ha, J.S.: Numerical prediction on the char-acteristics of spray-induced mixing and thermal decompositionof urea solution in scr system. Fall Technical Conference ofthe ASME Internal Combustion Engine Division, ICEF2004-889(2004)
22. Klein, S., Nellis, G.: Thermodynamics. Cambridge UniversityPress (2012)
23. Kontin, S., Hofler, A., Koch, R., Bauer, H.J.: Heat and mass trans-fer accompanied by crystallization of single particles containingurea-water-solution. ILASS Europe (2010)
24. Kucera, A., Hill, J.: On inward solidifying cylinders and spheresinitially not at their fusion temperature. Int. J. Non-Linear Mech.1, 73–82 (1986)
25. Lundstrom, A., Waldheim, B., Strom, H., Westerberg, B.: Mod-elling of urea gas phase thermolysis and theoretical details on ureaevaporation. Engineers, Part D: Journal of Automobile Proceed-ings of the Institution of Mechanical Engineering (2011)
26. Munnannur, A., Liu, Z.G.: Development and validation of a pre-dictive model for def injection and urea decomposition in mobilescr denox systems. SAE International (2010)
27. Musa, S., Saito, M., Furuhata, T., Arai, M.: Evaporation charac-teristics of a single aqueous urea solution droplet. ICLASS 195(2006)
28. Nomura, H., Ujhe, Y., Rath, H.J., Sato, J., Kono, M.: Experimen-tal study on high-pressure droplet evaporation using microgravityconditions. Twenty-Sixth Symposium on Combustion, pp. 1267–1273 (1996)
29. Peng, D., Robinson, D.: A new two-constant equation of state. Ind.Eng. Chem. Fundam 15(1), 59–64 (1976)
30. Poling, B.E., Prausnitz, J.M., O’Connell, J.P.: The Propertiesof Gases and Liquids, Fifth Edition. McGraw-Hill, New York(2001)
31. Koch, R., Kontin, S., Bauer, H.J.: Size and refractive index mea-surements of inhomogeneous particles with a solid crust by phasedoppler anemometry. ILASS-EUROPE (2011)
32. Schaber, P.M., Colson, J., Higgins, S., Thielen, D., Anspach, B.,Brauer, J.: Thermal decomposition (pyrolysis) of urea in an openreaction vessel. Thermochim. Acta 424, 131–142 (2004)
33. Sirignano, W.A.: Fluid dynamics and transport of droplets andsprays. Cambridge University Press, Cambridge (1999)
34. Smyth, E.: Molecular orientation and the partial vapor pressuresof binary mixtures, i. systems composed of normal liquids. J. Am.Chem. Soc. 51(9) (1929)
Emiss. Control Sci. Technol. (2015) 1:80–97 97
35. Strom, H., Lundstrom, A., Andersson, B.: Choice of urea-spraymodels in cfd simulations of urea-scr systems. Chem. Eng. J. 150,69–82 (2009)
36. Torres, D.J., Trujillo, M.F.: Kiva-4: An unstructured ale code forcompressible gas flow with sprays. J. Compuational Phys. 219,943–975 (2006)
37. Trujillo, M.F., Torres, D.J., O’Rourke, P.: High-pressure multi-component liquid sprays : departure from ideal behaviour. Int. J.Engine Res. 5, 229–246 (2004)
38. Twigg, M.V.: Progress and future challenges in controlling automo-tive exhaust gas emissions. Appl. Catal. B Environ. 70, 2–15 (2007)
39. Wang, T.J., Baek, S.W., Lee, S.Y.: Experimental investigation onevaporation of urea-water-solution droplet for scr applications.AIChE 46, 17–34 (2009)
40. Yaws, C.L.: Chemical Properties Handbook. Knovel (1999)41. Zhu, G., Aggarwal, S.: Transient supercritical droplet evaporation
with emphasis on the effects of equation-of-state. Int. J. Heat MassTransfer. 43, 1157–1171 (2000)