Modeling the system the data flow diagram the context diagram level decomposition the cornucopia...
30
modeling the system the data flow diagram the context diagram level decomposition the cornucopia case portfolio project Systems Analysis and Design for the Small Enterprise section II Analysis
-
Upload
lydia-richardson -
Category
Documents
-
view
222 -
download
0
Transcript of Modeling the system the data flow diagram the context diagram level decomposition the cornucopia...

modeling the systemthe data flow diagramthe context diagramlevel decompositionthe cornucopia caseportfolio project
Sys
tem
s A
nal
ysis
an
d D
esig
nfo
r th
e S
mal
l E
nte
rpri
se
section IIAnalysis

Chapter Objectives
When you complete this chapter you will be able to:• Describe why the data flow diagram is called a process
model• Recognize and describe an abstraction• Identify the four elements of a data flow diagram• Construct a data flow diagram• Decompose a data flow diagram
2

Modeling the System
Process model: diagrams how data flows through the system
Data model: diagrams the relationships between data files
Object model: diagrams the relationships between enterprise objects
System models: diagram system functions, hardware, and software
3

4
Figure 3-1: DFD and the Six CIS Components
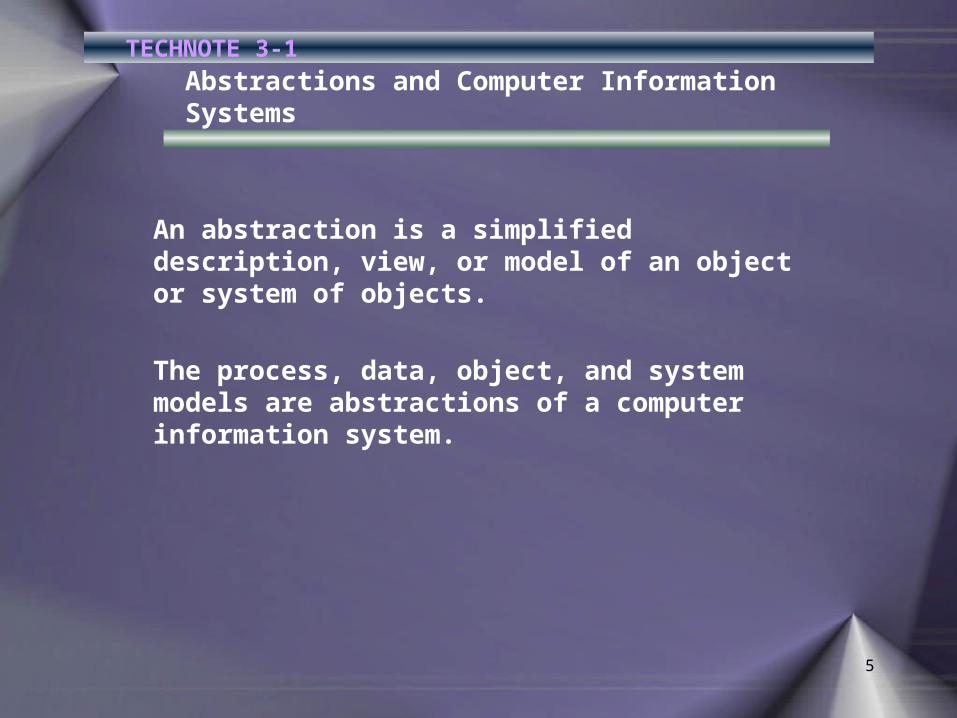
Abstractions and Computer Information Systems
5
An abstraction is a simplified description, view, or model of an object or system of objects.
The process, data, object, and system models are abstractions of a computer information system.
TECHNOTE 3-1

The Data Flow Diagram
• The data flow diagram (DFD) presents a picture of what people and procedures do to transform data into information
• The DFD is composed of four elements:– External entity … the originator of data (source) or
receiver of information (sink)– Process …a series of steps that manipulate data– Data store … a place to keep data for later reference– Data flow … describe data and information elements
passing between external entities, processes, and data stores
6

7
Figure 3-3: Illustrated DFD Symbols

The Data Flow Diagram
• Standard rules for construction:
– Data flows must originate or terminate at a process
– Data stores must have at least one entry and one exit data flow
– Processes must have at least one entry and one exit data flow
8
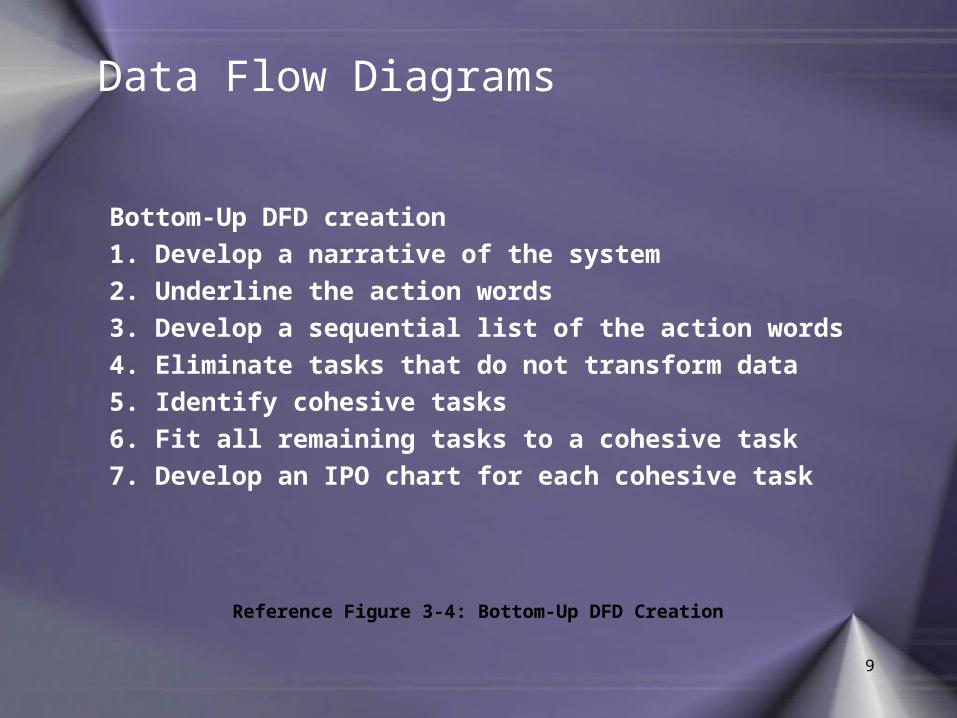
Data Flow Diagrams
9
Bottom-Up DFD creation
1. Develop a narrative of the system
2. Underline the action words
3. Develop a sequential list of the action words
4. Eliminate tasks that do not transform data
5. Identify cohesive tasks
6. Fit all remaining tasks to a cohesive task
7. Develop an IPO chart for each cohesive task
Reference Figure 3-4: Bottom-Up DFD Creation

Data Flow Diagrams
A portion of Silhouette Sea Charter’s narrative:
Sometimes the office manager cannot determine whether the request is reasonable. When this happens, the request is forwarded to the owner, who makes this determination, contacts the customer if necessary, and either adjusts the request or rejects it outright. All requests are returned to the office manager for scheduling and filing.

Figure 3-5: Silhouette’s Bottom-Up DFD Worksheet
11
Action words identifiedin the narrative

Silhouette’s Task #1 Evaluate Special Requests IPO Chart
12

Silhouette Sea Charter’s Partial DFD Sketch
13

Data Flow Diagrams
14
Top-Down DFD creation
1. Solicit oral answers to the question “What is the first task of this system?”
2. Continue with “What happens next?”
3. Repeat Step 2 until the response is “We do it all over again,” or We are finished.”
Reference Figure 3-8: Top-Down DFD Creation

The Context Diagram
15
The context diagram
• Shows a single process• Connected to the external entities• Establishes the system boundaries

Figure 3-9: TKSystem Context Diagram
16

Figure 3-10: Revised TKSystem Context Diagram
17

Level Decomposition
18
• The single process in the context diagram is composed of a collection of well-defined activities called cohesive tasks
• Task definition begins by locating the events within a process
• Events identify the end of one task and the beginning of another
• Once a task is identified, the analyst can identify the inputs and outputs
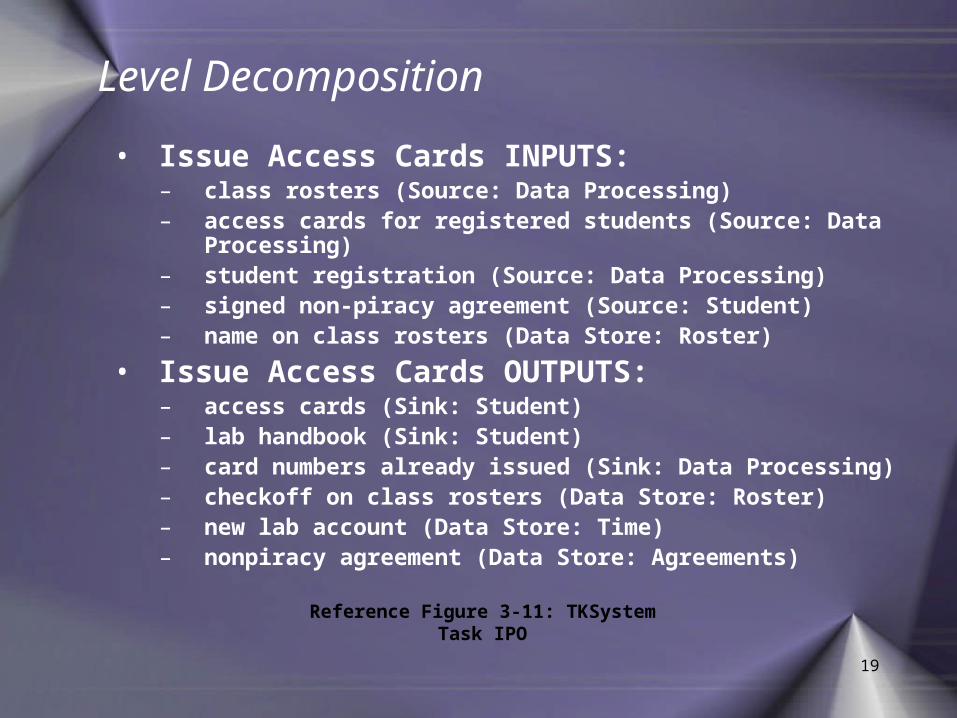
Level Decomposition
19
• Issue Access Cards INPUTS:– class rosters (Source: Data Processing)– access cards for registered students (Source: Data Processing)– student registration (Source: Data Processing)– signed non-piracy agreement (Source: Student)– name on class rosters (Data Store: Roster)
• Issue Access Cards OUTPUTS:– access cards (Sink: Student)– lab handbook (Sink: Student)– card numbers already issued (Sink: Data Processing)– checkoff on class rosters (Data Store: Roster)– new lab account (Data Store: Time)– nonpiracy agreement (Data Store: Agreements)
Reference Figure 3-11: TKSystem Task IPO

Figure 3-12: TKSystem Issue Access Cards Task DFD
20

Logical and Physical DFDs
21
TECHNOTE 3-2
•Logical DFDs remove all reference to the implementation specifics of the system
•Physical DFDs specify the real world objects that are used to make the system work
•During the analysis phase:–Develop the physical DFD–Abstract the logical DFD
•During the design phase:–Develop the logical DFD
–Develop the physical DFD

Figure 3-13: TKSystem First-Level DFD
22
Enlarge
Enlarge

Figure 3-14: Data Flow Walk-Through
23

Figure 3-15: TKSystem DFD Levels
24

Model Building for Pay
25
ThinkingCritically
How would you respond to a client who asks why he or she should pay for model building?
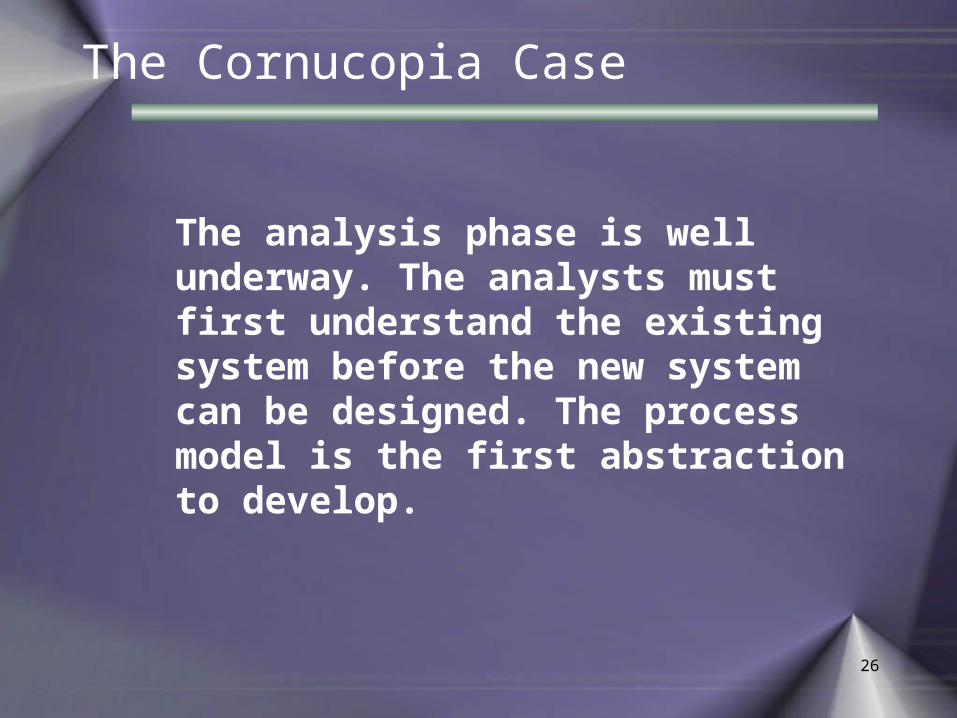
The Cornucopia Case
The analysis phase is well underway. The analysts must first understand the existing system before the new system can be designed. The process model is the first abstraction to develop.
26

27
Cornucopia Existing System Context Diagram

28
Cornucopia Existing System First-Level DFD
Detail
Detail
Detail
Detail

Chapter Summary (1/2)
29
• The data flow diagram (DFD) models the processes of an information system
• DFDs consist of processes, external entities, data stores, and data flows
• DFD modeling begins with the context diagram, which depicts the entire system in a single process symbol surrounded by external entities

Chapter Summary (2/2)
30
• The first-level DFD shows the major functional components of the system as processes, connected by data flows to external entities, data stores, and other processes
• As needed, successively more detailed levels are developed to promote complete understanding of the
system