
Modeling the plastic response of thin metal membranes€¦ · Modeling the plastic response of thin...
21
Journal of the Mechanics and Physics of Solids 54 (2006) 2474–2494 Modeling the plastic response of thin metal membranes S. Nemat-Nasser a, , A. Maximenko b , E. Olevsky b a University of California, San Diego, 9500 Gilman Dr., La Jolla, CA 92093-0416 USA b San Diego State University, 5500 Campanile Dr., San Diego CA 92182-1323 USA Received 1 March 2005; received in revised form 25 January 2006; accepted 17 April 2006 Abstract Using a dislocations-based model of slip and crystal plasticity, we show by illustrative examples that the experimentally observed increase in the yield stress of very thin metallic membranes most likely is due to the variation of grain orientations through the thickness of the membrane, as well as the surface hardness due to oxidation or contamination, both of which generally are insignificant when there is a sufficient number of interior crystals through the membrane thickness; the overall effect may well be produced by a combination of these two causes. We show that crystal plasticity models can account for such size effects without a need for resorting to phenomenological strain- gradient models. We illustrate this using Nemat-Nasser’s dislocations-based slip-induced crystal plasticity model that inherently includes length scales, although other rate-dependent slip models, e.g., the classical power-law slip model, most likely would qualitatively produce similar results. Our numerical results, based on the experimentally supported dislocation-induced slip model and the values of the model parameters given in Nemat-Nasser and Li [1998. Flow stress of F.C.C. polycrystals with application to OFHC Cu. Acta Mater. 46, 565–577], correlate well, both qualitatively and quantitatively, with the experimental results reported by Hommel and Kraft [2001. Deformation behavior of thin copper films on deformable substrates. Acta Mater. 49, 3935–3947] and Espinosa et al. [2004. Plasticity size effect in free-standing submicron polycrystalline FCC films subjected to pure tension. J. Mech. Phys. Solids 52, 667–689] for thin copper membranes, suggesting that, for submicron-sized samples, the classical crystal plasticity with slip models, does qualitatively account well for the small-size effects, and that quantitative predictions are obtained when, in addition, a physics-based dislocation model that includes length scales, is used. It is thus concluded that the length-scale effect and the size effect are two separate issues in metal plasticity, both of which ARTICLE IN PRESS www.elsevier.com/locate/jmps 0022-5096/$ - see front matter r 2006 Elsevier Ltd. All rights reserved. doi:10.1016/j.jmps.2006.04.010 Corresponding author. Tel.: +1 858 534 4914; fax: +1 858 534 2727. E-mail address: [email protected] (S. Nemat-Nasser).
Transcript of Modeling the plastic response of thin metal membranes€¦ · Modeling the plastic response of thin...

Journal of the Mechanics and Physics of Solids
54 (2006) 2474–2494
Modeling the plastic response ofthin metal membranes
S. Nemat-Nassera,�, A. Maximenkob, E. Olevskyb
aUniversity of California, San Diego, 9500 Gilman Dr., La Jolla, CA 92093-0416 USAbSan Diego State University, 5500 Campanile Dr., San Diego CA 92182-1323 USA
Received 1 March 2005; received in revised form 25 January 2006; accepted 17 April 2006
Abstract
Using a dislocations-based model of slip and crystal plasticity, we show by illustrative examples
that the experimentally observed increase in the yield stress of very thin metallic membranes most
likely is due to the variation of grain orientations through the thickness of the membrane, as well as
the surface hardness due to oxidation or contamination, both of which generally are insignificant
when there is a sufficient number of interior crystals through the membrane thickness; the overall
effect may well be produced by a combination of these two causes. We show that crystal plasticity
models can account for such size effects without a need for resorting to phenomenological strain-
gradient models. We illustrate this using Nemat-Nasser’s dislocations-based slip-induced crystal
plasticity model that inherently includes length scales, although other rate-dependent slip models,
e.g., the classical power-law slip model, most likely would qualitatively produce similar results. Our
numerical results, based on the experimentally supported dislocation-induced slip model and the
values of the model parameters given in Nemat-Nasser and Li [1998. Flow stress of F.C.C.
polycrystals with application to OFHC Cu. Acta Mater. 46, 565–577], correlate well, both
qualitatively and quantitatively, with the experimental results reported by Hommel and Kraft [2001.
Deformation behavior of thin copper films on deformable substrates. Acta Mater. 49, 3935–3947]
and Espinosa et al. [2004. Plasticity size effect in free-standing submicron polycrystalline FCC films
subjected to pure tension. J. Mech. Phys. Solids 52, 667–689] for thin copper membranes, suggesting
that, for submicron-sized samples, the classical crystal plasticity with slip models, does qualitatively
account well for the small-size effects, and that quantitative predictions are obtained when, in
addition, a physics-based dislocation model that includes length scales, is used. It is thus concluded
that the length-scale effect and the size effect are two separate issues in metal plasticity, both of which
ARTICLE IN PRESS
www.elsevier.com/locate/jmps
0022-5096/$ - see front matter r 2006 Elsevier Ltd. All rights reserved.
doi:10.1016/j.jmps.2006.04.010
�Corresponding author. Tel.: +1 858 534 4914; fax: +1 858 534 2727.
E-mail address: [email protected] (S. Nemat-Nasser).

are nicely accounted for by physics-based dislocation models of crystal plasticity without a need to
include the plastic strain gradient.
r 2006 Elsevier Ltd. All rights reserved.
Keywords: Crystal plasticity; Polycrystalline material; Metallic membranes; Size effect
1. Introduction
The mechanical behavior of thin films is of importance in many modern applications. Theminiaturization of structural and functional devices involves size reduction down to thesingle-crystal scale. The inelastic response of such thin metal films can be substantiallydifferent from that of their bulk counterparts; Choi and Suresh (2002). The flow stress of thinfilms, as a rule, exceeds that of the bulk material of the same composition and average grainsize. This difference in mechanical response is usually viewed to be due to the substrateconfinements. Recently, the uniaxial tensile response of metal membranes with submicronthickness has been studied experimentally by Hommel and Kraft (2001) and Espinosa et al.(2004). Hommel and Kraft observe that the flow stress and the hardening of thin copper filmsincrease with decreasing film thickness and/or grain size, and are about two times higher inthe (1 1 1)-grains compared to the (1 0 0)-grains; the measurements are made on the samepolycrystalline film sample at various suitably oriented crystals. In a number of metallicsamples considered by Espinosa and coworkers, considerable increase in the flow stress,essentially inversely proportional to the thickness of the membranes, has been observed.
Both phenomenological and dislocations-based models have been developed to explainthis kind of phenomenon. Invoking the inherent dislocation-related microscopic length-scales in plasticity, several macroscopic strain-gradient plasticity models have beenproposed to address this issue phenomenologically; Fleck et al. (1994), Fleck andHutchinson (2001), and Hutchinson (2000). The introduction of the plastic strain gradientinto the plasticity constitutive relations produces macroscopic length scales that can thenbe used as free parameters to fit the experimental results.
The sample-size effect and the dislocation-related microscopic length scales are twoessentially distinct features of metal plasticity, as suggested by Nemat-Nasser (2004,p. 476). The strain-gradient plasticity theories combine these two effects intophenomenological length scales that emerge in the resulting constitutive relations. Whilethe length scales are integral parts of a dislocation-based plasticity model, the sample-sizeeffect is a problem-dependent issue that may or may not relate to the dislocation-basedlength scales. When the thickness of thin films is of the order of the constituting singlecrystals, the orientation of the crystals at which the measurements are made, the geometricand textural incompatibility between neighboring crystals, and the surface properties ofthe crystals (e.g., oxidation or contamination), most likely introduce constraints that maylead to substantially greater stiffness of the samples and also to a more brittle failure modeof otherwise very ductile metallic films. In cases of this kind, the interaction betweenindividual crystals can be accounted for by direct application of crystal plasticity models;Cailletaud et al. (2003). The quantitative success of this kind of modeling to a great extentrests on the viability of the model used to represent the single-crystal behavior, althoughqualitative predictions by this approach would be successful even if one uses ad hoc slipmodels, e.g., a simple rate-dependent power law.
ARTICLE IN PRESSS. Nemat-Nasser et al. / J. Mech. Phys. Solids 54 (2006) 2474–2494 2475
Calculations in the present article are based on a dislocation-based model proposed byNemat-Nasser and Li (1998), Nemat-Nasser and Okinaka (1996), and Nemat-Nasser et al.(1998) for fcc crystals. Using the actual physics of metal plasticity, the model views theplastic deformation of fcc crystals to be due to slip on active {1 1 1} slip planes and in the/1 1 0S slip directions. Since the pioneering work of Orowan (1934), Polanyi (1934), andTaylor (1934), it is now generally known that such slip is induced by the motion of themobile dislocations associated with the active slip systems; Havner (1992) and Nemat-Nasser (2004). This motion is resisted by short-range and long-range energy barriers thatthe dislocations must overcome through their thermal activation, assisted by the externallyapplied stresses; Kocks et al. (1975). The short-range barriers introduce temperature andrate dependence of the flow stress, and the long-range ones produce the work-hardeningeffects. Both contributions are associated with certain microscopic (actually, nanoscopic)length scales corresponding to the density of the associated dislocations, the nature of theshort-range barriers, and the average size of the grains.1
For a typical slip system, the model is given, briefly discussed, and illustrated based onthe experimental data for annealed and as-received oxygen-free high-conductivity(OFHC) copper presented by Nemat-Nasser and Li (1998). The physical parameters ofthis model for OFHC copper have been established by these authors through a series ofcareful experiments over a range of strain rates from 10�3 to 104/s and for temperaturesfrom 77 to over 1000K. Remarkably, the results for the annealed thin copperfilms presented by Hommel and Kraft (2001) are quantitatively simulated using thevalues of the constitutive parameters reported by Nemat-Nasser and Li (1998) for theannealed OHFC copper. In addition, the same model is used together with the datagiven by Nemat-Nasser and Li for the as-received OHFC copper, to examine the questionof possible effects of the textural, geometric, and surface properties on the plastic responseof the (un-annealed) thin metallic films used in Espinosa et al. (2004) experiments, arrivingat remarkably good quantitative predictions. We also use a finite-element approach withour dislocation-based crystal-plasticity model to show through illustrative examples thatthe through-the-thickness textural and geometric incompatibility can also substantiallyaffect the plastic response of a very thin film whose thickness is of the order of the size of afew crystals.
2. Kinematics of deformation of fcc crystal
The description of the kinematics of fcc crystal deformation follows the standard model;see, e.g., Nemat-Nasser (2004, Chapter 6 and references cited therein). The totaldeformation gradient, F, is divided into a non-plastic deformation gradient, F*, and aplastic deformation gradient, Fp,
F ¼qx
qX
� �T
; F ¼ F�F p; L ¼ _FF�1, (123)
where X and x denote the reference and the current particle positions, respectively, and L isthe velocity gradient, the superimposed dot standing for the time derivative, keeping theparticle fixed. The non-plastic deformation gradient, F*, includes the elastic deformation
ARTICLE IN PRESS
1We note in passing that none of these microscopic (nano-scale) parameters seem to relate to the macroscopic
plastic strain gradients, either directly or indirectly.
S. Nemat-Nasser et al. / J. Mech. Phys. Solids 54 (2006) 2474–24942476

and the rigid body rotation. L is also divided into the non-plastic, L*, and plastic, Lp,parts, and using Eq. (2) in (3), we have
L� ¼ _F�F��1; Lp ¼ F� _F
pF p�1F��1. (4,5)
The non-plastic deformation gradient can be decomposed as
F� ¼ V eR�; V e ¼ 1þ �, (6,7)
where Ve is the left-stretch, expressed in terms of e, the elastic strain measured in therotated lattice, and R* is the rigid-body rotation tensor. In general, the elastic strain, e, isvery small for most metals, being of the order of fractions of one percent. Therefore, themajor part of the crystalline deformation is due to plastic deformation of the crystals,induced by plastic slip on various active slip systems. Since the overall crystal spin can bequite large, the non-plastic velocity gradient (4) is expressed as
L� ¼ _�þ �O� � O��þ O�; O� ¼ _R�R�T, (8,9)
where the higher order terms in e are neglected, and O* is the rigid-body spin. Thesymmetric and antisymmetric parts of L* are the rates of the elastic lattice deformation,D*, and lattice spin, W*, respectively,
D� ¼ _�þ �O� � O��; W � ’ O�. (10,11)
The plastic deformation is assumed to be solely due to crystalline slip. An fcc singlecrystal has four slip planes and three slip directions on each slip plane. As a result, theplastic part of the velocity gradient can be written as
Lp ¼X4a¼1
X3a¼1
_gðaaÞlðaaÞ; lðaaÞ¼ R�l
ðaaÞ0 R�T; l
ðaaÞ0 ¼ s
ðaÞ0 � n
ðaÞ0 , (12214)
where _gðaaÞ is the plastic slip rate on the slip plane a, in the slip direction a. Here, n0 and s0are the unit normal of the slip plane and the unit vector in the slip direction, respectively.The zero subscript indicates initial configuration and the index (aa) stands for the ath slipdirection on the ath slip plane. The symmetric, Dp, and antisymmetric, Wp, parts of Lp inEq. (12) can be represented as
Dp ¼X4a¼1
X3a¼1
_gðaaÞpðaaÞ; W p ¼X4a¼1
X3a¼1
_gðaaÞwðaaÞ, (15,16)
pðaaÞ ¼ R�pðaaÞ0 R�T; wðaaÞ ¼ R�w
ðaaÞ0 R�T, (17,18)
pðaaÞ0 ¼
1
2ðlðaaÞ0 þ l
ðaaÞT0 Þ; w
ðaaÞ0 ¼
1
2ðlðaaÞ0 � l
ðaaÞT0 Þ. (19,20)
The symmetric, D, and the antisymmetric, W, parts of the total velocity gradient are nowgiven by
D ¼ D� þDp; W ¼W � þW p. (21,22)
ARTICLE IN PRESSS. Nemat-Nasser et al. / J. Mech. Phys. Solids 54 (2006) 2474–2494 2477

The important feature of relation (15) is that among twelve tensors, pðaaÞ, only five arelinearly independent. There are seven additional relations between these tensors. As shownby Nemat-Nasser and Okinaka (1996), these relations are
pða1Þ þ pða2Þ þ pða3Þ ¼ 0; a ¼ 1; . . . 4, (23)
�pð11Þ þ pð12Þ þ pð43Þ ¼ 0; �pð12Þ � pð33Þ þ pð41Þ ¼ 0; pð13Þ � pð21Þ þ pð32Þ ¼ 0.
(24226)
With the aid of these relations, all slip rates can be computed unambiguously using rate-dependent slip models.
3. Constitutive relations for single fcc crystal
Since the lattice elastic distortion is very small, we assume that the Jaumannrate, s
r, of the Cauchy stress tensor, s, is linearly related to the lattice elastic
deformation rate,
sr¼ C� : D�; s
r¼ _sþ sO� � O�s, (27,28)
where C* is the elasticity tensor in the rotated lattice. In modeling the Hommel–Kraft andEspinosa et al. results, we use the measured shear modulus reported by these authors. Forthe illustrative examples, we assumed isotropic elasticity. In all cases, we take the Poisson’sratio to be 0.34 (for copper).The resolved shear stress, tðaaÞ, acting on the aath slip system is expressed in terms
of the slip rate, temperature, and the accumulated crystal slip, by (Nemat-Nasseret al., 1998)
tðaaÞ ¼ t0 1� �kT
G0ln_gðaaÞ
_g0þ ln f ðg;TÞ
� �� �1=q( )1=p
f ðg;TÞ þ t00a þ t0agðgÞ, (29)
where T is the temperature, and the resolved shear stress associated with the aath slipsystem is given by the following inner product of s and pðaaÞ:
tðaaÞ ¼ s; pðaaÞ� �
. (30)
We have discussed the derivation of Eq. (29) in what follows.Note in passing that, in view of this, Eqs. (23)–(26) take on the following alternative
form:
tða1Þ þ tða2Þ þ tða3Þ ¼ 0; a ¼ 1; . . . ; 4
� tð11Þ þ tð12Þ þ tð43Þ ¼ 0; �tð12Þ � tð33Þ þ tð41Þ ¼ 0; tð13Þ � tð21Þ þ tð32Þ ¼ 0.
ð31234Þ
In Eq. (29), the functions f and g characterize the density of dislocations that intersectthe slip plane and the total dislocation density, respectively. The parameter g is theaccumulated effective plastic strain of the crystal, used here as an (independent) internal
ARTICLE IN PRESSS. Nemat-Nasser et al. / J. Mech. Phys. Solids 54 (2006) 2474–24942478
(‘‘time’’) parameter to measure the internal structural changes, being a non-decreasingquantity; it is given by
g ¼X4a¼1
X3a¼1
Z t
0
_gðaaÞðxÞ�� ��dx. (35)
Expression (29) is based on the dislocation-model developed by Nemat-Nasser and Li(1998) to represent the experimental data they produced for OFHC copper over the rangeof strain rates from 10�3 to 104/s and temperatures from 77 to over 1000K, using anInstron testing machine and special recovery Hopkinson techniques; see Nemat-Nasser etal. (1991), and Nemat-Nasser and Isaacs (1997). In this approach, one starts withOrowan’s expression, _g ¼ brmv, where b is the magnitude of the Burgers vector, rm is thedensity of the mobile dislocations, and v is their average velocity. This velocity is expressedby v ¼ ‘so, where ‘s is the average dislocation spacing, and o is the frequency at which thedislocations overcome their short-range energy barriers. If the barrier energy per unitdislocation length is DG, then it can be shown that
o ¼ o0 expf�DG=kTg. (36)
This is obtained by minimizing the free energy, F ¼ oDG � TS, with respect to o, whereS ¼ k lnðo0!=ðo0 � oÞ!o!Þ is the configurational entropy, noting that o0bob1; and usingSterling’s approximation for the logarithm of the factorial of large numbers. For the fccmetals, the dislocations that intersect the slip planes are the primary barriers to the motionof the mobile dislocations that glide on these planes. Thus, the average spacing of thebarriers is given by ‘s ¼ r�1=2; where r is the average density of the dislocations. It hasbeen suggested by Ono (1968) and Kocks et al. (1975) that DG can be expressed by
DG ¼ G0 1�t� ta
t
� �ph iq
, (37)
where ta is the shear stress due to the elastic field of all dislocations, grain boundaries, andother defects, G0 is the total barrier energy per unit dislocation length, t is the shear stressrequired for the dislocations to overcome their barriers without the assistance of theirthermal energy, and p and q are constants that characterize the barrier profile. Ono (1968)has shown that, for many cases, 0opp1 and 1pqp2. Nemat-Nasser and coworkers haveverified this for many refractory and other metals; see Nemat-Nasser (2004, pp. 235 and238). For copper, p ¼ 2=3 and q ¼ 2, have been experimentally established in Nemat-Nasser and Li (1998). In addition, experimental results show that the athermal part of theflow stress can be represented as
ta ¼ t00a þ t0agðrÞ. (38)
Putting the above results together, the flow stress finally becomes
t ¼ t0 1� �kT
G0ln
_g_g0þ ln
‘0‘s
� �� �1=q( )1=p
‘0‘sþ t00a þ t0agðrÞ,
t0 ¼G0
bl‘0; _g0 ¼ brmo0‘0, ð39Þ
where ‘0 is some reference average length scale, e.g., the average dislocation spacing of theannealed metal, and l is the width of the energy barrier.
ARTICLE IN PRESSS. Nemat-Nasser et al. / J. Mech. Phys. Solids 54 (2006) 2474–2494 2479

Now, to simplify the above relation for the present application, we use the accumulatedtotal plastic slip, g, as a time parameter, and assume that ‘s=‘0 changes with thisaccumulated plastic slip and temperature, T, while the athermal part, gðrÞ, varies with gonly. In other words, we use a simple constitutive model to express the dislocation densityassociated with ‘s in terms of g and T, say, ‘0=‘s ¼ f ðg;TÞ, and set gðrÞ ¼ gðgÞ. In thismanner we reduce Eq. (38) to (29).To specify the functions f(g, T) and g(g) in Eq. (29), note that f(g, T) must be an
increasing function of g and a decreasing function of T, while g(g) must increase with g.Experimental data suggest that these functions may be approximated as follows:
f ðg;TÞ ¼ 1þ a0ð1� ðT=TmÞ2Þg1=2; gðgÞ ¼ gn1 , (40)
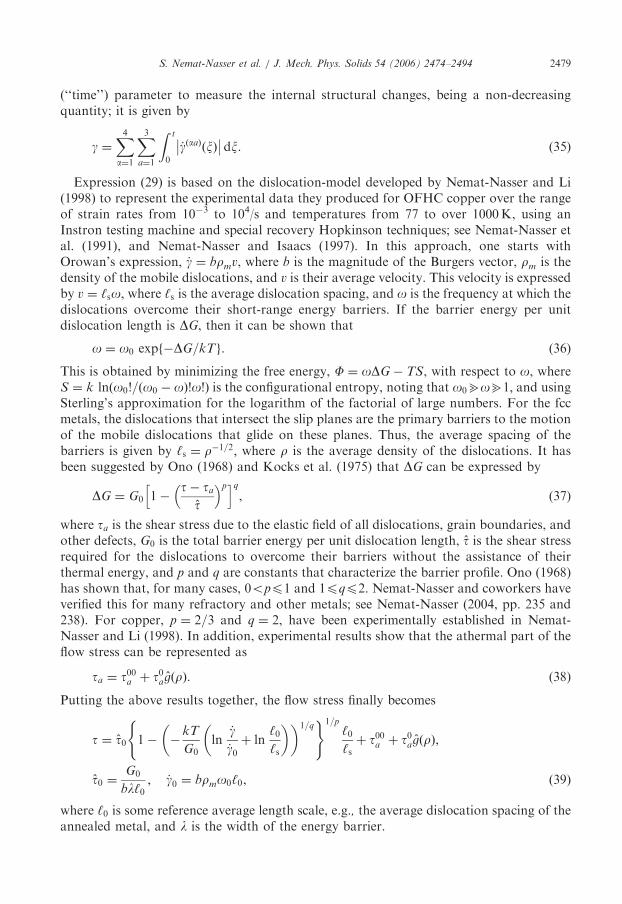
where Tm ¼ 1357K is the melting temperature for copper, and the values of the otherconstitutive parameters are given in Table 1 for both annealed and as-received OFHCcopper, taken from Nemat-Nasser and Li (1998). Figs. 1 and 2, taken from Nemat-Nasserand Li (1998), compare the model predictions with the experimental results for theannealed case, and Figs. 3 and 4 are for the as-received case, respectively. Also, it has beenshown by Kapoor and Nemat-Nasser (1998) for many different metals that, at high strain
ARTICLE IN PRESS
Table 1
Material parameters, from Nemat-Nasser and Li (1998)
Parameter p q k/G0 (10�5/K) _g0 (1010/s) t0 (Mpa) a0 n0 t0a (Mpa) n1
Annealed 2/3 2 4.9 2 46 20 1/2 220 0.3
As-received 2/3 2 4.9 2 400 1.8 1/2 220 0.3
0
100
200
300
400
500
600
700
800
0.00 0.20 0.40 0.60 0.80 1.00
TRUE STRAIN
TR
UE
ST
RE
SS
(M
Pa)
Annealed OFHC Copper Solid Curves: Model PredictionsDash Curves: Experiments
8,000/s
8,000/s
0.1/s
0.001/s
77K
296K
296K
296K
Fig. 1. Comparison between the model predictions and the experimental results for annealed OFHC copper at
indicated initial temperatures and strain rates.
S. Nemat-Nasser et al. / J. Mech. Phys. Solids 54 (2006) 2474–24942480
rates and for suitably large strains, essentially all the stress work is converted into heat,with the stored elastic energy of the dislocations being negligibly small. On the other hand,when metals are deformed plastically by only a few percent strain, some of the stress workis stored in the material in the form of the elastic energy of the dislocations. Stroh (1953)has calculated this to be about 4–5% of the total stress work, at small strains. Therefore, in
ARTICLE IN PRESS
0
100
200
300
400
500
600
700
800
0.00 0.20 0.40 0.60 0.80 1.00 1.20
TRUE STRAIN
TR
UE
ST
RE
SS
(M
Pa)
Solid Curves: Model PredictionsDash Curves: Experiments
OFHC Copper 4,000/s
77K
496K
696K
896K
1096K
Fig. 2. Comparison between the model predictions and the experimental results for annealed OFHC copper at
indicated initial temperatures and 4000/s strain rate.
As-received OFHC Copper, Various Strain Rates
0
100
200
300
400
500
600
700
800
0 0.2 0.4 0.6 0.8 1TRUE STRAIN
TR
UE
ST
RE
SS
(M
Pa)
77K, 8,000/s
296K, 8,000/s
296K, 0.1/s
296K, 0.001/s
Fig. 3. Comparison between the model predictions and the experimental results for annealed OFHC copper at
indicated initial temperatures and strain rates.
S. Nemat-Nasser et al. / J. Mech. Phys. Solids 54 (2006) 2474–2494 2481

Figs. 1–4, the temperature change due to plastic work is taken into account in calculatingthe temperature, T, assuming that all the stress work is used to heat the sample, whereas inthe next section where only a few percent strains are involved, 95% of the stress work isassumed to be lost into heat.As is seen from Figs. 1 to 4, the model has good predictive capability for temperatures
from 77 to 1096K and strain rates from 10�3 to 8000/s. As is also seen, except for t0 anda0, all other constitutive parameters are the same for the annealed and as-received materialin this case. Since the density of dislocations in an as-received copper is about two ordersof magnitude greater than that in an annealed copper, we expect that t0 should be an orderof magnitude greater in the former case relative to the latter. For the same reason, it isexpected that a0 should change by an order of magnitude when an as-received sample isannealed. The values of these parameters in Table 1 clearly accord with these observations.
4. Numerical modeling of deformation of polycrystals
In the classical theory of crystal plasticity, as originated in 1934 from the contributionsof Orowan, Polanyi, and Taylor, the slip rate of each slip system of a given crystal isassumed to vary only in time with loading but not within the crystal itself, so that for eachcrystal the velocity gradient (12) is a function of time only. Different crystals in apolycrystalline solid, however, in general will have different velocity gradients, dependingon their orientation, size, and other factors. We therefore may treat each crystal as anelement in a finite-element modeling, and examine the effects of the texturalincompatibilities on the overall response of the polycrystal. Since, in the presentapplication, we are concerned with only a few percent plastic strains of thin membranes,the resulting numerical results should adequately capture the essence of the problem.
ARTICLE IN PRESS
0
100
200
300
400
500
600
700
800
0 0.2 0.4 0.6 0.8 1 1.2TRUE STRAIN
TR
UE
ST
RE
SS
(M
Pa)
77K
496K
696K
896K1096K
Fig. 4. Comparison between the model predictions and the experimental results for annealed OFHC copper at
indicated initial temperatures and 4000/s strain rate.
S. Nemat-Nasser et al. / J. Mech. Phys. Solids 54 (2006) 2474–24942482

The numerical modeling may be based on the virtual work-rate principle, according towhich the required stress equilibrium is expressed by
F ¼Z
V
s; dDh idV ¼ 0, (41)
where V is the volume of the considered body and the symbol dD denotes variation of thestrain-rate tensor. Relation (41) and the boundary conditions provide all necessaryequations for the prediction of the polycrystal deformation. In our modeling, weconsidered only kinematical boundary conditions with velocities specified over certainparts of the boundary of the polycrystal, the rest of the boundary being traction-free. Inview of Eq. (21), Eq. (41) can be rewritten as
F ¼ Fp þ Fe; Fp ¼
ZV
s; dDph idV ; Fe ¼
ZV
s; dD�h idV . (42244)
In Fe, we replace the stress tensor by
s ¼ st�Dt þ _sDt ¼ st�Dt þ ðC� : D� � sO� þ O�sÞDt, (45)
where t is the current time and Dt is the time increment. In this incremental approach, weassume that the stress and strain fields at t� Dt are known, and then seek to extrapolate toobtain their values at t. Thus, in Eq. (45), st�Dt is known and s, D*, and O* are to beevaluated at t.
The term Fp is the work-rate of plastic deformation that can be assessed in two ways.The first approach is to follow Nemat-Nasser and Okinaka (1996). This is discussed below,and the second approach, which consists of a direct application of a finite-element method,is discussed in Section 8. For the first alternative, we start by taking the inner product ofDp and pðaaÞ, to arrive at the following set of equations:
Dp; pðaaÞ� �
¼X4b¼1
X3b¼1
_gðbbÞHðaaÞðbbÞ; H
ðaaÞðbbÞ ¼ pðaaÞ; pðbbÞ
� �. (46,47)
The set Eq. (46) consists of 12 equations, but, in view of Eq. (23)–(26), only five of these areindependent. Using Eqs. (31)–(34), we obtain seven additional relations among 12 sliprates, _gðaaÞ, and hence, noting plastic incompressibility, we can calculate all 12 slip rates,
_gðaaÞ ¼X5i¼1
AiðaaÞ Dp; pðiÞ� �
, (48)
where pðiÞ denotes the selected five independent slip systems, with AiðaaÞ being the known
coefficients. Upon substitution of Eq. (48) into Eq. (29) we obtain a set of non-linearequations that relate the resolved shear stresses to the components of the plastic strain-ratetensor,
tðaaÞ ¼ F Dp; pðiÞ� ��
, (49)
where F is a non-linear function corresponding to Eq. (29). The plastic work-rate, Fp, isgiven by
Fp ¼X4a¼1
X3a¼1
ZV
tðaaÞd_gðaaÞ dV : (50)
ARTICLE IN PRESSS. Nemat-Nasser et al. / J. Mech. Phys. Solids 54 (2006) 2474–2494 2483

This work-rate is now expressed in terms of the strain-rate tensor Dp by substituting Eqs.(48) and (49) into Eq. (50). The actual computations are performed using the method ofplastic-predictor/elastic-corrector developed by Nemat-Nasser and coworkers, which isefficient, accurate, and stable; for a detailed discussion, illustrative examples, andreferences, see Nemat-Nasser (2004, Chapter 5). The application of the method to crystalplasticity has been made by Nemat-Nasser and Okinaka (1996) and to frictional granularmaterials with dilatancy and pressure sensitivity by Balendran and Nemat-Nasser(1993a, b). As will be illustrated in Section 6, with this method all active slip systems areunambiguously calculated for the rate-dependent models; for the details of thecomputational algorithm that have been used in crystal plasticity, see Nemat-Nasser(2004, Subsection 6.5.11, p. 462).
5. Application to thin-film data
We now first apply the model to predict the results reported by Hommel and Kraft(2001), using the values of the model parameters given in Table 1 for the annealed case(first row). Then we consider the corresponding data presented by Espinosa et al. (2004)for un-annealed thin copper membranes, and use the model parameters for the as-receivedcase (second row) of Table 1.Hommel and Kraft (2001) report the results of uniaxial tension of thin copper films,
deposited on a 250 mm thick Ni sheet coated with a thin layer of polyimide, and annealed at200 1C for 60min. The macroscopic strain is measured directly optically, and the axial stress
is obtained for the (1 1 1)- and (1 0 0)-grain orientations, using X-ray measurements of the
changes in the corresponding lattice dimensions and Hooke’s law. The Ni substrate is used toprevent the compression of the samples upon unloading. This unloading is necessary forthe X-ray measurements. The reported effective strain rate is about 10�7/s. The (1 1 1)- and(1 0 0)-grains are oriented with their [2 1 1] and [0 0 1] directions along the loading axis,respectively. From the measured data, and using a Poisson ratio of 0.34, the elastic shearmoduli of 44 and 16.4GPa are inferred from these authors’ results. Fig. 5 shows theexperimental data, extracted from Fig. 2(a) of Hommel and Kraft (2001, p. 3940). Whilethe (1 0 0)-data start with zero stress at zero strain, the (1 1 1)-data start with about 35MPastress at (reported) zero strain. Hence, the two sets of data do not have a common origin.Using the parameter values given in Table 1 for the annealed copper (first row), a strain
rate of 10�7/s, and T ¼ 296K, we have calculated the effective stress for two cases, onecorresponding to grains that are oriented in the (1 1 1)-plane with their ½2 1 1� axis along theloading direction, and the other for (1 0 0) grains with their [0 0 1] axis in the loadingdirection. Noting the difference in the origin of the two data sets, the results are shown inFig. 5 by solid curves. The reader should note that no adjustment has been made in thevalues of the parameters that Nemat-Nasser and Li (1998) have reported for OFHCcopper, based on their set of macroscopic experiments. Here, we have simply used thosereported values of the parameters and crystal plasticity, as detailed by Nemat-Nasser(2004, Chapter 6), to obtain the results presented in Fig. 5.We now examine the data presented in Espinosa et al. (2004) for un-annealed thin and
thick copper films. These authors report experimental results of uniaxial tension of metalmembranes with submicron to micron thicknesses. Unlike the data in uniaxial extension ofthin copper wires reported by Fleck et al. (1994), Espinosa et al. observe that the uniaxialdeformation of the membranes strongly depends on the thickness, with the uniaxial tensile
ARTICLE IN PRESSS. Nemat-Nasser et al. / J. Mech. Phys. Solids 54 (2006) 2474–24942484

yield limit increasing as the membrane thickness decreases. This effect is observed only forsamples with submicron thicknesses, i.e., when the thickness is of the order of the size ofone or two crystals in the polycrystalline membranes.
Membranes of three different metals have been investigated, namely gold, copper, andaluminum. It has been found for aluminum that the samples essentially lose their plasticitywhen shaped into a membrane with a thickness of the order of the size of a couple ofgrains. It is known that aluminum films are usually covered by a thin layer of strong,adherent native oxide that generally is under an in-plane compression. Surface crystals thatbear such an oxide layer have greater stiffness and resistance to plastic deformation thando the bulk crystals; i.e., these surface crystals do not deform plastically until their surfaceoxide layer is fractured. As a result, the yield limit of the surface layer crystals is expectedto be greater than that of the interior grains, rendering the membrane plasticity to bedependent on the thickness of the crystals within the oxidized surface layer as comparedwith the overall membrane thickness. In Sections 7 and 8, we consider a finite-elementmodel that allows examining the through the thickness textural incompatibility inmembranes that are only a few grains thick.
Here, we use our crystal-plasticity model together with the data for the un-annealedcopper (Table 1, second row) to check how well the model can predict the results presentedin Fig. 7(b) of Espinosa et al. (2004, p. 680). Again, we do not make any adjustments to thevalues of the parameters that are reported by Nemat-Nasser and Li (1998) for their as-received OFHC copper results.
In their Figs. 7(a) and (b), Espinosa et al. (2004) show that, while the membranes ofwidth 5, 10, and 20 mm display similar stress–strain relations, a change in thickness from1.0 to 0.2 mm results in a substantial increase in the flow stress. For an average grain size ofabout 100 nm, there are no more than two grains through the thickness of the thinmembranes, while for the 1.0 mm membranes there may be 5–10 grains per thickness. Also,
ARTICLE IN PRESS
0
50
100
150
200
250
300
350
400
450
0 0.25 0.5 0.75 1 1.25 1.5 1.75 2Strain, %
Str
ess,
MP
a
Data from Hommel and Kraft (2001)
(111) Crystals
(100) Crystals
Fig. 5. Locally measured stress in crystals with ½2 1 1� (upper data points) and [0 0 1] (lower data points) in the
loading direction vs. optically measured overall macroscopic strain of a polycrystalline membrane and simulation
results using the values of the model parameters reported by Nemat-Nasser and Li (1998) for annealed OFHC
copper (Table 1, first row).
S. Nemat-Nasser et al. / J. Mech. Phys. Solids 54 (2006) 2474–2494 2485
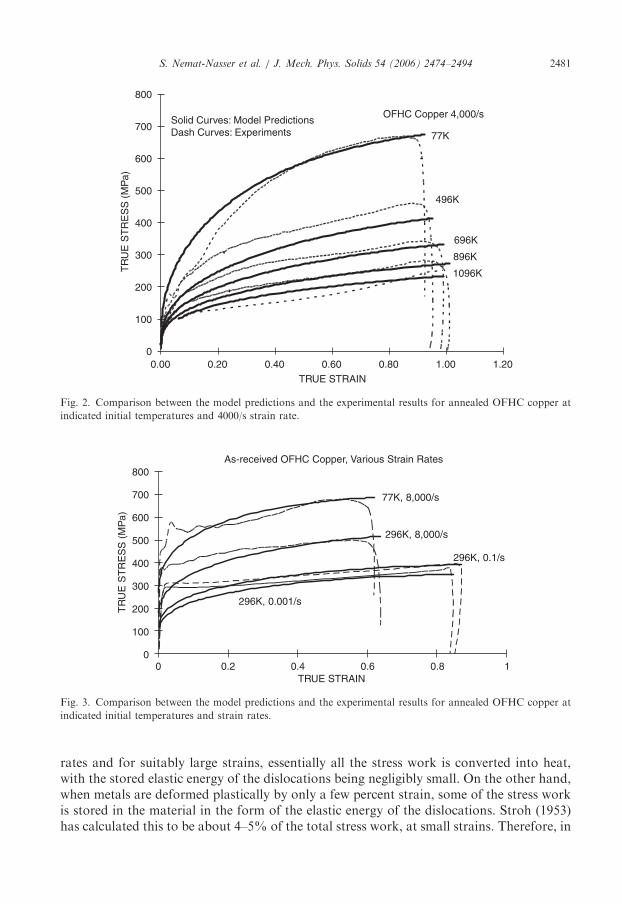
the sample preparation suggests possible grain contamination which can affect the 0.2 nmmembranes but not noticeably the 1.0 mm membranes. In addition, the grain orientationsthrough the thickness are most likely distributed over a wide range for the thickmembranes, whereas in the case of thin membranes, most grains would have their (1 1 1)-plane parallel to the membrane surface, as commented on by Espinosa and coworkers.Another fact is the strain rate which varies in a given experiment with the membranelength; although the authors comment that the strain rate remains in the range of 10�5/s.Since the model results are also affected by the strain rate, in what follows, the results aregiven for three strain rates 10�4, 10�5, and 10�6/s, which are expected to cover the ratesthat a sample may have experienced.2
Based on the above observations, we allow for the variation in the orientation for thegrains of the thick membrane but assume a common orientation for the grains in the thinmembrane. We set t00a ¼ 0; 75MPa for the thick and thin membranes, respectively. Thesecond value takes into account potential surface contaminations, as well as the initialsingle-crystal slip resistance reported by Wu et al. (1991). From Fig. 3, it is also seen thatthe as-received samples show a pronounced initial yield stress at room temperature andlow strain rates, much higher than that observed in the corresponding curves for theannealed samples in Fig. 1. We use a shear modulus of 46.6GPa (obtained using theYoung modulus of 125GPa, as reported by Espinosa et al., and a Poisson ratio of 0.34) forboth cases, and present results for three strain rates, namely 10�4, 10�5, and 10�6/s. Forthe thick membrane, we use a Taylor averaging with 125 possible orientations, and notethat the use of a greater number of orientations does not noticeably affect the resultingstress–strain curve.The results are shown in Fig. 6 by the solid curves for indicated strain rates. Again, as is
seen, good quantitative predictions have emerged from an experimentally supportedphysics-based model. Since the material-model parameters have been established throughindependent experiments reported by Nemat-Nasser and Li (1998), the remarkablepredictive capability of the model clearly underscores the significance of experimentallysupported, physics-based modeling in metal plasticity (and, in general). In this connection,it may be significant to bear in mind the experimental conditions and the measurementtechniques used by Hommel and Kraft (2001) and Espinosa et al. (2004). The first authorsoptically measure the average macroscopic strain of the polycrystalline membrane andassume that to be the same as the local strain for all crystal orientations; this is similar tothe Taylor model assumption. The stress, however, is inferred from the measured locallattice dimensional changes for a specific crystal of desired orientation. In the experimentsby Espinosa and coworkers, both the strain and stress are inferred from the measuredmacroscopic deformations of the membrane and the corresponding applied loads.Therefore, the values of the model parameters that are based on the results of macroscopicexperiments are in fact the appropriate quantities to be used for the model predictions inboth cases.
6. Crystal orientation and active slip systems
As has been shown by Taylor (1934), in general, up to eight slip systems can be active inan fcc crystal, although only five of these can be independent. It can be shown that, in a
ARTICLE IN PRESS
2This has been confirmed by Professor Espinosa in a private communication.
S. Nemat-Nasser et al. / J. Mech. Phys. Solids 54 (2006) 2474–24942486

fully developed plastic deformation of a crystal, either six or eight slip systems aregenerally active; see Nemat-Nasser (2004, Subsection 6.5.6, p. 453). Our physics-based slipmodel of crystal plasticity allows direct calculation of all slip rates; see Nemat-Nasser(2004, Subsection 6.5.11, p. 462). We now illustrate this considering uniaxial straining of afilm in the [0 0 1]-direction, similar to the Hommel–Kraft experiment, and calculate forcrystals with different orientations the equivalent stress and the corresponding slip rates at2% overall strain. The aims here are (1) to demonstrate that even in a given polycrystal, theeffective axial stress can vary by a factor of two or greater, depending on the crystalorientation even when we use the same elastic modulus for all orientations, and (2) the sliprates of all active slip systems (in fcc crystal, up to eight) can be computed.
Let the [1 0 0]-direction be normal to the plane of the film, and consider various crystalswhose axes are obtained through the following rotation matrix:
R ¼
cosjffiffi2p
2sin j
ffiffi2p
2sin j
�ffiffi2p
2sin j 1
2cos jþ 1
212cos j� 1
2
�ffiffi2p
2sin j 1
2cos j� 1
212cos jþ 1
2
26664
37775, (51)
where j is allowed to vary from 0 to p/2, defining various orientations relative to theloading direction relative to the ([1 0 0], [0 1 0], [0 0 1]) coordinate system. If the overalldeformation-rate tensor is D, then for a crystal whose orientation is defined by the angle j,the deformation-rate tensor in that crystal’s lattice coordinates would be D0 ¼ RDRT. Inwhat follows, D is a diagonal matrix whose non-zero components are: D11 ¼ 1=s and
ARTICLE IN PRESS
0
100
200
300
400
500
600
700
800
900
0 0.25 0.5 0.75 1 1.25 1.5Strain, %
Str
ess,
MP
a
Thick, DataThick, 0.0001 Strain RateThick, 0.00001 Strain RateThick, 0.000001 Strain RateThin, DataThin, 0.0001 Strain RateThin, 0.00001 Strain RateThin, 0.000001 Strain Rate
Data from Espinosa et al. (2004)
Fig. 6. Globally measured stress and strain in thin, 0.2 nm (upper data points), and in thick, 1.0mm (lower data
points), films with (1 1 1) plane parallel to the film surface, vs. measured overall macroscopic strain of a
polycrystalline membranes, and the corresponding simulation results using the values of the model parameters
(Table 1, second row) reported by Nemat-Nasser and Li (1998), for indicated strain rates.
S. Nemat-Nasser et al. / J. Mech. Phys. Solids 54 (2006) 2474–2494 2487

D22 ¼ D33 ¼ �0:5=s. For the sake of illustration and in order to reduce the requiredcomputational efforts, we use the common shear modulus 60GPa for all cases.Fig. 7 shows the equivalent stress (axial stress) as a function of the angle j, that is, for
the same overall deformation rate defined by D11 ¼ 1=s and D22 ¼ D33 ¼ �0:5=s, weconsider a typical crystal with lattice orientation defined by angle j, and calculate theeffective stress of that crystal. The resulting curve shows large variations in its slope asdifferent crystal orientations are considered, suggesting that different slip systems areactive in crystals of different orientations. Note that the effective axial stress has a rangefrom about 330 to almost 700MPA, depending on the crystal orientation, even for acommon elastic modulus.Fig. 8 gives the slip rates of all active slip systems as functions of the relative lattice
orientation, j. The slip systems numbered 3 and 11 are inactive and the systems 6 and 7have the same slip rates, for all considered orientations in this example. For the values of jin the range 0–131 (say, Range I), eight slip systems are active at 2% strain. For j from 13to 151, the situation is dramatically different, where the slip rates of the systems 1, 2, 4, and8 are decreasing as the orientation angle j increases, reducing to zero at 161, while the sliprates of systems 5 and 9 gradually increase as j increases, being fully active for j equal toor greater than 181. The crystals oriented in the range of 16–341 (say, Range II) have sixactive slip systems, four of which are in common with the crystals in Range I. The situationis again dramatically different for crystals oriented in the range 35–371, where two systems,10 and 12, which are active in Range II, are inactive for j between 37 and 691 (say, RangeIII), while systems 1 and 2 that are inactive in Range II, are active in Range III. Finally, fororientations in the range 69–73, the situation is quite different, and then for j greater than,say, 74 up to 901, eight slip systems, 1, 2, 4, 6–8, 10, and 11, are active with 4 and 8 havingthe same slip rates (in addition to 6 and 7).
ARTICLE IN PRESS
Equivalent Stress (MPa) at 2% Strain1/s Axial Strain Rate in [100]-direction
G = 60GPa for all Orientation
300
350
400
450
500
550
600
650
700
0 10 20 30 40 50 60 70 80 90Orientation, Degrees
Str
ess,
MP
a
[010]
[100]
[001]
Fig. 7. Equivalent stress (axial stress) as a function of the angle j at 2% strain, 1/s axial and �0.5/s lateral strain
rates; data from Table 1 for annealed copper and G ¼ 60GPa; j ¼ 0 corresponds to the shown crystal
coordinates.
S. Nemat-Nasser et al. / J. Mech. Phys. Solids 54 (2006) 2474–24942488

7. Through-thickness texture effect
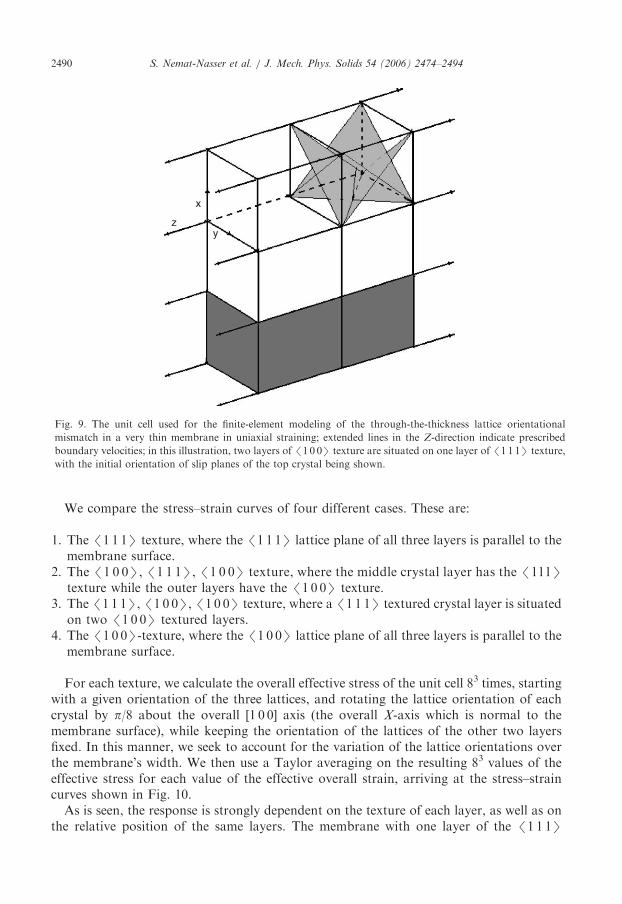
We now examine the effect of the mismatch of the crystal lattice orientations throughthe thickness of a very thin membrane, on its elastic-plastic response. For illustration, weconsider a case where, on the average, the membrane is only three-crystals thick, but allowfor an isotropic orientational variation over the width of the membrane. The calculationsare performed using a finite-element approach, as detailed in Section 8. In what follows, wereport the results of the calculation.
We use a unit cell consisting of three cubic elements, each with a specific latticeorientation, Fig. 9. The unit cell is being deformed in uniaxial straining. The overall strainrate is defined by D11 ¼ 1=s and D22 ¼ D33 ¼ �0:5=s, all other components of the overalldeformation-rate tensor being zero; the boundary conditions are adjusted so that the topand bottom surfaces of the unit cell in Fig. 9 are traction-free, and the initially co-planarlateral surfaces of the three cubes remain co-planar as the unit cell is being uniaxiallystrained. The stress-deformation relation for each active slip system is the same as before,with constitutive parameters given in Table 1 for the as-received (un-annealed) case(second row in Table 1). To simplify the calculations, we assume the common shearmodulus of G ¼ 60GPa and Poisson ratio of 0.34 for all orientations, although, asdiscussed before, the shear modulus depends on the lattice orientation. Calculations can beperformed taking into account the variation in the shear modulus with lattice orientation,and this would accentuate the effect that we are seeking to illustrate, but at the cost of aconsiderably greater amount of computational effort. Since we are not at this pointaddressing any specific experimental result, for illustration the simplified calculation isconsidered adequate.
ARTICLE IN PRESS
-1
-0.8
-0.6
-0.4
-0.2
0
0.2
0.4
0.6
0.8
1
0 10 20 30 40 50 60 70 80 90
Orientation, Degree
Slip
Rat
e, 1
/sSystem 1 System 2 System 4 System 5 System 6
System 7 System 8 System 9 System 10 System 12
Fig. 8. Slip rates of active slip systems as functions of the crystal orientation, j, at 2% strain, 1/s axial and �0.5
lateral overall strain rates; data from Table 1 for annealed copper; G ¼ 60Gpa.
S. Nemat-Nasser et al. / J. Mech. Phys. Solids 54 (2006) 2474–2494 2489
We compare the stress–strain curves of four different cases. These are:
1. The /1 1 1S texture, where the /1 1 1S lattice plane of all three layers is parallel to themembrane surface.
2. The /1 0 0S, /1 1 1S, /1 0 0S texture, where the middle crystal layer has the /111Stexture while the outer layers have the /1 0 0S texture.
3. The /1 1 1S, /1 0 0S, /1 0 0S texture, where a /1 1 1S textured crystal layer is situatedon two /1 0 0S textured layers.
4. The /1 0 0S-texture, where the /1 0 0S lattice plane of all three layers is parallel to themembrane surface.
For each texture, we calculate the overall effective stress of the unit cell 83 times, startingwith a given orientation of the three lattices, and rotating the lattice orientation of eachcrystal by p/8 about the overall [1 0 0] axis (the overall X-axis which is normal to themembrane surface), while keeping the orientation of the lattices of the other two layersfixed. In this manner, we seek to account for the variation of the lattice orientations overthe membrane’s width. We then use a Taylor averaging on the resulting 83 values of theeffective stress for each value of the effective overall strain, arriving at the stress–straincurves shown in Fig. 10.As is seen, the response is strongly dependent on the texture of each layer, as well as on
the relative position of the same layers. The membrane with one layer of the /1 1 1S
ARTICLE IN PRESS
x
yz
Fig. 9. The unit cell used for the finite-element modeling of the through-the-thickness lattice orientational
mismatch in a very thin membrane in uniaxial straining; extended lines in the Z-direction indicate prescribed
boundary velocities; in this illustration, two layers of /1 0 0S texture are situated on one layer of /1 1 1S texture,
with the initial orientation of slip planes of the top crystal being shown.
S. Nemat-Nasser et al. / J. Mech. Phys. Solids 54 (2006) 2474–24942490
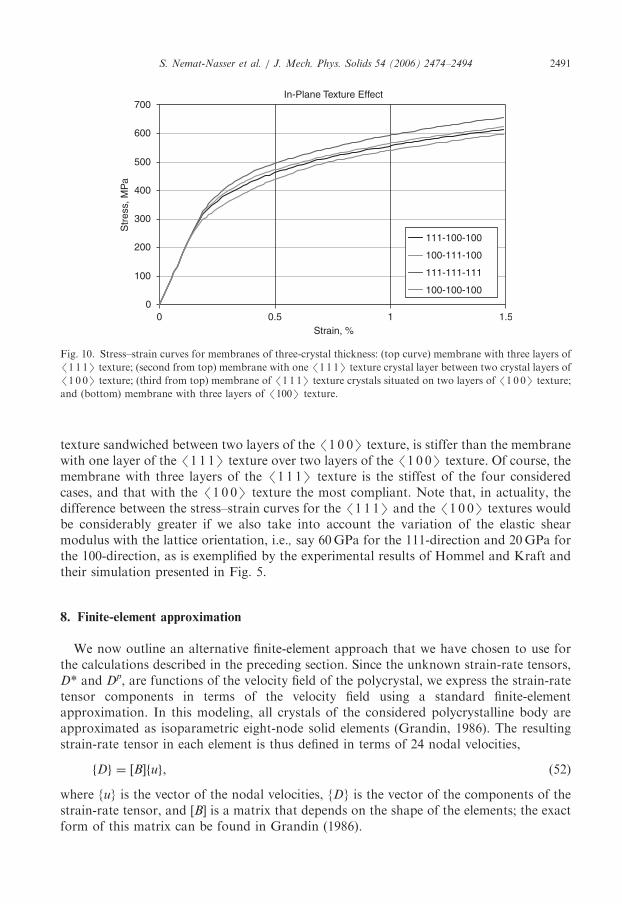
texture sandwiched between two layers of the /1 0 0S texture, is stiffer than the membranewith one layer of the /1 1 1S texture over two layers of the /1 0 0S texture. Of course, themembrane with three layers of the /1 1 1S texture is the stiffest of the four consideredcases, and that with the /1 0 0S texture the most compliant. Note that, in actuality, thedifference between the stress–strain curves for the /1 1 1S and the /1 0 0S textures wouldbe considerably greater if we also take into account the variation of the elastic shearmodulus with the lattice orientation, i.e., say 60GPa for the 111-direction and 20GPa forthe 100-direction, as is exemplified by the experimental results of Hommel and Kraft andtheir simulation presented in Fig. 5.
8. Finite-element approximation
We now outline an alternative finite-element approach that we have chosen to use forthe calculations described in the preceding section. Since the unknown strain-rate tensors,D* and Dp, are functions of the velocity field of the polycrystal, we express the strain-ratetensor components in terms of the velocity field using a standard finite-elementapproximation. In this modeling, all crystals of the considered polycrystalline body areapproximated as isoparametric eight-node solid elements (Grandin, 1986). The resultingstrain-rate tensor in each element is thus defined in terms of 24 nodal velocities,
Df g ¼ B½ � uf g, (52)
where {u} is the vector of the nodal velocities, {D} is the vector of the components of thestrain-rate tensor, and [B] is a matrix that depends on the shape of the elements; the exactform of this matrix can be found in Grandin (1986).
ARTICLE IN PRESS
In-Plane Texture Effect
0
100
200
300
400
500
600
700
0 1 1.50.5Strain, %
Str
ess,
MP
a
111-100-100
100-111-100
111-111-111
100-100-100
Fig. 10. Stress–strain curves for membranes of three-crystal thickness: (top curve) membrane with three layers of
/1 1 1S texture; (second from top) membrane with one /1 1 1S texture crystal layer between two crystal layers of
/1 0 0S texture; (third from top) membrane of /1 1 1S texture crystals situated on two layers of /1 0 0S texture;
and (bottom) membrane with three layers of /100S texture.
S. Nemat-Nasser et al. / J. Mech. Phys. Solids 54 (2006) 2474–2494 2491
In view of the elasto-viscoplastic nature of the constitutive model, two velocity fields areused in our calculations,
fug ¼ fueg þ fupg. (53)
The velocity fields {ue} and {up} correspond to the elastic and viscoplastic deformation ofthe body, respectively. Strain-rate tensor Dp depends only on {up}, and the elastic strain-rate tensor D* depends only on {ue}. In general, a virtual work-rate formulation can beused to find any number of unknown parameters. The additional unknown velocity fieldmakes the solution more cumbersome, but it considerably simplifies our numericalalgorithm, because it eliminates the necessity for numerical treatment of very stiff sets ofdifferential equations, typical in standard elastic-plastic calculations (see Nemat-Nasser,2004, Chapter 5). The velocity field {u} is continuous at the boundaries between finiteelements. There are no continuity conditions for the velocity field {up} that corresponds tothe plastic deformation. To model the uniaxial tension, the boundary conditionscorresponding to a prescribed uniform tensile velocity field and stress-free lateral surfacesare considered for the unit cell shown in Fig. 9.Finite-element approximations reduce Eq. (41) to a set of non-linear equations for the
unknown nodal velocities, {u} and {up}. This set of equations is solved by iteration. Ateach iteration step, the non-linear velocity function Eq. (29) is linearized as follows:
tðaaÞð_gðaaÞÞ �tðaaÞð_gðaaÞ
p Þ
_gðaaÞp
_gðaaÞ, (54)
where the slip rates _gðaaÞp are taken from the preceding iteration step. Convergence of an
iteration process of this kind has been investigated by Olevsky and Maximenko (1994).Here, the accuracy of the iteration is considered to be sufficient when the change in thevalue of the average stresses in the membrane from iteration to iteration in the volume ofthe polycrystalline body does not exceed 0.01%. Finite-element calculations have beentested by comparison against single-crystal stress–strain curves obtained by the plastic-predictor/elastic-corrector method and shown in the previous chapters of the article.Once the velocity field in the crystals is found, the spin O* is calculated according to
Eq. (11), and the increment of rigid-body rotation is estimated using Eq. (9), which, fromthe Cayley–Hamilton theorem (Nemat-Nasser et al., 1998), becomes
DR� ¼ 1þsin oo
O� dtþ1� cos o
o2ðO�DtÞ2; o2 ¼ �
tr ðO�DtÞ2� �
2, (55,56)
The new orientation of the slip systems is then obtained from,
pðaaÞtþDt ¼ DR�p
ðaaÞt DR�T. (57)
All quantities at time t are now calculated and the iteration is repeated.
9. Conclusions
By means of illustrative examples, the sample-size effects, observed in the plasticdeformation of very thin metallic membranes, are examined. Two different origins of thesize effect have been addressed by numerical simulations, the orientational incompatibilityof the crystals and the potential effect of surface contamination in very thin membranes.
ARTICLE IN PRESSS. Nemat-Nasser et al. / J. Mech. Phys. Solids 54 (2006) 2474–24942492

It is shown that an increase of the yield stress with a decrease of the membrane thicknessmost likely is caused by the effect of orientational incompatibility of adjacent crystals andby surface hardness due to oxidation or contamination, both of which generally areinsignificant when there are a sufficient number of interior crystals through the membranethickness. A crystal plasticity model can qualitatively account for such size effects. When,in addition, a physics-based experimentally supported slip model is used, excellentquantitative results are obtained. We have demonstrated this by direct calculation,providing quantitative results, in full accord with data on thin copper membranes, usingthe values of the constitutive parameters that have been experimentally evaluated byNemat-Nasser and Li (1998) for OFHC copper. The fact that the direct application of a
physics-based dislocation model of crystal plasticity, without any adjustment in the already
published values of the involved constitutive parameters, accurately reproduces the results of
two sets of independent experiments on thin copper films of various thicknesses, clearly
underscores the efficacy of this general approach to material modeling. While dislocation-based physical models of the kind presented in this work naturally involve severalmicroscopic dislocation-based length scales, these length scales have little if any relation tothe macroscopic length scales in the phenomenological gradient plasticity models. Thosemodels include, in an ad hoc manner, the gradients of the plastic strains in theirconstitutive relations, thereby producing free parameters with physical dimension of lengththat are then used to fit data in specific cases, or are used for other purposes.
References
Balendran, B., Nemat-Nasser, S., 1993a. Double sliding model for cyclic deformation of granular materials,
including dilatancy effects. J. Mech. Phys. Solids. 41 (3), 573–612.
Balendran, B., Nemat-Nasser, S., 1993b. Viscoplastic flow of planar granular materials. Mech. Mater. 16 (1–2),
1–12.
Cailletaud, G., Diard, O., Feyel, F., Forest, S., 2003. Computational crystal plasticity: from single crystal to
homogenized polycrystals. Tech. Mech. 23, 130–145.
Choi, Y., Suresh, S., 2002. Size effect on the mechanical properties of thin polycrystalline metal films on
substrates. Acta Mat. 50, 1881–1893.
Espinosa, H.D., Prorok, B.C., Pang, B., 2004. Plasticity size effect in free-standing submicron polycrystalline FCC
films subjected to pure tension. J. Mech. Phys. Solids 52, 667–689.
Fleck, N.A., Hutchinson, J.W., 2001. A reformulation of a class of strain gradient plasticity theories. J. Mech.
Phys. Solids 49, 2245–2271.
Fleck, N.A., Muller, G.M., Ashby, M.F., Hutchinson, J.W., 1994. Strain gradient plasticity: theory and
experiment. Acta Metall. 42, 475–487.
Grandin, H., 1986. Fundamentals of the Finite Element Method. Macmillan, New York.
Havner, K., 1992. Finite Plastic Deformation of Crystalline Solids. Cambridge University Press, Cambridge.
Hommel, M., Kraft, O., 2001. Deformation behavior of thin copper films on deformable substrates. Acta Mater.
49, 3935–3947.
Hutchinson, J.W., 2000. Plasticity at the micron scale. Int. J. Solids Struct. 37, 225–238.
Kapoor, R., Nemat-Nasser, S., 1998. Determination of temperature rise during high strain rate deformation.
Mech. Mat. 27, 1–12.
Kocks, U.F., Argon, A., Ashby, M.F., 1975. Thermodynamics and kinetics of slip. Progress in Materials Science,
19. Pergamon, New York, pp. 68–170.
Nemat-Nasser, S., Isaacs, J.B., Starrett, J.E., 1991. Hopkinson techniques for dynamic recovery experiments.
Proc. R. Soc. London A 435, 371–391.
Nemat-Nasser, S., Isaacs, J., 1997. Direct measurement of isothermal flow stress of metals at elevated
temperatures and high strain rates with application to Ta and Ta–W alloys. Acta Mater. 45 (3), 907–919.
ARTICLE IN PRESSS. Nemat-Nasser et al. / J. Mech. Phys. Solids 54 (2006) 2474–2494 2493
Nemat-Nasser, S., 2004. Plasticity: A Treatise on the Finite Deformation of Heterogeneous Inelastic Materials.
Cambridge University Press, Cambridge.
Nemat-Nasser, S., Li, S.Y., 1998. Flow stress of F.C.C. polycrystals with application to OFHC Cu. Acta Mater.
46, 565–577.
Nemat-Nasser, S., Okinaka, T., 1996. A new computational approach to crystal plasticity: fcc single crystal.
Mech. Mater. 24, 43–57.
Nemat-Nasser, S., Ni, L., Okinaka, T., 1998. A constitutive model for fcc crystals with application to
polycrystalline OFHC copper. Mech. Mater. 30, 325–341.
Olevsky, E., Maximenko, A., 1994. Nonstationary problems of the quasistatic theory of hardening plastic bodies.
Comp. Mater. Sci. 3, 247–253.
Ono, K., 1968. Temperature dependence of dispersed barrier hardening. J. Appl. Phys. 39, 1803–1806.
Orowan, E., 1934. Zur Kristallplastizitat-I, II, III. Zeit. Phys. 89, 605–613, 614–633, 634–659.
Polanyi, M., 1934. Uber eine Art Gitterstorung, die eine Kristall plastisch machen konnte. Zeit Phys. 89, 660–664.
Stroh, A.N., 1953. A theoretical calculation of the strored energy in a work-hardened material. Proc. R. Soc.
London B 67, 391–400.
Taylor, G.I., 1934. The mechanism of plastic deformation of crystals—I, II. Proc. R. Soc. Lond. A. 145, 362–387,
388–404.
Wu, T.Y., Bassani, J.L., Laird, C., 1991. Latent hardening in single crystals I. Theory and experiments. Proc. R.
Soc. Lond. A 435, 1–19.
ARTICLE IN PRESSS. Nemat-Nasser et al. / J. Mech. Phys. Solids 54 (2006) 2474–24942494


![Forefronts in structure–performance models of separation ... · increasingly thinner ‘skin’ layers in phase-separated membranes (e.g. Refs. [4,11,12]), ultra-thin silicon membranes](https://static.fdocuments.net/doc/165x107/60696278de9f530b5c3efe03/forefronts-in-structureaperformance-models-of-separation-increasingly-thinner.jpg)


