Modeling the Motivation-Learning Interface in Learning and Decision Making (FA9550-06-1-0204)
78
Modeling the Motivation-Learning Interface in Learning and Decision Making (FA9550-06-1-0204) PI’s: W. Todd Maddox (University of Texas, Austin) & Arthur B. Markman (University of Texas, Austin) AFOSR Joint Program Review - Cognition and Decision Program and Human-System Interface Program (Jan 28-30, 2009, Arlington, VA)
-
Upload
stone-caldwell -
Category
Documents
-
view
28 -
download
3
description
AFOSR Joint Program Review - Cognition and Decision Program and Human-System Interface Program (Jan 28-30, 2009, Arlington, VA). Modeling the Motivation-Learning Interface in Learning and Decision Making (FA9550-06-1-0204). PI ’ s: W. Todd Maddox (University of Texas, Austin) & - PowerPoint PPT Presentation
Transcript of Modeling the Motivation-Learning Interface in Learning and Decision Making (FA9550-06-1-0204)
Modeling the Motivation-Learning Interface in Learning and Decision
Making(FA9550-06-1-0204)
PI’s: W. Todd Maddox (University of Texas, Austin) & Arthur B. Markman (University of Texas, Austin)
AFOSR Joint Program Review - Cognition and Decision Program andHuman-System Interface Program (Jan 28-30, 2009, Arlington, VA)
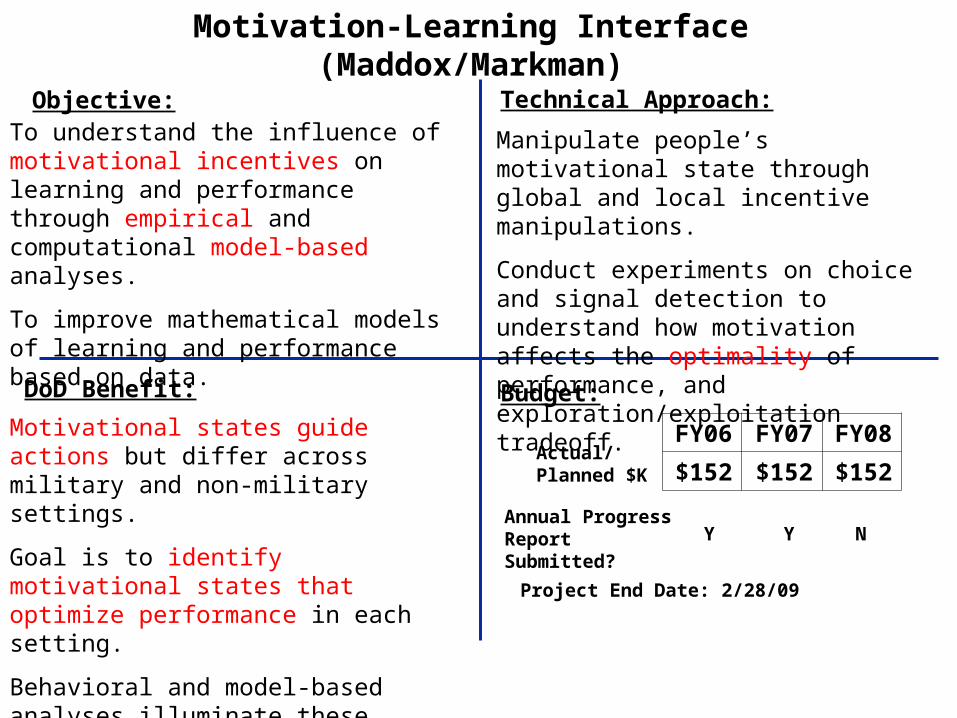
Motivation-Learning Interface (Maddox/Markman)
Objective:
DoD Benefit:
Technical Approach:
Budget:
Actual/Planned $K
FY06 FY07 FY08
$152 $152 $152
Annual Progress Report Submitted? Y Y N
Project End Date: 2/28/09
To understand the influence of motivational incentives on learning and performance through empirical and computational model-based analyses.
To improve mathematical models of learning and performance based on data.
Manipulate people’s motivational state through global and local incentive manipulations.
Conduct experiments on choice and signal detection to understand how motivation affects the optimality of performance, and exploration/exploitation tradeoff.
Motivational states guide actions but differ across military and non-military settings.
Goal is to identify motivational states that optimize performance in each setting.
Behavioral and model-based analyses illuminate these effects and characterize them along an exploration-exploitation continuum.

List of Project Goals
1. Develop and test a choice/gambling task
2. Examine and model motivational influences on this choice task
3. Examine and model variants of this task
4. Explore social influences on motivation, learning and performance
5. Extend to and model related tasks (signal detection, decision criterion learning, dynamic decision making)

Progress Towards Goals (or New Goals)
1. Develop and test a choice/gambling taskDone
2. Examine and model motivational influences on this choice taskInitial studies completed and published
3. Examine and model variants of this taskSome competed and published; others in progress
4. Explore social influences on motivation, learning, and performanceInitial studies completed and published; others in progress
5. Extend to and model related tasks (signal detection, decision criterion learning, dynamic decision making)Work in progress

Research Questions
• What does it mean to “motivate” someone to do “well”?
• How do we achieve this aim?
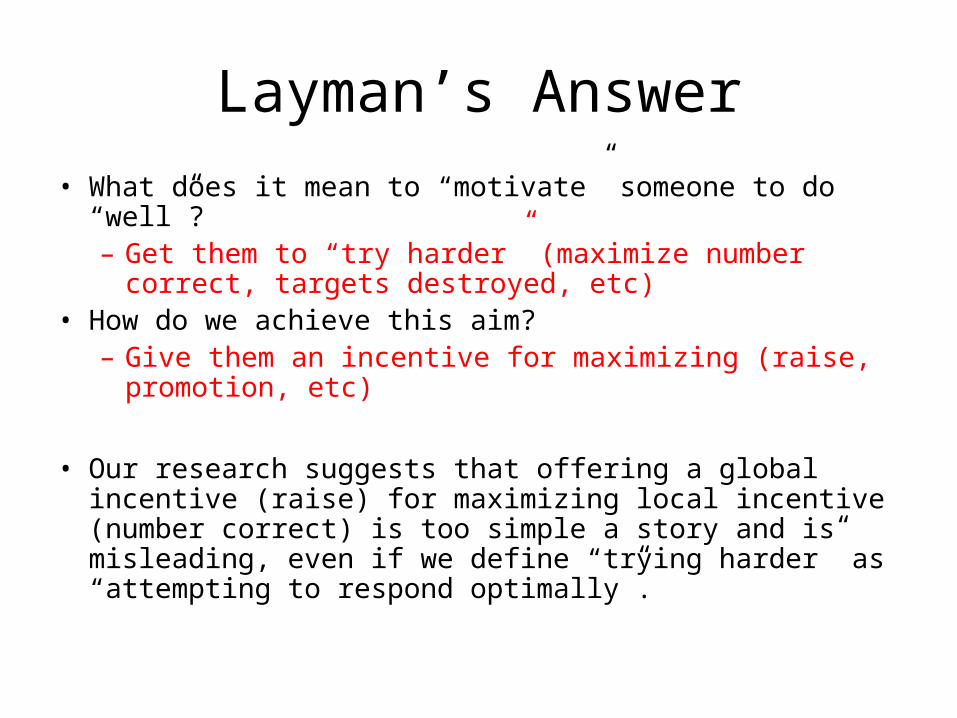
Layman’s Answer
• What does it mean to “motivate” someone to do “well”?– Get them to “try harder” (maximize number correct,
targets destroyed, etc)• How do we achieve this aim?
– Give them an incentive for maximizing (raise, promotion, etc)
• Our research suggests that offering a global incentive (raise) for maximizing local incentive (number correct) is too simple a story and is misleading, even if we define “trying harder” as “attempting to respond optimally”.
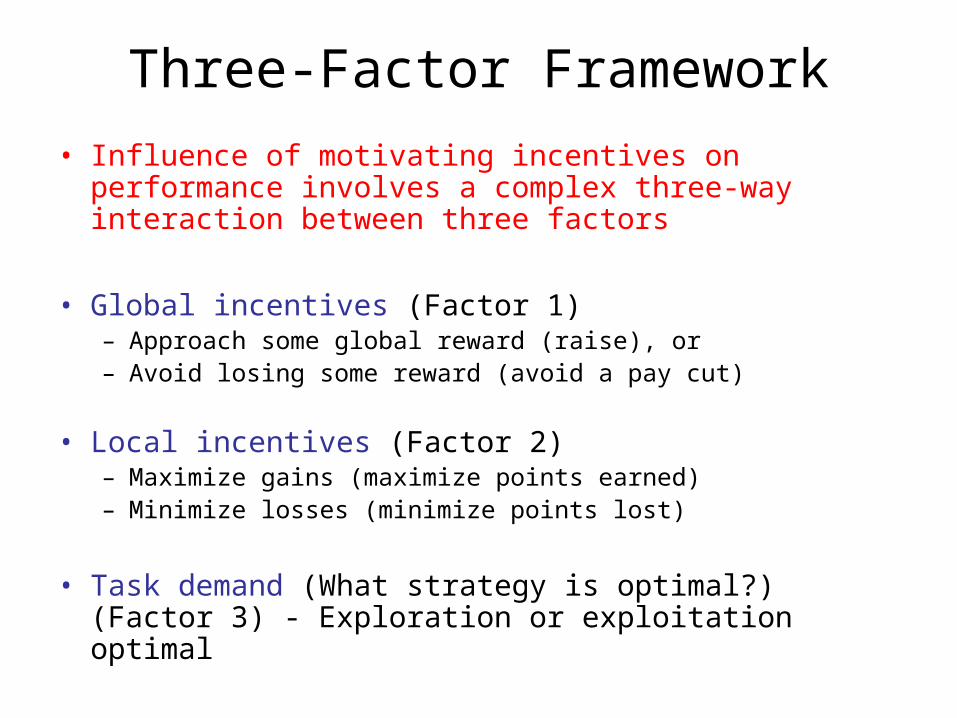
Three-Factor Framework
• Influence of motivating incentives on performance involves a complex three-way interaction between three factors
• Global incentives (Factor 1)– Approach some global reward (raise), or– Avoid losing some reward (avoid a pay cut)
• Local incentives (Factor 2)– Maximize gains (maximize points earned)– Minimize losses (minimize points lost)
• Task demand (What strategy is optimal?) (Factor 3) - Exploration or exploitation optimal
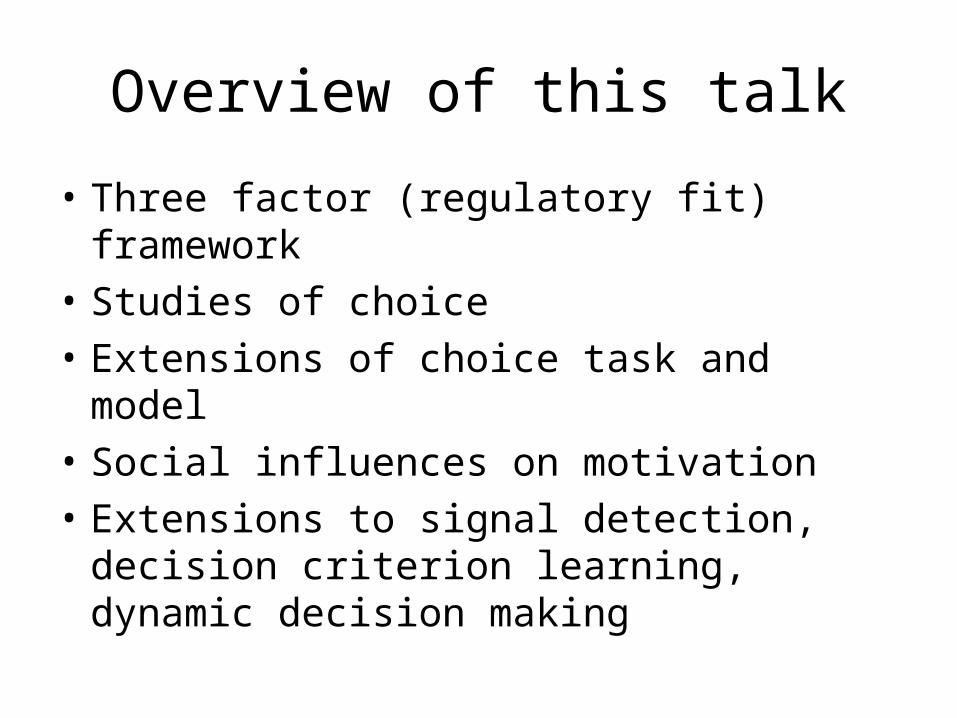
Overview of this talk
• Three factor (regulatory fit) framework
• Studies of choice
• Extensions of choice task and model
• Social influences on motivation
• Extensions to signal detection, decision criterion learning, dynamic decision making

Global Incentives(Regulatory Focus)
Approach
(Promotion Focus)
Achieve Global Task Performance Criterion
Raffle ticket for $50
Avoidance
(Prevention Focus)
Achieve Global Task Performance Criterion
Keep $50 raffle ticket given initially
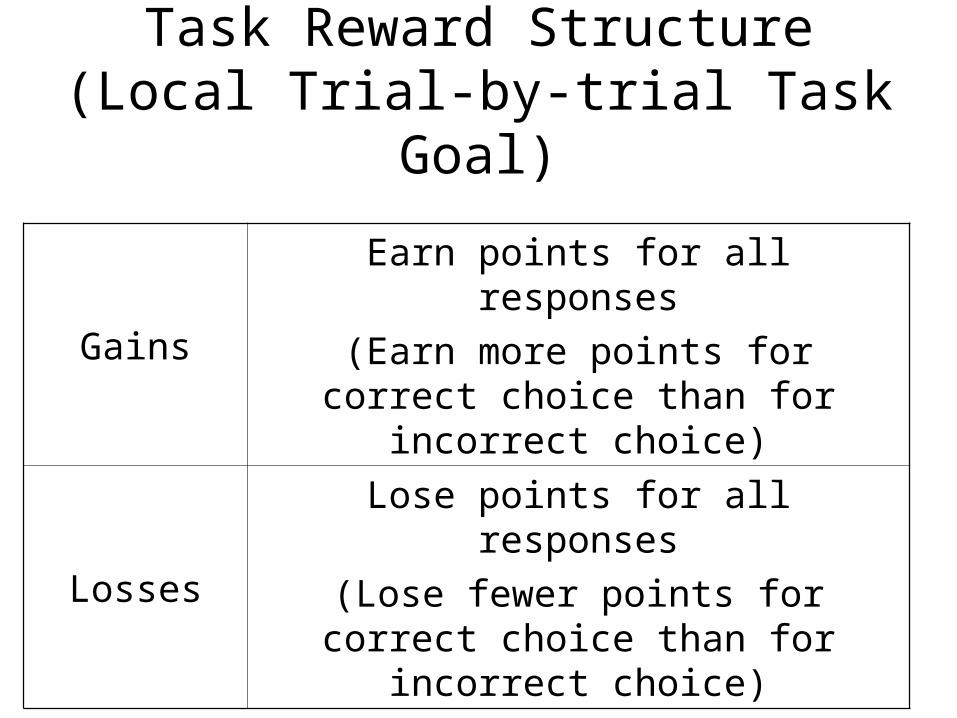
Task Reward Structure(Local Trial-by-trial Task Goal)
GainsEarn points for all responses
(Earn more points for correct choice than for incorrect choice)
LossesLose points for all responses
(Lose fewer points for correct choice than for incorrect choice)
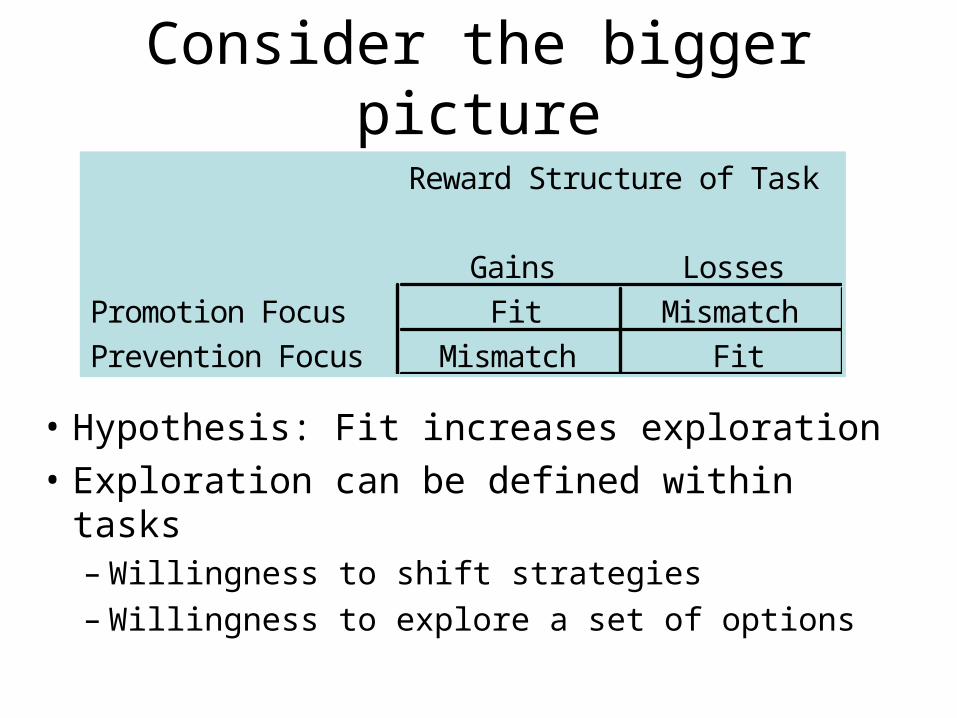
Consider the bigger picture
Reward Structure of Task
Gains LossesPromotion Focus Fit MismatchPrevention Focus Mismatch Fit
• Hypothesis: Fit increases exploration
• Exploration can be defined within tasks– Willingness to shift strategies– Willingness to explore a set of options

Consider the bigger picture
• Almost all cognitive research involves a promotion focus and a gains reward structure– Promotion focus: small monetary reward or social
contract with experimenter.– Gains: reward for correct response, no reward for error
Reward Structure of Task
Gains LossesPromotion Focus Fit MismatchPrevention Focus Mismatch Fit
Fit
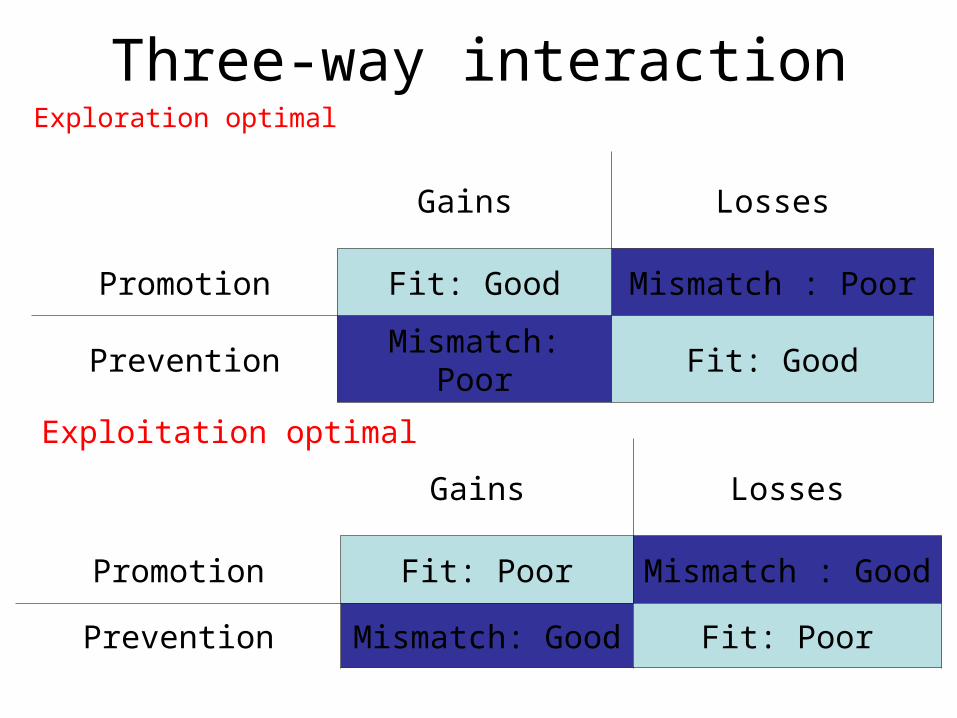
Three-way interactionExploration optimal
Gains Losses
Promotion Fit: Good Mismatch : Poor
Prevention Mismatch: Poor Fit: Good
Exploitation optimal
Gains Losses
Promotion Fit: Poor Mismatch : Good
Prevention Mismatch: Good Fit: Poor
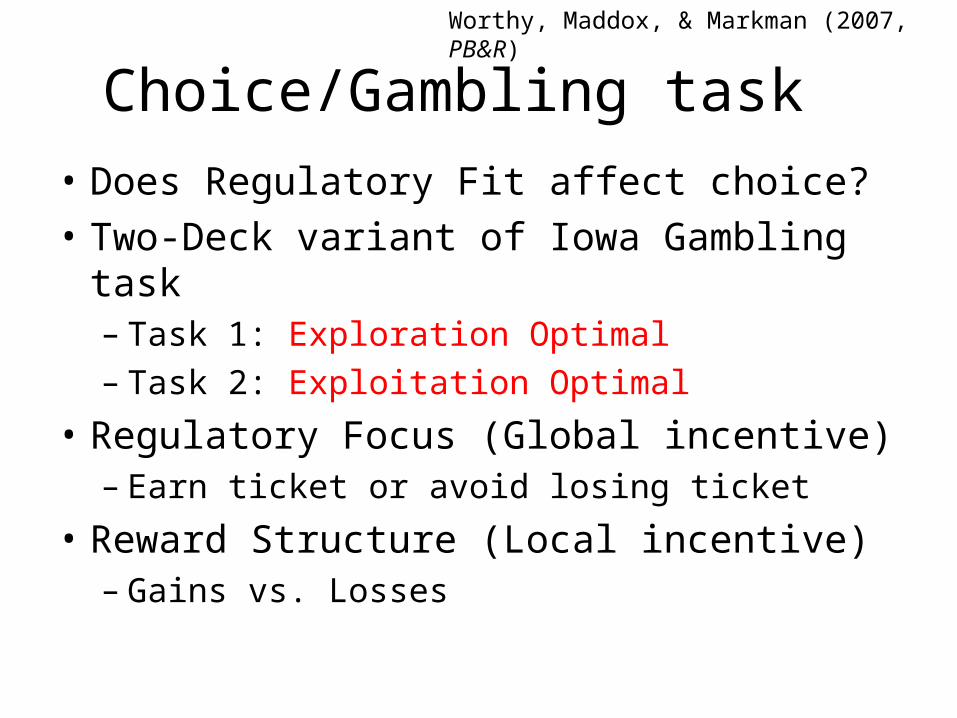
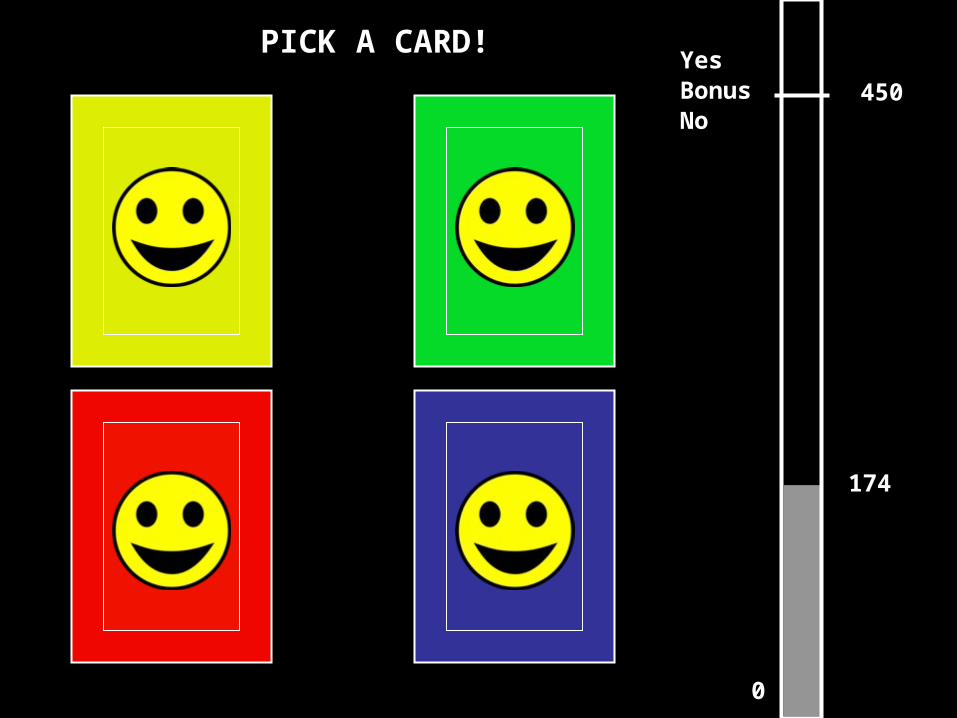
Choice/Gambling task
• Does Regulatory Fit affect choice?
• Two-Deck variant of Iowa Gambling task– Task 1: Exploration Optimal– Task 2: Exploitation Optimal
• Regulatory Focus (Global incentive)– Earn ticket or avoid losing ticket
• Reward Structure (Local incentive)– Gains vs. Losses
Worthy, Maddox, & Markman (2007, PB&R)

Gains Condition Example
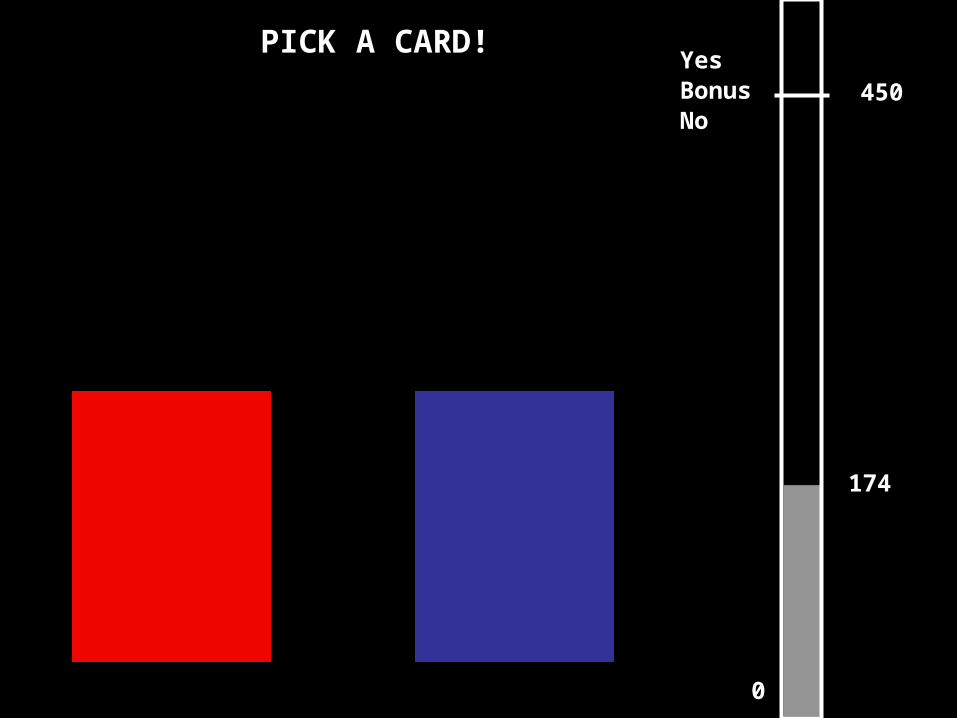
0
PICK A CARD!YesBonus No
450
174
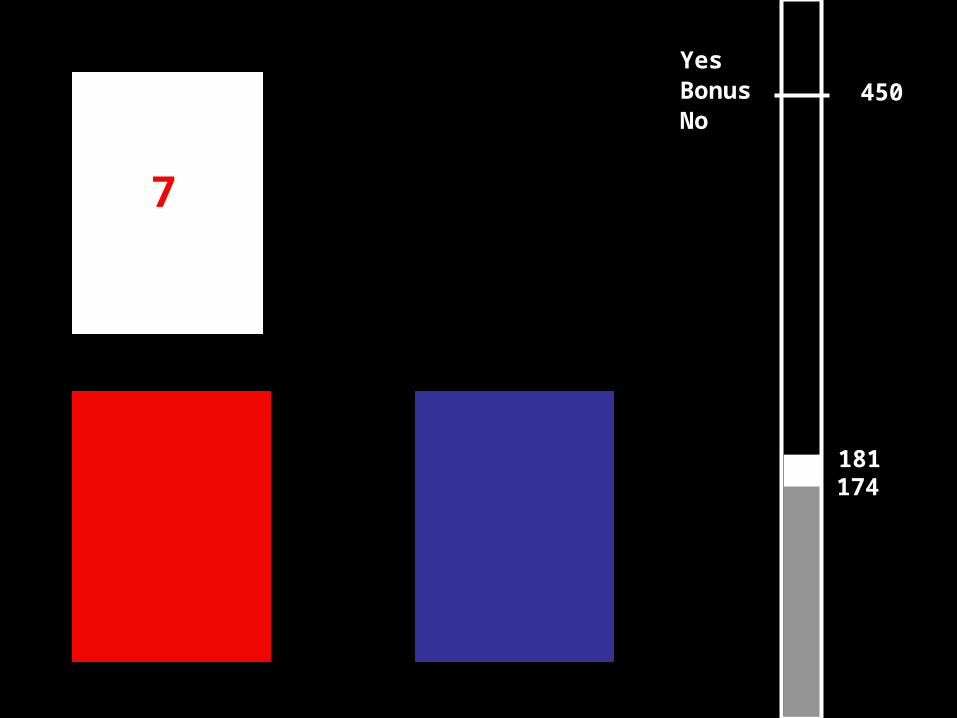
0
174
Correct
181
YesBonus No
450
7

0
PICK A CARD!YesBonus No
450
181
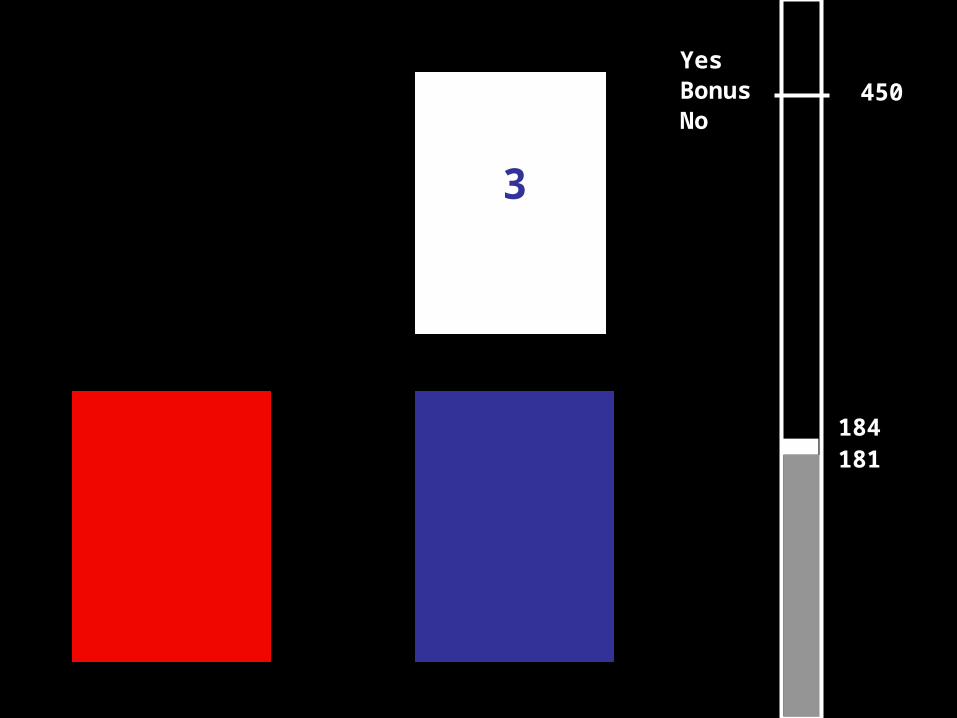
0
181
Correct
184
YesBonus No
450
3

0
PICK A CARD!YesBonus No
450
184

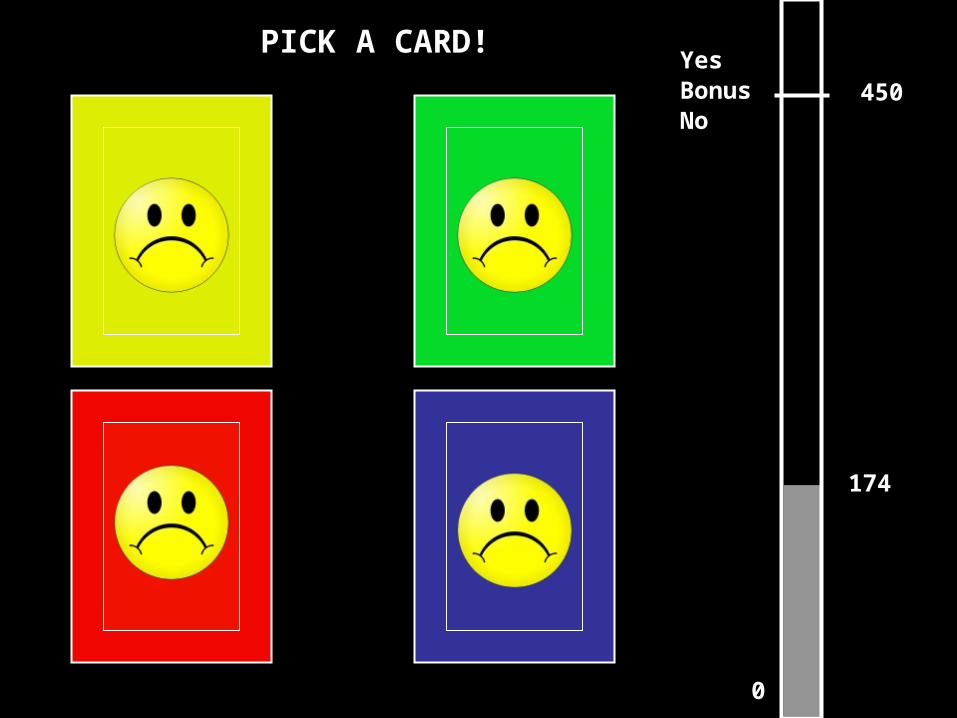
Losses Condition Example

0PICK A CARD!
YesBonus No
- 450
-174
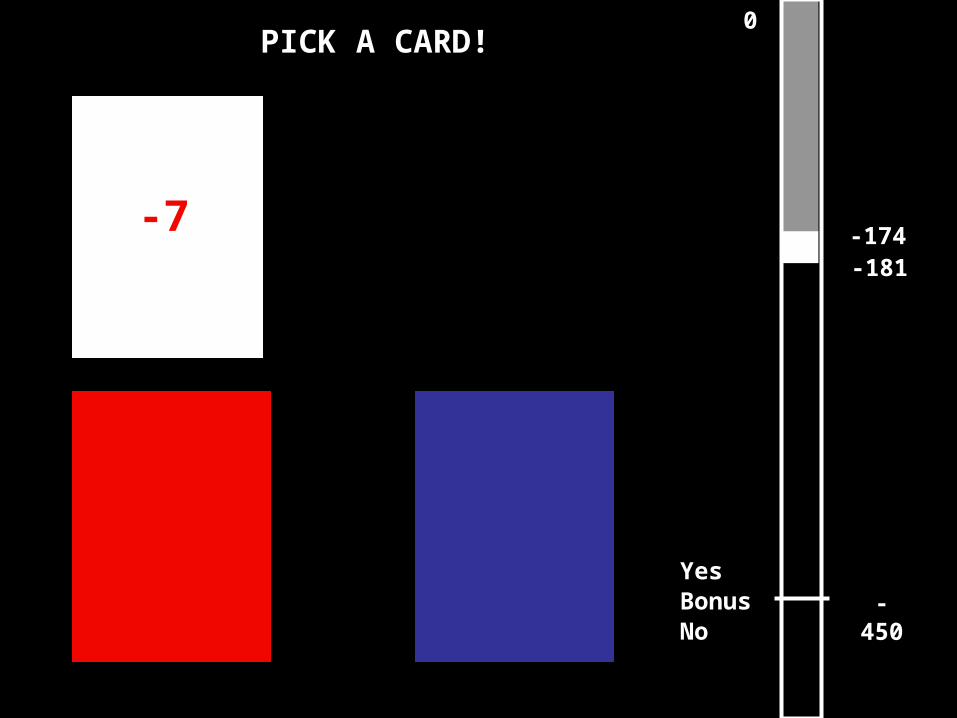
0PICK A CARD!
YesBonus No
- 450
-174-7-181
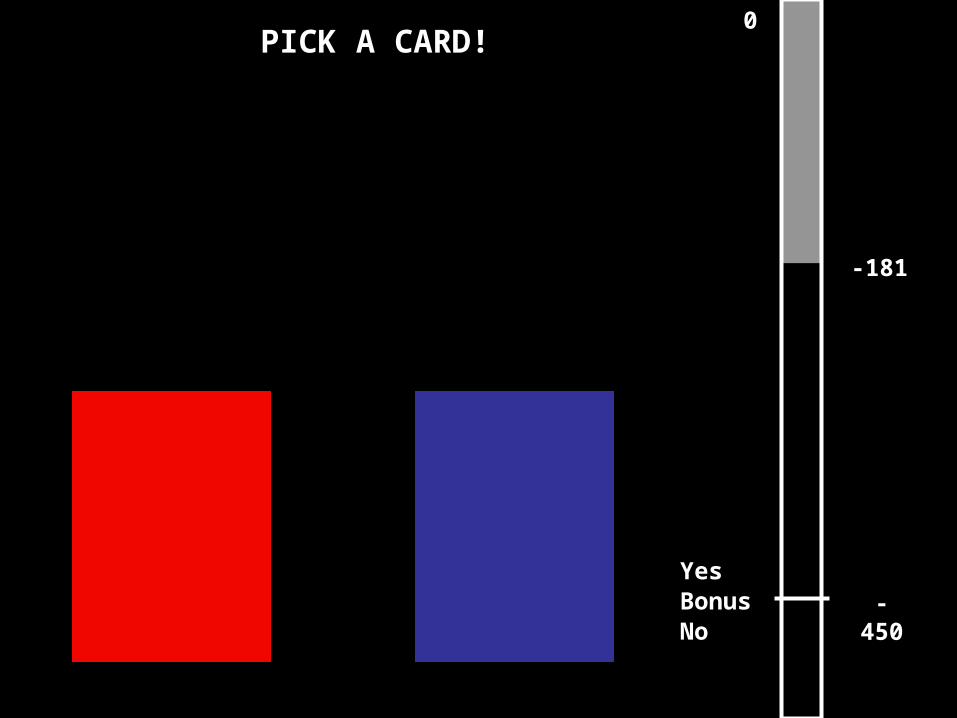
0PICK A CARD!
YesBonus No
- 450
-181
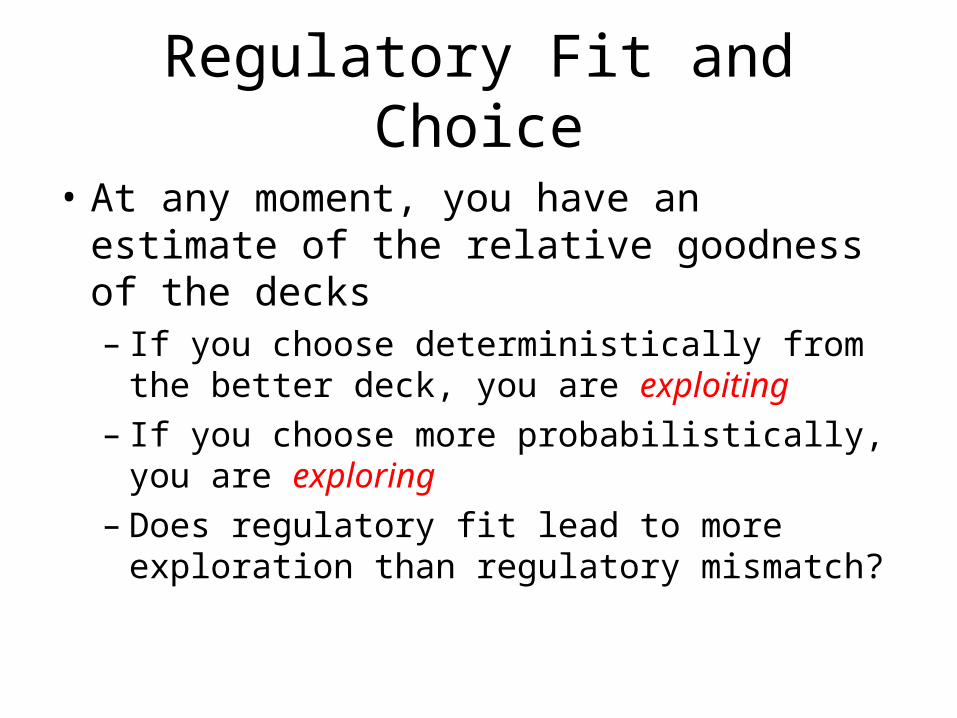
Regulatory Fit and Choice
• At any moment, you have an estimate of the relative goodness of the decks– If you choose deterministically from the better
deck, you are exploiting– If you choose more probabilistically, you are exploring
– Does regulatory fit lead to more exploration than regulatory mismatch?
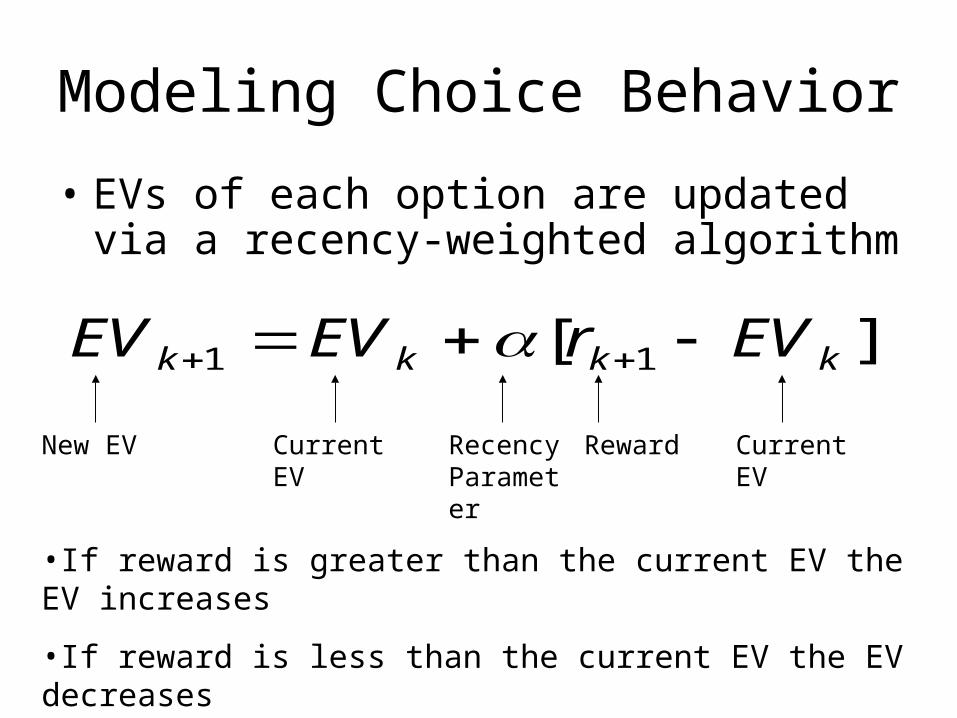
Modeling Choice Behavior
• EVs of each option are updated via a recency-weighted algorithm
][ 11 kkkk EVrEVEV
Current EVNew EV RewardRecency Parameter
Current EV
•If reward is greater than the current EV the EV increases
•If reward is less than the current EV the EV decreases
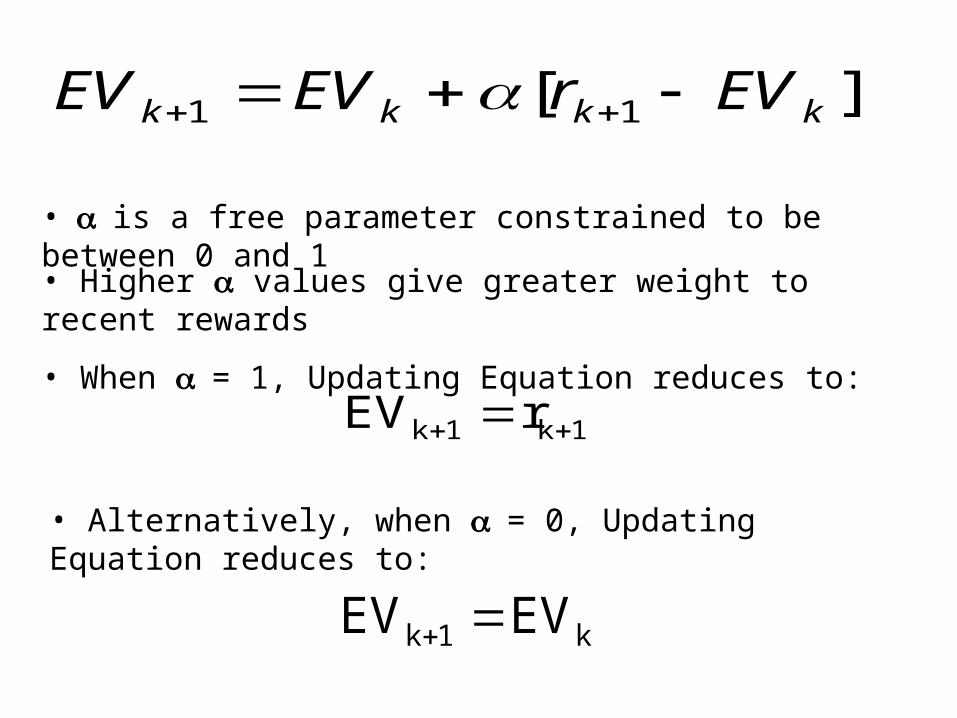
][ 11 kkkk EVrEVEV
•is a free parameter constrained to be between 0 and 1
1k1k rEV
• Higher values give greater weight to recent rewards
• When = 1, Updating Equation reduces to:
• Alternatively, when = 0, Updating Equation reduces to:
k1k EVEV

Action Selection• Action selection is probabilistically determined via choice rules (e.g. Luce, 1959)
Softmax Rule
n
b
bEV
aEV
tat
t
e
eP
1
))((
))((
,
Probability of choosing option “A”
EV for option “A”
Exploitation parameter
Sum of EVs for all options
• Higher values indicate greater exploitation
• Lower values indicate greater exploration
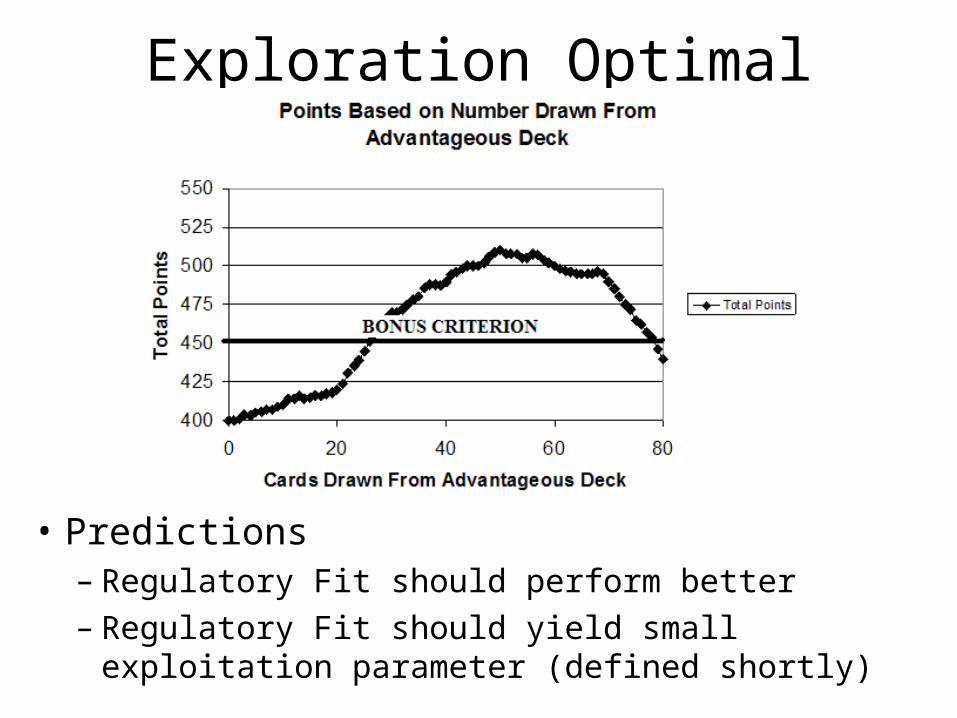
Exploration Optimal
• Predictions– Regulatory Fit should perform better– Regulatory Fit should yield small exploitation
parameter (defined shortly)
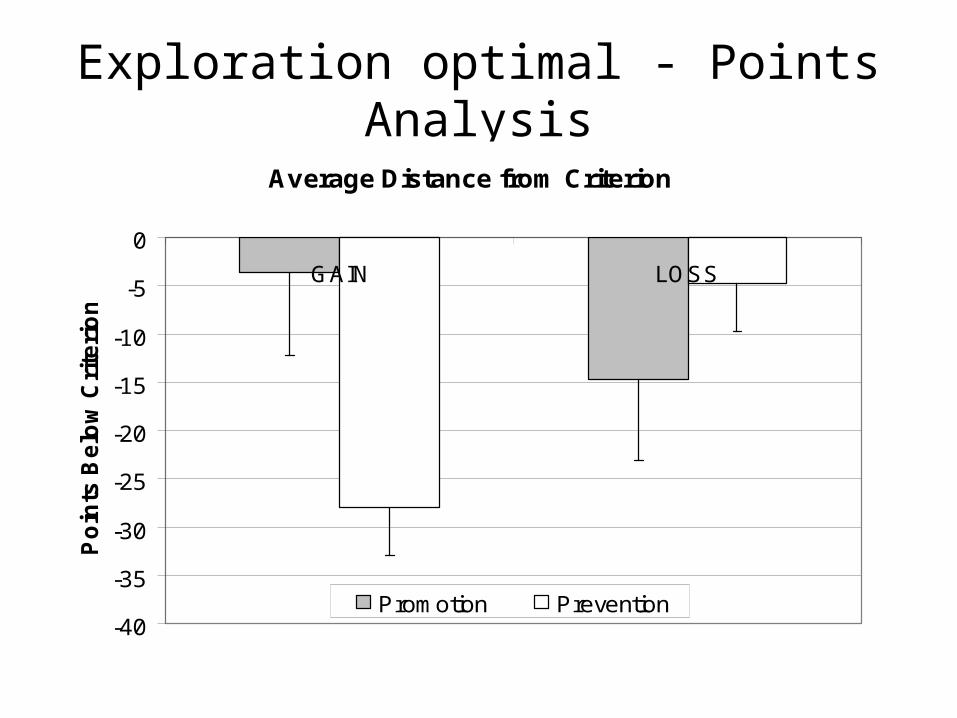
Exploration optimal - Points Analysis
Average Distance from Criterion
-40
-35
-30
-25
-20
-15
-10
-5
0
GAIN LOSS
Po
ints
Be
low
Cri
teri
on
Promotion Prevention
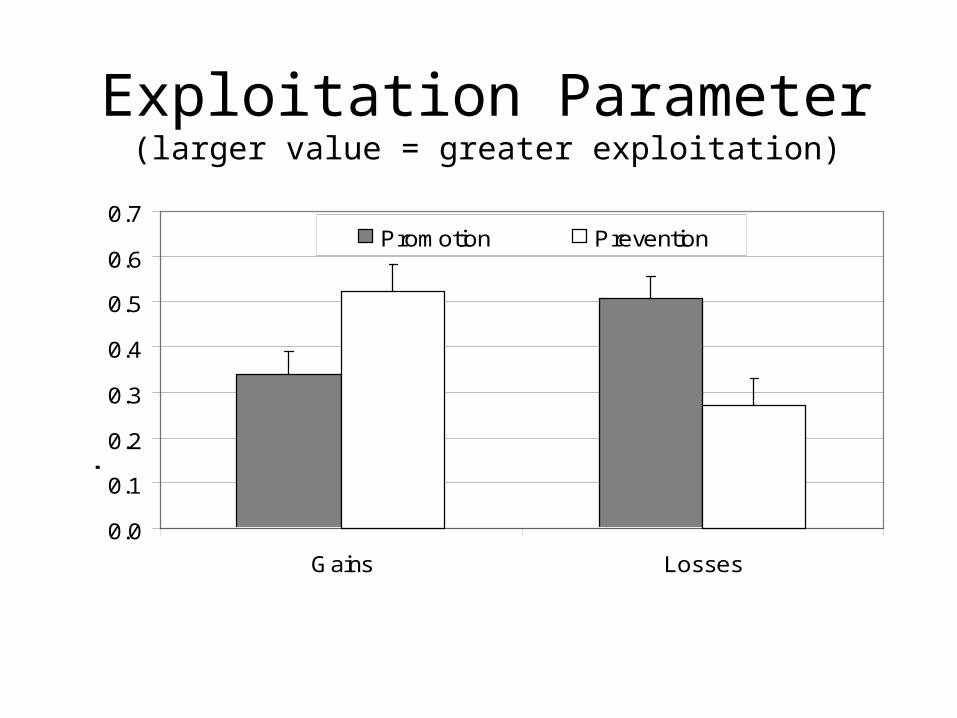
Exploration/Exploitation parameter values
0.0
0.1
0.2
0.3
0.4
0.5
0.6
0.7
Gains Losses
Ex
plo
rati
on
-Ex
plo
ita
tio
n Promotion Prevention
Exploitation Parameter(larger value = greater exploitation)
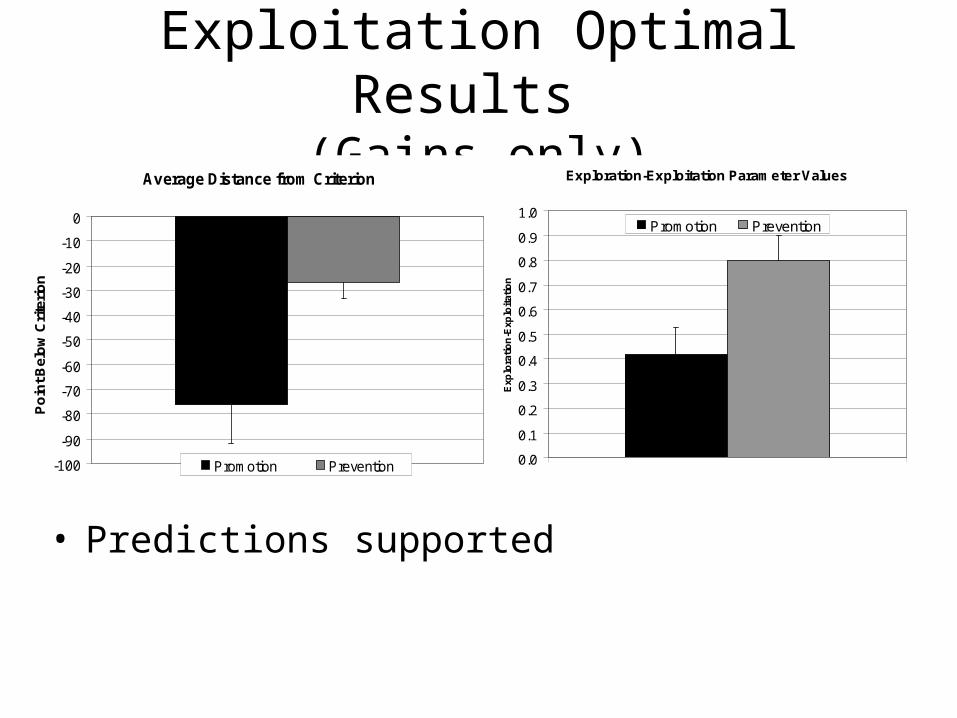
Exploitation Optimal Results (Gains only)
Average Distance from Criterion
-100
-90
-80
-70
-60
-50
-40
-30
-20
-10
0
Po
int B
elo
w C
rite
rio
n
Promotion Prevention
Exploration-Exploitation Parameter Values
0.0
0.1
0.2
0.3
0.4
0.5
0.6
0.7
0.8
0.9
1.0
Exp
lora
tio
n-E
xplo
itat
ion
Promotion Prevention
• Predictions supported
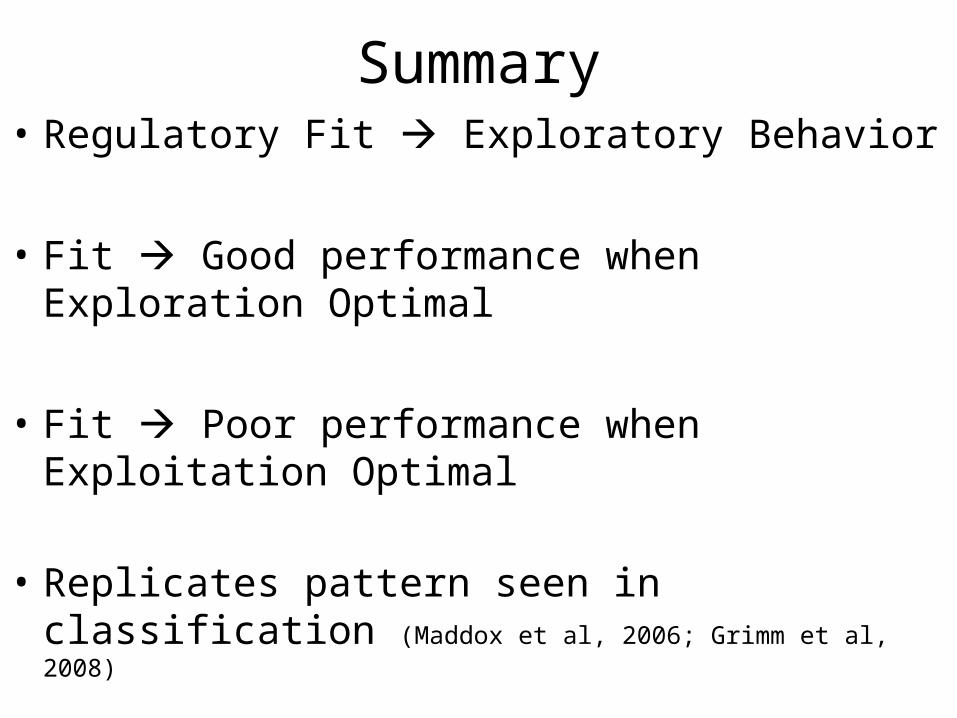
Summary• Regulatory Fit Exploratory Behavior
• Fit Good performance when Exploration Optimal
• Fit Poor performance when Exploitation Optimal
• Replicates pattern seen in classification (Maddox et al, 2006; Grimm et al, 2008)

Affect and Choice
• Four-Deck variant of Iowa Gambling task– Exploitation Optimal
• Alternative method for inducing regulatory focus– Smile vs. Frown faces on all cards
• Reward Structure– Gains vs. Losses
Worthy, Maddox, & Markman (in preparation)
0
PICK A CARD!YesBonus No
450
174
0
PICK A CARD!YesBonus No
450
174
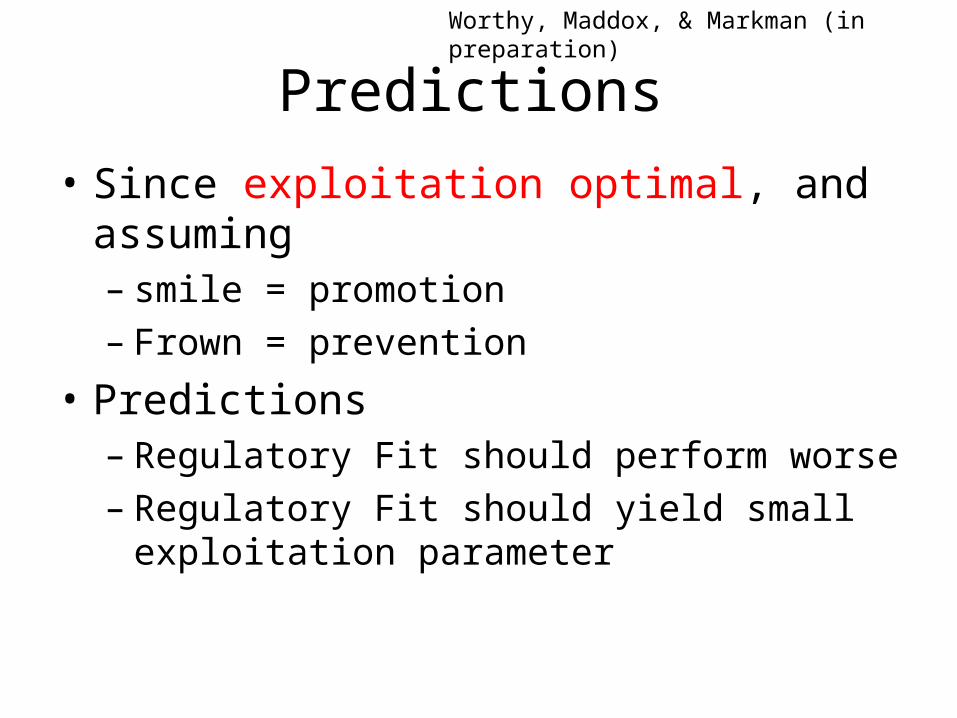
Predictions
• Since exploitation optimal, and assuming– smile = promotion– Frown = prevention
• Predictions– Regulatory Fit should perform worse– Regulatory Fit should yield small exploitation
parameter
Worthy, Maddox, & Markman (in preparation)
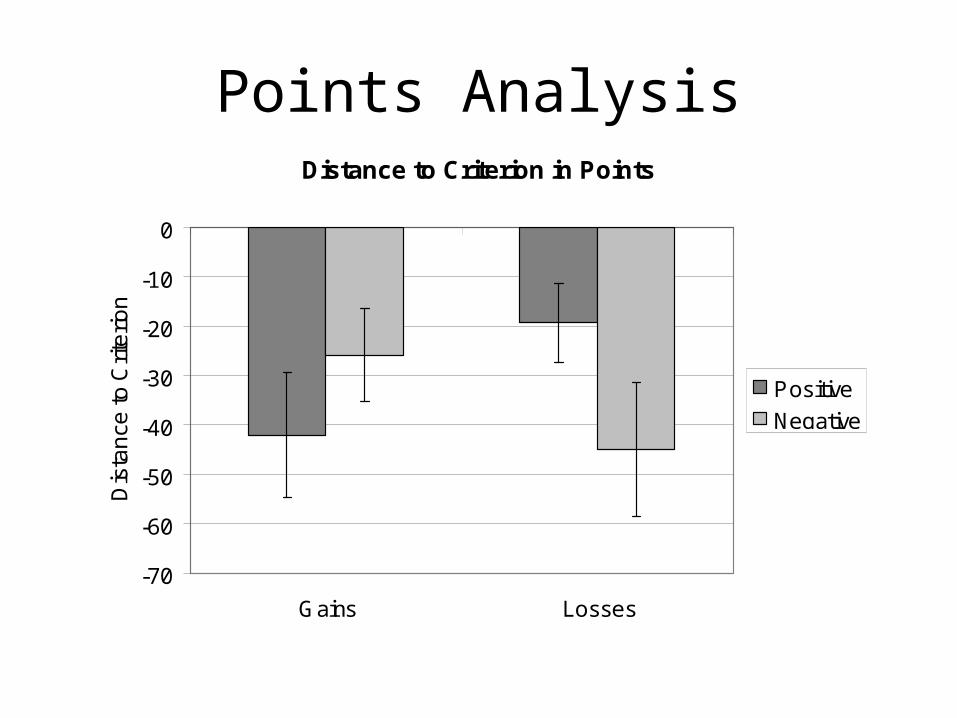
Points AnalysisDistance to Criterion in Points
-70
-60
-50
-40
-30
-20
-10
0
Gains Losses
Dis
tan
ce to
Crit
erio
n
Positive
Negative
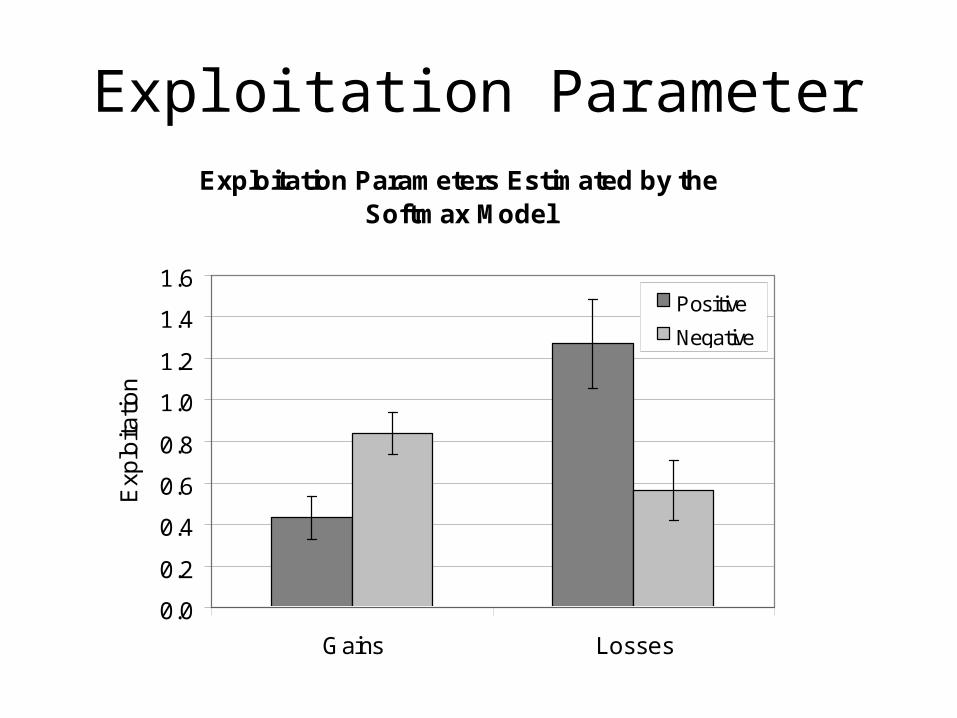
Exploitation ParameterExploitation Parameters Estimated by the
Softmax Model
0.0
0.2
0.4
0.6
0.8
1.0
1.2
1.4
1.6
Gains Losses
Exp
loita
tion
Positive
Negative
Summary• Predictions supported• Same behavioral and model pattern for
regulatory focus and affect manipulation
• Follow-up studies (running)– Exploration optimal task in progress for
affect task.– Model comparison project– Feedback/ITI delays
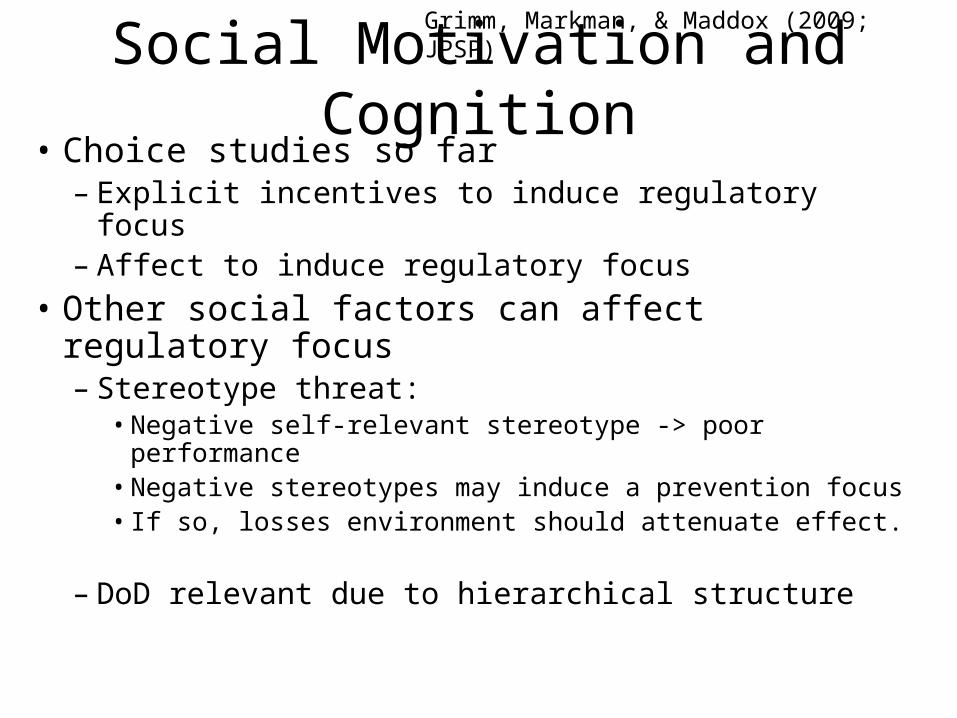
Social Motivation and Cognition• Choice studies so far
– Explicit incentives to induce regulatory focus– Affect to induce regulatory focus
• Other social factors can affect regulatory focus– Stereotype threat:
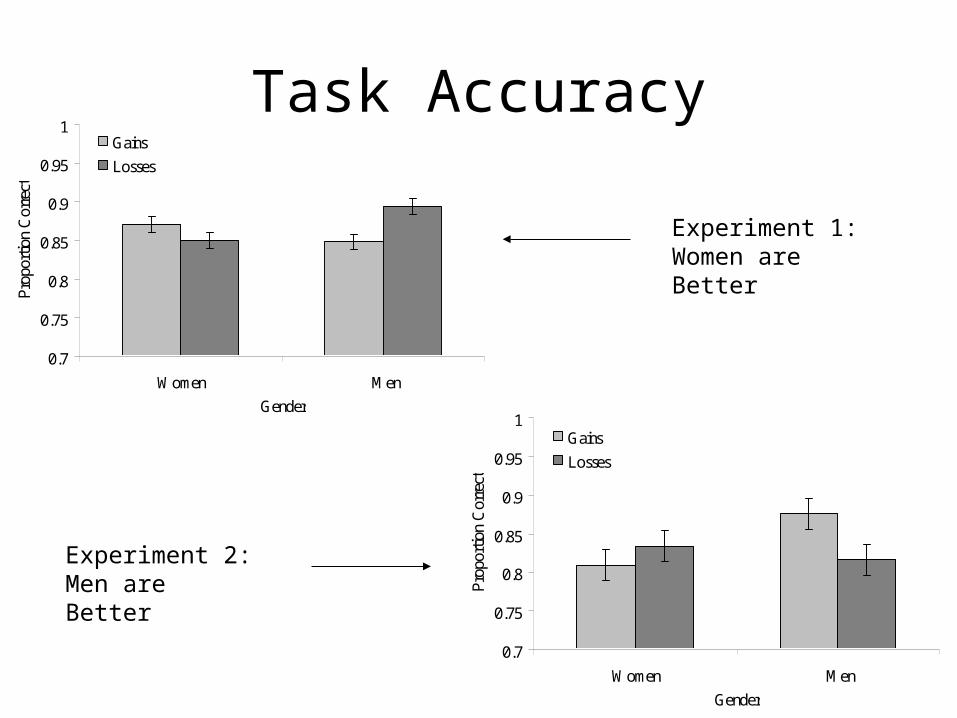
• Negative self-relevant stereotype -> poor performance• Negative stereotypes may induce a prevention focus• If so, losses environment should attenuate effect.
– DoD relevant due to hierarchical structure
Grimm, Markman, & Maddox (2009; JPSP)
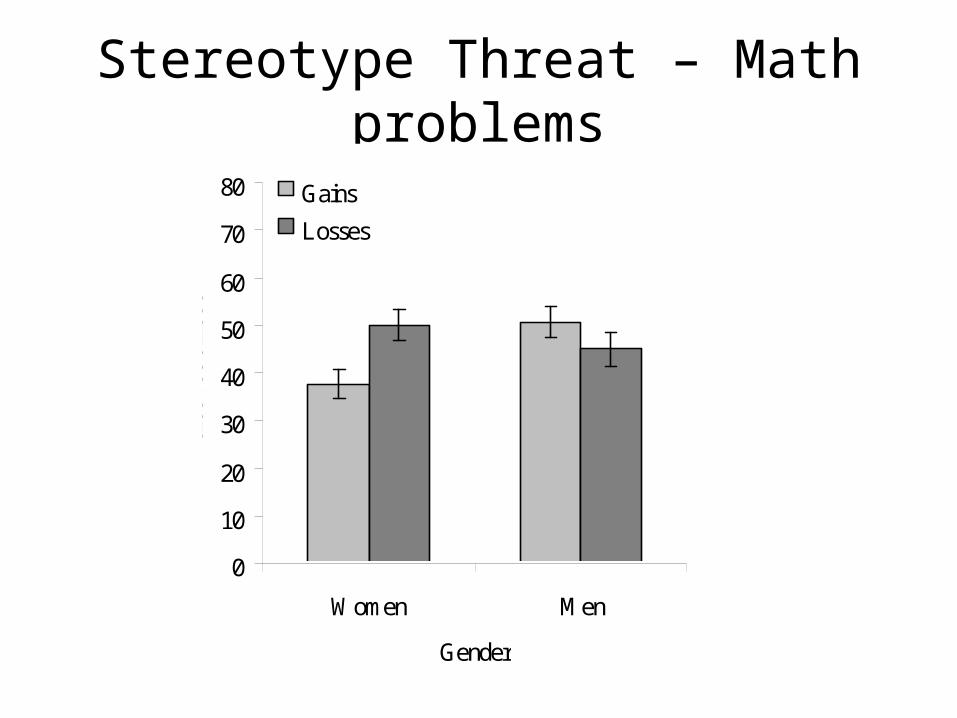
Stereotype Threat – Math problems
0
10
20
30
40
50
60
70
80
Women Men
Gender
Gains
Losses
*
Perc
ent C
orre
ct
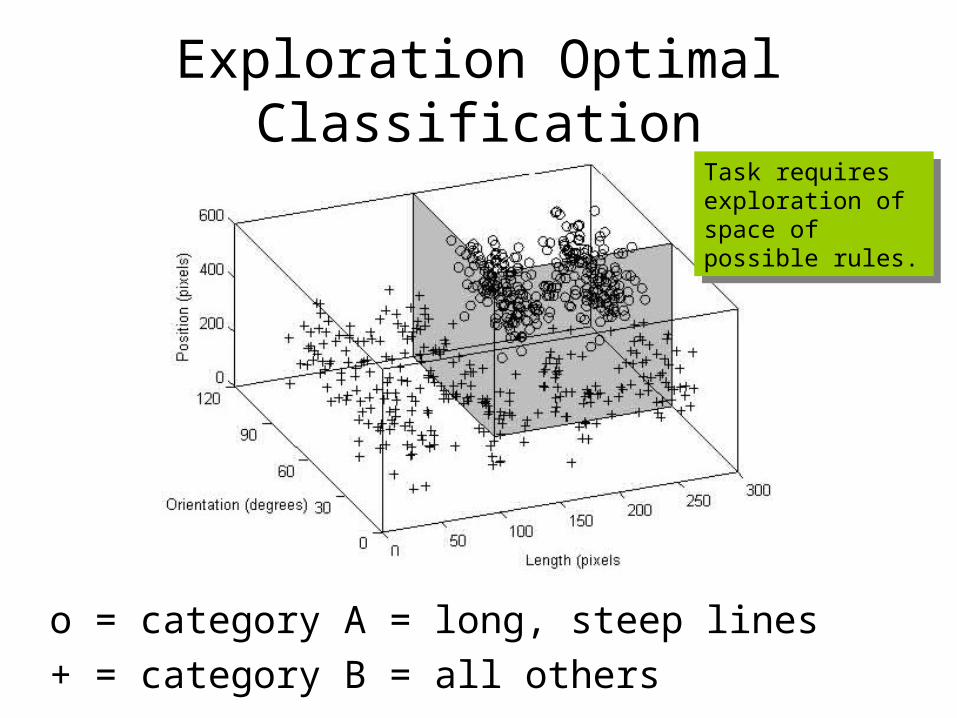
Exploration Optimal Classification
o = category A = long, steep lines
+ = category B = all others
Task requires exploration of space of possible rules.
Task requires exploration of space of possible rules.
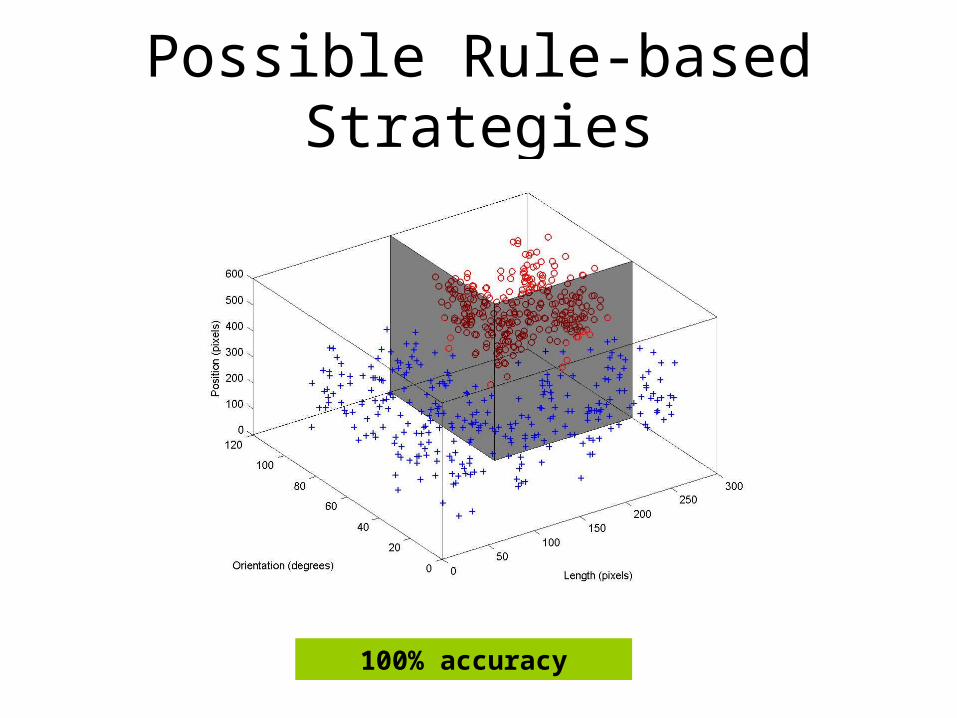
Possible Rule-based Strategies
83% accuracy100% accuracy

Experiment Screen Sample
Gains
Losses
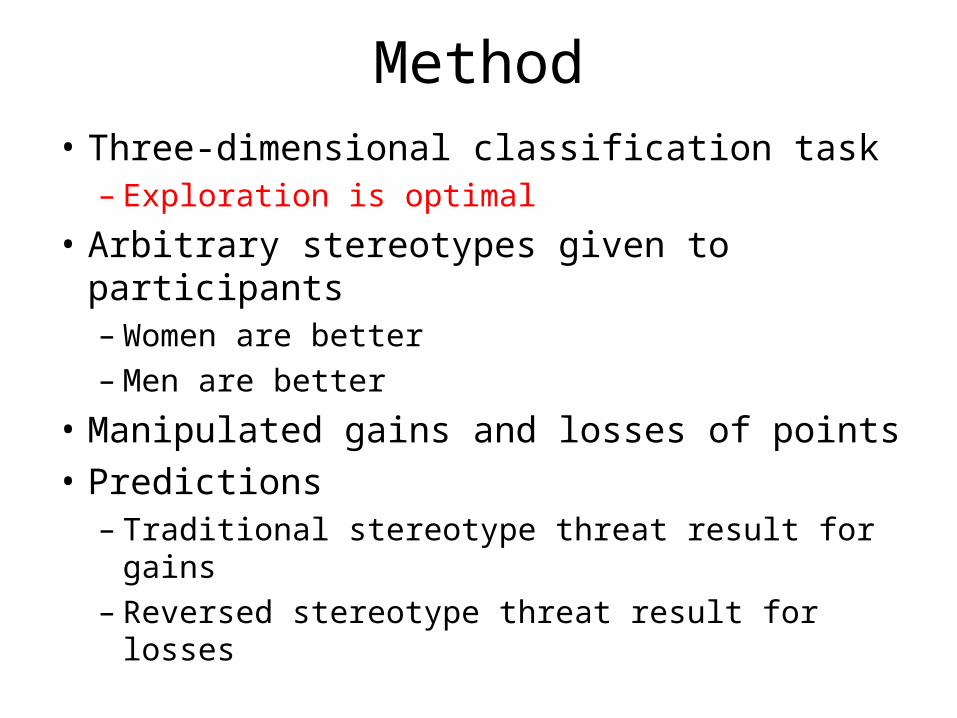
Method
• Three-dimensional classification task– Exploration is optimal
• Arbitrary stereotypes given to participants– Women are better– Men are better
• Manipulated gains and losses of points
• Predictions– Traditional stereotype threat result for gains– Reversed stereotype threat result for losses
0.7
0.75
0.8
0.85
0.9
0.95
1
Women Men
Gender
Pro
port
ion
Cor
rect
Gains
Losses
Task Accuracy
Experiment 1: Women are Better
Experiment 2: Men are Better
0.7
0.75
0.8
0.85
0.9
0.95
1
Women Men
Gender
Pro
port
ion
Cor
rect
Gains
Losses
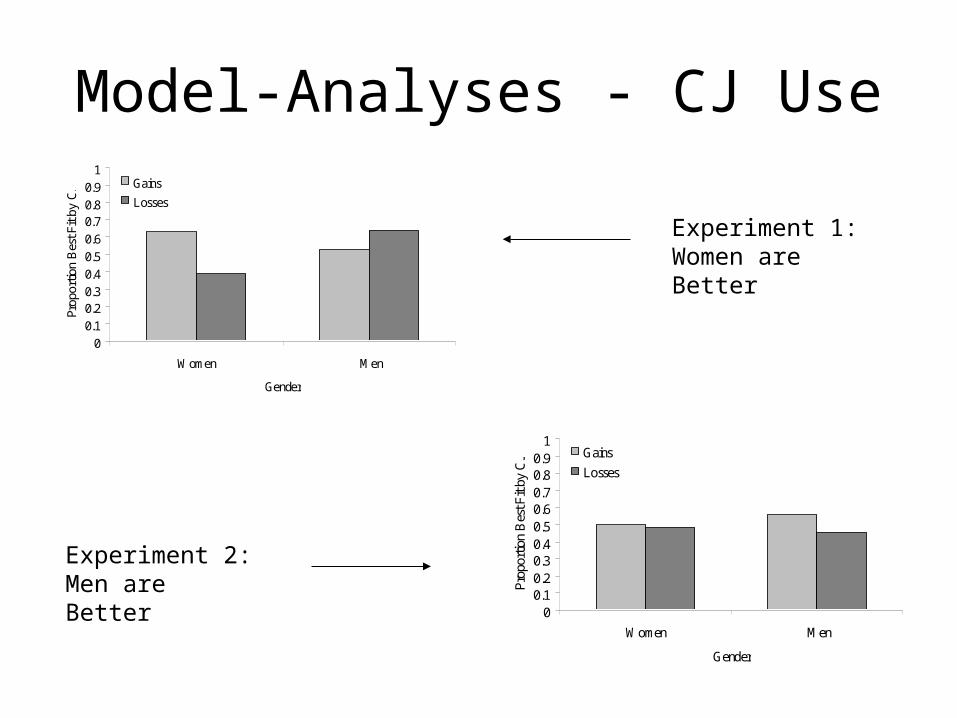
Model-Analyses - CJ Use
0
0.1
0.20.3
0.4
0.5
0.6
0.70.8
0.9
1
Women Men
Gender
Prop
ortio
n B
est F
it by
CJ Gains
Losses
Experiment 1: Women are Better
Experiment 2: Men are Better
00.10.20.30.40.50.60.70.80.9
1
Women Men
Gender
Pro
port
ion
Bes
t Fit
by C
J Gains
Losses
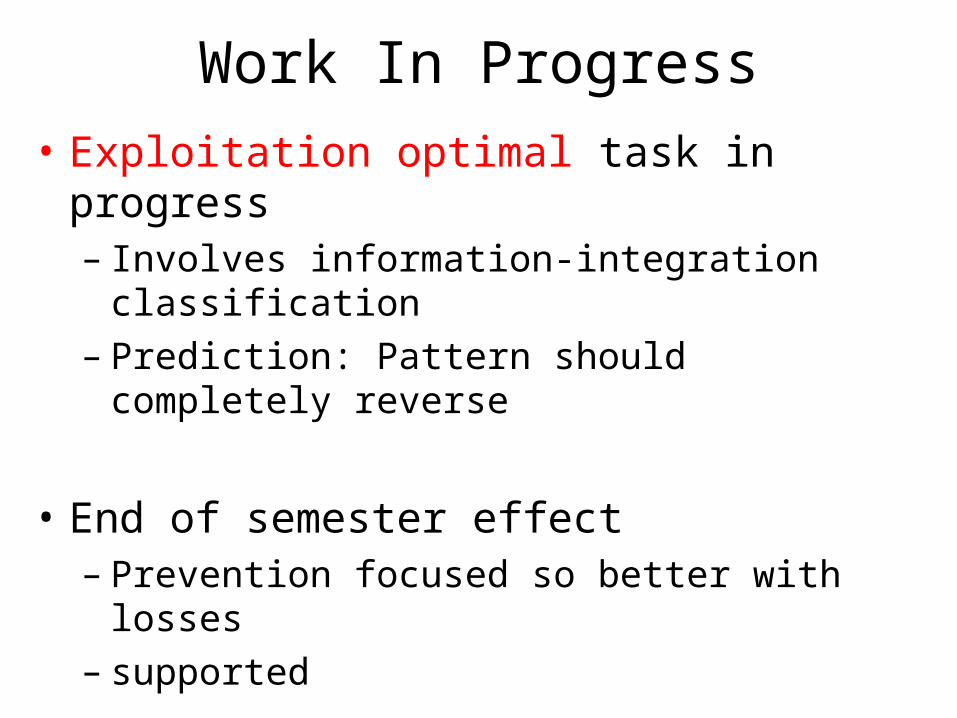
Work In Progress
• Exploitation optimal task in progress– Involves information-integration classification– Prediction: Pattern should completely reverse
• End of semester effect– Prevention focused so better with losses– supported
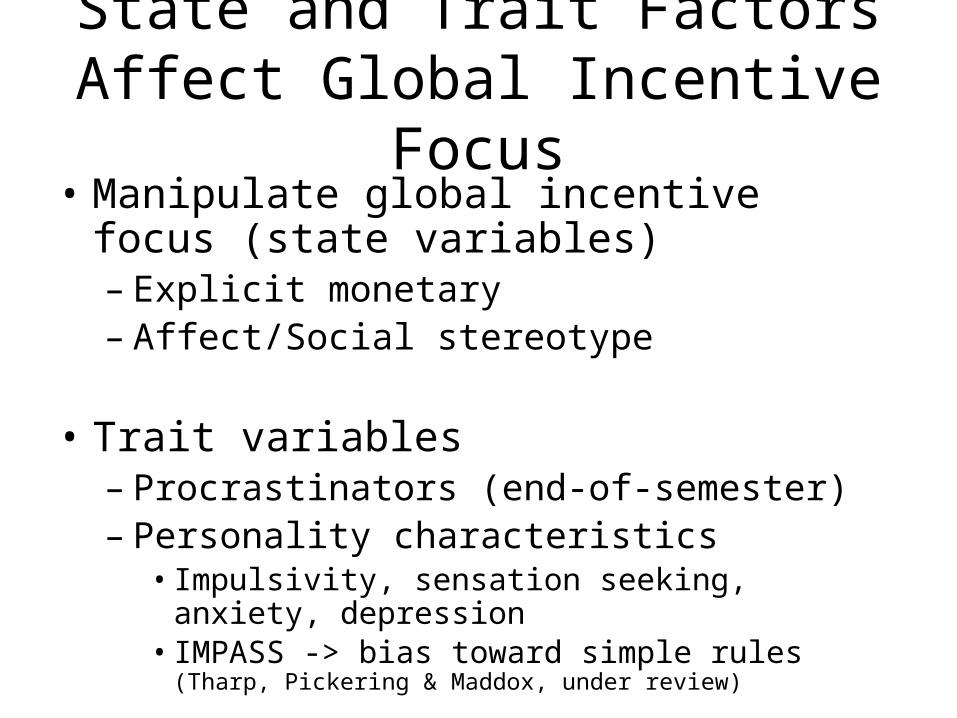
State and Trait Factors Affect Global Incentive Focus
• Manipulate global incentive focus (state variables)– Explicit monetary– Affect/Social stereotype
• Trait variables– Procrastinators (end-of-semester)– Personality characteristics
• Impulsivity, sensation seeking, anxiety, depression• IMPASS -> bias toward simple rules (Tharp, Pickering
& Maddox, under review)
Task and Model Extensions
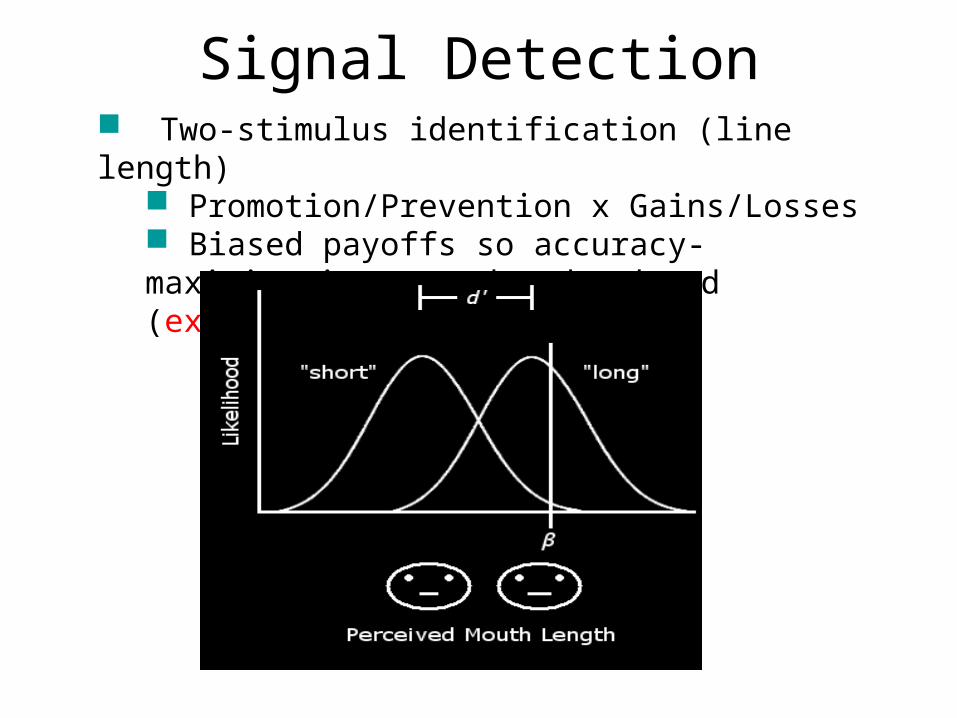
Signal Detection Two-stimulus identification (line length)
Promotion/Prevention x Gains/Losses Biased payoffs so accuracy-maximization must be abandoned (exploration optimal)
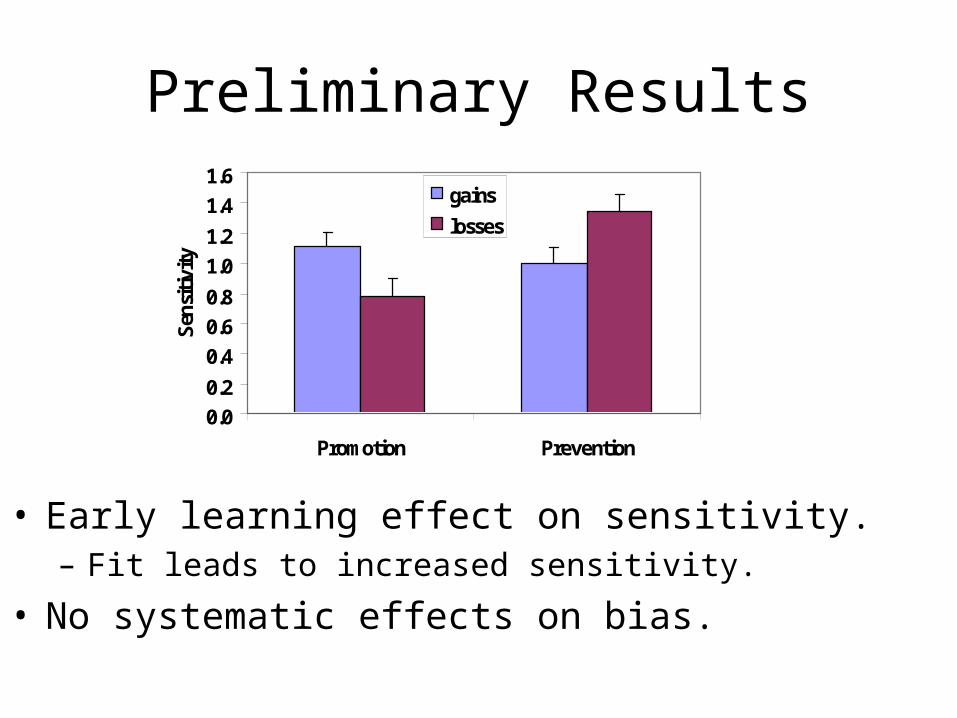
Preliminary Results
0.0
0.2
0.4
0.6
0.8
1.0
1.2
1.4
1.6
Promotion Prevention
Sen
siti
vitygains
losses
• Early learning effect on sensitivity.– Fit leads to increased sensitivity.
• No systematic effects on bias.
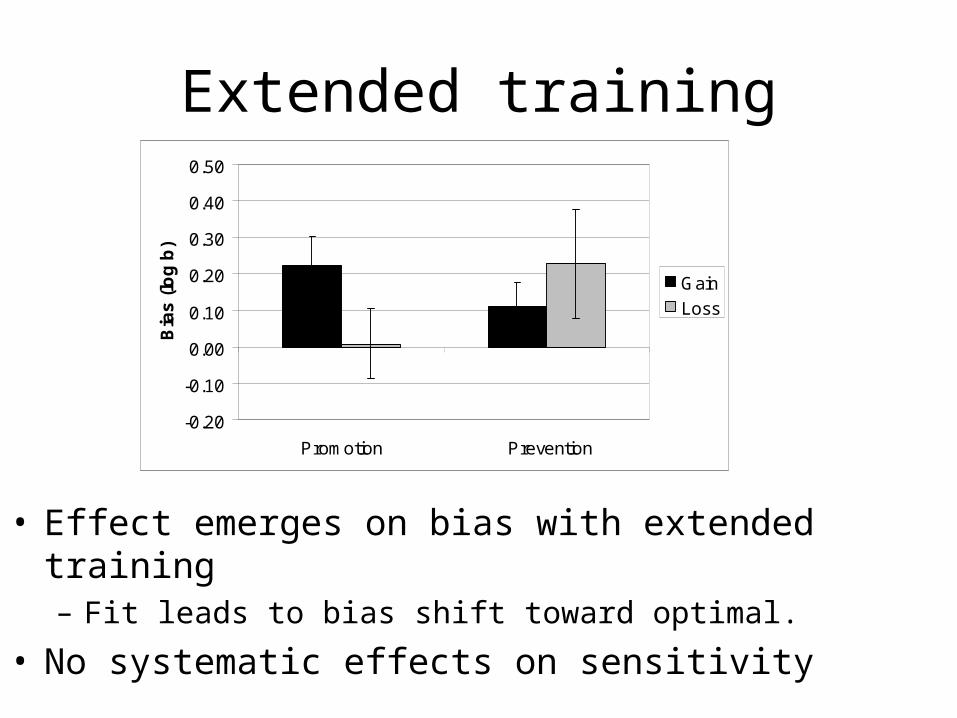
Extended training
-0.20
-0.10
0.00
0.10
0.20
0.30
0.40
0.50
Promotion Prevention
Bia
s (
log
b)
Gain
Loss
• Effect emerges on bias with extended training– Fit leads to bias shift toward optimal.
• No systematic effects on sensitivity

Confidence paradigm
• Classification and Confidence judgment obtained
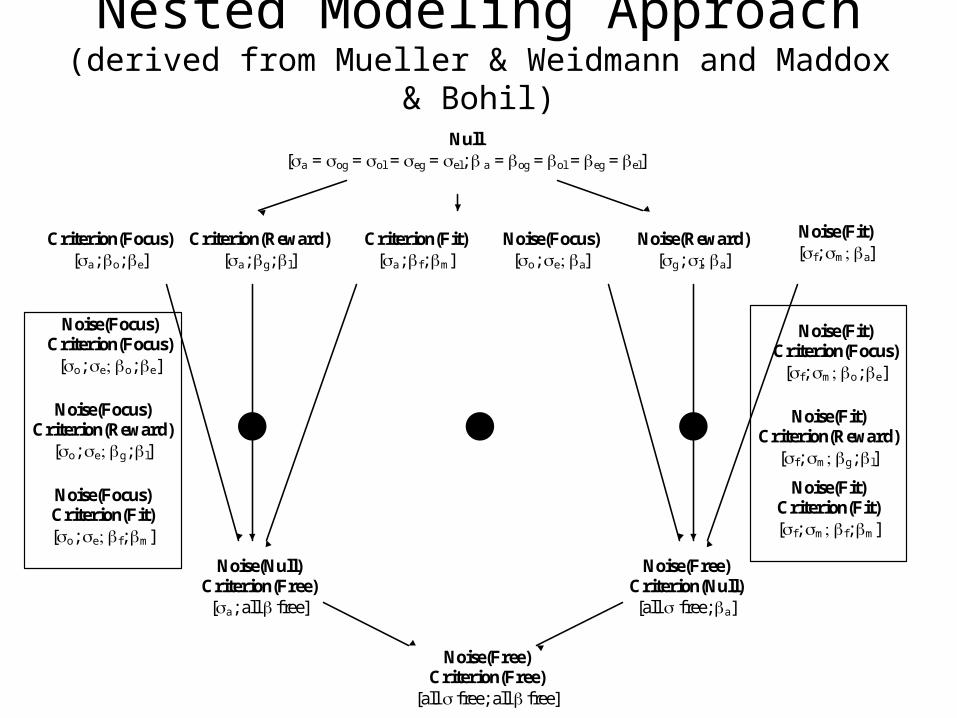
Nested Modeling Approach(derived from Mueller & Weidmann and Maddox & Bohil)
Null [a = og = ol = eg = el; a = og = ol = eg = el]
Criterion(Focus) [a; o; e]
Criterion(Reward) [a; g; l]
Criterion(Fit) [a; f; m]
Noise(Focus) [o; ea]
Noise(Reward) [g; la]
Noise(Fit) [f; ma]
Noise(Fit) Criterion(Focus)
[f; mo; e]
Noise(Fit) Criterion(Reward)
[f; mg; l]
Noise(Fit) Criterion(Fit) [f; mf; m]
Noise(Null) Criterion(Free) [a; all free]
Noise(Free) Criterion(Null) [all free; a]
Noise(Free) Criterion(Free)
[all free; all free]
Noise(Focus) Criterion(Focus)
[o; eo; e]
Noise(Focus) Criterion(Reward)
[o; eg; l]
Noise(Focus) Criterion(Fit) [o; ef; m]
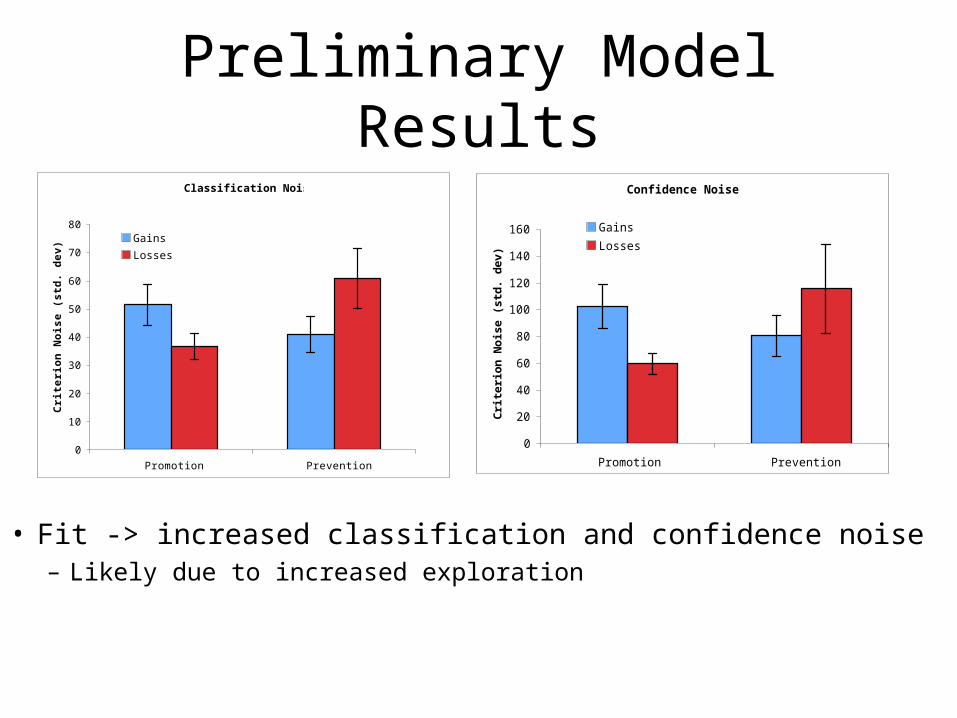
Preliminary Model ResultsClassification Noise
0
10
20
30
40
50
60
70
80
Promotion Prevention
Cri
teri
on
No
ise
(st
d.
de
v)
Gains
Losses
• Fit -> increased classification and confidence noise– Likely due to increased exploration
Confidence Noise
0
20
40
60
80
100
120
140
160
Promotion Prevention
Cri
teri
on
No
ise (
std
. d
ev)
Gains
Losses
Followup• Incorporate into Maddox and Bohil’s Hybrid Model• External decision criterion• ….
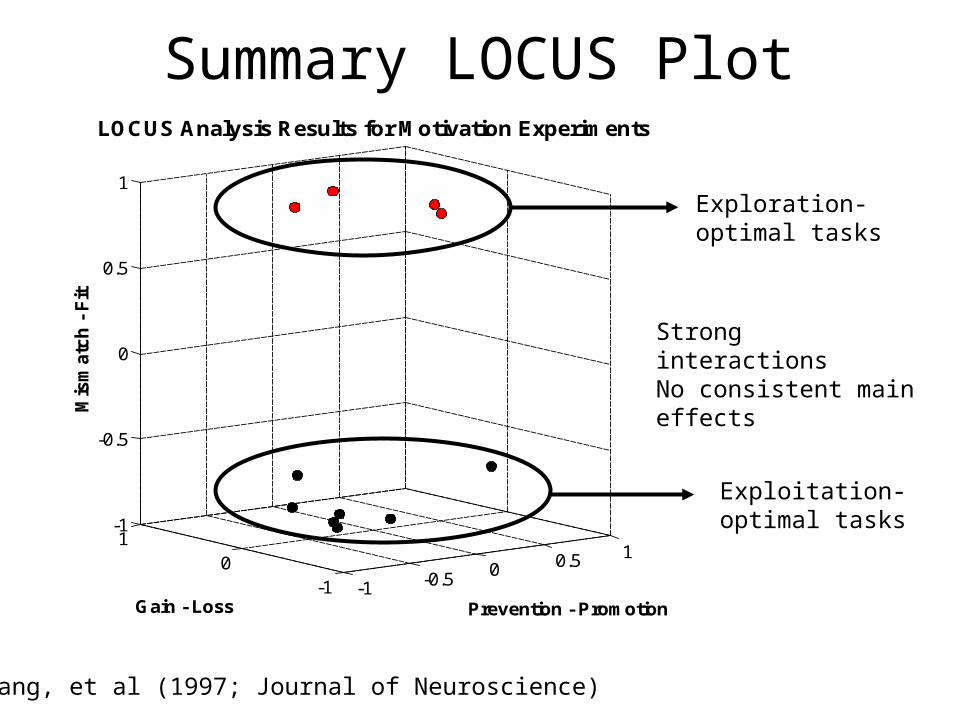
Summary LOCUS Plot
-1 -0.5 0 0.5 1
-10
1-1
-0.5
0
0.5
1
Mis
matc
h -
Fit
LOCUS Analysis Results for Motivation Experiments
Prevention - PromotionGain - Loss
Zhang, et al (1997; Journal of Neuroscience)
Exploration-optimal tasks
Exploitation-optimal tasks
Strong interactionsNo consistent main effects
Summary• What does it mean to “motivate” someone to do
“well”?• How do we achieve this aim?
• It is complex, but systematic and understandable.
• It involves a three-way interaction of – Global incentives– Local incentive– Task demand (i.e., optimal classifier strategy)
Summary (cont.)• Regulatory Fit (interaction between global
and local incentives) leads to increased exploration.
• Exploration can be advantageous or disadvantageous, depending upon the task demands.

Summary (cont.)• We successfully applied a reinforcement learning model
to choice and identified an “exploitation” parameter that tracks regulatory fit effects.
• We applied classification learning models to stereotype threat data and found that regulatory fit affects the flexibility of hypothesis-testing.
• We are extending the approach to more basic tasks such as signal detection and criterion learning and are generalizing relevant models to account for regulatory fit effects
• Finally, we are extending the approach to more dynamic decision making tasks and model development is ongoing.
Future Directions
• Continue model development
• Applications to resource acquisition (foraging)
• Exploration of other social effects on motivation– Social influences on choking under pressure.
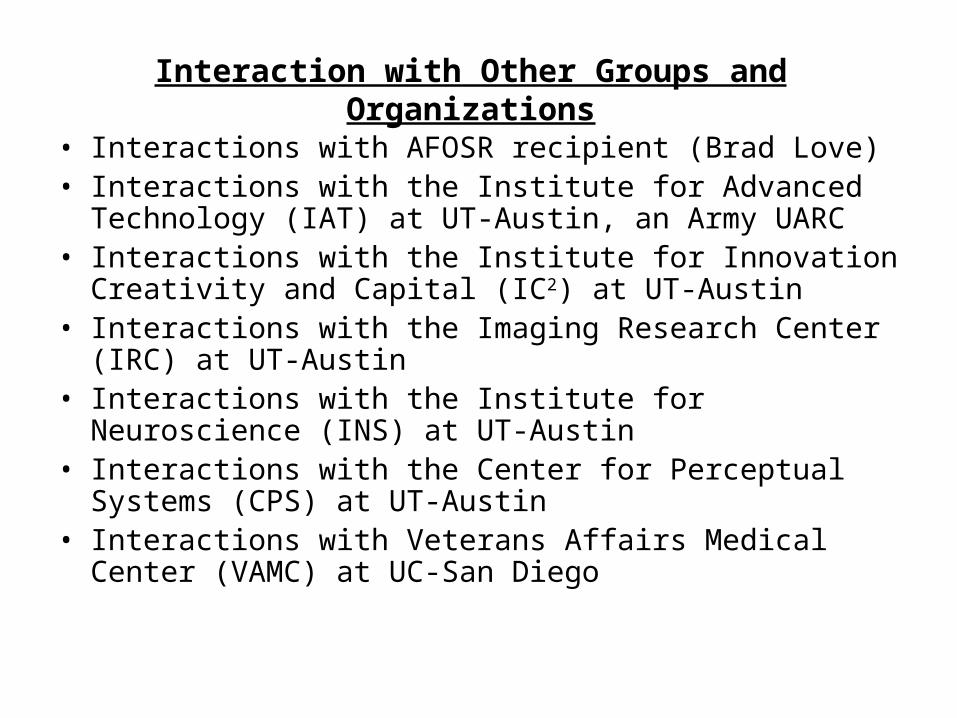
Interaction with Other Groups and Organizations
• Interactions with AFOSR recipient (Brad Love)• Interactions with the Institute for Advanced Technology
(IAT) at UT-Austin, an Army UARC• Interactions with the Institute for Innovation Creativity
and Capital (IC2) at UT-Austin• Interactions with the Imaging Research Center (IRC) at
UT-Austin• Interactions with the Institute for Neuroscience (INS) at
UT-Austin• Interactions with the Center for Perceptual Systems
(CPS) at UT-Austin• Interactions with Veterans Affairs Medical Center
(VAMC) at UC-San Diego
List of Publications Attributed to the Grant (2008-9)
Peer-Reviewed Manuscripts
• Grimm, L.R., Markman, A.B., Maddox, W.T., & Baldwin, G.C. (2008). Differential effects of regulatory fit on classification learning. Journal of Experimental Social Psychology, 44, 920-927.
• Worthy, D.A., Maddox, W.T., & Markman, A.B. (2008) Ratio and Difference Comparisons of Expected Reward in Decision Making Tasks. Memory & Cognition, 36, 1460-1469.
• Grimm, L.R., Markman, A.B., Maddox, W.T., & Baldwin, G.C. (in press) Stereotype threat reinterpreted as regulatory fit. Journal of Personality and Social Psychology.
• Worthy, D.A., Markman, A.B. & Maddox, W.T. (in press) What is pressure? Evidence for social pressure as a type of regulatory focus. Psychonomic Bulletin and Review.
• Maddox, W.T., Glass, B.D., & Markman, A.B. (under revision) Regulatory fit effects on stimulus identification.• Grimm, L.R., Markman, A.B., & Maddox, W.T. (under revision) Regulatory fit created by time of semester and
task reward structure influences test performance.• Glass, B.C., Markman, A.B., & Maddox, W.T. (under review) The generalized exploration model (GEM): A
model of human foraging for empirical analysis• Markman, A.B., Beer, J.S., Grimm, L.R., Rein, J.R., & Maddox, W.T. (under review) The optimal level of fuzz:
Case studies in a methodology for psychological research.
Conference Presentations
• Worthy, D., Markman, A.B., & Maddox, W.T. Are reward expectancies in choice tasks processes as ratios or differences?: Implications for theories of reward processing in the orbitofrontal cortex. Poster presented at the Annual Meeting of the Cognitive Neuroscience Society, San Franscisco, CA, April, 2008.
• Worthy, D.A., Maddox, W.T., & Markman, A.B. (2007). The length of feedback interval and inter-trial interval effects decision-making in choice tasks. Poster to be presented at the Annual Meeting of the Society for Neuroeconomics, September 27-30, 2008, Hull, Massachusetts.
• Worthy, D.A, Maddox, W.T., & Markman, A.B. What is pressure? Relating social pressure to regulatory focus. Poster presented at the 49th Annual Meeting of the Psychonomics Society, Chicago, Il, November, 2008.
• Grimm, L.R., Markman, A.B., & Maddox, W.T., Minimizing Losses Improves End of Semester GRE Performance. Presentation at the Society for Personality and Social Psychology, Tampa, Florida, February 2009.
• Glass, B.D., Filoteo, J.V., Markman, A.B. & Maddox, W.T. Regulatory focus and executive functions. Poster presented at the Annual Meeting of the Cognitive Neuroscience Society, San Franscisco, CA, March, 2009..

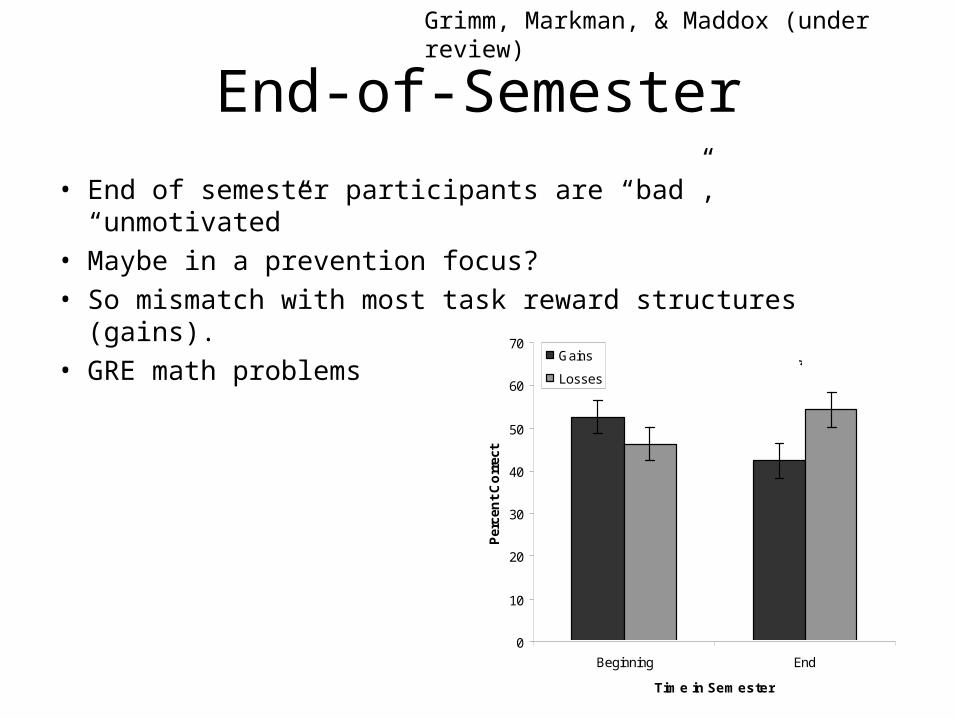
End-of-Semester
• End of semester participants are “bad”, “unmotivated”• Maybe in a prevention focus?• So mismatch with most task reward structures (gains).• GRE math problems
0
10
20
30
40
50
60
70
Beginning End
Time in Semester
Per
cen
t C
orr
ect
Gains
Losses*
Grimm, Markman, & Maddox (under review)
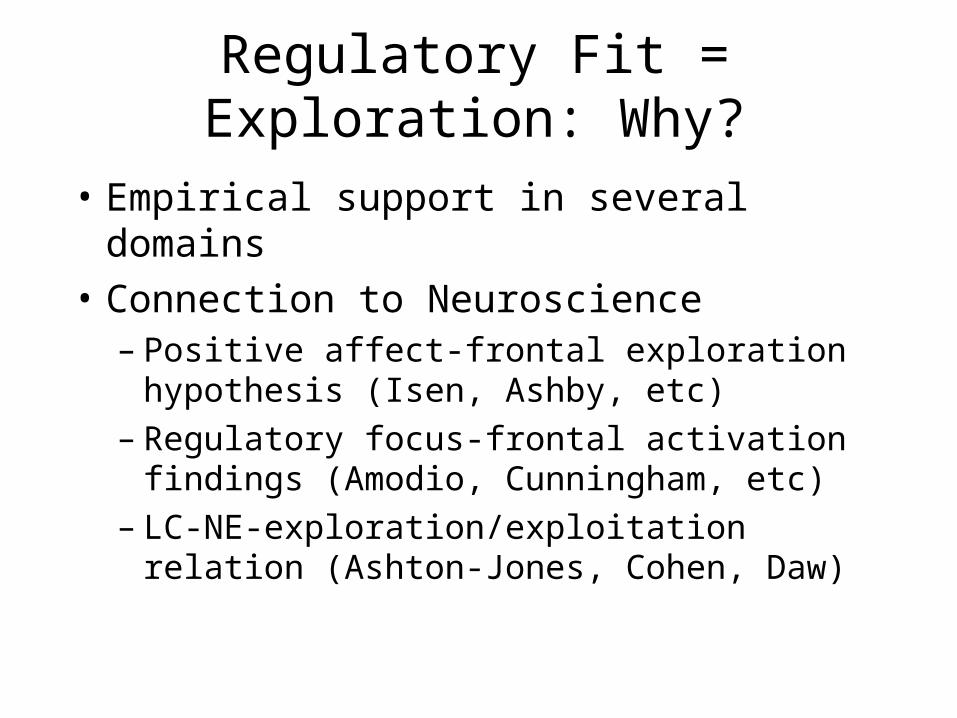
Regulatory Fit = Exploration: Why?
• Empirical support in several domains
• Connection to Neuroscience– Positive affect-frontal exploration
hypothesis (Isen, Ashby, etc)– Regulatory focus-frontal activation findings
(Amodio, Cunningham, etc)– LC-NE-exploration/exploitation relation
(Ashton-Jones, Cohen, Daw)
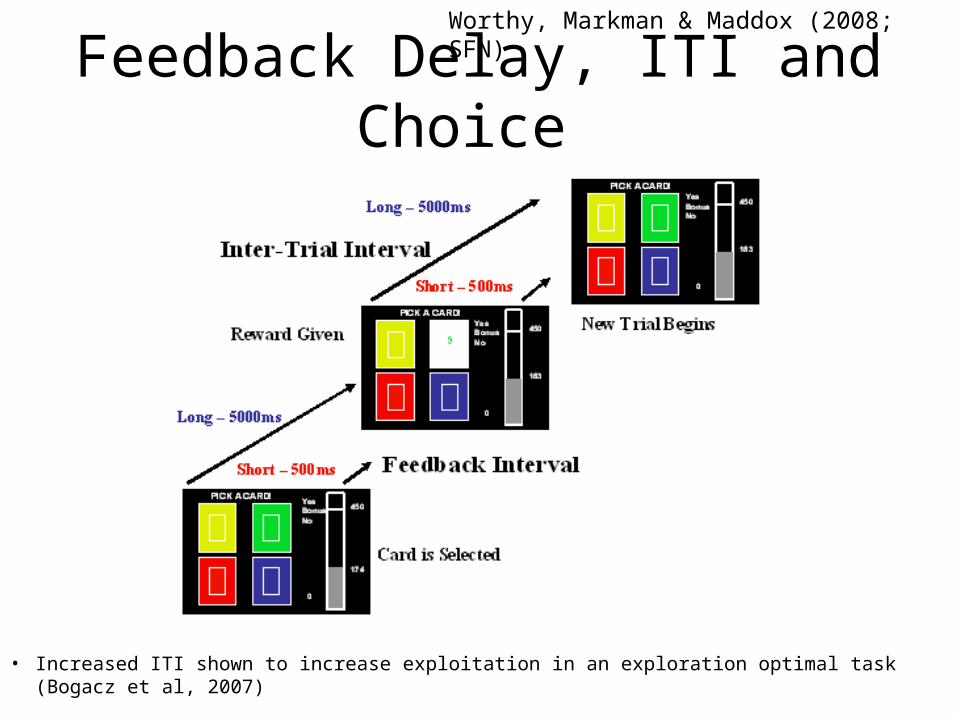
Feedback Delay, ITI and Choice
Worthy, Markman & Maddox (2008; SFN)
• Increased ITI shown to increase exploitation in an exploration optimal task (Bogacz et al, 2007)

Design and Results
Average Estimated Exploitation
0.00.20.40.60.81.01.21.4
Short Long
Inter-Trial Interval
Short Feedback
Long Feedback
• Increased feedback duration-> less switching, less exploration.
Proportion of Switches
0
0.2
0.4
0.6
0.8
Short Long
Inter-Trial Interval
Short Feedback
Long Feedback
• Four-deck exploitation optimal task (gains only)
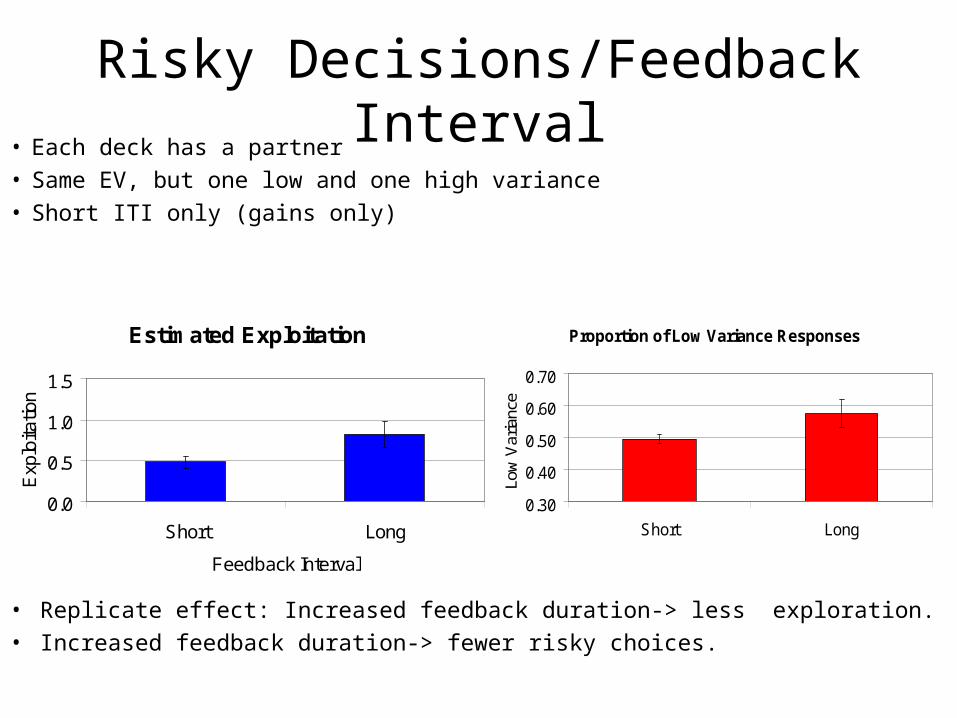
Risky Decisions/Feedback Interval• Each deck has a partner• Same EV, but one low and one high variance• Short ITI only (gains only)
Estimated Exploitation
0.0
0.5
1.0
1.5
Short Long
Feedback Interval
Exp
loita
tion
Proportion of Low Variance Responses
0.30
0.40
0.50
0.60
0.70
Short LongLo
w V
aria
nce
• Replicate effect: Increased feedback duration-> less exploration.• Increased feedback duration-> fewer risky choices.
Followups in progress
• Losses variants• Exploration optimal variants

Extending Models
• Choice models use one of two decision rules– Matching rules
– Difference rules
)()(
)(, bEVaEV
aEVP
tt
tta
))(())((
))((
, bEVaEV
aEV
ta tt
t
ee
eP
These rules predict that choices are affected by scalar additions to reward values, but not by scalar multiplications
These rules predict that choices are affected by scalar multiplications of reward values, but not by scalar additions.
Worthy, Maddox, & Markman (2008; M&C)
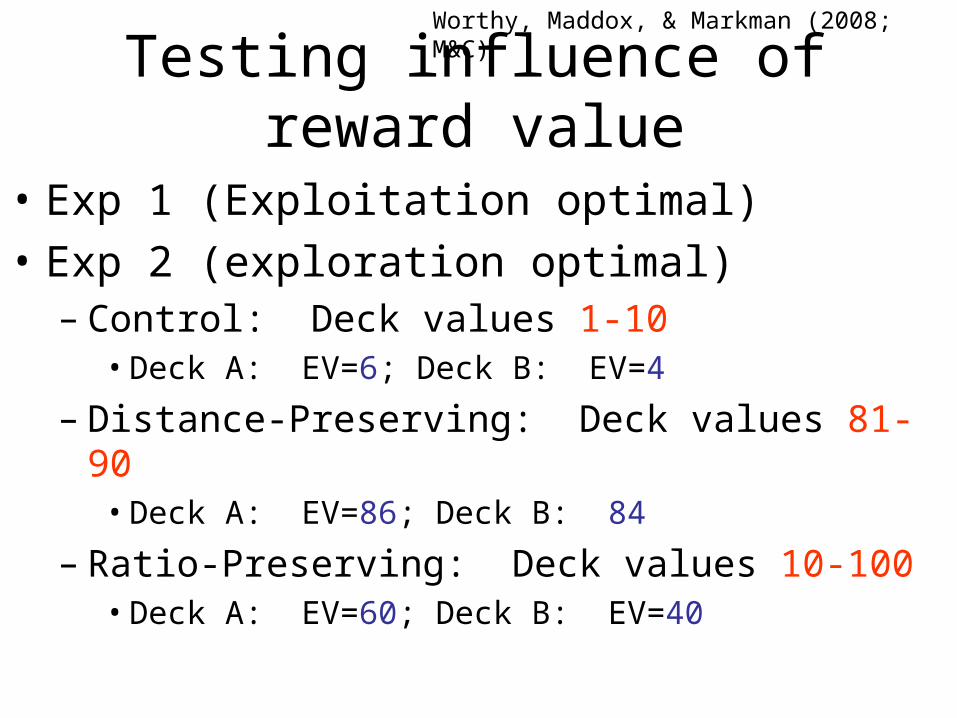
Testing influence of reward value
• Exp 1 (Exploitation optimal)
• Exp 2 (exploration optimal)– Control: Deck values 1-10
• Deck A: EV=6; Deck B: EV=4
– Distance-Preserving: Deck values 81-90• Deck A: EV=86; Deck B: 84
– Ratio-Preserving: Deck values 10-100• Deck A: EV=60; Deck B: EV=40
Worthy, Maddox, & Markman (2008; M&C)
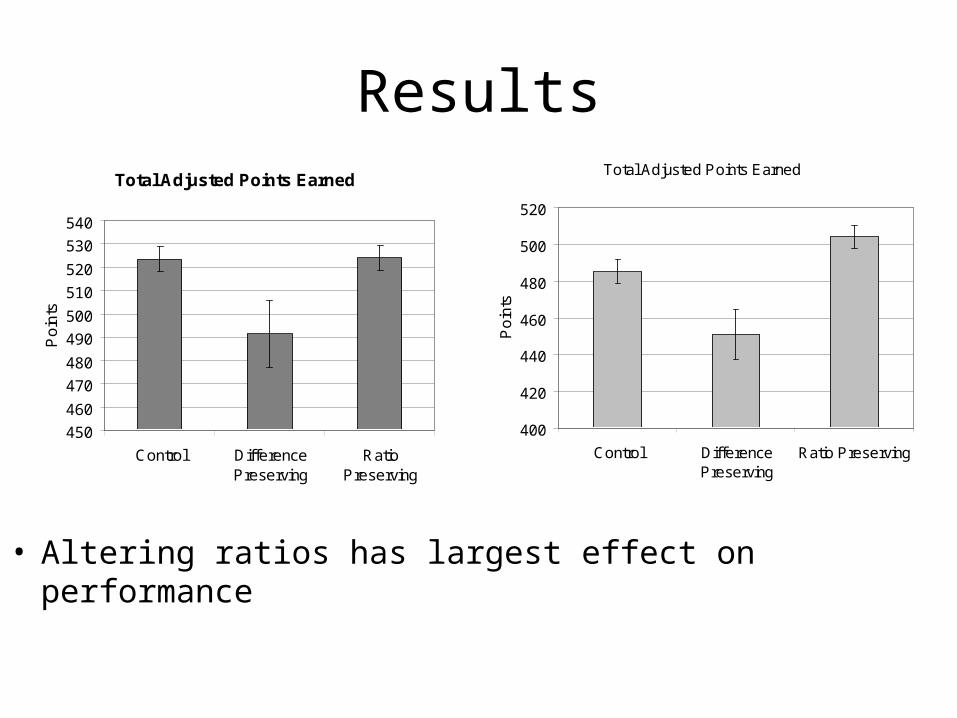
ResultsTotal Adjusted Points Earned
450
460
470
480
490
500
510
520
530
540
Control DifferencePreserving
RatioPreserving
Po
ints
Total Adjusted Points Earned
400
420
440
460
480
500
520
Control DifferencePreserving
Ratio Preserving
Po
ints
• Altering ratios has largest effect on performance

Summary
• Support for 3-way interaction in choice– Fit -> exploration
• Affect manipulation similar to focus
• Feedback delay increases exploitation, reduces risky choices– Implications for training….
• Ratio preserving models supported
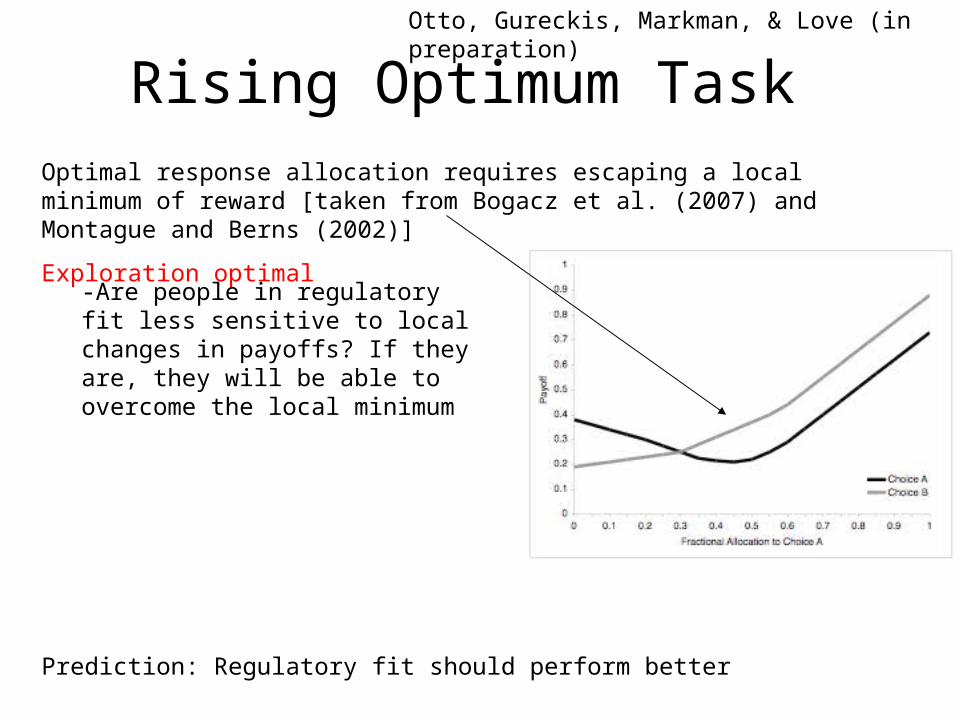
Optimal response allocation requires escaping a local minimum of reward [taken from Bogacz et al. (2007) and Montague and Berns (2002)]
Exploration optimal
Prediction: Regulatory fit should perform better
Rising Optimum Task
-Are people in regulatory fit less sensitive to local changes in payoffs? If they are, they will be able to overcome the local minimum
Otto, Gureckis, Markman, & Love (in preparation)
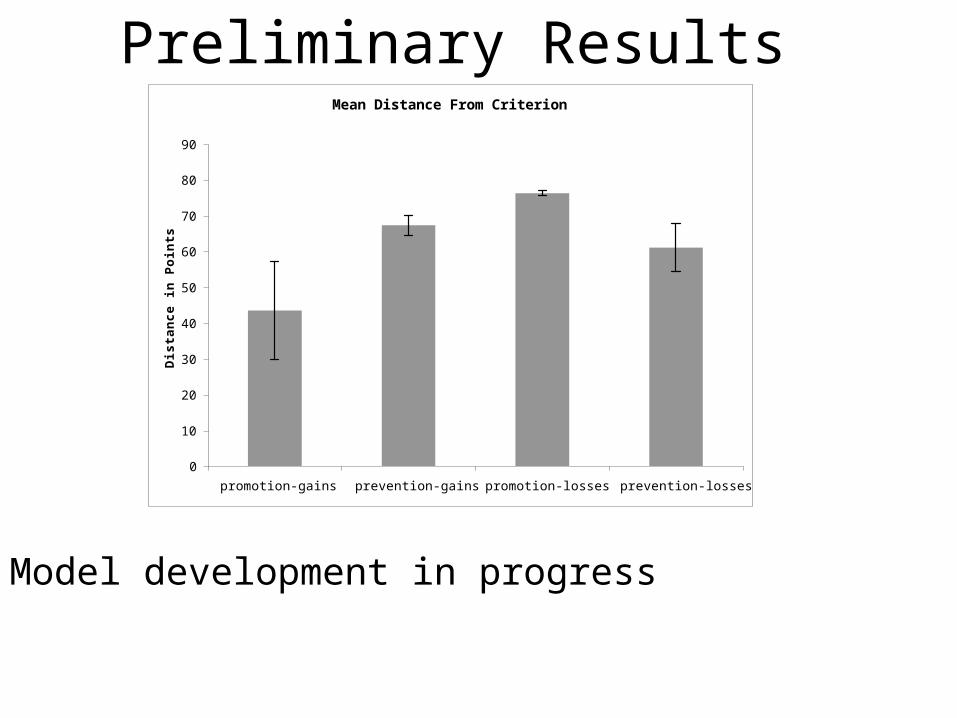
Mean Distance From Criterion
0
10
20
30
40
50
60
70
80
90
promotion-gains prevention-gains promotion-losses prevention-losses
Dis
tan
ce in
Poin
ts
Preliminary Results
Model development in progress