Modeling the Microstructural Evolution during Hot - DiVA Portal
58
Modeling the Microstructural Evolution during Hot Deformation of Microalloyed Steels Linda Bäcke Doctoral thesis Royal Institute of Technology School of Industrial Engineering and Management Material Science and Engineering Division of Mechanical Metallurgy SE-100 44 Stockholm, Sweden
Transcript of Modeling the Microstructural Evolution during Hot - DiVA Portal
Modeling the Microstructural Evolution during Hot Deformation of
Microalloyed Steels
Linda Bäcke
Doctoral thesis
Royal Institute of Technology School of Industrial Engineering and Management
Material Science and Engineering Division of Mechanical Metallurgy
SE-100 44 Stockholm, Sweden

Modeling the Microstructural Evolution during Hot Deformation of Microalloyed Steels LINDA BÄCKE ISRN KTH/MSE--09/12--SE+MEK/AVH ISBN 978-91-7415-267-8 Akademisk avhandling som med tillstånd av Kungliga Tekniska Högskolan framlägges till offentlig granskning för avläggande av Teknologie doktorsexamen måndagen den 20 april 2009. Fakultetsopponent är Dr. Eric J. Palmiere vid The University of Sheffield, England. © Linda Bäcke, 2009 Tryckt av: Universitetsservice US-AB, Stockholm, Sverige, 2009
Modeling the Microstructural Evolution during Hot Deformation of Microalloyed Steels LINDA BÄCKE Abstract Recrystallization kinetics, during and after hot deformation, has been investigated for decades. From these investigations several equations have been derived for describing it. The equations are often empirical or semi-empirical, i.e. they are derived for certain steel grades and are consequently only applicable to steel grades similar to these. To be able to describe the recrystallization kinetics for a variety of steel grades, models which are more physically-based are necessary. This thesis contains the development of a physically-based model describing the microstructural evolution during hot deformation of microalloyed steels. The work is mainly focused on the recrystallization kinetics. During hot rolling, the repeated deformation and recrystallization provides progressively refined recrystallized grains. Also, recrystallization enables the material to be deformed more easily and knowledge of the recrystallization kinetics is important in order to predict the required roll forces. Hot strip rolling is generally conducted in a reversing roughing mill followed by a continuous finishing mill. During rolling in the roughing mill the temperature is high and complete recrystallization should occur between passes. In the finishing mill the temperature is lower which means slower recrystallization kinetics and partial or no recrystallization often occurs. If microalloying elements such as Nb, Ti or V are present, the recrystallization can be further retarded by either solute drag or particle pinning. When recrystallization is completely retarded and strain is accumulated between passes, the austenite grains will be severely deformed, i.e. pancaking occurs. Pancaking of the grains provides larger amount of nucleation sites for ferrite grains upon transformation and hence a finer ferrite grain size is achieved. In this work a physically-based model has been used to describe the microstructural evolution of austenite. The model is built-up by several sub-models describing dislocation density evolution, recrystallization, grain growth and precipitation. It is based on dislocation density theory where the generated dislocations during deformation provide the driving force for recrystallization. In the model, subgrains act as nuclei for recrystallization and the condition for recrystallization to start is that the subgrains reach a critical size and configuration. The retarding effect due to elements in solution and as precipitated particles is accounted for in the model. To verify and validate the model axisymmetric compression tests combined with relaxation were modeled and the results were compared with experimental data. The precipitation sub-model was verified by the use of literature data. In addition, rolling in the hot strip mill was modeled using process data from the hot strip mill at SSAB Strip Products Division. The materials investigated were plain C-Mn steels and Nb microalloyed steels. The results from the model show good agreement with measured data. Keywords: modeling, austenite, microalloyed steels, hot deformation, microstructure evolution, static recrystallization, dynamic recrystallization, metadynamic recrystallization.
iii

iv

Preface This work was carried out at Dalarna University and at SSAB Strip Products in Borlänge and was one of the projects in the Post Graduate School in Metal Forming at Dalarna University, Borlänge. I wish to thank the sponsors of this project, the Swedish Steel Producer’s Association (Jernkontoret), The Swedish knowledge foundation, SSAB and Dalarna University. I am very grateful for the discussions and contributions from: My assistant supervisor, Professor Göran Engberg at Dalarna University for supervising me, for encouraging me in my work, for sharing his great experience in microstructure evolution with me and for lots of stimulating discussions. My colleague, Ulrika Borggren for co-authorship and fruitful discussions. My supervisor, Professor Stefan Jonsson, at KTH, for his valuable feedback. All my colleagues at both Dalarna University and at SSAB Strip Products for general support and for stimulating discussions. Finally, I want to thank my family for believing in me and especially my husband Fredrik for his endless support and love.
Linda Bäcke Borlänge, March 2009
v

vi

List of papers and author contribution in each paper During the work with this thesis, the author changed her surname from Lissel to Bäcke. This thesis consists of an introduction and the following seven papers, referred to by roman numerals: I. Prediction of microstructural behavior during hot rolling L. Lissel and G. Engberg
Conference proceeding of the 8th International Conference on Technology of Plasticity (ICTP), Verona, Italy 2005.
II. A physically based microstructure model for predicting the microstructural
evolution of a C-Mn steel during and after hot deformation G. Engberg and L. Lissel Published in Steel Research International, Vol. 79 (2008), pp. 47-58 III. Prediction of the microstructural evolution during hot strip rolling of Nb
microalloyed steels L. Lissel and G. Engberg
Conference proceeding of the 3rd International Conference on Recrystallization and grain growth, ReX & GG III; Jeju Island; Korea. Published in Materials Science Forum, Vol. 558-559 (2007), pp. 1127-1132
IV. Modeling precipitation and its effect on recrystallization during hot strip rolling
of niobium steels L. Lissel, G. Engberg and U. Borggren
Conference proceeding of the 3rd International Conference on TMP; Padua; Italy, 2008
V. Physical based model for predicting the microstructural evolution at hot rolling L. Bäcke and G. Engberg Invited paper to the International Conference MEFORM 2009, Freiberg, Germany VI. Modeling the effect of solute drag on recovery and recrystallization during hot
deformation of Nb microalloyed steels L. Bäcke Manuscript submitted to ISIJ international VII. Modeling the kinetics of strain induced precipitation and its effect on recovery
and recrystallization in Nb microalloyed steels L. Bäcke, U. Borggren and G. Engberg Manuscript to be submitted to an international journal
vii

Author contribution Paper I Evaluation of experimental results from literature, collecting and evaluating relevant process data, model parameter-fitting and calculations and writing in close co-operation with the co-author Paper II Determining experimental setup along with evaluation of experimental data, model parameter-fitting and calculations and writing in close co-operation with the co-author Paper III Collecting and evaluating relevant process data, model development, model parameter-fitting and calculations and writing in close co-operation with the co-author Paper IV Collecting and evaluating relevant process data, model development, model parameter-fitting and calculations and writing in close co-operation with the co-authors Paper V Evaluating results and writing in close co-operation with the co-author Paper VI Single author Paper VII Evaluation of experimental results from literature, model development, model parameter-fitting and calculations and writing in close co-operation with the co-authors
viii
Table of contents
1 Introduction ___________________________________________________________ 1 1.1 Hot strip rolling _________________________________________________________ 1 1.2 Thermomechanical controlled rolling _______________________________________ 4 1.3 Background to the work __________________________________________________ 7 1.4 Aim of the work _________________________________________________________ 8
2 Microstructure evolution during hot deformation _____________________________ 9 2.1 The grain structure _____________________________________________________ 10 2.2 Dislocation generation and recovery _______________________________________ 11 2.3 Recrystallization and grain growth ________________________________________ 12 2.4 The effect of microalloying elements on recovery and recrystallization___________ 16
3 Modeling recrystallization _______________________________________________ 21 3.1 Physically-based model __________________________________________________ 21 3.2 Empirical models _______________________________________________________ 25
4 Experimental procedure_________________________________________________ 27
5 Summary of appended papers ____________________________________________ 31 5.1 Paper I________________________________________________________________ 31 5.2 Paper II _______________________________________________________________ 32 5.3 Paper III ______________________________________________________________ 34 5.4 Paper IV ______________________________________________________________ 36 5.5 Paper V _______________________________________________________________ 38 5.6 Paper VI ______________________________________________________________ 38 5.7 Paper VII _____________________________________________________________ 40
6 Conclusions and future work_____________________________________________ 43
7 References____________________________________________________________ 45 APPENDED PAPERS
ix

x

1 Introduction The microstructural evolution during hot deformation of microalloyed steels involves accumulation, annihilation and rearrangement of dislocations, recrystallization and grain growth. Microalloying elements, such as Nb, Ti and V can form carbides, nitrides and/or carbonitrides affecting the course of the microstructural evolution. For hot deformation, the microstructural evolution that occurs in the material is dependent on the size of the reductions, the strain rate, the temperature and the length of the holding times between reductions. For hot strip rolling of steel it is the desired final mechanical and geometrical properties of the strip that determines the so called rolling schedule, which is the setup for the rolling process, i.e. the amount of reduction, the rolling velocity and the temperature. High strength low alloy (HSLA) steels are steels microalloyed with Nb, Ti and/or V. Microalloying elements added give a contribution to both grain size refinement and precipitation hardening. Before hot rolling of microalloyed steels, the steels are soaked at high temperature to dissolve the particles to get enough microalloying elements in solution. At low temperatures the microalloying elements start to precipitate causing a retardation of recrystallization. For conventional controlled rolling the finishing passes are carried out below the temperature where the material recrystallizes. When no recrystallization occurs between passes, the strain is accumulated and the austenite grains become severely deformed. This provides for more preferential nucleation sites for ferrite during subsequent transformation and a fine ferrite grain size is obtained.
1.1 Hot strip rolling At SSAB Strip Products Division in Borlänge, Sweden, the hot rolled steel strips produced are of a wide range of strength, from mild steels to ultra high strength steels. The wide range in strength is mainly achieved by adding different amounts of alloying elements. High strength is mainly obtained by microalloying with Ti and/or Nb. In Figure 1 a schematic picture of the hot strip mill at SSAB Strip Products Division is shown. In the hot strip mill slabs with height of ~220 mm, length of 5500 - 11000 mm and width of 650 - 1650 mm are reduced to thin strips with thickness 1.6 - 16 mm. The hot strip mill consists of, from start to finish, reheating furnaces, descaler, reversing roughing mill, coilbox, crop shear, descaler, finishing mill with six stands, run-out table with accelerated cooling and finally down-coilers. In the reheating furnaces the slabs are heated up to ~1200°C and a fully annealed structure is obtained. The heating temperature and the time in the furnaces are dependent on the steel grade and for microalloyed steel they are chosen in order to dissolve the right amount of particles. During heating, some of the particles formed during the continuous casting of the
1

slab are dissolved provided that they are small enough and that the temperature is high enough for dissolution. Particles that are stable at higher temperatures than the chosen reheating temperature are of course not dissolved.
Figure 1. The hot strip mill at SSAB Strip Products Division in Borlänge. When the slab is withdrawn from the furnace, the surface is covered with oxide scale which is removed in the descaler after the furnace. Descaling is also conducted before some of the passes in the roughing mill. In the reversing roughing mill five to seven passes are conducted and the total reduction is ~85%. The inter-pass times in the roughing mill are long, which depends on the fact that the bar is rolled back and forth. After rolling in the roughing mill, the transfer bar is usually transported down to the coilbox where it is coiled, but sometimes it is directly transferred down to the finishing mill. When the transfer bar is coiled in the coilbox the temperature along it gets more evenly distributed. During rolling in the roughing mill and during transportation, the temperature of the transfer bar decreases and before entering the finishing mill it is ~1000°C. Before entering the finishing mill, the new layer of oxide scale is removed and the irregular head and tail end are generally cut off, leaving an even edge to enter the first pass. In the finishing mill, the bar is reduced to the desired thickness. Since the finishing mill is a continuous process, the inter-pass times are shorter than in the roughing mill. After rolling in the finishing mill, the strip is cooled to the desired temperature at the run-out table and subsequently coiled. The temperature in the hot strip mill is only measured at a few places in the process: after the roughing mill, after the finishing mill and at the down coiler. It is only possible to measure the temperature at the surface of the strip and the temperature gradients in the thickness direction of the strip therefore have to be calculated. Also, the temperature between the measuring points has to be calculated. An example of the calculated temperature during rolling, using STEELTEMP® [1], is presented in Figure 2. STEELTEMP is a finite-difference program for temperature and heat-transfer analysis during, for example heating and flat rolling. The temperatures at the surface and at the centre of the workpiece are shown in the figure, as well as the measured surface temperatures after the roughing mill and after the finishing mill. The figure shows rolling of a 220 mm slab to a 4 mm thick strip. In the first passes there are
2

large temperature gradients in the thickness direction but these are reduced during rolling and at the end of the finishing mill, there are practically no remaining temperature gradients.
Figure 2. Calculated temperature during rolling in the roughing mill and in the finishing mill.
As mentioned above, after heating in the furnaces the material is fully annealed. The dislocations are arranged in configurations of lower energy and the dislocation density is relatively low. Furthermore, the energy of the material is lowered by grain growth and the grains are quite coarse after the heat treatment. During deformation, the stored energy of the material is raised by the presence of dislocations and boundaries. Simultaneously, recovery occurs because of the high temperature. During recovery, rearrangement and annihilation of dislocations occurs which lowers the stored energy. The remaining stored energy is the driving force for subsequent recrystallization. In the roughing mill, the temperature is high and the inter-pass times are long, allowing for full recrystallization to occur between passes. In the finishing mill the temperature is lower and the inter-pass times are shorter than in the roughing mill which means that no or partial recrystallization could occur between passes. Recovery and recrystallization are important processes during hot rolling. They lower the flow stress of the material enabling it to be deformed more easily. After complete recrystallization the energy of the material may be further reduced by normal grain growth. These softening mechanisms: recovery, recrystallization and grain growth are described more thoroughly in section 2.
3

1.2 Thermomechanical controlled rolling To achieve the desired final mechanical properties of the strip such as a good combination of strength, fracture toughness and weldability, thermomechanical processing (TMP) is utilized [2, 3]. TMP means control of the reheating temperature, the rolling schedule, the cooling rate and the coiling temperature, i.e. control of the entire processing sequence. The purpose of TMP is to obtain optimum ferrite refinement and it is therefore necessary to “maximize the area of austenite grain boundary per unit volume at the onset of phase transformation” [4]. There are different ways of achieving this and the main types of controlled rolling are recrystallization controlled rolling, conventional controlled rolling and dynamic recrystallization controlled rolling [5]. The type of controlled rolling refers to the conditions in the final rolling passes, i.e. in the finishing mill for conventional hot strip rolling. First, the as-reheated microstructure is eliminated in the roughing mill where complete recrystallization occurs between passes. During hot strip rolling, the material generally stops recrystallizing below a certain temperature. This temperature is often called the recrystallization stop temperature (RST) or the no-recrystallization temperature, Tnr. The Tnr denotes the temperature above which static recrystallization occurs between passes [6]. It depends on the deformation, the cooling rate and the inter-pass times in the rolling process. Below this temperature recrystallization is retarded due to strain-induced precipitation of second-phase particles. Recrystallization is retarded by adding small amounts of certain elements to mild steels (microalloying). High strength low alloy (HSLA) steels is the commonly used name for microalloyed steels. Microalloying generally means the addition of less then 0.1% of elements to mild steel compositions and refers to the addition of Ti, Nb or V [7]. The effect of the concentration of Ti, Nb, V and Al in a 0.07C-1.40Mn-0.25Si (wt.%) steel on the recrystallization stop temperature was determined by Cuddy [8], see Figure 3.
Figure 3. Effect of the initial solute content on the recrystallization stop temperature, from Cuddy [8].
4

In Cuddy’s investigation [8] multi-pass deformation was conducted with a total reduction of about 65%. As seen in Figure 3, the most effective raise of the RST is provided by Nb. Also, recrystallization is impeded at higher temperatures with smaller additions of Nb than with Ti, Al and V. When heating the slabs of Nb microalloyed steels before rolling, the temperature is usually high enough so that Nb is in solution. During rolling, Nb forms nitrides, carbides and/or carbonitrides which effectively retards recovery and recrystallization. The highly work hardened (pancaked) austenite provides numerous nucleation sites for the ferrite during the subsequent transformation which give very fine ferrite grains [9]. Recrystallization controlled rolling means that rolling is conducted above the no-recrystallization temperature, Tnr, and that full recrystallization is obtained between passes. The repeated recrystallization of austenite provides progressively refined recrystallized grains. A schematic time-temperature diagram of recrystallization controlled rolling is shown in Figure 4.
Figure 4. Schematic time-temperature diagram of recrystallization controlled rolling showing the recrystallized microstructure between passes. Tnr and Ar3 denote the no-recrystallization temperature and the phase transformation temperature, respectively. From Siciliano et al. [5]. Conventional controlled rolling is illustrated in Figure 5. It is conducted above the phase transformation temperature, Ar3, and below Tnr so that the strain is accumulated between passes and the austenite grains get severely deformed, i.e. pancaking of the austenite occur. The severely deformed austenite grains provide numerous nucleation sites during subsequent transformation. Dynamic recrystallization controlled rolling, Figure 6, means that dynamic recrystallization, DRX, is triggered in one or more passes during rolling and this in turn triggers the fast metadynamic recrystallization, MDRX. DRX is induced either by applying large single deformations or by accumulation of strain from pass to pass. Siciliano and Jonas [5] state that one of the benefits with this approach is the intense grain refinement caused by dynamic recrystallization.
5

Figure 5. Schematic time-temperature diagram of conventional controlled rolling, showing the deformed microstructure between passes. Tnr and Ar3 denote the no-recrystallization temperature and the phase transformation temperature, respectively. From Siciliano et al. [5].
Figure 6. Schematic time-temperature diagram of dynamic recrystallization controlled rolling, showing the very fine recrystallized microstructure after dynamic (DRX) and metadynamic recrystallization (MDRX). Tnr and Ar3 denote the no-recrystallization temperature and the phase transformation temperature, respectively. From Siciliano et al. [5]. To be able to practice controlled rolling and thereby get the desired final mechanical properties of the product, knowledge of the microstructural evolution of the austenite during rolling is essential. In order to design optimized rolling schedules that fit the needs and constraints of each case, models that describe the microstructural evolution are extremely useful.
6

1.3 Background to the work For several decades the microstructural evolution of austenite during hot deformation of steels has been investigated [4, 5, 8-15]. Over the last few years, more and more attention has been paid to the development of mathematical models that can predict the microstructural evolution during hot rolling [4, 5, 10, 11, 13-18]. The goal is usually to be able to predict the microstructure of the materials and to optimize the different process conditions to obtain the best combination of strength, ductility and weldability in the as-rolled product. For the hot rolling process, a setup (rolling schedule) determines the temperature and reduction that has to be met in each pass in order to obtain the desired final product. The setup is determined on the basis of the desired final mechanical and geometrical properties of the strip. With an on-line model predicting the mechanical properties, the hot rolling process could be controlled towards the mechanical properties. If for example a deviation from the predicted target occurs during rolling, a new setup could be determined in order to meet the final mechanical properties. This would require a model with very short calculation times in order to calculate a new setup and adjust the process in time. Therefore, for this purpose, empirical or semi-empirical models with short calculation times are often used. Semi-empirical models refer to models that are derived for certain steel grades and are generally only applicable to these. With an off-line model, rolling schedules for different steel grades can be optimized. For example, the INTEG hot strip mill model (HSMM) [16] predicts the final mechanical properties of as-rolled products. The microstructural evolution is described by semi-empirical models and one setup of parameters is required for each steel grade. Another model predicting the final mechanical properties is presented by Andorfer et al. [17]. The model is used in an on-line control system, CAQC (Computer Aided Quality Control), in order to calculate a new setup during rolling. The model is used for the seven-stand hot strip mill of voestalpine’s steel plant in Linz, Austria. The description of recrystallization and grain growth is based on semi-empirical equations. Semi-empirical models (described in section 3.2) give a good description for the steel grades they are derived for. In order to describe the microstructural evolution for a variety of steel grades there is a need for models which are more physically-based. Such a model would provide the possibility to design optimized rolling schedules for both existing and new steel grades. The model used in this work is based on a physical description of dislocation density evolution. Only mean values of the microstructural variables are considered in the model and this approach was chosen in order to keep the calculation times fairly short. The model describes the microstructural evolution during hot deformation and is based on the work by Siwecki and Engberg [4] and Wang et al. [18]. It is implemented in a toolbox for process simulations [19]. The model is intended to be able to describe the microstructural evolution during the whole rolling process, from heating the slabs in the furnace to cooling of the strips when coiled, and also predict the final mechanical properties. This work is concentrated on the deformation part
7

in hot rolling, i.e. rolling in the roughing mill and in the finishing mill. The following steps in the rolling process, cooling and coiling of the strip, are not considered here. No phase transformation is yet described in the model, only the austenite region is considered.
1.4 Aim of the work The aim of this thesis is the verification and validation of a newly developed microstructure model. The model is intended to contribute to the understanding of the microstructural evolution during hot deformation. The work is done for SSAB Strip Products Division who produces steel strips of a variety of low-carbon steel grades. The calculations are primarily intended for the hot strip mill process at SSAB Strip Products Division and for SSAB’s products. At the start time of the work, the existing model contained a description of work hardening and recovery [4] and a recrystallization model developed by Wang et al. [18]. A new simplified recrystallization model was under development and the work in this thesis is the further development of the entire model with emphasis on the recrystallization description. This was done by:
• Simulating hot strip rolling of C-Mn steels (Paper I) • Verifying and validating the description of recovery and recrystallization of C-Mn
steels by simulating stress-relaxation tests (Paper II) • Simulating hot strip rolling of Nb microalloyed steels by adding a semi-empirical
equation for the description of precipitation (Paper III) • Simulating hot strip rolling of Nb microalloyed steels by adding a physically-based
model for the description of precipitation (Paper IV-V) • Verifying and validating the description of solute drag on recovery and
recrystallization in Nb microalloyed steels by simulating stress-relaxation tests (Paper VI)
• Verifying and validating the precipitation model for Nb(C,N) precipitation by simulating previously reported experimental data (Paper VII)
8
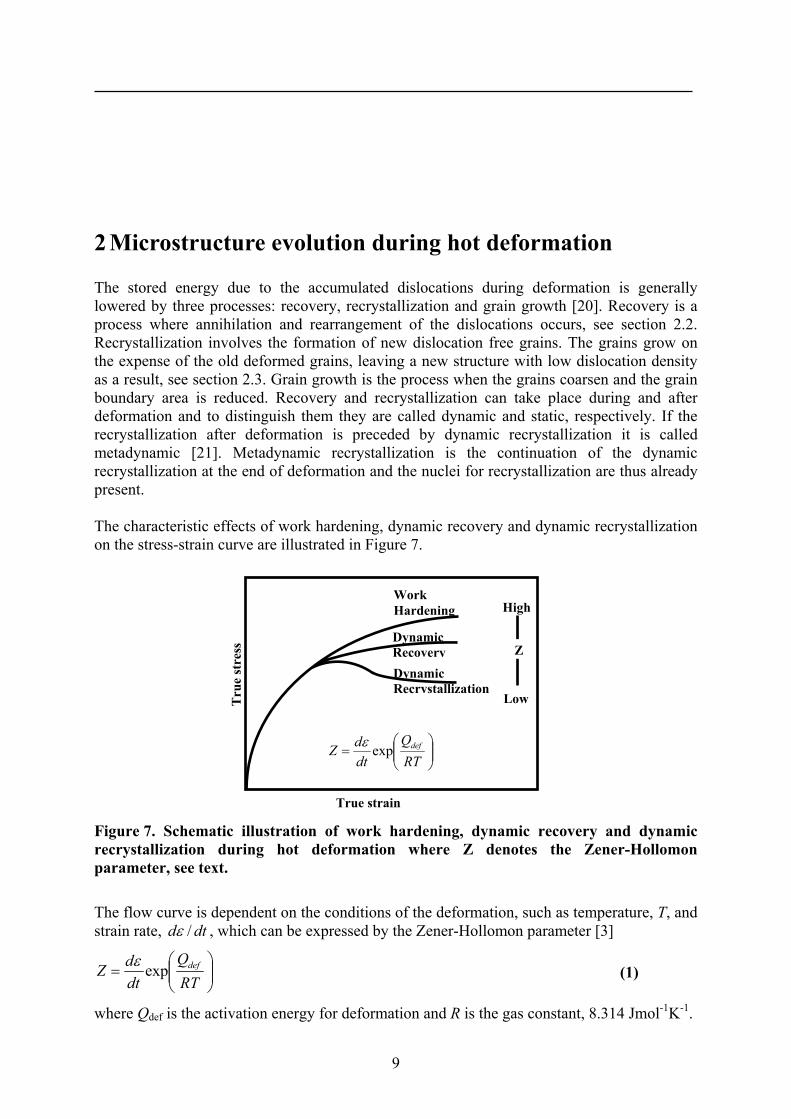
2 Microstructure evolution during hot deformation The stored energy due to the accumulated dislocations during deformation is generally lowered by three processes: recovery, recrystallization and grain growth [20]. Recovery is a process where annihilation and rearrangement of the dislocations occurs, see section 2.2. Recrystallization involves the formation of new dislocation free grains. The grains grow on the expense of the old deformed grains, leaving a new structure with low dislocation density as a result, see section 2.3. Grain growth is the process when the grains coarsen and the grain boundary area is reduced. Recovery and recrystallization can take place during and after deformation and to distinguish them they are called dynamic and static, respectively. If the recrystallization after deformation is preceded by dynamic recrystallization it is called metadynamic [21]. Metadynamic recrystallization is the continuation of the dynamic recrystallization at the end of deformation and the nuclei for recrystallization are thus already present. The characteristic effects of work hardening, dynamic recovery and dynamic recrystallization on the stress-strain curve are illustrated in Figure 7.
Work Hardening
Dynamic RecoveryDynamic Recrystallization
Z
High
LowTru
e st
ress
True strain
⎟⎟⎠
⎞⎜⎜⎝
⎛=
RTQ
dtdZ defexpε
Figure 7. Schematic illustration of work hardening, dynamic recovery and dynamic recrystallization during hot deformation where Z denotes the Zener-Hollomon parameter, see text. The flow curve is dependent on the conditions of the deformation, such as temperature, T, and strain rate, dtd /ε , which can be expressed by the Zener-Hollomon parameter [3]
⎟⎟⎠
⎞⎜⎜⎝
⎛=
RTQ
dtdZ defexpε (1)
where Qdef is the activation energy for deformation and R is the gas constant, 8.314 Jmol-1K-1.
9
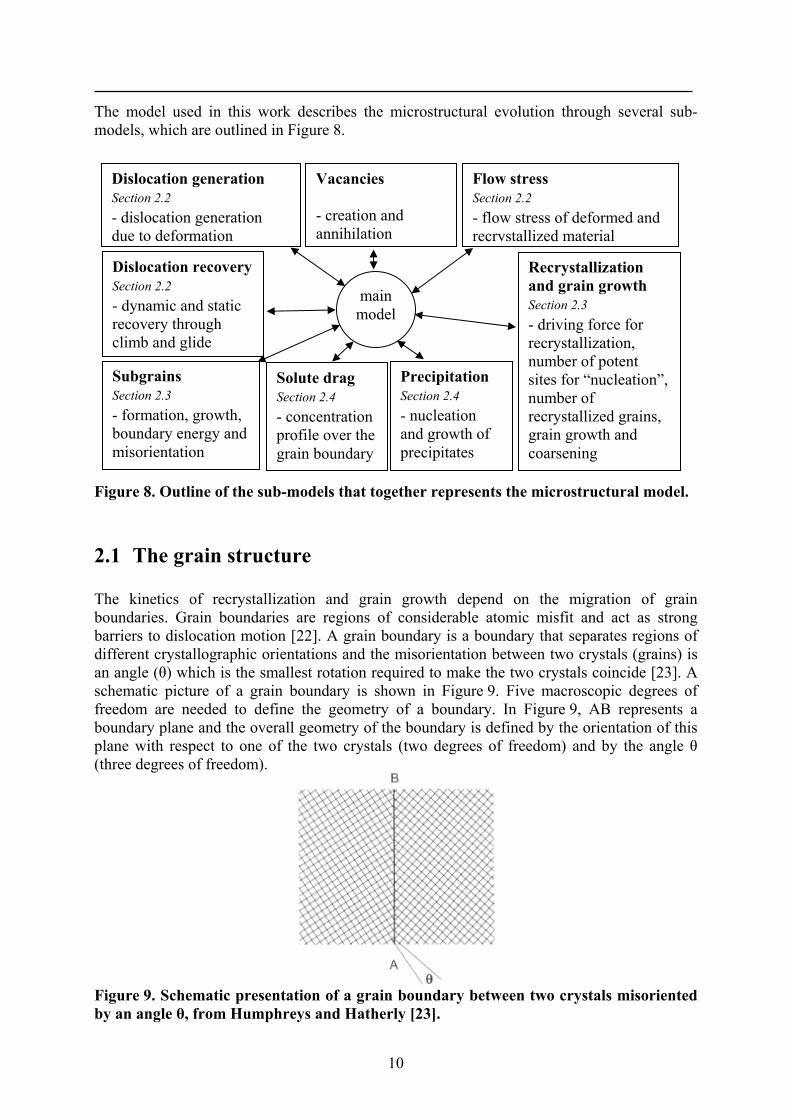
The model used in this work describes the microstructural evolution through several sub-models, which are outlined in Figure 8.
Dislocation generation Section 2.2 - dislocation generation due to deformation
Vacancies - creation and annihilation
Dislocation recovery Section 2.2 - dynamic and static recovery through climb and glide
Subgrains Section 2.3 - formation, growth, boundary energy and misorientation
Recrystallization and grain growth Section 2.3 - driving force for recrystallization, number of potent sites for “nucleation”, number of recrystallized grains, grain growth and coarsening
main model
Precipitation Section 2.4 - nucleation and growth of precipitates
Flow stress Section 2.2 - flow stress of deformed and recrystallized material
Solute drag Section 2.4 - concentration profile over the grain boundary
Figure 8. Outline of the sub-models that together represents the microstructural model.
2.1 The grain structure The kinetics of recrystallization and grain growth depend on the migration of grain boundaries. Grain boundaries are regions of considerable atomic misfit and act as strong barriers to dislocation motion [22]. A grain boundary is a boundary that separates regions of different crystallographic orientations and the misorientation between two crystals (grains) is an angle (θ) which is the smallest rotation required to make the two crystals coincide [23]. A schematic picture of a grain boundary is shown in Figure 9. Five macroscopic degrees of freedom are needed to define the geometry of a boundary. In Figure 9, AB represents a boundary plane and the overall geometry of the boundary is defined by the orientation of this plane with respect to one of the two crystals (two degrees of freedom) and by the angle θ (three degrees of freedom).
Figure 9. Schematic presentation of a grain boundary between two crystals misoriented by an angle θ, from Humphreys and Hatherly [23].
10

Grain boundaries are usually separated into the categories of low and high angle grain boundaries which are dependent on the size of the misorientation [23]. Low angle grain boundaries (LAGB) or subgrain boundaries are boundaries misoriented by an angle less than 10-15°. High angle grain boundaries (HAGB) are boundaries misoriented by an angle greater than 10-15°. The definition of grains with low angle boundaries and high angle boundaries play an important role in the description of recrystallization as will be discussed in section 2.3 and section 3.1.
2.2 Dislocation generation and recovery Most of the applied work during rolling turns into heat and only a small part remains as stored energy (~1%) [23]. The increase in stored energy is mainly due to the accumulation of dislocations which is caused by both tangling of existing dislocations and the generation of new. The energy is also raised by the increase of grain boundary area. The stored energy in the material is the driving force for recovery and recrystallization. Recovery of the material is a process that occurs prior to recrystallization and is primarily due to changes in the dislocation structure. During recovery, the dislocations rearrange in configurations of lower energy. Recovery is actually a series of events: formation of cells, annihilation of dislocations within cells, formation of low-angle subgrains and subgrain growth [23], see Figure 10.
Figure 10. The stages of recovery where first cells are formed due to the rearrangement of dislocations and then subgrains are formed and grow due to annihilation of dislocations, from Humphreys and Hatherly [23].
11

During subsequent recrystallization the subgrains function as the nuclei for recrystallization, see section 2.3. During hot deformation, dislocation accumulation due to deformation and annihilation and rearrangement of dislocations due to dynamic recovery occurs simultaneously. The evolution of dislocations during hot deformation can be separated in two parts – dislocation generation and dislocation recovery
dtd
dtd
dtd recoverygen ρρρ
−= (2)
where ρgen is the generated dislocation density and ρrecovery is the annihilated dislocation density. If dynamic recovery is the only form of restoration that occurs in the material, the flow-stress in a stress-strain curve reaches a plateau and then holds a steady-state flow-stress, see Figure 7. This depends on the fact that the rate of recovery and work hardening reaches a dynamic equilibrium. The flow stress during deformation is dependent on the dislocation density ρ and is usually described by
ρbGαmσσ ⋅⋅⋅⋅+= 0 (3)
where σ0 is a constant, mainly due to the strengthening contribution of precipitation, m is the Taylor factor which is dependent on the deformation due to the development of a deformation texture [4], see Figure 11, α is a proportionality constant (~0.15), G is the shear modulus and b is the Burgers vector. Equation (3) gives a good description of the flow-stress, see for example the work by Bergström [24].
Figure 11. Taylor factor as a function of applied strain for uniaxial compression of a fcc metal, from Siwecki and Engberg [4].
2.3 Recrystallization and grain growth The definition of recrystallization according to Doherty et al. [20] is “the formation of a new grain structure in a deformed material by the formation and migration of high angle grain boundaries driven by the stored energy of deformation”. Consequently, recrystallization is a process where new dislocation-free grains grow on the expense of the old deformed grains, leaving a new structure with low dislocation density as a result. The process is divided into nucleation of new grains and growth of the same. It is nowadays acknowledged that “nucleation” of recrystallization can not be described with classical nucleation theory [23].
12

Recrystallization is a much more rapid process and the new grains grow from small regions already present in the structure, like subgrains or cells. The subgrains must have an energy advantage, a larger size, to be able to grow, rather than shrink and vanish. Hence, for the recrystallization to take place, a critical subgrain size has to be reached. This critical size is large in comparison with the mean subgrain size, which means that it can only be reached by abnormal growth. According to Humphreys [25], no evidence is found that rotation plays an important role in subgrain coarsening. It is a reasonable assumption that both subgrain coarsening and nucleation of recrystallization from pre-existing subgrains are controlled by the migration of low angle grain boundaries. Subgrain coarsening in regions of large orientation gradient is believed to be a mechanism by which recrystallization originates [25]. When an orientation gradient is present in the deformed and recovered material, the subgrains will grow more rapidly than those in an environment where there is no orientation gradient. Faster growing subgrains obtain more misorientation, which results in the creation of a high angle grain boundary and hence a nucleus. Consequently, for recrystallization to take place a critical subgrain size has to be reached and the misorientation has to be high enough, i.e. it has to be a high angle grain boundary. Preferable nucleation sites for recrystallization are grain boundaries [23, 26] and the new grains form a “necklace” around the deformed grain, see Figure 12 and Figure 13 (a) and (b). When the grains are very large, intragranular nucleation occurs where new grains nucleate at the interior of the grains as well and not only at the prior deformed austenite grain boundaries [23], see Figure 13.
prior grain boundary
Figure 12. A schematic picture of the development of recrystallizing grains, where the initial grain size is small in comparison with the new recrystallized grains. The dotted lines illustrate prior grain boundaries and the continuous lines show new recrystallized grains. From Humphreys and Hatherly [23].
Figure 13. A schematic picture of the development of recrystallizing grains, where the initial grain size is large in comparison with the new recrystallized grains. The dotted lines illustrate prior grain boundaries and the continuous lines show new recrystallized grains. From Humphreys and Hatherly [23].
13

The recrystallized grain size is reduced when larger deformations are applied. Larger deformations give smaller subgrains and thereby increases the number of nuclei for recrystallization [13, 27]. An example is shown in Figure 13 compared to Figure 12. If the initial grain size is the same, more nuclei, as in Figure 13, provide a finer recrystallized grain size. The effect of smaller recrystallized grains with larger strains is most evident at relatively small strains. It becomes less evident with increasing strain and ceases at some critical strain. A smaller initial grain size also reduces the recrystallized grain size due to the increase of potential nucleation sites caused by the increased grain boundary area [13, 27]. The recrystallized grain size is also dependent on temperature. At lower temperatures, finer recrystallized grains are obtained due to the lower mobility of the grain boundaries and consequently slower growth rate of the recrystallizing grains [27]. The slower growth rate promotes additional nucleation during recrystallization which consequently gives smaller recrystallized grains. As the initial grain size is decreased, this effect becomes less significant. Recrystallization is a thermally activated process and the temperature dependence for static recrystallization is illustrated in Figure 14. The recrystallization curves are obtained from analyzing stress-relaxation tests performed on a Gleeble 1500 thermomechanical simulator. As seen in the figure, a sigmoidal shape of the recrystallization curve is obtained when the recrystallized fraction is plotted as a function of log(time). This is due to the nucleation and growth of recrystallizing grains followed by impingement of the growing grains.
Impingement of growing grains
Nucleation
Figure 14. Recrystallization curves from analyzing stress-relaxation tests for a plain C-Mn steel pre-strained to 0.2 true strain at a strain rate of 1 s-1 deformed and annealed at 850°C-1200°C. The material is the same as that studied in Paper II.
Recrystallization during deformation is called dynamic recrystallization. If dynamic recrystallization occurs, the flow-stress raises to a peak value followed by a lower steady-state flow-stress, see Figure 7. Dynamic recrystallization is promoted by low strain rates and high temperature. If the strain rate is low enough and the temperature high enough the flow stress does not reach a steady-state flow-stress after the peak, but oscillates around a certain value due to successive cycles of recrystallization occurring concurrently with the deformation [21].
14
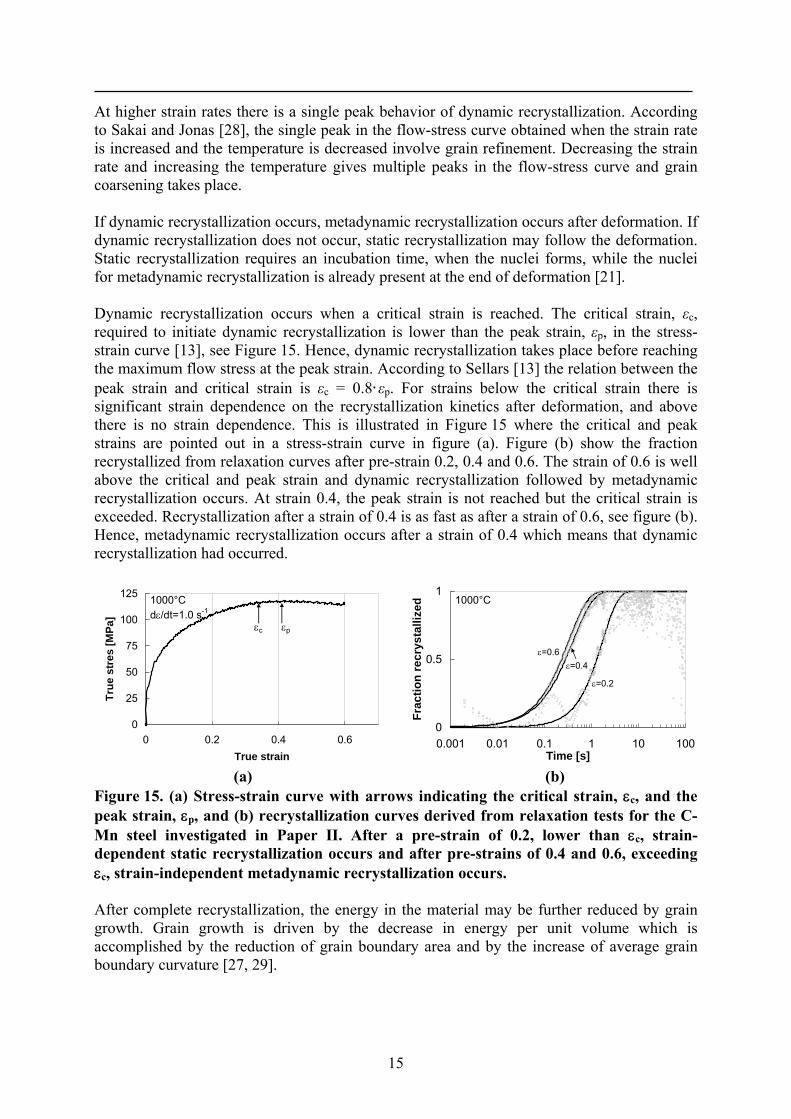
At higher strain rates there is a single peak behavior of dynamic recrystallization. According to Sakai and Jonas [28], the single peak in the flow-stress curve obtained when the strain rate is increased and the temperature is decreased involve grain refinement. Decreasing the strain rate and increasing the temperature gives multiple peaks in the flow-stress curve and grain coarsening takes place. If dynamic recrystallization occurs, metadynamic recrystallization occurs after deformation. If dynamic recrystallization does not occur, static recrystallization may follow the deformation. Static recrystallization requires an incubation time, when the nuclei forms, while the nuclei for metadynamic recrystallization is already present at the end of deformation [21]. Dynamic recrystallization occurs when a critical strain is reached. The critical strain, εc, required to initiate dynamic recrystallization is lower than the peak strain, εp, in the stress-strain curve [13], see Figure 15. Hence, dynamic recrystallization takes place before reaching the maximum flow stress at the peak strain. According to Sellars [13] the relation between the peak strain and critical strain is εc = 0.8·εp. For strains below the critical strain there is significant strain dependence on the recrystallization kinetics after deformation, and above there is no strain dependence. This is illustrated in Figure 15 where the critical and peak strains are pointed out in a stress-strain curve in figure (a). Figure (b) show the fraction recrystallized from relaxation curves after pre-strain 0.2, 0.4 and 0.6. The strain of 0.6 is well above the critical and peak strain and dynamic recrystallization followed by metadynamic recrystallization occurs. At strain 0.4, the peak strain is not reached but the critical strain is exceeded. Recrystallization after a strain of 0.4 is as fast as after a strain of 0.6, see figure (b). Hence, metadynamic recrystallization occurs after a strain of 0.4 which means that dynamic recrystallization had occurred.
0
25
50
75
100
125
0 0.2 0.4 0.6True strain
True
str
es [M
Pa]
εc εp
1000°Cdε/dt=1.0 s-1
0
0.5
1
0.001 0.01 0.1 1 10 100Time [s]
Frac
tion
recr
ysta
llize
d
ε=0.2
ε=0.4ε=0.6
1000°C
(a) (b) Figure 15. (a) Stress-strain curve with arrows indicating the critical strain, εc, and the peak strain, εp, and (b) recrystallization curves derived from relaxation tests for the C-Mn steel investigated in Paper II. After a pre-strain of 0.2, lower than εc, strain-dependent static recrystallization occurs and after pre-strains of 0.4 and 0.6, exceeding εc, strain-independent metadynamic recrystallization occurs. After complete recrystallization, the energy in the material may be further reduced by grain growth. Grain growth is driven by the decrease in energy per unit volume which is accomplished by the reduction of grain boundary area and by the increase of average grain boundary curvature [27, 29].
15

16
2.4 The effect of microalloying elements on recovery and recrystallization
Microalloying elements retard the progress of recrystallization either as dissolved in the austenite (solute drag) or as precipitates (precipitation pinning). The most common microalloying elements are niobium, vanadium and titanium which are all strong carbide-forming elements. The effect of Nb in solution is shown in the dynamic recrystallization-time-temperature (RTT) curves in Figure 16, taken from Paper VI. The construction of RTT curves as a way to study recrystallization was proposed by Akben et al. [30]. RTT curves are constructed from the recrystallization start time at a certain temperature taken as the peak strain through the strain rate. The values in Figure 16 are obtained from the flow stress curves at strain rate 0.1 s-1 and temperature 1000-1200°C. It can be seen that recrystallization is much faster in the plain C-Mn steel compared to the Nb microalloyed steels. The effect is enhanced at lower temperatures.
1000
1100
1200
1 2 3 4 5Time to peak strain [s]
Tem
pera
ture
[°C
]
Nb2Nb1CMn
Strain rate 0.1 s-1
Figure 16. The effect of Nb in solution on dynamic RTT curves at a strain rate of 0.1 s-1 (from Paper VI). The Nb1 steel contains 0.034 wt.% Nb and the Nb2 steel contains 0.055 wt.% Nb. Yamamoto et al. [31] investigated the effect on recrystallization of Nb, V and Ti in solution and as precipitated carbides and nitrides. The softening in the material was studied by double compression tests and the fraction softening between deformations was determined by the offset-method (see section 4). The fraction softening was compared to the fraction recrystallized determined for a quenched steel with high hardenability (0.04C-2.0Mn-0.3Mo-0.10Nb in wt.%) by microscopic observations. The microscopic observation compared to the softening curves indicated that recrystallization starts at the softening ratio around 20%. To determine the effect of solutes, 0.006C steels were decarburized to less than 0.002C so that the microalloying elements remained dissolved at 900°C. The softening kinetics in steels with varying Nb content were studied, see Figure 17 (a). Yamamoto et al. found that the retarding effect of Nb in solution is very significant in the region below 20% softening, i.e. before the start of recrystallization. Above 20% softening the effect is smaller which indicates that solute Nb retards recovery and the onset of recrystallization. The solute drag showed almost no effect on the progress of recrystallization, only the onset. Also for Ti steels, softening is retarded, but not as much as for the Nb steel, see Figure 17 (b). For V steels, softening is only slightly delayed.

0
20
40
60
80
100
0.01 0.1 1 10 100 1000 10000Holding time [s]
Softe
ning
ratio
[%] 0.002C, 900°C Nb free
0.097Nb
0.171Nb
0.05Nb
0
20
40
60
80
100
0.01 0.1 1 10 100 1000 10000Holding time [s]
Softe
ning
ratio
[%]
Si-Mn
0.097Nb
0.092V
0.095Ti
0.002C, 900°C
(a) (b)
Figure 17. The effect of (a) Nb in solution on softening behavior (b) Nb, V and Ti in solution, from Yamamoto et al. [31]. Yamamoto et al. also investigated the effect of solutes from other microalloying elements, Ni, Cr, Mn and Mo, see Figure 18, to establish if the effect of solute drag is resulting from lattice distortion by solute atom in the matrix. They found that the degree of the retarding effect may be explained by the degree of lattice distortion. The retarding effect increases in ascending order of Ni, Cr, Mn, V, Mo, Ti, Nb.
0
20
40
60
80
100
0.01 0.1 1 10 100 1000Holding time [s]
Softe
ning
ratio
[%] 1.0 % Cr
1.0 % Ni1.9 % Mn0.9 % Mo
Si-Mn
0.097Nb
900°C
Figure 18. The effect of Cr, Ni, Mn and Mo in solution on softening behavior compared to a Nb steel, from Yamamoto et al. [31]. In the investigation by Yamamoto et al. [31] precipitates where examined using a transmission electron microscope (TEM) and extraction replicas. The Nb precipitated was determined by chemical analyses of the extracted replicas and is shown in Figure 19 (a). At 1000°C, the ultra low carbon steel (0.002C) showed the same softening behavior as the higher carbon steel (0.019C). This indicates that no precipitation occurs at 1000°C during the time for softening. At lower temperatures the higher carbon steel displays slower softening behavior than the ultra low carbon steel, see Figure 19 (b). With higher C content, more precipitation of NbC particles occurs. This indicates that recrystallization is influenced more by precipitated particles than by solute drag. It was demonstrated that the Ti steel also shows an effect of higher C content, see Figure 20 (a), but the softening behavior in V steel is not influenced by an increase of C or N, see Figure 20 (b). Recrystallization is most likely complete before the start of VC or VN
17
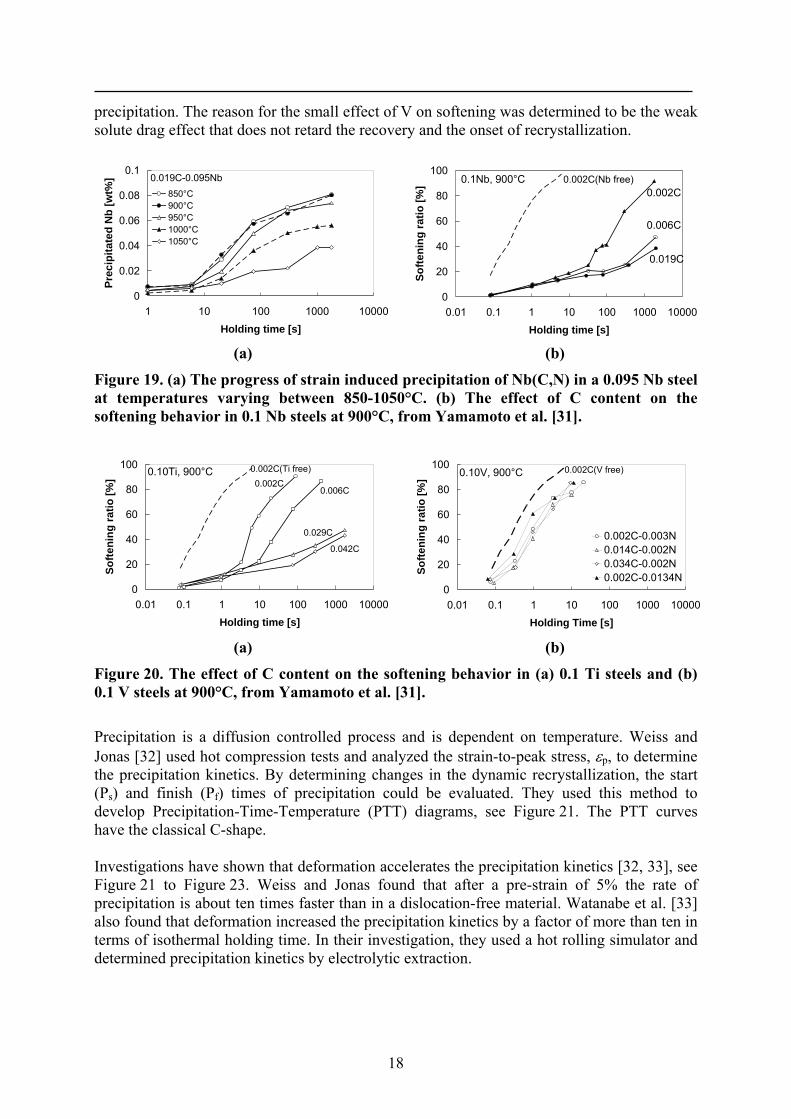
precipitation. The reason for the small effect of V on softening was determined to be the weak solute drag effect that does not retard the recovery and the onset of recrystallization.
0
0.02
0.04
0.06
0.08
0.1
1 10 100 1000 10000Holding time [s]
Prec
ipita
ted
Nb
[wt%
]
850°C900°C950°C1000°C1050°C
0.019C-0.095Nb
0
20
40
60
80
100
0.01 0.1 1 10 100 1000 10000Holding time [s]
Softe
ning
ratio
[%] 0.1Nb, 900°C 0.002C(Nb free)
0.002C
0.019C
0.006C
(a) (b)
Figure 19. (a) The progress of strain induced precipitation of Nb(C,N) in a 0.095 Nb steel at temperatures varying between 850-1050°C. (b) The effect of C content on the softening behavior in 0.1 Nb steels at 900°C, from Yamamoto et al. [31].
0
20
40
60
80
100
0.01 0.1 1 10 100 1000 10000Holding time [s]
Softe
ning
ratio
[%]
0.002C(Ti free)
0.029C
0.006C0.002C
0.10Ti, 900°C
0.042C
0
20
40
60
80
100
0.01 0.1 1 10 100 1000 10000Holding Time [s]
Softe
ning
ratio
[%]
0.002C-0.003N0.014C-0.002N0.034C-0.002N0.002C-0.0134N
0.002C(V free)0.10V, 900°C
(a) (b)
Figure 20. The effect of C content on the softening behavior in (a) 0.1 Ti steels and (b) 0.1 V steels at 900°C, from Yamamoto et al. [31]. Precipitation is a diffusion controlled process and is dependent on temperature. Weiss and Jonas [32] used hot compression tests and analyzed the strain-to-peak stress, εp, to determine the precipitation kinetics. By determining changes in the dynamic recrystallization, the start (Ps) and finish (Pf) times of precipitation could be evaluated. They used this method to develop Precipitation-Time-Temperature (PTT) diagrams, see Figure 21. The PTT curves have the classical C-shape. Investigations have shown that deformation accelerates the precipitation kinetics [32, 33], see Figure 21 to Figure 23. Weiss and Jonas found that after a pre-strain of 5% the rate of precipitation is about ten times faster than in a dislocation-free material. Watanabe et al. [33] also found that deformation increased the precipitation kinetics by a factor of more than ten in terms of isothermal holding time. In their investigation, they used a hot rolling simulator and determined precipitation kinetics by electrolytic extraction.
18

800
850
900
950
1000
1050
1 100 10000 1000000Time [s]
Tem
pera
ture
[°C
]
UndeformedDeformed 5%
Ps Pf
0.05%C, 0.035% Nb
Figure 21. Precipitation-time-temperature diagram for undeformed and deformed austenite, where Ps and Pf are the start and finish times of precipitation respectively, from Weiss and Jonas [32].
Figure 22. Precipitation kinetics of Nb(C,N) particles in recrystallized austenite of a 0.062%C-0.074%Nb steel, from Watanabe et al. [33].
Figure 23. Precipitation kinetics of Nb(C,N) particles in deformed austenite (30% reduction at 950°C) of a 0.063%C-0.084%Nb steel, from Watanabe et al. [33].
19

Precipitation and recrystallization are two interacting processes. If precipitation occurs before or in the initial stage of recrystallization, recrystallization is retarded by the precipitates. If recrystallization is complete before the onset of precipitation, precipitation kinetics is reduced due to fewer nucleation sites. Kang et al. [34] investigated the individual effect on recrystallization of each stage of precipitation, i.e. nucleation, growth and coarsening. In their investigation, they followed the softening kinetics of a 0.03wt.% Nb steel by double compression tests. Precipitate sizes were determined using TEM and carbon extraction replicas. At temperature 1000°C and above, the softening curve has the typical sigmoidal shape and below 1000°C, the softening curve exhibited a “hump” with initial softening followed by hardening due to precipitation, see Figure 24. Figure 25 shows the mean particle size as a function of time. In the figure, the time dependence of the particle size could be divided into two regions: one with a steep and one with a week slope. The transition point was regarded as the end of the growth stage and the start of the coarsening stage. A Comparison of the softening curve, Figure 24, with the mean sizes of the precipitates, Figure 25, showed that during nucleation and growth, softening is impeded by particle pinning. During the coarsening stage of precipitates, softening is again resumed. At 1000°C, recrystallization was completed before precipitation started and the precipitation hence occurred in undeformed material.
0
0.2
0.4
0.6
0.8
1
0.01 0.1 1 10 100 1000 10000 100000Time [s]
Frac
tion
softe
ning
850°C900°C950°C1000°C1050°C
Figure 24. Softening curves at various temperatures after a pre-strain of 0.3 at strain rate 10 s-1, from Kang et al. [34].
1
10
100
1000
0.01 0.1 1 10 100 1000 10000 1E+05Time [s]
Mea
n pa
rtic
le s
ize
[nm
] 850°C900°C950°C1000°C
Figure 25. Mean particle size of Nb(C,N) precipitates as a function of holding time after deformation, from Kang et al. [34].
20

3 Modeling recrystallization
3.1 Physically-based model The recrystallization model used in this work is based on Humphreys’ model [35] and is described in the appended papers. The following section will give a brief summary of the reasoning behind the model development. In the model, subgrains act as nuclei for recrystallization. The condition for recrystallization to be triggered in the model is that the subgrains are larger than a critical size and that they are misoriented enough, the subgrain boundaries have to be of high angle type (see section 2.1 and 2.3). The condition for the misorientation to be high enough is that the subgrains have a boundary energy close to that of grains. The subgrain size, Rsub, depends on the dislocation density, ρ, [36]
ρssub kR = (4)
where ks is a constant. The boundary energy of subgrains, γsub, is assumed to be dependent on the misorientation and the boundary energy of a high angle grain boundary, γgb, [35]
⎟⎟⎠
⎞⎜⎜⎝
⎛−⋅=
g
sub
g
subgbsub ln1
θθ
θθγγ (5)
where θsub and θg are the misorientation of low and high angle grain boundaries, respectively. The evolution of the ratio θsub/θg and also the subgrain size during deformation are shown in Figure 26. In the model, the condition of a high angle boundary is determined by the ratio θsub/θg which has to be close to one for recrystallization to start.
0
0.2
0.4
0.6
0.8
1
0 0.05 0.1 0.15 0.2True strain
θ sub
/ θg
0
5
10
15
20
25
Rsu
b [µ
m]
Rsub
θsub/θg
Figure 26. The evolution of θsub/θg and subgrain size during deformation of a C-Mn steel at 900°C.
21

The second condition for recrystallization to be triggered is that the driving force, Frec, is larger than zero
0)-( recdef2
dsub
sub
rec
gbrec >−−⋅⋅⋅++−= SDZ PPbGc
RRF ρργγ
(6)
where Rrec is the recrystallized grain size, cd is a constant, ρdef and ρrec are the dislocation density in the deformed and recrystallized material, respectively, and PZ and PSD are the retarding forces due to particle pinning and solute drag, respectively. From this condition the critical subgrain size is derived
SDZ PPbGcR
−−⋅⋅⋅
⎟⎟⎠
⎞⎜⎜⎝
⎛⎟⎟⎠
⎞⎜⎜⎝
⎛−−
=)-(
ln11
recdef2
d
g
sub
g
subgb
critsub, ρρ
θθ
θθγ
(7)
This means that for larger deformations (higher dislocation density), providing smaller subgrains, a smaller critical size is required for recrystallization to start. If recrystallization starts, the number of recrystallized grains is determined. The grains are assumed to be spherical and the potential nucleation sites are subgrains at high angle grain boundaries, i.e. along the old deformed boundary. In the model, the grain boundary area is calculated for deformed grains. In Figure 27 and Figure 28 a schematic picture of the course of recrystallization is shown. During recrystallization, growth of recrystallizing grains and coarsening of recrystallized grains take place concurrently. Figure 28 shows the recrystallizing grains growing into the deformed material and the coarsening of recrystallized grains, i.e. normal grain growth.
(a) (b) (c)
Figure 27. A schematic picture of (a) a spherical grain, (b) deformed grain and (c) deformed grain with new recrystallized grains along its periphery.
Old grain boundary
Coarsening of recrystallized grain, normal grain growth (interior grain)
Recrystallizing grain (surface grain)
”Reduced” grain boundary
Figure 28. A schematic picture of deformed material (light gray) where new grains (dark gray) grow and coarsen.
22

In the model, the recrystallizing/recrystallized grains are treated as two classes: surface grains and interior grains, which represent growing and coarsening grains, respectively, see Figure 28. If the grain boundary is covered with new recrystallized grains, a “reduced” old grain boundary is calculated where new grains can start to recrystallize. Second-phase particles exert a retarding force, PZ, on recrystallization and grain growth. Also, microalloying elements dissolved in the austenite provides a retarding force, PSD. For the material to recrystallize, the driving force for recrystallization has to be larger than the pinning force exerted by precipitates and the retarding force exerted by solute drag, see equation (6). The drag on a grain boundary caused by elements in solution depends on the velocity of the boundary relative to the diffusivity of the impurity and also its interaction with the grain boundary. To be able to model the effect of solute drag on recrystallization and grain growth, the interaction energy between the solute and the grain boundary, ΔG, has to be determined. ΔG is the dissipation of free energy due to diffusion when the boundary passes through a volume containing one mol of atoms [37]. A wedge-shaped or a truncated wedge-shaped function is often chosen for ΔG in order to simplify the calculations, see Figure 29 (a). The atoms are dragged along the boundary and the concentration profile at the boundary for a certain element at constant temperature depends on the velocity of the boundary. In Figure 29 (b) the concentration, c, of Nb along the boundary at different boundary velocities is shown. Higher velocity yields lower concentration profile.
-2.5
-1 -0.5 0 0.5 1y/w
ΔG
Boundary width
-0.005
0
0.005
0.01
0.015
0.02
-1 -0.5 0 0.5 1 1.5 2 2.5
y/w
c-c 0
direction
v 1
v 3
v 2
v 1<v 2<v 3
c0 = 0.01
(a) (b) Figure 29. (a) Wedge-shaped (dashed line) and truncated wedge-shaped (solid line) function for ΔG. (b) Impurity concentration profile across a grain boundary moving with velocity v calculated using the model by Hillert and Sundman [37] assuming a wedge shaped interaction profile and constant solute diffusivity (c0 is the matrix solute concentration). The position along the grain boundary, y, has been normalized through division with the boundary width, w. A concentration profile dependent on the boundary velocity means a retarding force dependent on the velocity. In Figure 30 the effect of the retarding force as a function of velocity is shown. For recrystallization, the driving force is large, i.e. the boundary velocity of recrystallized grains is high, and the retarding force is in the “high velocity region”. As the velocity is decreased due to accumulation of atoms in the boundary, the retarding force also gets higher. Hence, only at the initial stage of recrystallization, the retarding force is in the high velocity region.
23

0.E+00
1.E+07
2.E+07
0 10 20 30 40 5Dimensionless velocity v ·w /D
PSD
[J/m
3 ]0
High velocity region
Figure 30. The variation of the retarding force with a dimensionless boundary velocity as calculated with Hillert and Sundman’s model [37]. A wedge shaped interaction profile and constant solute diffusivity is assumed. The retarding force due to second phase particles, PZ, with radius r and volume fraction f is, for randomly distributed particles, described by [23]
rf
P gb
23
Z
γ= (8)
commonly known as Zener pinning. The number of particles per unit volume, Nv, is given by ( )34 3rfNv π= . Assuming that particles within a distance r on either side of the boundary
will intersect it gives the number of particles intersecting unit area of the boundary NS=2r·Nv. With the maximum restraining effect on the grain boundary given by Fs=πrγgb [23] and the retarding force given by PZ=NS·FS, equation (8) is obtained. Randomly distributed particles, equation (8), do not give enough retardation to impede recrystallization completely [38, 39]. A more realistic assumption for the precipitate distribution is that the particles lie on the subgrain boundaries. A schematic picture of randomly distributed particles and particles distributed at the grain boundary is shown in Figure 31. When the particles are distributed at the boundaries, the number of particles per unit area of boundary is vvA SNN /δ= , where Sv is the grain boundary area per unit volume (=3/2Rgb) and δ is a factor depending on the position of the particles in the boundaries [23]. Consequently, particles on grain boundaries provide a higher retarding force than the one given by equation (8)
22 rfR
FNP gbgbSAZ
δγ== (9)
which gives enough retarding force on the growth of recrystallizing grains.
(a) (b)
v v
Figure 31. Schematic picture of a boundary with velocity v where the particles are (a) randomly distributed and (b) distributed on the boundary.
24
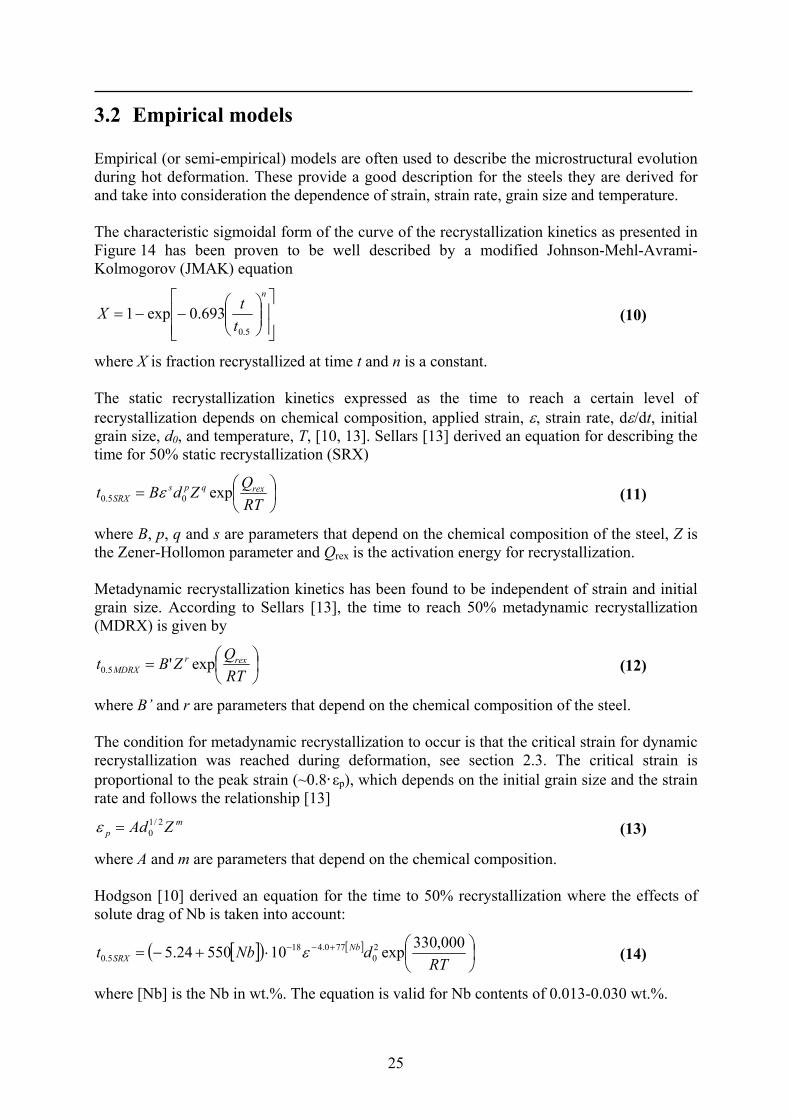
3.2 Empirical models Empirical (or semi-empirical) models are often used to describe the microstructural evolution during hot deformation. These provide a good description for the steels they are derived for and take into consideration the dependence of strain, strain rate, grain size and temperature. The characteristic sigmoidal form of the curve of the recrystallization kinetics as presented in Figure 14 has been proven to be well described by a modified Johnson-Mehl-Avrami-Kolmogorov (JMAK) equation
⎥⎥⎦
⎤
⎢⎢⎣
⎡⎟⎟⎠
⎞⎜⎜⎝
⎛−−=
n
ttX
5.0
693.0exp1 (10)
where X is fraction recrystallized at time t and n is a constant. The static recrystallization kinetics expressed as the time to reach a certain level of recrystallization depends on chemical composition, applied strain, ε, strain rate, dε/dt, initial grain size, d0, and temperature, T, [10, 13]. Sellars [13] derived an equation for describing the time for 50% static recrystallization (SRX)
⎟⎠⎞
⎜⎝⎛=
RTQZdBt rexqps
SRX exp05.0 ε (11)
where B, p, q and s are parameters that depend on the chemical composition of the steel, Z is the Zener-Hollomon parameter and Qrex is the activation energy for recrystallization. Metadynamic recrystallization kinetics has been found to be independent of strain and initial grain size. According to Sellars [13], the time to reach 50% metadynamic recrystallization (MDRX) is given by
⎟⎠⎞
⎜⎝⎛=
RTQZBt rexr
MDRX exp'5.0 (12)
where B’ and r are parameters that depend on the chemical composition of the steel. The condition for metadynamic recrystallization to occur is that the critical strain for dynamic recrystallization was reached during deformation, see section 2.3. The critical strain is proportional to the peak strain (~0.8·εp), which depends on the initial grain size and the strain rate and follows the relationship [13]
mp ZAd 2/1
0=ε (13)
where A and m are parameters that depend on the chemical composition. Hodgson [10] derived an equation for the time to 50% recrystallization where the effects of solute drag of Nb is taken into account:
[ ]( ) [ ] ⎟⎠⎞
⎜⎝⎛⋅+−= +−−
RTdNbt Nb
SRX000,330exp1055024.5 2
0770.418
5.0 ε (14)
where [Nb] is the Nb in wt.%. The equation is valid for Nb contents of 0.013-0.030 wt.%.
25

When the effect of precipitates on recrystallization is modeled it is often assumed that once precipitation has started, usually defined as 5% precipitation, recrystallization is completely retarded [5, 10]. The start for precipitation, i.e. the time for 5% precipitation, has been determined by Dutta and Sellars [40] to be described by
( ) ⎟⎟⎠
⎞⎜⎜⎝
⎛⎟⎟⎠
⎞⎜⎜⎝
⎛
−−−− ⋅⋅=2
s3
defdef ln000,270
5.01160.05p ][103 kT
BRT eeZNbt ε (15)
where [Nb] is the concentration of Nb in solution in wt.%. B is a constant with a mean value of 2.5·1010, Tdef is the temperature of deformation in K, R is the gas constant and ks is the supersaturation ratio. This ratio is often determined with the solubility product by Irvine [41] and is then given by
def/677026.2soln
s 10]14/12][[
TNCNbk −
+= (16)
where the elements are the niobium, carbon and nitrogen contents in solution in wt.%.
26

4 Experimental procedure The recrystallization kinetics can be determined by metallographic examination of quenched specimens or by mechanical testing such as double compression tests with varying holding times between deformations or by using stress relaxation tests. Metallographic determination of the recrystallization kinetics is tedious and quite difficult because of the phase transformation that occurs during cooling in microalloyed steels. Determination of the recrystallization kinetics by double compression tests requires one test for each holding time, i.e. one test per value on the recrystallization-time curve, and numerous tests have to be done. The stress relaxation technique is used in this research since it is the most efficient way to measure reliable recrystallization kinetics. The tests were performed on a Gleeble 1500 thermomechanical simulator. The stress relaxation test is described by Karjalainen et al. [42, 43], where both the analysis technique and characteristics of the test are described. Karjalainen et al. showed that the stress relaxation technique is applicable to several steel grades. The technique can measure both static and metadynamic recrystallization. The fraction recrystallized in stress relaxation tests is determined using the mixture rule for the work-hardened part and the fully softened part [43], and is given by
( ) ( ) ttX t
rec loglog
2121
11
αασσσασ
−−−−−
= (17)
where σ1, σ2, α1 and α2 are constants in the first and third stage of relaxation, see Figure 32, and σt is the stress at time t. In the figure, relaxation after a pre-strain of 0.5 at 950°C is shown for a Nb microalloyed steel. The arrows in the figure indicate start and stop of recrystallization. In Figure 32 it appears to be two sets of data by the end of stage I, although it is in fact data from one single test. This feature is due to high frequency oscillations.
Figure 32. The stages of relaxation after a pre-strain of 0.5 at 950°C for a Nb microalloyed steel with 0.034 wt.% Nb (the material studied in Paper III, IV and VI). The arrows indicate start and stop of recrystallization.
27
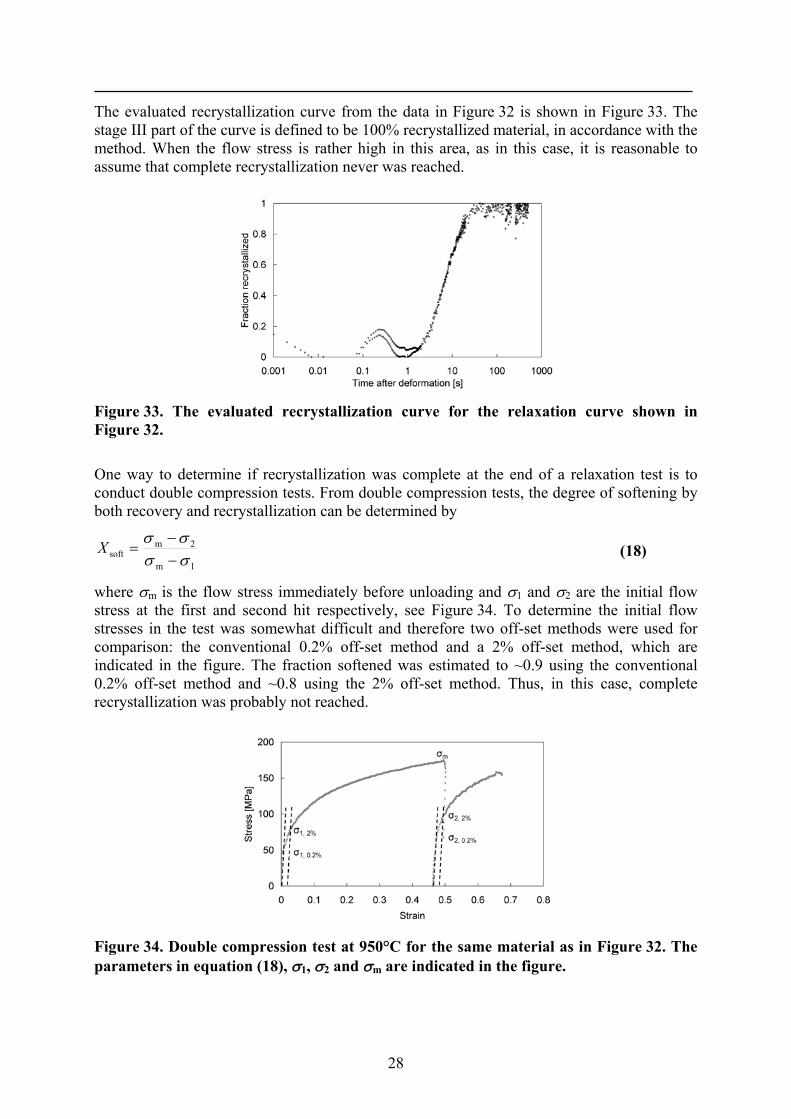
The evaluated recrystallization curve from the data in Figure 32 is shown in Figure 33. The stage III part of the curve is defined to be 100% recrystallized material, in accordance with the method. When the flow stress is rather high in this area, as in this case, it is reasonable to assume that complete recrystallization never was reached.
Figure 33. The evaluated recrystallization curve for the relaxation curve shown in Figure 32.
One way to determine if recrystallization was complete at the end of a relaxation test is to conduct double compression tests. From double compression tests, the degree of softening by both recovery and recrystallization can be determined by
1m
2msoft σσ
σσ−−
=X (18)
where σm is the flow stress immediately before unloading and σ1 and σ2 are the initial flow stress at the first and second hit respectively, see Figure 34. To determine the initial flow stresses in the test was somewhat difficult and therefore two off-set methods were used for comparison: the conventional 0.2% off-set method and a 2% off-set method, which are indicated in the figure. The fraction softened was estimated to ~0.9 using the conventional 0.2% off-set method and ~0.8 using the 2% off-set method. Thus, in this case, complete recrystallization was probably not reached.
Figure 34. Double compression test at 950°C for the same material as in Figure 32. The parameters in equation (18), σ1, σ2 and σm are indicated in the figure.
28

The test samples in this investigation have a diameter of 10 mm and a height of 12 mm and were machined from the head-end of transfer bars after rolling in the roughing mill in SSAB’s hot strip mill. The experimental setup is shown in Figure 35. The anvils are made of tungsten carbide and three foils are used in the tests: a graphite foil for reducing friction, a nickel-foil for preventing carbon diffusion into the specimen at high temperatures and a tantalum-foil to prevent sticking to the anvils, se Figure 35 (b). The sample is heated using resistance heating. In the picture, the thermocouple attached to the sample for measuring and controlling the temperature of the sample is shown. Also, the spray devices for quenching the samples can be seen.
(a) (b) (c)
C
Ni
10mm 12mm
Ta
Figure 35. Experimental setup in the Gleeble machine: (a) at room temperature, (b) illustration of the foils and (c) at 1200°C. Due to the fact that there is a phase transformation when quenching the samples, the old austenite grains are not easy to detect in the microstructure. Preferably, martensite should be formed when quenching the samples, in order to freeze the austenite structure. In these tests, ferrite transformation has sometimes started on the former austenite grain boundaries. Hence, there were some problems in determining the old austenite boundaries, but an estimation of the prior austenite grain size could be done.
29

30

5 Summary of appended papers
5.1 Paper I Prediction of microstructural behavior during hot rolling In this paper the microstructure model was used to describe the microstructural evolution of C-Mn steels during hot rolling in SSAB’s hot strip mill. The model is built up by sub-models and the sub-model describing the flow stress was verified in a previous work by Siwecki and Engberg [4]. Here, a verification of the sub-model describing recrystallization was performed. First, results from the recrystallization model was compared with experimental data from Medina et al. [44], where good agreement was obtained. The fraction recrystallized during hot rolling calculated with the microstructure model was then compared to the fractions calculated with an empirical model which is proven to give good results according to Siciliano et al. [45]. The results showed some minor differences. Both models predict full recrystallization in the roughing mill. In the finishing mill the empirical model predicts full recrystallization after the first two passes and thereafter partial. The microstructure model predicts partial recrystallization in the entire finishing mill, although it is nearly complete after the first two passes. The calculated flow stress during hot rolling was verified using process data collected from SSAB’s hot strip mill. From measured roll forces a mean flow stress was calculated for each pass using a friction-hill model. The verification was done by comparing the mean flow stress from the microstructure model with the mean flow stress calculated from measured roll forces. The development of the mean flow stress during the rolling process is shown in Figure 36.
0
50
100
150
200
250
R1 R2 R3 R4 R5 F1 F2 F3 F4 F6
Pass
MFS
[MP
a]
MicrostructuremodelFriction-hillmodel
Roughing mill Finishing mill
Figure 36. Mean flow stresses (MFS) for each pass in the hot strip mill calculated with the friction-hill model and the microstructure model.
31

The agreement with the friction-hill model in the roughing mill is good, but in the finishing mill it is less accurate. One explanation could be the uncertainty in the calculated temperatures, where the calculations only can be adapted to the measured strip surface temperatures. In Paper I, the coefficient of friction is never discussed, but surely it affects the results. When calculating the mean flow stresses with the friction-hill model, the coefficient of friction was set to a constant value of 0.3. The value of 0.3 was obtained as follows: In the roughing mill the roll torque can be determined and with both the roll torques and the roll forces known, the coefficient of friction could be defined. The calculated coefficient of friction in the roughing mill was ~0.3 and hence this value was used. In the finishing mill, the roll torque could not be accurately determined and the coefficient of friction had to be estimated. It is possible that the coefficient of friction in the finishing mill varies from stand to stand, but since this could not be verified, the same value as in the roughing mill was used. There is a possibility that the actual mean flow stresses in the finishing mill are in fact higher than the flow stresses determined with the friction-hill model due to an inaccurate friction. If so, the agreement with measured data would in fact be better than what is illustrated in Figure 36. From this investigation it is clear that the hot rolling process is too complex to use as “an experimental tool” to verify and validate the model. Controlled experiments, where all the data is confirmed are needed.
5.2 Paper II A physically based microstructure model for predicting the microstructural evolution of a C-Mn steel during and after hot deformation In this paper, the model was used to describe experimental data conducted on a Gleeble 1500 thermomechanical simulator at Oulu University, Finland. With the intention of verifying that the model can describe dynamic, static and metadynamic recrystallization, compression tests combined with stress relaxation were performed at various temperatures, strains and strain rates. The following experimental parameters were used:
Reheating rate 4°Cs-1 Reheating temperature 1200°C Soaking time 180 s Cooling rate to deformation temperature 10°Cs-1 Holding time before deformation 15 s Deformation temperature 850°C - 1200°C Applied strain in each hit 0.2-0.6 Strain rate 0.1 - 10 s-1
32

The same set of parameters was used to describe the microstructural evolution for all the tests. For the compression tests, the agreement between the experimental and calculated values is good, but the model does not accurately describe the shape of the curves, see Figure 37. When dynamic recrystallization occurs in the calculations, this is described by one part still deforming and one part recrystallizing while simultaneously deformed. This results in oscillations of the curves which can be seen in Figure 37. Also, in the initial stage of deformation the agreement with experimental data is rather poor, especially at higher strain rates as in Figure 37 (b).
(a) (b)
Figure 37. Calculated and experimental stress-strain curves at various temperatures at strain rates of (a) 0.1 s-1 and (b) 10 s-1. Calculations of the stress relaxation tests show reasonable agreement with experimental data, see for example Figure 38.
Figure 38. Experimental and calculated relaxation curves at various temperatures after a strain of 0.4 at strain rate 1 s-1. For almost every stress relaxation test at strain rate 1s-1, temperatures from 850°C -1200°C and strains of 0.2, 0.4 and 0.6, the model accurately describes the recrystallization kinetics. Also at strain rate 0.1 s-1, at temperatures 1000°C and below, the model gives good agreement with experimental values. There are some problems describing the relaxation when substantial dynamic recrystallization has occurred during the deformation. Therefore, at strain rate 0.1 s-1
33

at temperature 1100°C and above, the model can not reproduce the experimental flow stress during relaxation. A validation of the model was done by calculating a multi-step test where good agreement with flow stress values and grain sizes was obtained, see Figure 39. The outline of the multi-step test was arranged to simulate the hot rolling process. The first reduction was large in order to quickly reduce the grain size. It was then followed by a long holding time in order to get a fully recrystallized structure before the next reduction. The succeeding reductions were followed by shorter holding times.
(a) (b)
Figure 39. (a) Experimental and calculated average grain size and (b) flow stress at four subsequent deformations with different holding times in between. Generally, experimental data and calculations show good agreement which was very promising for the intention of predicting the microstructural evolution during hot rolling. The next step was to verify that the model can describe the microstructural evolution for microalloyed steels.
5.3 Paper III Prediction of the microstructural evolution during hot strip rolling of Nb microalloyed steels In this paper, the microstructural evolution during hot strip rolling of Nb steels was modeled using the microstructure model in combination with Dutta and Sellars equation for the start of precipitation [40]. In Paper II, the calculated results at the initial part of deformation were rather poor and therefore a new setup of parameters was fitted in this paper to get better results. The parameters in the model were fitted with data obtained from compression tests combined with stress relaxation for a steel with composition 0.065C-0.008N-0.034Nb given in wt.%. The tests were conducted at temperatures in accordance with the hot rolling process, 900-1200°C. In Figure 40, some of the obtained results are presented. The figure show compression and stress relaxation for temperatures 1000, 1100 and 1200°C, a pre-strain of 0.6 and a strain rate of 1 s-1.
34

0
50
100
150
0 0.1 0.2 0.3 0.4 0.5 0.6True strain
True
str
ess
[MPa
]
1200°C
1000°C
1100°C
Soaking temperature = 1250°CInitial grain size R0 = 130µmdε/dt = 1 s-1
0
50
100
150
0.01 0.1 1 10 100 1000Time after deformation [s]
True
str
ess
[MPa
] 1000°C
1200°C
1100°C
(a) (b)
Figure 40. Calculated (dashed) and experimental (solid) values for (a) stress-strain curves and (b) stress relaxation curves at different temperatures. Ten commercial HSLA steels with Nb content in wt.% of 0.034 to 0.056 processed in SSAB’s hot strip mill, were modeled in this investigation. The final thickness of the strips was in the range 4-15 mm. From measured roll forces the mean flow stress was determined using a friction-hill model as was the case in Paper I. This enabled the calculated flow stresses to be compared to measured ones. The accuracy of the calculated flow stresses compared to the measured ones is good with an agreement mainly within the interval ±15%. For thinner strips (final thickness ~4 mm), there were some problems in predicting accurate flow stresses in the last passes in the finishing mill, see Figure 41 (a). For steels with less reduction, the model predicts the flow stresses well, see the result of an 8 mm strip in Figure 41 (b). In the figure, the six finishing passes are numbered F1 to F6 and the precipitation start, PPTN, calculated with Dutta and Sellars equation is indicated by arrows.
0
100
200
300
0.74 0.78 0.82 0.86
1000/T [K-1]
MFS
[MPa
]
Friction-hillMicrostructure model
PPTN
F1 F2 F3 F4 F5 F6
0
100
200
300
0.74 0.78 0.82 0.86
1000/T [K-1]
MFS
[MPa
]
Friction-hillMicrostructure model
F1 F2 F3 F4 F5 F6
PPTN
(a) (b)
Figure 41. Calculated mean flow stress for (a) a 4 mm strip and (b) an 8 mm strip. The arrow indicates the precipitation (PPTN) start point. The less accurate agreement between calculated and measured values in the last passes for the thinner strips might depend on the fact that no kinetics and growth of the precipitates is taken into account. In the calculations, the volume fraction of precipitates is set to a constant value in order to entirely retard the recrystallization in the following passes. In reality, continued nucleation and growth of precipitates are expected during the subsequent rolling.
35

5.4 Paper IV Modeling precipitation and its effect on recrystallization during hot strip rolling of niobium steels In this paper, the microstructural evolution during hot strip rolling of Nb steels was modeled using the model in combination with Cahn’s simplified model for solute drag [46] and a precipitation model. In the precipitation model, solubility products were used to determine the driving force and solubility of precipitates. The parameters determining solute drag was set by fitting the model to experiments above the temperature where precipitation should occur. Figure 42 shows the results of the calculated flow stress compared to experiments for compression and stress-relaxation tests at temperatures 1000, 1100 and 1200°C, a pre-strain of 0.4 and a strain rate of 1 s-1. The tests were done for a steel with composition 0.065C-0.008N-0.034Nb given in wt.% (same steel as in Paper III). The precipitation model predicts some precipitation of NbC at 1000°C for longer times. Comparing the results in Figure 40 (Paper III) with Figure 42, the flow stress at the end of the test at 1000°C in Figure 42 is in level with experiments while in Figure 40 it is somewhat lower. This is due to the description of the precipitation kinetics here, where the volume fraction increases with time giving a retardation of recovery as well as some strengthening contribution.
0
50
100
150
0 0.1 0.2 0.3 0True strain
True
str
ess
[MPa
]
1000°C
1100°C
1200°C
.4
0
50
100
150
0.01 0.1 1 10 100 1000Time after deformation [s]
True
str
ess
[MPa
] 1000°C
1100°C
1200°C
(a) (b)
Figure 42. Calculated (dashed) and experimental (solid) values for (a) stress-strain curves and (b) stress relaxation curves at different temperatures (ε = 0.4, dε/dt = 1 s-1).
The parameters for the precipitation model were determined by using literature data with experiments at different temperatures for strain-induced precipitation and also by fitting the experimental data of stress-relaxation tests, see Figure 43. Three commercial steel grades rolled in SSAB’s hot strip mill (Domex 240: 0%Nb, Domex 420: 0.036%Nb, Domex 490: 0.063%Nb) with a final thickness of 8 mm were selected to be studied. As in Paper I and III, the mean flow stress from measured roll forces was calculated with a friction-hill model. The agreement between calculated and measured values is reasonably good, see Figure 44, which implies that the calculations give accurate values for recrystallization and precipitation kinetics. For Domex 420, the measured mean flow stress values are not quite met and this might be explained by some strengthening contribution missing and that there should in fact be some more precipitation at lower temperatures.
36

0
50
100
150
200
0 0.1 0.2 0.3 0.4True strain
True
str
ess
[MPa
]
0
50
100
150
200
0.01 0.1 1 10 100 1000Time after deformation [s]
Flow
str
ess
[MPa
]
(a) (b)
Figure 43. Calculated (dashed) and experimental (solid) values for (a) a stress-strain curve and (b) a stress relaxation curve at 900°C (ε = 0.4, dε/dt = 1 s-1).
0
50
100
150
200
250
300
0.75 0.8 0.85 0.91000/T [1/K]
Mea
n Fl
ow S
tres
s [M
Pa] Calculated
MeasuredDomex 490
Domex 420
Domex 240
Figure 44. Comparison of the mean flow stress (MFS) from measured data to the mean flow stress calculated with the microstructural model for rolling in the finishing mill for the three investigated steels. Figure 45 shows calculated precipitation of NbC and fraction recrystallized while rolling in the finishing for Domex 420 and Domex 490. In the figure, the six finishing passes are numbered F1 to F6. Only for Domex 490 a noticeable amount of NbC precipitation occurs.
0
0.5
1
0 5 10 15 20Time [s]
Frac
tion
recr
ysta
llize
d
0
0.5
1
1.5
Volu
me
frac
tion
NbC
Fraction recrystallizedVolume fraction NbC
F1 F2 F3 F4 F5 F6 x10-4
0
0.5
1
0 5 10 15 20Time [s]
Frac
tion
recr
ysta
llize
d
0
0.5
1
1.5
Volu
me
frac
tion
NbC
Fraction recrystallizedVolume fraction
F1 F2 F3 F4 F5 F6 x10-4
(a) (b) Figure 45. Volume fraction precipitated NbC and fraction recrystallized during rolling in the finishing mill for (a) Domex 420 and (b) Domex 490.
37

5.5 Paper V Physical Based Model for Predicting the Microstructural Evolution at Hot Rolling In this paper the progress of the model development was described. The results from Paper III and IV were compared. For the plain C-Mn steel, as shown in Figure 44 (Paper IV), the flow stress is lower than for the Nb steels. The model predicts recrystallization to be nearly complete throughout the whole process, except between the last two passes where partial recrystallization occurs. The final predicted austenite grain radius is about 15 µm and hence larger than the predicted grain size of 7 µm for the Nb steels investigated in Paper III. In Paper III, recrystallization and grain growth were reduced by solute drag due to a small reduction in grain boundary mobility as well as by particles. For the low-alloyed Nb steel (Domex 420) in Paper IV, the model predicts very little precipitation of NbC, and the retardation of recrystallization is due to Nb in solution. The recrystallization is completely retarded in the last passes due to the effect of solute drag. Here, the recrystallization is retarded earlier than in the case with no description of the precipitation kinetics and no solute drag model (Paper III), leading to a final austenite grain size radius of ~40 µm. The main difference between the calculations is the description of the solute drag effect. Using the Dutta and Sellars description for the start time of precipitation of Nb(C,N) with the recrystallization model gives reasonable agreement with mill observations. Using a precipitation model and a solute drag model with the recrystallization model gives a more detailed description of the microstructure evolution.
5.6 Paper VI Modeling the effect of solute drag on recovery and recrystallization during hot deformation of Nb microalloyed steels In this investigation, the effect of solute drag on recovery and recrystallization was investigated more thoroughly by using the solute drag model by Hillert and Sundman [37]. Two Nb steels with 0.034wt.% Nb (Nb1 steel) and 0.055wt.% Nb (Nb2 steel) were studied. Hillert and Sundman’s model describes the retarding force due to solutes on moving grain boundaries giving retardation in grain growth and recrystallization. Solutes also provide retardation on recovery. The effect of solutes on recovery was described by reducing the rate parameter of dislocation recovery, where the reduction depends on the diffusivity and solute concentration of Nb. A linear temperature dependence of the interaction energy (ΔG = 12·T-30676) describing the solute drag effect on grain boundaries, gave good correlation with measured data, see Figure 46. Calculated and measured stress-strain curves are illustrated in Figure 47 where the model reproduces the experimental data quite well with the exception of the oscillations in the curves. The oscillations are explained in Paper II and depend on the fact that in the model,
38
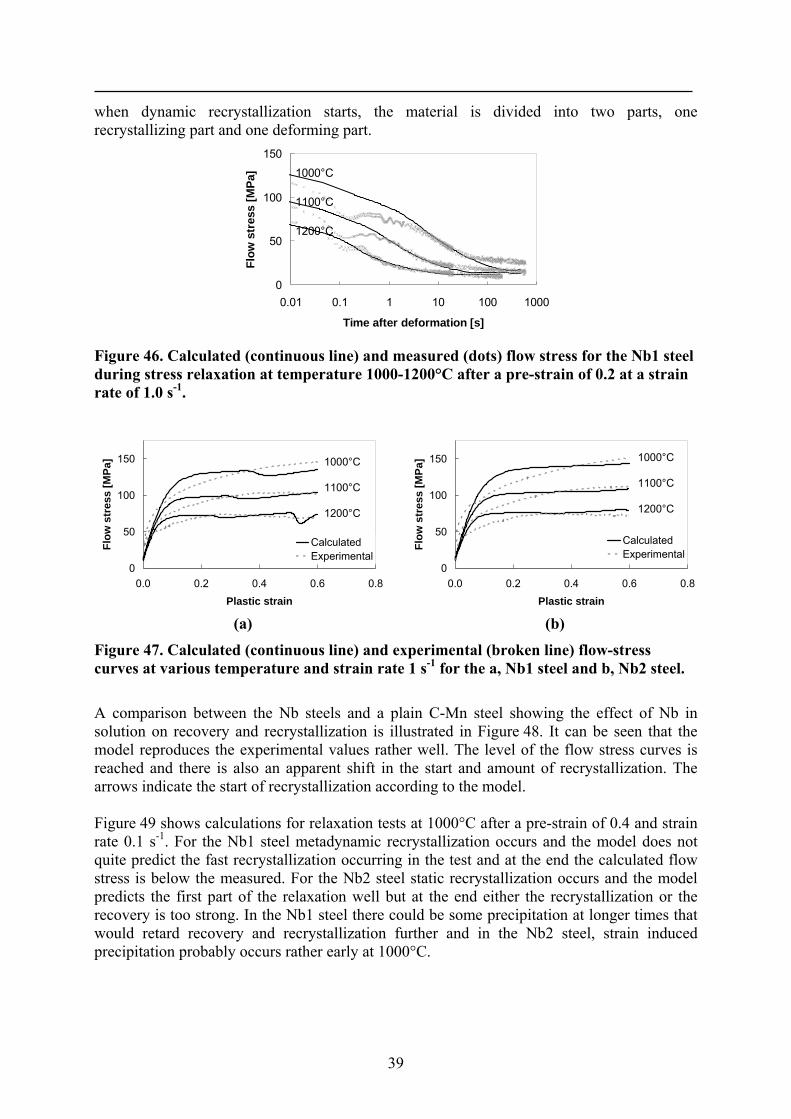
when dynamic recrystallization starts, the material is divided into two parts, one recrystallizing part and one deforming part.
0
50
100
150
0.01 0.1 1 10 100 1000
Time after deformation [s]
Flow
str
ess
[MPa
] 1000°C
1100°C
1200°C
Figure 46. Calculated (continuous line) and measured (dots) flow stress for the Nb1 steel during stress relaxation at temperature 1000-1200°C after a pre-strain of 0.2 at a strain rate of 1.0 s-1.
0
50
100
150
0.0 0.2 0.4 0.6 0.8Plastic strain
Flow
str
ess
[MPa
]
CalculatedExperimental
1000°C
1100°C
1200°C
0
50
100
150
0.0 0.2 0.4 0.6 0.8Plastic strain
Flow
str
ess
[MPa
]
CalculatedExperimental
1000°C
1100°C
1200°C
(a) (b)
Figure 47. Calculated (continuous line) and experimental (broken line) flow-stress curves at various temperature and strain rate 1 s-1 for the a, Nb1 steel and b, Nb2 steel.
A comparison between the Nb steels and a plain C-Mn steel showing the effect of Nb in solution on recovery and recrystallization is illustrated in Figure 48. It can be seen that the model reproduces the experimental values rather well. The level of the flow stress curves is reached and there is also an apparent shift in the start and amount of recrystallization. The arrows indicate the start of recrystallization according to the model. Figure 49 shows calculations for relaxation tests at 1000°C after a pre-strain of 0.4 and strain rate 0.1 s-1. For the Nb1 steel metadynamic recrystallization occurs and the model does not quite predict the fast recrystallization occurring in the test and at the end the calculated flow stress is below the measured. For the Nb2 steel static recrystallization occurs and the model predicts the first part of the relaxation well but at the end either the recrystallization or the recovery is too strong. In the Nb1 steel there could be some precipitation at longer times that would retard recovery and recrystallization further and in the Nb2 steel, strain induced precipitation probably occurs rather early at 1000°C.
39

0
50
100
0.0 0.2 0.4 0.6 0.8Plastic strain
Flow
str
ess
[MPa
]CalculatedExperimental
Nb2 Nb1
CMn
Figure 48. Calculated (continuous line) and experimental (broken line) flow-stress curves at strain rate 1 s-1 and temperature 1100°C for the Nb steels and a C-Mn steel. The arrows indicate the start of recrystallization according to the model.
0
20
40
60
80
100
120
0.01 0.1 1 10 100 1000
Time after deformation [s]
Flow
str
ess
[MPa
] Nb2, exp.Nb2, calc.Nb1, exp.Nb1, calc.
Figure 49. Calculated (continuous line) and measured flow stress (dots) for the two Nb steels during stress relaxation at temperature 1000°C after a pre-strain of 0.4 at a strain rate of 0.1 s-1.
5.7 Paper VII Modeling the kinetics of strain induced precipitation and its effect on recovery and recrystallization in Nb microalloyed steels In this paper, precipitation kinetics was modeled using literature data. Rather good agreement with experimental data from various experimental methods was obtained with the model. Deformation accelerates the precipitation which can be reasonably described by the model. The calculated Nb(C,N) precipitation and particle size for undeformed austenite is shown in Figure 50. In Figure 51 precipitated Nb in deformed austenite is shown. At high temperatures where the driving force for precipitation is low there is a significant effect of solute drag on the precipitation kinetics, see Figure 52. In (a) the solute drag effect is included and in (b) the solute drag effect is excluded from the calculations. Solute drag retards recrystallization enough for strain induced precipitation to occur. For low temperatures where
40

the driving force for precipitation is large there is practically no influence of solute drag on the precipitation kinetics.
0
1
2
3
4
5
6
100 1000 10000 100000Time [s]
Mol
e fr
actio
n
0
50
100
150
200
250
300
Part
icle
siz
e [n
m]Calculated fraction
Fraction, Akamatsu et al.
Calculated size
Size, Akamatsu et al.
950°C
x10-4
Figure 50. Calculated and experimental precipitation kinetics and particle size at 950°C with experimental data from Akamatsu et al. [47].
0
0.02
0.04
0.06
0.08
0.1
1 10 100 1000 10000Time [s]
Prec
ipita
ted
Nb
[wt.%
] CalculatedYamamoto et al.
900°C0
0.02
0.04
0.06
0.08
0.1
1 10 100 1000 10000Time [s]
Prec
ipita
ted
Nb
[wt.%
] CalculatedYamamoto et al.
950°C
(a) (b)
Figure 51. Calculated (lines) and experimental (symbols) precipitated Nb at (a) 900 and (b) 950°C with experimental data from Yamamoto et al. [31].
0
0.02
0.04
0.06
0.08
0.1
0.1 10 1000 100000Time after deformation [s]
Prec
ipita
ted
Nb[
wt%
]
0
0.2
0.4
0.6
0.8
1
Frac
tion
recr
ysta
llize
dCalculatedprecipitated NbYamamoto et al.
Calculated fractionrecrystallized
950°C
0
0.02
0.04
0.06
0.08
0.1
0.1 10 1000 100000Time after deformation [s]
Prec
ipita
ted
Nb
[wt%
]
0
0.2
0.4
0.6
0.8
1Fr
actio
n re
crys
talli
zed
Calculatedprecipitated NbYamamoto et al.
Calculated fractionrecrystallized
950°C
(a) (b)
Figure 52. The effect of solute drag on precipitation. Calculated (lines) and experimental (symbols) precipitated Nb and calculated fraction recrystallized at 950°C in a Nb steel with experimental data from Yamamoto et al. [31]. (a) The solute drag model is included. (b) The solute drag model is excluded.
41

42
6 Conclusions and future work In Paper I it was concluded that the recrystallization model developed by Engberg provides good agreement with experimental data for recrystallization. The calculations of the mean flow stress for process data in the roughing mill show good agreement with the calculated mean flow stress using a friction-hill model. The recrystallization during rolling gives similar values as an acknowledged empirical model. Still some modifications have to be made to get better agreement for the finishing mill. It was also concluded that the results were promising for the purpose of modeling the microstructural evolution in hot strip mills, but also that the hot rolling process is too complex to use to get a good setup of parameters. In Paper II it was concluded that the model provides reasonable agreement with experimental data for all the temperatures and strain rates tested. The model does not accurately describe the shape of the curves, especially for small strains and low strain rates but the agreement between experimental and calculated level of the flow stress is good. Furthermore, the calculated relaxation curves provided good fit with experimental data. In some cases where substantial dynamic recrystallization has occurred during the deformation, there were some problems describing the relaxation. Calculations of a multi-step test show good agreement with both flow-stress values and grain sizes and on the whole, the results give very promising results for the intention of predicting the microstructural evolution during hot rolling. In Paper III it was concluded that the model, in combination with the Dutta and Sellars expression for the start time of precipitation of Nb(C,N), gives reasonable agreement with mill observations and can be used to predict or interpret the microstructural evolution of Nb steels during finish rolling. In order to get better results, there is a need for a model describing the kinetics and growth of precipitates. In Paper IV it was concluded that the precipitation model in combination with a solute drag model gave a reasonable description of the microstructural evolution of Nb steels during hot rolling. This investigation showed that a good description of the microstructural evolution during hot rolling is achieved only by using mean size values for particles and a simplified solute drag model. The model predicts that only in the 0.063wt.% Nb steel a noticeable amount of NbC precipitation occurs. Since recrystallization is retarded in the last passes for both the 0.036wt.% Nb steel and the 0.063 wt.% Nb steel, solute drag has an essential effect on the retardation of recrystallization. Further validation of the precipitation model has to be done. In Paper V the progress of the model development was described and the results from Paper III and IV were compared. The sub-models in the microstructure model used in different combinations show reasonable results and it was concluded that the model can be used to predict or understand the microstructural evolution of Nb steels during finish rolling. For example, the model indicates that only for high-alloyed Nb steels a noticeable amount of NbC
43
precipitation occurs during rolling and that solute drag has an essential effect on the retardation of recrystallization. In Paper VI it was concluded that the effect of solute drag on recrystallization kinetics at temperatures above the equilibrium temperature for dissolving Nb(C,N), i.e. 1100°C, is evident when comparing the dynamic recrystallization between Nb steels and a plain C-Mn steel. Also at lower temperatures the retardation of recrystallization seems to be due to solute drag. When precipitation is likely to occur in the steel, the solute drag is not sufficient to reduce recovery and recrystallization. Only by adding two models to the original model, one describing the retarding effect of solutes on recovery and one describing the retarding effect of recrystallization and grain growth, the model can describe the flow stress during compression and relaxation for Nb microalloyed steel when precipitation does not occur. To be able to model the recrystallization kinetics at low temperatures in microalloyed steels a description of the precipitation kinetics is necessary. In Paper VII it was concluded that the calculated Nb(C,N) precipitation kinetics and particle size show reasonable agreement with experimental data obtained with various experimental methods. At higher temperatures where the driving force for precipitation is low there is a significant effect of solute drag on the precipitation kinetics. Still some improvement of the model can be made. The studies in this thesis have shown that the model can be used to describe the microstructural evolution of Nb microalloyed steels during hot deformation. To get a model for a variety of steel grades, a description of the solute drag effect of Ti is needed. Further work has to be done with the precipitation model, a description of the kinetics of, for example, TiC, VN, AlN and MnS precipitation is needed. Also, more complex precipitates like (Ti,Nb)(C,N) has to be described. Particle stimulated nucleation (PSN) was never discussed in the work, but there could be an effect of PSN for both recrystallization and precipitation. Furthermore, to get a model that describes the whole hot rolling process, a phase transformation sub-model has to be implemented into the model. Also, there is a need for a description of precipitation in the ferrite, to be able to predict the final mechanical properties.
44

7 References [1] B. Leden, Scand. J. Metall, Vol. 15 (1986), pp. 215-223. [2] T. Siwecki, G. Engberg and A. Cuibe, "Thermo-mechanical controlled processes for
high strength and toughness in heavy plates and strips of HSLA-steels", THERMEC 97: International Conference on Thermomechanical Processing of Steels and Other Materials, Wollongong, Australia, 1997, pp. 757-763.
[3] A.J. DeArdo, "Fundamental Aspects of the Physical Metallurgy of Thermomechanical Processing of Steel", THERMEC-88: International Conference on Physical Metallurgy of Thermomechanical Processing of Steels and Other Metals, Tokyo, Japan, 1988, pp. 20-29.
[4] T. Siwecki and G. Engberg, "Recrystallization controlled rolling of steels", Thermo-Mechanical Processing in Theory, Modelling & Practice [TMP] exp 2, Stockholm, Sweden, 1997, pp. 121-144.
[5] F.J. Siciliano and J.J. Jonas, Metall. Mater. Trans.A, Vol. 31A (2000), pp. 511-530. [6] S. Yue and J.J. Jonas, Materials Forum, Vol. 14 (1990), pp. 245-252. [7] A.J. DeArdo, J.M. Gray and L. Meyer, "Fundamental Metallurgy of Niobium in
Steel", Niobium, San Francisco, California, USA, 1984, pp. 685-759. [8] L.J. Cuddy, "The Effect of Microalloy Concentration on the Recrystallization of
Austenite During Hot Deformation", Thermomechanical Processing of Microalloyed Austenite, Pittsburgh, Pennsylvania, USA, 1982, pp. 129-140.
[9] C. Ouchi, T. Sanpei, T. Okita and I. Kozasu, "Microstructural Changes of Austenite During Hot Rolling and Their Effects on Transformation Kinetics", The Hot Deformation of Austenite, New York, USA, 1977, pp. 316-340.
[10] P.D. Hodgson, Mater. Forum, Vol. 17 (1993), pp. 403-408. [11] S.F. Medina, "Microstructural modelling for low alloy and microalloyed steels", 2nd
International Conference on Modelling of Metal Rolling Processes, London, UK, 1996, pp. 501-510.
[12] R.A. Petkovic, M.J. Luton and J.J. Jonas, "Flow Curves and Softening Kinetics in High-Strength Low-Alloy Steels", The Hot Deformation of Austenite. AIME, New York, USA, 1977, pp. 68-85.
[13] C.M. Sellars, "The Physical Metallurgy of Hot Working", Hot Working and Forming Processes, Sheffield, UK, 1980, pp. 3-15.
[14] F. Siciliano, Jr., K. Minami, T.M. Maccagno and J.J. Jonas, ISIJ Int., Vol. 36 (1996), pp. 1500-1506.
[15] M.C. Somani, L.P. Karjalainen, D.A. Porter and A.R. Morgridge, "Regression modelling of the recrystallization kinetics of austenite", International conference on Thermomechanical Processing: Mechanics, Microstructure & Control, Sheffield, UK, 2002, pp. 436-441.
[16] R.A. Shulkosky, D.L. Rosburg, J.D. Chapman and K.R. Barnes, "A microstructure evolution model used for hot strip rolling", Modeling, Control, and Optimization in
45

Ferrous and Non-Ferrous Industry as held at the Materials Science & Technology 2003 Conference, Chicago, IL, USA, 2003, pp. 509-527.
[17] J. Andorfer, G. Hribernig, A. Samoilov, A. Luger, J. Zeindl, K. Rendl, P. Stiaszny and G. Hubmer, "Properties of hot rolled strip obtained by calculation or testing - a critical comparison", 9th European conference on NDT, Berlin, Germany, 2006, pp. 1-16.
[18] X. Wang, T. Siwecki and G. Engberg, "A physical model for prediction of microstructure evolution during thermomechanical processing", THERMEC 2003 (Part 5): International Conference on Processing & Manufacturing of Advanced Materials, Madrid, Spain, 2003, pp. 3801-3806.
[19] G. Engberg, "A toolbox for process simulations", Stål 2004, Borlänge, Sweden, 2004, pp. 138-139.
[20] R.D. Doherty, D.A. Hughes, F.J. Humphreys, J.J. Jonas, D.J. Jensen, M.E. Kassner, W.E. King, T.R. McNelley, H.J. McQueen and A.D. Rollett, Mater. Sci. Eng. A, Vol. 238 (1997), pp. 219-274.
[21] R.A.P. Djaic and J.J. Jonas, J. Iron Steel inst., Vol. 210 (1972), pp. 256-261. [22] D. Hull and D.J. Bacon, "Introduction to Dislocations, Third Edition", Pergamon Press
Ltd , Headington Hill Hall, Oxford OX3 0BW, England, 1984, pp. 230. [23] F.J. Humphreys and M. Hatherly, "Recrystallization and related annealing
phenomena", Elsevier Science Ltd , The Boulevard, Langford Lane, Kidlington, Oxford OX5 1GB, UK, 2004.
[24] Y. Bergström, "The plastic deformation of metals - a dislocation model and its applicability", Div. of Physical Metallurgy, Royal Institute of Technology, Stockholm, 1983.
[25] F.J. Humphreys, Materials Science Forum, Vol. 467-470 (2004), pp. 107-116. [26] C.M. Sellars, "Microstructure modeling in hot deformation", Thermo-Mechanical
Processing in Theory, Modelling & Practice [TMP] exp 2, Stockholm, Sweden, 1997, pp. 35-51.
[27] W.P. Sun, M. Militzer, E.B. Hawbolt and T.R. Meadowcroft, "Austenite grain refinement and growth during the thermomechanical processing of steels", Hot Workability of Steels and Light Alloys-Composites; Montreal, Quebec; Canada, 1996, pp. 285-292.
[28] T. Sakai and J.J. Jonas, Acta Metall., Vol. 32 (1984), pp. 189-209. [29] K. Lücke and H.P. Stüwe, "On the Theory of Grain Boundary Motion", Recovery and
Recrystallization of Metals Aime, 1966, pp. 171-210. [30] M.G. Akben, B. Bacroix and J.J. Jonas, Acta Metall., Vol. 31 (1983), pp. 161-174. [31] S. Yamamoto, C. Ouchi and T. Osuka, "The Effect of Microalloying Elements on the
Recovery and Recrystallization in Deformed Austenite", Thermomechanical Processing of Microalloyed Austenite, Pittsburgh, Pennsylvania, USA, 1982, pp. 613-639.
[32] I. Weiss and J.J. Jonas, Metall. Trans.A, Vol. 10A (1979), pp. 831-840. [33] H. Watanabe, Y.E. Smith and R.D. Pehlke, "Precipitation Kinetics of Niobium
Carbonitride in Austenite of High-Strength Low-Alloy Steels", The Hot Deformation of Austenite. AIME, New York, USA, 1977, pp. 140-168.
[34] K.B. Kang, O. Kwon, W.B. Lee and C.G. Park, Scripta Materialia, Vol. 36 (1997), pp. 1303-1308.
[35] F.J. Humphreys, Acta Mater., Vol. 45 (1997), pp. 4231-4240. [36] S.V. Raj and G.M. Pharr, "A Compilation and Analysis of Data for the Stress
Dependence of the Subgrain Size", International Conference on Low Energy Dislocation Structures, Charlottesville, Virginia, USA, 1986, pp. 217-237.
[37] M. Hillert and B. Sundman, Acta Metall., Vol. 24 (1976), pp. 731-743.
46

[38] S.S. Hansen, J.B. Van der Sande and M. Cohen, Metall. Trans. A., Vol. 11A (1980),
pp. 387-402. [39] E.J. Palmiere, C.I. Garcia and A.J. DeArdo, Metallurgical and Materials Transactions
A (USA), Vol. 27A (1996), pp. 951-960. [40] B. Dutta and C.M. Sellars, Mater. Sci. Technol., Vol. 3 (1987), pp. 197-206. [41] K.J. Irvine, F.B. Pickering and T. Gladman, J. Iron Steel inst., Vol. 205 (1967), pp.
161-182. [42] L.P. Karjalainen, J. Perttula, Y. Xu and J. Niu, "Stress relaxation, a novel technique
for measuring the softening kinetics in hot-deformed austenite", Physical Simulation of Casting, Hot Rolling and Welding, Tsukuba, Japan, 1997, pp. 231-236.
[43] L.P. Karjalainen and J. Perttula, ISIJ Int., Vol. 36 (1996), pp. 729-736. [44] S.F. Medina and J.E. Mancilla, ISIJ Int., Vol. 36 (1996), pp. 1063-1069. [45] F. Siciliano, Jr., K. Minami, T.M. Maccagno and J.J. Jonas, ISIJ International, Vol. 36
(1996), pp. 1500-1506. [46] J.W. Cahn, Acta Metall., Vol. 10 (1962), pp. 789-798. [47] S. Akamatsu, T. Senuma and M. Hasebe, "Mathematical Modelling of Nb(C,N)
Precipitation Applicable to Extra Low Carbon Steels", International Symposium on Low-Carbon Steels for the 90's, Pittsburgh, Pennsylvania, USA, 1993, pp. 187-194.
47

![Thermal properties of hot-pressed aluminum nitride ... · applied uniaxial pressure was supposed to orient graphene particles in the matrix [16, 19]. The microstructural observations](https://static.fdocuments.net/doc/165x107/5ed65979f4f2e228267f8f2d/thermal-properties-of-hot-pressed-aluminum-nitride-applied-uniaxial-pressure.jpg)