
Modeling the Heat Treatment Response of P/M Components · Modeling the Heat Treatment Response of...
38
1 Modeling the Heat Treatment Response of P/M Components Research Team Makhlouf M. Makhlouf, Professor Richard D. Sisson, Jr., Professor Virendra S. Warke, Ph.D. Student Focus Group Members Don Brydges Quebec Metal Powders, Ltd. Ian Donaldson GKN Sinter Metals Worcester John Fulmer Nichols Portland Bill Jandeska General Motors Chaman Lall Metal Powder Products Co. Jean Lynn DaimlerChrysler Corporation. Stephen Mashl (Chair) Bodycote IMT, Inc. Sim Narasimhan Hoeganaes Corporation Rocco Petrilli Sinterstahl G.m.b.H. Reinaldo Soave Mahle Metal Leve S.A. Sylvain St-Laurent Quebec Metal Powders, Ltd. PROJECT STATEMENT Objectives The main objective of this project is to develop and verify a computer simulation software and strategy that enables the prediction of the effects of heat treatment on powder metallurgy components. The simulation should accurately predict dimensional change and distortion, residual stresses, type and quantity of metallurgical phases in the microstructure, and hardness. Strategy The project is divided into four major tasks as follows: • Task-1 of the project is to assess the capability of a commercially available heat treatment tool for predicting the heat treatment response of wrought alloys. This task includes modeling the heat treatment response of wrought 5160 steel and validating the model predictions against measured data. • Task-2 of the project is to model the heat treatment response of fully dense P/M parts (46XX alloy). In this Task, the input database required for the model will be
-
Upload
truongthien -
Category
Documents
-
view
217 -
download
0
Transcript of Modeling the Heat Treatment Response of P/M Components · Modeling the Heat Treatment Response of...

1
Modeling the Heat Treatment Response of P/M Components
Research Team Makhlouf M. Makhlouf, Professor Richard D. Sisson, Jr., Professor Virendra S. Warke, Ph.D. Student Focus Group Members Don Brydges Quebec Metal Powders, Ltd. Ian Donaldson GKN Sinter Metals Worcester John Fulmer Nichols Portland Bill Jandeska General Motors Chaman Lall Metal Powder Products Co. Jean Lynn DaimlerChrysler Corporation. Stephen Mashl (Chair) Bodycote IMT, Inc. Sim Narasimhan Hoeganaes Corporation Rocco Petrilli Sinterstahl G.m.b.H. Reinaldo Soave Mahle Metal Leve S.A. Sylvain St-Laurent Quebec Metal Powders, Ltd.
PROJECT STATEMENT
Objectives The main objective of this project is to develop and verify a computer simulation software and strategy that enables the prediction of the effects of heat treatment on powder metallurgy components. The simulation should accurately predict dimensional change and distortion, residual stresses, type and quantity of metallurgical phases in the microstructure, and hardness. Strategy The project is divided into four major tasks as follows: • Task-1 of the project is to assess the capability of a commercially available heat
treatment tool for predicting the heat treatment response of wrought alloys. This task includes modeling the heat treatment response of wrought 5160 steel and validating the model predictions against measured data.
• Task-2 of the project is to model the heat treatment response of fully dense P/M parts (46XX alloy). In this Task, the input database required for the model will be

2
generated and used to predict the heat treatment response of fully dense P/M parts. The model predictions will be verified against measured data.
• Task-3 of the project includes modeling the heat treatment response of porous P/M
components. Here the input data required for the model will be generated for two different porosity levels. The model will be modified to accommodate the effect of porosity on heat treatment response for the given alloys; again the model predictions will be verified against measured data.
• Task-4 of the project includes modeling the heat treatment response of a production
part with two different levels of porosity and subjected to two different heating methods. The model predictions will be verified against measured data.
The deliverable from the project is a tested software tool and strategy for predicting the effect of heat treatment on the characteristics of P/M components.
SUMMARY OF ACCOMPLISHMENTS IN THIS QUARTER
• Square blocks of 4601 alloy powder with 0.5% admixed carbon were manufactured to yield three levels of porosity, namely, 0%, 5 %, and 10 %.
• Small CHTE probes were machined out of these blocks and heat transfer coefficients for these samples were obtained by quenching in Houghton-G oil.
• Jominy end quench test samples were machined from the blocks and tested to characterize hardnability of the alloy.
• Oil absorption during quenching was quantified by measuring the weight gained by the probes after quenching.
• Metallography was performed on the samples in order to check porosity distribution around the machined probe cross-section.
• Relevant equations on the effect of porosity on various mechanical and thermal properties were obtained from the literature.
• Test matrix to characterize phase transformation kinetics for the three levels of porosity was developed.
• Samples were machined from pressed and sintered blocks for dilatational measurements in order to obtain transformation kinetics for all three levels of porosity.
• Test matrix was developed to measure the transformation-induced plasticity in the alloy during Austenite to Martensite, and Austenite to Bainite transformation.
WORK PLANNED FOR NEXT QUARTER

3
• Dilatometric measurements will be performed at Oak Ridge National Laboratory, Oak Ridge, TN.
• Strain vs. time data from isothermal dilatational curves and strain vs. temperature data from continuous cooling dilatation curves will be fitted into the kinetics equations using a specialized routine developed by Deformation Control Technology, Cleveland, OH.
• Dilatometric measurements under an applied static load will be performed at Oak Ridge National Laboratory, Oak Ridge, TN.
• Similar to the transformation kinetics datasets, these measurements under different loading conditions will be utilized to obtain transformation-induced plastic stain in the material.
Changes in project statement None. Report organization The body of this report is organized in four Appendices as follows:
Appendix A – contains a paper that was presented at the 2004 International Conference on Powder Metallurgy & Particulate Materials, Chicago, IL. In this article, various aspects of quenching of P/M steel parts with varying densities is discussed. Heat transfer coefficients for probes, which are machined from 90% and 95 % dense P/M blocks, are measured by quenching in Houghton-G oil. Jominy end quench tests are performed on the same alloy with 90 % and 95 % of theoretical density and the hardnability curve is plotted. The probes are also used to quantify the oil absorption characteristics of the alloy for different density levels. Detailed procedures for these measurements can be found in this appendix. Appendix B – contains a paper that was presented at the 2004 International Conference on Powder Metallurgy & Particulate Materials, Chicago, IL. This article focuses mainly on the development of datasets required by the DANTE models in order to predict the heat treatment response of the alloy under consideration. Moreover, the modification of the DANTE model to predict heat treatment response of P/M steel by introducing porosity as a state variable is discussed. Finally, the capabilities of DANTE model are presented using a wrought steel alloy as an example. Appendix C – contains test matrices for dilatometry measurements to generate the transformation kinetics datasets that are required as input data for DANTE. These measurements will be performed at Oak Ridge National Laboratory (ORNL), Oak Ridge, TN. A high-speed quench dilatometer, at the High Temperature Materials Laboratory at ORNL will be used to generate data as described in the experimental procedure section of this appendix.

4
Appendix D – contains test matrices for dilatometry experiments under an applied static load. The main purpose of these measurements is to quantify the transformation induced plasticity during transformation. Plastic behavior of steels during metallurgical transformations can be divided into two aspects: (1) Classical plasticity, which is plastic flow arising from variation of the applied stress or the temperature cycle, and (2) Transformation plasticity, which is the plastic flow arising from variation of phase proportion during phase transformation. In other words, the progress of transformation occurring in the metal under external stress induces plastic deformation in that metal even if the stress applied and transformation temperature are kept constant. The transformation plasticity is an important parameter for the numerical simulations of the heat treatment process in steels, as omission of this parameter not only can lead to erroneous stress values, but also may generate wrong signs of the residual stresses predicted by the model. Low Stress Dilatometry will be used to determine the transformation-induced plasticity by an applying external compressive static load just before the start of the transformation. In this appendix, the detailed procedure for assessing transformation plasticity caused by the austenite-to-martenite transformation and the austenite-to-bainite transformation is described. These measurements will be performed at Oak Ridge National Laboratory, Oak Ridge, TN.
1
Appendix A
QUENCHING POWDER METALLURGY PRODUCTS
Richard D. Sisson Jr., Mohammed Maniruzzaman, Shuhui Ma, Virenda Warke and Makhlouf M. Makhlouf
Mechanical Engineering Department
Worcester Polytechnic Institute Worcester, MA 01609
ABSTRACT The cooling rates of powder metallurgy products during quenching depends on the nature of the surface finish of the part as well as the quenching process parameters (i.e. fluid composition and temperature, agitation rates and part orientation and geometry). In this paper the results of a series of quenching experiments with powder metallurgy (P/M) quench probes are presented and discussed. A theoretical analysis of the heat transfer mechanisms during quenching is also presented and discussed with special attention to film and nucleate boiling. It was found that a 90% pore-free density 4660 P/M alloy probe had a higher heat transfer coefficient than that of a 95% pore-free density probe. No Leidenfrost effect was seen in both probes. INTRODUCTION Powder metallurgy (P/M), one of the fastest growing metal working technologies, is a promising and attractive technology because of its ability to fabricate quality parts with complex shape. P/M parts are fabricated from metal powders through compaction, sintering and densification. To add considerable value to the P/M parts, additional steps as finishing operations may be taken. These steps include repressing, smoothing, surface hardening through carburization, shot peening, coating and strengthening through heat treatment, etc. There are various process variables that can control the properties of the final product, such as, powder chemistry, heat treatment, microstructure and porosity distribution [1,2]. P/M parts are heat treated to control phases present and microstructure and distribution of alloying elements after fabrication of parts. Various heat treatment techniques are applied to P/M parts that follow the classical techniques used in wrought and cast metals. Solutionizing and quenching heat treatments are used to harden all through a part to improve strength [1,2].

2
Heat transfer during quenching of hot metal parts in a liquid quenchant is controlled by several distinct cooling mechanisms [3,4], as shown in Figure 1. Upon immersion into the quench fluid, the part will first be surrounded by vapor film, which is shown in the figure by the range A-B. In this range heat transfer rate is minimum and heat transfer occurs mainly through radiation. The part cools slowly in this regime. As the part cools, the film becomes unstable and the mechanism is then called partial film boiling or transition boiling, shown by the range B-C. The surface alternatively covered with a vapor blanket and liquid layer, resulting in oscillating surface temperatures. The onset of this regime is known as Leidenfrost point [3]. With the decrease in temperature, the heat flux steadily increases and reaches a maximum, known as critical heat flux (CHF), as shown by point C. The range C-E is known as nucleate boiling regime. With further decrease in temperature, partial films are broken into numerous bubbles and the quench media contacts the part directly. The liquid near the hot surface becomes superheated and tends to evaporate, forming bubbles wherever there are nucleation sites such as tiny pit or scratches on the surface. The bubbles transport the latent heat of the phase changes and also increase the convective heat transfer by agitating the liquid near the surface. This corresponds to rapid heat transfer. The part is still very hot and the quench media boils vigorously. In this regime, heat transfer is rapid. There are two sub-regimes in nucleate boiling: bulk boiling and local boiling. Bulk boiling, shown by the range C-D, is nucleate boiling in a saturated liquid; in this case, the bubbles do not collapse and they leave the hot surface in the form of jets and bubble columns. Local boiling, shown by the range D-E, is nucleate boiling in a sub-cooled liquid, where bubbles formed at the heating surface and tend to condense locally. The last regime is the natural convection regime; the surface of the part has cooled to a temperature below the boiling point/range of the quench media. The heat is transferred by the natural convection of the liquid.

3
Figure 1: Temperature-Time and Cooling rate – Temperature curves of a CHTE 4140 steel probe[5] of 9.525mm dia and 38.1 mm long quenched in clear mineral oil (Houghton T7A, Houghton Intl.). In this study a series of quench experiments were performed to study the quenching performance of 4660 P/M alloy parts. CHTE quench probe system [5-7] was used to collect the time-temperature data during quenching in mineral oils. Surface heat transfer coefficients as a function of temperature were estimated and the effects of porosity on the quenching performance of the part were investigated. EXPERIMENTAL Raw materials: 1. Commercial water atomised, prealloyed ATOMET 4601 (Fe-1.8Ni-0.55Mo-0.196Mn) from Quebec Metal powders 2. Southwestern 1651 graphite of high purity 99% and particle size range of 0-325 � m. 3. 3/4% by weight Acrawax C atomized lubricant. Mixing: Lubricant (3/4 % Acrawax C atomized) and metal powders are mixed for 15 mins in a P-K Vee blender, 3.784 liter (4 quart) capacity mixer. Carbon as graphite was added at the same time as the lubricant.

4
Compaction and Sintering: Plates of 107.95 x 107.95 x 26.9875 mm (4-1/4 x 4-1/4 x 1-1/16 in) at two levels of porosity were pressed;
• at a pressure of 689.5 MPa (50 tsi) to yield 90% dense, and • at pressures of 620.55 MPa (45 tsi) first press, plus presinter 30 minutes in
dissociated ammonia environment at 1550°F plus repress at 799.82 MPa (58 tsi) to get 95% of pore-free density.
An M and N Modern Hydraulic Press, double acting hydraulic press, was used in each case. Sintering was carried out under dissociated ammonia environment at a pressure of one atmosphere with a cooling rate of 2 hr to reach 60 oC (140°F) in a Lindberg tube type furnace, 152.4 mm (6 in) ID with 304.8 mm (12 in) long hot zone. The sintering temperature was 1121 oC (2050°F) for 1/2 hour at temperature with a heating rate of 30 minute, room temp. to 1126 oC (2059°F). The final composition of the P/M plates is Fe-0.6C-1.8Ni-0.549Mo-0.196Mn (4660 P/M alloy). Several 9.525 mm (3/8 in) dia x 38.1 mm (1-1/2 in) long CHTE quench probes and 25.4 mm (1 in) dia x 102 mm (4 in) long Jominy end-quench probes (ASTM A 255-67) were fabricated by machining from the P/M plate. The CHTE probe is cylindrical in shape in order to enable ease of heat transfer calculation using 1-D approximation using the time-temperature data measured at the center of the probe. The dimensions of the probe along with the coupling and the connecting rod are shown in Fig. 2. CHTE probes were austenized at 850oC in argon environment and then quenched in Houghto G quench oil using a CHTE Quench Probe System, as shown in Fig. 3. The system consists of notebook PC based data-acquisition system, pneumatic cylinder with air valve, a small box furnace, 1-L size beaker for quenchant and K-type thermocouple-connecting rod-coupling-interchangeable probe tip assembly. The pneumatic cylinder rod moves the probe down into the quench tank from the box furnace. Jominy end-quench probes were also austenized at 850oC in a box furnace. The probe was quickly transferred to a Jominy end-quench test fixture where it was cooled by spraying a controlled flow of water onto one end of the probe.
9.525 mm
38.1 mm 63.5 mm 355.6 mm
Probe Tip
CouplingConnecting rod
1.5875mm allen set screw
#6 - 32 threads per 25.4mm
K-type
Thermocouple
20 threads per 25.4 mm
6.35mm L - 6.35mm D
24 threads per 25.4mm
6.35mm L - 7.9375mm D
19.05 mm
Fig. 2 CHTE quench probe-coupling-connecting rod assembly [5-7]

5
Pneumatic cylinder
Furnace
Oil beaker
Pneumatic on/off
switch
K-type thermocouple
Probe tip
Connecting rod
Computer with Data
Acquisition Card
Thermocouple for Oil temp.
Fig. 3 CHTE quench probe system [5-7] RESULTS AND DISCUSSIONS Quench probes were machined from fabricated P/M plates with two levels of porosity; 5% and 10%. Density of the machined probes was measured and the results are shown in Table-I. The surface morphology of the machined CHTE probes of 90% and 95% dense are shown in Fig. 4. 90% dense probe surface shows more pores with larger size than that of 95% dense probe.
Table I: Density measurement of PM Parts
Set – I (10% porosity)
Set – II (5% porosity)
Diameter, cm 2.538 2.471 Area, cm2 5.060 4.797 Height, cm 10.160 10.160
Volume, cm3 51.413 48.739 Mass, g 364.110 361.640
Density, g/cm3 7.082 7.420 % density 90 94

6
a. 90% pore-free density b. 95% pore-free density Fig. 4 Surface morphology of the CHTE P/M quench probe before quenching Each type of CHTE probe was quenched in Houghto G mineral oil after austenizing at 850oC for at least 5 mins in an Argon atmosphere. The tests were repeated four times. Fig. 5 depicts the typical cooling curves and cooling rate curves for 90% and 95% dense probes. In both cases the maximum cooling rate occurred at around 690oC. The presence of more and bigger pores on the surface of 90% dense probe than that of 95% dense enhanced the heat extraction rate from the surface, as illustrated in Fig. 6. No film boiling regime or Leidenfrost points were visible. In the partial film regime, the surface pores helped to break the oil vapor film formed on the surface thereby enhanced the heat extraction rate. Presence of more and bigger pores also increased the heat extraction in the nucleate boiling regime.
a. 90% pore-free density b. 95% pore-free density Fig. 5 Typical cooling and cooling rate curves for 90% and 95% dense CHTE P/M quench probes quenched in Houghto G mineral based quench oil.

7
90% and 95% 4660 probe quenched in Houghton G
Cooling rate, oC/sec
0 20 40 60 80 100 120 140 160 180
Te
mp
era
ture
, o
C
100
200
300
400
500
600
700
800
900
90%
95%
Fig. 6 Comparison of cooling rate curves of CHTE P/M quench probes at two levels of density Surface heat transfer coefficients of CHTE probe can be calculated using the lumped thermal capacity model [7]. This model is applicable only when the ratio of internal resistance within the part ( )
sk1 to the external resistance of the quenching fluid
boundary layer ( )( )Lh1 is much less than 1. This ratio is known as the Biot number (Bi) [8], where h is the surface heat transfer coefficient, L is the volume to surface area ratio of the part, and kS is the thermal conductivity of the part. The lumped-capacity model is valid for parts for which Bi ≤ 0.1 and the CHTE probe satisfies this condition. This model can be expressed by the following equations:
dt
dTTVCTTAh pe )()( !="" (1)
where, h =heat transfer coefficient averaged over the surface area, W/m2-K A = surface area, m2 T = temperature of the probe surface, oC Te = temperature of the oil, oC ! = Density, kg/m3
V = volume, m3 Cp = specific heat, J/kg*oC dT/dt = derivative of the temperature with respect to time, or cooling rate, oC/sec.
In order to calculate the average heat transfer coefficient from the cooling rate data the following are considered: (a) The specific heat of the probe during quenching varies with temperature, and (b) The density can also vary but to a lesser extent. Rearranging equation (1),

8
dt
dT
TTA
TVCh
e
p
)(
)(
!="
(2)
Due to lack of time-history of thermal property data for the alloy used in this study, specific heats, Cp, as a function of temperature, for 4140 were used in eq. (1). The data was calculated using the data from ASM Metals Handbook [9] and TPRC [10], which are fitted into one polynomial equation to cover the entire temperature range: 25.4404991.0108108103
2437410++!"!+!"=
"""TTTTCp (3)
For the presence of porosity in the P/M parts, the density varies with porosity as follows: ( )
O!"! #= 1 (4)
where, O! is the density of fully dense alloy and ! is the fraction porosity.
Fig. 7 shows the surface heat transfer coefficients as a function of temperature for P/M parts quenched in Houghton G mineral oil for two levels of density. 90% dense probe has higher heat transfer rate, which may be due to the presence of bigger and higher number of pores on the surface. Also, oil absorbed through the interconnecting pores might help in increased heat extraction rate. A series of weight tests had also been done to investigate the absorption of oil during quenching and the results are tabulated in Table II. Absorption of oil in 90% dense probe is higher than that of 95% dense probe. That clearly indicates the presence of more interconnecting pores near the surface in 90% dense probe.
Temperature, oC
0 100 200 300 400 500 600 700 800 900
He
at tra
nsfe
r co
effic
ien
t, W/m
2*K
0
500
1000
1500
2000
2500
3000
90%
95%
Fig. 7 Surface heat transfer coefficients as a function of temperature for P/M parts at two levels of density (or porosity)

9
Table II: Absorption of oil by PM parts during quenching
Sample 90% pore-free density 95% pore-free density
Weight before 16.98142 17.26612
Weight after 16.98816 17.26628
Weight gain (g) 0.00674 0.00016 Fig. 8 shows the scanning electron photomicrographs of cross-sectional view of CHTE P/M probes. Probe with 90% pore-free density has more and bigger pores than that of 95% pore-free density and pores are interconnected. Pores reduce the effective cross-sectional area and negatively affect thermal conductivity. For an isolated pore structure, the thermal conductivity decreases with temperature. But if the pores are interconnected and contain a gas, the materials can actually exhibit an increasing thermal conductivity at higher temperature. This may be due to the contribution from the continuous gas phase [1]. The higher cooling rate observed in 90% dense probe, as shown in Fig. 6, may also be due to the presence of interconnecting pores, which enhanced the cooling rate through oil absorption as well as contribution from the entrapped continuous gas phase. Surface pores also played an important role in nucleate boiling region by providing numerous sites for bubble nucleation [11,12]. Since 90% pore-free density probe had more surface pores than that of 95% pore-free density probe, as shown in Fig. 4, it experienced higher heat transfer rate during the partial film and nucleate boiling regimes.
90% pore-free density 95% pore-free density Fig. 8 Scanning electron micrographs of CHTE P/M quench probes at two levels of density showing porosity distributions

10
Jominy end-quench tests were performed according to the ASTM standard A-255-67. After the test a flat was ground on the side of the probe and Rockwell C hardness tests were performed at an interval of 1.5875 mm (1/16 in) up to 50.8 mm (2 in) distance from the quench end. The results are shown in Fig. 9. The hardenability is decreased by pores as shown in the figure. To investigate the effect of pore size on the size of the indentation made by 1.5875 mm (1/16 in) ball indenter of Rockwell C Hardness Tester, optical photomicrographs were taken, as shown in Fig. 9. It is evident from the micrographs that the size of pores was much smaller than the size of the indentation for both levels of porosity. Thereby measured hardness represents the hardenability of the bulk materials.
Fig. 9 The hardenability measured on a Jominy end-quench probe for two levels of porosity.

11
90% pore-free density 95% pore-free density Fig. 10 Photomicrographs of indentation made by 1.5875 mm (1/16 in) ball indenter of Rockwell hardness tester on CHTE P/M quench probes at two levels of density.
SUMMARY In this study, the quenching performance of 4660 P/M alloy was investigated. It was found that the surface pores played an important role to enhance the heat extraction rate from the part during quenching. It was also found that a 90% pore-free density 4660 P/M alloy probe had a higher heat transfer coefficient than that of a 95% pore-free density probe. No Leidenfrost effect was seen in both probes. ACKNOWLEDGEMENTS The support of the Powder Metallurgy Research Center (PMRC) of WPI and the member companies is gratefully acknowledged. REFERENCES 1. German, R. M. Powder Metallurgy Science, 2nd edition, Metal Powder Industries
Federation, New Jersey, 1994. 2. Gagne M., and Trudel Y. “Effects of post-sintering cooling on the properties of low
alloy sintered materials”, Advances in Powder Metallurgy, v 4, Sintering, Metal Powder Industries Federation, New Jersey, 1991, p 115-130.

12
3. Totten, G.E., Bates, C.E. and Clinton, N.A. Handbook of Quenchants and Quenching Technology, ASM International, Materials Park, OH, 1993.
4. Segerberg, S. and Bodin, J. “Variation in the Heat Transfer Coefficient around Components of Differeny Shapes during Quenching”, Proceedings of the 1st International Conference on Quenching and Control of Distortion, ASM International, Materials Park, OH, 1992, pp.165-170.
5. Maniruzzaman, M., Chaves, J.C., McGee, C., Ma, S. and Sisson, R.D. “CHTE quench probe system – a new quenchant characterization system”, Proceedings of the 5th International Conference on Frontiers of Design and Manufacturing (ICFDM 2002), Vol. 1, Dalian, China, pp. 619-625, 2002.
6. Chaves, J.C., Maniruzzaman, M. and Sisson, R.D. “A New Quench Characterization System for Steels”, Proceedings of the 21st Heat Treating Society Conference, cdrom version, ASM International, Materials Park, OH, 2002.
7. Ma, S., Maniruzzaman, M. and Sisson, R.D. “Characterization of Mineral Oil Based Quenchants Using CHTE Quench Probe System”, Proceedings of the 1st ASM International Surface Engineering Congress and 13th International Federation for Heat Treatment and Surface Engineering (IFHTSE) Congress, cdrom version, ASM International, Materials Park, OH, 2003.
8. Mills, A.F. Heat Transfer, 2nd ed., Prentice Hall Inc., Upper Saddle River, NJ, 1999. 9. Davis, J.R. Metals Handbook, ASM International, 1990, pp. 197-199 and 203.
10. Touloukian, Y.S. Thermophysical Properties of Matter. TPRC Data Series. Vol. 4, IFI Plenum, NY, 1970, pp 103-109.
11. Maniruzzaman, M. and Sisson, R.D. “Bubble Dynamics in Quenching Heat Treatment of Steel”, Proceedings of the 21st Heat Treating Society Conference, cdrom version, ASM International, Materials Park, OH, 2002.
12. Sisson, R.D., Chaves, J.C. and Maniruzzaman, M. “The Effect of Surface Finish on the Quenching Behavior of 4140 Steel in Mineral Oils, Proceedings of the 21st Heat Treating Society Conference, cdrom version, ASM International, Materials Park, OH, 2002.

1
Appendix B
Modeling the Heat Treatment of Powder Metallurgy Steels
Virendra S. Warke, Jack Yuan, Mohamed Maniruzzaman, Makhlouf M. Makhlouf, and Richard D. Sisson, Jr.
Department of Mechanical Engineering
Worcester Polytechnic Institute Worcester, MA 01609
ABSTRACT An integrated model and database requirement for heat treatment of powder metallurgy steels is presented and discussed. The model is based on modifications to the commercially available software package DANTE and is coupled to the finite element analysis (FEA) software ABAQUS. DANTE relies on a series of integrated numerical models to predict the temperature versus time and phase transformations at every nodal point in a P/M part. These models require accurate data for thermal properties, elastic and plastic properties, mass transport, and phase transformations, all as a function of temperature. In this paper the database requirements and experimental procedures to generate the database are presented and discussed. INTRODUCTION P/M components experience considerable changes during heat treatment that include changes in mechanical properties, in dimensions, in magnitude and sense of residual stresses, and in metallurgical phase composition. Since the quality assurances criteria that heat-treated P/M components must meet include prescribed minimum mechanical properties and compliance with dimensional tolerances, it is necessary for P/M producers to be able to accurately predict these changes in order to take appropriate measures to prevent their harmful effects and insure the production of good quality parts. Satisfactory response to heat treatment is often gauged by the ability of the component to be heat treated to a desired microstructure, and hardness and strength levels without undergoing cracking, distortion or excessive dimensional changes. In addition to reversible changes that are caused by thermal expansion and contraction, metallic components experience permanent dimensional changes during heat treatment. These permanent changes can be classified into three groups based on their origin: (1) Dimensional changes with mechanical origins, these include dimensional changes
caused by stresses developed by external forces, dimensional changes arising from

2
thermally induced stresses, and dimensional changes caused by relaxation of residual stresses.
(2) Dimensional changes with metallurgical origins, these include dimensional changes
caused by recrystallization, solution and precipitation of alloying elements, and phase transformations.
(3) Dimensional changes due to quenching, these are dimensional changes that occur during quenching or that result from stresses induced by quenching.
Residual stresses often adversely affect the mechanical properties of P/M components. They are caused by differing rates of cooling during quenching and depend on the differential rate of cooling, section thickness, and material strength. Decreasing the severity of the quench results in a lower level of residual stresses but with a correspondingly reduced material strength of solution heat-treated materials. Residual stresses may also arise from phase transformations during heat treatment that result in differential volumetric changes in the material [1]. Various commercial software packages capable of predicting the heat treatment response of wrought steels are available. These include: HEARTS [2], TRAST [3], SYSWELD [4], and DANTE [5]. In this work, the commercial software DANTE and ABAQUS are used to predict the heat treatment response of P/M components. DANTE is based on a robust internal state variable approach [6] in which porosity can be introduced as an additional state variable. In this paper, the various aspects of modeling and the experimental data required as input to the model are presented and discussed. Moreover, the techniques used to generate the input database are described. DANTE is marketed by Deformation Control Technology, Inc. (Ohio, USA) ABAQUS is marketed by Hibbitt, Karlsson & Sorensen, Inc. (Rode Island, USA)
BACKGROUND
DANTE is comprised of a set of user-defined subroutines that is linked into the finite element solver ABAQUS - standard. The DANTE subroutines contain a mechanics model, a phase transformation model, and an element diffusion model coupled with stress/displacement, and thermal and mass diffusion solvers respectively. The mechanics model is based on internal state variables and describes the mechanical behavior of each metallurgical phase over a wide range of temperatures, deformation levels, and deformation rates. This model includes the effect of phase transformations as well as transformation-induced plasticity in the various metallurgical phases during heat-treating [7]. The phase transformation model is also based on an internal state variable framework in which the volume fraction of phases is tracked with changing time and temperature. In this model, formation of ferrite, pearlite, and bainite is assumed to follow diffusive transformation kinetics. The martensitic transformation is assumed to be athermal; however, the kinetics equations, which are written in the form of rate equations, have an explicit dependency on cooling rate [8].

3
The material data used in the models is measured by various mechanical and thermal tests. Data for the mechanics model is obtained from temperature and rate-dependent tension and compression measurements; on the other hand, data for the phase transformation model is derived from heating and cooling dilatometry measurements. These measurements are discussed in detail in the following section. Other mechanical and thermal properties of the materials are extracted from the available literature and are implemented in the models as functions of temperature [1]. The effect of porosity on the various mechanical and thermal properties of the material can be accounted for in the DANTE subroutines by introducing the relative density of the part as a state variable (i.e., as an element property). The relative density can be assigned as a constant throughout the part or it can be introduced as a profile inside the part. This approach allows calculating the various mechanical and thermal material properties at each element in the component. For example, Equations (1), (2), (3), (4), and (5) give the variation with relative density of strength (σ), thermal conductivity (κ), coefficient of thermal expansion (αT), Modulus of Elasticity (E), and Poisson’s ratio (ν), respectively [9, 10]
m
T
K !!"
#$$%
&=
'
'(( ..0 (1)
20
.1
1.
!"
!##
+
$= (2)
3/1
0. !!
"
#$$%
&=
T
T
'
'(( (3)
!
""#
$%%&
'=
T
EE(
(.0 (4)
!"
#$%
&''(
)**+
,=
T-
-. .37.1exp.068.0 (5)
Equations (1), (2), (3), (4), and (5), σ0 is strength of the fully dense alloy, K is a geometric constant similar to the stress intensity factor, m is an exponent - typically taken to be 0.35, қ0 is the conductivity of the fully dense material, ε is pore fraction, χ is a pore-sensitivity coefficient typically 11; α0 is the coefficient of thermal expansion of the fully dense material, E0 is modulus of elasticity of the fully dense material, Y is an

4
exponent typically between 1 and 2, ρ is the theoretical density of the material, and ρT is density of the P/M component. The DANTE/ABAQUS model is shown schematically in Figure1. In addition, to the geometry and mesh generator, and the post processor, it contains two main modules: (1) the thermal module, and (2) the stress module. The thermal module is setup to solve a heat transfer problem for each one of the steps of the heat-treating process, i.e., the furnace heating step, the immersion into the quench tank step, and the quenching step. The output file generated by the thermal module contains mainly the thermal history of the part during the various process steps. The stress module accesses this output file and calculates the residual stresses generated, the displacements, the volume fraction of metallurgical phases, and the hardness for the entire temperature history of the part.
Figure 1. Solution procedure for the DANTE/ABAQUS model.
In order to obtain reliable predictions from the model, in addition to accurate heat transfer coefficients, accurate kinetic parameters, as well as physical and mechanical properties must be generated and input into the model. This data is alloy specific, and for each alloy, data must be obtained for different porosity levels.
Geometry and mesh (ABAQUS-CAE)
Thermal analysis (ABAQUS solver + DANTE subroutine)
Stress analysis (ABAQUS solver + DANTE subroutine)
Post processing (ABAQUS visualization module)
Process steps
Initial conditions
Boundary conditions
Process steps
Initial conditions
Boundary conditions

5
Measurement of heat transfer coefficients The method employed for measuring heat transfer coefficients involves quenching a heated cylindrical probe that is machined from the material to be tested into the quenching medium and acquiring the temperature-time profile. The apparatus used for this purpose is shown in Figure 2 and consists of an electric box furnace for heating the probe, a connecting rod that joins the probe to a pneumatic cylinder that allows automatic quenching of the probe into a beaker that contains the quenching oil, and a computer connected to a fast data acquisition system. A k-type thermocouple inserted at the geometrical center of the probe continuously measures the temperature of the probe[11-12]. The probe dimensions are chosen such that the Biot number for the quenching process is <0.1. This requirement insures that significant thermal gradients will not be present in the radial direction in the probe. Accordingly, a simple heat balance analysis (usually referred to as a lumped parameter analysis) can be performed on the system (probe + quenching medium) to yield the heat transfer coefficient. With the Bi < 0.1, the error associated with such calculations of the heat transfer coefficient is less than 5%. A heat balance applied to the probe results in Equation 6, which is used to calculate the heat transfer coefficient at the surface of the probe. [13]
( ) dtdT
TTA
VCh
fss
p
!!=
" (6)
In Equation 6, h is the heat transfer coefficient at the surface of the probe, ρ, V, Cp , and As are the density, volume, specific heat, and surface area of the steel probe, respectively. Ts is the temperature at the surface of the probe, which, due to the geometry of the probe, is approximately equal to the measured temperature at the center of the probe. Tf is the bulk temperature of the quenching medium. Figure 3 shows the heat transfer coefficient obtained by this method for 4601 P/M probes pressed with different levels of porosity1[14].
1 Pre-alloyed 4601 powder with admixed carbon to yield 0.6%C in the probes.

6
Pneumatic cylinder
Furnace
Oil beaker
Pneumatic on/off
switch
K-type thermocouple
Probe tip
Connecting rod
Computer with Data
Acquisition Card
Thermocouple for Oil temp.
Figure 2. Apparatus used to measure the heat transfer coefficient during quenching[11-12].
Temperature, oC
0 100 200 300 400 500 600 700 800 900
He
at tra
nsfe
r co
effic
ien
t, W/m
2*K
0
500
1000
1500
2000
2500
3000
90%
95%
Figure 3. Variation of heat transfer coefficient with temperature and part density. [14]

7
Determination of phase transformation kinetics parameters Dilatometry is based on the principle that, during heating and cooling, dimensional changes occur in materials as a consequence of both thermal expansion associated with temperature change, and phase transformations. Sensitive, high-speed dilatometers are used measure these changes as a function of time and temperature. The resulting data is then converted to discrete values of strain for specific values of time and temperature during the thermal cycle. Strain as a function of time and temperature is then used to determine the start and completion of phase transformations. Typically, in steels, the critical temperatures, Ac1 and Ac3, are first determined. The thermal cycle to be used involves heating the test specimen to 700°C ±5°C at a nominal rate of 10°C/s. Heating is then continued at a nominal rate of 28°C/hr while strain is continuously measured until the Ac1 and Ac3 temperatures are identified [15]. Once these temperatures are known, CCT and TTT diagrams are constructed from continuous cooling dilatation curves and isothermal dilatation curves, respectively. Figure 4 shows a typical volume vs. temperature plot obtained from dilatometry experiments; Figure 4 also shows the regions where different phases evolve during transformations of austenite.
Figure 4. Typical dilatation curves for a ferrous material [15].

8
Determination of mechanical properties Table I shows a typical design of experiment that is used to generate the necessary mechanical properties. These properties are needed for each phase at various temperatures and various strain rates. The measurements are performed in a tensile testing machine with both heating and cooling capabilities; the test specimens are austenitized and then cooled to the test temperature. In order to generate the properties of austenite, the test is conducted immediately once the specimen has equilibrated at the austenitizing temperature. If, on the other hand the properties of a diffusive phase are being measured, the test specimen is held at the appropriate temperature until the phase transformation is complete and then the specimen is tested. The properties of as-quenched martensite are obtained from specimens that are heated in a box furnace and quenched in a small quench bath. These specimens are then tested in compression (because of the brittle nature of as quenched martensite) at room temperature. Properties for tempered martensite are obtained from specimens that are tempered in a box furnace and then tested in tension at the appropriate temperature.
Table I. Mechanical Properties Testing Matrix.
Austenite (test in tension)
Martensite (test in compression)
Tempered Martensite
(test in tension)
Relative Density
Temp. (°C)
0.001(s-1)
0.1 (s-1)
1.0 (s-1)
Temp. (°C)
0.1 (s-1)
Temp. (°F)
0.1 (s-1)
900 * * * 290 * 200 * 700 * 240 * RT * 500 * * * 120 * 350 * * RT *
1.0 (Full
Density)
200 * * 900 * * * 290 * 200 * 700 * 240 * RT * 500 * * 120 *
0.95
200 RT * 900 * * * 290 * 200 * 700 * 240 * RT * 500 * 120 *
0.9
350 RT *
9
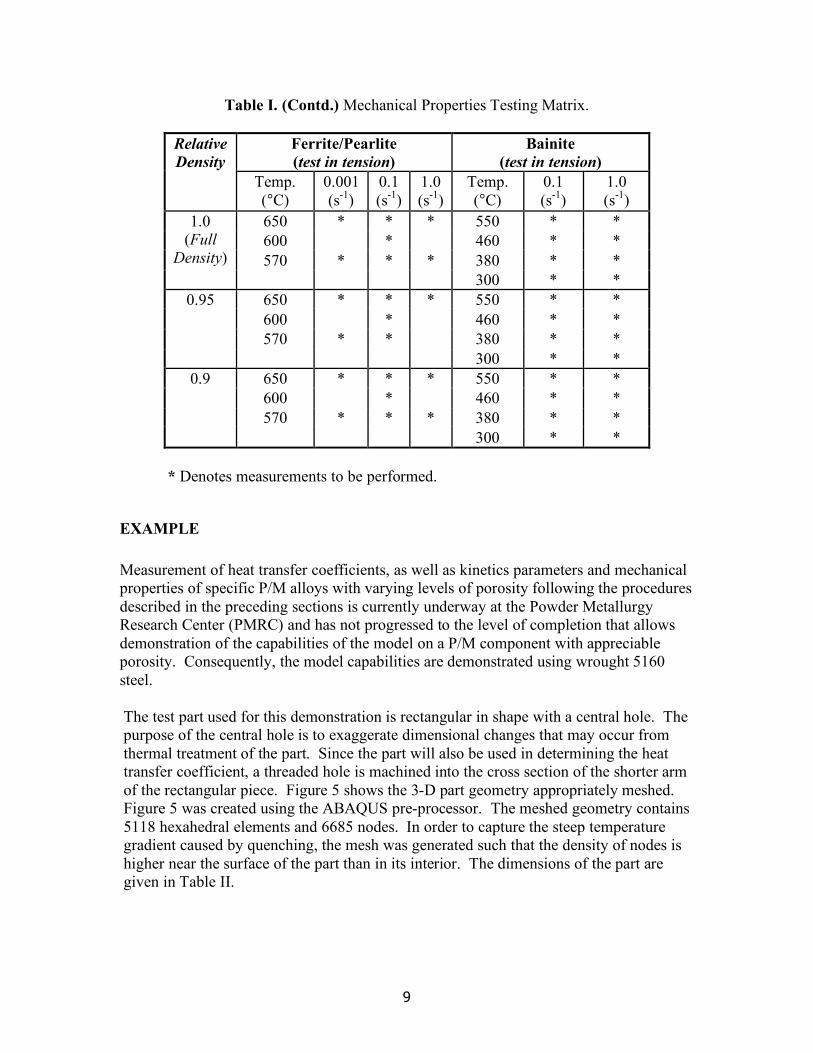
Table I. (Contd.) Mechanical Properties Testing Matrix.
Ferrite/Pearlite (test in tension)
Bainite (test in tension)
Relative Density
Temp. (°C)
0.001(s-1)
0.1 (s-1)
1.0 (s-1)
Temp. (°C)
0.1 (s-1)
1.0 (s-1)
650 * * * 550 * * 600 * 460 * * 570 * * * 380 * *
1.0 (Full
Density) 300 * *
650 * * * 550 * * 600 * 460 * * 570 * * 380 * *
0.95
300 * * 650 * * * 550 * * 600 * 460 * * 570 * * * 380 * *
0.9
300 * * * Denotes measurements to be performed.
EXAMPLE Measurement of heat transfer coefficients, as well as kinetics parameters and mechanical properties of specific P/M alloys with varying levels of porosity following the procedures described in the preceding sections is currently underway at the Powder Metallurgy Research Center (PMRC) and has not progressed to the level of completion that allows demonstration of the capabilities of the model on a P/M component with appreciable porosity. Consequently, the model capabilities are demonstrated using wrought 5160 steel. The test part used for this demonstration is rectangular in shape with a central hole. The purpose of the central hole is to exaggerate dimensional changes that may occur from thermal treatment of the part. Since the part will also be used in determining the heat transfer coefficient, a threaded hole is machined into the cross section of the shorter arm of the rectangular piece. Figure 5 shows the 3-D part geometry appropriately meshed. Figure 5 was created using the ABAQUS pre-processor. The meshed geometry contains 5118 hexahedral elements and 6685 nodes. In order to capture the steep temperature gradient caused by quenching, the mesh was generated such that the density of nodes is higher near the surface of the part than in its interior. The dimensions of the part are given in Table II.

10
Table II. Dimensions of the Part.
Dimension Magnitude
Length 76.33 mm Height 9.525 mm Width 39.624 mm
Diameter of center hole 31.75 mm
Figure 5. Geometry and mesh used in the model.
Solution procedure and boundary conditions The Thermal Module: The following heat treatment process steps are considered in modeling the heat treatment response of this part:
(1) Furnace heating, followed by (2) Immersion into a quench tank, followed by (3) Quenching
The initial conditions relevant to the thermal module are the carbon content of the part, temperature of the part before heat-treating, i.e. room temperature, and the heat treatment mode. The heat treatment modes are used to select the appropriate kinetics input from the different kinetics models in DANTE to match each of the process steps as they change from furnace heating to sample immersion in the quenching fluid to quenching.
The boundary conditions relevant to each process step in the thermal module are as follows:

11
o For the furnace-heating step: A convective boundary condition is specified at
the surface of the part by providing the heat transfer coefficient data obtained from the experiments for heating the part in the furnace up to the austenitizing temperature of the alloy.
o For the immersion step: The direction and velocity of immersion of the part
into the quench tank is defined in the immersion step. This step is important in order to capture the temperature gradient along the immersion length of the part. In this model, the part is immersed along its length, with a velocity of 100 mm/sec, and the process time for this step is set to 0.9 seconds.
o For the quenching step: A convective boundary condition is specified at the
surface of the part by providing the heat transfer coefficient data obtained from the experiments for quenching the part in the quenching medium down to the room temperature. The technique to obtain the heat transfer coefficient for a particular alloy is discussed in the following section.
The Stress Module: This module uses mainly the time-temperature history of the part generated by the thermal module in order to calculate nodal displacements, stresses, volume fraction of metallurgical phases, and hardness. The initial condition relevant to the stress module is simply setting the magnitude of stress at all nodes to zero. If a known initial stress state existed, appropriate values could have been easily used. For boundary conditions, nodal constraints are required in order to prevent rigid body displacement and rotation. This requirement applies to all the process steps, and is defined only once in the model input file. In our model, 3 nodes around the center of the X-Y plane of the part (1-2 planes in Figure 5) are constrained in displacement and rotation. In order to develop confidence in the model, the model predictions were compared to measurements performed on a 5160 steel sample of configuration and dimensions similar to those used in the model. For this purpose, samples with the dimensions shown in Table II were machined from a 5160 steel plate. A hole that is 1.778 mm in diameter and 17.78 mm in depth, for inserting a thermocouple, was drilled at the center of the X-Y plane of the samples (the 1-2 plane in Figure 5). The top 9 mm of the hole was bored and tapped with internal threads to allow screwing the sample to a connecting rod, which holds the part in an upright position during heating and quenching. Graphite powder was packed into the hole before the thermocouple was inserted in order to ensure intimate contact between the sample and the thermocouple. The sample was then heated to 850°C and time vs. temperature data was recorded while the sample is quenched. Figure 6 shows a comparison of the model predicted and measured cooling curves. In the early stages of quenching, the measured cooling rate is somewhat slower than the model predicted cooling rate. The reason for this discrepancy between the measured and model predicted values of heat transfer coefficient is attributed to the fact that the hole machined at the center of the part entraps part of the vapor blanket that is formed by the hot oil and

12
retains it thus covering the internal surface of the thus effectively reducing the overall heat transfer coefficient of the sample. Figure 7 shows a comparison between the measured and computer-predicted hardness values across the sample’s cross-section. The measurements were performed on Wilson Rockwell hardness testing machine with accuracy ±0.5Rc. There is very good agreement between the computer-predicted and measured hardness values except at the part’s edge. This discrepancy at the part’s edge is attributed to the loss of carbon at the surface due to decarburization. Although decarburization was not accounted for in this analysis, the model has the capabilities that allow accounting for carbon diffusion.
Figure 6. Comparison between measured and model-predicted cooling curves for wrought 5160 steel.

13
Location from one end (mm)
0 5 10 15 20 25
Hard
ness (H
RC
)
56
58
60
62
64
Measured
Predicted
Figure 7. Comparison between measured and model-predicted hardness values for wrought 5160 steel.
Figure 8 shows a comparison between the measured (Fig. 8(a)) and computer-predicted (Fig. 8(b)) dimensions of the central hole in the part before and after quenching. The measurements were performed on a Starrett coordinate measurement machine. The machine can measure the coordinate with the least count of 10 microns. Since machining a hole in a flat part invariably involves some error, the radius of the machined hole does not match perfectly the radius created in the model. Therefore, an accurate quantitative comparison between the measured and predicted part distortion is not possible. Moreover, a very small, unwanted, rigid body motion has occurred in the modeled part. This can be avoided in future models by constraining one more node in the stress model. Nevertheless, Figure 6 provides a useful qualitative assessment of the ability of the software to simulate dimensional distortion in the steel.

14
Radius (mm)
0.0 0.1 0.2 0.3 0.4 0.5
0.0
0.1
0.2
0.3
0.4
0.5
0.00.10.20.30.40.5
0.0
0.1
0.2
0.3
0.4
0.5
Before quenching
After quenching
(a)
Radius (mm)
0.0 0.1 0.2 0.3 0.4 0.5
0.0
0.1
0.2
0.3
0.4
0.5
0.00.10.20.30.40.5
0.0
0.1
0.2
0.3
0.4
0.5
Before quenching
After quenching
(b)
Figure 8. Coordinates of the circular hole before and after quenching. (a) Measured using CMM, and (b) predicted by the model.

15
SUMMARY The commercial code DANTE combined with ABAQUS provides a model capable of predicting the heat treatment response of metallic components. It is expected that the predictive capabilities of this model can be extended to P/M components through the use of applicable state functions that relate the necessary model parameters to part density. The success of the model in predicting the heat treatment response of P/M components is commensurate with the development of a reliable database of heat transfer coefficients, phase transformation kinetics parameters, and mechanical and physical properties of alloys as functions of temperature. Recently, the Powder Metallurgy Research Center (PMRC) embarked on a 3-year project to adapt DANTE to the needs of the P/M industry; within the context of this effort is the development of the required database. REFERENCES
1. Furguson B.L., Petrus G.J., and Pattok T., “A Software Tool to Simulate Quenching of Alloy Steel,” Third International Conference on Quenching and Control of Distortion, 1999,pp.188-200
2. Inoue T. and Arimoto K., “Mettallo-Thermo-Mechanical Simulation of Quenching Process-Theory and Implementation of Computer Code ‘HEARTS’,” Quenching and Distortion Control Conference Proceedings, ASM International, 1992, pp.205-12.
3. Jarvstrat N. and Sjostrom S., “Current Status of TRAST: A Material Model Subroutine System for the Calculation of Quench Stresses in Steel,”ABAQUS Users’ Conference Proceedings, 1993, pp.273-87.
4. Southwest Research Institute and Farmatome, “SYSWELD-A Predictive Model for Heat Treat Distortion,” Presentation at the National Center for Manufacturing Sciences, Ann Arbor, Michigan, April 14,1992.
5. Dowling W. et al., “Development of Carburizing and Quenching Simulation Tool: Program Overview,” Second International Conference on Quenching and Control of Distortion , 1996, pp. 349-355.
6. Bammann D. et al., “Development of Carburizing and Quenching Simulation Tool: A Material Model for Carburizing Steel Undergoing Phase Transformation,” Second International Conference on Quenching and Control of Distortion, 1996, pp. 367-375.
7. Bammann D. J., Chiesa M. L., Johnson G.C., “Modeling Large Deformation and Failure in Manufacturing Process,” Proceeding of the Ninteenth International Congress of Theoretical and Applied Mechanics, 1996, pp. 359-376.
8. Lusk M. T. , Lee Y. K., “A Global Material Model for Simulating the Transformation Kinetics of Low Alloy Steel,” Seventh International Seminar on Heat Treatment and Surface Engineering of Light Alloys, 1999, pp. 273-282.

16
9. German R.M., Powder Metallurgy of Iron and Steel, John Willey and Sons, Inc.,1998, pp. 373-404.
10. Germal R.M., Powder Metallurgy Science, Metal Powder Industries Federation, Princeton, NJ, p. 384.
11. M. Maniruzzaman et al., “CHTE Quench Probe System – a New Quenchant Characterization System”, Proceedings of the 5th International Conference on Frontiers of Design and Manufacturing (ICFDM 2002), Dalian, China ,Vol. 1, July 10-12, 2002, , pp. 619-625.
12. Chaves, J.C., “The Effect of Surface Condition and High Temperature Oxidation on Quenching Performance of 4140 Steel in Mineral Oil, in Manufacturing Engineering”, 2001, Ph.D. Dessertation, Worcester Polytechnic Institute, Worcester,MA, p.133.
13. Shuhui Ma et al., “Characterization of the performance of mineral oil based quenchants using the CHTE Quench Probe System”, The 1st International Surface Engineering Congress and the 13th IFHTSE Congress , ASM International, Columbus, Ohio,October 7-10,2002, pp 281-289.
14. Sisson R., Maniruzzaman M., Ma S., Warke V., Makhlouf.M, “Quenching Powder Metallurgy Product”, International Conference on Powder Metallurgy and Particulate Materials, Chicago, IL , June 2004, to be published.
15. “Recommended Practice for the Quantitative Measurement and Reporting of Hypo- Eutectoid Carbon and Low-Alloy Steel Phase Transformations,” ASTM Standard, A1033-04.

1
Appendix C
Test Matrix used to Determine Transformation Kinetics using Quench Dilatometry
Material Information:
• Steel powder is 4601 AUTOMET with 0.5% admixed carbon. • Alloy chemistry is given in Table I. • P/M samples pressed with 3 levels of porosity:
o Single pressed and sintered: relative density ≈ 0.90 o Double pressed and double sintered: relative density ≈ 0.95 o Pressed, sintered, powder forged: relative density ≈ 1.00
• Rectangular blocks will be compacted and samples for dilatometery measurements will be machined from these blocks.
Table I: Composition of the alloy in wt.% of alloying elements.
Element Carbon Oxygen Sulphur Manganese Molybdenum Nickel wt. % 0.5 0.11 0.0093 0.196 0.549 1.812
Preliminary Data: Some preliminary calculations using handbook equations for critical temperatures for the 4601 + 0.5 wt.%C P/M steel alloy chemistry produces these values which are used as rough estimates for designing the test matrix. Ae1 ~ 700°C, Ac1 ~ 690°C Ae3 ~ 730°C, Ac3 ~ 755°C Bs ~ 565°C Ms ~ 290°C Measurement of Transformation Kinetics Parameters: 1. Determination of Critical Temperatures: The critical temperatures, Ac1 and Ac3, will be determined from test specimens separate from those used for other transformation measurements. The specimen will be heated to 700±5°C at the nominal rate of 10°C/s. Heating must then be continued at a nominal rate of 28°C/hr while strain is continuously measured until the Ac1 and Ac3 temperatures are identified. 2. Isothermal Transformation Data Sets: Each isothermal transformation thermal cycle will consist of heating a test specimen to an austenitizing temperature of (Ac3+50°C) ±°C

2
at a nominal rate of 10°C/s. The test specimen will be held at this austenitizing temperature for 5 minutes and then quenched to the isothermal hold temperature. A cooling rate of at least 175°C/s will be employed. During the quench, the temperature of the test specimen must not undershoot the isothermal hold temperature by more than 20°C, and must be stabilized at the isothermal hold temperature within 2 seconds. The temperature of the specimen must be maintained within ±5°C of the isothermal hold temperature during dimension measurement. The test specimen will be held at the isothermal hold temperature and its dimension continuously measured until transformation is 100% complete. The specimen must then be quenched to room temperature. Data must be sampled and recorded at a rate of at least 5 dimension measurements per second. Complete transformation is defined as the time at which maximum dimensional change has occurred. A different test specimen will be employed for each thermal cycle. Table II shows the detailed experiment matrix for isothermal tests for the temperature range between Ac3 and Ms.
Table II: Test Matrix for generating the isothermal transformation data sets. Phases Isothermal holding
temperature (°C) Number of tests
740 1 Ferrite 710 2 690 2 660 1 630 2 600 1
Ferrite + Pearlite
580 2 570 2 560 2 520 1 480 1 440 1 400 1 360 1 320 2
Bainite
300 2 3. Continuous Cooling Transformation Data Sets: Each continuous cooling transformation thermal cycle will consist of heating a test specimen to an austenitizing temperature of (Ac3 + 50°C) ±5°C at a nominal rate of 10°C/s. The test specimen will be held at the austenitizing temperature for 5 minutes and then cooled to room temperature with the cooling rates specified in Table III and Table IV. Data must be sampled and recorded at the rate of one dimension measurement per degree Celsius. Linear cooling rates will be used to the maximum cooling rate possible. At cooling rates where linear control is not possible, the rate at 700°C will be reported along with the cooling time between 800°C and 500°C. A different test specimen will be used for each thermal cycle.

3
Table III: Test matrix for Martensitic transformation. Cooling rate (°C/s) Number of tests
135 1
150 2
175 1
Table IV: Test matrix for continuous cooling transformation datasets.
Cooling rate (°C/s) Number of tests
0.5 1
1 1
3 1
5 2
7 2
10 1
40 1
100 1

1
Appendix D
Test Matrix used to Determine Transformation-Induced Plasticity using Quench Dilatometry
Material Information:
• Steel powder is 4601 AUTOMET with 0.5% admixed carbon. • Alloy chemistry is given in Table I. • P/M samples pressed with 3 levels of porosity:
o Single pressed and sintered: relative density ≈ 0.90 o Double pressed and double sintered: relative density ≈ 0.95 o Pressed, sintered, powder forged: relative density ≈ 1.00
• Rectangular blocks will be compacted and samples for dilatometery measurements will be machined from these blocks.
Table I: Composition of the alloy in wt.% of alloying elements.
Element Carbon Oxygen Sulphur Manganese Molybdenum Nickel wt. % 0.5 0.11 0.0093 0.196 0.549 1.812
Preliminary Data: Some preliminary calculations using handbook equations for critical temperatures for the 4601 + 0.5 wt.%C P/M steel alloy chemistry produces these values which are used as rough estimates for designing the test matrix. Ae1 ~ 700°C, Ac1 ~ 690°C Ae3 ~ 730°C, Ac3 ~ 755°C Bs ~ 565°C Ms ~ 290°C Measurement of Transformation Induced Plastic Strain (TRIP) Parameters:
Plastic behavior of steels during metallurgical transformations can be divided into two parts: (1) Classical plasticity, i.e., plastic flow arising from variation of applied stress or from the temperature cycle, and (2) Transformation plasticity, i.e., plastic flow arising from variation of phase proportion due to phase transformation. That is to say, the progress of a transformation occurring in the metal under an external stress induces
2
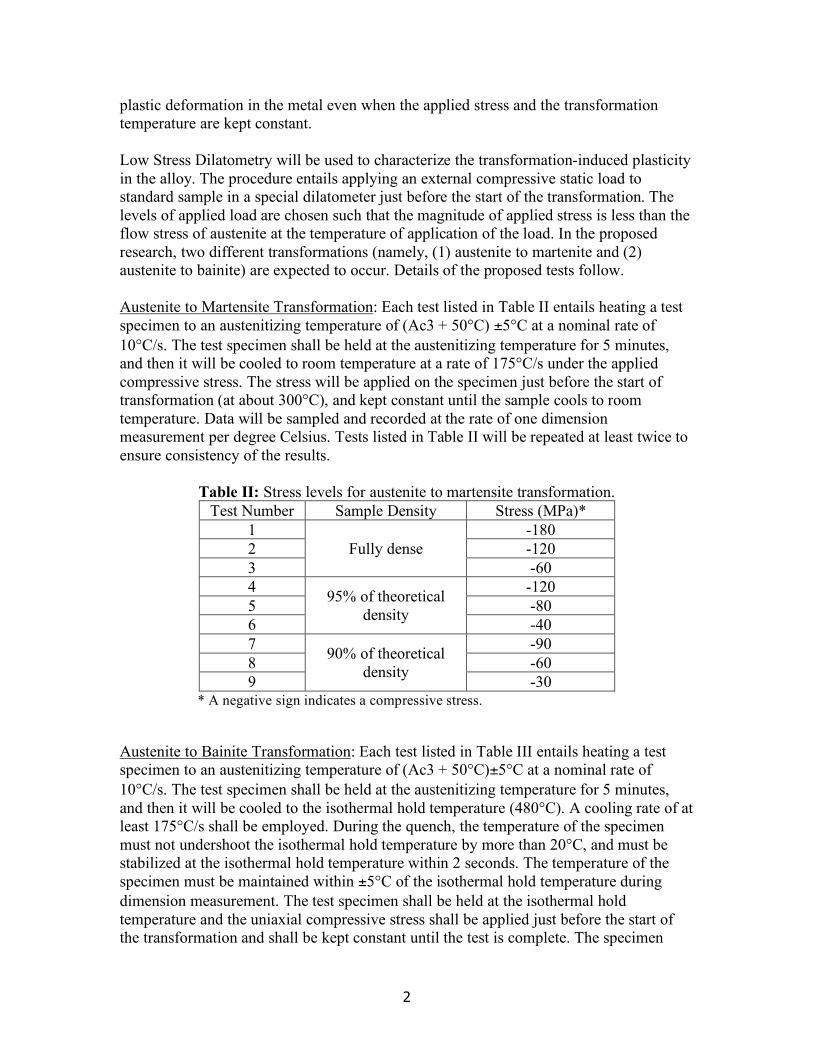
plastic deformation in the metal even when the applied stress and the transformation temperature are kept constant. Low Stress Dilatometry will be used to characterize the transformation-induced plasticity in the alloy. The procedure entails applying an external compressive static load to standard sample in a special dilatometer just before the start of the transformation. The levels of applied load are chosen such that the magnitude of applied stress is less than the flow stress of austenite at the temperature of application of the load. In the proposed research, two different transformations (namely, (1) austenite to martenite and (2) austenite to bainite) are expected to occur. Details of the proposed tests follow. Austenite to Martensite Transformation: Each test listed in Table II entails heating a test specimen to an austenitizing temperature of (Ac3 + 50°C) ±5°C at a nominal rate of 10°C/s. The test specimen shall be held at the austenitizing temperature for 5 minutes, and then it will be cooled to room temperature at a rate of 175°C/s under the applied compressive stress. The stress will be applied on the specimen just before the start of transformation (at about 300°C), and kept constant until the sample cools to room temperature. Data will be sampled and recorded at the rate of one dimension measurement per degree Celsius. Tests listed in Table II will be repeated at least twice to ensure consistency of the results.
Table II: Stress levels for austenite to martensite transformation. Test Number Sample Density Stress (MPa)*
1 -180 2 -120 3
Fully dense -60
4 -120 5 -80 6
95% of theoretical density -40
7 -90 8 -60 9
90% of theoretical density -30
* A negative sign indicates a compressive stress.
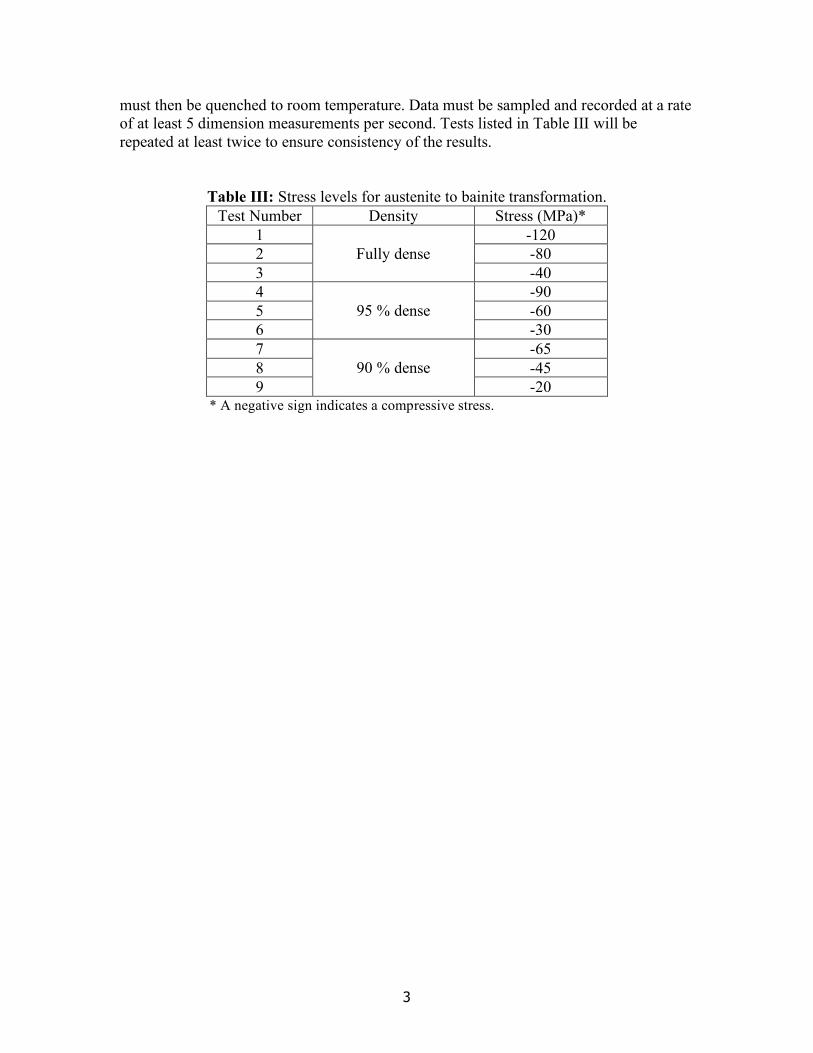
Austenite to Bainite Transformation: Each test listed in Table III entails heating a test specimen to an austenitizing temperature of (Ac3 + 50°C)±5°C at a nominal rate of 10°C/s. The test specimen shall be held at the austenitizing temperature for 5 minutes, and then it will be cooled to the isothermal hold temperature (480°C). A cooling rate of at least 175°C/s shall be employed. During the quench, the temperature of the specimen must not undershoot the isothermal hold temperature by more than 20°C, and must be stabilized at the isothermal hold temperature within 2 seconds. The temperature of the specimen must be maintained within ±5°C of the isothermal hold temperature during dimension measurement. The test specimen shall be held at the isothermal hold temperature and the uniaxial compressive stress shall be applied just before the start of the transformation and shall be kept constant until the test is complete. The specimen
3
must then be quenched to room temperature. Data must be sampled and recorded at a rate of at least 5 dimension measurements per second. Tests listed in Table III will be repeated at least twice to ensure consistency of the results.
Table III: Stress levels for austenite to bainite transformation. Test Number Density Stress (MPa)*
1 -120 2 -80 3
Fully dense -40
4 -90 5 -60 6
95 % dense -30
7 -65 8 -45 9
90 % dense -20
* A negative sign indicates a compressive stress.


