![BEAM-COLUMN JOINTS STRENGTHENED WITH FRP SYSTEMS … in Seismic... · BEAM-COLUMN JOINTS STRENGTHENED WITH FRP SYSTEMS Ciro FAELLA Full Professor ... Paulay & Priestley [2] (model](https://static.fdocuments.net/doc/165x107/5af2d6ce7f8b9ad061913ad9/beam-column-joints-strengthened-with-frp-systems-in-seismicbeam-column-joints.jpg)
Modeling the Fire Performance of FRP-strengthened...
20
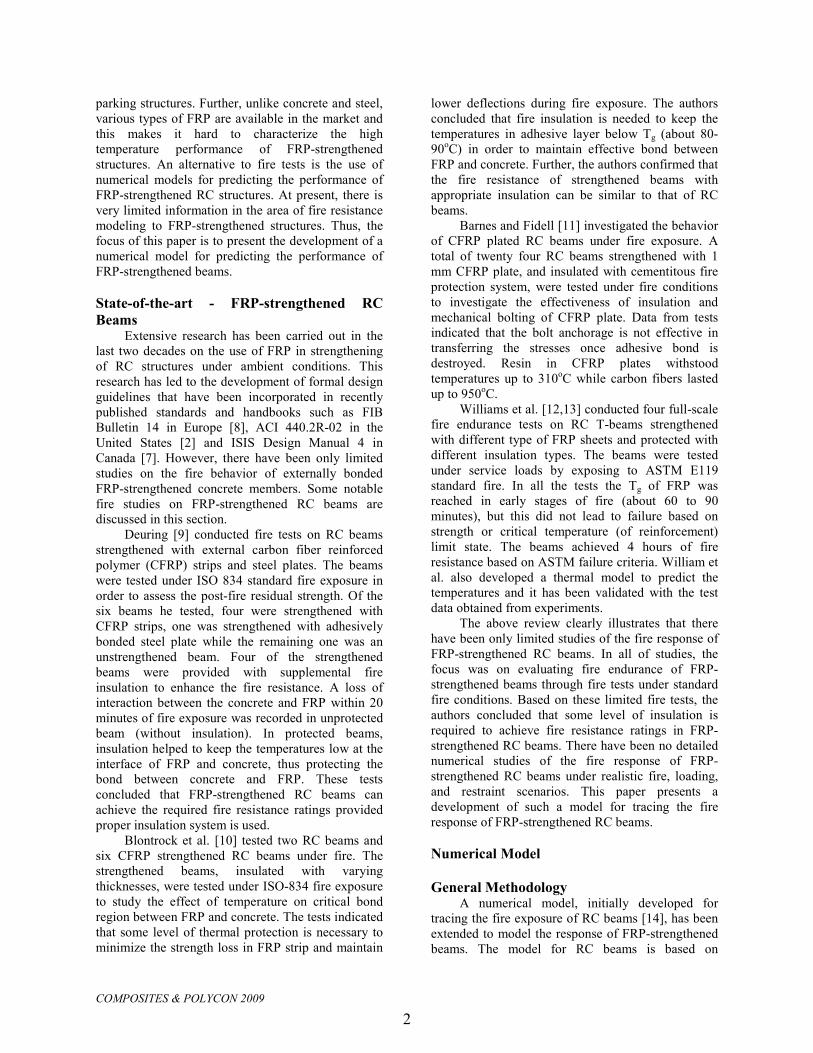
COMPOSITES & POLYCON 2009 1 COMPOSITES & POLYCON 2009 American Composites Manufacturers Association January 15-17, 2009 Tampa, FL USA Modeling the Fire Performance of FRP-strengthened Reinforced Concrete Beams by Venkatesh Kodur, Professor, CEE Dept., MSU Aqeel Ahmed, PhD candidate, CEE Dept., MSU Monther Dwaikat, PhD candidate, CEE Dept., MSU Abstract This paper presents the development of a numerical model for tracing the response of FRP- strengthened reinforced concrete (RC) beams under fire conditions. The model is based on a macroscopic finite element approach and utilizes moment curvature relationships to trace the response of insulated FRP-strengthened RC beams from linear elastic stage to collapse under any given fire exposure and loading scenarios. In the analysis, high temperature material properties, load and restraint conditions, material and geometric nonlinearity are accounted for, and a realistic failure criterion (not critical temperature consideration alone) is applied to determine the failure of beams. The model is validated against fire test data on FRP-strengthened RC beams and is applied to study the effect of FRP- strengthening, insulation scheme and failure criterion on the fire response of FRP-strengthened RC beams. Results from the model indicate that the fire behavior of FRP-strengthened RC beams, provided with supplemental fire insulation, is as good as that of unstrengthened RC beams. A case study is presented to illustrate the application of the model for optimizing the fire insulation scheme to achieve required fire resistance in FRP-strengthened concrete beams. Key words: Fire resistance, RC beams, fiber reinforced polymers, numerical model, fire protection Introduction In recent years, there has been an increased interest in the use of fiber reinforced polymer (FRP) materials for strengthening of reinforced concrete (RC) structures, and this has raised concerns regarding the behavior of such systems in fire. However, relatively little is known about the performance of FRP-strengthened concrete structures under realistic fire and loading scenarios. This is a primary factor limiting the widespread application of FRP in building applications. In the event of fire, the properties of FRP deteriorate quickly, resulting in rapid loss of strength and stiffness above glass transition temperature (T g ) [1]. Typically, the glass transition temperatures for commonly used polymers vary between 60 to 82 o C [2]. Therefore, FRP sheets used without fire protection will lose their strength and stiffness at early stages of fire exposure [3]. When used in buildings, structural members are to satisfy fire resistance ratings prescribed in building codes. Fire resistance is the duration during which a structural member exhibits resistance with respect to strength, integrity and stability and depends on many factors including structural geometry, material used in construction and characteristics of fire. A fire resistance rating is the fire resistance of a member rounded off to nearest hour or half-hour. Concrete due to its low thermal conductivity, high thermal capacity and slower loss of strength and stiffness properties performs reasonably well under fire. Therefore, concrete structures are often used without any fire protection. However, when strengthened with external FRP system, concerns like loss of strength, stiffness and bond, flame spread, smoke generation and toxicity associated with fire are to be addressed [4]. Guidelines on design and application of FRP at ambient temperature are available in different codes of practice [2, 5-7]. However, the codes do not specify any fire guidelines and assume that the FRP is lost in the event of fire. ACI 440.2R-02 recommends that FRP-strengthened members must meet all building and fire code guidelines spelled out for RC structures. Further, it requires that the pre- strengthened RC structure must be capable of withstanding the service loads (1.2 times the dead load and 0.85 times the live load) in order to prevent collapse that might arise from failure of FRP under fire exposure. In the last few years there have been few limited studies on fire performance of FRP-strengthened RC members. Most of these studies involved standard fire tests on FRP-strengthened RC members for developing fire resistance ratings. There is insufficient information on the behavior of FRP- strengthened RC beams under realistic fire, loading and failure limit states. This lack of knowledge is a major obstacle for using FRP in buildings and
Transcript of Modeling the Fire Performance of FRP-strengthened...
COMPOSITES & POLYCON 2009
1
COMPOSITES & POLYCON 2009
American Composites Manufacturers Association
January 15-17, 2009
Tampa, FL USA
Modeling the Fire Performance of
FRP-strengthened Reinforced Concrete Beams
by
Venkatesh Kodur, Professor, CEE Dept., MSU
Aqeel Ahmed, PhD candidate, CEE Dept.,
MSU
Monther Dwaikat, PhD candidate, CEE Dept.,
MSU
Abstract
This paper presents the development of a
numerical model for tracing the response of FRP-
strengthened reinforced concrete (RC) beams under
fire conditions. The model is based on a macroscopic
finite element approach and utilizes moment
curvature relationships to trace the response of
insulated FRP-strengthened RC beams from linear
elastic stage to collapse under any given fire
exposure and loading scenarios. In the analysis, high
temperature material properties, load and restraint
conditions, material and geometric nonlinearity are
accounted for, and a realistic failure criterion (not
critical temperature consideration alone) is applied to
determine the failure of beams. The model is
validated against fire test data on FRP-strengthened
RC beams and is applied to study the effect of FRP-
strengthening, insulation scheme and failure criterion
on the fire response of FRP-strengthened RC beams.
Results from the model indicate that the fire behavior
of FRP-strengthened RC beams, provided with
supplemental fire insulation, is as good as that of
unstrengthened RC beams. A case study is presented
to illustrate the application of the model for
optimizing the fire insulation scheme to achieve
required fire resistance in FRP-strengthened concrete
beams.
Key words: Fire resistance, RC beams, fiber reinforced polymers, numerical model, fire protection
Introduction
In recent years, there has been an increased
interest in the use of fiber reinforced polymer (FRP)
materials for strengthening of reinforced concrete
(RC) structures, and this has raised concerns
regarding the behavior of such systems in fire.
However, relatively little is known about the
performance of FRP-strengthened concrete structures
under realistic fire and loading scenarios. This is a
primary factor limiting the widespread application of
FRP in building applications.
In the event of fire, the properties of FRP
deteriorate quickly, resulting in rapid loss of strength
and stiffness above glass transition temperature (Tg)
[1]. Typically, the glass transition temperatures for
commonly used polymers vary between 60 to 82oC
[2]. Therefore, FRP sheets used without fire
protection will lose their strength and stiffness at
early stages of fire exposure [3].
When used in buildings, structural members are
to satisfy fire resistance ratings prescribed in building
codes. Fire resistance is the duration during which a
structural member exhibits resistance with respect to
strength, integrity and stability and depends on many
factors including structural geometry, material used
in construction and characteristics of fire. A fire
resistance rating is the fire resistance of a member
rounded off to nearest hour or half-hour. Concrete
due to its low thermal conductivity, high thermal
capacity and slower loss of strength and stiffness
properties performs reasonably well under fire.
Therefore, concrete structures are often used without
any fire protection. However, when strengthened
with external FRP system, concerns like loss of
strength, stiffness and bond, flame spread, smoke
generation and toxicity associated with fire are to be
addressed [4].
Guidelines on design and application of FRP at
ambient temperature are available in different codes
of practice [2, 5-7]. However, the codes do not
specify any fire guidelines and assume that the FRP
is lost in the event of fire. ACI 440.2R-02
recommends that FRP-strengthened members must
meet all building and fire code guidelines spelled out
for RC structures. Further, it requires that the pre-
strengthened RC structure must be capable of
withstanding the service loads (1.2 times the dead
load and 0.85 times the live load) in order to prevent
collapse that might arise from failure of FRP under
fire exposure.
In the last few years there have been few limited
studies on fire performance of FRP-strengthened RC
members. Most of these studies involved standard
fire tests on FRP-strengthened RC members for
developing fire resistance ratings. There is
insufficient information on the behavior of FRP-
strengthened RC beams under realistic fire, loading
and failure limit states. This lack of knowledge is a
major obstacle for using FRP in buildings and
COMPOSITES & POLYCON 2009
2
parking structures. Further, unlike concrete and steel,
various types of FRP are available in the market and
this makes it hard to characterize the high
temperature performance of FRP-strengthened
structures. An alternative to fire tests is the use of
numerical models for predicting the performance of
FRP-strengthened RC structures. At present, there is
very limited information in the area of fire resistance
modeling to FRP-strengthened structures. Thus, the
focus of this paper is to present the development of a
numerical model for predicting the performance of
FRP-strengthened beams.
State-of-the-art - FRP-strengthened RC
Beams Extensive research has been carried out in the
last two decades on the use of FRP in strengthening
of RC structures under ambient conditions. This
research has led to the development of formal design
guidelines that have been incorporated in recently
published standards and handbooks such as FIB
Bulletin 14 in Europe [8], ACI 440.2R-02 in the
United States [2] and ISIS Design Manual 4 in
Canada [7]. However, there have been only limited
studies on the fire behavior of externally bonded
FRP-strengthened concrete members. Some notable
fire studies on FRP-strengthened RC beams are
discussed in this section.
Deuring [9] conducted fire tests on RC beams
strengthened with external carbon fiber reinforced
polymer (CFRP) strips and steel plates. The beams
were tested under ISO 834 standard fire exposure in
order to assess the post-fire residual strength. Of the
six beams he tested, four were strengthened with
CFRP strips, one was strengthened with adhesively
bonded steel plate while the remaining one was an
unstrengthened beam. Four of the strengthened
beams were provided with supplemental fire
insulation to enhance the fire resistance. A loss of
interaction between the concrete and FRP within 20
minutes of fire exposure was recorded in unprotected
beam (without insulation). In protected beams,
insulation helped to keep the temperatures low at the
interface of FRP and concrete, thus protecting the
bond between concrete and FRP. These tests
concluded that FRP-strengthened RC beams can
achieve the required fire resistance ratings provided
proper insulation system is used.
Blontrock et al. [10] tested two RC beams and
six CFRP strengthened RC beams under fire. The
strengthened beams, insulated with varying
thicknesses, were tested under ISO-834 fire exposure
to study the effect of temperature on critical bond
region between FRP and concrete. The tests indicated
that some level of thermal protection is necessary to
minimize the strength loss in FRP strip and maintain
lower deflections during fire exposure. The authors
concluded that fire insulation is needed to keep the
temperatures in adhesive layer below Tg (about 80-
90oC) in order to maintain effective bond between
FRP and concrete. Further, the authors confirmed that
the fire resistance of strengthened beams with
appropriate insulation can be similar to that of RC
beams.
Barnes and Fidell [11] investigated the behavior
of CFRP plated RC beams under fire exposure. A
total of twenty four RC beams strengthened with 1
mm CFRP plate, and insulated with cementitous fire
protection system, were tested under fire conditions
to investigate the effectiveness of insulation and
mechanical bolting of CFRP plate. Data from tests
indicated that the bolt anchorage is not effective in
transferring the stresses once adhesive bond is
destroyed. Resin in CFRP plates withstood
temperatures up to 310oC while carbon fibers lasted
up to 950oC.
Williams et al. [12,13] conducted four full-scale
fire endurance tests on RC T-beams strengthened
with different type of FRP sheets and protected with
different insulation types. The beams were tested
under service loads by exposing to ASTM E119
standard fire. In all the tests the Tg of FRP was
reached in early stages of fire (about 60 to 90
minutes), but this did not lead to failure based on
strength or critical temperature (of reinforcement)
limit state. The beams achieved 4 hours of fire
resistance based on ASTM failure criteria. William et
al. also developed a thermal model to predict the
temperatures and it has been validated with the test
data obtained from experiments.
The above review clearly illustrates that there
have been only limited studies of the fire response of
FRP-strengthened RC beams. In all of studies, the
focus was on evaluating fire endurance of FRP-
strengthened beams through fire tests under standard
fire conditions. Based on these limited fire tests, the
authors concluded that some level of insulation is
required to achieve fire resistance ratings in FRP-
strengthened RC beams. There have been no detailed
numerical studies of the fire response of FRP-
strengthened RC beams under realistic fire, loading,
and restraint scenarios. This paper presents a
development of such a model for tracing the fire
response of FRP-strengthened RC beams.
Numerical Model
General Methodology A numerical model, initially developed for
tracing the fire exposure of RC beams [14], has been
extended to model the response of FRP-strengthened
beams. The model for RC beams is based on
COMPOSITES & POLYCON 2009
3
macroscopic finite element (FE) approach and uses a
moment-curvature relationship to trace the response
of an RC beams. The model accounts for fire induced
spalling, axial restraint effects, high temperature
material properties, softening of concrete and various
failure criteria. The model is well validated against
fire tests on RC beams [12,15,16].
This model is extended to trace the response of
FRP-strengthened RC beams in the entire range of
behavior up to collapse under fire. In the analysis, the
fire exposure time is incremented in time steps and
the response of the beam is evaluated at each time
step.
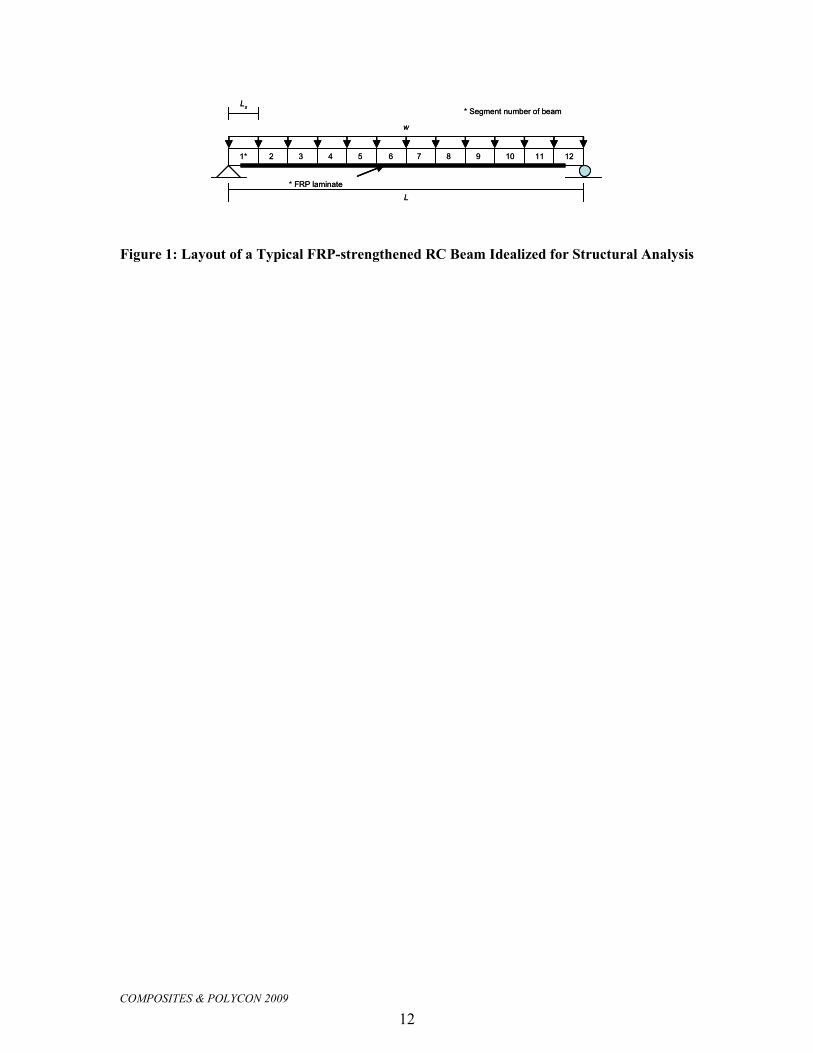
The beam is divided into a number of segments
along its length. Figure 1 illustrates the various
segments in a typical beam. It is assumed that the
mid-section of each segment represents the overall
behavior of the segment.
At each time step, thermal analysis is carried
out to determine the temperature distribution within
the cross-section of each segment. The computed
temperatures are used to generate moment curvature
(M-κ) relationships for each segment at various time steps. These M-κ relationships are in turn used to trace the response of the beam under fire conditions.
The M-κ relationships, at various time steps, are generated using the changing properties of
constituent materials namely concrete, steel
reinforcement, FRP and insulation. Thus, the material
nonlinearity is automatically accounted for in the
generation of M-κ relationships.
The load carrying capacity of the beam at a
particular time step is evaluated by taking the
maximum moment in the M-κ relationships. The deflection of the beam at each time step is calculated
through the stiffness approach by evaluating average
stiffness of the beam. The strength and stiffness of
beam decreases with time and failure is said to occur
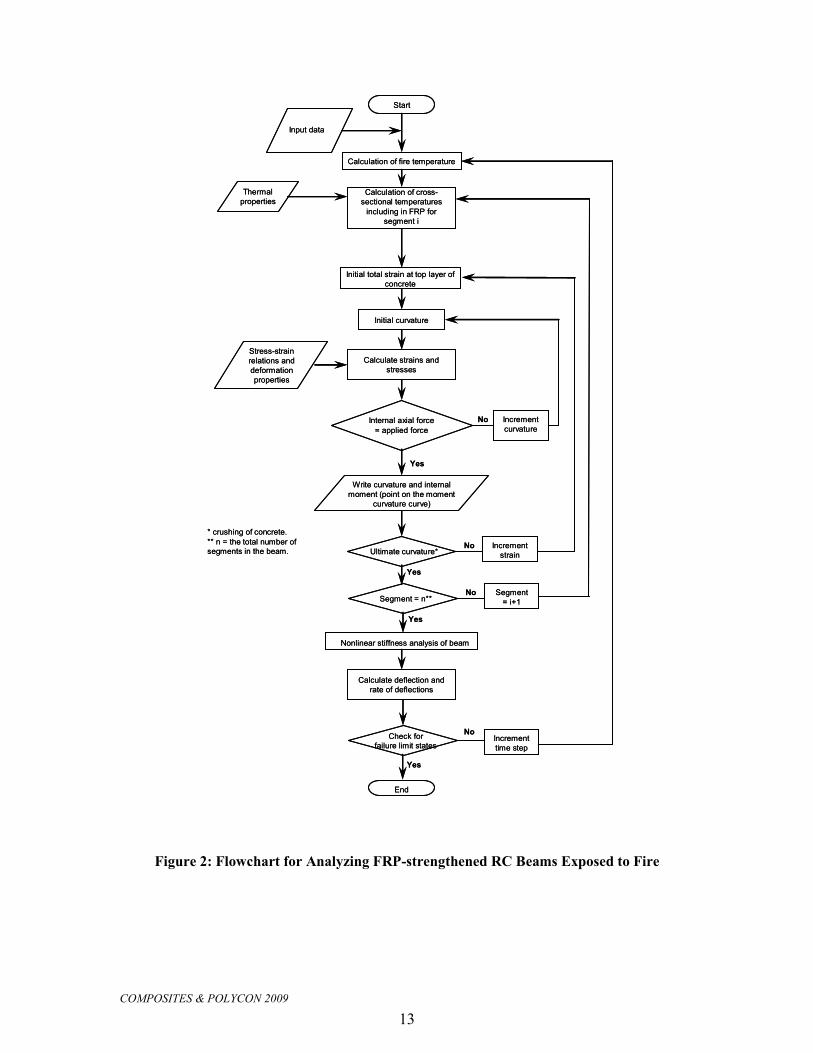
when one of the failure limit states is reached [14]. A
flowchart showing the numerical procedure for fire
resistance calculations is illustrated in Figure 2.
The model generates various critical output
parameters, such as cross sectional temperatures,
stresses, strains, deflections and moment capacities at
each time increment. The temperatures (including Tg
of FRP) and strength capacities for each segment, and
computed deflections in the beam, are used to
evaluate failure of the beam at each time step. At
every time step, each segment is checked against pre-
determined failure criteria, which include thermal and
structural considerations. The time increments
continue until a certain point at which the thermal
failure criterion is met or the strength (deflection)
reaches its limit state. At this point, the beam is said
to have failed. The time to reach this failure point is
the fire resistance of the beam.
At each time step, the numerical calculations are
performed in four steps: namely, calculation of fire
temperatures to which the beam is exposed,
calculation of cross- sectional temperatures in the
beam, generation of M-κ relationships for each beam segment, and calculation of resulting beam deflection
and strength through nonlinear structural analysis.
The details are discussed in the following sections:
Fire Temperatures In the model, the beam is assumed to be
exposed to fire from two, three or four sides. The fire
temperatures follow that of a standard fire exposure
or any other specified fire scenario. The time-
temperature relationship for the ASTM E119 [17]
standard fire can be approximated by the following
equation:
( )( ) hhf ttTT 41.17079553.3exp17500 +−−+= (1)
where: th = time (hours), T0 = initial temperature (°C), and Tf = fire temperature (°C)
Any design fire scenario or standard
hydrocarbon fire (ASTM 1529 [18]) can be used in
the model. The design fire time-temperature
relationships specified in the SFPE [19] have been
incorporated into the model.
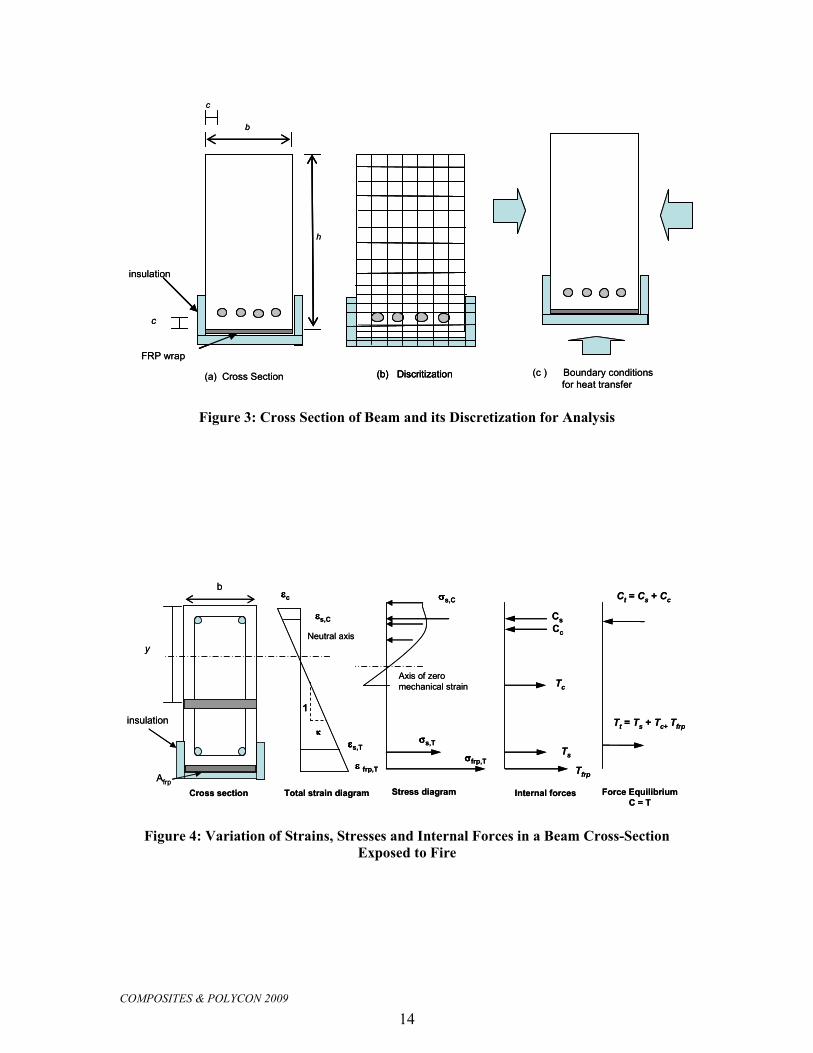
Thermal Analysis The temperatures within the beam cross section,
including FRP and insulation layer, is calculated
through finite element analysis. The cross-sectional
area of each segment is subdivided into a number of
elements (see Figure 3). A finer mesh is used for
predicting temperatures in insulation and FRP.
It is assumed that the temperature is uniform
along the length of the segment thus allowing the
calculations for a unit length of each segment.
Temperature distribution in the beam cross section is
not significantly influenced by the inclusion of steel
reinforcement for thermal analysis [20]. Therefore,
steel rebars are not considered in the thermal
analysis. The heat transfer on the boundary elements
is through mechanism of convection and radiation.
However, from insulation to FRP and FRP to
concrete, conduction is the dominant heat transfer
mechanism. The governing equation for transient
heat conduction within the beam cross-section is
given as:
t
TcQTk∂∂
=+∇ ρ2
(2)
where: k = thermal conductivity, ρc = heat capacity,
T = temperature, t = time, and Q = heat source.
COMPOSITES & POLYCON 2009
4
The governing equation for the heat transfer
analysis at the boundary can be expressed as:
( )∞−−=
∂∂
+∂∂
TThnz
Tn
y
Tk tzy
(3)
where: ht = heat transfer coefficient, T∞ = fire or
ambient temperature depending on the type of
exposure, ny and nz = components of the vector
normal to the boundary in the plane of the cross
section.
Galerkin finite element method is used to solve
Eq. (2). In this approach, the material property
matrices and the equivalent nodal heat flux (stiffness
matrix Ke, mass matrix Me, and nodal heat flux Fe)
are generated for each element. Once the element
matrices are computed, they are assembled into a
global system of differential equations which can be
written as:
( )tFTKTM =+&
(4)
where: K = global stiffness matrix, M = global mass
matrix, and F = equivalent nodal heat flux and T& = temperature derivative with respect to time (t).
A finite difference procedure (θ algorithm) in the time domain is used to solve Eq. (4) and
following equation can be obtained [21]:
( ) ( )( ) ( )( )nnnn FFhTKhMTKhM θθθθ −++−−=+ ++ 11 11
(5)
where: h = time step, Tn and Tn+1 = temperature at the
beginning and the end of time step, respectively, Fn
and Fn+1 = equivalent nodal heat flux at the beginning
and the end of time step, and θ = a constant between 0 and 1.
For unconditional stability of the numerical
calculations, the value of θ has to be greater than or
equal to 0.5 [14, 21]. By knowing the temperatures at
ambient conditions, Eq. (5) can be applied to obtain
the temperature-time history at the following time
step, and this can be repeated for subsequent time
steps. In each time step, an iterative process is
required to solve Eq. (5) due to the nonlinearity of
both material properties and boundary conditions.
Generation of Moment-curvature Curves The cross-sectional temperatures generated
from thermal analysis are used to develop M-κ relationships at various time steps. For the generation
of M-κ relationships, the following assumptions are made [2]:
• Plane sections before bending remain plane after bending.
• The FRP has linear stress-strain relationship to failure.
• No relative slip exists between FRP and the concrete substrate.
• There is no bond-slip between steel reinforcement and concrete.
The strength calculations, at elevated
temperatures, are carried out using the same mesh as
used for thermal analysis. The temperatures,
deformations and stresses in each element are
represented by the corresponding values at the center
of the element. These values are obtained by
averaging the values at nodes for rectangular
elements and for steel rebars the temperature is
assumed to be that at the center of the rebar.
The total strain in a concrete element, at any fire
exposure time, is given by the sum of the thermal
strain (expansion), the mechanical strain, the creep
strain, and the transient strain in the center as given
by following equation:
trcrmetht εεεεε +++=
(6)
where: εt = total strain, εth = thermal strain, εme =
mechanical strain, εcr = creep strain, and εtr =
transient strain.
In the model, thermal strain is calculated by
integrating the coefficient of thermal expansion
(which depends on the temperature of the concrete)
over the temperature domain. Creep strain in concrete
is assumed to be a function of time, temperature and
stress level, and is computed based on Harmathy’s
(1993) approach using the following expression:
( )293
,1
−= Td
Tccr et
f
σβε
(7)
where: β1 = 6.28×10⁻⁶ s-0.5, d = 2.658×10⁻³ K-1, T =
current concrete temperature (K), t = time (s), fc,T =
concrete strength at temperature T, and σ = current
stress in the concrete.
The transient strain, which is specific for
concrete under fire conditions, is computed based on
the relationship proposed by Anderberg and
Thelandersson (1976). The transient strain is related
to thermal strain as follows:
thc
trf
k εσ
ε ∆=∆20,
2
(8)
COMPOSITES & POLYCON 2009
5
where: k2 = a constant ranges between 1.8 and 2.35 (a
value of 2 will be used in the analysis); ∆εth = change
in thermal strain; ∆εtr = change in transient strain and
fc,20 = concrete strength at room temperature.
At any fire exposure time, the total strain in
steel reinforcement is calculated as the sum of three
components given in the following equation:
crsmesthsts εεεε ++=
(9)
where: εts, εths, εmes and εcrs are total strain, thermal
strain, mechanical strain and creep strain in the steel
reinforcement, respectively.
Similar to concrete, thermal strain in steel can
be calculated from the knowledge of rebar
temperature and thermal expansion of the reinforcing
steel. Creep strain is computed based on Dorn’s
theory and the model proposed by Harmathy (1967)
with some modifications made to account for
different values of yield strength of steel. According
to Harmathy’s model, creep strain in steel is given by
the following expression:
( ) θθεε ZZ tcrs += 3131203
(10)
where:
( )
>
×
≤
×
=
12
51023.1
12
510755.6
8.1016
7.4
19
y
yf
yy
fe
ffZ
σ
σσ
σ
dte RTH∫= ∆−θ , =
∆R
H38900°K, t = time
(hours),
75.1
0 016.0
=
yt
f
σε , σ = stress in steel,
and fy = yield strength of steel.
For FRP, the total strain at any time step can
be calculated using the following equation:
bicrfrpmet εεεε −+=
(11)
where: εt = total strain, εme = mechanical strain, εcrfrp
= creep strain in FRP and εbi = initial strain at the
soffit of the beam at the time of retrofitting with FRP.
Creep strain in FRP may play an important role
at elevated temperatures depending on the type and
orientation of fibers, and type of matrix used to
embed the fibers. The creep effects are minimal both
at room and elevated temperatures for direction of
loading coinciding with the fiber direction since the
fibers dominate the properties. However, creep strain
will be significant if the direction of loading is off-
axis.
The total strain in a concrete or steel or FRP
element, at any fire exposure time can be related to
the curvature of the beam by the following
expression:
kyct += εε
(12)
where: εt = total strain, εc = strain at the top most
fiber in concrete , κ = curvature, and y = distance
from uppermost fiber in concrete to the center of the
element.
At any time step, and for an assumed value of εc
and κ, the total strain in each element (concrete, FRP or rebar) can be computed using Eq (12). Once the
total strain is computed, the thermal, transient (for
concrete only), and creep strains in the concrete,
rebars, and FRP are calculated using appropriate
equation given above for known temperatures. Then,
the mechanical strain in each element is computed
using the following equations:-
trcrthtme εεεεε −−−= for
concrete (13)
crsthstsmes εεεε −−= for steel
(14)
bicrfrptsmes εεεε −−= for FRP
(15)
For the estimated mechanical strain, the stresses
and subsequently the corresponding forces in each
element can be computed using temperature
dependent stress strain relationships for concrete,
steel, and FRP. These forces are used to check force
equilibrium for each assumed value of strain and
curvature. For an assumed value of εc, κ is iterated until force equilibrium is satisfied. This iterative
procedure is repeated till equilibrium, compatibility
and convergence criterion are satisfied. Once these
conditions are satisfied, moment and curvature
corresponding to that strain are computed. Through
this approach, various points on the moment-
curvature curve are generated for each time step.
Beam Analysis The moment curvature relationships generated
for various segments are used to trace the response of
the whole beam exposed to fire. At each time step,
the deflection of the beam is evaluated through
stiffness approach. The secant stiffness for each
segment is determined from the moment-curvature
COMPOSITES & POLYCON 2009
6
relationships, based on the moment level reached in
that particular segment.
To compute the deflection of the beam at any
time step, and for a given loading conditions, the
stiffness matrix and the loading vector are computed
for each longitudinal segment. Then the computed
stiffness matrices are assembled in the form of
nonlinear global stiffness equation, which can be
written as:
PK g =δ
(16)
where: Kg = global stiffness matrix, δ = nodal
displacements, and P = equivalent nodal loads.
Iterative procedure described by Cambell and
Kodur [22] is used to solve Eq (16) and deflections of
the beam are computed.
Various parameters, including cross sectional
temperatures, stresses, deflections, and moment
capacity are generated by the above analysis. These
parameters are used to evaluate failure of the beam.
ASTM E119 specifies thermal and strength limit
states as a failure criteria’s for beams. In addition,
British Standard BS 476 [23] considers deflection
and rate of deflection criterion as a limiting state to
determine failure in beams. Furthermore, in FRP-
strengthened structures the properties of FRP degrade
with temperature. Tg in FRP epoxy/adhesive is often
considered a means of determining the effectiveness
of FRP in beams. Therefore, in the model the
temperature in FRP can be used as a possible failure
limit state. Thus, five failure limit states have been
incorporated in the model and accordingly the failure
is said to occur when:
• The applied service load exceeds the strength of the beam.
• The temperature in reinforcing steel (tension reinforcement) exceeds 593
oC.
• The deflection of the beam exceeds L/20 at any fire exposure time.
• The rate of deflection exceeds the limit L2/9000d (mm/ min) where L, length of the beam
(mm); and d, effective depth of the beam (mm).
• The temperature in FRP layer exceeds glass transition temperature (Tg ) of FRP.
As discussed above, the Tg of matrix is very low
(ranges from 68 to 82oC). Williams et al. [12]
reported that in their beam tests, Tg of the epoxy
exceeded around 55 minutes but the failure did not
occur for more than 4 hours. Therefore, limiting
temperature criteria for FRP layer is over
conservative and thus should not be considered in the
analysis.
It should be noted that the user has the option to
specify any of the five limit states to define the
failure.
High Temperature Material Properties For modeling the response of FRP-strengthened
beams, high temperature properties of concrete, steel,
FRP and insulation are required. These properties
include thermal, mechanical and deformation
properties which vary as a function of temperature.
There is reliable data on high temperature properties
of concrete and steel. However, only limited
knowledge of high temperature properties of FRP and
insulation exists. For concrete, the properties
suggested by ASCE Manual [24] and Eurocode-2
[25] have been included into the model. For
reinforcing steel, the mechanical properties (stress–
strain–temperature relationships) given in the ASCE
Manual [24] have been incorporated.
Based on literature review, the high temperature
properties of FRP and insulation are built into the
program. Bisby [4] suggested semi-empirical
relationships to describe the variation of strength and
stiffness as a function of temperature for
unidirectional composite materials. These
relationships were derived by fitting a sigmoid
function, using least-squares regression analysis, to
data obtained from different tests on composites.
These strength and stiffness properties are built into
the program. The thermal properties of FRP and
insulation are obtained from published data.
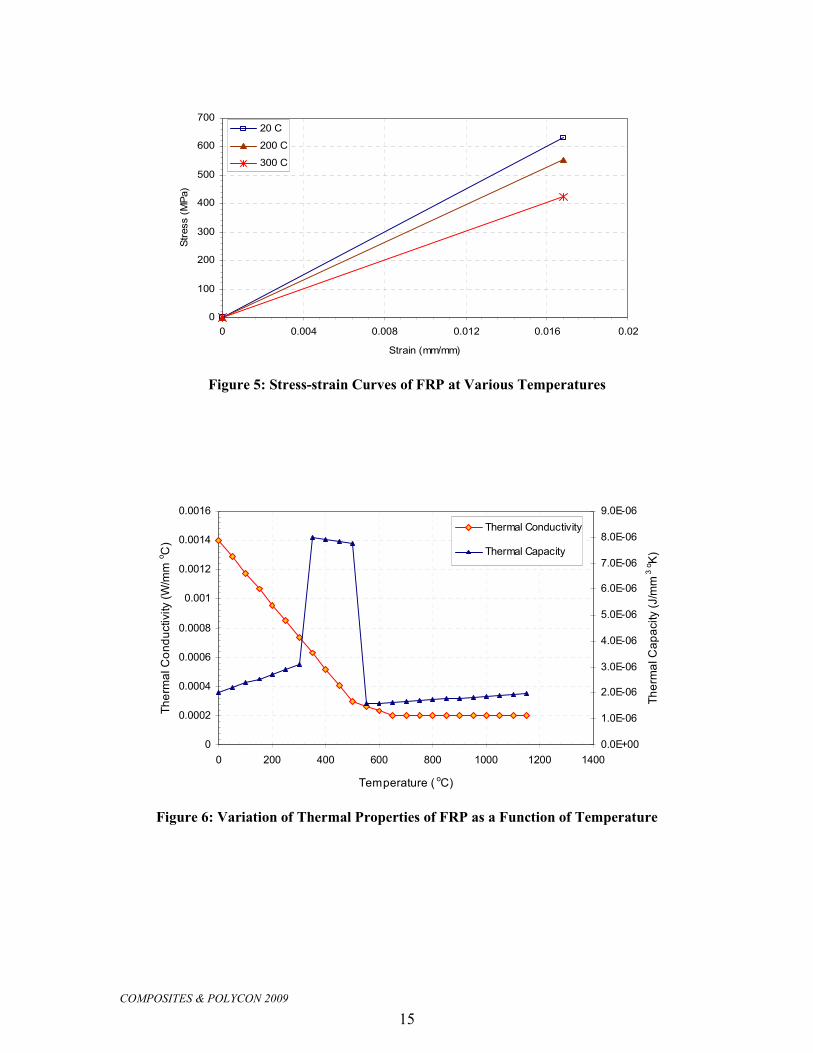
The stress-strain curves for CFRP at various
temperatures are shown in Figure 5. It can be seen
that the strength (stress) and stiffness decreases
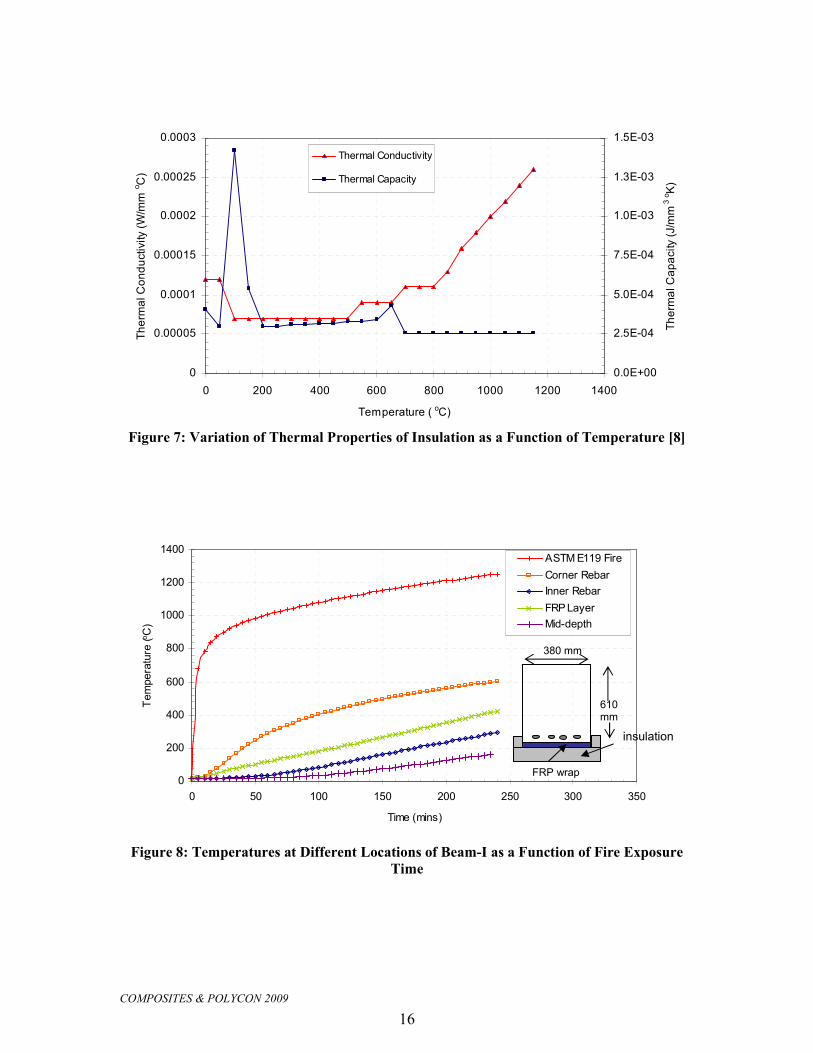
significantly with increased temperature. Figures 6
and 7 shows that there is a considerable reduction in
thermal conductivity of the FRP and insulation with
increasing temperature. The plateau in the high
thermal capacity of FRP in the range of 340-510oC is
due to additional heat absorbed for decomposition of
the resin in the matrix [26]. Also, the peak for
thermal capacity of insulation at about 100oC (shown
in Figure 7) is due to the water evaporation of
trapped water that consumes most of the heat energy.
Model Validation
General The model developed above is validated by
conducting numerical studies on two externally FRP-
strengthened RC beams. The first beam, referred to
as Beam I, is a CFRP-strengthened RC beam,
selected to illustrate the applicability of the model in
tracing the fire response of the beam [27]. The beam
is exposed to ASTM E119 standard fire from three
COMPOSITES & POLYCON 2009
7
sides. The second beam referred to as Beam II, an
FRP-strengthened beam tested by Blontrock et al.
[10], is selected to validate the model against fire test
data. These beams were retrofitted with
unidirectional CFRP laminates, and in each case the
loading coincided with the fiber direction. Therefore,
creep strains are assumed to be negligible in the
analysis. Details of the beam dimensions, material
properties, and load level are given in Table 1.
Typical FRP-strengthened Beam To illustrate the usefulness of the model, a
typical RC rectangular beam strengthened with CFRP
is analyzed under ASTM E119 standard fire exposure
from three sides. This beam is assumed fully
insulated on the bottom surface and partially
extending on the sides (see Figure 8). This beam was
analyzed using the computer model and results from
the analysis are presented in Figure 8 to 10.
Figure 8 shows the temperature profile at
various points in the cross-sections of the beam
plotted as a function of fire exposure time. As
expected, the predicted temperature decreases with
increasing distance from the fire-exposed side. The
low thermal conductivity of insulation keeps the
temperatures in FRP and steel rebars quite low. The
analysis shows that the concrete temperature at mid-
depth remains relatively low. This is due to low
thermal conductivity and high thermal capacity of the
concrete. Figure 8 shows that the temperatures in the
corner rebar are higher than that for inner (central)
rebar throughout fire exposure time. This trend is on
expected lines and can be attributed to the fact that
corner steel rebars are closer to fire exposed surface
on the bottom and side while the inner rebar is closer
to the fire exposed surface at the bottom face only.
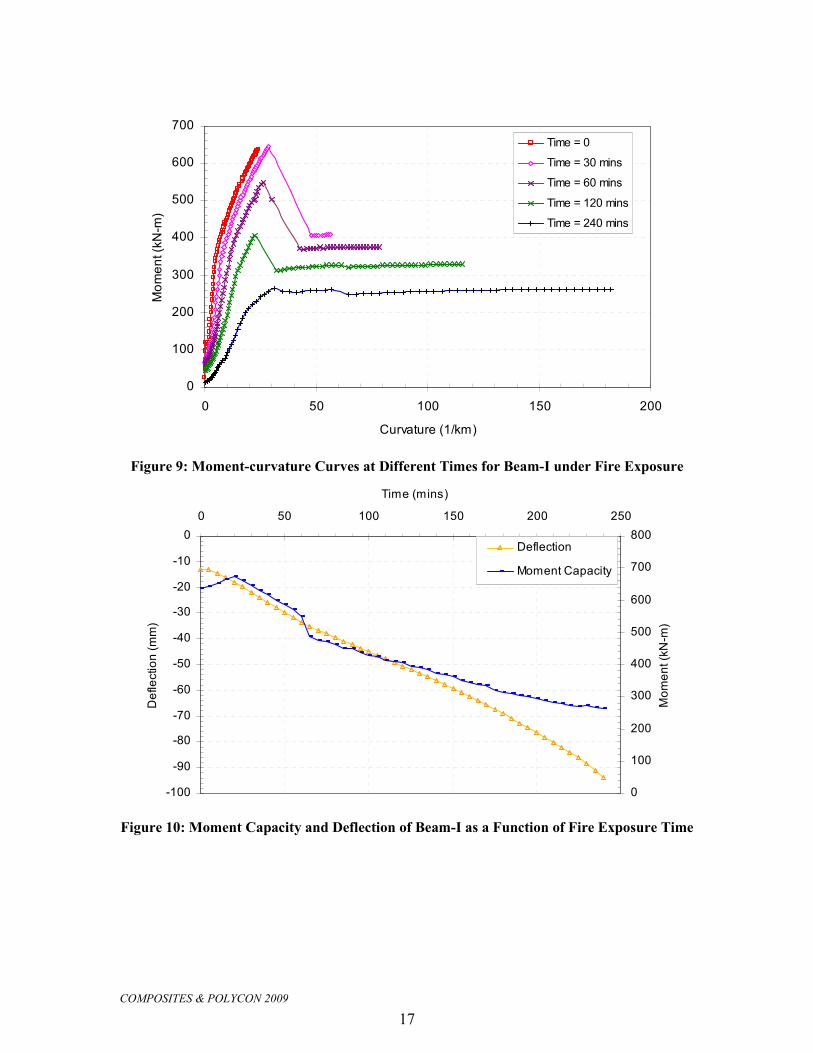
The moment-curvature curves obtained at
various time steps for the beam are shown in Figure
9. At early stages of fire exposure, the moment
capacity increases with curvature till peak moment is
attained and after that the moment drops due to
rupture of FRP. At ambient temperature, this moment
drop is not captured since concrete crushes prior to
rupturing of FRP. The percentage drop in moment
capacity decreases with increasing the fire exposure
time because at elevated temperatures, the FRP loses
stiffness very rapidly thus reducing its contribution
towards the moment capacity of the beam. The
ultimate curvature of the beam increases with
increase in temperatures due to higher deterioration
in the strength and stiffness properties of concrete,
steel and FRP. The beam behaves as unstrengthened
RC beam after the FRP is no longer contributing to
the moment capacity of the beam.
The variations of moment capacity and
deflection of the beam as a function of fire exposure
time are shown in Figure 10. It should be noted that
the predicted moment capacity of the strengthened
beam at room temperature (636 kN.m) is slightly
higher than the calculated moment capacity based on
ACI 440.2R-02 provisions [2]. This can be attributed
to that the model accounts for strain hardening of
steel reinforcement which is not taken into
consideration in the ACI design equations [2].
Results presented in Figure 10 indicate that
there is a slight increase in moment capacity just after
fire exposure followed by a faster rate of degradation
in moment capacity. This increased moment capacity
at early stages of fire exposure can be attributed to
concrete losing stiffness more rapidly than FRP at
initial stages. This occurs as a result of low
temperatures in FRP due to the presence of
insulation. This allows higher tensile strains to
develop in FRP and more utilization of FRP layer
strength thus increasing moment capacity of the
beam. However, once the temperature in FRP starts
increasing, FRP loses its strength and stiffness and
moment capacity decreases at a faster rate.
Subsequently, the rate of decrease of moment
capacity reduces with fire exposure time and this is
attributed to low increase in the temperature with fire
exposure time after FRP is lost.
The fire resistance of the beam is computed
based on the five failure criteria discussed above. The
predicted fire resistance based on the critical
temperature in the steel rebar is 230 minutes. The Tg
temperature (matrix) in the layer exceeds before the
beam is into 100 minutes of fire exposure. However,
this criterion is over conservative since the beam
continues to carry applied loads for about 4 hours,
despite FRP temperatures exceeds Tg.
Test Beam The validity of the computer model is
established by comparing predicted results from the
model with the measured test data on an FRP-
strengthened RC beam (Beam II) reported in the
literature [10]. The geometric and material properties
of this tested beam, taken from the literature, are
given in Table 1. The selected beam has 25 mm of
insulation thickness at the soffit of the beam. The
beam was analyzed using the above developed
computer program and results from analysis are
plotted in Figures 11, 12, and 13. For this beam,
Blontrock et al. [10] have reported only the
temperature measurements in the rebar and the mid-
span deflections.
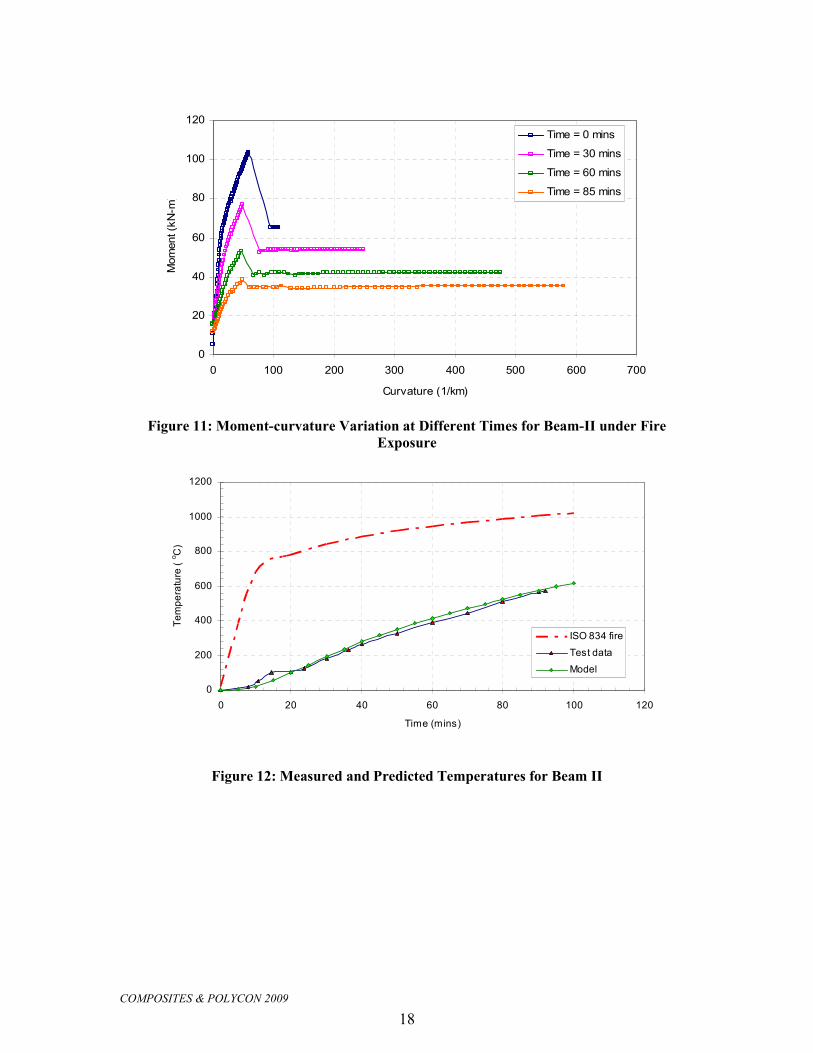
The moment-curvature curves obtained at
various time steps for the beam are shown in Figure
11. The room temperature capacity of the beam
before and after peeling off of the FRP matches with
measured strengths in the test. During the test, the
COMPOSITES & POLYCON 2009
8
glued insulation fell off after 7 minutes after the start
of the fire (test). It can be seen in the figure that the
moment capacity decreases with increased fire
exposure time, and this can be attributed to
deterioration of mechanical properties of FRP. Also,
the figure indicates that curvature increases with the
fire exposure time.
Figure 12 shows the comparison of predicted
and measured temperatures in steel reinforcement
and are plotted as a function of exposure time. There
is a good agreement between the predicted and
measured values in the entire range of fire exposure.
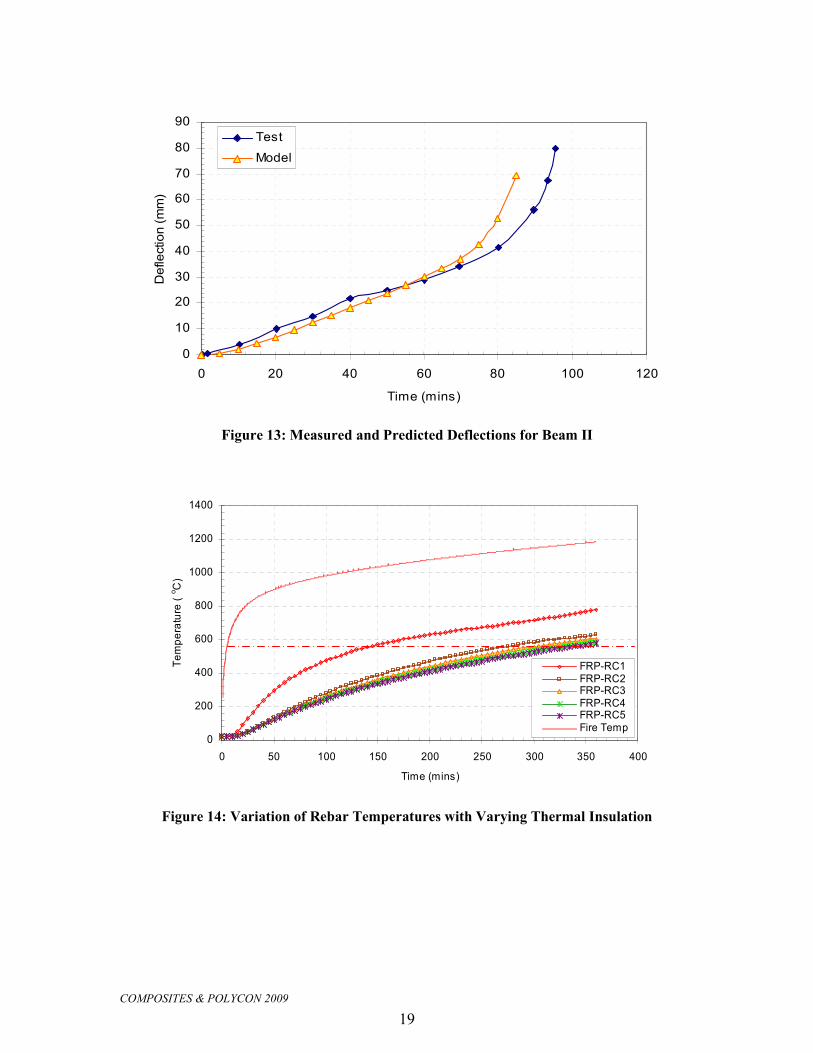
Figure 13 compares predicted and measured
mid-span deflection as a function of fire exposure
time for Beam II. The measured deflections are
plotted for 95 minutes of fire exposure time after
which the data could not be recorded due to sudden
increase in deflections. For most part, the deflections
computed by the model are in good agreement with
measured values. However, beyond 80 minutes, the
model predicts slightly higher deflections. This might
be due to the variation of the material properties used
in the analysis as compared to actual properties of the
tested beam. However, predicting slightly higher
deflections generally leads to conservative fire
resistance for FRP-strengthened beams.
The model could not be validated against
critical results such as FRP temperatures. This is
mainly because data on high temperature thermal
properties of insulating material, used as fire proofing
of FRP-strengthened RC beams, is not reported in the
literature. For this purpose, full scale fire resistance
tests on FRP-strengthened beams as well as high
temperature properties of insulation are currently
being undertaken at Michigan State University.
Parametric Studies The thermal and structural response of FRP-
strengthened RC beams is complex and depends on
many factors including material (FRP) type, high
temperature mechanical properties, and insulation
configuration and properties. To investigate the
efficacy of the model predictions and the effect of
insulation schemes on fire resistance of FRP-
strengthened RC beams, five beams designated FRP-
RC1, FRP-RC2, FRP-RC3, FRP-RC4 and FRP-RC5
are analyzed. The dimensions and material properties
of the beams are given in Table 1. For the analysis,
the thickness of insulation on side of the beam is kept
consistent. For beams FRP-RC2, FRP-RC3, FRP-
RC4 and FRP-RC5, the insulation thicknesses at the
beam soffit are 15 mm, 25 mm, 40 mm, and 50 mm
respectively. However, beam FRC-RC1 is
strengthened with FRP but not provided with
supplemental fire insulation. The analysis is carried
out by exposing the beams to the standard ASTM
E119 fire from three sides. The load ratio (ratio of
applied load under fire conditions to strength capacity
at room temperature) is kept at 50% for structural
analysis. The fire resistance is evaluated based on
strength, deflection, and rebar temperature failure
criteria discussed above. However, the failure based
on Tg is not determined since this limit state is overly
conservative. A summary of the results from analysis
is presented in Table 2 and shown in Figure 14 and
15.
Figure 14 illustrates the variation in the rebar
temperatures as a function of fire exposure time for
the five beams (FRP-RC1, FRP-RC2, FRP-RC3,
FRP-RC4 and FRP-RC5). The results show that the
insulation thickness has a significant effect on the
temperatures in FRP and the reinforcement (as can be
seen in Figure 14). This can be attributed to the low
thermal conductivity of the insulation material. The
insulation helps keep temperatures low at the FRP-
concrete interface and in the reinforcement.
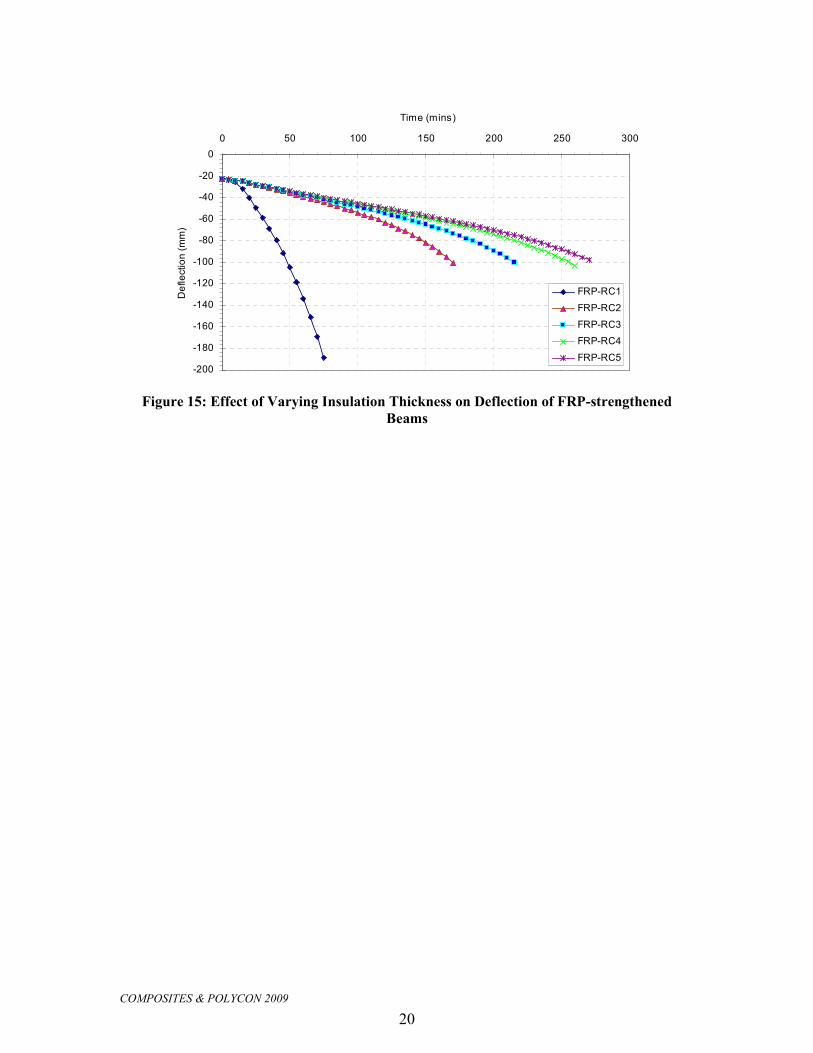
The variations of deflection as a function of
time for the analyzed beams are shown in Figure 15.
It can be noticed that an increase in insulation
thickness reduces the deflection during the fire
exposure time. However, this reduction is not
proportional to the thickness increase. This can be
attributed to slower temperature rise in FRP and
rebars, resulting from the presence of insulation, as
discussed above. The results suggest that increase in
thickness beyond a certain value will not be very
helpful.
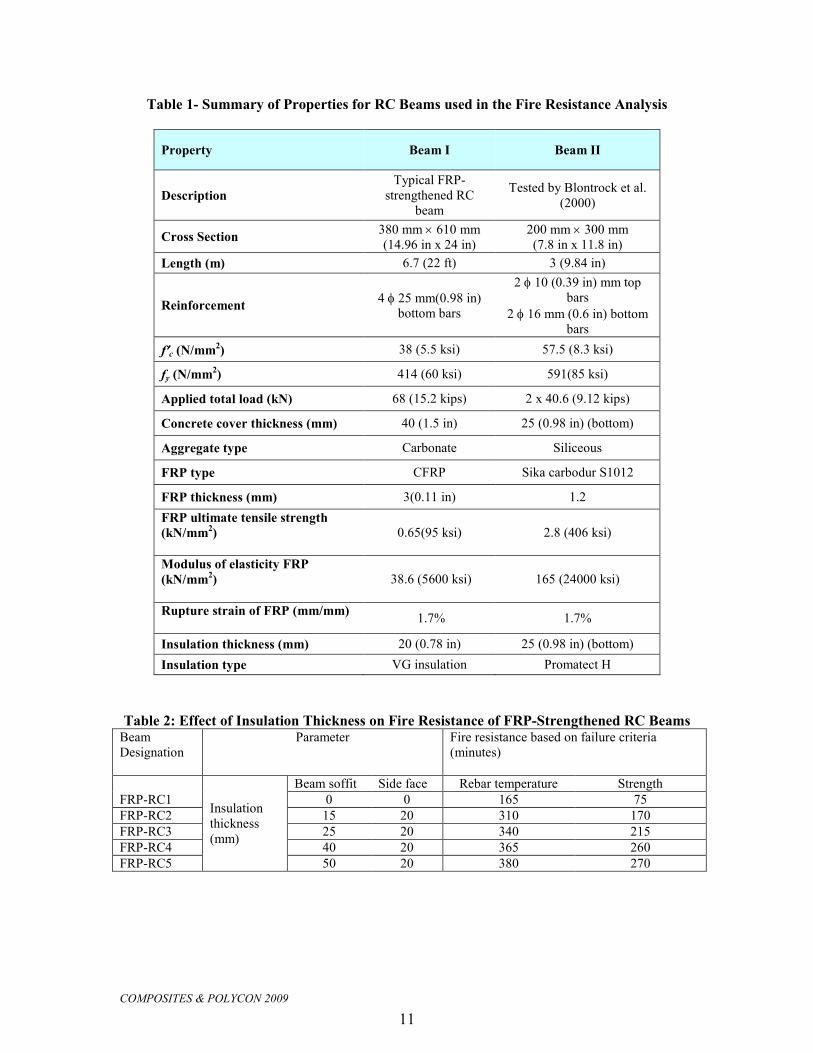
Table 2 shows the influence of insulation
thickness on the fire resistance of the five analyzed
beams. The fire resistance of the beams is computed
based on the four failure criteria discussed
previously. The analysis shows that no failures in any
of the five beams occur due to deflection or rate of
deflection limit state. This can be attributed to
reduced ductility of the beams strengthened with
FRP. It is also evident that the fire resistance
computed based on critical rebar temperature and
strength limit state considerably increases with
increasing the insulation thickness. Increasing the
insulation thickness from 15mm to 50 mm increases
the fire resistance, for strength failure criteria, by
about 100 minutes. This can be attributed to low
temperature increase in the FRP and steel
reinforcement with increasing insulation thickness.
The analysis also indicates that by increasing
the insulation thickness from 40mm to 50mm has
little influence on fire resistance of the strengthened
beam (increases the fire resistance by about 10
minutes). Therefore, it can be concluded that the
increase in insulation thickness beyond certain value
is not cost effective. This illustrates that the model
can be applied to develop optimum insulation
COMPOSITES & POLYCON 2009
9
thickness requirements in FRP-strengthened RC
beams for given fire rating.
There is considerable difference in fire
resistance of the analyzed beams based on the two
tabulated failure criteria. This can be attributed to
rapid degradation of FRP at high temperatures and
increase in rebar temperature is independent of
mechanical properties of constituent material.
Practical Applications FRP are high-performing materials that offer a
viable and cost-effective option for strengthening
deteriorating infrastructure. However, when used in
building applications, and rehabilitation of structural
members, they need to satisfy prescribed fire
resistance ratings specified in the building codes. In
recent years, there has been limited effort to study the
fire behavior of FRP-strengthened RC members and
to develop solutions for achieving required fire
endurance.
The current approach of evaluating fire
resistance through standard fire tests on full-scale
FRP-strengthened RC members is expensive, time
consuming and has a number of drawbacks. An
alternative approach is to use calculation methods for
predicting the fire resistance. However, such
calculation methods are not widely available at
present. Further, the current provisions in codes and
standards for evaluating fire resistance are
prescriptive and do not reflect realistic scenarios such
as loading, fire scenario and failure criteria. Thus, the
current design approaches are not applicable for
undertaking performance-based design that provides
rational and cost-effective fire safety solutions.
The computer model presented here is capable
of tracing the behavior of FRP-strengthened RC
beams from the initial pre-fire stage to the failure of
the beam under realistic fire scenarios, load level, and
all possible failure criteria. Using the program, a
designer can develop an optimum fire insulation
scheme for an FRP-strengthened RC beam using this
program. Thus, the use of this program will lead to an
optimal design that is not only economical but is also
based on rational design principles. Further, the
program can be applied to conduct parametric
studies, which can then be used to develop rational
fire safety design guidelines for incorporation into
codes and standards.
At present, the computer program is being
further expanded to account for the effects of bond
degradation, and axial restraints which are developed
during exposure to fire. Also, the model is being
expanded to account for other modes of failure that
may result from axial and rotational restraints such as
shear failure at the supports and instability of the
beam.
Conclusions Based on the information presented in the paper,
the following conclusions can be drawn:
• There is limited information on the fire performance of RC beams strengthened with
externally bonded FRP systems, especially under
design fire and realistic fire and loading scenarios.
• The numerical model presented in this paper is capable of predicting the response of FRP-
strengthened RC beams. The model accounts for
high temperature material properties, fire scenarios,
load level, and realistic failure criteria.
• The proposed model is useful for developing cost-effective fire insulation scheme in FRP
strengthened RC beams. Increasing insulation
thickness beyond a certain value may not enhance
fire resistance.
• Attaining Tg in FRP reinforcement may not lead to failure in FRP-strengthened RC beams. Thus,
realistic limit states, such as strength and
deflection, should be used to define failure in FRP-
strengthened beams.
References
[1] H. Blontrock, L. Taerwe, and S. Matthys,
‘‘Properties of Fibre Reinforced Plastics at Elevated
Temperatures with Regard to Fire Resistance of
Reinforced Concrete Members,’’ In: Proceedings, 4th
International Symposium on Non-Metallic (FRP)
Reinforcement for Concrete Structures, American
Concrete Institute, Baltimore, MD, 1999, pp. 43–54.
[2] ACI Committee 440, “Guide for the Design and
Construction of Externally Bonded FRP Systems for
Strengthening Concrete Structures,” (ACI 440.2R-
02), American Concrete Institute, Farmington Hills,
MI, 2004, pp. 3.
[3] B. Williams et. al., “Fire Insulation Schemes for
FRP-Strengthened Concrete Slabs,” Composites Part
A, Vol. 37, 2005, pp. 1151-1160.
[4] L.A. Bisby, “Fire Behavior of Fibre-Reinforced
Polymer (FRP) Reinforced or Strengthened
Concrete,” Doctoral thesis, Queen’s University at
Kingston, Kingston, ON, Canada, 2003, pp. 371.
[5] ACI 440.1R-06, Guide for the design and
construction of structural concrete reinforced with
FRP bars American Concrete Institute (ACI), 2006.
[6] CSA, S806-02: Design and construction of
building components with fibre-reinforced polymers,
COMPOSITES & POLYCON 2009
10
Mississauga, Canada: Canadian Standards
Association, 2002.
[7] ISIS Design Manual No. 4: Strengthening
reinforced concrete structures with externally-bonded
fibre reinforced polymers. Winnipeg, Canada:
Intelligent Sensing for Innovative Structures, 2001.
[8] FIB bulletin 14, Design and use of externally
bonded FRP reinforcement for RC structures,” Task
Group 9.3 FRP, 2001.
[9] M. Deuring, “Brandversuche an Nachtraglich
Verstarkten Tragern aus Beton,” Research Report
EMPA No. 148,795, Swiss Federal Laboratories for
Materials Testing and Research, Dubendorf,
Switzerland, 1994.
[10] H. Blontrock, L. Taerwe, and P. Vandevelde,
“Fire Tests on Concrete Beams Strengthened with
Fibre Composite Laminates,” Third PhD Symposium,
Vienna, Austria, 2000, pp. 10.
[11] R. Barnes and J. Fidell, “Performance in fire of
small-scale CFRP strengthened concrete beams,”
Journal of Composites for Construction, Vol. 10, No.
6, December 2006.
[12] B. Williams et al., “Fire endurance of Fiber-
reinforced polymer strengthened concrete T-beams”,
ACI Structural Journal, Vol. 105, No. 1, January-
February 2008.
[13] ISIS, Canada: Monograph on Durability of Fiber
Reinforced Polymers in Civil Infrastructure, Canada,
2006, pp. 7-21.
[14] V.K.R. Kodur and M.B. Dwaikat, “A numerical
model for predicting the fire resistance of reinforced
concrete beams,” Cement and Concrete Composites,
Vol. 30, 2008, pp. 431-443.
[15] M.B. Dwaikat and V.K.R. Kodur, “Effect of fire
scenario, restraint conditions, and spalling on the
behavior of RC beams,” Proceedings of Fifth
International Conference on Structures in Fire,
Singapore, 2008, pp. 369-379.
[16] V.K.R. Kodur and M.B. Dwaikat, “Performance
based fire safety design of reinforced concrete
beams”, Journal of Fire Protection Engineering,
2007, pp. 1-22.
[17] ASTM E119: Standard test methods for fire tests
of building construction and materials, West
Conshohocken, Pennsylvania, American Society for
Testing and Materials, 2002.
[18] ASTM, Standard test methods for determining
effects of large hydrocarbon pool fires on structural
members and assemblies. Test Method. West
Conshohocken, PA: American Society for Testing
and Materials, 1993, pp. E1529.
[19] SFPE, Fire exposures to structural elements –
engineering guide. Bethesda, MD: Society of Fire
Protection Engineers, 2004, pp. 150.
[20] T.T. Lie and R.J. Irwin, Method to calculate the
fire resistance of reinforced concrete columns with
rectangular cross section. ACI Structural Journal,
1993, pp. 52–60.
[21] B. William, A first course in the finite element
method, Richard D. Irwin, Inc., 1990.
[22] T.I. Campbell and V.K.R. Kodur, “Deformation
controlled nonlinear analysis of prestressed concrete
continuous beams,” PCI Journal, 1990, pp. 42–55.
[23] B.S., Fire tests on building materials and
structures – Part 20: Method from determination of
the fire resistance of elements of construction
(general principles). BS 476-3:1987, BSI, UK, 1987.
[24] T.T. Lie, “Structural Fire Protection,” ASCE
Committee on Fire Protection, Structural Division,
American Society of Civil Engineers, New York,
1992, pp. 241.
[25] Eurocode 2, EN1992-1-2: Design of Concrete
Structures. Part 1–2: General Rules– Structural Fire
Design. Comite´ Europee´ n de Normalisation
(CEN), Brussels, 2003.
[26] C.A. Griffis, R.A. Masumura, and C.I. Chang,
“Thermal response of graphite epoxy composite
subjected to rapid heating,” Environmental effects on
composite materials. Vol. 2. Lancaster, Pennsylvania,
Technomic Publishing Company, 1984.
[27] H.V.S. GangaRao, N. Taly, and P.V. Vijay,
Reinforced Concrete Design with FRP Composites,
CRC Press., Florida, United States, 2007.
COMPOSITES & POLYCON 2009
11
Table 1- Summary of Properties for RC Beams used in the Fire Resistance Analysis
Property Beam I Beam II
Description
Typical FRP-
strengthened RC
beam
Tested by Blontrock et al.
(2000)
Cross Section 380 mm × 610 mm (14.96 in x 24 in)
200 mm × 300 mm (7.8 in x 11.8 in)
Length (m) 6.7 (22 ft) 3 (9.84 in)
Reinforcement 4 φ 25 mm(0.98 in) bottom bars
2 φ 10 (0.39 in) mm top bars
2 φ 16 mm (0.6 in) bottom bars
f′′′′c (N/mm2) 38 (5.5 ksi) 57.5 (8.3 ksi)
fy (N/mm2) 414 (60 ksi) 591(85 ksi)
Applied total load (kN) 68 (15.2 kips) 2 x 40.6 (9.12 kips)
Concrete cover thickness (mm) 40 (1.5 in) 25 (0.98 in) (bottom)
Aggregate type Carbonate Siliceous
FRP type CFRP Sika carbodur S1012
FRP thickness (mm) 3(0.11 in) 1.2
FRP ultimate tensile strength
(kN/mm2)
0.65(95 ksi) 2.8 (406 ksi)
Modulus of elasticity FRP
(kN/mm2)
38.6 (5600 ksi) 165 (24000 ksi)
Rupture strain of FRP (mm/mm)
1.7% 1.7%
Insulation thickness (mm) 20 (0.78 in) 25 (0.98 in) (bottom)
Insulation type VG insulation Promatect H
Table 2: Effect of Insulation Thickness on Fire Resistance of FRP-Strengthened RC Beams Beam
Designation
Parameter Fire resistance based on failure criteria
(minutes)
Insulation
thickness
(mm)
Beam soffit Side face Rebar temperature Strength
FRP-RC1 0 0 165 75
FRP-RC2 15 20 310 170
FRP-RC3 25 20 340 215
FRP-RC4 40 20 365 260
FRP-RC5 50 20 380 270
COMPOSITES & POLYCON 2009
12
L
Ls
w
1* 2 3 4 5 6 7 8 9 10 11 12
* Segment number of beam
* FRP laminate
L
Ls
w
1* 2 3 4 5 6 7 8 9 10 11 12
* Segment number of beam
* FRP laminate
Figure 1: Layout of a Typical FRP-strengthened RC Beam Idealized for Structural Analysis
COMPOSITES & POLYCON 2009
13
Start
Input data
Thermal
properties
Calculation of fire temperature
Calculation of cross-
sectional temperatures
including in FRP for
segment i
Stress-strain
relations and
deformation
properties
Calculate strains and
stresses
End
Internal axial force
= applied force
Yes
No Increment
curvature
Initial total strain at top layer of
concrete
Initial curvature
Write curvature and internal
moment (point on the moment
curvature curve)
Ultimate curvature*
Yes
No Increment
strain
Nonlinear stiffness analysis of beam
Calculate deflection and
rate of deflections
Check for
failure limit states
Yes
NoIncrement
time step
* crushing of concrete.
** n = the total number of
segments in the beam.
Segment = n**No Segment
= i+1
Yes
Figure 2: Flowchart for Analyzing FRP-strengthened RC Beams Exposed to Fire
COMPOSITES & POLYCON 2009
14
(a) Cross Section
h
c
c
b
FRP wrap
insulation
(b) Discritization (c ) Boundary conditions
for heat transfer(a) Cross Section
h
c
c
b
FRP wrap
insulation
(b) Discritization(b) Discritization (c ) Boundary conditions
for heat transfer
Figure 3: Cross Section of Beam and its Discretization for Analysis
Cross section Total strain diagram Stress diagram Internal forces
1
Axis of zero
mechanical strain
Neutral axis
Force Equilibrium
C = T
εεεε frp,T
Tt = Ts + Tc+ Tfrp
Ct = Cs + Cc
Cs
Cc
Tc
Ts
Tfrp
σσσσfrp,T
σσσσs,T
σσσσs,Cεεεεc
εεεεs,C
κκκκ
εεεεs,T
Afrp
y
b
insulation
Cross section Total strain diagram Stress diagram Internal forces
1
Axis of zero
mechanical strain
Neutral axis
Force Equilibrium
C = T
εεεε frp,T
Tt = Ts + Tc+ Tfrp
Ct = Cs + Cc
Cs
Cc
Tc
Ts
Tfrp
σσσσfrp,T
σσσσs,T
σσσσs,Cεεεεc
εεεεs,C
κκκκ
εεεεs,T
Afrp
y
b
insulation
Figure 4: Variation of Strains, Stresses and Internal Forces in a Beam Cross-Section
Exposed to Fire
COMPOSITES & POLYCON 2009
15
0
100
200
300
400
500
600
700
0 0.004 0.008 0.012 0.016 0.02
Strain (mm/mm)
Stress (MPa)
20 C
200 C
300 C
Figure 5: Stress-strain Curves of FRP at Various Temperatures
0
0.0002
0.0004
0.0006
0.0008
0.001
0.0012
0.0014
0.0016
0 200 400 600 800 1000 1200 1400
Temperature ( oC)
Therm
al Conductivity (W/mm oC)
0.0E+00
1.0E-06
2.0E-06
3.0E-06
4.0E-06
5.0E-06
6.0E-06
7.0E-06
8.0E-06
9.0E-06
Therm
al Capacity (J/mm
3 oK)
Thermal Conductivity
Thermal Capacity
Figure 6: Variation of Thermal Properties of FRP as a Function of Temperature
COMPOSITES & POLYCON 2009
16
0
0.00005
0.0001
0.00015
0.0002
0.00025
0.0003
0 200 400 600 800 1000 1200 1400
Temperature ( oC)
Therm
al Conductivity (W/mm oC)
0.0E+00
2.5E-04
5.0E-04
7.5E-04
1.0E-03
1.3E-03
1.5E-03
Therm
al Capacity (J/mm
3 oK)
Thermal Conductivity
Thermal Capacity
Figure 7: Variation of Thermal Properties of Insulation as a Function of Temperature [8]
Figure 8: Temperatures at Different Locations of Beam-I as a Function of Fire Exposure
Time
0
200
400
600
800
1000
1200
1400
0 50 100 150 200 250 300 350
Time (mins)
Temperature (oC)
ASTM E119 Fire
Corner Rebar
Inner Rebar
FRP Layer
Mid-depth
380 mm
610 mm
FRP wrap
insulation
0
200
400
600
800
1000
1200
1400
0 50 100 150 200 250 300 350
Time (mins)
Temperature (oC)
ASTM E119 Fire
Corner Rebar
Inner Rebar
FRP Layer
Mid-depth
380 mm
610 mm
FRP wrap
insulation
0
200
400
600
800
1000
1200
1400
0 50 100 150 200 250 300 350
Time (mins)
Temperature (oC)
ASTM E119 Fire
Corner Rebar
Inner Rebar
FRP Layer
Mid-depth
380 mm
610 mm
FRP wrap
insulation
COMPOSITES & POLYCON 2009
17
0
100
200
300
400
500
600
700
0 50 100 150 200
Curvature (1/km)
Moment (kN-m
)Time = 0
Time = 30 mins
Time = 60 mins
Time = 120 mins
Time = 240 mins
Figure 9: Moment-curvature Curves at Different Times for Beam-I under Fire Exposure
-100
-90
-80
-70
-60
-50
-40
-30
-20
-10
0
0 50 100 150 200 250
Time (mins)
Deflection (mm)
0
100
200
300
400
500
600
700
800
Moment (kN-m
)
Deflection
Moment Capacity
Figure 10: Moment Capacity and Deflection of Beam-I as a Function of Fire Exposure Time
COMPOSITES & POLYCON 2009
18
0
20
40
60
80
100
120
0 100 200 300 400 500 600 700
Curvature (1/km)
Moment (kN-m
)
Time = 0 mins
Time = 30 mins
Time = 60 mins
Time = 85 mins
Figure 11: Moment-curvature Variation at Different Times for Beam-II under Fire
Exposure
0
200
400
600
800
1000
1200
0 20 40 60 80 100 120
Time (mins)
Temperature ( oC)
ISO 834 fire
Test data
Model
Figure 12: Measured and Predicted Temperatures for Beam II
COMPOSITES & POLYCON 2009
19
0
10
20
30
40
50
60
70
80
90
0 20 40 60 80 100 120
Time (mins)
Deflection (mm)
Test
Model
Figure 13: Measured and Predicted Deflections for Beam II
0
200
400
600
800
1000
1200
1400
0 50 100 150 200 250 300 350 400
Time (mins)
Temperature ( oC)
FRP-RC1FRP-RC2FRP-RC3FRP-RC4FRP-RC5Fire Temp
Figure 14: Variation of Rebar Temperatures with Varying Thermal Insulation
COMPOSITES & POLYCON 2009
20
-200
-180
-160
-140
-120
-100
-80
-60
-40
-20
0
0 50 100 150 200 250 300
Time (mins)
Deflection (mm)
FRP-RC1
FRP-RC2
FRP-RC3
FRP-RC4
FRP-RC5
Figure 15: Effect of Varying Insulation Thickness on Deflection of FRP-strengthened
Beams