Modeling the Epidemic Dynamics and Control of COVID-19 ... · Modeling the Epidemic Dynamics and...
15
Modeling the Epidemic Dynamics and Control of COVID-19 Outbreak in China Shilei Zhao a,b,c , Hua Chen a,b,c,d,* a CAS Key Laboratory of Genomic and Precision Medicine, Beijing Institute of Genomics, Chinese Academy of Sciences, Beijing 100101, China b China National Center for Bioinformation, Beijing 100101, China c School of Future Technology, University of Chinese Academy of Sciences, Beijing 100049, China d CAS Center for Excellence in Animal Evolution and Genetics, Chinese Academy of Sciences, Kunming 650223, China Abstract The coronavirus disease 2019 (COVID-19) is rapidly spreading over China and more than 30 coun- tries in last two months. COVID-19 has multiple characteristics distinct from other infectious diseases, including a high infectivity during incubation, time delay between real dynamics and daily observed case numbers, and the effects from multiple quarantine and control measures. We develop a model SUQC to adequately characterizes the dynamics of COVID-19 and explicitly model the control by artificial measures, which is more suitable for analysis than other existing epidemic models. The SUQC model is applied to the daily released data of the confirmed infected to analyze the outbreak of COVID-19 in Wuhan, Hubei (excluding Wuhan), China (excluding Hubei) and four first-tier cities of China. We find that, before January 30, 2020, all these regions except Beijing have a reproductive number R> 1, and after January 30, all regions have a reproductive number R< 1, indicating the effectiveness of the quarantine and control measures in inhibiting COVID- 19. The confirmation rate of Wuhan is 0.0643, significantly lower than 0.1914 of Hubei (excluding Wuhan) and 0.2189 of China (excluding Hubei), but increases to 0.3229 after Feb 12th when clinical diagnosis was adopted. The un-quarantined infected individuals in Wuhan on February 12, 2020 is as high as 3, 509 and decreases to 334 on February 21th, 2020. After fitting the model with recent data, we predict that the end times of COVID-19 of Wuhan and Hubei are around late-March, of China (excluding Hubei) around mid-March, and of the four tier-one cities before March 2020. A total of 80, 511 individuals of the whole country are infected, among which 49, 510 are from Wuhan, 17, 679 from Hubei(excluding Wuhan), and the rest 13, 322 from other regions of China (excluding Hubei). We suggest the rigorous quarantine and control * Corresponding author: [email protected] 1 . CC-BY-NC-ND 4.0 International license It is made available under a author/funder, who has granted medRxiv a license to display the preprint in perpetuity. is the (which was not peer-reviewed) The copyright holder for this preprint . https://doi.org/10.1101/2020.02.27.20028639 doi: medRxiv preprint
Transcript of Modeling the Epidemic Dynamics and Control of COVID-19 ... · Modeling the Epidemic Dynamics and...
Modeling the Epidemic Dynamics and Control of COVID-19 Outbreak inChina
Shilei Zhaoa,b,c, Hua Chena,b,c,d,∗
aCAS Key Laboratory of Genomic and Precision Medicine, Beijing Institute of Genomics, Chinese Academy ofSciences, Beijing 100101, China
bChina National Center for Bioinformation, Beijing 100101, ChinacSchool of Future Technology, University of Chinese Academy of Sciences, Beijing 100049, China
dCAS Center for Excellence in Animal Evolution and Genetics, Chinese Academy of Sciences, Kunming 650223,China
Abstract
The coronavirus disease 2019 (COVID-19) is rapidly spreading over China and more than 30 coun-
tries in last two months. COVID-19 has multiple characteristics distinct from other infectious
diseases, including a high infectivity during incubation, time delay between real dynamics and
daily observed case numbers, and the effects from multiple quarantine and control measures. We
develop a model SUQC to adequately characterizes the dynamics of COVID-19 and explicitly model
the control by artificial measures, which is more suitable for analysis than other existing epidemic
models.
The SUQC model is applied to the daily released data of the confirmed infected to analyze the
outbreak of COVID-19 in Wuhan, Hubei (excluding Wuhan), China (excluding Hubei) and four
first-tier cities of China. We find that, before January 30, 2020, all these regions except Beijing
have a reproductive number R > 1, and after January 30, all regions have a reproductive number
R < 1, indicating the effectiveness of the quarantine and control measures in inhibiting COVID-
19. The confirmation rate of Wuhan is 0.0643, significantly lower than 0.1914 of Hubei (excluding
Wuhan) and 0.2189 of China (excluding Hubei), but increases to 0.3229 after Feb 12th when clinical
diagnosis was adopted. The un-quarantined infected individuals in Wuhan on February 12, 2020 is
as high as 3, 509 and decreases to 334 on February 21th, 2020.
After fitting the model with recent data, we predict that the end times of COVID-19 of Wuhan
and Hubei are around late-March, of China (excluding Hubei) around mid-March, and of the four
tier-one cities before March 2020. A total of 80, 511 individuals of the whole country are infected,
among which 49, 510 are from Wuhan, 17, 679 from Hubei(excluding Wuhan), and the rest 13, 322
from other regions of China (excluding Hubei). We suggest the rigorous quarantine and control
∗Corresponding author: [email protected]
1
. CC-BY-NC-ND 4.0 International licenseIt is made available under a author/funder, who has granted medRxiv a license to display the preprint in perpetuity.
is the(which was not peer-reviewed) The copyright holder for this preprint .https://doi.org/10.1101/2020.02.27.20028639doi: medRxiv preprint

measures should be kept before March in Beijing, Shanghai, Guangzhou and Shenzhen, and before
late-March in Hubei. The model can also be useful to predict the trend of epidemic and provide
quantitative guide for other counties in a high risk of outbreak, such as South Korea, Japan and
Iran.
Keywords: Coronavirus disease 2019, SARS-CoV-2, epidemic model
Introduction1
The outbreak of coronavirus disease 2019 (COVID-19) was initially identified in mid-December2
2019 in Wuhan, China (1; 2). The earliest patients in Wuhan are related to exposure from a seafood3
market. Later, the number of patients grows drastically due to human-to-human transmission (3).4
The incubation period of COVID-19 is reported to be 3-7 days, at most 14 days, which varies5
greatly among patients (4). The novel coronavirus is believed to be infectious during incubation6
period when no symptoms are shown on the patients (5), an important characteristics differentiating7
COVID-19 from its close relative SARS. Considerable measures have been implemented to control8
the outbreak in Wuhan and China, mainly by quarantine to reduce transmission. On Jan 23rd,9
2019, Wuhan restricted travel outside the city. Any person exposed to COVID-19 is required to10
perform a self-isolation for 14 days. Around Jan 25rd, 2019, nucleic acid kit was developed to11
diagnose the patients. On Feb 12th, 2020, clinical diagnosis was used to assist the confirmation of12
infection in Hubei province. Nonetheless, COVID-19 has spread to all provinces of China and more13
than 30 other countries in the last two months(6; 7).14
COVID-19 has three features that make it hard to describe with the existing epidemic models15
including SIR, SEIR etc (8; 9). Firstly, COVID-19 has a relatively long incubation period which16
causes a time delay between real dynamic and the daily observed case numbers. Secondly, the17
epidemic trend heavily depends on multiple artificial factors, including local medical resources,18
quarantine measures, and the efficiency of conformation approaches, which should be explicitly19
modeled. For example, the outbreak is more severe in Wuhan compared to other cities in China20
which constrains the medical resources, therefore the infected need a longer time to be confirmed21
and reported in the official released numbers. This potentially leads to a larger difference between22
real and reported infected cases in Wuhan than in other places. This could also explain why23
a sudden increase of confirmed infected cases was observed when clinical diagnosis was adopted24
in confirmation in Wuhan. Lastly, the quarantine measures are widely implemented, and the25
quarantined have a lower chance to infect the susceptible individuals. This is critical for controlling26
2
. CC-BY-NC-ND 4.0 International licenseIt is made available under a author/funder, who has granted medRxiv a license to display the preprint in perpetuity.
is the(which was not peer-reviewed) The copyright holder for this preprint .https://doi.org/10.1101/2020.02.27.20028639doi: medRxiv preprint

the spread across China.1
The characteristics of COVID-19 outbreak and control are distinct from existing infectious2
diseases, and the existing epidemic models cannot be applied to describe the observed data directly.3
We thus propose to use a simple SUQC model (Susceptible, Un-quarantined infected, Quarantined4
infected, Confirmed infected). SUQC distinguishes the infected individuals to be un-quarantined,5
quarantined but not confirmed, and confirmed. Among the three types, the confirmed number is6
the data we can directly observe from the official released report. Only un-quarantined infected7
have ability to infect susceptible individuals and affect the development of the epidemic. In our8
proposed model, the quarantine rate parameter is used to quantify the strength of quarantine9
policy on the development of epidemics, and the confirmation rate parameter is used to measure10
the efficiency of confirmation based on the released data. The two parameters can solve from fitting11
the observed confirmed cases over time. Note that the model contains only four variables and three12
parameters to model both artificial factors and characteristics of epidemics using the data we can13
directly observe. We expect that the simplified model will not over fit the data given the short14
time span, but will adequately characterize the essential dynamics.15
We apply the SUQC model to the daily released numbers of confirmed cases in Wuhan city,16
Hubei province (excluding Wuhan), China (excluding Hubei) and four first-tier cities: Beijing,17
Shanghai, Guangzhou and Shenzhen. The parameters of the model were inferred, and used to18
predict the future trends of epidemics in China.19
Method20
SUQC model21
SUQC takes into account the following novel epidemic features of COVID-19: (1) the epidemic22
has an infection probability during the incubation (presymptomatic) period; (2) various isolation23
measures are used to control the development of the epidemic; (3) the main data source is the daily24
confirmed infected number released in the official report, which is affected by the detection method25
and has a delay between the real infected and confirmed infected number. Four variables related26
to the features are used to model the the flows of people between four possible states:27
S = S(t), the number of susceptible individuals with no resistance to disease in the population.28
S is the same as that in existing infectious disease models, e.g. SIR and SEIR.29
U = U(t), the number of infected and un-quarantined individuals that can be either presymp-30
tomatic or symptomatic. Different from E in the SEIR model, U are infectious, and can render a31
3
. CC-BY-NC-ND 4.0 International licenseIt is made available under a author/funder, who has granted medRxiv a license to display the preprint in perpetuity.
is the(which was not peer-reviewed) The copyright holder for this preprint .https://doi.org/10.1101/2020.02.27.20028639doi: medRxiv preprint

susceptible to be un-quarantined infected.1
Q = Q(t), the number of quarantined infected individuals. The un-quarantined infected become2
Quarantined infected by isolation or hospitalization, and lose the ability of infecting the susceptible.3
C = C(t), the number of confirmed infected cases. The number of confirmed infected is released4
by the official agency or media, which may be the only variable with observation that we can5
access. Note that C is usually smaller than the number of real infected individuals, due to the6
limited sensitivity of diagnosis methods. The duration of incubation can also cause a time delay of7
confirmation. Nevertheless, C is also the number useful for monitoring and predicting the trend of8
epidemic dynamics.9
Besides the aforementioned variables, we have a composite variable I(t) = U(t) +Q(t) + C(t),10
representing the real cumulative number of infected individuals at time t. The limitation of detec-11
tion methods and the medical resources can greatly delay the confirmation process, insomuch the12
confirmation proportion C/I is less than 1 and time-varying.13
R, the number of removed individuals, is not included in the model as in the SIR/SEIR models.14
Once the infected are quarantined, we assume their probability of infecting susceptible individuals15
is zero, and thus no matter the infected are recovered or not, they have no affect on the dynamics16
of the epidemic system.17
The model comprises the following independent parameters:18
α is the infection rate, the mean number of new infected caused by an un-quarantined infected19
per day. α ∈ [0,∞).20
γ1 is the quarantine rate for an un-quarantined infected being quarantined, with the range21
γ1 ∈ [0, 1]. The quarantines can be centralized isolation, self isolation, hospitalization and so on.22
It is a parameter representing multi-resource measures to reduce infection caused by U .23
γ2, the conformation rate of Q, is the probability that the quarantined infected are identified24
to be confirmatory cases by a conventional method, such as the laboratory diagnosis, with the25
range γ2 ∈ [0, 1]. γ2 is affected by the incubation period duration, medical conditions, accuracy of26
laboratory tests, and other artificial factors such as the time delay between case confirmation and27
the official release. γ2 is time-varying since the change of diagnosis criterion and the improvement28
of nucleic acid test can accelerate the confirming process.29
σ is the subsequent confirmation rate of those infected that are not confirmed by the conventional30
methods, but confirmed with some additional tests. If no other special approaches used, σ is set to31
0. Combing two sources of confirmation approaches, β = γ2 + (1 − γ2)σ is the total confirmation32
4
. CC-BY-NC-ND 4.0 International licenseIt is made available under a author/funder, who has granted medRxiv a license to display the preprint in perpetuity.
is the(which was not peer-reviewed) The copyright holder for this preprint .https://doi.org/10.1101/2020.02.27.20028639doi: medRxiv preprint

rate.1
δ is the confirmation rate of the un-quarantined infected who can be identified as confirmed2
infected without being quarantined.3
We thus set up a set of ODE equations to model the dynamics of an infectious disease and4
the control by artificial factors (Eqn. 1). In the model, U goes directly to C, or go through Q5
indirectly. Actually, the former can be viewed as a special case of the later with zero delay time6
during Q→ C. Thus we delete the direct way and simplified the model as Eqn. 2.7
dSdt = −αU(t)S(t)/N
dUdt = −αU(t)S(t)/N − γ1U(t)− (1− γ1)δU(t)
dQdt = γ1U(t)−
(γ2 + (1− γ2)σ
)Q(t)
dCdt =
(γ2 + (1− γ2)σ
)Q(t) + (1− γ1)δU(t)
(1)
dSdt = −αU(t)S(t)/N
dUdt = −αU(t)S(t)/N − γ1U(t)
dQdt = γ1U(t)−
(γ2 + (1− γ2)σ
)Q(t)
dCdt =
(γ2 + (1− γ2)σ
)Q(t)
(2)
From the above SUQC model, we can further define some biologically meaningful parameters,8
for monitoring and predicting the trend of disease:9
T = 1/γ1 is the mean waiting time from quarantine to confirmation; w = 1/(γ2 + (1 − γ2)σ)10
5
. CC-BY-NC-ND 4.0 International licenseIt is made available under a author/funder, who has granted medRxiv a license to display the preprint in perpetuity.
is the(which was not peer-reviewed) The copyright holder for this preprint .https://doi.org/10.1101/2020.02.27.20028639doi: medRxiv preprint
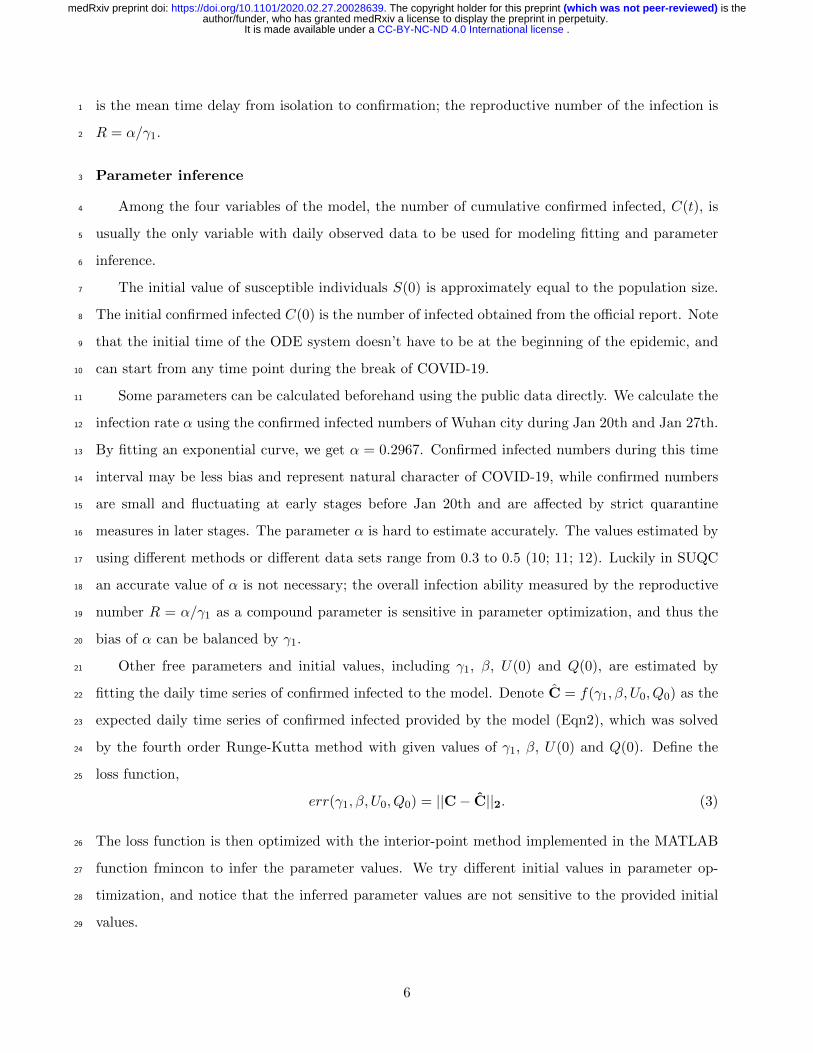
is the mean time delay from isolation to confirmation; the reproductive number of the infection is1
R = α/γ1.2
Parameter inference3
Among the four variables of the model, the number of cumulative confirmed infected, C(t), is4
usually the only variable with daily observed data to be used for modeling fitting and parameter5
inference.6
The initial value of susceptible individuals S(0) is approximately equal to the population size.7
The initial confirmed infected C(0) is the number of infected obtained from the official report. Note8
that the initial time of the ODE system doesn’t have to be at the beginning of the epidemic, and9
can start from any time point during the break of COVID-19.10
Some parameters can be calculated beforehand using the public data directly. We calculate the11
infection rate α using the confirmed infected numbers of Wuhan city during Jan 20th and Jan 27th.12
By fitting an exponential curve, we get α = 0.2967. Confirmed infected numbers during this time13
interval may be less bias and represent natural character of COVID-19, while confirmed numbers14
are small and fluctuating at early stages before Jan 20th and are affected by strict quarantine15
measures in later stages. The parameter α is hard to estimate accurately. The values estimated by16
using different methods or different data sets range from 0.3 to 0.5 (10; 11; 12). Luckily in SUQC17
an accurate value of α is not necessary; the overall infection ability measured by the reproductive18
number R = α/γ1 as a compound parameter is sensitive in parameter optimization, and thus the19
bias of α can be balanced by γ1.20
Other free parameters and initial values, including γ1, β, U(0) and Q(0), are estimated by21
fitting the daily time series of confirmed infected to the model. Denote C = f(γ1, β, U0, Q0) as the22
expected daily time series of confirmed infected provided by the model (Eqn2), which was solved23
by the fourth order Runge-Kutta method with given values of γ1, β, U(0) and Q(0). Define the24
loss function,25
err(γ1, β, U0, Q0) = ||C− C||2. (3)
The loss function is then optimized with the interior-point method implemented in the MATLAB26
function fmincon to infer the parameter values. We try different initial values in parameter op-27
timization, and notice that the inferred parameter values are not sensitive to the provided initial28
values.29
6
. CC-BY-NC-ND 4.0 International licenseIt is made available under a author/funder, who has granted medRxiv a license to display the preprint in perpetuity.
is the(which was not peer-reviewed) The copyright holder for this preprint .https://doi.org/10.1101/2020.02.27.20028639doi: medRxiv preprint
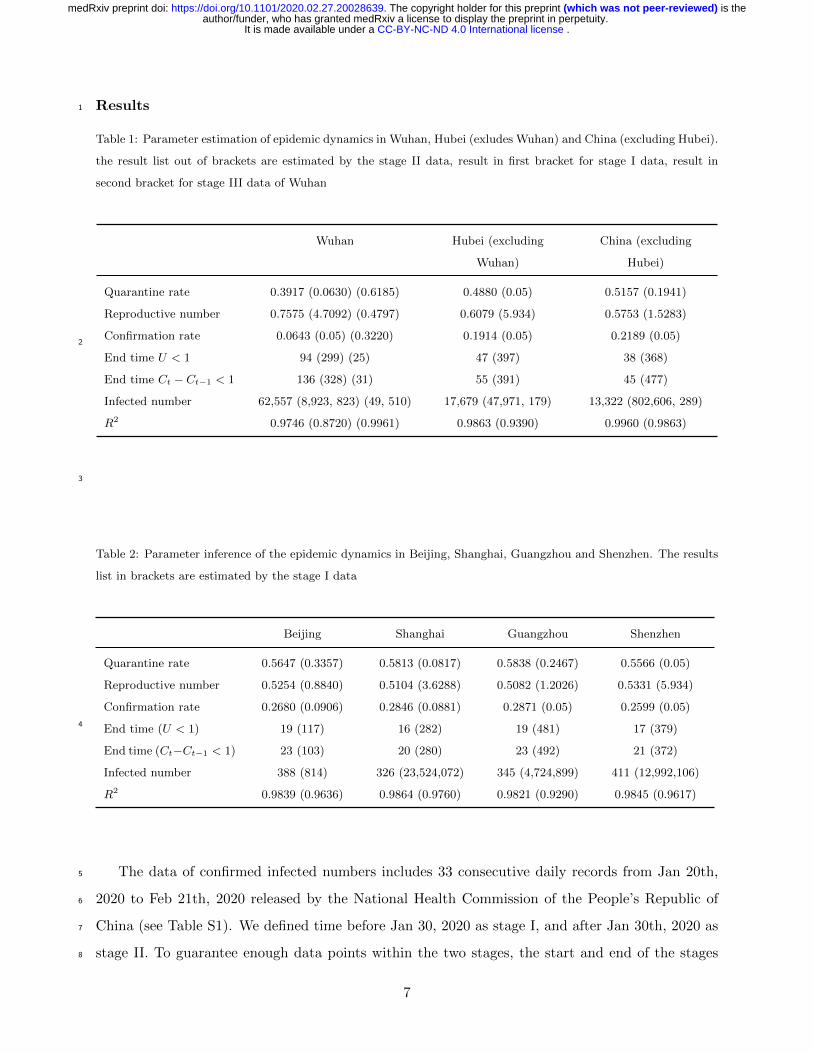
Results1
Table 1: Parameter estimation of epidemic dynamics in Wuhan, Hubei (exludes Wuhan) and China (excluding Hubei).
the result list out of brackets are estimated by the stage II data, result in first bracket for stage I data, result in
second bracket for stage III data of Wuhan
Wuhan Hubei (excluding
Wuhan)
China (excluding
Hubei)
Quarantine rate 0.3917 (0.0630) (0.6185) 0.4880 (0.05) 0.5157 (0.1941)
Reproductive number 0.7575 (4.7092) (0.4797) 0.6079 (5.934) 0.5753 (1.5283)
Confirmation rate 0.0643 (0.05) (0.3220) 0.1914 (0.05) 0.2189 (0.05)
End time U < 1 94 (299) (25) 47 (397) 38 (368)
End time Ct − Ct−1 < 1 136 (328) (31) 55 (391) 45 (477)
Infected number 62,557 (8,923, 823) (49, 510) 17,679 (47,971, 179) 13,322 (802,606, 289)
R2 0.9746 (0.8720) (0.9961) 0.9863 (0.9390) 0.9960 (0.9863)
2
3
Table 2: Parameter inference of the epidemic dynamics in Beijing, Shanghai, Guangzhou and Shenzhen. The results
list in brackets are estimated by the stage I data
Beijing Shanghai Guangzhou Shenzhen
Quarantine rate 0.5647 (0.3357) 0.5813 (0.0817) 0.5838 (0.2467) 0.5566 (0.05)
Reproductive number 0.5254 (0.8840) 0.5104 (3.6288) 0.5082 (1.2026) 0.5331 (5.934)
Confirmation rate 0.2680 (0.0906) 0.2846 (0.0881) 0.2871 (0.05) 0.2599 (0.05)
End time (U < 1) 19 (117) 16 (282) 19 (481) 17 (379)
End time (Ct−Ct−1 < 1) 23 (103) 20 (280) 23 (492) 21 (372)
Infected number 388 (814) 326 (23,524,072) 345 (4,724,899) 411 (12,992,106)
R2 0.9839 (0.9636) 0.9864 (0.9760) 0.9821 (0.9290) 0.9845 (0.9617)
4
The data of confirmed infected numbers includes 33 consecutive daily records from Jan 20th,5
2020 to Feb 21th, 2020 released by the National Health Commission of the People’s Republic of6
China (see Table S1). We defined time before Jan 30, 2020 as stage I, and after Jan 30th, 2020 as7
stage II. To guarantee enough data points within the two stages, the start and end of the stages8
7
. CC-BY-NC-ND 4.0 International licenseIt is made available under a author/funder, who has granted medRxiv a license to display the preprint in perpetuity.
is the(which was not peer-reviewed) The copyright holder for this preprint .https://doi.org/10.1101/2020.02.27.20028639doi: medRxiv preprint

may vary by one or twos days. Wuhan has recently undergone stricter measures of quarantine and1
transmission limiting, and clinical diagnosis was adopted after Feb 12th, we thus further did a stage2
III analysis of the dynamics in Wuhan using data after Feb 13th.3
Remarkable difference among trends inferred from three-stage data4
Figure 1 shows the inference and prediction of epidemic dynamics of Wuhan using stage I, II5
and III data respectively. The first 15 daily data points (from Jan 28th to Feb 11th) of stage II were6
used to fit the model and infer parameters. The following 10 daily data points were used as test data7
for evaluating the performance of the model. in Figure 1(B), the blue curve presents the model8
fitting result; blue dots present the predicted numbers of the confirmed infected with the fitted9
model; and red dots are the observed number of the confirmed. Note that the reported numbers10
of confirmed are based on nucleic acid diagnosis before Feb 12th; both results of nucleic acid and11
clinical diagnosis are provided from Feb 12th to 14th, and only the total confirmed numbers of12
the two diagnoses are provided from Feb 15th to 21th. By comparing with three daily data points13
of the nucleic acid diagnosis, we can see the fitted model predicts the trend well. The predicted14
numbers of all infected (I(t)) are also plotted in Figure 1(B). We can see big gap between the15
predicted numbers of total infected and the predicted numbers of confirmed infected in Wuhan.16
Clinical diagnosis is adopted by Wuhan local medical agency as an additional diagnosis criterion17
after Feb 12th, increasing the confirmation rate and causing a big boost of the number of confirmed18
infected. Note that a proportion of the total infected still remains unidentified even with clinical19
diagnosis.20
With the inferred parameters, we further plot the long-term predictions of the numbers of21
total infected (I), un-quarantined infected (U), quarantined infected (Q) and cumulative Confirmed22
infected (C) in Wuhan (Figure 1(A)). The end time (increment of confirmed infected equals zero)23
is predicted to be 136 days from Jan 28th, 2020. The total number of infected individuals is 62, 57724
(Table 1).25
We can do a similar analysis using stage I data of Wuhan. The stage I data is informative for26
predicting the epidemic trend assuming no rigorous quarantine and control measures. The first 1027
daily data points (from Jan 20th) were used to infer the parameters. The rest data points were used28
to test the performance of the model (Figure 1(C-D)). As clearly seen in Figure 1(C), the predicted29
numbers of C(t) andI(t) increase dramatically, which are far beyond the observed numbers after30
Jan 21. The number of total infected can be as large as 8, 923, 823, and the epidemic lasts for a31
8
. CC-BY-NC-ND 4.0 International licenseIt is made available under a author/funder, who has granted medRxiv a license to display the preprint in perpetuity.
is the(which was not peer-reviewed) The copyright holder for this preprint .https://doi.org/10.1101/2020.02.27.20028639doi: medRxiv preprint

much longer time (299 days, see Table 1). The dramastic difference between predictions from stage1
I and stage II data indicates the preventing measures and quarantines, such as travel restrict, are2
very efficient in controlling the outburst of the epidemic.3
Since more strict quarantine and traffic control measures were executed recently to inhibit the4
infection of COVID-19 in Wuhan and clinical diagnosis was adopted after Feb 12th, we also analyzed5
the stage III data (from Feb 13th). The estimated quarantine rate is 0.6185, much higher than that6
of 0.3917 estimated based on stage II data. The total number of infected individuals is estimated7
to be 49, 510, indicating a further acceleration of the epidemic end (Table 1).8
Similar analysis was accomplished on stage I and II data of Hubei province (excluding Wuhan),9
the whole country (excluding Hubei), and four tier-1 cities in China (Figures 2-3, S1-S4, Tables10
1-2). Overall, the model predictions are in high accuracy. We see similar trends in these regions:11
the predicted numbers of infected are distinct between results from the two stage data, indicating12
the necessity and efficiency of quarantine and control measures. We note that even with stage I13
data, Beijing have a reproductive number smaller than 1 (Figure S1, Table 2, 0.8840), indicating14
an early-stage prompt and effective response to COVID-19.15
Confirmation rate. From Figures 2-3, S1-S4, we notice that the difference between C(t)16
and I(t) in Wuhan is the biggest. Wuhan has the most infected individuals than any other places17
in China (more than 50%), highly beyond the limit of local clinical resources, leading to a long18
waiting time for confirmation, and the lowest confirmation rate of 0.0643 in Wuhan, compared with19
0.1914 of Hubei (excluding Wuhan), 0.2189 of China (excluding Hubei), 0.2680 of Beijing , 0.284620
of Shanghai, 0.2871 of Guangzhou, and 0.2599 of Shenzhen. As predicted by the model, 26, 81021
quarantined infected haven’t been confirmed in Wuhan by Feb 11th, 2020. The confirmation rate of22
Wuhan increases to 0.3229 (Table 1) after Feb 12th when clinical diagnosis was adopted in Wuhan.23
Quarantine rate and reproductive number. At stage II, Wuhan has the smallest quar-24
antine rate (0.3917) compared to the other six regions (all close to or larger than 0.5). This leads25
to a larger reproductive number (R = α/γ1). The reproductive number of Wuhan decreases from26
of 0.7575 at stage II to 0.4797 at stage III. Based on reproductive numbers, the epidemic all over27
China is apparently under control.28
Un-quarantined. The un-quarantined individuals are the source of new infection. Using stage29
II data, the estimated number of U(t) individuals in Wuhan (Figure 1(A)) on Feb 12th is still as30
high as 3, 509. The person-to-person transmission will last for more than two months to early May31
2020. However, estimated with stage III data, the quarantine rate of Wuhan increases to 0.618532
9
. CC-BY-NC-ND 4.0 International licenseIt is made available under a author/funder, who has granted medRxiv a license to display the preprint in perpetuity.
is the(which was not peer-reviewed) The copyright holder for this preprint .https://doi.org/10.1101/2020.02.27.20028639doi: medRxiv preprint

and the un-quarantined infected individuals decreased to 334 on Feb 21th, 2020 (Figure 1(E)).1
Predictions2
After fitting the model with the recent data from stage II and stage III (for Wuhan), we make3
a series of predictions about future dynamics of the COVID-19 outbreak in China.4
• The end times of the epidemic (with zero new confirmed infected as the criterion) of Wuhan5
and Hubei (excluding Wuhan) are around late-March, and around mid-March of China. The6
end times of the four first-tier cities, Beijing, Shanghai, Guangzhou and Shenzhen, are before7
March. The end time with zero un-quarantined infected as a criterion is usually earlier than8
that with zero new confirmed infected.9
• The final infected number of the whole country is predicted to be 80, 511 individuals, among10
which 49, 510 are from Wuhan and 17, 679 from Hubei (excluding Wuhan), and the rest 13, 32211
are from other regions of China.12
• Given the inferred end times, rigorous quarantine and control measures should be kept be-13
fore March in Beijing, Shanghai, Guangzhou and Shenzhen, and before late-March in China14
(including Hubei). We should further point out that, the real confirmed infected in Beijing15
(Figure S1(B)), Shanghai (Figure S2(B)) and Shenzhen (Figure S4(B)) are a bit larger than16
the predicted values by our model. This is likely caused by the recent return-to-work tide17
after the traditional Chinese Spring festival.18
Discussion19
We developed a model SUQC for the epidemic dynamics and control of COVID-19. SUQC uses20
four variables and as less parameters as possible to avoid over-fitting the data, while adequately21
characterizes the epidemic dynamics. The model is different from the well-known epidemic SEIR22
model in the following aspects: (1) the infected individuals are classified into un-quarantined, quar-23
antined and confirmed. And only the un-quanrantined can infect the susceptible individuals; While24
in SEIR, all the infected are infectious; (2) the quarantine rate is a parameter in SUQC to explic-25
itly model the effects of quarantine and control measures; (3) SUQC distinguishes the confirmed26
infected (observed data) and the total infected individuals, and the parameter confirmation rate is27
affected by medical resources and the sensitivity of diagnosis methods. Overall, SUQC is developed28
10
. CC-BY-NC-ND 4.0 International licenseIt is made available under a author/funder, who has granted medRxiv a license to display the preprint in perpetuity.
is the(which was not peer-reviewed) The copyright holder for this preprint .https://doi.org/10.1101/2020.02.27.20028639doi: medRxiv preprint

0 20 40 60 80 100 120
Time (unit: day, from 2020-1-28)
0
1
2
3
4
5
6
7In
div
idu
al n
um
be
r×10
4
U (Unquarantined infected)
Q (Quarantined infected)
C (Confirmed infected)
I (Infected, all)
(A)
0 5 10 15 20 25
Time (unit: day, from 2020-1-28)
0
1
2
3
4
5
6
7
Cu
mu
lative
co
nfirm
ed
in
fecte
d n
um
be
r ×104
Real confirmed infected (including clinical diagnosis)
Real confirmed infected (excluding clinical diagnosis)
Model fitting of the confirmed infected
Prediction of the confirmed infected
Prediction of all the infected
(B)
0 100 200 300 400 500
Time (unit: day, from 2020-1-20)
0
2
4
6
8
10
Ind
ivid
ua
l n
um
be
r
×106
U (Unquarantined infected)
Q (Quarantined infected)
C (Confirmed infected)
I (Infected, all)
(C)
0 5 10 15 20 25 30
Time (unit: day, from 2020-1-20)
0
0.5
1
1.5
2
2.5
3
Cu
mu
lative
co
nfirm
ed
in
fecte
d n
um
be
r ×105
Real confirmed infected
Model fitting of the confirmed infected
Prediction of the confirmed infected
Prediction of all the infected
(D)
0 10 20 30 40
Time (unit: day, from 2020-2-13)
0
1
2
3
4
5
Ind
ivid
ua
l n
um
be
r
×104
U (Unquarantined infected)
Q (Quarantined infected)
C (Confirmed infected)
I (Infected, all)
(E)
0 2 4 6 8 10 12 14
Time (unit: day, from 2020-2-13)
0
1
2
3
4
5
6
7
Cu
mu
lative
co
nfirm
ed
in
fecte
d n
um
be
r ×104
Real confirmed infected
Model fitting of the confirmed infected
Prediction of the confirmed infected
Prediction of all the infected
(F)
Figure 1: Inferring the epidemic dynamics in Wuhan: (A) prediction using stage II data; (B)Model-fitting and testingwith stage II data. The first 15 data points (from Jan 28th) are used to infer the parameters, and the remainingpoints are used to test the model performance. (C) prediction using stage I data; (D) Model-fitting and testing withstage I data, the first 10 data points (from Jan 20th) are used to infer the parameters, and the remaining points areused to test the model; (E) prediction using stage III data; (D) Model-fitting and testing with stage III data. Thefirst 7 data points (from Jan 23th) are used to infer the parameters, and the remaining points are used to test themodel.
11
. CC-BY-NC-ND 4.0 International licenseIt is made available under a author/funder, who has granted medRxiv a license to display the preprint in perpetuity.
is the(which was not peer-reviewed) The copyright holder for this preprint .https://doi.org/10.1101/2020.02.27.20028639doi: medRxiv preprint

0 20 40 60 80 100 120
Time (unit: day, from 2020-1-28)
0
0.5
1
1.5
2
Ind
ivid
ua
l n
um
be
r
×104
U (Unquarantined infected)
Q (Quarantined infected)
C (Confirmed infected)
I (Infected, all)
(A)
0 5 10 15 20 25
Time (unit: day, from 2020-1-28)
0
0.5
1
1.5
2
2.5
3
Cu
mu
lative
co
nfirm
ed
in
fecte
d n
um
be
r ×104
Real confirmed infected (including clinical diagnosis)
Real confirmed infected (excluding clinical diagnosis)
Model fitting of the confirmed infected
Prediction of the confirmed infected
Prediction of all the infected
(B)
0 100 200 300 400 500
Time (unit: day, from 2020-1-20)
0
1
2
3
4
5
Ind
ivid
ua
l n
um
be
r
×107
U (Unquarantined infected)
Q (Quarantined infected)
C (Confirmed infected)
I (Infected, all)
(C)
0 5 10 15 20 25 30
Time (unit: day, from 2020-1-20)
0
1
2
3
4
Cu
mu
lative
co
nfirm
ed
in
fecte
d n
um
be
r ×105
Real confirmed infected
Model fitting of the confirmed infected
Prediction of the confirmed infected
Prediction of all the infected
(D)
Figure 2: Inferring the epidemic dynamics in Hubei province (excluding Wuhan): (A) prediction using stage II data;(B)model-fitting and testing with stage II data. The first 15 data points (from Jan 28th) are used to infer theparameters, and the remaining points are used to test the model performance; (C) prediction using stage I data; (D)model-fitting and testing with stage I data. The first 10 data points (from Jan 20th) are used to infer the parameters,and the remaining points are used to test the model.
12
. CC-BY-NC-ND 4.0 International licenseIt is made available under a author/funder, who has granted medRxiv a license to display the preprint in perpetuity.
is the(which was not peer-reviewed) The copyright holder for this preprint .https://doi.org/10.1101/2020.02.27.20028639doi: medRxiv preprint

0 20 40 60 80 100
Time (unit: day, from 2020-1-30)
0
2000
4000
6000
8000
10000
12000
14000
Ind
ivid
ua
l n
um
be
r
U (Unquarantined infected)
Q (Quarantined infected)
C (Confirmed infected)
I (Infected, all)
(A)
0 5 10 15 20 25
Time (unit: day, from 2020-1-30)
2000
4000
6000
8000
10000
12000
14000
Cu
mu
lative
co
nfirm
ed
in
fecte
d n
um
be
r
Real confirmed infected
Model fitting of the confirmed infected
Prediction of the confirmed infected
Prediction of all the infected
(B)
0 100 200 300 400 500
Time (unit: day, from 2020-1-20)
0
2
4
6
8
10
Ind
ivid
ua
l n
um
be
r
×108
U (Unquarantined infected)
Q (Quarantined infected)
C (Confirmed infected)
I (Infected, all)
(C)
0 5 10 15 20 25 30
Time (unit: day, from 2020-1-20)
0
2
4
6
8
Cu
mu
lative
co
nfirm
ed
in
fecte
d n
um
be
r ×104
Real confirmed infected
Model fitting of the confirmed infected
Prediction of the confirmed infected
Prediction of all the infected
(D)
Figure 3: Inferring epidemic dynamics in China (excluding Hubei province): (A) prediction using stage II data;(B) model-fitting and testing with stage II data. The first 15 data points (from Jan 30th) are used to optimise theparameters, and the remaining points are used to test the model; (C) prediction using stage I data; (D) Model-fittingand testing with stage I data. The first 10 data points (from Jan 20th) are used to optimise the parameters, and theremaining points are used to test the model.
13
. CC-BY-NC-ND 4.0 International licenseIt is made available under a author/funder, who has granted medRxiv a license to display the preprint in perpetuity.
is the(which was not peer-reviewed) The copyright holder for this preprint .https://doi.org/10.1101/2020.02.27.20028639doi: medRxiv preprint

to characterize the dynamics of COVID-19, and is more suitable for analysis and prediction than1
adopting existing epidemic models.2
SUQC is applied to the daily released data of China to analyze the dynamics of COVID-193
outbreak, and demonstrates an accurate prediction of the trends with the test data. COVID-194
has currently spread to more than 30 countries. Some countries, such as, South Korea, Japan and5
Iran are in their early stage of an outbreak while being under a high risk, and the governments are6
attempting to minimise further spread. SUQC can serve as a useful tool for quantifying parameters7
and variables concerning the effects of quarantine or confirmation methods on the epidemic, and8
further provide guidance on the control of the outbreak in these countries.9
Acknowledgements10
We thank Yongbiao Xue and Liping Wang for motivating this project. This project was sup-11
ported by the National Natural Science Foundation of China (Grant No. 31571370, 91631106, and12
91731302), the “Strategic Priority Research Program” of the Chinese Academy of Sciences (Grant13
No. XDB13000000), the National Key R&D Program of China (Grant No. 2018YFC1406902), and14
the One Hundred Talents Program of the Chinese Academy of Sciences.15
References16
[1] Wuhan Municipal Health Commission. Wuhan Municipal Health Commission brief-17
ing on the pneumonia epidemic situation 31 Dec 2019 [in Chinese]. Available at:18
http://wjw.wuhan.gov.cn/front/web/showDetail/2019123108989 (Accessed: 23 February19
2020)20
[2] Wang C, Horby PW, Hayden FG, Gao GF (2020) A novel coronavirus outbreak of global21
health concern. Lancet.https://doi.org/10.1016/S0140-6736(20)30185-922
[3] Chan JF-W, Yuan S, Kok K-H et al (2020) A familial cluster of pneumonia as-23
sociated with the 2019 novel coronavirus indicating person-to-person transmission:24
Lancet.https://doi.org/10.1016/S0140-6736(20)30154-925
[4] A study of a family cluster. Wang C, Horby PW, Hayden FG, Gao GF (2020) A26
novel coronavirus outbreak of global health concern. Lancet.https://doi.org/10.1016/S0140-27
6736(20)30185-928
14
. CC-BY-NC-ND 4.0 International licenseIt is made available under a author/funder, who has granted medRxiv a license to display the preprint in perpetuity.
is the(which was not peer-reviewed) The copyright holder for this preprint .https://doi.org/10.1101/2020.02.27.20028639doi: medRxiv preprint

[5] National Health Commission of the People’s Republic of China. In-1
fectious Disease Specialists. Prevention and control of novel coron-2
avirus pneumonia (The Fifth Edition), [in Chinese]. Available at:3
http://www.nhc.gov.cn/jkj/s3577/202002/a5d6f7b8c48c451c87dba14889b30147.shtml (Ac-4
cessed: 23 February 2020)5
[6] Du Z, Wang L, Chauchemez S, Xu X, Wang X, Cowling BJ, et al (2020) Risk for transportation6
of 2019 novel coronavirus disease from Wuhan to other cities in China. Emerg Infect Dis.7
https://doi.org/10.3201/eid2605.200146 (Accessed: 23 February 2020)8
[7] Li Q, Guan X, Wu P, Wang X, Zhou L, Tong Y, et al (2020) Early transmission dynamics9
in Wuhan, China, of novel coronavirus–infected pneumonia. N Engl J Med. NEJMoa2001316;10
Epub ahead of print.11
[8] Juliette Stehle, Nicolas Voirin, Alain Barrat, et al. Simulation of an SEIR infectious disease12
model on the dynamic contact network of conference attendees[J]. 9(1):87.13
[9] Fisman D , Khoo E , Tuite A . Early Epidemic Dynamics of the West African 2014 Ebola14
Outbreak: Estimates Derived with a Simple Two-Parameter Model[J]. PLoS Currents, 2014,15
6.16
[10] Imai N, Cori A, Dorigatti I, et al (2020) Report 3: Transmissibility of 2019-n-CoV.17
Available at: https://www.imperial.ac.uk/media/imperial-college/medicine/sph/ide/gida-18
fellowships/Imperial-2019-nCoV-transmissibility.pdf (Accessed: 23 February 2020).19
[11] Liu T, Hu J, Kang M. et al (2020) ‘Transmission dynamics of 2019 novel coronavirus (2019-20
nCoV)’, bioRxiv. doi: 10.1101/2020.01.25.919787.21
[12] Majumder, M. and Mandl, K. D (2020) ‘Early Transmissibility Assessment of a Novel Coron-22
avirus in Wuhan, China’. Available at: https://papers.ssrn.com/abstract=3524675 (Accessed:23
23 February 2020).24
15
. CC-BY-NC-ND 4.0 International licenseIt is made available under a author/funder, who has granted medRxiv a license to display the preprint in perpetuity.
is the(which was not peer-reviewed) The copyright holder for this preprint .https://doi.org/10.1101/2020.02.27.20028639doi: medRxiv preprint