Modeling sRNA-dependent circuits
33
QUANTITATIVE MODELING OF GENETIC CIRCUITS INTEGRATING TRANSCRIPTIONAL AND S RNA MEDIATED REGULATIONS Matteo Brilli INRIA -RHONE-ALPES LBBE UMR CNRS 5558 UNIV-LYON1 Trento November 27, 2012 (INRIA, CNRS, UNIV-LYON1) MODELING INTEGRATED GENETIC CIRCUITS NOVEMBER 27, 2012 1 / 31
-
Upload
matteo-brilli -
Category
Science
-
view
242 -
download
0
Transcript of Modeling sRNA-dependent circuits
QUANTITATIVE MODELING OF GENETIC CIRCUITS
INTEGRATING TRANSCRIPTIONAL AND SRNAMEDIATED REGULATIONS
Matteo Brilli
INRIA - RHONE-ALPESLBBE
UMR CNRS 5558UNIV-LYON1
Trento November 27, 2012
(INRIA, CNRS, UNIV-LYON1) MODELING INTEGRATED GENETIC CIRCUITS NOVEMBER 27, 2012 1 / 31

TOC
1 INTRODUCTION
2 EXAMPLES
3 BASICS OF MATHEMATICAL MODELING
4 NETWORK MOTIFS AND THEIR DYNAMICAL PROPERTIES
5 MODELING SRNA REGULATIONDynamical properties of sRNA-transcription integrated circuits
(INRIA, CNRS, UNIV-LYON1) MODELING INTEGRATED GENETIC CIRCUITS NOVEMBER 27, 2012 2 / 31
INTRODUCTION
INTRODUCTION
GENERAL FEATURES
1 sRNAs are today recognized as pivotal post-transcriptional regulators;
2 size ranges from 50 to a few hundreds nucleotides;
3 the majority modulate gene expression by direct base-pairing with targetmRNA;
4 regulation is predominantly negative;
5 increasing evidence of multiple targets per sRNA.
(INRIA, CNRS, UNIV-LYON1) MODELING INTEGRATED GENETIC CIRCUITS NOVEMBER 27, 2012 3 / 31
INTRODUCTION
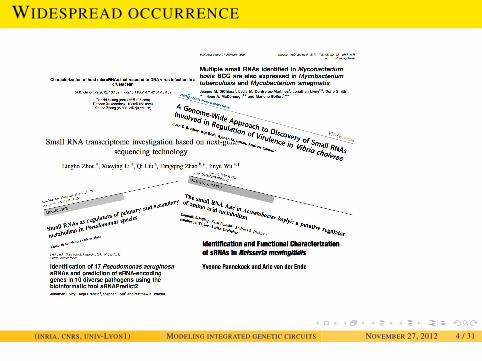
WIDESPREAD OCCURRENCE
(INRIA, CNRS, UNIV-LYON1) MODELING INTEGRATED GENETIC CIRCUITS NOVEMBER 27, 2012 4 / 31
INTRODUCTION
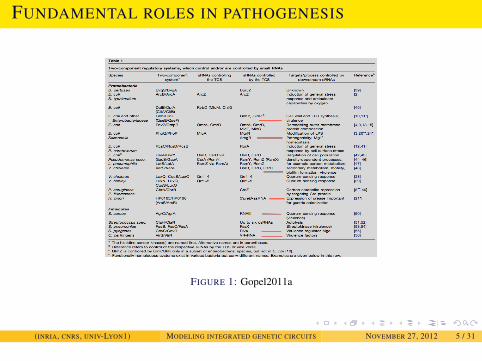
FUNDAMENTAL ROLES IN PATHOGENESIS
FIGURE 1: Gopel2011a
(INRIA, CNRS, UNIV-LYON1) MODELING INTEGRATED GENETIC CIRCUITS NOVEMBER 27, 2012 5 / 31
INTRODUCTION
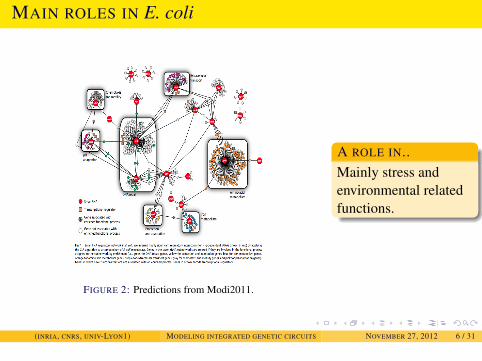
MAIN ROLES IN E. coli
FIGURE 2: Predictions from Modi2011.
A ROLE IN..Mainly stress andenvironmental relatedfunctions.
(INRIA, CNRS, UNIV-LYON1) MODELING INTEGRATED GENETIC CIRCUITS NOVEMBER 27, 2012 6 / 31
INTRODUCTION
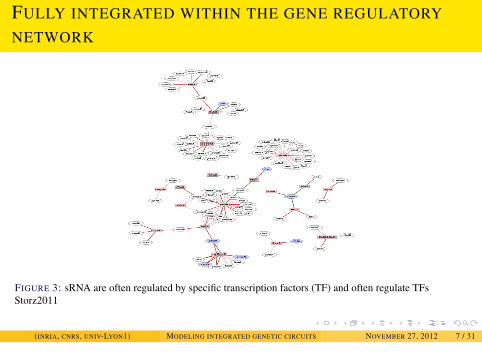
FULLY INTEGRATED WITHIN THE GENE REGULATORY
NETWORK
FIGURE 3: sRNA are often regulated by specific transcription factors (TF) and often regulate TFsStorz2011
(INRIA, CNRS, UNIV-LYON1) MODELING INTEGRATED GENETIC CIRCUITS NOVEMBER 27, 2012 7 / 31
INTRODUCTION
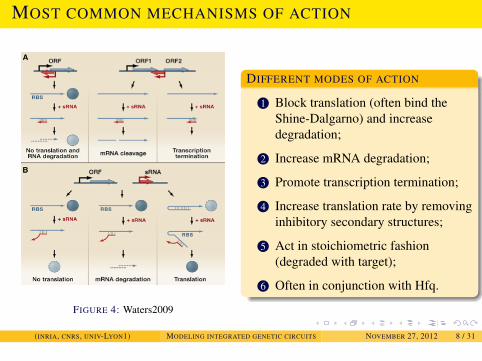
MOST COMMON MECHANISMS OF ACTION
FIGURE 4: Waters2009
DIFFERENT MODES OF ACTION
1 Block translation (often bind theShine-Dalgarno) and increasedegradation;
2 Increase mRNA degradation;
3 Promote transcription termination;
4 Increase translation rate by removinginhibitory secondary structures;
5 Act in stoichiometric fashion(degraded with target);
6 Often in conjunction with Hfq.
(INRIA, CNRS, UNIV-LYON1) MODELING INTEGRATED GENETIC CIRCUITS NOVEMBER 27, 2012 8 / 31
INTRODUCTION
HFQ
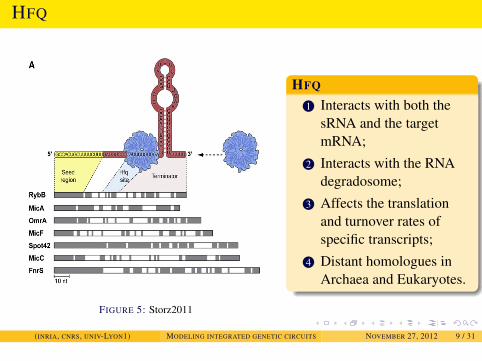
FIGURE 5: Storz2011
HFQ
1 Interacts with both thesRNA and the targetmRNA;
2 Interacts with the RNAdegradosome;
3 Affects the translationand turnover rates ofspecific transcripts;
4 Distant homologues inArchaea and Eukaryotes.
(INRIA, CNRS, UNIV-LYON1) MODELING INTEGRATED GENETIC CIRCUITS NOVEMBER 27, 2012 9 / 31
INTRODUCTION
HFQ
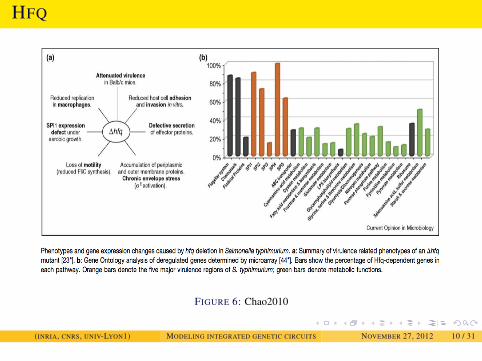
FIGURE 6: Chao2010
(INRIA, CNRS, UNIV-LYON1) MODELING INTEGRATED GENETIC CIRCUITS NOVEMBER 27, 2012 10 / 31
INTRODUCTION
SHORT SUMMARY FOR EUKARYOTES
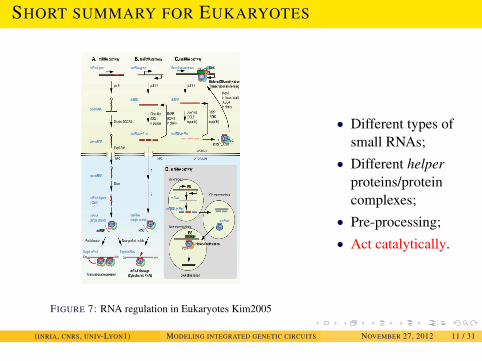
FIGURE 7: RNA regulation in Eukaryotes Kim2005
• Different types ofsmall RNAs;
• Different helperproteins/proteincomplexes;
• Pre-processing;• Act catalytically.
(INRIA, CNRS, UNIV-LYON1) MODELING INTEGRATED GENETIC CIRCUITS NOVEMBER 27, 2012 11 / 31
EXAMPLES
RYHB AND IRON HOMEOSTASIS
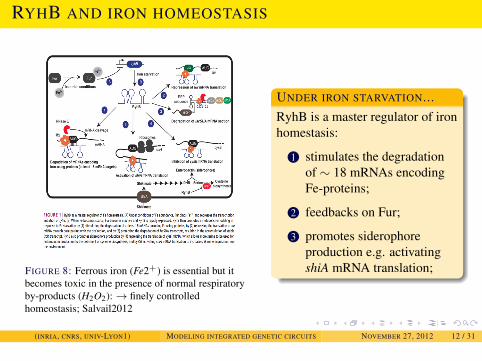
FIGURE 8: Ferrous iron (Fe2+) is essential but itbecomes toxic in the presence of normal respiratoryby-products (H2O2):→ finely controlledhomeostasis; Salvail2012
UNDER IRON STARVATION...RyhB is a master regulator of ironhomestasis:
1 stimulates the degradationof ∼ 18 mRNAs encodingFe-proteins;
2 feedbacks on Fur;
3 promotes siderophoreproduction e.g. activatingshiA mRNA translation;
(INRIA, CNRS, UNIV-LYON1) MODELING INTEGRATED GENETIC CIRCUITS NOVEMBER 27, 2012 12 / 31
EXAMPLES
QRR AND QUORUM SENSING REGULATION IN Vibrio
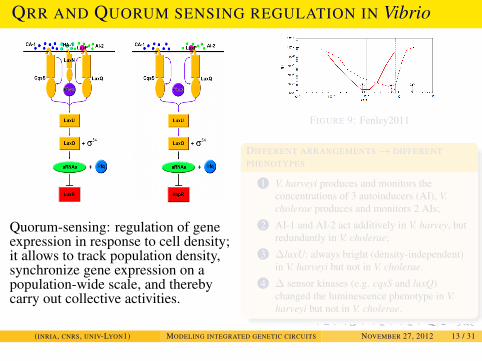
Quorum-sensing: regulation of geneexpression in response to cell density;it allows to track population density,synchronize gene expression on apopulation-wide scale, and therebycarry out collective activities.
FIGURE 9: Fenley2011
DIFFERENT ARRANGEMENTS→ DIFFERENTPHENOTYPES
1 V. harveyi produces and monitors theconcentrations of 3 autoinducers (AI), V.cholerae produces and monitors 2 AIs;
2 AI-1 and AI-2 act additively in V. harvey, butredundantly in V. cholerae;
3 ∆luxU: always bright (density-independent)in V. harveyi but not in V. cholerae.
4 ∆ sensor kinases (e.g. cqsS and luxQ)changed the luminescence phenotype in V.harveyi but not in V. cholerae.
(INRIA, CNRS, UNIV-LYON1) MODELING INTEGRATED GENETIC CIRCUITS NOVEMBER 27, 2012 13 / 31
EXAMPLES
QRR AND QUORUM SENSING REGULATION IN Vibrio
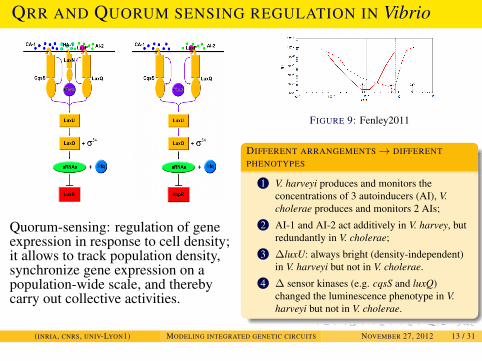
Quorum-sensing: regulation of geneexpression in response to cell density;it allows to track population density,synchronize gene expression on apopulation-wide scale, and therebycarry out collective activities.
FIGURE 9: Fenley2011
DIFFERENT ARRANGEMENTS→ DIFFERENTPHENOTYPES
1 V. harveyi produces and monitors theconcentrations of 3 autoinducers (AI), V.cholerae produces and monitors 2 AIs;
2 AI-1 and AI-2 act additively in V. harvey, butredundantly in V. cholerae;
3 ∆luxU: always bright (density-independent)in V. harveyi but not in V. cholerae.
4 ∆ sensor kinases (e.g. cqsS and luxQ)changed the luminescence phenotype in V.harveyi but not in V. cholerae.
(INRIA, CNRS, UNIV-LYON1) MODELING INTEGRATED GENETIC CIRCUITS NOVEMBER 27, 2012 13 / 31
EXAMPLES
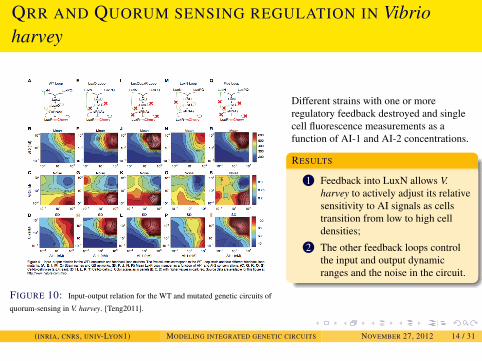
QRR AND QUORUM SENSING REGULATION IN Vibrioharvey
FIGURE 10: Input-output relation for the WT and mutated genetic circuits of
quorum-sensing in V. harvey. [Teng2011].
Different strains with one or moreregulatory feedback destroyed and singlecell fluorescence measurements as afunction of AI-1 and AI-2 concentrations.
RESULTS
1 Feedback into LuxN allows V.harvey to actively adjust its relativesensitivity to AI signals as cellstransition from low to high celldensities;
2 The other feedback loops controlthe input and output dynamicranges and the noise in the circuit.
(INRIA, CNRS, UNIV-LYON1) MODELING INTEGRATED GENETIC CIRCUITS NOVEMBER 27, 2012 14 / 31
EXAMPLES
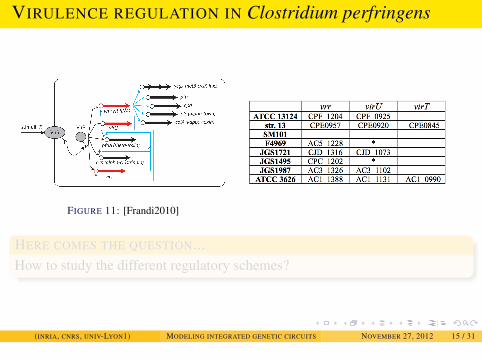
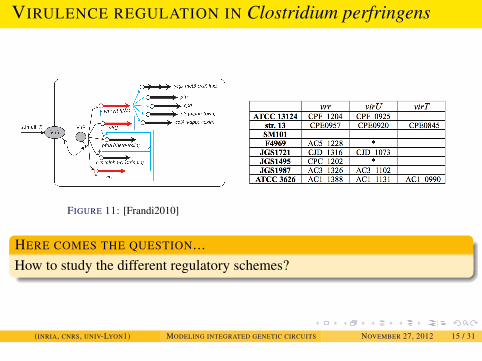
VIRULENCE REGULATION IN Clostridium perfringens
FIGURE 11: [Frandi2010]
HERE COMES THE QUESTION...How to study the different regulatory schemes?
(INRIA, CNRS, UNIV-LYON1) MODELING INTEGRATED GENETIC CIRCUITS NOVEMBER 27, 2012 15 / 31
EXAMPLES
VIRULENCE REGULATION IN Clostridium perfringens
FIGURE 11: [Frandi2010]
HERE COMES THE QUESTION...How to study the different regulatory schemes?
(INRIA, CNRS, UNIV-LYON1) MODELING INTEGRATED GENETIC CIRCUITS NOVEMBER 27, 2012 15 / 31
EXAMPLES
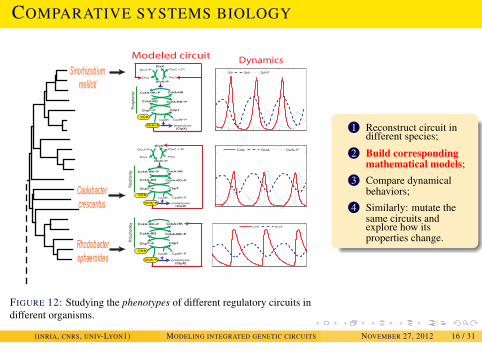
COMPARATIVE SYSTEMS BIOLOGY
Sinorhizobium meliloti
Caulobacter crescentus
Rhodobacter sphaeroides
CckA-RD
CckA-HK~P
CckA-RD~P
CckA-HK
CtrA
ChpT~P
CtrA~P
ChpT
CpdR~PCpdR
proteolysis(ClpX)
Phos
phor
elay
DivK~P
DivK
DivJ
DivJ~P
PleC
PleC + Pi
CckA-RD
CckA-HK~P
CckA-RD~P
CckA-HK
CtrA
ChpT~P
CtrA~P
ChpT
CpdR~PCpdR
proteolysis(ClpX)
Phos
phor
elay
CtrA GcrA DivK~P
DivK~P
DivK
DivJ
DivJ~P
PleC
PleC + Pi
CckA-RD
CckA-HK~P
CckA-RD~P
CckA-HK
CtrA
ChpT~P
CtrA~P
ChpT
CpdR~PCpdR
proteolysis(ClpX)
Phos
phor
elay
CtrA GcrA DivK~P
CtrA GcrA
Modeled circuit Dynamics
FIGURE 12: Studying the phenotypes of different regulatory circuits indifferent organisms.
1 Reconstruct circuit indifferent species;
2 Build correspondingmathematical models;
3 Compare dynamicalbehaviors;
4 Similarly: mutate thesame circuits andexplore how itsproperties change.
(INRIA, CNRS, UNIV-LYON1) MODELING INTEGRATED GENETIC CIRCUITS NOVEMBER 27, 2012 16 / 31
BASICS OF MATHEMATICAL MODELING
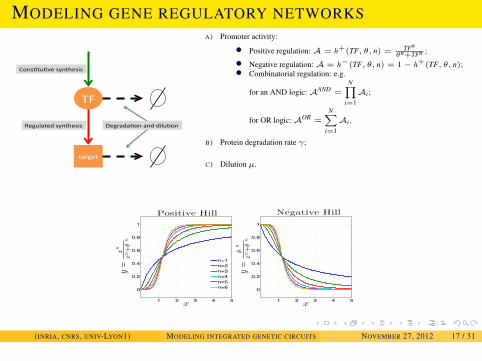
MODELING GENE REGULATORY NETWORKS
TF
target
Cons-tu-ve synthesis
Regulated synthesis Degrada-on and dilu-on
A) Promoter activity:
• Positive regulation: A = h+(TF, θ, n) = TFnθn+TFn ;
• Negative regulation: A = h−(TF, θ, n) = 1− h+(TF, θ, n);• Combinatorial regulation: e.g.
for an AND logic: AAND =N∏
i=1
Ai;
for OR logic: AOR =N∑
i=1
Ai .
B) Protein degradation rate γ;
C) Dilution µ.
1 2 3 4 5
0
0.2
0.4
0.6
0.8
1
x
y=
xn
xn+
!n
Positive Hill
1 2 3 4 5
0
0.2
0.4
0.6
0.8
1
x
y=
!n
xn+
!n
Negative Hill
n=1n=2n=3n=4n=5n=6
(INRIA, CNRS, UNIV-LYON1) MODELING INTEGRATED GENETIC CIRCUITS NOVEMBER 27, 2012 17 / 31
NETWORK MOTIFS AND THEIR DYNAMICAL PROPERTIES
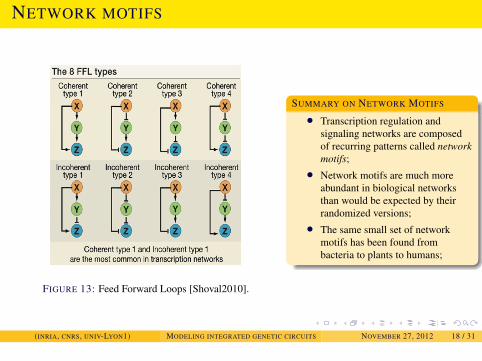
NETWORK MOTIFS
FIGURE 13: Feed Forward Loops [Shoval2010].
SUMMARY ON NETWORK MOTIFS
• Transcription regulation andsignaling networks are composedof recurring patterns called networkmotifs;
• Network motifs are much moreabundant in biological networksthan would be expected by theirrandomized versions;
• The same small set of networkmotifs has been found frombacteria to plants to humans;
(INRIA, CNRS, UNIV-LYON1) MODELING INTEGRATED GENETIC CIRCUITS NOVEMBER 27, 2012 18 / 31
NETWORK MOTIFS AND THEIR DYNAMICAL PROPERTIES
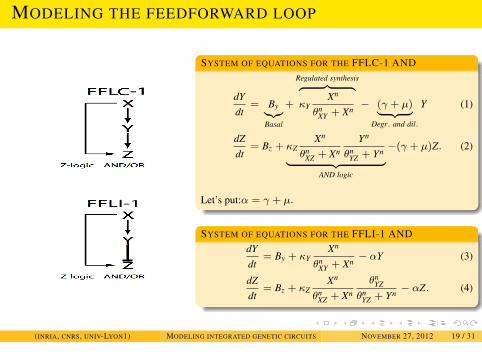
MODELING THE FEEDFORWARD LOOP
-1-1
I-1
SYSTEM OF EQUATIONS FOR THE FFLC-1 AND
dYdt
= By︸︷︷︸Basal
+
Regulated synthesis︷ ︸︸ ︷κY
Xn
θnXY + Xn
− (γ + µ)︸ ︷︷ ︸Degr. and dil.
Y (1)
dZdt
= Bz + κZXn
θnXZ + Xn
Yn
θnYZ + Yn︸ ︷︷ ︸
AND logic
−(γ + µ)Z. (2)
Let’s put:α = γ + µ.
SYSTEM OF EQUATIONS FOR THE FFLI-1 ANDdYdt
= By + κYXn
θnXY + Xn
− αY (3)
dZdt
= Bz + κZXn
θnXZ + Xn
θnYZ
θnYZ + Yn
− αZ. (4)
(INRIA, CNRS, UNIV-LYON1) MODELING INTEGRATED GENETIC CIRCUITS NOVEMBER 27, 2012 19 / 31
NETWORK MOTIFS AND THEIR DYNAMICAL PROPERTIES
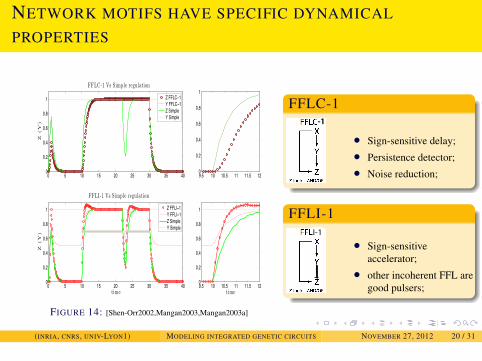
NETWORK MOTIFS HAVE SPECIFIC DYNAMICAL
PROPERTIES
0 5 10 15 20 25 30 35 400
0.2
0.4
0.6
0.8
1
Z(Y
)
FFLC-1 Vs Simple regulation
9.5 10 10.5 11 11.5 120
0.2
0.4
0.6
0.8
1
0 5 10 15 20 25 30 35 400
0.2
0.4
0.6
0.8
1
time
Z(Y
)
FFLI-1 Vs Simple regulation
9.5 10 10.5 11 11.5 120
0.2
0.4
0.6
0.8
1
time
Z FFLC−1Y FFLC−1Z SimpleY Simple
Z FFLI−1Y FFLI−1Z SimpleY Simple
FIGURE 14: [Shen-Orr2002,Mangan2003,Mangan2003a]
FFLC-1-1-1
• Sign-sensitive delay;• Persistence detector;• Noise reduction;
FFLI-1I-1
• Sign-sensitiveaccelerator;
• other incoherent FFL aregood pulsers;
(INRIA, CNRS, UNIV-LYON1) MODELING INTEGRATED GENETIC CIRCUITS NOVEMBER 27, 2012 20 / 31
MODELING SRNA REGULATION
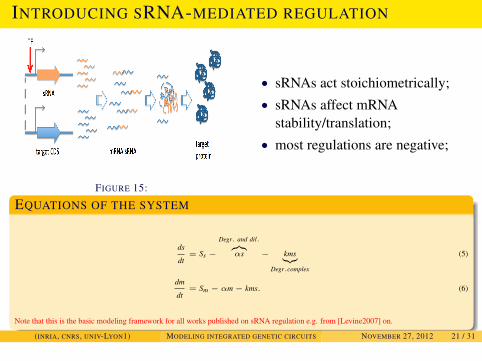
INTRODUCING SRNA-MEDIATED REGULATION
FIGURE 15:
• sRNAs act stoichiometrically;• sRNAs affect mRNA
stability/translation;• most regulations are negative;
EQUATIONS OF THE SYSTEM
ds
dt= Ss −
Degr. and dil.︷︸︸︷αs − kms︸︷︷︸
Degr.complex
(5)
dm
dt= Sm − αm− kms. (6)
Note that this is the basic modeling framework for all works published on sRNA regulation e.g. from [Levine2007] on.
(INRIA, CNRS, UNIV-LYON1) MODELING INTEGRATED GENETIC CIRCUITS NOVEMBER 27, 2012 21 / 31
MODELING SRNA REGULATION
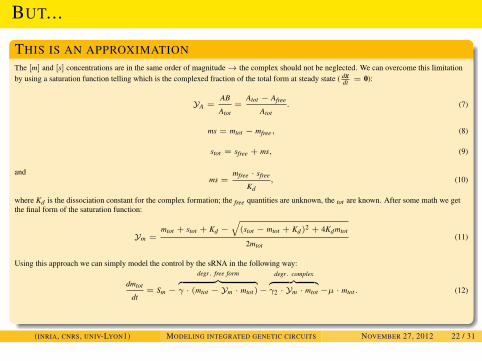
BUT...
THIS IS AN APPROXIMATIONThe [m] and [s] concentrations are in the same order of magnitude→ the complex should not be neglected. We can overcome this limitationby using a saturation function telling which is the complexed fraction of the total form at steady state ( dx
dt = 0):
YA =AB
Atot=
Atot − Afree
Atot. (7)
ms = mtot − mfree, (8)
stot = sfree + ms, (9)
andms =
mfree · sfree
Kd, (10)
where Kd is the dissociation constant for the complex formation; the free quantities are unknown, the tot are known. After some math we getthe final form of the saturation function:
Ym =mtot + stot + Kd −
√(stot − mtot + Kd)
2 + 4Kdmtot
2mtot(11)
Using this approach we can simply model the control by the sRNA in the following way:
dmtot
dt= Sm −
degr. free form︷ ︸︸ ︷γ · (mtot − Ym · mtot)−
degr. complex︷ ︸︸ ︷γ2 · Ym · mtot −µ · mtot. (12)
(INRIA, CNRS, UNIV-LYON1) MODELING INTEGRATED GENETIC CIRCUITS NOVEMBER 27, 2012 22 / 31
MODELING SRNA REGULATIONDYNAMICAL PROPERTIES OF SRNA-TRANSCRIPTION INTEGRATED
CIRCUITS
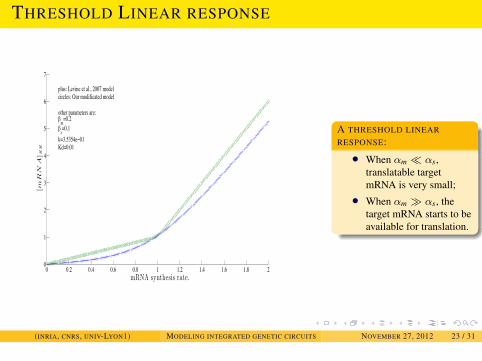
THRESHOLD LINEAR RESPONSE
0 0.2 0.4 0.6 0.8 1 1.2 1.4 1.6 1.8 20
1
2
3
4
5
6
7
mRNA synthesis rate.
[m
RN
A]S
S
plus: Levine et al., 2007 modelcircles: Our modificated model
other parameters are:m=0.2
s=0.1k=3.5354e 01Kd=0.01
A THRESHOLD LINEARRESPONSE:
• When αm � αs,translatable targetmRNA is very small;
• When αm � αs, thetarget mRNA starts to beavailable for translation.
(INRIA, CNRS, UNIV-LYON1) MODELING INTEGRATED GENETIC CIRCUITS NOVEMBER 27, 2012 23 / 31
MODELING SRNA REGULATIONDYNAMICAL PROPERTIES OF SRNA-TRANSCRIPTION INTEGRATED
CIRCUITS
THRESHOLD LINEAR RESPONSE
0.2 0.4 0.6 0.8 10
1
2
3
4
5
6
7
8
m
X SS
=0.5
=1.0
=4.0=2.0
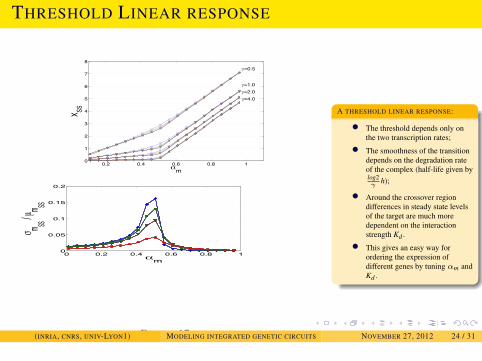
FIGURE 16:
0 0.2 0.4 0.6 0.8 10
0.05
0.1
0.15
0.2
m SS / µ m SS
m
FIGURE 17:
A THRESHOLD LINEAR RESPONSE:
• The threshold depends only onthe two transcription rates;
• The smoothness of the transitiondepends on the degradation rateof the complex (half-life given bylog2γ
h);
• Around the crossover regiondifferences in steady state levelsof the target are much moredependent on the interactionstrength Kd .
• This gives an easy way forordering the expression ofdifferent genes by tuning αm andKd .
(INRIA, CNRS, UNIV-LYON1) MODELING INTEGRATED GENETIC CIRCUITS NOVEMBER 27, 2012 24 / 31
MODELING SRNA REGULATIONDYNAMICAL PROPERTIES OF SRNA-TRANSCRIPTION INTEGRATED
CIRCUITS
SRNA CAN PROVIDE A SWITCH-LIKE BEHAVIOR
10−2 10−1 100 10110−6
10−5
10−4
10−3
10−2
10−1
100
_s / _m
[ta
rge
t
mR
NA
]
Ultrasensitivity
a=10a=100a=1000a=10000
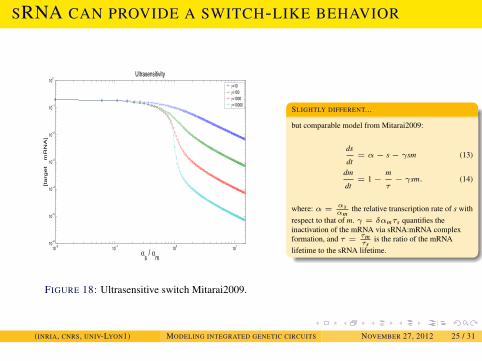
FIGURE 18: Ultrasensitive switch Mitarai2009.
SLIGHTLY DIFFERENT...
but comparable model from Mitarai2009:
ds
dt= α− s− γsm (13)
dm
dt= 1−
m
τ− γsm. (14)
where: α = αsαm
the relative transcription rate of s withrespect to that of m. γ = δαmτs quantifies theinactivation of the mRNA via sRNA:mRNA complexformation, and τ = τm
τsis the ratio of the mRNA
lifetime to the sRNA lifetime.
(INRIA, CNRS, UNIV-LYON1) MODELING INTEGRATED GENETIC CIRCUITS NOVEMBER 27, 2012 25 / 31
MODELING SRNA REGULATIONDYNAMICAL PROPERTIES OF SRNA-TRANSCRIPTION INTEGRATED
CIRCUITS
TARGET PRIORITIZATION
0 0.5 1 1.50
0.1
0.2
0.3
0.4
0.5
0.6
0.7
0.8
0.9
1
sRNA synthesis rate
norm
alized
steady
state
[mR
NA
]
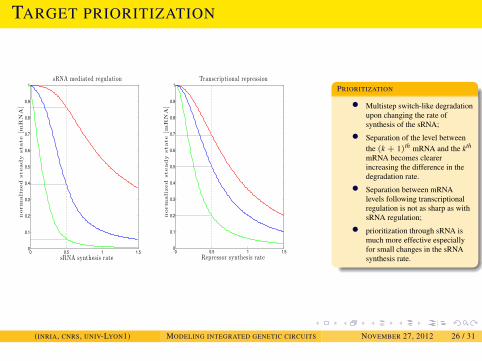
sRNA mediated regulation
0 0.5 1 1.50
0.1
0.2
0.3
0.4
0.5
0.6
0.7
0.8
0.9
1
Repressor synthesis rate
norm
alized
steady
state
[mR
NA
]
Transcriptional repression
PRIORITIZATION
• Multistep switch-like degradationupon changing the rate ofsynthesis of the sRNA;
• Separation of the level betweenthe (k + 1)th mRNA and the kth
mRNA becomes clearerincreasing the difference in thedegradation rate.
• Separation between mRNAlevels following transcriptionalregulation is not as sharp as withsRNA regulation;
• prioritization through sRNA ismuch more effective especiallyfor small changes in the sRNAsynthesis rate.
(INRIA, CNRS, UNIV-LYON1) MODELING INTEGRATED GENETIC CIRCUITS NOVEMBER 27, 2012 26 / 31
MODELING SRNA REGULATIONDYNAMICAL PROPERTIES OF SRNA-TRANSCRIPTION INTEGRATED
CIRCUITS
BISTABILITY
sRNA
TF
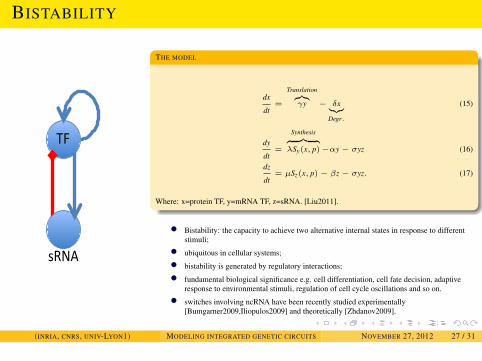
THE MODEL
dx
dt=
Translation︷︸︸︷γy − δx︸︷︷︸
Degr.
(15)
dy
dt=
Synthesis︷ ︸︸ ︷λSy(x, p)−αy− σyz (16)
dz
dt= µSz(x, p)− βz− σyz. (17)
Where: x=protein TF, y=mRNA TF, z=sRNA. [Liu2011].
• Bistability: the capacity to achieve two alternative internal states in response to differentstimuli;
• ubiquitous in cellular systems;
• bistability is generated by regulatory interactions;
• fundamental biological significance e.g. cell differentiation, cell fate decision, adaptiveresponse to environmental stimuli, regulation of cell cycle oscillations and so on.
• switches involving ncRNA have been recently studied experimentally[Bumgarner2009,Iliopulos2009] and theoretically [Zhdanov2009].
(INRIA, CNRS, UNIV-LYON1) MODELING INTEGRATED GENETIC CIRCUITS NOVEMBER 27, 2012 27 / 31
MODELING SRNA REGULATIONDYNAMICAL PROPERTIES OF SRNA-TRANSCRIPTION INTEGRATED
CIRCUITS
BISTABILITY
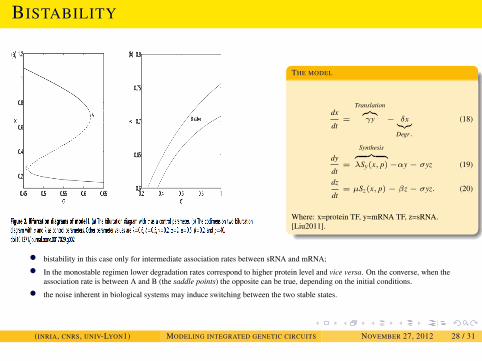
THE MODEL
dx
dt=
Translation︷︸︸︷γy − δx︸︷︷︸
Degr.
(18)
dy
dt=
Synthesis︷ ︸︸ ︷λSy(x, p)−αy− σyz (19)
dz
dt= µSz(x, p)− βz− σyz. (20)
Where: x=protein TF, y=mRNA TF, z=sRNA.[Liu2011].
• bistability in this case only for intermediate association rates between sRNA and mRNA;
• In the monostable regimen lower degradation rates correspond to higher protein level and vice versa. On the converse, when theassociation rate is between A and B (the saddle points) the opposite can be true, depending on the initial conditions.
• the noise inherent in biological systems may induce switching between the two stable states.
(INRIA, CNRS, UNIV-LYON1) MODELING INTEGRATED GENETIC CIRCUITS NOVEMBER 27, 2012 28 / 31
MODELING SRNA REGULATIONDYNAMICAL PROPERTIES OF SRNA-TRANSCRIPTION INTEGRATED
CIRCUITS
CONCLUSIONS
• sRNAs provide an efficient regulatory mechanism;• integration of transcriptional and sRNA mediated regulations generates a
wide variety of interesting dynamical behaviors, such as threshold linearresponse, prioritization of targets and even bistability (and oscillations);
• modeling genetic circuits may provide information on both functionalityand evolution of genetic circuits.
(INRIA, CNRS, UNIV-LYON1) MODELING INTEGRATED GENETIC CIRCUITS NOVEMBER 27, 2012 29 / 31
MODELING SRNA REGULATIONDYNAMICAL PROPERTIES OF SRNA-TRANSCRIPTION INTEGRATED
CIRCUITS
COLLABORATORS AND ACKNOWLEDGEMENTS
A SPECIAL THANKS TO
Equipe Baobab (MF Sagot),LBBE, INRIA; Daniel Kahn(LBBE, INRA).
AND FOR YOUR ATTENTION,Thank you!
contact me: [email protected]
By the way...looking for a dog? 6 Labrador Chocolate available, contact me!
(INRIA, CNRS, UNIV-LYON1) MODELING INTEGRATED GENETIC CIRCUITS NOVEMBER 27, 2012 30 / 31

APPENDIX BIBLIOGRAPHY
(INRIA, CNRS, UNIV-LYON1) MODELING INTEGRATED GENETIC CIRCUITS NOVEMBER 27, 2012 31 / 31


![GROWTH RATES AND CRITICAL EXPONENTS OF ......{a,b,c, d] and {a,b,c,e) are dependent. By (1.2), they are both circuits. As symmetric differences of circuits are dependent in a binary](https://static.fdocuments.net/doc/165x107/609caa9492f89221e5215094/growth-rates-and-critical-exponents-of-abc-d-and-abce-are-dependent.jpg)