Modeling solar radiation for a bioclimatic urban planning · Modeling solar radiation for a...
31
Modeling solar radiation for a bioclimatic urban planning Raphaël Nahon, Benoit Beckers, Olivier Blanpain – July 10 th 2015
Transcript of Modeling solar radiation for a bioclimatic urban planning · Modeling solar radiation for a...

Modeling solar radiation
for a bioclimatic urban planning
Raphaël Nahon, Benoit Beckers, Olivier Blanpain – July 10th 2015

2 Planning
1. A first methodology for the study of Bioclimatism in Urban planning a) The SERVEAU project b) Definition of the “bioclimatism” of an urban project c) The main stages of an urban project d) Presentation of the solar model e) Presentation of the thermal model f) Illustration on the Batignolles ZAC (joint development zone)
2. Towards a finest characterization of the daylight conditions
a) Different aspects of the solar radiation b) The UDI and DA, prime indicators of the daylight conditions in an interior c) Adaptation of the solar model d) Illustration on a simple office model
3. Conclusions and perspectives
3 Bioclimatism in urban planning – the SERVEAU project
SERVEAU Simulation, Evaluation and Reduction of the Energetic
Vulnerability of Urban Projects
11th Unified Inter-Ministry Fund call for projects
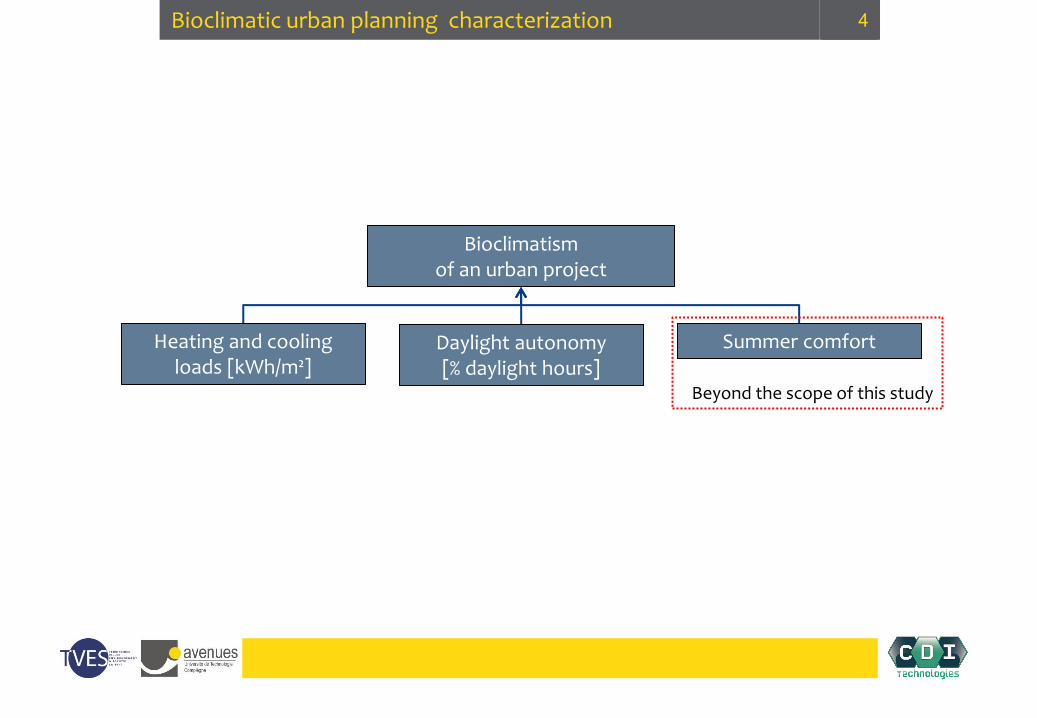
4 Bioclimatic urban planning characterization
Bioclimatism of an urban project
Daylight autonomy [% daylight hours]
Heating and cooling loads [kWh/m²]
Summer comfort
Beyond the scope of this study
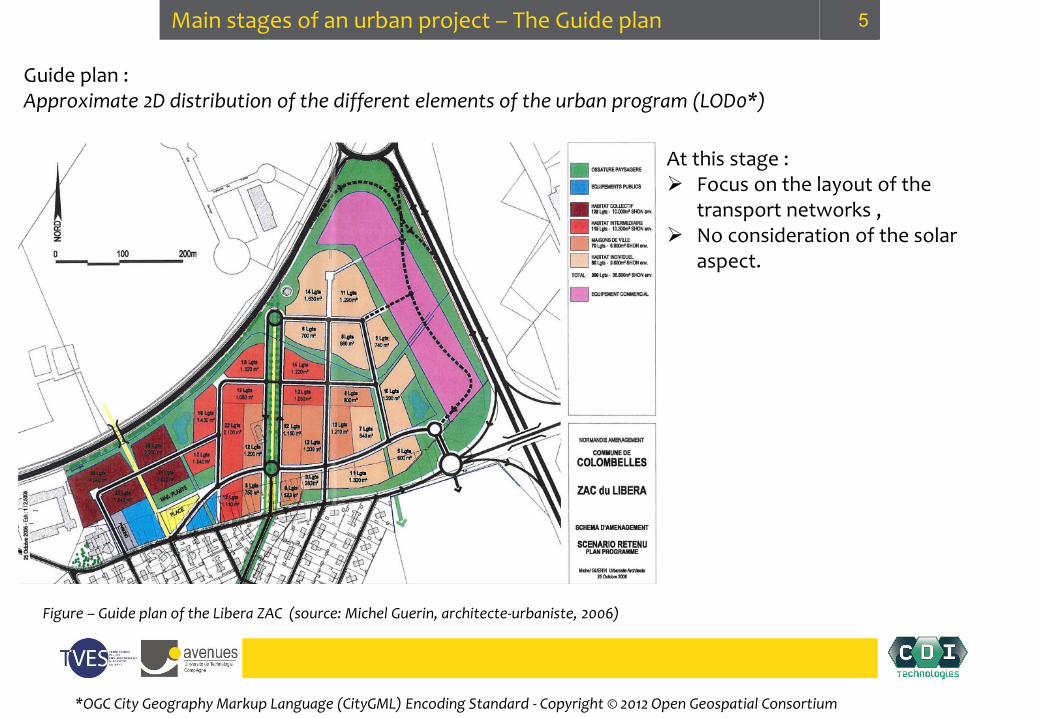
5 Main stages of an urban project – The Guide plan
Guide plan : Approximate 2D distribution of the different elements of the urban program (LOD0*)
*OGC City Geography Markup Language (CityGML) Encoding Standard - Copyright © 2012 Open Geospatial Consortium
At this stage : Focus on the layout of the
transport networks , No consideration of the solar
aspect.
Figure – Guide plan of the Libera ZAC (source: Michel Guerin, architecte-urbaniste, 2006)
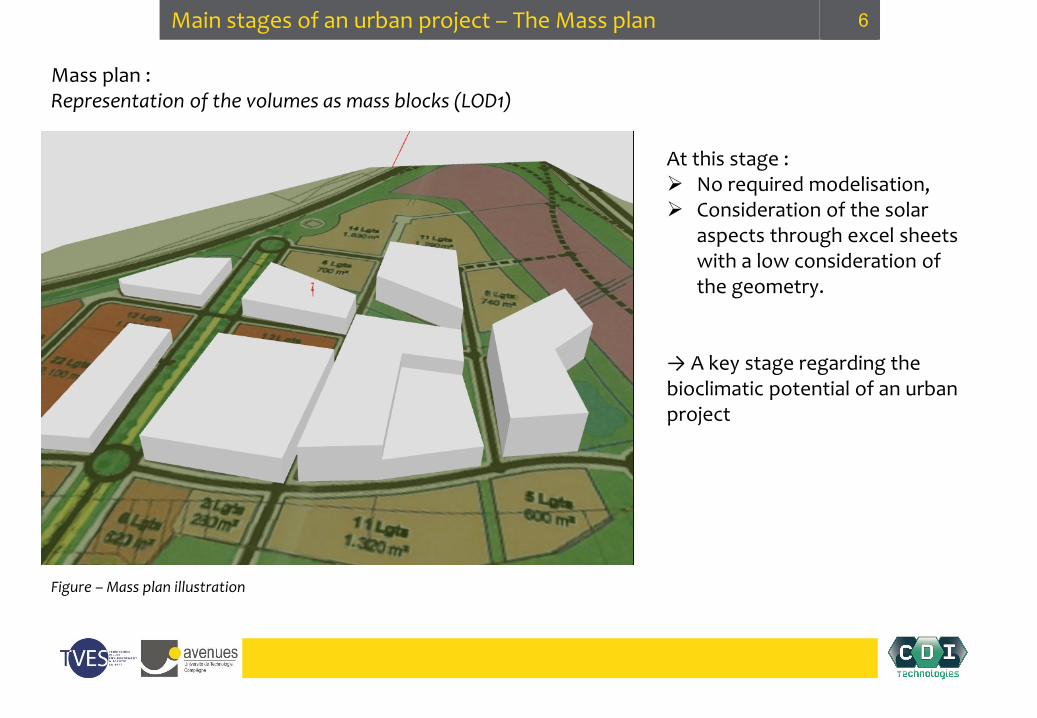
6 Main stages of an urban project – The Mass plan
Mass plan : Representation of the volumes as mass blocks (LOD1)
Figure – Mass plan illustration
At this stage : No required modelisation, Consideration of the solar
aspects through excel sheets with a low consideration of the geometry.
→ A key stage regarding the bioclimatic potential of an urban project
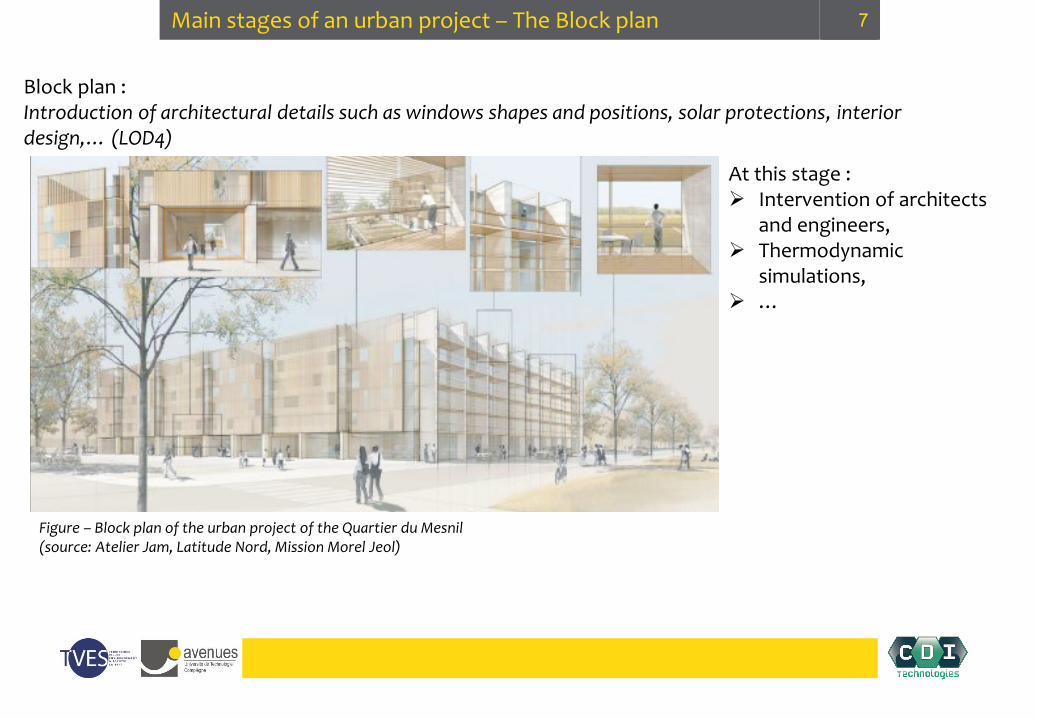
7 Main stages of an urban project – The Block plan
Block plan : Introduction of architectural details such as windows shapes and positions, solar protections, interior design,… (LOD4)
Figure – Block plan of the urban project of the Quartier du Mesnil (source: Atelier Jam, Latitude Nord, Mission Morel Jeol)
At this stage : Intervention of architects
and engineers, Thermodynamic
simulations, …
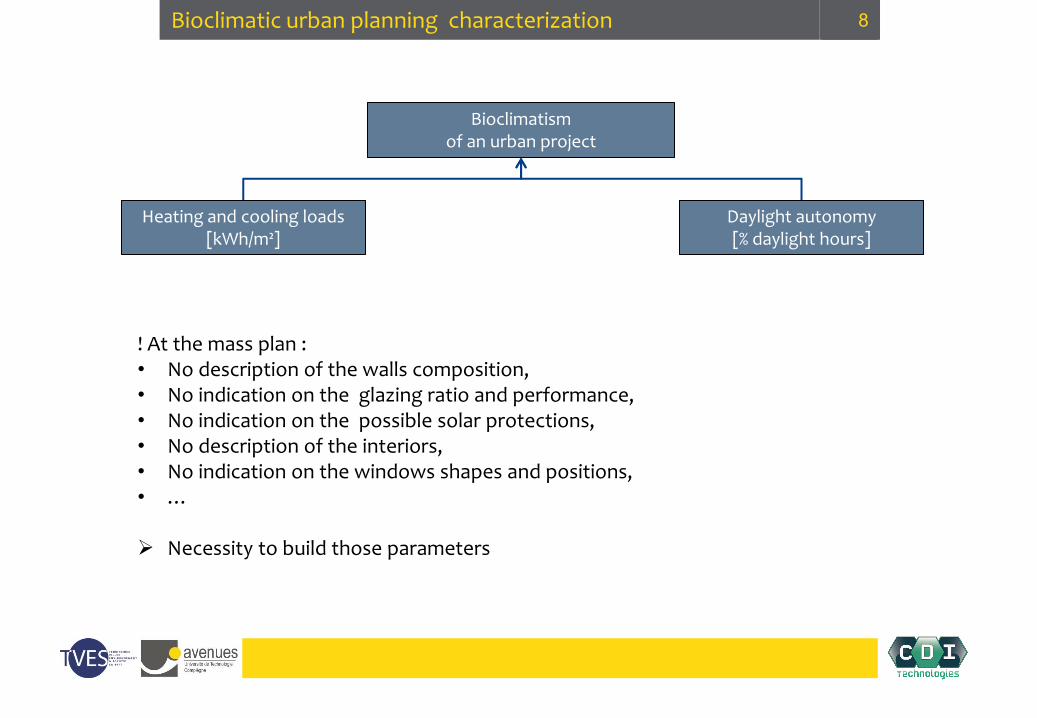
8 Bioclimatic urban planning characterization
Bioclimatism of an urban project
Daylight autonomy [% daylight hours]
Heating and cooling loads [kWh/m²]
! At the mass plan : • No description of the walls composition, • No indication on the glazing ratio and performance, • No indication on the possible solar protections, • No description of the interiors, • No indication on the windows shapes and positions, • … Necessity to build those parameters
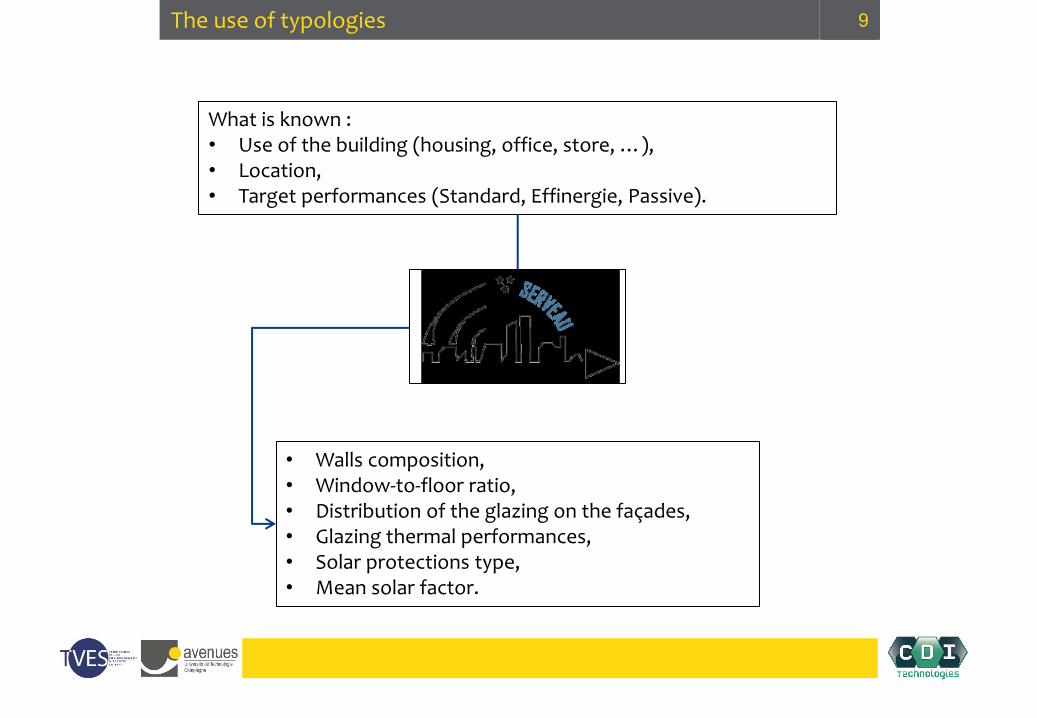
9 The use of typologies
What is known : • Use of the building (housing, office, store, …), • Location, • Target performances (Standard, Effinergie, Passive).
• Walls composition, • Window-to-floor ratio, • Distribution of the glazing on the façades, • Glazing thermal performances, • Solar protections type, • Mean solar factor.

10 Bioclimatic urban planning
Bioclimatism of an urban project
Daylight autonomy [% daylight hours]
?
Heating and cooling loads [kWh/m²]
Solar gains through windows [kWh]
Irradiances on the façade [kWh/m²] Mean solar
factor
Glazing ratio
Glazing performance
Walls composition
Thermal model

11 Daylight autonomy, a simplified methodology
OR A B C
S 31 27 70
SO 31 21 64,2
O 32 14 58,4
NO 37 1 52,8
N 42 -11 47,2
NE 37 1 52,8
E 32 14 58,4
SE 31 21 64,2
H - - -
ZONE CCLIMAT
1 1,07
2 1,05
3 1,05
4 1,00
5 1,00
6 0,96
7 0,96
8 0,93
9 0,93
𝐷𝑎𝑦𝑙𝑖𝑔ℎ𝑡 𝐴𝑢𝑡𝑜𝑛𝑜𝑚𝑦
= 𝑓(𝑆𝑉𝐹, 𝐴, 𝐵, 𝐶, 𝐷𝑒𝑝𝑡ℎ, 𝐶𝑐𝑙𝑖𝑚𝑎𝑡)

12 Bioclimatic urban planning characterization
Heating and cooling loads [kWh/m²]
Solar gains through windows [kWh]
Irradiances on the façade [kWh/m²] Mean solar
factor
Glazing ratio
Bioclimatism of an urban project
Glazing performance
Walls composition
Thermal model
Daylight autonomy [% daylight hours]
Coefficients of modulation by zone and orientations
Sky view factors from the façades
Depth of interest

13 Presentation of the model – global architecture
Tilling of the sky vault
Irradiances on the external faces of the buildings
estimation
Heating and cooling loads estimation Daylight autonomy estimation
Characterize the bioclimatism of an urban project
Sky radiance distribution Sky view factors
From the external faces of the building
Solar model
Thermal model Simplified method

14 Presentation of the solar model – Tiling of the sky vault
B. Beckers and P. Beckers, “Sky vault partition for computing daylight availability and shortwave energy budget on an urban scale,” Light. Res. Technol., 2013.
Figure – Sky partition in 145, 500 and 5000 elements
Tiles of the same aspect ratio and solid angle
Easyness of computation of the sky view factors
Easyness of navigation between tiles
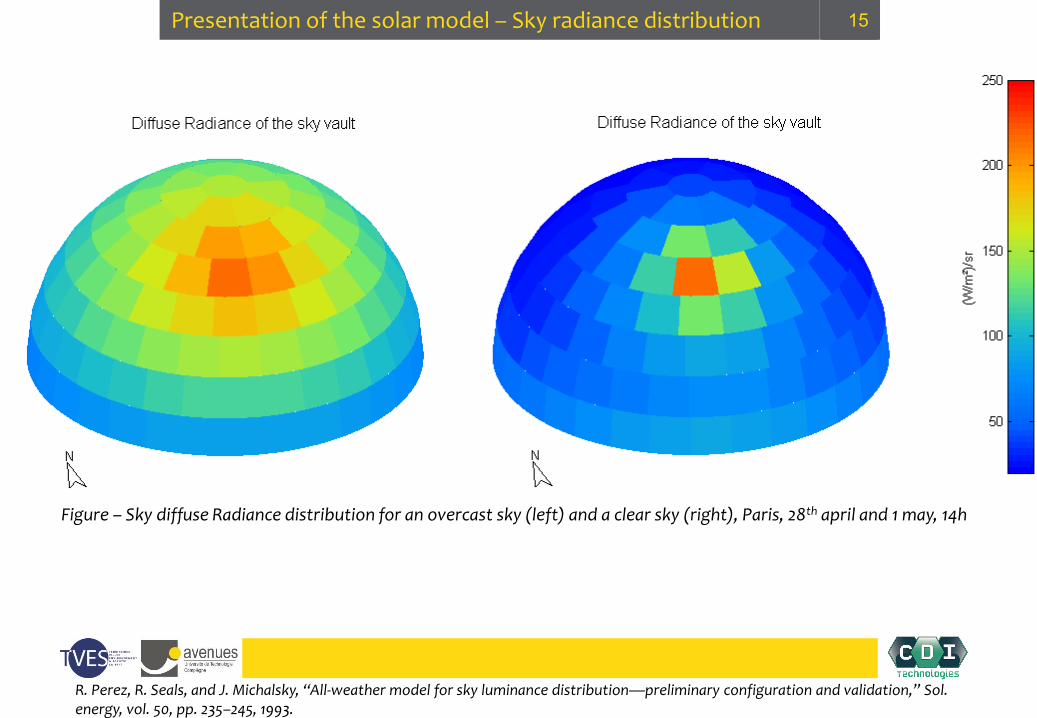
15 Presentation of the solar model – Sky radiance distribution
R. Perez, R. Seals, and J. Michalsky, “All-weather model for sky luminance distribution—preliminary configuration and validation,” Sol. energy, vol. 50, pp. 235–245, 1993.
Figure – Sky diffuse Radiance distribution for an overcast sky (left) and a clear sky (right), Paris, 28th april and 1 may, 14h

16 Presentation of the solar model – Irradiances estimation
Weather data Geometry
Semantics
Tiling of the sky vault
Tiles radiances
Meshing of the external faces
View factors from mesh to mesh
Irradiances on external meshes
Direct and diffuse Irradiances
on external meshes Reflection factors
Radiosity
Sky view factors
Sun position

17 Presentation of the Thermal model – Electrical analogy
Figure - Thermal model, electrical analogy
J. H. Kämpf, “On the modelling and optimisation of urban energy fluxes,” 2009.
• Tr : inside air temperature • Text : exterior temperature • UA : conductance through the windows and ventilation • Kw1, Kw2 : conductance of the internal and external part of the wall • Ki, Ke : conductance of the thin layer of air at the internal and external wall surface • Cr, Cw : heat capacity of the air and the wall material • Qsun1 : energy flux from the sun to the external wall surface • Qsun2 : energy flux from the sun that penetrates in the room
F. Lorenz and G. Masy, “Méthode d’évaluation de l'économie d'énergie apportée par l'intermittence de chauffage dans les bâtiments. Traitement par différences finies d'un modèle à deux constantes de temps,” 1982.
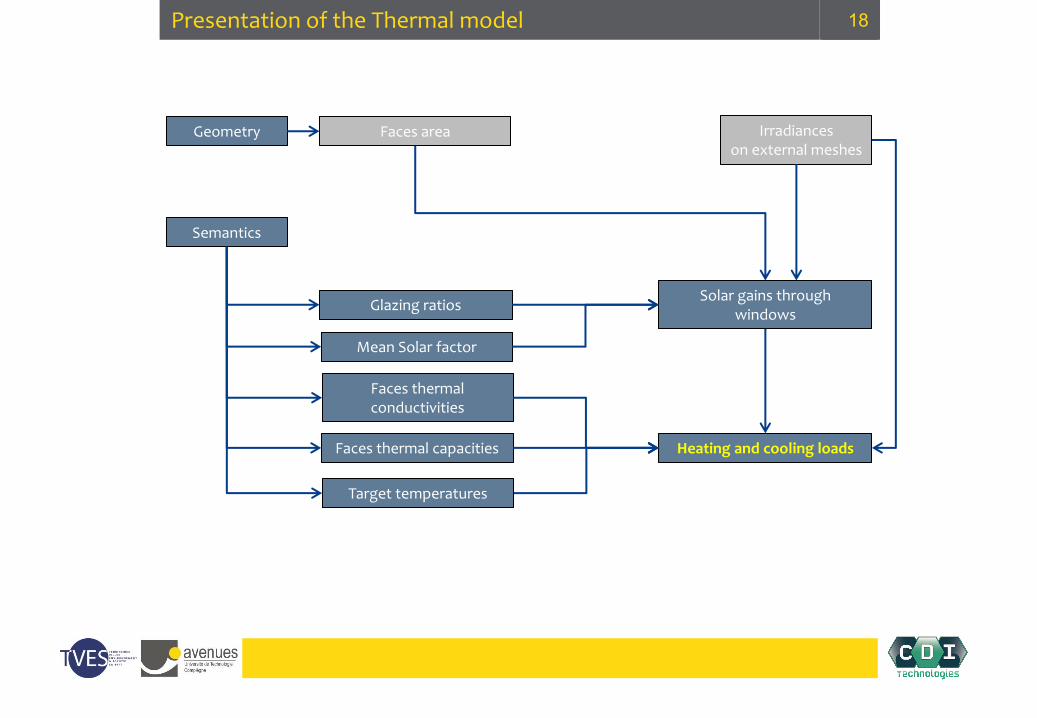
18 Presentation of the Thermal model
Geometry
Semantics
Faces area Irradiances on external meshes
Mean Solar factor
Glazing ratios
Faces thermal conductivities
Faces thermal capacities
Solar gains through windows
Heating and cooling loads
Target temperatures

19 Test case – ZAC Batignolles
Urban program : • Housing : 46 000 m², • Office : 26 600 m², • Stores : 10 940 m², • School : 7 655 m², • Total : 67 195 m².
No taking into account of the climatic data on the daylight autonomy estimation, No taking into account of the glare, Heating load overestimation due to the mean solar factor, No taking into account of roof tilts on the solar active potential.
0
500
1000
1500
2000
2500
3000
3500
4000
4500
5000
Typologies at mass plan STD at block plan
Energy consumptions (MWh/an)
Cooling
Lighting
Heating
18%
Figure - Mass plan of the Batignolles ZAC

20 Solar radiation – A quick look on cloud cover at different locations
B. Liu and R. Jordan, “The interrelationship and characteristic distribution of direct, diffuse and total solar radiation,” Sol. Energy, vol. 4, pp. 1–19, 1960.

21 Solar radiation – Light & Energy from the sky
R. Perez, R. Seals, and J. Michalsky, “All-weather model for sky luminance distribution—preliminary configuration and validation,” Sol. energy, vol. 50, pp. 235–245, 1993.

22 Light & Energy from the sky
Figure - Radiance and luminance distribution – Paris Orly, june 25th, 11h (overcast sky)
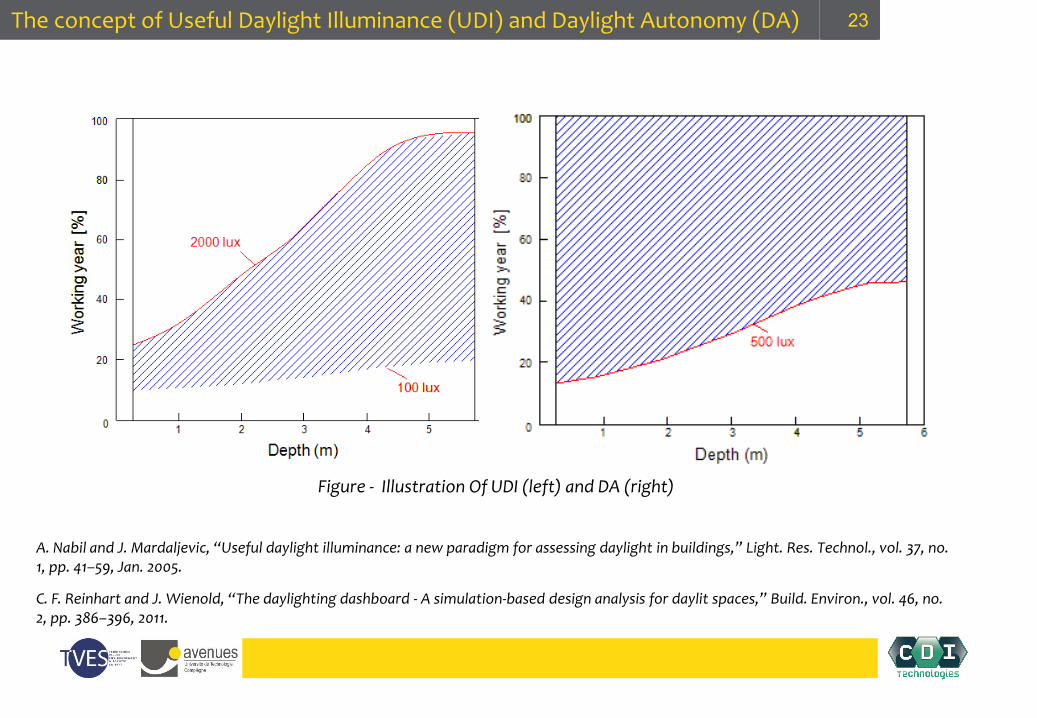
23 The concept of Useful Daylight Illuminance (UDI) and Daylight Autonomy (DA)
A. Nabil and J. Mardaljevic, “Useful daylight illuminance: a new paradigm for assessing daylight in buildings,” Light. Res. Technol., vol. 37, no. 1, pp. 41–59, Jan. 2005.
C. F. Reinhart and J. Wienold, “The daylighting dashboard - A simulation-based design analysis for daylit spaces,” Build. Environ., vol. 46, no. 2, pp. 386–396, 2011.
Figure - Illustration Of UDI (left) and DA (right)

24 Bioclimatic urban planning – Heating/cooling loads
Heating and cooling loads [kWh/m²]
Solar gains through windows [kWh]
Irradiances on the façade [kWh/m²] Mean solar
factor
Glazing ratio
Bioclimatism of an urban project
Glazing performance
Walls composition
Thermal model
Daylight autonomy [% daylight hours]
Illuminance levels on an horizontal plane
[lux]
Illuminances on the façade [lux]
Illuminances on the
interior faces [lux]
Light transmittance of the glazing
Solar protections type and positions
Windows shapes and positions
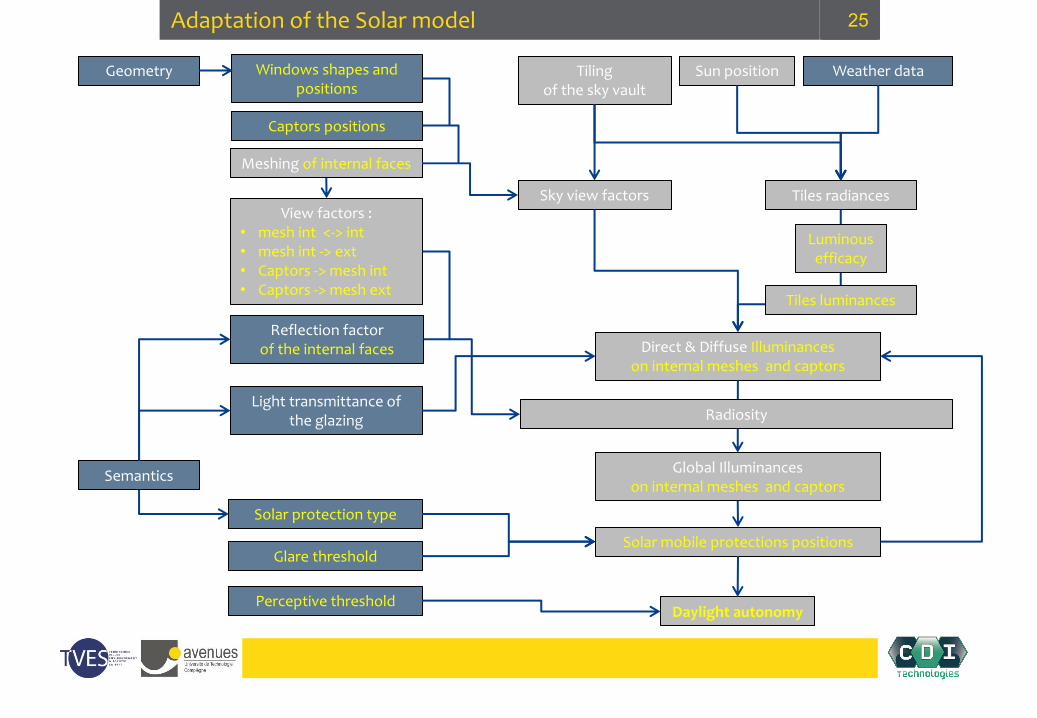
25 Adaptation of the Solar model
Geometry
Semantics
Meshing of internal faces
View factors : • mesh int <-> int • mesh int -> ext • Captors -> mesh int • Captors -> mesh ext
Global Illuminances on internal meshes and captors
Reflection factor of the internal faces
Captors positions
Windows shapes and positions
Light transmittance of the glazing
Daylight autonomy
Direct & Diffuse Illuminances on internal meshes and captors
Solar protection type
Radiosity
Glare threshold Solar mobile protections positions
Perceptive threshold
Weather data Tiling of the sky vault
Sun position
Tiles radiances Sky view factors
Luminous efficacy
Tiles luminances

26 Impact of the LoD - Illustration on simple study case
Figure - Description of the Office model

27 Impact of the LoD - solar blinds on daylight autonomy
• Active user : lowers the blinds whenever the UDI upper limit is crossed on the point at 0.75 cm from the window.
• Passive user : keeps the blinds always lowered.
Figure - Solar blinds impact on the UDI (left) and DA (right)

28 Impact of the LoD - windows positions and ground covering
Figure - Window positioning (var1) and ground covering (var2) impact on the UDI and DA
• var1 : changing the window from horizontal to vertical, • Var2 : changing the ground reflectivity from 0.2 to 0.5.
ref
var1
var2

29 Impact of the LoD - solar blinds on thermal loads
-
10,00
20,00
30,00
40,00
50,00
60,00
70,00
active user no blinds
Heating loads (kWh/m²)
• Walls composition : 20cm of concrete, 15cm of insulation • Double-glazing
Figure – Comparison of the heating load
38%

30 Conclusions and perspectives
• A methodology for a better consideration of the bioclimatic aspect of at early stages of an urban project is presented.
• The limits of this methodology are identified, especially regarding daylight access characterization.
• An adaptation of the solar model is presented in order to explore the impact of new indicators, requiring a higher LoD, on the characterization of the bioclimatism of a project.
• The results show a strong impact both on the heating loads and the daylight autonomy and justify the use of such indicators as soon as in the mass plan.
High calculations cost → PBLI ; Necessity to explore different interior configuration → Procedural modeling ; A reflection on the captors type and location needs to be conducted.

Thank you for your attention


![Bioclimatic Buildings [ ] - RIO 12 · Bioclimatic Buildings Roberto Lamberts Federal University of Santa Catarina ... NBR 15220-3 CLIMATE + MAN + HABITAT. 15 Bioclimatic architecture](https://static.fdocuments.net/doc/165x107/5c4466cd93f3c34c3c35c1b5/bioclimatic-buildings-rio-12-bioclimatic-buildings-roberto-lamberts-federal.jpg)