Modeling. Simulation, Testing, and Measurements of...
5
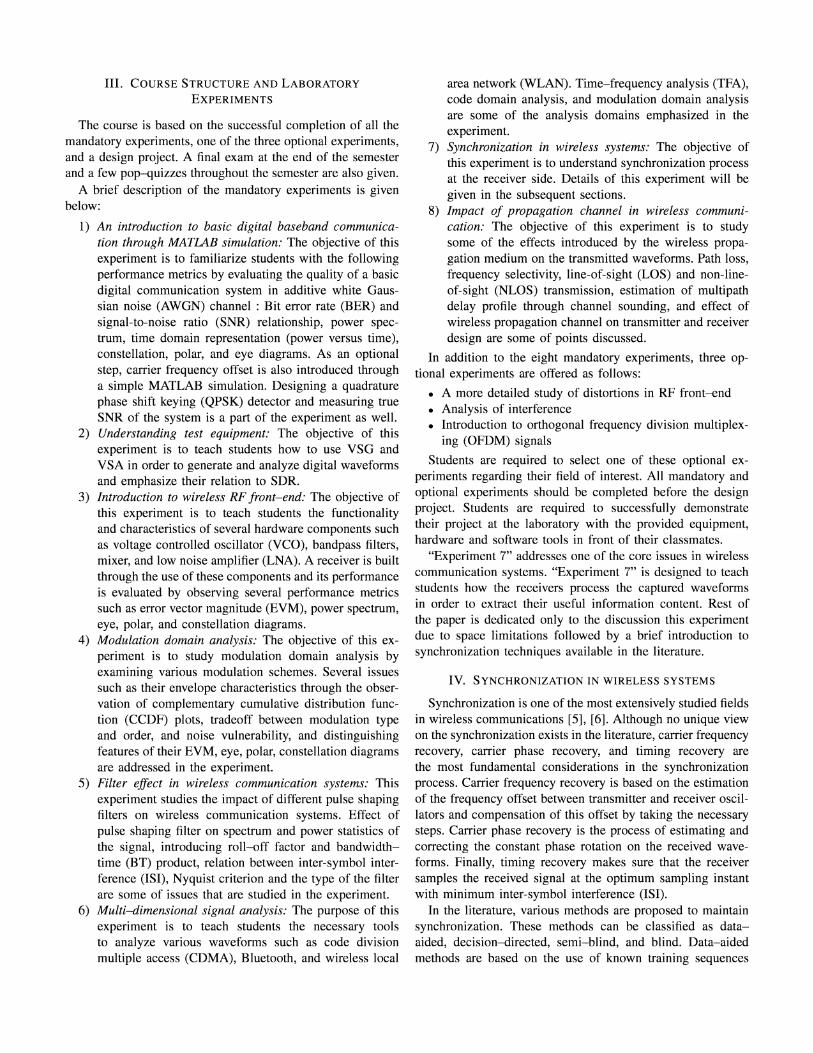
Modeling. Simulation, Testing, and Measurements of Wireless Communication Systems: A Laboratory Based Approach Sabih Guzelgoz and Hiiseyin Arslan Department of Electrical Engineering, University of South Florida 202 E. Fowler Avenue, ENB-118, Tampa, FL, 33620 E-mails: [email protected], [email protected] Abstract-Several challenges such as inter-operability, global seamless connectivity, and spectral crowding became more of a concern after the tremendous growth in wireless industry and the diversity in wireless systems and standards. Software defined radio (SDR) is envisioned to be a promising solution for all these challenges. From the point of education, all these challenges along with the introduction of new concepts such as SDR necessitate the establishment of new platforms where students can model, simulate and test wireless systems from various aspects. This paper gives an overview of a laboratory course incorporating the use of SDR capable devices. A brief description of all the laboratory experiments is included, whereas only one of the experiments focusing on synchronization in wireless systems is discussed in detail due to space limitations. Index Terms-Synchronization in wireless systems, testing wireless systems, wireless communications I. INTRODUCTION Popularity of wireless systems and services have paved the way to the significant evolution of wireless technologies over the last couple of decades, from simple paging to real- time voice communication and recently to very high rate data communication. Software defined radio (SDR), which provides flexible radio functionality and avoids the use of application specific fixed analog circuits and components, is one of the technologies that is lately receiving significant attention from the wireless community [1]. Ever growing wireless communication technologies and standards along with the introduction of recent concepts such as SDR required the development of a flexible wireless laboratory platform where students can better understand the fundamental theories, software simulation of the systems, hardware test and modeling, system measurement and testing, software and hardware interactions and co-simulations through hands-on experiments. Electrical Engineering department of University of South Florida (USF) has seen this necessity and developed a wireless communications systems laboratory course that is composed of benches equipped with SDR capable transmitters and receivers. Some of the research activities undertaken in the Electrical Engineering department of USF formed the basis for the laboratory course [2]-[4]. Vector signal generator (VSG), vector signal analyzer (VSA), and radio frequency (RF) hardware with computer aided design (CAD) tools including MATLAB, and signal studio are the integral parts of the laboratory benches. Bench setups are very flexible and allow generation of various signal waveforms, measurements and modeling of the RF and baseband circuitry under different stimulus conditions, mod- eling of wireless radio channel effects and RF impairments, and optimization of the transceiver structures and baseband algorithms. In this paper, one of the experiments, which is synchroniza- tion in wireless communication systems, is discussed in detail as an example to give readers a better understanding on the teaching methodology followed. II. MODEL OF THE LABORATORY COURSE The laboratory course consists of three layers: theory, sim- ulation, and experiments with real hardware. A conceptual layout of the course is given in Fig. 1. Theory which forms the core of the course is placed on the top row. Simulation world where students can simulate and test various wireless communication systems prior to implementing a real-world application is shown below the theory block. The next row is related to the use of test and measurement equipment which connect the simulation world with the realistic hardware. Fig. 1 shows some of the important test and measurement equipment, i.e. VSG, VSA, and spectrum analyzer (SA). The modern versions of SAs with capabilities of providing I/Q (in-phase and quadrature) samples through wide bandwidth digitizer such as Agilent PSA (E4440A), can also be used as SA or vice versa. Custom and standard waveforms can be generated by the VSG from various sources. MATLAB and signal studio soft- ware are two options for the realization of waveforms. It is also within VSG's capabilities to generate waveforms with various impairments such as noise, fading, and interference to test the receiver's ability to demodulate signals under more realistic conditions. 978-1-4244-4565-3/09/$25.00 ©2009 IEEE
Transcript of Modeling. Simulation, Testing, and Measurements of...
Modeling. Simulation, Testing, and Measurementsof Wireless Communication Systems: A Laboratory
Based ApproachSabih Guzelgoz and Hiiseyin Arslan
Department of Electrical Engineering, University of South Florida202 E. Fowler Avenue, ENB-118, Tampa, FL, 33620E-mails: [email protected], [email protected]
Abstract-Several challenges such as inter-operability, globalseamless connectivity, and spectral crowding became more of aconcern after the tremendous growth in wireless industry andthe diversity in wireless systems and standards. Software definedradio (SDR) is envisioned to be a promising solution for all thesechallenges. From the point of education, all these challenges alongwith the introduction of new concepts such as SDR necessitatethe establishment of new platforms where students can model,simulate and test wireless systems from various aspects. Thispaper gives an overview of a laboratory course incorporatingthe use of SDR capable devices. A brief description of all thelaboratory experiments is included, whereas only one of theexperiments focusing on synchronization in wireless systems isdiscussed in detail due to space limitations.
Index Terms-Synchronization in wireless systems, testingwireless systems, wireless communications
I. INTRODUCTION
Popularity of wireless systems and services have pavedthe way to the significant evolution of wireless technologiesover the last couple of decades, from simple paging to realtime voice communication and recently to very high rate datacommunication. Software defined radio (SDR), which providesflexible radio functionality and avoids the use of applicationspecific fixed analog circuits and components, is one of thetechnologies that is lately receiving significant attention fromthe wireless community [1].
Ever growing wireless communication technologies andstandards along with the introduction of recent conceptssuch as SDR required the development of a flexible wirelesslaboratory platform where students can better understand thefundamental theories, software simulation of the systems,hardware test and modeling, system measurement and testing,software and hardware interactions and co-simulations throughhands-on experiments.
Electrical Engineering department of University of SouthFlorida (USF) has seen this necessity and developed a wirelesscommunications systems laboratory course that is composedof benches equipped with SDR capable transmitters andreceivers. Some of the research activities undertaken in theElectrical Engineering department of USF formed the basisfor the laboratory course [2]-[4].
Vector signal generator (VSG), vector signal analyzer(VSA), and radio frequency (RF) hardware with computeraided design (CAD) tools including MATLAB, and signalstudio are the integral parts of the laboratory benches. Benchsetups are very flexible and allow generation of varioussignal waveforms, measurements and modeling of the RF andbaseband circuitry under different stimulus conditions, modeling of wireless radio channel effects and RF impairments,and optimization of the transceiver structures and basebandalgorithms.
In this paper, one of the experiments, which is synchronization in wireless communication systems, is discussed in detailas an example to give readers a better understanding on theteaching methodology followed.
II. MODEL OF THE LABORATORY COURSE
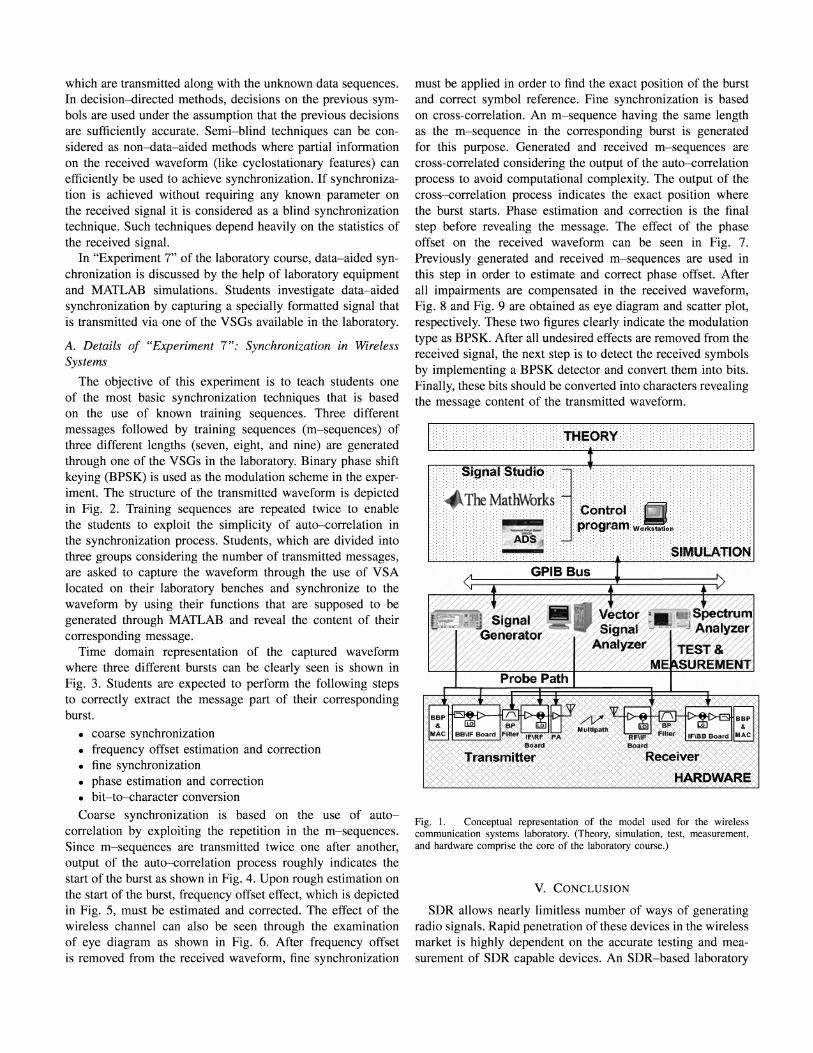
The laboratory course consists of three layers: theory, simulation, and experiments with real hardware. A conceptuallayout of the course is given in Fig. 1. Theory which formsthe core of the course is placed on the top row. Simulationworld where students can simulate and test various wirelesscommunication systems prior to implementing a real-worldapplication is shown below the theory block. The next row isrelated to the use of test and measurement equipment whichconnect the simulation world with the realistic hardware.
Fig. 1 shows some of the important test and measurementequipment, i.e. VSG, VSA, and spectrum analyzer (SA). Themodern versions of SAs with capabilities of providing I/Q(in-phase and quadrature) samples through wide bandwidthdigitizer such as Agilent PSA (E4440A), can also be used asSA or vice versa.
Custom and standard waveforms can be generated by theVSG from various sources. MATLAB and signal studio software are two options for the realization of waveforms. It is alsowithin VSG's capabilities to generate waveforms with variousimpairments such as noise, fading, and interference to test thereceiver's ability to demodulate signals under more realisticconditions.
978-1-4244-4565-3/09/$25.00 ©2009 IEEE
III. COURSE STRUCTURE AND LABORATORYEXPERIMENTS
The course is based on the successful completion of all themandatory experiments, one of the three optional experiments,and a design project. A final exam at the end of the semesterand a few pop-quizzes throughout the semester are also given.
A brief description of the mandatory experiments is givenbelow:
1) An introduction to basic digital baseband communication through MATLAB simulation: The objective of thisexperiment is to familiarize students with the followingperformance metrics by evaluating the quality of a basicdigital communication system in additive white Gaussian noise (AWGN) channel: Bit error rate (BER) andsignal-to-noise ratio (SNR) relationship, power spectrum, time domain representation (power versus time),constellation, polar, and eye diagrams. As an optionalstep, carrier frequency offset is also introduced througha simple MATLAB simulation. Designing a quadraturephase shift keying (QPSK) detector and measuring trueSNR of the system is a part of the experiment as well.
2) Understanding test equipment: The objective of thisexperiment is to teach students how to use VSG andVSA in order to generate and analyze digital waveformsand emphasize their relation to SDR.
3) Introduction to wireless RF front-end: The objective ofthis experiment is to teach students the functionalityand characteristics of several hardware components suchas voltage controlled oscillator (VCO), bandpass filters,mixer, and low noise amplifier (LNA). A receiver is builtthrough the use of these components and its performanceis evaluated by observing several performance metricssuch as error vector magnitude (EVM), power spectrum,eye, polar, and constellation diagrams.
4) Modulation domain analysis: The objective of this experiment is to study modulation domain analysis byexamining various modulation schemes. Several issuessuch as their envelope characteristics through the observation of complementary cumulative distribution function (CCDF) plots, tradeoff between modulation typeand order, and noise vulnerability, and distinguishingfeatures of their EVM, eye, polar, constellation diagramsare addressed in the experiment.
5) Filter effect in wireless communication systems: Thisexperiment studies the impact of different pulse shapingfilters on wireless communication systems. Effect ofpulse shaping filter on spectrum and power statistics ofthe signal, introducing roll-off factor and bandwidthtime (BT) product, relation between inter-symbol interference (lSI), Nyquist criterion and the type of the filterare some of issues that are studied in the experiment.
6) Multi-dimensional signal analysis: The purpose of thisexperiment is to teach students the necessary toolsto analyze various waveforms such as code divisionmultiple access (CDMA), Bluetooth, and wireless local
area network (WLAN). Time-frequency analysis (TFA),code domain analysis, and modulation domain analysisare some of the analysis domains emphasized in theexperiment.
7) Synchronization in wireless systems: The objective ofthis experiment is to understand synchronization processat the receiver side. Details of this experiment will begiven in the subsequent sections.
8) Impact of propagation channel in wireless communication: The objective of this experiment is to studysome of the effects introduced by the wireless propagation medium on the transmitted waveforms. Path loss,frequency selectivity, line-of-sight (LOS) and non-lineof-sight (NLOS) transmission, estimation of multipathdelay profile through channel sounding, and effect ofwireless propagation channel on transmitter and receiverdesign are some of points discussed.
In addition to the eight mandatory experiments, three op-tional experiments are offered as follows:
• A more detailed study of distortions in RF front-end• Analysis of interference• Introduction to orthogonal frequency division multiplex
ing (OFDM) signals
Students are required to select one of these optional experiments regarding their field of interest. All mandatory andoptional experiments should be completed before the designproject. Students are required to successfully demonstratetheir project at the laboratory with the provided equipment,hardware and software tools in front of their classmates.
"Experiment 7" addresses one of the core issues in wirelesscommunication systems. "Experiment 7" is designed to teachstudents how the receivers process the captured waveformsin order to extract their useful information content. Rest ofthe paper is dedicated only to the discussion this experimentdue to space limitations followed by a brief introduction tosynchronization techniques available in the literature.
IV. SYNCHRONIZATION IN WIRELESS SYSTEMS
Synchronization is one of the most extensively studied fieldsin wireless communications [5], [6]. Although no unique viewon the synchronization exists in the literature, carrier frequencyrecovery, carrier phase recovery, and timing recovery arethe most fundamental considerations in the synchronizationprocess. Carrier frequency recovery is based on the estimationof the frequency offset between transmitter and receiver oscillators and compensation of this offset by taking the necessarysteps. Carrier phase recovery is the process of estimating andcorrecting the constant phase rotation on the received waveforms. Finally, timing recovery makes sure that the receiversamples the received signal at the optimum sampling instantwith minimum inter-symbol interference (lSI).
In the literature, various methods are proposed to maintainsynchronization. These methods can be classified as dataaided, decision-directed, semi-blind, and blind. Data-aidedmethods are based on the use of known training sequences
which are transmitted along with the unknown data sequences.In decision-directed methods, decisions on the previous symbols are used under the assumption that the previous decisionsare sufficiently accurate. Semi-blind techniques can be considered as non-data-aided methods where partial informationon the received waveform (like cyclostationary features) canefficiently be used to achieve synchronization. If synchronization is achieved without requiring any known parameter onthe received signal it is considered as a blind synchronizationtechnique. Such techniques depend heavily on the statistics ofthe received signal.
In "Experiment 7" of the laboratory course, data-aided synchronization is discussed by the help of laboratory equipmentand MATLAB simulations. Students investigate data-aidedsynchronization by capturing a specially formatted signal thatis transmitted via one of the VSGs available in the laboratory.
A. Details of "Experiment 7" : Synchronization in WirelessSystems
The objective of this experiment is to teach students oneof the most basic synchronization techniques that is basedon the use of known training sequences. Three differentmessages followed by training sequences (m-sequences) ofthree different lengths (seven, eight, and nine) are generatedthrough one of the VSGs in the laboratory. Binary phase shiftkeying (BPSK) is used as the modulation scheme in the experiment. The structure of the transmitted waveform is depictedin Fig. 2. Training sequences are repeated twice to enablethe students to exploit the simplicity of auto-correlation inthe synchronization process. Students, which are divided intothree groups considering the number of transmitted messages,are asked to capture the waveform through the use of VSAlocated on their laboratory benches and synchronize to thewaveform by using their functions that are supposed to begenerated through MATLAB and reveal the content of theircorresponding message.
Time domain representation of the captured waveformwhere three different bursts can be clearly seen is shown inFig. 3. Students are expected to perform the following stepsto correctly extract the message part of their correspondingburst.
• coarse synchronization• frequency offset estimation and correction• fine synchronization• phase estimation and correction• bit-to-character conversionCoarse synchronization is based on the use of auto
correlation by exploiting the repetition in the m-sequences.Since m-sequences are transmitted twice one after another,output of the auto-correlation process roughly indicates thestart of the burst as shown in Fig. 4. Upon rough estimation onthe start of the burst, frequency offset effect, which is depictedin Fig. 5, must be estimated and corrected. The effect of thewireless channel can also be seen through the examinationof eye diagram as shown in Fig. 6. After frequency offsetis removed from the received waveform, fine synchronization
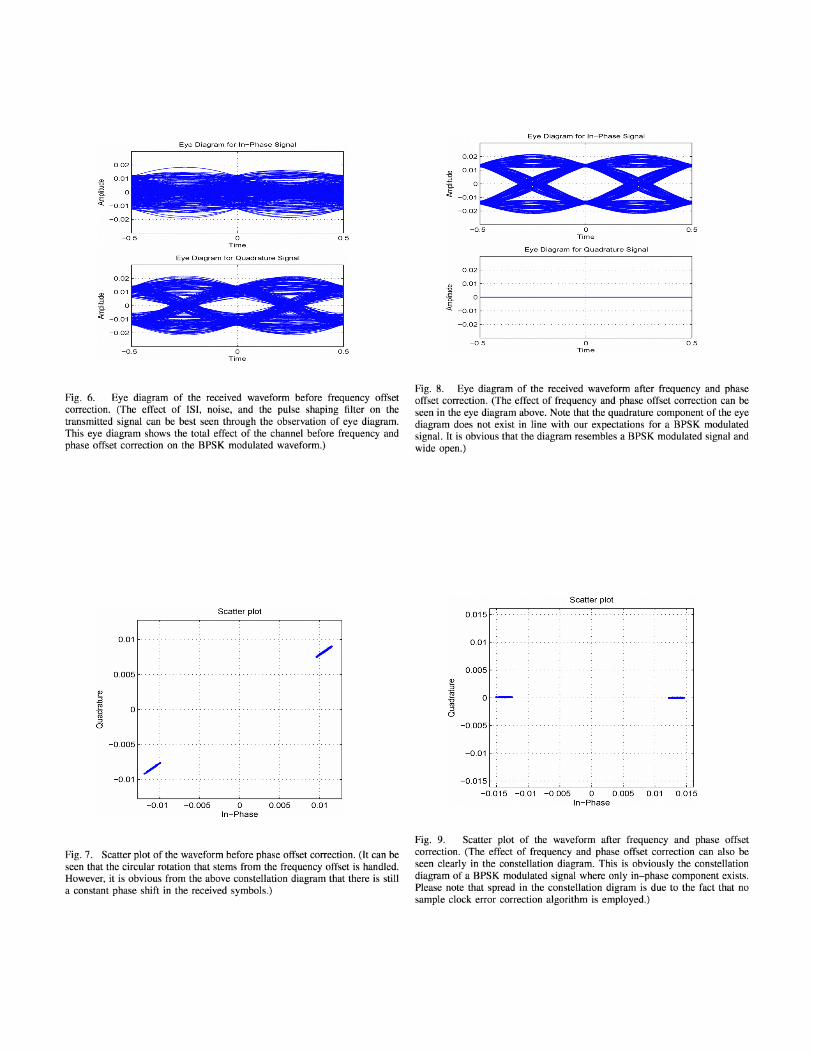
must be applied in order to find the exact position of the burstand correct symbol reference. Fine synchronization is basedon cross-correlation. An m-sequence having the same lengthas the m-sequence in the corresponding burst is generatedfor this purpose. Generated and received m-sequences arecross-correlated considering the output of the auto-correlationprocess to avoid computational complexity. The output of thecross-correlation process indicates the exact position wherethe burst starts. Phase estimation and correction is the finalstep before revealing the message . The effect of the phaseoffset on the received waveform can be seen in Fig. 7.Previously generated and received m-sequences are used inthis step in order to estimate and correct phase offset. Afterall impairments are compensated in the received waveform,Fig. 8 and Fig. 9 are obtained as eye diagram and scatter plot,respectively. These two figures clearly indicate the modulationtype as BPSK. After all undesired effects are removed from thereceived signal, the next step is to detect the received symbolsby implementing a BPSK detector and convert them into bits.Finally, these bits should be converted into characters revealingthe message content of the transmitted waveform.
.........................:::::::: ::::::::::: :THEORY':::::,,····....................
/
/
/ //
Fig. I. Conceptual representation of the model used for the wirelesscommunication systems laboratory. (Theory, simulation, test, measurement,and hardware comprise the core of the laboratory course.)
V. CONCLUSION
SDR allows nearly limitless number of ways of generatingradio signals. Rapid penetration of these devices in the wirelessmarket is highly dependent on the accurate testing and measurement of SDR capable devices. An SDR-based laboratory

3 3 3: Gl 3 3 3: Gl 3 3 3:.. .. CT> I: .. .. CT> I: .. .. CT>CT> CT> Ul .. CT> CT> Ul .. CT> CT> Ul.c .c Ul ~ .c .c Ul ~ .c .c UlI: I: .. D. I: I: .. D. I: I: ..CT> CT> CO-l CT> CT> CO-l CT> CT> co" "
CT> _ .
" "CT> _.
" " CT>n n>~
n n[ll~
n n oCT> CT> CT> CT> CT> CT>
rn=7 rn=7 rn=8 rn=8 rn=9 rn=9
Fig. 2. Frame and slot structure used in the "Experiment 7". (A burst iscomposed of two m- scquences and the message. Two rn- sequences are sentone after another in order to enable students to use auto-corre lation whilesynchronizing with the burst. Each burst is separated from each other by aguard interval with a particular duration of time.)
Fig. 4. Auto-correlation peaks. (Upon applying auto-correlation on thereceived waveform, a peak pointing the start position of the burst of interestshould appear. This step is called as the coarse synchronization)
5
X 10'
3Time Index
Burst 3
GuardIntervals
Burst1
- 150
Ern~ -100~c-o~ - 110s:w1ii - 120c0>
Ui - 130 I
- 140
3.5 4
x10'
1.5 2 2.5"me Index
0.5-1 60 L--~-~-_L-_~-~-~--~----'
o
Fig. 3. Time domain representation of the captured waveform
course, which is developed in Electrical Engineering department of USF, is outlined in this paper. The laboratory is basedon the use of SDR capable devices and structured in a waythat it is composed of complementary experiments. One of theexperiments performed as a part of the course is discussed indetail to reveal the principles followed in the design of theexperiments.
A CK NOWLED GMENT
The authors would like to thank Ahmed Hesham andOmar Zakaria for their efforts in preparing the laboratoryexperiments, and Serhan Yarkan for his helpful comments andreviewing the manuscript.
R EFERENCES
[1] J. Mitola, "The software radio architecture," IEEE CommunicationsMagazine , vol. 33, no. 5, pp. 26-38, May 1995.
[2] H. Arslan and D. Singh, "Wimax transceiver testing: Part- l - establishtest procedures for wimax transceivers," Microwaves & RF Magazine, pp.63-96, 2006.
[3] A. Webster, J. Paviol, J. Liu, H. Arslan, and L. Dunleavy, "Measurementbased modeling of a 5 ghz wlan transmitter;' in Proc. IEEE Radio andWireless Conference, September 2004, pp. 403-406.
[4] H. Arslan, "A wireless communication systems laboratory course: Connecting the pieces together through sdr capable modem instruments;'Microwaves & RF Magazi ne, October 2007.
[5] H. Meyr, M. Moeneclaey, and S. A. Fechtel, Digital CommunicationReceivers : Synchronization, Channel Estimation, and Signal Processing.Wiley-Interscience, 1998.
[6] U. Mengali and A. N. D'Andrea, Synchronization Techniques fo r DigitalReceivers . Springer, 1997.
Scatter plot
- 0.01
-0.015'-'---~--~-~--~-~----'-'
- 0.015 - 0.01 - 0.005 0 0.005 0.01 0.015In- Phase
Fig. 5. Scatter plot of the waveform before frequency offset correction.(Frequency offset is introduced due to the mismatch between transmitter andreceiver oscillators and causes a circular rotation in the symbol locations onthe constellation diagram. The extent of this rotation depends on the frequencyoffset value. This effect can be clearly seen in this plot.)
Eye Di ag ram for In - P ha se Signal
.:~~~~~----~~~ -~-----=.:=- - ~- - -
-~-- :--
0 .02
ill0 .01
'" 0"'-.'i' - 0 .0 1
- 0 .0 2
- 0 .5 oTime
Ey e Di a g ram for Q uadrature S ignal
0 .5
Eye Di ag ram fo r In - P ha se Signal
Eye Di a g ra m fo r Quad rature S ignal
0 .02
Q.l 0 .01
i of-- - - - - - - - ----- - - - - - - - - --iJf - 0 .0 1
0 .02
w 0 .01
~ 0-e,
.'i' - 0 .0 1
- 0 .0 2
- 0 .5 oT im e
0 .5
- 0 .0 2
- 0 .5 oT im e
0 .5
Fig. 6. Eye diagram of the received waveform before frequency offsetcorrection. (The effect of lSI, noise, and the pulse shaping filter on thetransmitted signal can be best seen through the observation of eye diagram.This eye diagram shows the total effect of the channel before frequency andphase offset correction on the BPSK modulated waveform.)
Fig. 7. Scatter plot of the waveform before phase offset correction. (It can beseen that the circular rotation that stems from the frequency offset is handled.However, it is obvious from the above constellation diagram that there is stilla constant phase shift in the received symbols.)
Fig. 8. Eye diagram of the received waveform after frequency and phaseoffset correction. (The effect of frequency and phase offset correction can beseen in the eye diagram above. Note that the quadrature component of the eyediagram does not exist in line with our expectations for a BPSK modulatedsignal. It is obvious that the diagram resembles a BPSK modulated signal andwide open.)
Fig. 9. Scatter plot of the waveform after frequency and phase offsetcorrection. (The effect of frequency and phase offset correction can also beseen clearly in the constellation diagram. This is obviously the constellationdiagram of a BPSK modulated signal where only in- phase component exists.Please note that spread in the constellation digram is due to the fact that nosample clock error correction algorithm is employed.)