Modeling science: Studying the structure and dynamics of science
120
Selected contributions, resulting from presentations at the workshop ‘‘Modeling Science-Understanding, Forecasting and Communicating the Science System,’’ held in Amsterdam, October 6–9, 2009 Guest Editors Katy Bo ¨rner, Indiana University Wolfgang Gla ¨nzel, Katholieke Universiteit Leuven Andrea Scharnhorst, The Royal Netherlands Academy of Arts and Sciences (Data Archives and Networked Services and e-Humanities Group) Peter van den Besselaar, Vrije Universiteit Amsterdam
Transcript of Modeling science: Studying the structure and dynamics of science

Selected contributions, resulting from presentationsat the workshop ‘‘Modeling Science-Understanding,
Forecasting and Communicating the Science System,’’held in Amsterdam, October 6–9, 2009
Guest Editors
Katy Borner, Indiana University
Wolfgang Glanzel, Katholieke Universiteit Leuven
Andrea Scharnhorst, The Royal Netherlands Academy of Arts and Sciences
(Data Archives and Networked Services and e-Humanities Group)
Peter van den Besselaar, Vrije Universiteit Amsterdam


Modeling science: studying the structure and dynamicsof science
Katy Borner • Wolfgang Glanzel • Andrea Scharnhorst •
Peter van den Besselaar
Received: 1 June 2011 / Published online: 28 June 2011� Akademiai Kiado, Budapest, Hungary 2011
Mathematical models of the science and technology (S&T) system have a long tradition in
scientometrics. They entail models of statistical properties such as the cumulative
advantage model for citation patterns by Derek de Solla Price (1976) or models of sci-
entific processes such as the epidemics of scientific ideas by William Goffman (1966).
Frequently, new modeling attempts ‘‘echo’’ major breakthroughs in mathematical mod-
eling. For example, models developed in physics, economics, or the social sciences are
frequently applied to the science system itself, validated using S&T data, and interpreted
by the authors of these models and their collaborators. This special issue aims to establish
models of the science system as a promising area of research in scientometrics enabled by
high-quality and high-coverage data, advanced data mining and modeling approaches, and
new means to visualize the structure and dynamics of science at multiple levels. Models of
science aim to answer questions regarding the basic mechanisms behind emergent struc-
tures such as scientific disciplines, scientific paradigms and cross-disciplinary research
fronts, or the career trajectories of researchers.
The issue comprises six selected contributions, resulting from presentations at the
workshop ‘‘Modeling Science—Understanding, Forecasting and Communicating The
Science System,’’ held in Amsterdam October 6–9, 2009.
• Peter Mutschke, Philipp Mayr, Philipp Schaer, and York Sure Science Models as
Value-Added Services for Scholarly Information Systems
• Serge Galam Tailor Based Allocations for Multiple Authorship: A Fractional gh-Index
K. BornerIndiana University, Bloomington, IN, USA
W. Glanzel (&)Katholieke Universiteit Leuven, Leuven, Belgiume-mail: [email protected]
A. ScharnhorstThe Royal Netherlands Academy of Arts and Sciences (Data Archives and Networked Servicesand e-Humanities Group), Eindhoven, The Netherlands
P. van den BesselaarVrije Universiteit Amsterdam, Amsterdam, The Netherlands
123
Scientometrics (2011) 89:347–348DOI 10.1007/s11192-011-0429-3

• Timothy S. Evans, Renaud Lambiotte, and Pietro Panzarasa Community Structure and
Patterns of Scientific Collaboration in Business and Management
• M. Laura Frigotto and Massimo Riccaboni A Few Special Cases: Scientific Creativity
and Network Dynamics in the Field of Rare Diseases
• Hanning Guo, Scott Weingart, and Katy Borner: Mixed-Indicators Model for
Identifying Emerging Research Areas
• Christopher Watts and Nigel Gilbert: Does Cumulative Advantage Affect Collective
Learning in Science? An Agent-Based Simulation
The papers in this special issue span a wide range: the possible use of information
retrieval as a test-bed for models (Mutschke, Mayr, Schaer, Sure), the study of properties
of new indicators such as the h-index (Galam), or measuring and modeling scientific
collaboration (Evans, Lambiotte, Panzarasa), scientific creativity (Frigotto, Riccaboni),
newly emerging research areas (Guo, Weingart, Borner), and learning (Watts, Gilbert).
Different datasets at different scales are used to design and validate the models. In-depth,
field-specific analyses as well as generic statements about the nature of scientific activity
are made. Globalization and increasing specialization accompanied by interdisciplinary
research, and changing institutional conditions (such as funding and tenure schemes)
impact the structure and dynamics of science and models of the science system. Trian-
gulation of methods (narratives, survey and bibliometrics indicators) is one possible
answer to tackle complexity (Frigotto, Riccaboni); combining different indicators and
visual analytics is another one (Guo, Weingart, Borner). Simulation models allow testing
different scenarios in the space of theoretical assumptions as well as in the empirical space
(Watts, Gilbert).
Many challenges remain: The majority of existing models remain unconnected. There
are very few attempts to compare, synthesize, or interconnect existing models (Tabah
1999; Morris and Van der Veer Martens 2008; Scharnhorst et al. 2011). Future work
should aim to integrate modeling approaches and results from different disciplines to arrive
at a more comprehensive understanding of the science system.
Acknowledgments We would like to thank the authors for their professional contributions to multiplerounds of discussions and revisions, the anonymous reviewers for their expert comments, and the journalScientometrics for editorial advice and support. This work was supported by the COST (European Coop-eration in Science and Technology) action MP0801—‘‘Physics of Competition and Conflicts,’’ the RoyalNetherlands Academy of Arts and Sciences (KNAW), in particular the Virtual Knowledge Studio for theHumanities and Social Sciences, the James S. McDonnell Foundation, the Cyberinfrastructure for NetworkScience Center (http://cns.iu.edu) at Indiana University, USA, and the Rathenau Institute, The Netherlands.
References
Goffman, W. (1966). Mathematical approach to the spread of scientific ideas—the history of mast cellresearch. Nature, 212(5061), 449.
Morris, S. A., & Van der Veer Martens, B. (2008). Mapping research specialties. Annual Review ofInformation Science and Technology, 42(1), 213–295.
Price, D. J. de Solla (1976). A general theory of bibliometric and other cumulative advantage processes.Journal of the American Society for Information Science, 27(5), 292–306.
Scharnhorst, A., Borner, K., & Van den Besselaar, P. (Eds.) (2011). Models of Science Dynamics. Berlin:Springer.
Tabah, A. N. (1999). Literature dynamics: Studies on growth, diffusion, and epidemics. Annual Review ofInformation Science and Technology, 34, 249–286.
348 K. Borner et al.
123

Science models as value-added services for scholarlyinformation systems
Peter Mutschke • Philipp Mayr • Philipp Schaer • York Sure
Received: 3 June 2011 / Published online: 19 June 2011� Akademiai Kiado, Budapest, Hungary 2011
Abstract The paper introduces scholarly Information Retrieval (IR) as a further
dimension that should be considered in the science modeling debate. The IR use case is
seen as a validation model of the adequacy of science models in representing and pre-
dicting structure and dynamics in science. Particular conceptualizations of scholarly
activity and structures in science are used as value-added search services to improve
retrieval quality: a co-word model depicting the cognitive structure of a field (used
for query expansion), the Bradford law of information concentration, and a model of
co-authorship networks (both used for re-ranking search results). An evaluation of the
retrieval quality when science model driven services are used turned out that the models
proposed actually provide beneficial effects to retrieval quality. From an IR perspective,
the models studied are therefore verified as expressive conceptualizations of central phe-
nomena in science. Thus, it could be shown that the IR perspective can significantly
contribute to a better understanding of scholarly structures and activities.
Keywords Retrieval system � Value-added services � Science models � IR �Re-ranking � Evaluation
Introduction
Science models usually address issues in statistical modeling and mapping of structures
and scholarly activities in science. As a further dimension, that should be considered in
science modeling as well, the paper focuses on the applicability of science models
in scholarly Information Retrieval (IR) with regard to the improvement of search strategies
in growing scientific information spaces. Introducing an IR perspective in science mod-
eling is motivated by the fact that scholarly IR as a science of searching for scientific
content can be also seen as a special scholarly activity that therefore should also be taken
into account in science modeling. Moreover, as scholarly Digital Libraries (DLs) can be
P. Mutschke (&) � P. Mayr � P. Schaer � Y. SureGESIS-Leibniz Institute for the Social Sciences, Lennestr. 30, 53111 Bonn, Germanye-mail: [email protected]
123
Scientometrics (2011) 89:349–364DOI 10.1007/s11192-011-0430-x

considered as particular representations of the science system, searching in DLs can be
seen as a particular use case of interacting with exactly that system that is addressed by
science modeling. From this perspective, IR can play the role of a validation model of the
science models under study.
From the perspective of IR, a further motivation point is the assumption that traditional
IR approaches fail at points where the application of science models may help: (1) the
vagueness between search and indexing terms, (2) the information overload by the amount
of result records obtained, and (3) the problem that pure term frequency based rankings
provide results that often do not meet user needs (Mayr et al. 2008). This strongly suggests
the introduction of science models in IR systems that rely more on the real research process
and have therefore a greater potential for closing the gap between information needs of
scholarly users and IR systems than conventional system-oriented approaches.
While, in this paper we mainly focus on how to use science model-enhanced IR as a test
bed for different science models, we would also like to point out that there is a further
interface between IR and scientometrics which is currently underexploited. One of the
problem solving tasks shared by IR and scientometrics is the determination of a ‘‘proper’’
selected set of documents from an ensemble. In particular for newly emerging interdis-
ciplinary fields and their evaluation the definition of the appropriate reference set of
documents is important. Glanzel et al. (2009) have discussed how bibliometrics can be also
used for the retrieval of ‘‘core literature’’. Bassecoulard et al. (2007) and Boyack and
Klavans (2010) proposed sophisticated methods to delineate fields on the basis of articles
as well as journals. However, due to the interconnectedness of research streams and
different channels of knowledge transfer, it remains a complex problem how ‘‘hard
boundaries’’ in continuously changing research landscapes can be found.
In their paper on Bibliometric Retrieval Glanzel et al. (2009) apply a combination of
methods. They start from bibliographic coupling and keyword-based search and continue
with a step-wise process to filter out the final core set from potentially relevant documents.
Hereby, they make use of methods that are standard techniques in traditional IR as well
(such as keyword-based search or thresholds). But, as already stated by Glanzel et al., ‘‘the
objectives of subject delineation in the framework of bibliometric (domain) studies
essentially differ from the goals of traditional information retrieval’’. In principle, this
requires the application of different methods.
The bibliometric retrieval approach, in particular in an evaluative context, aims at
defining a reference set of documents on the basis of a firm methodological canon, in order
to justify the application and interpretation of standardized indicators. In traditional IR, in
contrast, the application of bibliometric models and approaches has the primary goal to
enhance the search from the perspective of the user by combining a wider search space
with a particular contextualization of the search. The overall aim here is to help the user to
get a grasp about the size and structure of the information space, rather than forcing him to
precisely define the search space.
Correspondingly, the goal of the DFG-funded project ‘‘Value-added Services for
Information Retrieval’’1 (Mayr et al. 2008) presented in this paper therefore is to improve
retrieval quality in scholarly information systems by computational science models that
reason about structural properties of the science system under study. Accordingly, the
overall assumption of the IRM project is that a user’s search should improve when science
model driven search services are used. The other way around, the extent to which retrieval
quality can be improved by performing science models as search services is seen as an
1 http://www.gesis.org/irm/.
350 P. Mutschke et al.
123

indicator for the adequacy of the models taken in representing and predicting scholarly
activities in the science system under study.
In the following, we will at first introduce the models proposed. After that, the evalu-
ation study is presented. The paper closes with a discussion of the observed results and the
conclusions to be drawn for the models studied.
Models
Computational science models, to our understanding, are particular conceptualizations of
scholarly activities and structures that can be expressed in algorithms (to be operational-
ized in systems that—more or less—reason about science, such as IR systems). The paper
proposes three different kinds of science models as value-added search services that
highlight different aspects of scholarly activity (see Fig. 1): (1) a co-word model of science
addressing the cognitive structure of a field by depicting the relationships between terms in
a field (STR), (2) a bibliometric model of re-ranking, called Bradfordizing, representing
the publication form of research output and its organization on a meso-level in terms of
journals (BRAD), and (3) a co-authorship model of re-ranking examining the collaboration
between the human actors of knowledge flow in science (AUTH). STR addresses the
problem of the vagueness between search and indexing terms by pointing to co-related
terms that are more appropriate for searching, BRAD and AUTH the problem of large and
unstructured result sets by ranking a given document set according to the coreness of
journals (BRAD) or according to the centrality of authors (AUTH) in a scientific com-
munity. Thus, the three models address very different dimensions of structural properties in
the science system. Moreover, they are also heterogeneous as regards the methods applied.
The STR uses co-word analysis, BRAD bibliometric statistics, and AUTH methods taken
from social network analysis, graph theory respectively.
Fig. 1 A simple search example (query term: ‘‘Unemployment’’) and typical structural attributes/outputs ofimplemented science models in our retrieval system. From left: search term recommendation (STR)producing highly associated indexing terms, Author Networks (AUTH) with centrality-ranked author namesand Bradfordizing based on core journals (BRAD) with highly frequent journal names/ISSNs
Science models as value-added services 351
123

However, to the same extent as different science models emphasize different aspects of
scholarly activity we expect that different kind of searches are best served by relying on
corresponding science models. This approach meets the fact that the frequency of many
structural attributes of the science system (such as co-authorships) usually follows some
type of power law distribution. These highly frequent attributes which are produced when
applying the science models have a strong selectivity in the document space which can be
utilized for IR. In the following the three models, which are descriptive models of science
so far, are discussed on a general conceptual level.
A co-word model of science: relevance of co-terms
Search in textual information systems only works when a user can find the right search
terms describing his information need and the terms used in the information system. This
mapping problem is known as the Language Problem in IR (Blair 1990, 2003). While
formulating queries a user is in an ‘‘Anomalous State of Knowledge’’ (Belkin 1980)—by
trying to map the words and concepts describing his problem to the terms of the system
wasting much effort in trying to fight ambiguity and vagueness of language. This problem
especially occurs in highly specialized scientific literature databases where often only
literature reference with spare bibliographic metadata is available. Another source of
vagueness evolves from special discourse dialects in scientific communities. These dialects
are not necessarily the same dialects an information specialist would use to describe a
document or a concept using his documentation language.
Therefore, an instrument is needed to map the user’s query terms to the document terms
of the system. Especially in digital libraries searchers are confronted with databases that
contain merely short texts which are described with controlled vocabularies. User studies
in digital libraries have shown that most users are not aware of the special controlled
vocabularies used in digital libraries (Shiri and Revie 2006). Hence they are not using them
in their query formulation.
Co-word analysis (Callon et al. 1983) can be used to reduce the problem of language
ambiguity and the vagueness of query. Petras (2006) proposed a search term suggestion
system (STR) which relies on a co-word model of science that maps query terms to
indexing terms at search time on the basis of term-term-associations between two
vocabularies: (1) natural language terms from titles and abstracts and (2) controlled
vocabulary terms used for document indexing. The associations are weighted according to
their co-occurrence within the collection to predict which of the controlled vocabulary
terms best mirror the search terms (Plaunt and Norgard 1998; Buckland et al. 1999). The
weights are calculated with the aid of a contingency table of all possible combinations
of the two terms A and B: AB, A:B, :AB and :A:B where ‘‘:’’ denotes the absence of a
term. Indexing terms having a high association with a query term are then recommended to
the user for searching.
Thus, the science model proposed focuses on the cognitive structure of a field depicting
the cognitive contexts in which a term appears. Accordingly, highly associated terms are
not just related terms or synonyms. Terms that strongly appear together (in the sense of the
model) rather represent the cognitive link structure of a field, i.e. they represent the co-
issues that are discussed together within the research context in question. Thus, the STR is
not a dictionary pointing to related terms. To what the STR really points are scientific
discourses in which the user’s term appears such that the user is provided by the research
issues related to his/her term, i.e. the cognitive structure of the field in which the initial
term is embedded. In the information system this cognitive structure is described by a
352 P. Mutschke et al.
123

controlled vocabulary, used systematically for indexing the documents in the system, such
that a high probability of precise retrieval results is expected when these terms are used
(instead of natural language terms of the user). In an IR environment a STR can be used as
a query expansion mechanism by enriching the original query with highly relevant con-
trolled terms derived from the special documentation language. Query expansion is the
process of reformulation an initial query to improve retrieval performance in an infor-
mation retrieval process (Efthimiadis 1996) and can be done in two ways: manually/
interactively or automatically. Done interactively this kind of reformulation help may
improve the search experience for the user in general. Suggesting terms reduces the
searcher’s need to think of the right search terms that might describe his or her information
need. It effectively eases the cognitive load on the searcher since it is much easier for a
person to pick appropriate search terms from a list than to come up with search terms by
themselves (White and Marchionini 2007).
A further effect of the STR is that it may point the user to different expressions for the
concept the user has in mind. A new or different view on a topic may ease the user to
change the search strategy towards related issues of the field (which are represented in the
cognitive structure the STR is providing). Thus, in an interactive scenario suggested terms
or concepts can even help to alleviate ‘‘anchoring bias’’ (Blair 2002) which describes the
human tendency to rely too heavily on one concept or piece of information when making
decision. This cognitive effect can be worked against by suggesting terms and encourage a
variation in one’s initial search strategy and a reconsideration on the query formulation.
A bibliometric model of science: coreness of journals
Journals play an important role in the scientific communication process (cp. Leydesdorff
et al. 2010). They appear periodically, they are topically focused, they have established
standards of quality control and often they are involved in the academic gratification
system. Metrics like the famous impact factor are aggregated on the journal level. In some
disciplines journals are the main place for a scientific community to communicate and
discuss new research results. These examples shall illustrate the impact journals bear in the
context of science models. Modeling science or understanding the functioning of science
has a lot to do with journals and journal publication characteristics. These journal publi-
cation characteristics are the point where Bradford law can contribute to the larger topic of
science models.
Bradford law of scattering bases on literature observations the librarian S. Bradford has
been carried out in 1934. His findings and after that the formulation of the bibliometric
model stand for the beginning of the modern documentation (Bradford 1948)—a docu-
mentation which founds decisions on quantifiable measures and empirical analyses.
Bradford’s work bases on analyses with journal publications on different subjects in the
sciences.
Fundamentally, Bradford law states that literature on any scientific field or subject-
specific topic scatters in a typical way. A core or nucleus with the highest concentration of
papers—normally situated in a set of few so-called core journals—is followed by zones
with loose concentrations of paper frequencies (see Fig. 1 for a typical Bradford distri-
bution). The last zone covers the so-called periphery journals which are located in the
model far distant from the core subject and normally contribute just one or two topically
relevant papers in a defined period. Bradford law as a general law in informetrics can
successfully be applied to most scientific disciplines, and especially in multidisciplinary
scenarios (Mayr 2009).
Science models as value-added services 353
123

Bradford describes his model in the following:
The whole range of periodicals thus acts as a family of successive generations of
diminishing kinship, each generation being greater in number than the preceding, and
each constituent of a generation inversely according to its degree of remoteness.
(Bradford 1934)
Bradford provides in his publications (1934, 1948) just a graphical and verbal expla-
nation of his law. A mathematical formulation has been added later by early informetric
researchers. Bradford‘s original verbal formulation of his observation has been refined by
Brookes (1977) to a cumulative distribution function resulting in a so-called rank-order
distribution of the items in the samples. In the literature we can find different names for this
type of distribution, e.g. ‘‘long tail distribution’’, ‘‘extremely skewed’’, ‘‘law of the vital
few’’ or ‘‘power law’’ which all show the same properties of a self-similar distribution. In
the past, Bradford law is often applied in bibliometric analyses of databases and collections
e.g. as a tool for systematic collection management in library and information science. This
has direct influence on later approaches in information science, namely the development of
literature databases. The most common known resource which implements Bradford law is
the Web of Science (WoS). WoS focuses very strictly on the core of international scientific
journals and consequently neglects the majority of publications in successive zones.
Bradfordizing, originally described by White (1981), is a simple utilization of the
Bradford law of scattering model which sorts/re-ranks a result set accordingly to the rank a
journal gets in a Bradford distribution. The journals in a search result are ranked by the
frequency of their listing in the result set, i.e. the number of articles in a certain journal. If a
search result is ‘‘Bradfordized’’, articles of core journals are ranked ahead of the journals
which contain only an average number (Zone 2) or just few articles (Zone 3) on a topic
(compare the example in Fig. 1). This re-ranking method is interesting because it is a
robust and quick way of sorting the central publication sources for any query to the top
positions of a result set such that ‘‘the most productive, in terms of its yield of hits, is
placed first; the second-most productive journal is second; and so on, down through the last
rank of journals yielding only one hit apiece’’ (White 1981).2
Thus, Bradfordizing is a model of science that is of particular relevance also for
scholarly information systems due to its structuring ability and the possibility to reduce a
large document set into a core and succeeding zones. On the other hand, modeling science
into a core (producing something like coreness) and a periphery always runs the risk and
critic of disregarding important developments outside the core.
A network model of science: centrality of authors
The background of author centrality as a network model of science is the perception of
‘‘science (as) a social institution where the production of scientific knowledge is embedded
in collaborative networks of scientists’’ (He 2009, see also Sonnewald 2007). Those net-
works are seen as ‘‘one representation of the collective, self-organized emerging structures
in science’’ (Borner and Scharnhorst 2009). Moreover, because of the increasing com-
plexity of nowadays research issues collaboration is becoming more and more ‘‘one of the
key concepts in current scientific research communication’’ (Jiang 2008). The increasing
2 Bradfordizing can be applied to document types other than journal article, e.g. monographs (cf. Worthen1975; Mayr 2008, 2009). Monographs e.g. provide ISBN numbers which are also good identifiers for theBradfordizing analysis.
354 P. Mutschke et al.
123

significance of collaboration in science not only correlates with an increasing amount (Lu
and Feng 2009; Leydesdorff and Wagner 2008) but also, and more importantly, with an
increasing impact of collaborative papers (Beaver 2004; Glanzel et al. 2009; Lang and
Neyer 2004).
Collaboration in science is mainly represented by co-authorships between two or more
authors who write a publication together. Transferred to a whole community, co-author-
ships form a co-authorship network reflecting the overall collaboration structure of a
community. Co-authorship networks have been intensively studied. Most of the studies,
however, focus mainly either on general network properties (see Newman 2001; Barabasi
et al. 2002) or on empirical investigation of particular networks (Yin et al. 2006; Liu et al.
2005). To our knowledge, Mutschke was among the first who pointed to the relationship
between co-authorship networks and other scientific phenomena, such as cognitive struc-
tures (Mutschke and Renner 1995; Mutschke and Quan-Haase 2001), and particular sci-
entific activities, such as searching scholarly DLs (Mutschke 1994, 2001, 2004b).
From the perspective of science modeling it is important to note that, as co-authorships
also indicate the share of knowledge among authors, ‘‘a co-authorship network is as much a
network depicting academic society as it is a network depicting the structure of our
knowledge’’ (Newman 2004). A crucial effect of being embedded in a network is that
‘‘some individuals are more influential and visible than others as a result of their position in
the network’’ (Yin et al. 2006). As a consequence, the structure of a network also affects
the knowledge flow in the community and becomes therefore an important issue for
science modeling as well as for IR (cp. Mutschke and Quan-Haase 2001; Jiang 2008; Lu
and Feng 2009; Liu et al. 2005).
This perception of collaboration in science corresponds directly with the idea of
structural centrality (Bavelas 1948; Freeman 1977) which characterizes centrality as a
property of the strategic position of nodes within the relational structure of a network.
Interestingly, collaboration in science is often characterized in terms that match a particular
concept of centrality widely used in social network analysis, namely the betweenness
centrality measure which evaluates the degree to which a node is positioned between others
on shortest paths in the graph, i.e. the degree to which a node plays such an intermediary
role for other pairs of nodes. Yin et al. (2006) see co-authorship as a ‘‘process in which
knowledge flows among scientists’’. Chen et al. (2009) characterize ‘‘scientific discoveries
as a brokerage process (which) unifies knowledge diffusion as an integral part of a col-
lective information foraging process’’. That brokerage role of collaboration correlates
conceptually to the betweenness measure which also emphasizes the bridge or brokerage
role of a node in a network (Freeman 1977, 1978/1979, 1980; cp. Mutschke 2010).
The betweenness-related role of collaboration in science was confirmed by a number of
empirical studies. Yan and Ding (2009) discovered a high correlation between citation
counts and the betweenness of authors in co-authorship networks. Liu et al. (2005) dis-
covered a strong correlation between program committee membership and betweenness in
co-authorship networks. Mutschke and Quan-Haase (2001) observed a high correlation of
betweenness in co-authorship networks and betweenness of the author‘s topics in keyword
networks. High betweenness authors are therefore characterized as ‘‘pivot points of
knowledge flow in the network’’ (Yin et al. 2006). They can be seen as the main driving
forces not only for just bridging gaps between different communities but also, by bringing
different authors together, for community making processes.
This strongly suggests the use of an author centrality model of science also for
re-ranking in scholarly IR (cf. Zhou et al. 2007). Our model of author centrality based
ranking originates from the model initially proposed by Mutschke (1994) which has been
Science models as value-added services 355
123
re-implemented for a real-life IR environment, to our knowledge before anyone else,
within the Daffodil system (Mutschke 2001; Fuhr et al. 2002) and the infoconnex portal
(Mutschke 2004a, b). Currently, the ranking model is provided by the German Social
Science portal sowiport3 as a particular re-ranking service. The general assumption of the
model is that a publication’s impact can be quantified by the impact of their authors which
is given by their centrality in co-authorship networks (cp. Yan and Ding 2009). Accord-
ingly, an index of betweenness of authors in a co-authorship network is seen as an index of
the relevance of the authors for the domain in question and is therefore used for re-ranking,
i.e., a retrieved set of publications is re-ranked according to the betweenness values of the
publications’ authors such that publications of central authors are ranked on top.
However, two particular problems emerge from that model. One is the conceptual
problem of author name ambiguity (homonymy, synonymy) in bibliographic databases. In
particular the potential homonymy of names may misrepresent the true social structure of a
scientific community. The other problem is the computation effort needed for calculating
betweenness in large networks that may bother, in case of long computation times, the
retrieval process and finally user acceptance. In the following an evaluation of the retrieval
quality of the three science model driven search services are presented.
Evaluation
Proof-of-concept prototype
All three proposed models were implemented in an online information system4 to dem-
onstrate the general feasibility of the three approaches. The prototype uses those models as
particular search stratagems (Bates 1990) to enhance retrieval quality. The open source
search server Solr5 is used as the basic retrieval engine which provides a standard term
frequency based ranking mechanism (TF-IDF). All three models work as retrieval add-ons
on-the-fly during the retrieval process.
The STR module is based on a commercial classification software (Recommind
Mindserver). The term associations are visualized as term clouds such that the user can see
the contexts in which the terms the user has in mind appear in the collection. This enables
the user to select more appropriate search terms from the cloud to expand the original
query.
The Bradfordizing re-ranking model is implemented as a Solr plugin which orders all
search results with an ISSN number such that the journal with the highest ISSN count gets
the top position in the result set, the second journal the next position, and so forth. The
numerical TF-IDF ranking value of each journal paper in the result set is then multiplied
with the frequency count of the respective journal. The result of this computation is taken
for re-ranking such that core journal publications are ranked on top.
The author centrality based re-ranking model computes a co-authorship network on the
basis of the result set retrieved for a query, according to the co-authorships appearing in the
result set documents.6 For each node in the graph betweenness is measured, and each
3 www.gesis.org/sowiport.4 www.gesis.org/beta/prototypen/irm.5 http://lucene.apache.org/solr/.6 Actually, the author–author-relations are computed during indexing time and are retrieved by the systemvia particular facets added to the user’s query.
356 P. Mutschke et al.
123

document in the result set is assigned a relevance value given by the maximum
betweenness value of its authors. Single authored publications are captured by this method
if their authors appear in the graph due to other publications they have published in co-
authorship. Thus, just publications from pure single fighters are ignored by this procedure.
The result set is then re-ranked by the centrality value of the documents’ authors such that
publications of central authors appear on the top of the list.
Methods
A major research issue of the project is the evaluation of the contribution of the three
services studied to retrieval quality: Do central authors, core journals respectively, actually
provide more relevant hits than conventional text-based rankings? Does a query expansion
by highly associated co-words of the initial query terms have any positive effects on
retrieval quality? Do combinations of the services enhance the effects? By measuring the
contribution of our services to retrieval performance we expect deeper insights in the
structure and the functioning the science system: As searching in a scientific information
system is seen as a way of interacting with the science system, retrieval quality evaluation
might also play the role of a ‘‘litmus test’’ for the adequacy of the science models taken for
understanding, forecasting and communicating the science system. Thus, the investigation
of science model driven value added services for scholarly information systems might
contribute to a better understanding of science.
The standard approach to evaluate IR systems is to do relevance assessments, i.e. the
documents retrieved are marked as relevant or not relevant with respect to previously
defined information need (cf. TREC,7 CLEF8). Modern collections usually are large and
cannot be assessed in total. Therefore, only subsets of the collection are assessed by a so-
called pooling method (Voorhees and Harman 2005) where the top n documents returned
by the different IR systems are taken. The assessors have to judge just the documents in the
subsets without knowing the originating IR systems.
Data and topics
In our study, a precision test of the three proposed models was conducted by performing
user assessments of the top ten documents provided by each of the three services. As a
baseline, the initial TF-IDF ranking done by the Solr engine was taken and therefore also
judged. As regards STR, the initial query was expanded automatically by the four strongest
associated co-words.
The precision test was carried out with 73 participants for ten different predefined topics
from the CLEF corpus. Each assessor had to choose one out of the ten topics. The
judgments were done according to the topic title and the topic description. The assessors
were instructed how to assess in a briefing. Each of the four evaluated systems
(AUTH = re-ranking by author centrality, BRAD = re-ranking by Bradfordizing,
STR = TF-IDF ranking for the expanded query, and SOLR as the baseline) returned the
n = 10 top ranked documents, which formed the pool of documents to be assessed.
Duplicates were removed, so that the size of the sample pools was between 34 and 39
documents. The assessors had to judge each document in the pool as relevant or not
7 http://trec.nist.gov/.8 http://www.clef-campaign.org/.
Science models as value-added services 357
123
relevant (binary decision). In case they did not assess a document this document is ignored
in later calculations.
The retrieval test was performed on the basis of the SOLIS9 database that consists of
369,397 single documents (including title, abstract, controlled keyword etc.
The 73 assessors did 43.78 single assessments on average which sums up to 3,196 single
relevance judgments in total. Only 5 participants didn’t fill out the assessment form
completely, but 13 did more than one. Since every assessor could freely choose from these
topics the assessments are not distributed evenly.
Results
Overall agreement and inter-grader reliability
The assessors in this experiment were not professionals and/or domain experts but students
(mainly library and information science). However, according to findings in TREC where a
rather high overall agreement between official TREC and non-TREC assessors was
observed (Al-Maskari et al. 2008; Alonso and Mizzaro 2009), we also assume not a
significant difference between domain experts and students in information science since all
topics are every-day life topics.10 The 73 assessors in our study judged a total of 3,196
single documents with an overall agreement over all topics and among all participants of
82%. 124 of 363 cases where perfect matches where all assessors agreed 100% (all relevant
and non relevant judgments matched). To rate the reliability and consistency of agreement
between the different assessments we applied the Fleiss’s Kappa measure of inter-grader
reliability for nominal or binary ratings (Fleiss 1971). All Kappa scores in our experiment
range between 0.20 and 0.52 which indicates a mainly acceptable level of overall agree-
ment (for more details see Schaer et al. 2010).
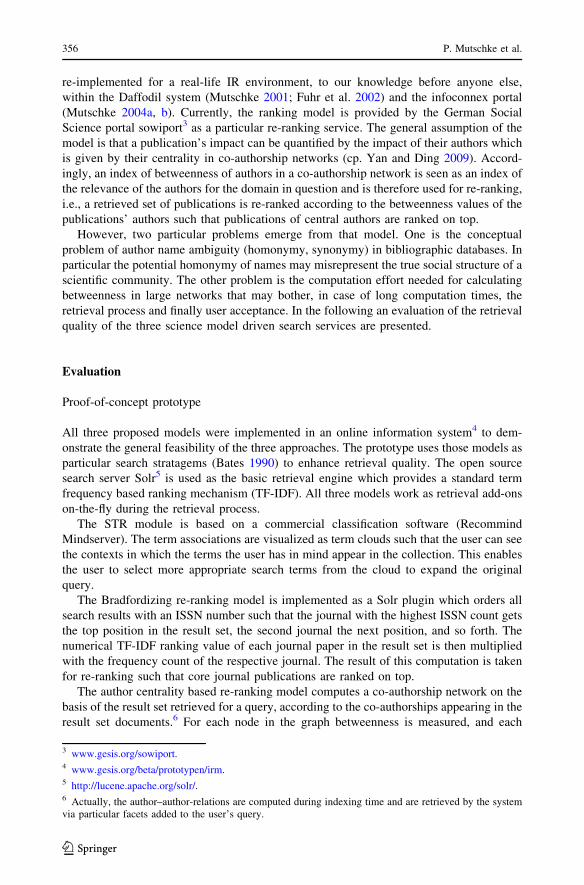
Precision
The precision P of each service was calculated by
P ¼ jrjjr þ nrj ð1Þ
for each topic, where |r| is the number of all relevant assessed documents and |r ? nr| is the
number of all assessed documents (relevant and not relevant). A graph of all precision
values including standard error can be seen in Fig. 2.
In our experiment the Solr standard relevance ranking algorithm (based on TF-IDF) was
taken as the baseline to which each of the three value-added services proposed had to
compare. The average precision of TF-IDF over all topics and assessors was 57%, where
values range between 17 and 75%. Ignoring the 17% value all other values are stable
around the baseline. For two topics (83 and 84) the baseline was also the best judged result.
STR used the same SOLR ranking mechanism as the baseline but with the addition of
automatically expanded queries. By expanding the query with the n = 4 suggested terms
with the highest confidence the average precision could be raised from 57 to 67% which is
an impressive improvement in precision, despite that fact that a larger recall is obtained
9 http://www.gesis.org/solis.10 However, a retrieval study with experts from different domains is currently carried out.
358 P. Mutschke et al.
123

(due to OR-ing the query with the four additional terms). In three cases precision drops
below the baseline (topic 84, 96 and 105). If we take standard error in consideration only
topic 105 is a real outliner (45% vs. a baseline of 66%).
Looking at the four topics where STR performed best (88, 110, 166 and 173 with an
improvement of 20% at least compared to the baseline) it can be seen that this positive
query drift was because of the new perspective added by the suggested terms. STR added
new key elements to the query that were not included before. For topic 88 (‘‘Sports in Nazi
Germany’’), for instance, the suggested term with the highest confidence was ‘‘Olympic
Games’’. A term that was not included in title or description in any way. Of course, sports
in Nazi Germany is not only focused on the Olympic Games 1936, but with a high
probability everything related to the Olympic Games 1936 had to do with sports in Nazi
Germany and was in this way judged relevant by the assessors. Other topics showed
comparable phenomena.
The two alternative re-ranking mechanisms Bradfordizing and Author Centrality
achieved an average precision that is near the baseline (57%), namely 60% for Author
Centrality and 57% for Bradfordizing. Author Centrality yielded a higher, but not sig-
nificantly higher average precision than Solr as a conventional ranking mechanism.11 Both
re-rank mechanisms showed a stable behavior (again, expect some outlier, cp. Fig. 2).
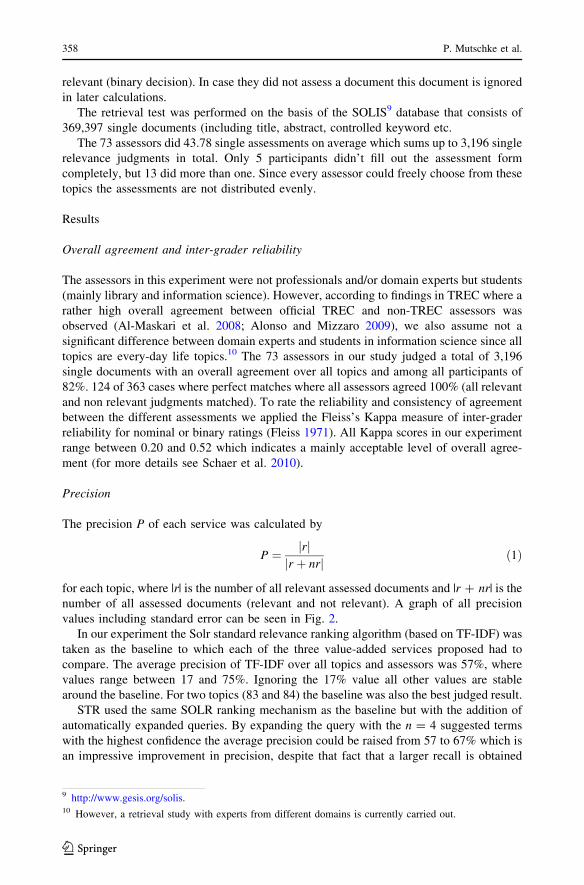
Overlap of top document result sets
However, a more important result as regards the two re-ranking services is that they point
to quite other documents than other services. This indicates that the science models behind
them provide a very different view to the document space. A comparison of the inter-
section of the relevant top 10 document result sets between each pair of retrieval service
shows that the result sets are nearly disjoint. 400 documents (4 services 9 10 per
0%
10%
20%
30%
40%
50%
60%
70%
80%
90%
100% AUTH
BRAD
SOLR
STR
Fig. 2 Precision for each topic and service (relevance assessments per topic/total amount of singleassessments), including standard error
11 Moreover, we observed a high range of re-rankings done by Author Centrality. More than 90% of thedocuments in the result sets were captured by the author centrality based ranking.
Science models as value-added services 359
123

service 9 10 topics) only had 36 intersections in total (cp. Fig. 3). Thus, there is no or very
little overlap between the sets of relevant top documents obtained from different rankings.
AUTH and SOLR as well as AUTH and BRAD have just three relevant documents in
common (for all 10 topics), and AUTH and STR have only five documents in common.
BRAD and SOLR have six, and BRAD and STR have five relevant documents in common.
The largest, but still low overlap is among SOLR and STR which have 14 common
documents. That confirms that the models proposed provide views to the document space
that differ greatly from standard retrieval models as well as from one another. This can be
also seen as a positive validation of the adequacy of the science models taken for repre-
senting relevant and quite different scientific activities.
Discussion
Two important implications emerge from the evaluation results: (1) The science models
proposed provide beneficial effects to information retrieval quality. The precision tests
turned out a precision of science-model driven search services which is at least as high as
the precision of standard rankings. The more important effect of the models however is that
they provide a particular view to the information space that is quite different from tradi-
tional retrieval methods such that the models open up new access paths to the knowledge
space in question. (2) The science models studied are therefore verified as expressive
models of science, as an evaluation of retrieval quality is seen as a litmus test of the
adequacy of the models investigated. Moreover, it turned out that the results provided by
the three science models investigated differ to a great extend which indicates that the
models highlight very different dimensions of scientific activity. This also demonstrates
that the models properly address the diversity of structures and dynamics in science.
The evaluation of retrieval quality achieved by a co-word model approach of query
expansion, as performed by the STR, turned out significantly that a ‘‘query drift’’ (Mitra
et al. 1998) towards terms that better reflect the scientific discourse(s) actually tends to
14
3
6
STR
AUTH BRAD
5 5
3
SOLR
0
Fig. 3 Intersection of suggested top n = 10 documents over all topics and services (total of 400documents)
360 P. Mutschke et al.
123

retrieve more relevant documents (cp. Petras 2006). It is important to note that this positive
effect is not only achieved by just mapping query terms to controlled terms from the
indexing vocabulary, but mainly by linking the original query to the right research context
the user has in mind, i.e. to research issues that are strongly co-related to the original term.
The STR maps a query term to the cognitive structure of a field allowing the user to
identify and select related topics and streams which obviously leads to more precise
queries. Thus, the co-word model of science is verified as an expressive model of accessing
the cognitive structure of a field and its various dimensions.
As regards the two re-ranking methods some added-values appear very clearly. On an
abstract level, the re-ranking models can be used as a compensation mechanism for
enlarged search spaces. Our analyses show that the hierarchy of the result set after
re-ranking by Bradfordizing or Author Centrality is a completely different one compared
to the original ranking. The user gets a new result cutout containing other relevant doc-
uments which are not listed in the first section of the original list. Additionally, the
re-ranking via structure-oriented science models offer an opportunity to switch between
term-based search and structure-oriented browsing of document sets (Bates 2002). On the
other hand, modeling science into a core and a periphery—the general approach of both
re-ranking models—always runs the risk and critic of disregarding important developments
outside the core (cp. Hjørland and Nicolaisen 2005). Both models, however, imply the
principle possibility to turn round the ranking in order to explicitly address publications of
less central authors or publications in peripheral journals. Moreover, and probably more
interesting, might be the ability of the models to point to items that appear between the top
and the ‘‘midfield’’ of the structure, for instance publications in zone 2 journals or pub-
lications of ‘‘social climbers’’ in co-authorship networks (who seem to have a strong
tendency of addressing innovative topics instead of mainstream issues, see Mutschke and
Quan-Haase 2001).
Thus, it could be shown how structural models of science can be used to improve
retrieval quality. The other way around, the IR experiment turned out that to the same
extent to which science models contribute to IR (in a positive as well as negative sense),
science-model driven IR might contribute to a better understanding of different concep-
tualizations of science (role of journals, authors and language in scientific discourses).
Recall and precision values of retrieval results obtained by science model oriented search
and ranking techniques seem to provide important indicators for the adequacy of science
models in representing and predicting structural phenomena in science.
As regards the relationship between bibliometric-aided retrieval and traditional IR it
turned out that, although the different perspectives aim at different objectives, on a generic
level they share questions of the determination of the relevant information space and
boundary setting in such a space. Thus, we could imagine that a future systematic com-
parison of bibliometric-aided retrieval and traditional IR approaches could be of relevance
both for the questions ‘‘what is a scientific field?’’ as well as for ‘‘what is the scientific field
relevant for my search?’’. In such a study, the different models of science could be
explicitly addressed and compared, together with the different selection criteria as applied
by the two retrieval approaches.
A further point that might be interesting from the perspective of science modeling is the
degree of acceptance of science models as retrieval methods by the users of a scholarly IR
system. The degree to which scientists are willing to use those models for finding what they
are looking for (as particular search stratagems, as proposed by Bates 2002) is a further
relevant indicator for the degree to which the models intuitively meet the real research
process. Thus, the major contributions of IR to science modeling might be to measure the
Science models as value-added services 361
123

expressiveness of existing science models and to generate novel models from the per-
spective of IR. In addition, the application and utilization of science model enhanced
public retrieval systems can probably be a vehicle to better explain and communicate
science and science models to a broader audience in the sense of public understanding of
science.
However, a lot of research effort needs to be done to make more progress in coupling
science modeling with IR. We see this paper as a first step in this area. The major challenge
that we see here is to consider also the dynamic mechanisms which form the structures and
activities in question and their relationships to dynamic features in scholarly information
retrieval.12
Acknowledgments We would like to express our grateful thanks to Andrea Scharnhorst for her valuablecomments. Special thanks go to the students in two independent LIS courses at Humboldt University(guided by our former colleague Vivien Petras) and University of Applied Science in Darmstadt. Thesestudents took part in our first IRM retrieval test in the winter semester 2009/2010. We thank Hasan Bas whodid the main implementation work for our assessment tool. The project is funded by DFG, grant No. INST658/6-1.
References
Al-Maskari, A., Sanderson, M., & Clough, P. (2008). Relevance judgments between TREC and Non-TRECassessors. Proceedings of SIGIR, 2009, 683–684.
Alonso, O., & Mizzaro, S. (2009). Can we get rid of TREC assessors? Using Mechanical Turk for relevanceassessment. In Proceedings of the SIGIR 2009 workshop on the future of IR evaluation (pp. 15–16).
Barabasi, A. L., Jeong, H., Neda, Z., Ravasz, E., Schubert, A., & Vicsek, T. (2002). Evolution of the socialnetwork of scientific collaborations. Physica A, 311, 590–614.
Bassecoulard, E., Lelu, A., & Zitt, M. (2007). A modular sequence of retrieval procedures to delineate ascientific field: from vocabulary to citations and back. In E. Torres-Salinas & H. F. Moed (Eds.),Proceedings of the 11th international conference on scientometrics and informetrics (ISSI 2007),Madrid, Spain, 25–27 June 2007 (pp. 74–84).
Bates, M. J. (1990). Where should the person stop and the information search interface start? InformationProcessing & Management, 26, 575–591.
Bates, M. J. (2002). Speculations on browsing, directed searching, and linking in relation to the Bradforddistribution. Paper presented at the Fourth International Conference on Conceptions of Library andInformation Science (CoLIS 4).
Bavelas, A. (1948). A mathematical model for group structure. Applied Anthropology, 7, 16–30.Beaver, D. (2004). Does collaborative research have greater epistemic authority? Scientometrics, 60(3),
309–408.Belkin, N. J. (1980). Anomalous states of knowledge as a basis for information retrieval. Canadian Journal
of Information Science, 5, 133–143.Blair, D. C. (1990). Language and representation in information retrieval. Amsterdam, NY: Elsevier.Blair, D. C. (2002). The challenge of commercial document retrieval. Part II. A strategy for document
searching based on identifiable document partitions. Information Processing and Management, 38(2),293–304.
Blair, D. C. (2003). Information retrieval and the philosophy of language. Annual Review of InformationScience and Technology, 37, 3–50.
Borner, K., & Scharnhorst, A. (2009). Visual conceptualizations and models of science. Journal of Infor-metrics, 3, 161–172.
Boyack, K. W., & Klavans, R. (2010). Co-citation analysis, bibliographic coupling, and direct citation:Which citation approach represents the research front most accurately? JASIST, 61(12), 2389–2404.
Bradford, S. C. (1934). Sources of information on specific subjects. Engineering, 137(3550), 85–86.Bradford, S. C. (1948). Documentation. London: Lockwood.Brookes, B. C. (1977). Theory of the Bradford Law. Journal of Documentation, 33(3), 180–209.
12 See Huberman and Adamic (2004) and Mutschke (2004b) for first attempts in that direction.
362 P. Mutschke et al.
123
Buckland, M., Chen, A., Chen, H.-M., Kim, Y., Lam, B., Larson, R., et al. (1999). Mapping entryvocabulary to unfamiliar metadata vocabularies. D-Lib Magazine, 5(1).
Callon, M., Courtial, J.-P., Turner, W. A., & Bauin, S. (1983). From translations to problematic networks:An introduction to co-word analysis. Social Science Information, 22(2), 191–235.
Chen, C., Chen, Y., Horowitz, M., Hou, H., Liu, Z., & Pellegrino, D. (2009). Towards an explanatory andcomputational theory of scientific discovery. Journal of Informetrics, 3, 191–209.
Efthimiadis, E. N. (1996). Query expansion. In M. E. Williams (Ed.), Annual review of information systemsand technology (ARIST) (Vol. 31, pp. 121–187). Information Today.
Fleiss, J. L. (1971). Measuring nominal scale agreement among many raters. Psychological Bulletin, 76(5),378–382.
Freeman, L. C. (1977). A set of measures of centrality based on betweenness. Sociometry, 40, 35–41.Freeman, L. C. (1978/1979). Centrality in social networks: Conceptual clarification. Social Networks, 1,
215–239.Freeman, L. C. (1980). The gatekeeper, pair-dependency and structural centrality. Quality & Quantity, 14,
585–592.Fuhr, N., Schaefer, A., Klas, C.-P., & Mutschke, P. (2002). Daffodil: An integrated desktop for supporting
high-level search activities in federated digital libraries. In M. Agosti & C. Thanos (Eds.), Researchand advanced technology for digital libraries. 6th European conference, EDCL 2002, proceedings(pp. 597–612). Berlin: Springer-Verlag.
Glanzel, W., Janssens, F., & Thijs, B. (2009). A comparative analysis of publication activity and citationimpact based on the core literature in bioinformatics. Scientometrics, 79(1), 109–129.
He, Z.-L. (2009). International collaboration does not have greater epistemic authority. JASIST, 60(10),2151–2164.
Hjørland, B., & Nicolaisen, J. (2005). Bradford’s law of scattering: ambiguities in the concept of ‘‘subject’’.Paper presented at the 5th International Conference on Conceptions of Library and InformationScience.
Huberman, B. A., & Adamic, L. A. (2004). Information dynamics in the networked world. Lect. Notes Phys.(Vol. 650, pp. 371–398).
Jiang, Y. (2008). Locating active actors in the scientific collaboration communities based on interactiontopology analysis. Scientometrics, 74(3), 471–482.
Lang, F. R., & Neyer, F. J. (2004). Kooperationsnetzwerke und Karrieren an deutschen Hochschulen. KfZSS,56(3), 520–538.
Leydesdorff, L., de Moya-Anegon, F., & Guerrero-Bote, V. P. (2010). Journal maps on the basis of Scopusdata: A comparison with the Journal Citation Reports of the ISI. JASIST, 61(2), 352–369.
Leydesdorff, L., & Wagner, C. S. (2008). International collaboration in science and the formation of a coregroup. Journal of Informetrics, 2(4), 317–325.
Liu, X., Bollen, J., Nelson, M. L., & van de Sompel, H. (2005). Co-authorship networks in the digital libraryresearch community. Information Processing and Management, 41(2005), 1462–1480.
Lu, H., & Feng, Y. (2009). A measure of authors’ centrality in co-authorship networks based on thedistribution of collaborative relationships. Scientometrics, 81(2), 499–511.
Mayr, P. (2008). An evaluation of Bradfordizing effects. In Proceedings of WIS 2008, Berlin, fourthinternational conference on webometrics, informetrics and scientometrics & ninth COLLNET meeting.Humboldt-Universitat zu Berlin.
Mayr, P. (2009). Re-Ranking auf Basis von Bradfordizing fur die verteilte Suche in Digitalen Bibliotheken.Berlin: Humboldt-Universitat zu Berlin.
Mayr, P., Mutschke, P., & Petras, V. (2008). Reducing semantic complexity in distributed digital libraries:Treatment of term vagueness and document re-ranking. Library Review, 57(3), 213–224.
Mitra, M., Singhal, A., & Buckley C. (1998). Improving automatic query expansion. In Proceedings ofSIGIR (pp. 206–214).
Mutschke, P. (1994). Processing scientific networks in bibliographic databases. In H. H. Bock, et al. (Eds.),Information systems and data analysis. Prospects–foundations–applications. Proceedings 17th annualconference of the GfKl 1993 (pp. 127–133). Heidelberg: Springer-Verlag.
Mutschke, P. (2001). Enhancing information retrieval in federated bibliographic data sources using authornetwork based stratagems. In P. Constantopoulos & I. T. Solvberg (Eds.), Research and advancedtechnology for digital libraries: 5th European conference, ECDL 2001, Proceedings (Vol. 2163,pp. 287–299). Notes in Computer Science. Berlin: Springer-Verlag.
Mutschke, P. (2004a). Autorennetzwerke: Verfahren der Netzwerkanalyse als Mehrwertdienste fur Infor-mationssysteme. Bonn: Informationszentrum Sozialwissenschaften (IZ-Arbeitsbericht Nr. 32).
Mutschke, P. (2004b). Autorennetzwerke: Netzwerkanalyse als Mehrwertdienst fur Informationssysteme.In B. Bekavac, et al. (Eds.), Information zwischen Kultur und Marktwirtschaft: Proceedings des 9.
Science models as value-added services 363
123

Internationalen Symposiums fur Informationswissenschaft (ISI 2004) (pp. 141–162). Konstanz: UVKVerl.-Ges.
Mutschke, P. (2010). Zentralitats- und Prestigemaße. In R. Haußling & C. Stegbauer (Eds.), HandbuchNetzwerkforschung (pp. 365–378). Wiesbaden: VS-Verlag fur Sozialwissenschaften.
Mutschke, P., & Quan-Haase, A. (2001). Collaboration and cognitive structures in social science researchfields: Towards socio-cognitive analysis in information systems. Scientometrics, 52(3), 487–502.
Mutschke, P., & Renner, I. (1995). Akteure und Themen im Gewaltdiskurs: Eine Strukturanalyse derForschungslandschaft. In E. Mochmann & U. Gerhardt (Eds.), Gewalt in Deutschland: Soziale Befundeund Deutungslinien (pp. 147–192). Munich: Oldenburg Verlag.
Newman, M. E. J. (2001). The structure of scientific collaboration networks. PNAS, 98, 404–409.Newman, M. E. J. (2004). Coauthorship networks and patterns of scientific collaboration. PNAS, 101,
5200–5205.Petras, V. (2006). Translating dialects in search: Mapping between specialized languages of discourse and
documentary languages. Berkley: University of California.Plaunt, C., & Norgard, B. A. (1998). An association based method for automatic indexing with a controlled
vocabulary. Journal of the American Society for Information Science, 49(August 1998), 888–902.Schaer, P., Mayr, P., & Mutschke, P. (2010). Implications of inter-rater agreement on a student information
retrieval evaluation. In M. Atzmuller, et al. (Eds.), Proceedings of LWA2010—Workshop-Woche:Lernen, Wissen & Adaptivitat.
Shiri, A., & Revie, C. (2006). Query expansion behavior within a thesaurus-enhanced search environment:A user-centered evaluation. JASIST, 57(4), 462–478.
Sonnewald, D. H. (2007). Scientific collaboration. Annual Review of Information Science & Technology,41(1), 643–681.
Voorhees, E. M., & Harman, D. K. (Eds.). (2005). TREC: Experiment and evaluation in informationretrieval. Cambridge, MA: The MIT Press.
White, H. D. (1981). ‘Bradfordizing’ search output: how it would help online users. Online Review, 5(1),47–54.
White, R. W., & Marchionini, G. (2007). Examining the effectiveness of real-time query expansion.Information Processing & Management, 43(3), 685–704.
Worthen, D. B. (1975). The application of Bradford’s law to monographs. Journal of Documentation, 31(1),19–25.
Yan, E., & Ding, Y. (2009). Applying centrality measures to impact analysis: A coauthorship networkanalysis. JASIST, 60(10), 21-07-2118.
Yin, L., Kretschmer, H., Hannemann, R. A., & Liu, Z. (2006). Connection and stratification in researchcollaboration: An analysis of the COLLNET network. Information Processing & Management, 42,1599–1613.
Zhou, D., Orshansky, S. A., Zha, H., & Giles, C. L. (2007). Co-ranking authors and documents in aheterogeneous network. In Proceedings of the 2007 seventh IEEE international conference on datamining (pp. 739–744).
364 P. Mutschke et al.
123

Tailor based allocations for multiple authorship:a fractional gh-index
Serge Galam
Received: 30 May 2011 / Published online: 26 August 2011� Akademiai Kiado, Budapest, Hungary 2011
Abstract A quantitative modification to keep the number of published papers invariant
under multiple authorship is suggested. In those cases, fractional allocations are attributed
to each co-author with a summation equal to one. These allocations are tailored on the
basis of each author contribution. It is denoted ‘‘Tailor Based Allocations (TBA)’’ for
multiple authorship. Several protocols to TBA are suggested. The choice of a specific TBA
may vary from one discipline to another. In addition, TBA is applied to the number of
citations of a multiple author paper to have also this number conserved. Each author gets
only a specific fraction of the total number of citations according to its fractional paper
allocation. The equivalent of the h-index obtained by using TBA is denoted the gh-index.
It yields values which differ drastically from those given by the h-index. The gh-index
departs also from �h recently proposed by Hirsh to account for multiple authorship. Con-
trary to the h-index, the gh-index is a function of the total number of citations of each
paper. A highly cited paper allows a better allocation for all co-authors while a less cited
paper contributes essentially to one or two of the co-authors. The scheme produces a
substantial redistribution of the ranking of scientists in terms of quantitative records. A few
illustrations are provided.
Keywords Multiple authorship � Fractional allocations � h-Index
Introduction
Individual bibliometry is today a major instrument to allocating research funds, promoting
academics and recruiting researchers. The existence of the h-index (Hirsch 2005) has
boosted the use of quantitative measures of scientist productions. In particular its incor-
poration within the Web of Science via a simple button have just turned upside-down the
S. Galam (&)Centre de Recherche en Epistemologie Appliquee, Ecole Polytechnique and CNRS, CREA,Boulevard Victor, 32, 75015 Paris, Francee-mail: [email protected]
123
Scientometrics (2011) 89:365–379DOI 10.1007/s11192-011-0447-1

world of evaluation. The use of the h-index is now widespread and unavoidable despite all
the associated shortcomings and biases.
To restrict an individual evaluation to only quantitative figures combining the number
of articles, the total number of citations and the h-index allow at a glance to rank two
competing scientists within a given field. Nevertheless qualitative evaluation is still of a
considerable importance to approach a scientist career.
It is also worth to emphasize that in addition to the institutional use of these indexes and
numbers, watching at one’s own h-index as well as those of friends or competitors has
became a ludic and convivial game to place a researcher in the social perspective of its
community out of it absorbing lonely state of doing research.
As expected for any index, the h-index was shown to exhibit a series of shortcomings
and weaknesses prompting a series of modifications like a weighting by citation impact
(Egghe and Rousseau 2008) and the bursting of novel proposals with the g-index (Egghe
2006). For a review focusing on the the h-index variants, computation and standardization
for different scientific fields see (Alonso et al. 2009) and (Van Raan 2006) for a com-
parison with standard bibliometric indicators. Complements to the h-index (Jin et al. 2007;
Hu et al. 2010) as well as generalizations (Van Eck and Waltman 2008) and variants (Guns
and Rousseau 2009) of both the h and g-indexes have proposed. A comparison of nine
different variants of the h-index using data from biomedicine has been conducted in
(Bornmann et al. 2008).
On this basis it is of importance to emphasize that there exists no ultimate index to be
self-sufficient. Only combining different indexes could approach a fair and appropriate
evaluation of the scientific output of a researcher.
However, the question of multiple co-authorship has not been given too much of interest
although several suggestions have been made recently. For instance it was suggested to
rescale a scientist h-index dividing it by the mean number of authors of all its papers which
belong its h-list (Batista et al. 2006). Combining citations and ranking of papers in a
fractional way was also proposed (Egghe 2008) as well as a scheme to allocate partial
credit to each co-author of a paper (Guns and Rousseau 2009). It was also proposed to
count papers fractionally according to the inverse of the number of co-authors (Schreiber
2009). Last but not least the initiator of the h-index has also proposed to consider a
modified �h-index (Hirsch 2010) to account for multiple authors.
It is rather striking to notice that while science is based on the discovering and the use of
conservation laws, scientists have been applying the myth of ‘‘Jesus multiplying bread and
fish’’ for decades by multiplying for themselves published articles. Indeed, when an article
is published with k authors, each co-author adds one paper to its own list of publications.
It means that for one paper published with k authors, k authors add one to their respective
number of publications. Accordingly, a single k-author papers contributes to k papers while
aggregating the total number of papers published by all scientists from their respective
publication lists. The same process applies for the citation dynamics with one single
citation for one k-author paper contributing to an overall of k citations since each one of the
k authors includes the citation in its personal h-index evaluation.
A few proposal were made previously to conserve the number of articles but prior to the
introduction of the h-index (Zuckerman 1968; Cole and Cole 1973; Price 1981; Cronin
1981; Vinkler 1987; Van Hooydonk 1997; Oppenheim 1998; Egghe et al. 2000) and stayed
without much application besides a recent suggestion to define an adapted pure h-index
(Chai et al. 2008). Fractional counting was also suggested recently to evaluate universities
(Leydesdorff and Shin 2010; Leydesdorff and Opthof 2010).
366 S. Galam
123

In this paper I propose a new scheme to obey the conservation law of published articles
at all levels of associated indexes. One paper counts for a single unit independently of the
number of co-authors. This unit must then be divided among the authors. Any fraction used
by one of the author is definitively withdraw from the unit. Accordingly, for a multiple
author paper fractional allocations are attributed to each co-author with a summation equal
to one. These allocations are tailored on the basis of each author contribution. It is denoted
‘‘Tailor Based Allocations (TBA)’’ for multiple authorship.
The total number of citations given to one paper must be also conserved within the sum
of all credits given to each one of its authors. Any part taken by one author is subtracted
from the total. To be consistent the same TBA must be used with respect to all figures
attached to a given paper. Each author gets only a specific fraction of the total number of
citations according to its fractional paper allocation. Using TBA for citations yields a new
equivalent of the h-index, I denote the gh-index. Contrary to the h-index, the gh-index is a
function of the total number of citations of each paper. A highly cited paper allows
automatically a better allocation for all co-authors while a less cited paper contributes
essentially either to one or two of the co-authors or little to all authors.
Several protocols to TBA are suggested and compared. The choice of a specific TBA
may vary from one discipline to another. In each case, the gh-index yields values which
differ drastically from those given by the h-index. The gh-index departs also from �hrecently proposed by Hirsh to account for multiple authorship. The scheme is found to
produce a substantial redistribution of the ranking of scientists in terms of quantitative
records. A few illustrations are provided.
Designing the perfect author allocations
According to the principle of conserved number of papers, given a single k-authors paper
only a fraction g(r, k) is allocated to each one of the k authors under the constraint
Xk
r¼1
gðr; kÞ ¼ 1 ð1Þ
where r ¼ 1; 2; . . .; k denotes the respective position of each author in the sequence of
co-authors. The respective values of the set of {g(r, k)} are determined following a ‘‘Tailor
Based Allocations’’, the TBA.
All quantitative figures attached to an author at position r of a given k authors paper
must then be scaled by g(r, k). Accordingly, the total number of publications of a
researcher must be calculated adding the series of the respective fractional TBA for all the
papers it authored. Henceforth one paper does not count for one any longer unless it is
authored by a single scientist. Given an author with a list of T publications, its total number
of articles becomes
Tg �XT
i¼1
giðr; kÞ ð2Þ
instead of T with the property Tg B T.
Similarly, considering the total number of citations of an author, the same rescaling
applies. Given a number ni of citations for paper i in the author list of T publications, the
TBA for the paper citations is
Tailor based allocations for multiple authorship: a fractional gh-index 367
123

giðr; kÞni; ð3Þ
instead of ni. Each co-author is granted a different number of citations from the same paper
with for a given paper,
Xk
r¼1
giðr; kÞni½ � ¼ ni ð4Þ
using Eq. 1. On this basis, the total number of citations of an author becomes
Ng �XT
i¼1
giðr; kÞni; ð5Þ
instead of N �PT
i¼1 ni with the property Ng B N.
Using Eq. 3 produces naturally novel values for the corresponding h-index denoted gh-
index. To implement the procedure the next crucial step is to select a criterium to allocate
the various values g(r, k) with r ¼ 1; 2; . . .; k for a specific paper. In principle, this set may
vary from one paper to another even for the same value of k.
Clearly, the best scheme will eventually become a specific allowance decided by the
authors themselves for each paper prior to have it submitted. For each name, in addition to
the affiliation, a quantitative fraction g(r, k) will be stated to denote the fraction of that
peculiar paper to be attributed to author r. The distribution of numerical values of a series
g(1, k), g(2, k), …, g(k, k) would thus reflect the precise contribution of each one of the
authors determining an exact TBA. That will be the most accurate and fair setting.
However, an implementation could start only in the near future. In the mean time, we need
to adopt one fixed standard in order to make a practical use of our proposal to treat all
existing publication data. However, the choice of a protocol must incorporates the tradition
of each discipline in co-signing papers. At this stage, each field should adopt its own TBA.
How to choose a tailor based allocations?
In physics, and in particular in condensed matter physics, the smallest team, i.e., a group of
two persons is composed of one researcher who has performed most of the technical work
while the other one has defined the frame and or the problem. Usually the first one is a
junior scientist (J), either undergraduate or graduate student or a postdoctoral researcher
whose supervisor is the second one, a senior researcher (S). The associated pair author
sequence is then J - S. In case we have additional (k - 2) authors Ar with r ¼2; 4; . . .; k � 1; the paper becomes a k author paper. The corresponding name sequence
follows their respective contributions yielding the series J � A2 � A3 � � � � � Ak�1 � S:However, in terms of decreasing weights of their respective contributions most often we
have A1 � Ak � A2 � A3 � � � � � Ak�1 for k authors with J = A1 and S = Ak, which is
different form the name sequence put in the paper.
While Hirsh advocates a specific scientific policy incentive in designing the �h-index
(Hirsch 2010) to favor senior researchers, I focus on trying to incorporate into the ranking
of authors the reality of the production of papers. The question of what part of return
should be attributed to each contribution is open to a future debate within each discipline to
set a standard. The standard could vary from one discipline to another. I consider that in the
making of current research the ‘‘technical part’’ is the one to receive the larger slice of the
368 S. Galam
123

output. Simultaneously, the ‘‘conceiving part’’ should be granted with the second larger
slice. It follows somehow the spirit of the financial setting of the American National
Science Foundation grant attribution. There, the grant pays the full salary of the researcher
who does the work against a summer salary for the leading researcher of the grant. That is
somehow how it works at least in condensed matter physics, the field I am familiar with.
I do not intend in promoting one specific policy to favor or discourage conducting
collaboration but to build a frame to both capture the current practice and to exhibit some
flexibility to allow adaptation to fit different policies. Various protocols should be first
tested in different fields by different researchers, and then it will become possible to
elaborate a standard, which may differ from one field to another. But everyone will thus get
its due within the conservation law of published papers applying the TBA. Last but not
least, any choice will have the effect to discourage the current inflation of multiple
authorship, which automatically increases the ranking of involved scientists. With any
TBA, adding an author to a paper will have a ‘‘cost’’ paid by the others, and in particular to
the one who in the current situation is getting credit without doing much work.
Homogeneous versus heterogeneous TBA
At this stage to implement our scheme we need to determine an explicit TBA associated to
a sequence of authors A1 � A2 � A3 � A4 � � � � � Ak�1 � Ak: Previous schemes which did
conserve allocation are uniform with respect to ranking as illustrated with the following
three main cases:
– The simplest equalitarian fractional allocating (Price 1981; Oppenheim 1998) where
each of the k authors receives an allocation 1/k. However if the output of a paper is
equalitarian the input is not making this scheme rather unfair for the author who did the
main part of the work.
– The arithmetic allocating (Van Hooydonk 1997) sounds well-balanced with gðr; kÞ ¼2ðkþ1�rÞ
kðkþ1Þ : The higher part is allocated to first author with gð1; kÞ ¼ 2ðkþ1Þ ; last author
receiving the smaller part gðk; kÞ ¼ 2kðkþ1Þ : This scheme favors the first author at the
expense of the last one. In other words, most credit is given to the junior scientist as
shown in Fig. 1. We could conceive the opposite arithmetic allocation with gðr; kÞ ¼2ðrÞ
kðkþ1Þ to heavily benefit to senior researchers as wished by Hirsch. My stand is to favor
junior researchers not because they are young but because they do most of the work.
– Similarly one can consider a geometric allocating (Egghe et al. 2000) with gðr; kÞ ¼21�r
2ð1�2�kÞ : The higher part is still allocated to first author with gð1; kÞ ¼ 12ð1�2�kÞ ; last
author receiving the smaller part gðk; kÞ ¼ 12k�1 : Figure 2 illustrates the variation of
g(r, k) a s function of k.
– An earlier proposal was a rather awkward combination of equalitarian fractioning
where each one of the authors receives the same slot 12ðk�1Þ besides the last author,
usually the senior researcher, who gets 12
(Zuckerman 1968).
While above TBA are homogeneous with respect to ranking we now propose an
heterogeneous TBA to favor, although differently, both the junior and the senior scientists.
Tailor based allocations for multiple authorship: a fractional gh-index 369
123

g 1, k
g k, k
g 2, k
g 3, k
g 1, k
g 9, k
k
0 2 4 6 8 10
0.2
0.4
0.6
0.8
1.0
Fig. 1 The various g(r, k) in case of a decreasing arithmetic allocation to favor junior scientists at theexpense of senior ones. The function gk, k represents the slot allocated to the last author of the list. This TBAyields two third one third at k = 2
g 3, k
g 1, k
g k, k
g 2, k
g 9, k
k
0 2 4 6 8 10
0.2
0.4
0.6
0.8
1.0
Fig. 2 The various g(r, k) in case of a decreasing geometric allocation to favor junior scientists at theexpense of senior ones. The function g(k, k) represents the slot allocated to the last author of the list. ThisTBA yields two third one third at k = 2
370 S. Galam
123
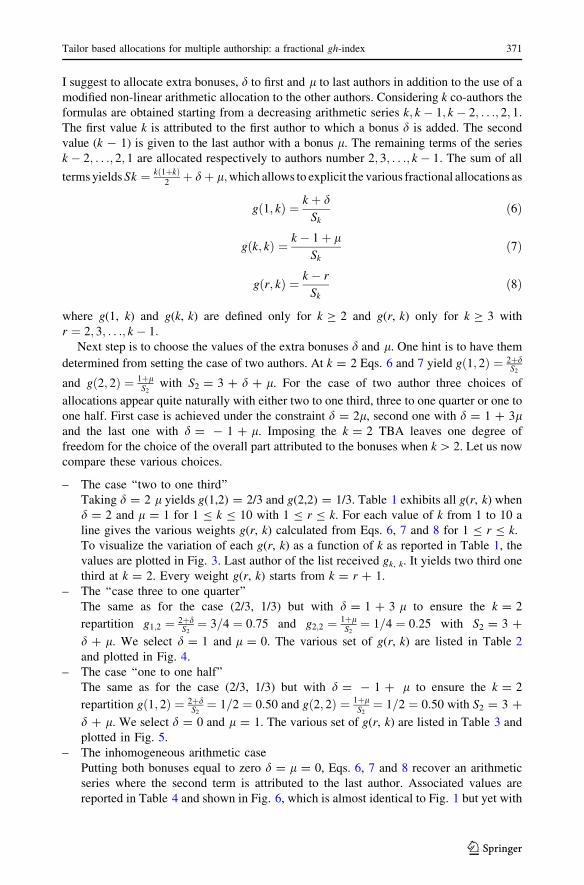
I suggest to allocate extra bonuses, d to first and l to last authors in addition to the use of a
modified non-linear arithmetic allocation to the other authors. Considering k co-authors the
formulas are obtained starting from a decreasing arithmetic series k; k � 1; k � 2; . . .; 2; 1:The first value k is attributed to the first author to which a bonus d is added. The second
value (k - 1) is given to the last author with a bonus l. The remaining terms of the series
k � 2; . . .; 2; 1 are allocated respectively to authors number 2; 3; . . .; k � 1: The sum of all
terms yields Sk ¼ kð1þkÞ2þ dþ l;which allows to explicit the various fractional allocations as
gð1; kÞ ¼ k þ dSk
ð6Þ
gðk; kÞ ¼ k � 1þ lSk
ð7Þ
gðr; kÞ ¼ k � r
Skð8Þ
where g(1, k) and g(k, k) are defined only for k C 2 and g(r, k) only for k C 3 with
r ¼ 2; 3; . . .; k � 1:Next step is to choose the values of the extra bonuses d and l. One hint is to have them
determined from setting the case of two authors. At k = 2 Eqs. 6 and 7 yield gð1; 2Þ ¼ 2þdS2
and gð2; 2Þ ¼ 1þlS2
with S2 = 3 ? d ? l. For the case of two author three choices of
allocations appear quite naturally with either two to one third, three to one quarter or one to
one half. First case is achieved under the constraint d = 2l, second one with d = 1 ? 3land the last one with d = - 1 ? l. Imposing the k = 2 TBA leaves one degree of
freedom for the choice of the overall part attributed to the bonuses when k [ 2. Let us now
compare these various choices.
– The case ‘‘two to one third’’
Taking d = 2 l yields g(1,2) = 2/3 and g(2,2) = 1/3. Table 1 exhibits all g(r, k) when
d = 2 and l = 1 for 1 B k B 10 with 1 B r B k. For each value of k from 1 to 10 a
line gives the various weights g(r, k) calculated from Eqs. 6, 7 and 8 for 1 B r B k.
To visualize the variation of each g(r, k) as a function of k as reported in Table 1, the
values are plotted in Fig. 3. Last author of the list received gk, k. It yields two third one
third at k = 2. Every weight g(r, k) starts from k = r ? 1.
– The ‘‘case three to one quarter’’
The same as for the case (2/3, 1/3) but with d = 1 ? 3 l to ensure the k = 2
repartition g1;2 ¼ 2þdS2¼ 3=4 ¼ 0:75 and g2;2 ¼ 1þl
S2¼ 1=4 ¼ 0:25 with S2 = 3 ?
d ? l. We select d = 1 and l = 0. The various set of g(r, k) are listed in Table 2
and plotted in Fig. 4.
– The case ‘‘one to one half’’
The same as for the case (2/3, 1/3) but with d = - 1 ? l to ensure the k = 2
repartition gð1; 2Þ ¼ 2þdS2¼ 1=2 ¼ 0:50 and gð2; 2Þ ¼ 1þl
S2¼ 1=2 ¼ 0:50 with S2 = 3 ?
d ? l. We select d = 0 and l = 1. The various set of g(r, k) are listed in Table 3 and
plotted in Fig. 5.
– The inhomogeneous arithmetic case
Putting both bonuses equal to zero d = l = 0, Eqs. 6, 7 and 8 recover an arithmetic
series where the second term is attributed to the last author. Associated values are
reported in Table 4 and shown in Fig. 6, which is almost identical to Fig. 1 but yet with
Tailor based allocations for multiple authorship: a fractional gh-index 371
123

subtle differences. Here g(k, k) stands instead of g(2, k) and g(2, k) stands instead of
g(3, k). In addition g(9, k) at k = 10 is the last lower point while it is the one before last
in Fig. 1. Depending on which situation has been selected either Tables 4 or 1 the
strategy of the senior scientist in adding authors will be totally opposite.
Table 1 The various g(r, k) when d = 2 and l = 1 for 1 B k B 10 with 1 B r B k
k/r 1 2 3 4 5 6 7 8 9 10
1 1 xxx xxx xxx xxx xxx xxx xxx xxx xxx
2 0.67 0.33 xxx xxx xxx xxx xxx xxx xxx xxx
3 0.56 0.11 0.33 xxx xxx xxx xxx xxx xxx xxx
4 0.46 0.15 0.08 0.31 xxx xxx xxx xxx xxx xxx
5 0.39 0.17 0.11 0.05 0.28 xxx xxx xxx xxx xxx
6 0.33 0.17 0.12 0.08 0.04 0.25 xxx xxx xxx xxx
7 0.29 0.16 0.13 0.10 0.06 0.03 0.23 xxx xxx xxx
8 0.26 0.15 0.13 0.10 0.08 0.05 0.02 0.20 xxx xxx
9 0.23 0.15 0.12 0.10 0.08 0.06 0.04 0.02 0.19 xxx
10 0.21 0.14 0.12 0.10 0.09 0.07 0.05 0.03 0.02 0.17
At k = 2 we have two third for the first author and one third for the second one
g 1, k
g k, k
g 2, k
g 3, k
g 9, k
k
0 2 4 6 8 10
0.2
0.4
0.6
0.8
1.0
Fig. 3 The various g(r, k) when d = 2 and l = 1 for 1 B k B 10 with 1 B r B k from Table 1. Thefunction g(1, k) represents the slot allocated to the first author of the list and g(k, k) the slot allocated to thelast author. The bonuses are defined to yield respective allocations of two third and one third at k = 2. Givena value r the weight g(r, k) is defined starting from k = r ? 1
372 S. Galam
123

Calculating the gh-index
While applying a TBA clearly modifies drastically the number of publications of authors, it
also modifies the associated h-index by extending the TBA to the paper citations. For a kauthor paper, the author at position r in the name sequence now receives g(r, k) n for its
own part of citations instead of the total number n. Using this fractional number of citations
Table 2 The various g(r, k) when d = 1 and l = 0 for 1 B k B 10 with 1 B r B k
k/r 1 2 3 4 5 6 7 8 9 10
1 1 xxx xxx xxx xxx xxx xxx xxx xxx xxx
2 0.75 0.25 xxx xxx xxx xxx xxx xxx xxx xxx
3 0.57 0.14 0.29 xxx xxx xxx xxx xxx xxx xxx
4 0.45 0.18 0.09 0.27 xxx xxx xxx xxx xxx xxx
5 0.37 0.19 0.12 0.06 0.25 xxx xxx xxx xxx xxx
6 0.32 0.18 0.14 0.09 0.04 0.23 xxx xxx xxx xxx
7 0.28 0.17 0.14 0.10 0.07 0.03 0.21 xxx xxx xxx
8 0.24 0.16 0.13 0.11 0.08 0.05 0.03 0.19 xxx xxx
9 0.22 0.15 0.13 0.11 0.09 0.06 0.04 0.02 0.17 xxx
10 0.16 0.14 0.12 0.11 0.09 0.07 0.05 0.04 0.02 0.16
At k = 2 it yields three to one quarter for respectively the first and second authors
g 1, k
g k, k
g 2, k
g 3, k
g 9, k
k
0 2 4 6 8 10
0.2
0.4
0.6
0.8
1.0
Fig. 4 The various g(r, k) when d = 1 and l = 0 for 1 B k B 10 with 1 B r B k from Table 2. Thefunction g(1, k) represents the slot allocated to the first author of the list and g(k, k) the slot allocated to thelast author. The bonuses are defined to yield respective allocations of three to one quarter at k = 2. Given avalue r the weight g(r, k) is defined starting from k = r ? 1
Tailor based allocations for multiple authorship: a fractional gh-index 373
123
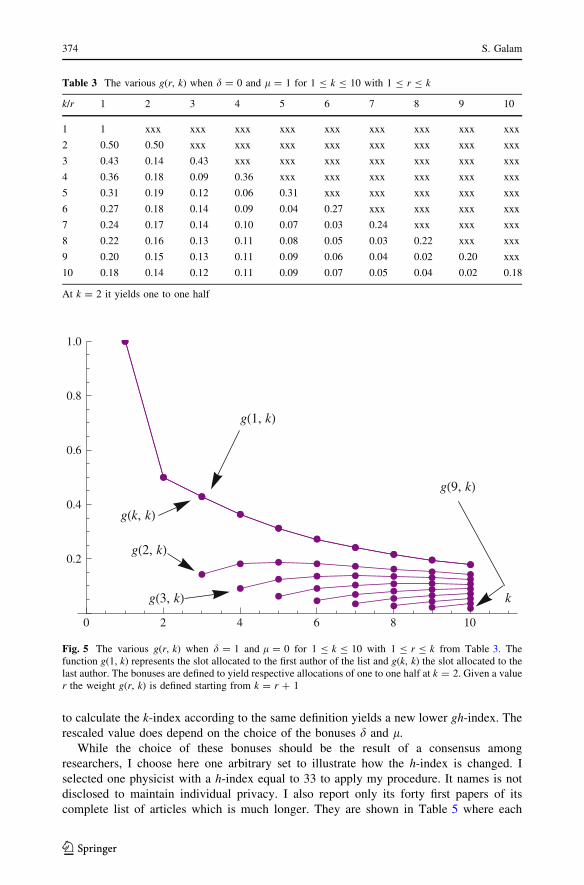
to calculate the k-index according to the same definition yields a new lower gh-index. The
rescaled value does depend on the choice of the bonuses d and l.
While the choice of these bonuses should be the result of a consensus among
researchers, I choose here one arbitrary set to illustrate how the h-index is changed. I
selected one physicist with a h-index equal to 33 to apply my procedure. It names is not
disclosed to maintain individual privacy. I also report only its forty first papers of its
complete list of articles which is much longer. They are shown in Table 5 where each
Table 3 The various g(r, k) when d = 0 and l = 1 for 1 B k B 10 with 1 B r B k
k/r 1 2 3 4 5 6 7 8 9 10
1 1 xxx xxx xxx xxx xxx xxx xxx xxx xxx
2 0.50 0.50 xxx xxx xxx xxx xxx xxx xxx xxx
3 0.43 0.14 0.43 xxx xxx xxx xxx xxx xxx xxx
4 0.36 0.18 0.09 0.36 xxx xxx xxx xxx xxx xxx
5 0.31 0.19 0.12 0.06 0.31 xxx xxx xxx xxx xxx
6 0.27 0.18 0.14 0.09 0.04 0.27 xxx xxx xxx xxx
7 0.24 0.17 0.14 0.10 0.07 0.03 0.24 xxx xxx xxx
8 0.22 0.16 0.13 0.11 0.08 0.05 0.03 0.22 xxx xxx
9 0.20 0.15 0.13 0.11 0.09 0.06 0.04 0.02 0.20 xxx
10 0.18 0.14 0.12 0.11 0.09 0.07 0.05 0.04 0.02 0.18
At k = 2 it yields one to one half
g 1, k
g k, k
g 2, k
g 3, k
g 9, k
k
0 2 4 6 8 10
0.2
0.4
0.6
0.8
1.0
Fig. 5 The various g(r, k) when d = 1 and l = 0 for 1 B k B 10 with 1 B r B k from Table 3. Thefunction g(1, k) represents the slot allocated to the first author of the list and g(k, k) the slot allocated to thelast author. The bonuses are defined to yield respective allocations of one to one half at k = 2. Given a valuer the weight g(r, k) is defined starting from k = r ? 1
374 S. Galam
123

paper is ranked with i ¼ 1; 2; . . .; 40 according to its associated total number of citation ni
following a decreasing order. The second column (r, k) indicates respectively the number
of authors and the researcher rank of each paper. The last four columns report the rescaled
numbers of citations allocated to the author using the precedent four different choices of
slot allocations at k = 2. We have g(r,k;2/3) for the case ‘‘two to one third’’, g(r,k;3/4) for
the case ‘‘three to one quarter’’, g(r,k;1/2) for the case one to one half and g(r,k;0) for zero
bonuses.
Indeed the selected author has published 9 times alone, 4 times as first author for two
authors, 13 times as second author for two authors, 1 time as first author for three authors, 3
Table 4 The various g(r, k) when d = l = 0 for 1 B k B 10 with 1 B r B k
k/r 1 2 3 4 5 6 7 8 9 10
1 1 xxx xxx xxx xxx xxx xxx xxx xxx xxx
2 0.67 0.33 xxx xxx xxx xxx xxx xxx xxx xxx
3 0.50 0.33 0.17 xxx xxx xxx xxx xxx xxx xxx
4 0.40 0.30 0.20 0.10 xxx xxx xxx xxx xxx xxx
5 0.33 0.27 0.20 0.13 0.07 xxx xxx xxx xxx xxx
6 0.29 0.24 0.19 0.14 0.09 0.05 xxx xxx xxx xxx
7 0.25 0.21 0.18 0.14 0.11 0.07 0.04 xxx xxx xxx
8 0.22 0.19 0.17 0.14 0.11 0.08 0.06 0.03 xxx xxx
9 0.20 0.18 0.16 0.13 0.11 0.09 0.07 0.04 0.02 xxx
10 0.18 0.16 0.14 0.13 0.11 0.09 0.07 0.05 0.04 0.02
g 9, k
g k, k
g 1, k
g 3, k
g 2, k
k
0 2 4 6 8 10
0.2
0.4
0.6
0.8
1.0
Fig. 6 The various g(r, k) when d = l = 0 for 1 B k B 10 with 1 B r B k from Table 4. The functiong(1, k) represents the slot allocated to the first author of the list and g(k, k) the slot allocated to the last author
Tailor based allocations for multiple authorship: a fractional gh-index 375
123

Table 5 An author h-index list of publication revisited by four different TBA
i (r, k) ni g(r, k; 2/3)ni g(r, k; 3/4)ni g(r, k; 1/2)ni g(r, k; 0)ni
1 (2, 2) 187 61.71 46.75 93.5 61.71
2 (1, 1) 181 181 181 181 181
3 (3, 3) 179 59.07 51.91 76.97 30.43
4 (1, 1) 145 145 145 145 145
5 (1, 1) 145 145 145 145 145
6 (2, 3) 132 14.52 18.48 18.48 43.56
7 (1, 1) 132 132 132 132 132
8 (2, 3) 120 13.20 16.80 16.80 39.60
9 (1, 2) 104 69.68 78.00 52.00 69.68
10 (3, 1) 98 54.98 55.86 42.14 49.00
11 (1, 2) 94 62.98 70.50 47.00 62.98
12 (3, 3) 90 29.70 26.10 38.70 15.30
13 (3, 3) 81 26.73 23.49 34.83 13.77
14 (1, 1) 75 75 75 75 75
15 (2, 2) 72 23.76 18 36 23.76
16 (3, 3) 71 23.43 20.59 30.53 12.07
17 (3, 3) 68 22.44 19.72 29.29 11.56
18 (3, 3) 66 21.78 19.14 28.38 11.22
19 (2, 2) 63 20.79 15.75 31.50 20.79
20 (3, 3) 55 18.15 15.95 23.63 9.35
21 (1, 1) 51 51 51 51 51
22 (2, 2) 50 16.5 12.5 25 16.5
23 (2, 2) 48 15.84 12 24 15.84
24 (1, 1) 45 45 45 45 45
25 (1, 1) 43 45 45 45 45
26 (1, 2) 42 28.14 31.50 21.00 28.14
27 (1, 1) 39 39 39 39 39
28 (2, 3) 38 4.18 5.32 5.32 12.54
29 (2, 2) 38 12.54 9.5 19 12.54
30 (2, 2) 35 11.55 8.75 17.5 11.55
31 (2, 2) 35 11.55 8.75 17.5 11.55
32 (2, 2) 34 11.22 8.50 17 11.22
33 (4, 6) 33 2.64 2.97 2.97 4.62
34 (1, 2) 31 20.77 23.25 15.50 20.77
35 (3, 3) 30 9.90 8.70 12.90 5.10
36 (2, 2) 30 9.9 7.5 15 9.9
37 (3, 3) 30 9.90 8.70 12.90 5.10
38 (2, 2) 30 9.9 7.5 15 9.9
39 (2, 2) 29 9.57 7.25 14.5 9.57
40 (2, 2) 29 9.57 7.25 14.5 9.57
376 S. Galam
123

times as second author for three authors, 9 times as last author for three authors, and 1 time
as fourth author for six authors. The associated values of g(r, k) are reported in Table 6.
They are used to calculate the rescaled citations of last four columns of Table 5.
Using Table 5 to evaluate the associated gh-index, instead of the h-index value of 33
we find that gh(2/3) = 21, gh(3/4) = 19, g(1/2) = 23, gh(0) = 20. The total number of
articles fir the author is respectively 19.91, 18.94, 22.31, 19.13 instead of the inflated value
of 40.
While all choices reduce by approximately half the number of articles, the h-index is
reduced by one third. The differences between the various sets of g(r, k) are significant but
not substantial. Clearly the modifications will vary from one author to another depending
on its distribution of multiple collaboration and on the author position in the sequence of
names.
Conclusion
I have presented a scheme to obey the conservation of both printed papers and given
citations. While the principle of a Tailor Based Allocations (TBA) is a scientific pre-
requisite, the differences between the various sets of fractional coefficients g(r, k) attrib-
uted to authors at position r in a list of k names, are significant but not substantial in the
cutting of the current inflation of counting of papers driven by the individual counting of
multiple authorship.
More applications are needed to figure out which TBA is more appropriate for each
discipline. However, our procedure is readable applicable to any individual set obtained
from the Web of Science.
From our results, it could appear that the TBA rescaling disadvantages senior authors
who usually sit last with several co-authors but indeed it is not quite the case since all
indexes are deflated to obey the conservation law of existing articles. Moreover, in contrast
to the h-index, the gh-index takes into account the existence of high citations for a paper
since then a large ni does yield large g(r, k)ni for all k authors whatever their respective
rank is. On the contrary, a low citation paper does contribute mainly to first and last
authors.
It is worth to notice that in some disciplines the question of who has contributed the
most or least to a paper is uncoupled from the sequence of co-authors in the byline of the
paper as traditionally often applied in mathematics and for practical reasons in high-energy
physics. In some cases, it is also known that the ‘‘senior’’ co-author did not contribute
much to the work but cosigns the paper as a privilege of its status being the professor,
Table 6 The TBA coefficientsused for the author list formTable 5
(r, k) g(r, k; 2/3) g(r, k; 3/4) g(r, k; 1/2) g(r, k; 0)
(1, 1) 1 1 1 1
(1, 2) 0.67 0.75 0.50 0.67
(2, 2) 0.33 0.25 0.50 0.33
(1, 3) 0.56 0.57 0.43 0.50
(2, 3) 0.11 0.14 0.14 0.33
(3, 3) 0.33 0.29 0.43 0.17
(4, 6) 0.08 0.09 0.09 0.14
Tailor based allocations for multiple authorship: a fractional gh-index 377
123

director, head of department or project leader. These facts make difficult to adopt one
single attribution model, which will be fair for all cases of multiple authorship. In those
cases, one possibility could be to apply the 1/k allocation for k co-authors although the
various contributions are rarely equivalent. The situation will be different in the future
since then authors will decide which fractions each one gets by having those fractions
written along the author affiliations. The sequence of authors could then be at will inde-
pendent or dependent of the sequence of the authors.
I do not intend to promote a peculiar policy for collaboration but to set a frame in which
one paper counts as one paper independently of its number of authors. On this basis the
choice of author allocations should integrate the reality of what part everyone did in the
building of a paper with the setting a specific TBA for each paper paper having in mind
that one paper counts for one no matter the number of co-authors. The focus of the paper
is to show explicitly that applying the TBA to obey the rule that one paper counts to
one modifies drastically the ranking of scientists. In particular extending the TBA to the
number of citations turns useless to be an author of a multiple author paper with a bib-
liometric return of almost zero. The ranking of scientists is also disrupted substantially
even if we select the equalitarian 1/k TBA for k co-authors since single and pair authors
will be favored with respect to larger sets of co-authors.
My proposal does not aim at setting a specific standard to TBA but to trigger novel
practice framed by the constraint of a total weight of one to one paper. In particular, within
TBA adding an author to a paper has a ‘‘cost’’ paid by the others, and in particular to the
ones who in the current situation are getting credit without doing much work.
This principle of reality should not discourage collaborations but on the contrary favor a
fair return to multiple authorship. It creates an incentive to stop the current inflation of
publications driven by the individual counting of multiple authorship.
References
Alonso, S., Cabrerizo, F. J., Herrera-Viedma, E., & Herrera, F. (2009). h-Index: A review focused in itsvariants, computation and standardization for different scientific fields. Journal of Informetrics 3,273–289.
Batista, P. D., Campiteli, M. G., Kinouchi, O., & Martinez, A. S. (2006). Is it possible to compareresearchers with different scientific interests? Scientometrics 68, 179–189.
Bornmann, L., Mutz, R., & Daniel, H. D. (2008). Are there better indices for evaluation purposes than the hindex? a comparison of nine different variants of the h index using data from biomedicine. Journal ofthe American Society for Information Science and Technology 59, 830–837.
Chai, J. C., Hua, P. H., Rousseau, R., Wan, J. K. (2008). Real and rational variants of the h-index and theg-index. In H. Kretschmer & F. Havemann (Eds.), Proceedings of the WIS 2008, Berlin, pp. 64–71.
Cole J. R., & Cole S. (1973). Social stratification in science. Chicago: The University of Chicago Press.Cronin, B. (1981). The need of a theory of citing. Journal of Documentation, 37, 16–24.Egghe, L. (2006). Theory and practise of the g-index. Scientometrics 69, 131–152.Egghe, L. (2008). Mathematical theory of the h- and g-index in case of fractional counting of authorship.
Journal of the American Society for Information Science and Technology 59, 1608–1616.Egghe, L., & Rousseau, R. (2008). An h-index weighted by citation impact. Information Processiong and
Management 44, 770–780.Egghe, L, Rousseau, R., & Van Hooydonk, G. (2000). Methods for accrediting publications to authors
or countries: Consequences for evaluation studies. Journal of the American Society for InformationScience, 51(2), 145–157.
Guns, R., & Rousseau, R. (2009). Real and rational variants of the h-index and the g-index. Journal ofInformetrics 3, 64–71.
Hirsch, J. E. (2005). An index to quantify an individuals scientific research output. Proceedings of theNational Academy of Sciences of the USA 102, 16569–16572.
378 S. Galam
123

Hirsch, J. E. (2010). An index to quantify an individual’s scientific research output that takes into accountthe effect of multiple coauthorship. Scientometrics 85 , 741–754.
Hu, X., Rousseau, R., & Chen, J. (2010). In those fields where multiple authorship is the rule, the h-indexshould be supplemented by role-based h-indices. Journal of Information Science 36(1), 73–85.
Jin, B. H., Liang, L. M., Rousseau, R., & Egghe, L. (2007). The R- and AR-indices: Complementing theh-index. Chinese Science Bulletin 52, 855–863.
Leydesdorff, L., & Opthof, T. (2010). Normalization at the field level: Fractional counting of citations.Journal of Informetrics 4, 644–646.
Leydesdorff, L., & Shin, J. C. (2010). How to evaluate universities in terms of their relative citation impacts:Fractional counting of citations and the normalization of differences among disciplines. arXiv:1010.2465v1.
Oppenheim, C. (1998). Fractional counting of multiauthored publications. Journal of the American Societyfor Information Science, 49(5), 482.
Price D. S. (1981). Multiple authorship. Science, 212(4498), 987.Schreiber, M. (2009). A case study of the modified Hirsch index hm accounting for multiple co-authors.
Journal of the American Society for Information Science and Technology 60, 1274–1282.Van Eck, N. J., & Waltman, L. (2008). Generalizing the h- and g-indices. Journal of Informetrics 2,
263–271.Van Hooydonk, G. (1997). Fractional counting of multi-authored publications: Consequences for the impact
of authors. Journal of the American Society for Information Science 48(10), 944–945.Van Raan, A. F. J. (2006). Comparison of the Hirsch-index with standard bibliometric indicators and with
peer judgment for 147 chemistry research groups. Scientometrics 67, 491–502.Vinkler, P. (1987). A quasi-quantitative citation model. Scientometrics, 12, 47–72.Zuckerman, H. (1968). Patterns of name-ordering among authors of scientific papers: A study of social
symbolism and its ambiguity. American Journal of Sociology 74, 276–291.
Tailor based allocations for multiple authorship: a fractional gh-index 379
123


Community structure and patterns of scientificcollaboration in Business and Management
T. S. Evans • R. Lambiotte • P. Panzarasa
Received: 7 June 2011 / Published online: 1 July 2011� Akademiai Kiado, Budapest, Hungary 2011
Abstract This paper investigates the role of homophily and focus constraint in shaping
collaborative scientific research. First, homophily structures collaboration when scientists
adhere to a norm of exclusivity in selecting similar partners at a higher rate than dissimilar
ones. Two dimensions on which similarity between scientists can be assessed are their
research specialties and status positions. Second, focus constraint shapes collaboration
when connections among scientists depend on opportunities for social contact. Constraint
comes in two forms, depending on whether it originates in institutional or geographic
space. Institutional constraint refers to the tendency of scientists to select collaborators
within rather than across institutional boundaries. Geographic constraint is the principle
that, when collaborations span different institutions, they are more likely to involve sci-
entists that are geographically co-located than dispersed. To study homophily and focus
constraint, the paper will argue in favour of an idea of collaboration that moves beyond
formal co-authorship to include also other forms of informal intellectual exchange that do
not translate into the publication of joint work. A community-detection algorithm for
formalising this perspective will be proposed and applied to the co-authorship network of
the scientists that submitted to the 2001 Research Assessment Exercise in Business and
Management in the UK. While results only partially support research-based homophily,
they indicate that scientists use status positions for discriminating between potential
partners by selecting collaborators from institutions with a rating similar to their own.
Strong support is provided in favour of institutional and geographic constraints. Scientists
tend to forge intra-institutional collaborations; yet, when they seek collaborators outside
T. S. EvansPhysics Department and Complexity & Networks, Imperial College, London, UKe-mail: [email protected]
R. LambiotteDepartment of Mathematics and Naxys, University of Namur, Namur, Belgiume-mail: [email protected]
P. Panzarasa (&)School of Business and Management, Queen Mary University of London, London, UKe-mail: [email protected]
123
Scientometrics (2011) 89:381–396DOI 10.1007/s11192-011-0439-1

their own institutions, they tend to select those who are in geographic proximity. The
implications of this analysis for tie creation in joint scientific endeavours are discussed.
Keywords Collaboration networks � Community structure �Intra- and inter-institutional collaborations � Geographic distance � Research specialty
Introduction
The idea of using published papers to study collaboration patterns among scientists is not
new (Price 1965). In information science, for example, there is a substantial body of
literature concerned with co-authorship networks (Ding et al. 1999) and co-citation net-
works (Crane 1972), where connections between authors are defined, respectively, in terms
of collaboration on the same paper or citation of their work in the same literature. Studies
of scientific collaborations have even a longer history in the mathematics community, in
which one of the earliest attempts to map and investigate the structure of social interaction
within a scientific community was formalised through the concept of the Erdos number, a
measure of a mathematician’s distance, in bibliographical terms, from the Hungarian
scholar (De Castro and Grossman 1999). Only recently, however, due to the advent of new
technological resources and the availability of comprehensive online bibliographies, have a
number of much larger and relatively complete and detailed collaboration networks been
documented and analysed (Barabasi et al. 2002, Jones et al. 2008, Moody 2004, Newman
2001a, Wuchty et al. 2007).
While most of these recent studies have been interested either in the global structural
and dynamic properties of the collaboration networks (Barabasi et al. 2002, Moody 2004,
Newman 2001a), or in the effects that collaboration has on scientific performance (Jones
et al. 2008, Wuchty et al. 2007), only little attention has been given to the micro mech-
anisms underpinning the way scientists select their collaborators at the local level. For
example, while it has been documented that collaborations spanning multiple universities,
and in particular, among these, the collaborations involving solely elite universities are
more likely to result in more highly cited papers than other forms of collaborations (Jones
et al. 2008), it still remains to be explored how in reality scientists assess potential partners
and select them for collaborative relations. While consideration of performance will cer-
tainly have some impact on the way collaborations are forged, it is also true that only a
minority of scientists may be in a position to freely collaborate only with those that can
help them achieve the highest levels of performance. For the majority of scientists, there
may be structural, disciplinary, institutional, or geographic constraints that restrict their
search behaviour to a delimited subset of possible collaborators. Focusing on the principles
that are conducive to the highest levels of scientific performance, therefore, does not help
understand how ties are actually forged in a collaboration network. To this end, what is
needed is an approach to tie creation that uncovers the mechanisms that underlie the
selection of scientific collaborators, irrespective of their implications for performance.
In this study, we take a step in this direction, and uncover the role of two fundamental
mechanisms of tie creation in collaboration networks: homophily (Lazarsfeld and Merton
1954, McPherson et al. 2001) and focus constraint (Feld 1981). We examine whether
scientists adhere to a principle of exclusivity in selecting their collaborators, by choosing
only among those with whom they share similar attributes. We focus on two forms of
homophily. First, scientists may take the research specialty of potential intellectual partners
as cues, and select those with whom there is a substantial overlap of research interests,
382 T. S. Evans et al.
123

scientific background, practices, perspectives, and standards. Second, when there is
uncertainty on the scientific quality of a joint work, scientists may choose to affiliate
themselves with others whose status is similar to their own (Podolny 1994).
We then shift our attention to focus constraint, and examine the extent to which
institutional and geographic constraints govern the creation of collaborative ties. First,
scientists may be more likely to select collaborators with whom they share the same
institutional affiliation than others from different institutions. Second, intra-institutional
collaborations may be induced by the tendency of scientists to collaborate with others that
are geographically co-located. This tendency would also imply that, when collaborations
span different institutions, they are more likely to involve scientists that are in geographic
proximity than at long distances from one another.
In our study we also attempt to adopt a broader perspective on collaboration than the
one strictly implied by the idea of co-authorship. Co-authorship undoubtedly represents
one of the major forms of intellectual cooperation. The literature, however, has long argued
in favour of a more permeable concept of collaboration to include other forms of informal
interaction among scientists (Katz and Martin 1997, Laband and Tollison 2000). For
instance, the published work of an author typically benefits from comments provided by
colleagues, journal reviewers and editors. Other forms of informal intellectual collabora-
tion include the mentoring that senior scientists offer to junior ones, and the commentary
received during the presentation of papers at conferences, workshops, and professional
meetings. Moreover, it is not uncommon that scientists become indirectly connected as a
result of collaborative agreements between higher-level units, such as departments, insti-
tutions, and research centres (Katz and Martin 1997). For instance, team leaders might
agree on a common research agenda that commits their respective groups to a number of
collaborative endeavours. In this case, while certain members of the groups may not be
directly involved in joint work leading to formal co-authorship, nonetheless their research
may indirectly benefit from the transfer of knowledge and skills, cross-fertilisation of
ideas, and the establishment of common research standards and goals that the collaborative
agreement between their groups has made possible. In cases like these it is not always an
obvious task to identify who is collaborating with whom precisely because patterns of co-
authorship and collaboration tend to diverge. While a strict bibliometric assessment would
count as collaboration only those activities that translate into a joint paper, there are
certainly other peripheral or indirect forms of intellectual exchange that are not reflected in
formal co-authorship, and yet represent genuine instances of associations that should be
taken into account to adequately capture the full extent of scientific collaboration.
To undertake an accurate assessment of collaboration one would therefore need to
integrate data on formal co-authorship with details on informal commentary (Laband and
Tollison 2000). This would inevitably be an arduous task, especially when conducted on a
large scale. Here, we propose an alternative response to the problem of the opaqueness of
collaboration. We begin by constructing a collaboration network based on formal co-
authorship, in which, as is typically done in similar network studies, two scientists are
assumed to be connected when they appear among the authors of the same paper (Barabasi
et al. 2002, Newman 2001a). However, we move beyond the idea of dyadic direct con-
nections between scientists, and apply recent community-detection methods to partition the
network into communities (Fortunato 2010). A scientist belongs to a community when he
or she collaborates with other members of that community to a greater extent than with
members of other communities. In this sense, communities may be locally dense even
when the network as a whole is sparse. Moreover, because within each community
Communities and patterns of scientific collaboration 383
123

scientists are inevitably connected only to a subset of all other members, communities may
include scientists that are only indirectly connected with each other.
We study the role of homophily and focus constraint for all scientists within each
community, even those that are not directly connected with each other. In so doing, we
implicitly take on a two-fold perspective on the structure and meaning of collaboration.
First, we assume collaboration occurs only within but not across the boundaries of com-
munities. Second, while direct ties clearly reflect formal co-authorship, we regard indirect
ties as an indicator of informal forms of collaboration. We seek support in favour of this
perspective by examining the collaboration network based on the papers submitted to the
2001 Research Assessment Exercise (RAE) in the UK in the field of Business and Man-
agement. Drawing on accurate details on the scientists’ attributes, we examine the extent to
which the topological boundaries between the uncovered communities reflect some fun-
damental ways in which scientists collaborate, either formally or informally. We do this by
testing the tendency of communities to include pairs of scientists that work in the same
research specialties, are affiliated with the same institutions, are associated with the same
levels of status, and are located at geographic proximity with each other.
The rest of the paper is organised as follows. In the next section, we place our work
within the relevant theoretical context. We then introduce the data and the methods for
partitioning the network into communities and assessing homophily and constraint in each
community. We then present the results. The final section will summarise and discuss the
main findings.
Homophily and focus constraint in collaboration networks
Homophily represents one of the network mechanisms of tie creation with the longest
tradition of investigation in the social sciences. This is the principle that similarity breeds
connection (Lazarsfeld and Merton 1954, McPherson et al. 2001). A significant body of
research has provided supportive evidence in favour of homophily by documenting a
positive association between sharing an attribute and some baseline level of interpersonal
attraction (McPherson et al. 2001). Attraction could, in turn, be reflected in a heightened
probability of similar people to select each other (Kossinets and Watts 2006), or com-
municate more frequently and develop a stronger social interaction (Reagans 2005).
In this paper, we begin our investigation of homophilous interactions in collaboration
networks by examining the extent to which scientists that work in the same research
specialty collaborate with one another with a higher likelihood than scientists from
different specialties. While research has long been interested in assessing the benefits
of conducting research across disciplinary fields and research specialties (Laband and
Tollison 2000, Whitfield 2008), the fact that scientists can also develop dense and strong
connections within their own fields or specialties has often received scanty attention.
Scientists can carefully select their collaborators to draw on different knowledge pools
without having to acquire the needed knowledge personally, but they can also aim to
strengthen their skills and enhance scientific consensus within their own specialty area.
Recent work suggests that scientists embedded in collaboration networks share ideas,
scientific standards and technique (Moody 2004, Whitfield 2008). By selecting their col-
laborators within their own specialty area, scientists can enhance scientific cohesion and
embeddedness, receive validation of their own attitudes and beliefs, and facilitate their
scientific production through the generation of shared norms of research practice.
384 T. S. Evans et al.
123

A second manifestation of homophilous interactions in collaborative research is related
to the role of status similarity in tie creation. In the social sciences, a number of empirical
studies have long been interested in the processes and reasons underpinning the creation of
connections among economic actors of similar status. Research has shown that processes
of competitive isomorphism are likely to lead economic actors of similar status to adopt
similar practices and operating systems, which in turn facilitates the coordination of
cooperative activities (Chung et al. 2000, Lorange and Roos 1992). Status similarity also
aligns the expectations of potential partners about each other’s behaviour, and increases
their commitment to sharing both the costs and benefits of an interaction (Chung et al.
2000). Moreover, a substantial body of work in sociology has illustrated that economic
actors, when considering the choice of creating a connection, assess the status of potential
partners (Chung et al. 2000, Podolny 1994). For example, the way in which others perceive
the quality of the output of a firm, especially when it cannot be assessed without ambiguity,
depends on the status of other firms that interact with the focal firm (Podolny 1994). As a
result of the signaling effect of status positions and social interactions, firms with similar
status tend to establish connections with one another when there is uncertainty about the
output of their transaction.
Sociological research on culture, science and technology has proposed a similar view on
the relational foundations and signaling effect of status. For instance, it was found that
within artistic genres with limited objective standards and high levels of uncertainty on
quality, the perception and judgement of the work of an artist was contingent on the status
of other artists with whom the focal artist interacted in the artistic community (Greenfeld
1989). In the sociology of science, it was contended that, when there are pronounced levels
of uncertainty about scientific quality, such as during periods of paradigmatic change, the
way in which a scientist is regarded depends on the status of those with whom the scientist
is associated (Camic 1992, Latour 1987). A similar perspective was also suggested to
explain the development of technology, in the sense that when an inventor’s technology
cannot be evaluated without uncertainty, assessment is fundamentally based on the status
of the economic actors that endorse that technology (Podolny and Stuart 1995).
These studies thus suggest that a principle of exclusivity based on status may also
govern the selection of partners in scientific collaborations. Challenged by pronounced
levels of competitive pressure and uncertainties posed by the need to secure funding and
publish in high-quality journals, scientists will become increasingly exclusive in the for-
mation of collaborations. They will generally avoid collaborating with others of a lower
status, and instead select collaborators of roughly equivalent status (Jones et al. 2008). In
this study, to investigate status-based homophily, we measure the ranking of the institu-
tions with which scientists are affiliated, and then examine whether collaborations tend to
span institutions of different ranking or only those with a similar one.
The second ordering principle that we examine is focus constraint (Feld 1981). This
refers to the idea that social associations depend on opportunities for social contact.
Research has uncovered the tendency of connections to occur among individuals who share
activities, roles, social positions, institutional affiliations, and geographic location (Feld
1981, Kossinets and Watts 2006, Monge et al. 1985). Here a special emphasis is placed on
institutional and geographic constraint. First, we examine whether scientists are more likely
to establish collaborations within their own institutions than across institutional boundaries.
Recent studies have investigated forms of collaborations that involve organisations of
various institutional profile, such as academic departments, business firms, government and
non-government organisations (Leydesdorff and Ward 2005). In particular, research has
highlighted the role of these inter-institutional collaborations in sustaining knowledge
Communities and patterns of scientific collaboration 385
123

transfer and creation. There are, however, also benefits associated with intra-institutional
collaborations. In principle, scientists can choose their collaborators within their own
institutions for a variety of reasons. For instance, joint research may be facilitated by the
ease and frequency of face-to-face communication and meetings, and by the common
cultural orientations, scientific standards and practices that are typically shared by the
members of the same institution. Hiring policies, in turn, can also promote collaborative
research within institutions as they tend to emphasise overlapping areas of research interests
between applicants and incumbents leading to potential joint work. For these reasons, here
we examine the role of institutional constraint in scientific collaboration by testing the
tendency of scientists to restrict the choice of their partners within institutional boundaries.
Intra-institutional collaborations may also originate from the benefits that scientists gain
from being geographically close to one another. The literature has long investigated the
benefits of geographic proximity, and in particular its impact on innovative activities (Jaffe
et al. 1993). Even though knowledge could in principle travel through space inexpensively,
nonetheless knowledge production tends to be geographically clustered (Braunerhjelm and
Feldman 2006). The arguments often proposed to explain this phenomenon include the
benefits that geographic proximity offers in terms of knowledge spillovers (Jaffe et al.
1993), opportunities of face-to-face interaction, transfer of tacit knowledge, and the
occurrence of unanticipated encounters between individuals (Gertler 2003). While the
literature has been concerned mainly with the spatial distribution of economic activities, it
may also help gain a better understanding of the geography of scientific collaboration
(Jones et al. 2008). When selecting their collaborators, scientists may be encouraged to
choose them within short geographic distances because spatial proximity facilitates
informal communication and the transfer of complex knowledge, which in turn may lead to
an increasing commitment to cooperation (Katz and Martin 1997). This argument thus not
only suggests that scientific collaboration may tend to occur within institutional bound-
aries, but also that, when collaborations span different institutions, they may be more likely
to involve scientists from institutions that are geographically close than dispersed.
Data and methods
In this section, we will begin by introducing the RAE network dataset, and then the
measures for scientists’ attributes that will be used to study homophily and focus con-
straint. We will then present the community-detection algorithm that will be used to
partition the network into groups of indirectly connected scientists. The section will end
with a discussion of the statistical methods developed to assess homophily and focus
constraint in each community.
The data
For our analysis, we have constructed the collaboration network of the social scientists that
authored or coauthored the publications submitted to the RAE 2001 in Business and
Management in the UK. The RAE was established in the UK in 1986, when the govern-
ment introduced the policy of selective funding (Ball and Butler 2004, Cooper and Otley
1998, HERO 2001). The exercise is traditionally carried out by the UK government
through Higher Education Funding Councils, and represents a peer-review evaluation
process undertaken by panels consisting of members who are chosen by the funding bodies
according to their research experience. The RAE that took place in 2001 represents the
386 T. S. Evans et al.
123

broader context from which our data were drawn. On the whole, it consisted of 68 units of
assessment and around 213,000 publications examined. In this work, we restrict our
analysis to the unit of assessment that received the largest number of submissions. This was
the Business and Management Studies subject area, which received 97 submissions from
94 institutions (Ball and Butler 2004, HERO 2001). Each institution was invited to put
forward within its submission all individuals who were actively engaged in research and in
post on 31 March 2001. Each of these individuals was required to submit up to four pieces
of research output produced during the period 1 January 1996–31 December 2000.
Panels composed of expert academics were formed to assess the quality of submissions
(Baker and Gabbott 2002, Cooper and Otley 1998). Evaluation criteria for each unit of
assessment were published by the panels before submissions were made to ensure that
academics were informed of the aspects of submissions that the panels regarded as most
important as well as the areas on which institutions were required to comment in their
submissions (HERO 2001). Ratings were allocated to submissions, and ultimately to
universities, on the grounds of their ability to reach national or international levels of
excellence. Ratings of research quality were expressed in terms of a standard scale
including 7 points ranging from 1 to 5* (i.e., 1, 2, 3b, 3a, 4, 5, and 5*). The RAE aimed to
ensure that institutions that produced research of the highest quality were allocated a higher
proportion of the available funding than institutions with lower-quality research. In the
RAE 2001, for example, institutions that acquired a rating of 1 or 2 did not obtain any
funding, while institutions that received a rating of 5* were given four times as much
funding as the institutions with a rating of 3b. The allocation of funding according to
research quality was therefore intended to act as an incentive both to protect and develop
research of excellent quality in the UK.
Our data contain detailed information about each paper that was submitted to the RAE
2001 in Business and Management, including the paper title, the names of author and co-
authors, the RAE ratings of their institutions as well as the publication type and publishing
details. Among the advantages of this dataset over other sources of data on publications is
that disambiguation of institutional affiliations of the authors who submitted to the RAE is
relatively straightforward. Our sample includes 9,325 papers submitted to the RAE by
2,609 scientists. These papers were also co-authored by 5,752 scientists that did not submit
to the RAE. Thus, the total number of scientists in our sample amounts to 8,361. A tie is
established between two scientists if they have co-authored one or more papers. Following
Newman (2001b), the weight of a tie between two scientists reflects their contributions in
their collaboration: the larger the number of scientists collaborating on a paper, the weaker
their interactions. Thus, tie weight increases with the total number of papers co-authored,
and is inversely proportional to the total number of co-authors of those papers. In our
analysis we looked at the largest connected component of this weighted network which
contains 3,338 authors.1
Scientists’ attributes
To study the role of homophily and focus constraint, we needed a number of additional
attributes for the scientists. Because these attributes were available only for the scientists
who submitted to the RAE (and not, for example for non-UK scientists or UK PhD students
who co-authored with someone who submitted, but did not submit themselves), we then
had to extract the subset of these scientists from the largest connected component of the
1 The next largest component has fewer than 100 authors.
Communities and patterns of scientific collaboration 387
123

network. Of the 3,338 scientists in the component, only 973 submitted to the RAE. For
each of these 973 scientists, we measured research specialty, status, institutional affiliation,
and geographic location.
To assess research-based homophily, we assigned each scientist to a research specialty
by using the domain statements of the 24 divisions and interest groups identified by the
Academy of Management. For each of these divisions and groups, the Academy provides a
brief description of the main research topics, objectives and methods.2 By using an
algorithm, we matched the titles of the papers submitted to the RAE with the Academy’s
statements, and assigned each author to a unique research specialty (Whitfield 2008).
To assess status-based homophily, each scientist was assigned the RAE ranking acquired
by the institution with which he or she was affiliated. Two measures of status were obtained
by using the RAE ratings that institutions received in 1996 and 2001. To study geographic
constraint, we obtained the latitude and longitude values in degrees for each institution, and
then calculated the distance in kilometers between any pair of institutions. The geographic
distance between any two scientists was then assumed to be equal to the distance between
the two institutions with which the scientists were affiliated. Finally, for institutional con-
straint, scientists were associated with their respective institutions of affiliation.
Community detection
The detection of communities, or modules, in networks has attracted much attention in
the last few years. Modules are defined as sub-networks that are locally dense even though
the network as a whole is sparse. They have been observed in a variety of networks
(e.g., biological networks, brain functional networks, and collaboration networks), where
they usually correspond to functional sub-units, namely sets of nodes that have a (usually
unknown) property or function in common. This architecture is expected to naturally
emerge in groups of interacting scientists (Scharnhorst and Ebeling 2005), as it presents the
advantage of combining two types of social organisation (Lambiotte and Panzarasa 2009):
close networks which foster trust and facilitate the transfer of complex and tacit knowl-
edge, and open networks which are rich in structural holes and facilitate knowledge cre-
ation and information diffusion. Several methods have been developed to detect modules in
large networks, and they cover a broad range of concepts and implementations (Fortunato
2010). In the field of Scientometrics, a division of citation or collaboration networks into
communities has been used as a taxonomic scheme in order to map knowledge domains
(Borner et al. 2003, Boyack et al. 2005, Chen 2003, Leydesdorff and Rafols 2008, Rosvall
and Bergstrom 2008, Wallace and Gingras 2008), but also as way to track their temporal
changes and the mobility of researchers (Hellsten et al. 2007).
In this study, we adopt a partitioning-based viewpoint, as we look for non-overlapping
communities. Partitions are uncovered by optimising the multi-resolution modularity
introduced by Reichardt and Bornholdt (2004):
QðcÞ ¼ 1
2m
X
C2P
X
i;j2C
Aij � ckikj
2m
� �; ð1Þ
where A is the weighted adjacency matrix of the collaboration network, ki �P
j Aij is the
strength of node i and m �P
i;j Aij=2 is the total weight in the network. The summation
2 Descriptions of these divisions and groups are available at the website of the Academy of Management:http://www.aomonline.org/aom.asp.
388 T. S. Evans et al.
123

over pairs of nodes i; j 2 C belonging to the same community C of the partition3 P counts
intra-community links. This quality function measures if links are more abundant within
communities than would be expected on the basis of chance, and incorporates a resolution
parameter c allowing to tune the characteristic size of the modules. Q(1) corresponds to
Newman-Girvan modularity (Newman and Girvan 2004). The resolution parameter c is
essential in order to get rid of the size dependence of modularity and to uncover the true
multi-scale organisation of the network. In what follows, the optimisation of Q(c) is
performed by using a reliable greedy algorithm (Blondel et al. 2008).4
Statistical significance of module attributes
By definition, uncovered modules consist of groups of scientists that are indirectly con-
nected but are close in a topological sense. Modules thus provide coarse-grained levels of
interactions which allow us to go beyond known dyadic connections between scientists
present in the data and to uncover intermediate units (building blocks) from the organi-
sation of the collaboration network. It is also important to emphasise that scientists are
expected to be driven by antagonistic forces, e.g. geographic distance vs research specialty,
in their choice of collaboration. The non-overlapping organisation imposed by the parti-
tioning algorithm is thus expected to highlight the dominant factors, namely it uncovers
communities underpinned by one dominant mechanism.
In order to test the effect of homophily and focus constraint on scientific collaborations,
we look at two measures of attribute diversity within each community:
SC ¼ �X
v2Cpc;v lnðpc;vÞ and RC ¼ 1�
X
v2Cp2
c;v; ð2Þ
where pc;v is defined as the density of authors in community C who possess attribute v in
the set C of possible attributes. SC and RC are the Shannon entropy and the Simpson
diversity index of pc;v, respectively. By construction, SC and RC are measures of the
diversity of a certain set C of attributes within community C. Low values of SC and RC
correspond to communities whose nodes are affiliated with the same institution, work in
the same specialties or are associated with the same levels of status, respectively.
Different sets of attributes are considered in order to assess the salience of different
factors for community structure: institution, research specialty and RAE rating. For
research specialty, for instance, (2) becomes SC ¼ �P24
v¼1 pc;v lnðpc;vÞ; where pc;v is now
the density of authors with research specialty v in community C and the summation is
performed over the set of 24 possible research specialties. The significance of these
diversity measures is evaluated through a permutation test (Traud et al. 2010), namely by
measuring SC;a and RC;a for each community C on 1,000 different instances a where the
assignment of the nodes to communities is preserved but where the attributes of the nodes
are randomly re-shuffled. The diversity of community C is then assessed by comparing SC
(RC) to the value of diversity of the null models and by measuring the probability Pc that
community C is less diverse than the one observed in the null model (see Fig. 1).
The salience of geographic proximity for community structure is assessed as follows.
For each community, we look at two average distances: the average distance dUIP between
3 Here P is a partition of the vertices of our graph. That is, P is a set of communities C and every author inthe largest connected component of our full weighted co-authorship graph is in one but only one of thesecommunities.4 The java code used to perform the optimisation of Q(c) is available on request from T. S. Evans.
Communities and patterns of scientific collaboration 389
123

an author and all other authors in the same community provided they are not from the same
institution, and the average distance dUAP between an author and all authors in the same
community whatever their institution. There is almost no difference in the results obtained
from these two distance measures in terms of the comparison of the null models to the
actual average distance measured in communities. The important point is that these dis-
tances are measured regardless of whether or not scientists co-authored a paper. Moreover,
a separation of 100 km when one institution is in a relatively sparsely populated location
with few institutions (e.g., Northern Island) may be a short scale whereas 100 km may be a
comparatively large distance in a dense urban environment with many institutions.
Therefore, these distances have to be compared to an appropriate null model defined as
follows. Each author in a community is considered in turn. The locations of all the
institutions except for the one associated with the author being considered are shuffled.
Authors in the same institution thus remain in the same institution, but the distance from
the author under consideration to those in another institution will almost certainly change.
We calculate the average distance between all pairs of authors in the same community in
1,000 realisations of the null model and compare the range of average distances found in
the null model against the average distance measured for the community with institutions
in the real location.
Results
Our analysis was performed on the RAE scientists extracted from the largest connected
component of the weighted collaboration network defined in the previous section. Modules at
different scales have been uncovered by optimising Q(c) over a broad range of values of c. In
what follows, we will discuss the properties of the partition optimising Q(0.091), keeping in
mind that similar conclusions are also obtained for other values of c. Results are similar for
both diversity measures discussed in the previous section, and therefore we will only show
entropy in our figures. The obtained partition is made of 24 modules, and has been chosen to
coincide with the number of research specialties. Our main purpose is to compare this
Fig. 1 Statistical significance of the diversity of research specialties in Business and Management for apartition of 24 communities. a Points show the entropy SC of the modules for the research specialty variable.Comparison is against 1,000 different instances of the null model described in the text. The ends of the barsmark the entropies at the quantiles 2.5% and 97.5%. b Points show the probability PC that the diversityfound in the null model is greater than the one found in reality
390 T. S. Evans et al.
123

algorithmically-obtained partition to our information about the scientists, namely their
research specialty, RAE rating, institutional affiliation, and geographic distance.
To investigate the mechanisms driving the formation of communities, we measured the
diversities SC and RC for the first 3 sets of attributes. Community C is said to exhibit a
significant uniformity (lack of diversity) for a certain set of attributes if it is less diverse
than in 97.5% of the random realisations, i.e., PC [ 0.975 in the above notations. In that
case, the attributes of C are thus significantly different from a random assignment. On the
contrary, the composition of a community is not distinguishable from a random assignment
for values of PC \ 0.975. Geographic distance is said to be a significant factor under-
pinning the composition of community C if the average distances dUIP and dUAP between
its scientists are smaller than in the null model in 97.5% of the random realisations.
The analysis incorporates four sets of results. The first two test our hypothesis of
specialty- and status-based homophily, respectively. As shown in Fig. 1, research specialty
is weakly correlated with community structure. Only 5 communities out of 24 exhibit a
degree of homogeneity in research specialty that is statistically significant. The rest of the
communities are not statistically significantly different from what would be randomly
expected. These findings thus provide only partial support in favour of the hypothesis that
in Business and Management scientists tend to collaborate with others within their own
research specialty. At the same time, results also suggest that scientists do not work across
research specialties to a greater degree than by chance. For instance, while Fig. 1b indi-
cates that a few communities have a large probability (close to 1) of exhibiting a greater
research similarity than the one found in the null model, there is no community for which
the probability that the corresponding null model has a higher research diversity is close to
zero.
The second set of results is concerned with status homophily, namely the hypothesis
that scientists tend to collaborate with others that are affiliated with institutions with the
same RAE rating as their own. As shown by Fig. 2a,b, the salience of status homophily for
collaboration depends on which measure of status is used. While the 1996 RAE rating
appears to be a statistically significantly strong driver of collaboration for 13 communities,
similarity in the 2001 rating is correlated with collaboration only for 6 communities. This
should not be surprising. On the one hand, when scientists selected their collaborators, they
were aware of the RAE rating that institutions obtained in 1996. In this respect, the results
provide support to the hypothesis that scientists in most communities used the 1996 RAE
rating as a signal to infer the quality of potential collaborators and discriminate between
them. On the other, since the papers in our dataset were published before 2001, the RAE
ratings obtained in 2001 were obviously not available to the scientists at the time of their
collaboration. Thus, the 2001 RAE ratings could not have been used before 2001 to make
inferences about quality, which explains the weaker support that Fig. 2a,b provides to
homophily based on the 2001 rating than on the 1996 one. Due to the (weak) correlation
between the 1994 and 2001 ratings, some of the scientists that before 2001 chose col-
laborators with a status similar to their own continued to maintain such similarity when the
new RAE ratings were released in 2001. However, Fig. 2a,b suggests that there were also a
number of scientists who changed their status in 2001, and as a result some of the simi-
larities based on the 1996 ratings eventually disappeared in 2001.
The last two sets of results test the hypotheses of institutional and geographic con-
straints, respectively. As can be seen in Fig. 2c, communities are extremely uniform in
terms of the institutional affiliation of their UK members. All 24 communities are statis-
tically significantly different from a random assignment, as the probability that the cor-
responding null model includes scientists with more diverse institutional affiliations than
Communities and patterns of scientific collaboration 391
123
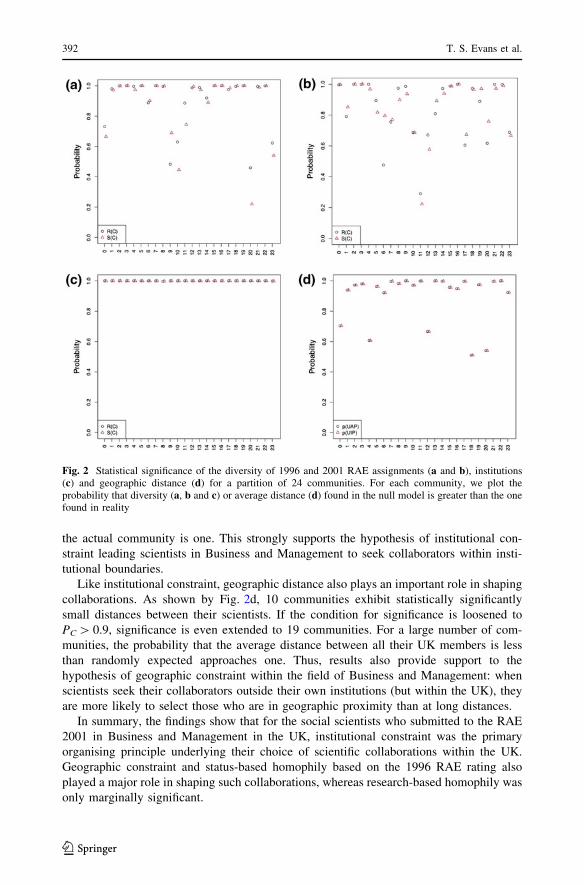
the actual community is one. This strongly supports the hypothesis of institutional con-
straint leading scientists in Business and Management to seek collaborators within insti-
tutional boundaries.
Like institutional constraint, geographic distance also plays an important role in shaping
collaborations. As shown by Fig. 2d, 10 communities exhibit statistically significantly
small distances between their scientists. If the condition for significance is loosened to
PC [ 0.9, significance is even extended to 19 communities. For a large number of com-
munities, the probability that the average distance between all their UK members is less
than randomly expected approaches one. Thus, results also provide support to the
hypothesis of geographic constraint within the field of Business and Management: when
scientists seek their collaborators outside their own institutions (but within the UK), they
are more likely to select those who are in geographic proximity than at long distances.
In summary, the findings show that for the social scientists who submitted to the RAE
2001 in Business and Management in the UK, institutional constraint was the primary
organising principle underlying their choice of scientific collaborations within the UK.
Geographic constraint and status-based homophily based on the 1996 RAE rating also
played a major role in shaping such collaborations, whereas research-based homophily was
only marginally significant.
Fig. 2 Statistical significance of the diversity of 1996 and 2001 RAE assignments (a and b), institutions(c) and geographic distance (d) for a partition of 24 communities. For each community, we plot theprobability that diversity (a, b and c) or average distance (d) found in the null model is greater than the onefound in reality
392 T. S. Evans et al.
123

Discussion and conclusions
Prior work established that teamwork production in science is increasingly composed of
collaborations that span university boundaries (Jones et al. 2008, Wuchty et al. 2007).
Unlike these studies that have typically looked at institutions from multiple countries (and
scientists from different disciplinary fields), our analysis has focused only on UK uni-
versities (and within a single discipline), and has suggested that scientists in Business and
Management in the UK seek their collaborators within their own institutions to a greater
extent than randomly expected. In this respect, our study integrates previous work on
multi-university collaboration by highlighting that, when scientists’ search behaviour is
directed toward domestic partners within a single broad disciplinary field, it tends to
remain localised within institutional boundaries. Scientists may consider collaborating with
international partners (Jones et al. 2008); however, within their own countries and disci-
plinary borders, they prefer to interact with colleagues from their own institutions.
Our results also supported the role of geography in the selection of collaborators in
Business and Management in the UK. Our analysis illustrated that, when collaborations
span institutional boundaries, they tend to be geographically clustered. On the one hand,
these findings corroborate related studies of multi-university collaborations highlighting
how geographic distance can hinder group communication and decision-making (Cum-
mings and Kiesler 2007). The importance of face-to-face contacts has long been reported
by the literature. Allen’s (1977) rule of thumb, for example, is that collaborators should be
no more than 30 metres apart, as longer distances would negatively impact on the effec-
tiveness of their collaboration (Kraut et al. 1990). On the other hand, there is an equally
substantial body of literature suggesting a weakening relevance of geographic location for
scientific production (Cairncross 1997, Jones et al. 2008). The so-called ‘‘death of dis-
tance’’ has been mainly associated with the increasing availability of communication and
computer-based technologies in research collaborations (Cairncross 1997, Jones et al.
2008). Our findings complement this argument by suggesting that, when scientists choose
their collaborators within their own country and discipline, they tend to favour geographic
proximity. In this sense, even though the scientists included in our dataset were only
partially affected by the rapid spread of information technologies in the 1990s, our results
seem to suggest that technology, at least within national and disciplinary boundaries, is an
imperfect substitute for geographic co-location (Cummings and Kiesler 2007).
Previous research on scientific collaboration has also focused on the benefits of inter-
disciplinarity, and suggested that scientists prefer collaborators from outside their own
disciplinary field over those within their field (Laband and Tollison 2000, Whitfield 2008).
Since the scope of our analysis was limited only to one disciplinary field, the findings
cannot provide evidence either in favour or against the tendency towards collaborations
across broad disciplinary fields (e.g., physics and economics). By contrast, what they
enable us to assess is the degree to which, within the boundaries of a single disciplinary
field, scientists tend to collaborate across the research specialties within that field. In this
respect, our results do not provide strong evidence in favour of such inter-specialty col-
laborations. They only partially support the hypothesis of specialty-based homophily, in
that only a relatively small number of communities included scientists that were more
similar in their research specialty than by chance. Since individual UK institutions inev-
itably tend to include only a fraction of all research specialties within Business and
Management, and because scientists were found to prefer collaborations within institu-
tional boundaries to those spanning institutions, it is not surprising to find that at least some
of these collaborations occurred within the scientific boundaries of distinct specialties.
Communities and patterns of scientific collaboration 393
123
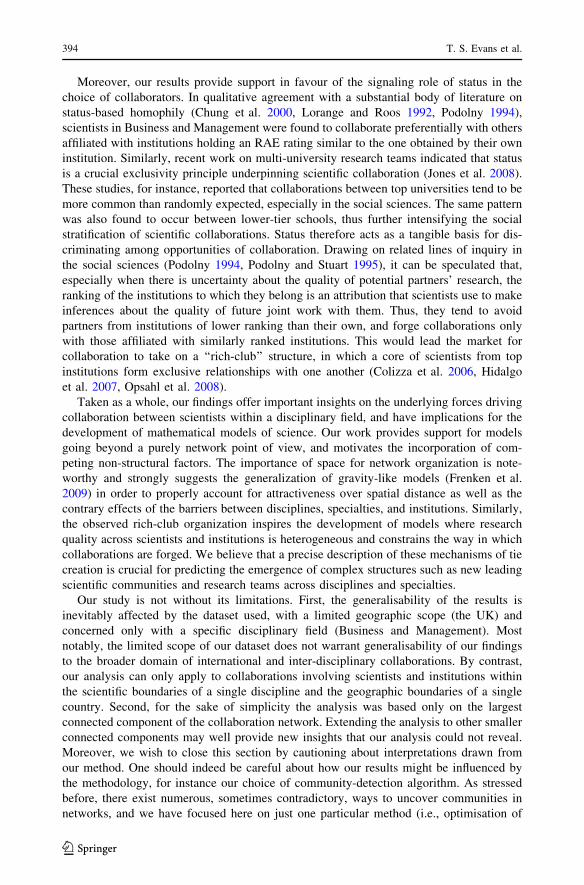
Moreover, our results provide support in favour of the signaling role of status in the
choice of collaborators. In qualitative agreement with a substantial body of literature on
status-based homophily (Chung et al. 2000, Lorange and Roos 1992, Podolny 1994),
scientists in Business and Management were found to collaborate preferentially with others
affiliated with institutions holding an RAE rating similar to the one obtained by their own
institution. Similarly, recent work on multi-university research teams indicated that status
is a crucial exclusivity principle underpinning scientific collaboration (Jones et al. 2008).
These studies, for instance, reported that collaborations between top universities tend to be
more common than randomly expected, especially in the social sciences. The same pattern
was also found to occur between lower-tier schools, thus further intensifying the social
stratification of scientific collaborations. Status therefore acts as a tangible basis for dis-
criminating among opportunities of collaboration. Drawing on related lines of inquiry in
the social sciences (Podolny 1994, Podolny and Stuart 1995), it can be speculated that,
especially when there is uncertainty about the quality of potential partners’ research, the
ranking of the institutions to which they belong is an attribution that scientists use to make
inferences about the quality of future joint work with them. Thus, they tend to avoid
partners from institutions of lower ranking than their own, and forge collaborations only
with those affiliated with similarly ranked institutions. This would lead the market for
collaboration to take on a ‘‘rich-club’’ structure, in which a core of scientists from top
institutions form exclusive relationships with one another (Colizza et al. 2006, Hidalgo
et al. 2007, Opsahl et al. 2008).
Taken as a whole, our findings offer important insights on the underlying forces driving
collaboration between scientists within a disciplinary field, and have implications for the
development of mathematical models of science. Our work provides support for models
going beyond a purely network point of view, and motivates the incorporation of com-
peting non-structural factors. The importance of space for network organization is note-
worthy and strongly suggests the generalization of gravity-like models (Frenken et al.
2009) in order to properly account for attractiveness over spatial distance as well as the
contrary effects of the barriers between disciplines, specialties, and institutions. Similarly,
the observed rich-club organization inspires the development of models where research
quality across scientists and institutions is heterogeneous and constrains the way in which
collaborations are forged. We believe that a precise description of these mechanisms of tie
creation is crucial for predicting the emergence of complex structures such as new leading
scientific communities and research teams across disciplines and specialties.
Our study is not without its limitations. First, the generalisability of the results is
inevitably affected by the dataset used, with a limited geographic scope (the UK) and
concerned only with a specific disciplinary field (Business and Management). Most
notably, the limited scope of our dataset does not warrant generalisability of our findings
to the broader domain of international and inter-disciplinary collaborations. By contrast,
our analysis can only apply to collaborations involving scientists and institutions within
the scientific boundaries of a single discipline and the geographic boundaries of a single
country. Second, for the sake of simplicity the analysis was based only on the largest
connected component of the collaboration network. Extending the analysis to other smaller
connected components may well provide new insights that our analysis could not reveal.
Moreover, we wish to close this section by cautioning about interpretations drawn from
our method. One should indeed be careful about how our results might be influenced by
the methodology, for instance our choice of community-detection algorithm. As stressed
before, there exist numerous, sometimes contradictory, ways to uncover communities in
networks, and we have focused here on just one particular method (i.e., optimisation of
394 T. S. Evans et al.
123

Q(c)). More definitive conclusions about the relation between topological communities and
characteristics of scientists should be drawn by comparing results obtained through dif-
ferent algorithms that partition the network into different communities, or even that allow
scientists to belong to multiple overlapping communities. Finally, while our approach takes
a purely structural viewpoint, an interesting approach would be to incorporate non-struc-
tural attributes in the definition of modules, such as more clearly hidden structural simi-
larities between the nodes (Expert et al. 2011).
References
Allen, T. (1977). Managing the flow of technology. Cambridge, MA: MIT Press.Baker, M. J., & Gabbott, M. (2002). The assessment of research. International Journal of Management
Education, 2(3), 3–15.Ball, D. F., & Butler, J. (2004). The implicit use of business concepts in the UK research assessment
exercise. R & D Management, 34(1), 87–97.Barabasi, A. L., Jeong, H., Neda, Z., Ravasz, E., Schubert, A., & Vicsek, T. (2002). Evolution of the social
network of scientific collaborations. Physica, 311, 590–614.Blondel, V. D., Guillaume, J.-L., Lambiotte, R., & Lefebvre, E. (2008). Fast unfolding of communities in
large networks, Journal of Statistical Mechanics, P10008.Borner, K., Chen, C. M., & Boyack, K. W. (2003). Visualizing knowledge domains. Annual Review of
Information Science and Technology, 37, 179–255.Boyack, K. W., Klavans, R., & Borner, K. (2005). Mapping the backbone of science. Scientometrics, 64,
351–374.Braunerhjelm, P., & Feldman, M. (2006). Cluster genesis: Technology-based industrial development.
Oxford: Oxford University Press.Cairncross, F. (1997). The death of distance. Cambridge MA: Harvard University Press.Camic, C. (1992). Reputation and predecessor selection: Parsons and the institutionalists. American
Sociological Review, 57, 421–445.Chen, C. M. (2003). Mapping scientific frontiers: The quest for knowledge visualization. Berlin: Springer.Chung, S., Singh, H., & Lee, K. (2000). Complementarity, status similarity and social capital as drivers of
alliance formation. Strategic Management Journal, 21, 1–22.Colizza, V., Flammini, A., Serrano, M. A., & Vespignani, A. (2006). Detecting rich-club ordering in
complex networks. Nature Physics, 2, 110–115.Cooper, C., & Otley, D. (1998). The 1996 research assessment exercise for business and management.
British Journal of Management, 9, 73–89.Crane, D. (1972). Invisible colleges. Chicago: University of Chicago Press.Cummings, J. N., & Kiesler, S. (2007). Coordination costs and project outcomes in multi-university col-
laborations. Research Policy, 36(10), 138–152.De Castro, R., & Grossman, J. W. (1999). Famous trails to Paul Erdos. Mathematical Intelligence, 21,
51–63.Ding, Y., Foo, S., & Chowdhury, G. (1999). A bibliometric analysis of collaboration in the field of
information retrieval. International Information and Library Review, 30, 367–376.Expert, P., Evans, T. S., Blondel, V. D., & Lambiotte, R. (2011). Uncovering space-independent commu-
nities in spatial networks. Proceedings of the National Academy of Science, 108, 7663–7668.Feld, S. L. (1981). The focused organization of social ties. American Journal of Sociology, 86, 1015–1035.Fortunato, S. (2010). Community detection in graphs. Physics Reports, 486, 75–174.Frenken, K., Hardeman, S., & Hoekman, J. (2009). Spatial scientometrics: Towards a cumulative research
program. Journal of Informetrics, 3, 222–232.Gertler, M. S. (2003). Tacit knowledge and the economic geography of context or the undefinable tacitness
of being (there). Journal of Economic Geography, 3, 75–99.Greenfeld, L. (1989). Different worlds: A sociological study of taste, choice and success in art. Cambridge,
England: Cambridge University Press.Hellsten, I., Lambiotte, R., Scharnhorst, A., & Ausloos, M. (2007). Self-citations, co-authorships and
keywords: A new method for detecting scientists’ field mobility? Scientometrics, 72, 469–486.Higher Education & Research Opportunities (HERO) in the United Kingdom (2001). A Guide to the 2001
Research Assessment Exercise.
Communities and patterns of scientific collaboration 395
123

Hidalgo, C. A., Klinger, B., Barabasi, A. L., & Hausmann, R. (2007). The product space conditions thedevelopment of nations. Science, 317, 482–487.
Jaffe, A. B., Trajtenberg, M., & Henderson R. (1993). Geographic localization of knowledge spillovers asevidenced by patent citations. Quarterly Journal of Economics, 108(3), 578–598.
Jones, B. F., Wuchty, S., & Uzzi, B. (2008). Multi-university research teams: Shifting impact, geography,and stratification in science. Science, 322(5905), 1259–1262.
Katz, J. S., & Martin, B. R. (1997). What is research collaboration?. Research Policy, 26, 1–18.Kossinets, G., & Watts, D. J. (2006). Empirical analysis of an evolving social network. Science, 311, 88–90.Kraut, R., Egido, C., & Galegher, J. (1990). Patterns of contact and communication in scientific research
collaboration. In J. Galegher, R. Kraut, & C. Egido (Eds.) Intellectual teamwork: Social and tech-nological bases of cooperative work (pp. 149–171). Hillsdale, NJ: Lawrence Erlbaum.
Laband, D. N., & Tollison, R. D. (2000). Intellectual collaboration. Journal of Political Economy, 108,632–662.
Lambiotte, R., & Panzarasa, P. (2009). Communities, knowledge creation and information diffusion.Journal of Informetrics, 3, 180190.
Latour, B. (1987). Science in action. Cambridge, MA: Harvard University Press.Lazarsfeld, P. F., & Merton, R. K. (1954). Friendship as social process: A substantive and methodological
analysis. In M. Berger, T. Abel & C. Page (Eds.) Freedom and control in modern society (pp. 18–66).New York, NY: Van Nostrand.
Leydesdorff, L., & Ward, J. (2005). Science shops: Adoscope of science-society collaborations in Europe.Public Understanding of Science, 14, 353–372.
Leydesdorff, L., & Rafols, I. (2008). A global map of science based on the ISI subject categories. Journal ofthe American Society for Information Science, 60, 348–362.
Lorange, P., & Roos, J. (1992). Strategic alliances. Cambridge, MA: Blackwell.McPherson, J. M., Smith-Lovin, L., & Cook, J. M. (2001). Birds of a feather: Homophily in social networks.
Annual Review of Sociology, 27, 415–444.Monge, P., Rothman, L., Eisenberg, E., Miller, K., & Kirste, K. (1985). The dynamics of organizational
proximity. Management Science, 31, 1129–1141.Moody, J. (2004). The structure of social science collaboration network: Disciplinary cohesion from 1963 to
1999. American Sociological Review, 69, 213–238.Newman, M. E. J. (2001a). The structure of scientific collaboration networks. Proceedings of the National
Academy of Science, 98, 404–409.Newman, M. E. J. (2001b). Scientific collaboration networks. I. Network construction and fundamental
results. Physical Review E, 64, 016131.Newman, M. E. J., & Girvan, M. (2004). Finding and evaluating community structure in networks. Physical
Review E, 69, 026113.Opsahl, T., Colizza, V., Panzarasa, P., & Ramasco, J. J. (2008). Prominence and control: The weighted rich-
club effect. Physical Review Letters, 101, 168702.Podolny, J. M. (1994). Market uncertainty and the social character of economic exchange. Administrative
Science Quarterly, 39, 458–483.Podolny, J. M., & Stuart, T. E. (1995). A role-based ecology of technological change. American Journal of
Sociology, 100, 1224–1260.Price, D. J. de S. (1965). Networks of scientific papers. Science, 149, 510–515.Reagans, R. (2005). Preferences, identity, and competition: Predicting tie strength from demographic data.
Management Science, 51(9), 1374–1383.Reichardt, J., & Bornholdt, S. (2004). Detecting fuzzy community structures in complex networks with a
Potts model. Physical Review Letters, 93, 218701.Rosvall, M., & Bergstrom, C. T. (2008). Maps of random walks on complex networks reveal community
structure. Proceedings of the Natonal Academy of Science, 105, 1118.Scharnhorst, A., & Ebeling, W. (2005). Evolutionary search agents in complex landscapes—A new model
for the role of competence and meta-competence (EVOLINO and other simulation tools),arXiv:0511232.
Traud, A. L., Kelsic, E. D., Mucha, P. J., & Porter, M. A. (2010) Community structure in online collegiatesocial networks, arXiv:0809.0690.
Wallace, M. L., & Gingras, Y. (2008). A new approach for detecting scientific specialties from rawcocitation networks. Journal of the American Society for Information Science, 60, 240–246.
Whitfield, J. (2008). Group theory. Nature, 455, 720–723.Wuchty, S., Jones, B. F., & Uzzi, B. (2007). The increasing dominance of teams in production of knowl-
edge. Science, 316, 1036–1039.
396 T. S. Evans et al.
123

A few special cases: scientific creativity and networkdynamics in the field of rare diseases
M. Laura Frigotto • Massimo Riccaboni
Received: 4 June 2011 / Published online: 21 June 2011� Akademiai Kiado, Budapest, Hungary 2011
Abstract We develop a model of scientific creativity and test it in the field of rare
diseases. Our model is based on the results of an in-depth case study of the Rett Syndrome.
Archival analysis, bibliometric techniques and expert surveys are combined with network
analysis to identify the most creative scientists. First, we compare alternative measures
of generative and combinatorial creativity. Then, we generalize our results in a stochastic
model of socio-semantic network evolution. The model predictions are tested with an
extended set of rare diseases. We find that new scientific collaborations among experts in a
field enhance combinatorial creativity. Instead, high entry rates of novices are negatively
related to generative creativity. By expanding the set of useful concepts, creative scientists
gain in centrality. At the same time, by increasing their centrality in the scientific com-
munity, scientists can replicate and generalize their results, thus contributing to a scientific
paradigm.
Keywords Creativity � Co-authorship network � Scientific collaboration �Bibliometric indicators � Biomedical research � Qualitative and quantitative method
Mathematics Subject Classification (2000) 05C82 � 05C90 � 05C65 � 62P25 �91D30 � 91B82
JEL Classification C63 � L14 � L26 � L65 � O31 � O33
To create consists precisely in not making useless combinations and in making those
which are useful and which are only a small minority […] not that I mean as sufficing
for invention the bringing together of objects as disparate as possible; most
M. L. Frigotto (&) � M. RiccaboniDepartment of Management and Computer Science, University of Trento,Via Inama, 5, 38100 Trento, Italye-mail: [email protected]
123
Scientometrics (2011) 89:397–420DOI 10.1007/s11192-011-0431-9
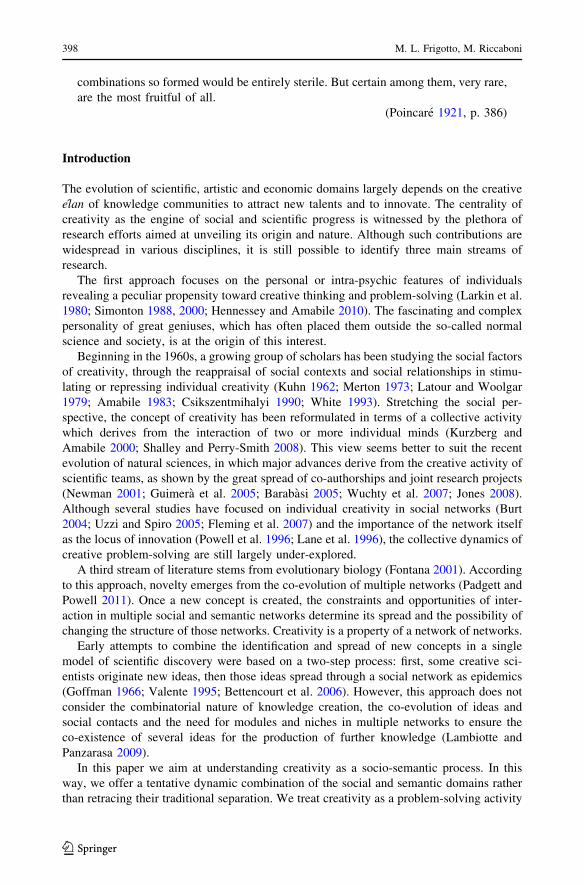
combinations so formed would be entirely sterile. But certain among them, very rare,
are the most fruitful of all.
(Poincare 1921, p. 386)
Introduction
The evolution of scientific, artistic and economic domains largely depends on the creative
elan of knowledge communities to attract new talents and to innovate. The centrality of
creativity as the engine of social and scientific progress is witnessed by the plethora of
research efforts aimed at unveiling its origin and nature. Although such contributions are
widespread in various disciplines, it is still possible to identify three main streams of
research.
The first approach focuses on the personal or intra-psychic features of individuals
revealing a peculiar propensity toward creative thinking and problem-solving (Larkin et al.
1980; Simonton 1988, 2000; Hennessey and Amabile 2010). The fascinating and complex
personality of great geniuses, which has often placed them outside the so-called normal
science and society, is at the origin of this interest.
Beginning in the 1960s, a growing group of scholars has been studying the social factors
of creativity, through the reappraisal of social contexts and social relationships in stimu-
lating or repressing individual creativity (Kuhn 1962; Merton 1973; Latour and Woolgar
1979; Amabile 1983; Csikszentmihalyi 1990; White 1993). Stretching the social per-
spective, the concept of creativity has been reformulated in terms of a collective activity
which derives from the interaction of two or more individual minds (Kurzberg and
Amabile 2000; Shalley and Perry-Smith 2008). This view seems better to suit the recent
evolution of natural sciences, in which major advances derive from the creative activity of
scientific teams, as shown by the great spread of co-authorships and joint research projects
(Newman 2001; Guimera et al. 2005; Barabasi 2005; Wuchty et al. 2007; Jones 2008).
Although several studies have focused on individual creativity in social networks (Burt
2004; Uzzi and Spiro 2005; Fleming et al. 2007) and the importance of the network itself
as the locus of innovation (Powell et al. 1996; Lane et al. 1996), the collective dynamics of
creative problem-solving are still largely under-explored.
A third stream of literature stems from evolutionary biology (Fontana 2001). According
to this approach, novelty emerges from the co-evolution of multiple networks (Padgett and
Powell 2011). Once a new concept is created, the constraints and opportunities of inter-
action in multiple social and semantic networks determine its spread and the possibility of
changing the structure of those networks. Creativity is a property of a network of networks.
Early attempts to combine the identification and spread of new concepts in a single
model of scientific discovery were based on a two-step process: first, some creative sci-
entists originate new ideas, then those ideas spread through a social network as epidemics
(Goffman 1966; Valente 1995; Bettencourt et al. 2006). However, this approach does not
consider the combinatorial nature of knowledge creation, the co-evolution of ideas and
social contacts and the need for modules and niches in multiple networks to ensure the
co-existence of several ideas for the production of further knowledge (Lambiotte and
Panzarasa 2009).
In this paper we aim at understanding creativity as a socio-semantic process. In this
way, we offer a tentative dynamic combination of the social and semantic domains rather
than retracing their traditional separation. We treat creativity as a problem-solving activity
398 M. L. Frigotto, M. Riccaboni
123

characterized by novelty, unconventionality, persistence, and difficulty in problem for-
mulation (Newell et al. 1959). To study creativity, we focus on rare diseases as scientific
specialties where problems are novel (most of the research started after the genomic
revolution in the 1990s), unconventional (diseases are frequently misdiagnosed), persistent(more than a decade is required, from problem identification to a cure) and ill-defined(causes and symptoms of rare diseases are still largely unknown). We draw attention on the
process of problem-solving which can be described as a search through a maze (Simon
1962), requiring the activation and teamwork of scientists (the emergence of communities
and team assembly) as well as the identification, combination and retention of useful
concepts (abstract and general ideas inferred from specific instances). The more difficult
and novel the disease, the greater the amount of trial-and-error required to find a solution
by recombining individual capabilities and concepts. We hypothesize that new combina-
tions of scientists and concepts which represent progress toward the goal of finding a cure
are retained as stable modules in socio-semantic networks; all others are dissolved. To test
our research hypothesis, we perform an in-depth case study and develop a theoretical
framework for the evolution of scientific creativity.
The paper is structured as follows. In ‘‘Knowledge creation and diffusion in scientific
networks’’ section, we locate our research in the literature on creativity. ‘‘Empirical pro-
tocol, data and methods’’ section describes our inductive approach and research method-
ology: from an in-depth case study analysis of a rare disease (‘‘The Rett Syndrome’’
section) to a model of the co-evolution of social and semantic networks (‘‘A stochastic
model of scientific creativity’’ section). The last section is devoted to a discussion and
summary of our main findings.
Knowledge creation and diffusion in scientific networks
Creativity is a complex phenomenon which has been studied from several different per-
spectives. The socio-economic literature notes that creative activity is accomplished by
people who occupy a special position in the social network or the economic system at a
certain moment in time (Schumpeter 1934). However, there is no consensus on exactly
where creative people can be found: at the periphery of the community, at the center, or in
a brokerage position.
In his analysis of the evolution of science, Kuhn argues creative people must be
peripheral, to keep some distance from mainstream knowledge and social relations and to
gain a different view of the field: ‘‘Any new interpretation of nature, whether a discovery
or a theory, emerges first in the mind of one or a few individuals. It is they who first learn
to see science and the world differently, and their ability to make the transition is facili-
tated by two circumstances that are not common to most other members of their profession.
Invariably their attention has been intensely concentrated upon the crisis-provoking
problems; usually in addition, they are men so young or so new to the crisis-ridden field
that practice has committed them less deeply than most of their contemporaries to the
world view and rules determined by the old paradigm’’ (1962, p. 143). As novices, they
may offer the field their fresh and divergent thinking. The kind of creativity underlying
such discoveries displays a generative nature, as it implies the introduction of new concepts
and theories on which new scientific achievements become possible (generative creativity).
Conversely, as brokers, individuals are at the crossroads of knowledge circulating
within different social circles. In this position, they have the best opportunity to produce
creative ideas. In this perspective, creativity has typically a combinatorial nature, as it is
Scientific creativity and network dynamics in the field of rare diseases 399
123
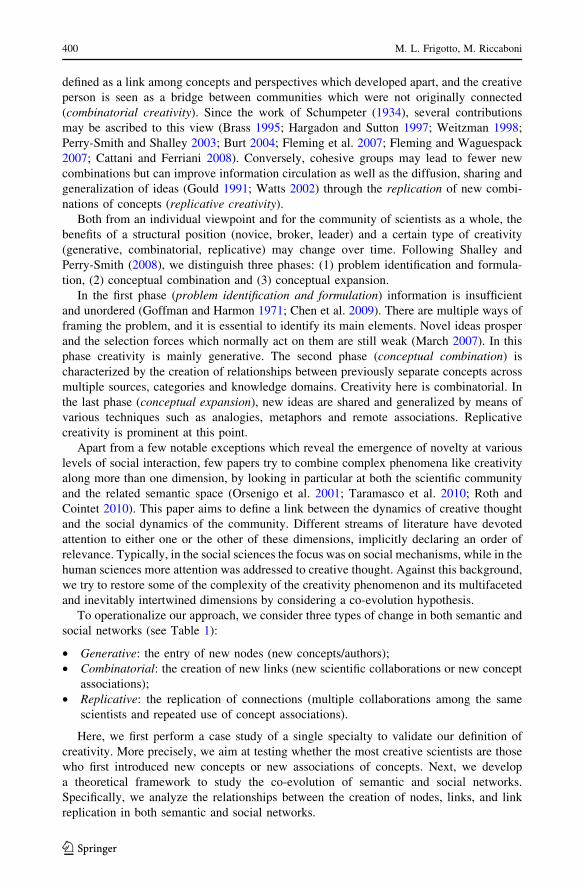
defined as a link among concepts and perspectives which developed apart, and the creative
person is seen as a bridge between communities which were not originally connected
(combinatorial creativity). Since the work of Schumpeter (1934), several contributions
may be ascribed to this view (Brass 1995; Hargadon and Sutton 1997; Weitzman 1998;
Perry-Smith and Shalley 2003; Burt 2004; Fleming et al. 2007; Fleming and Waguespack
2007; Cattani and Ferriani 2008). Conversely, cohesive groups may lead to fewer new
combinations but can improve information circulation as well as the diffusion, sharing and
generalization of ideas (Gould 1991; Watts 2002) through the replication of new combi-
nations of concepts (replicative creativity).
Both from an individual viewpoint and for the community of scientists as a whole, the
benefits of a structural position (novice, broker, leader) and a certain type of creativity
(generative, combinatorial, replicative) may change over time. Following Shalley and
Perry-Smith (2008), we distinguish three phases: (1) problem identification and formula-
tion, (2) conceptual combination and (3) conceptual expansion.
In the first phase (problem identification and formulation) information is insufficient
and unordered (Goffman and Harmon 1971; Chen et al. 2009). There are multiple ways of
framing the problem, and it is essential to identify its main elements. Novel ideas prosper
and the selection forces which normally act on them are still weak (March 2007). In this
phase creativity is mainly generative. The second phase (conceptual combination) is
characterized by the creation of relationships between previously separate concepts across
multiple sources, categories and knowledge domains. Creativity here is combinatorial. In
the last phase (conceptual expansion), new ideas are shared and generalized by means of
various techniques such as analogies, metaphors and remote associations. Replicative
creativity is prominent at this point.
Apart from a few notable exceptions which reveal the emergence of novelty at various
levels of social interaction, few papers try to combine complex phenomena like creativity
along more than one dimension, by looking in particular at both the scientific community
and the related semantic space (Orsenigo et al. 2001; Taramasco et al. 2010; Roth and
Cointet 2010). This paper aims to define a link between the dynamics of creative thought
and the social dynamics of the community. Different streams of literature have devoted
attention to either one or the other of these dimensions, implicitly declaring an order of
relevance. Typically, in the social sciences the focus was on social mechanisms, while in the
human sciences more attention was addressed to creative thought. Against this background,
we try to restore some of the complexity of the creativity phenomenon and its multifaceted
and inevitably intertwined dimensions by considering a co-evolution hypothesis.
To operationalize our approach, we consider three types of change in both semantic and
social networks (see Table 1):
• Generative: the entry of new nodes (new concepts/authors);
• Combinatorial: the creation of new links (new scientific collaborations or new concept
associations);
• Replicative: the replication of connections (multiple collaborations among the same
scientists and repeated use of concept associations).
Here, we first perform a case study of a single specialty to validate our definition of
creativity. More precisely, we aim at testing whether the most creative scientists are those
who first introduced new concepts or new associations of concepts. Next, we develop
a theoretical framework to study the co-evolution of semantic and social networks.
Specifically, we analyze the relationships between the creation of nodes, links, and link
replication in both semantic and social networks.
400 M. L. Frigotto, M. Riccaboni
123

Empirical protocol, data and methods
Research strategy overview
The goal of this paper is to define, measure and model creativity in scientific networks. In
the first part of our work (‘‘The Rett Syndrome’’ section), we conduct an in-depth analysis
of a single scientific community. In the second part (‘‘A stochastic model of scientific
creativity’’ section), we develop and test a stochastic model of network evolution.
The case study is designed: (1) to identify the conceptual cores and field boundaries
of an epistemic network (Laumann et al. 1983); (2) to explore the possibility of mea-
suring creativity by means of peer evaluation, bibliometric and network indicators; (3)
to test whether the most creative scientists, identified by measures at point (2), have
introduced new combinations of concepts in the evolution of a rare disease specialty
toward a cure. Throughout the case study, we combine both qualitative and quantitative
methods, such as archival and bibliometric analysis, to benefit from their complemen-
tarities (Denzin and Lincoln 1994) and to achieve reciprocal internal validation of results
(Yin 1994).
Our modeling effort builds upon a tradition of stochastic null-models of science dating
back to Simon (1955). The model is based on three parameters: the entry of new nodes, the
creation of new links, and the replication of existing links (Guimera et al. 2005). First, we
simulate the model for the social network of co-authorships and the semantic network of
concept co-occurrence in scientific papers. Then we estimate the maximum likelihood
value of the parameters of the model in some rare diseases. Lastly, we check for any
relationship between the structural parameters for the semantic and social networks across
different domains. The presence of a clear-cut relationship among them implies that the
two evolutionary processes of the semantic and social networks are interdependent.
Research setting
In order to be theoretically and methodologically coherent with our research questions, a
suitable empirical field of study should display creative problem-solving of different kinds
(generative, combinatorial, replicative). It should also provide a moderately sizable and
well-defined research topic. In this paper, our first focus is on one rare disease occurring
almost exclusively in girls, called the Rett Syndrome (RTT). Next, we test our model on
Table 1 Creativity in socio-semantic networks
Steps in creativeproblem-solving
Problemidentification
Conceptual combination Conceptual expansion
Networks events New nodes New links Replication of links
Semantic networkof concepts
Generation of newconcepts (generativecreativity)
Generation of newcombinations ofconcepts(combinatorialcreativity)
Replication of conceptcombinations,validation anddiffusion (replicativecreativity)
Social networkof scientists
Entry of newscientists (novices)
New scientificcollaborations
Replication ofcollaborations
Scientific creativity and network dynamics in the field of rare diseases 401
123

more diseases: Noonan and Horner syndromes, Mesothelioma, Paroxysmal Nocturnal
Hemoglobinuria (PNH), and Adenosine Deaminase (ADA) deficiency. We tested the
adequacy of RTT, a rare disease, as a research setting so that it could be empirically
defined as a creative and closed field. In the following subsections, we describe how this
was done, reporting results in ‘‘The Rett Syndrome’’ section. The same method was applied
to identifying the other five rare diseases in ‘‘A stochastic model of scientific creativity’’
section.
Empirical closure
According to Csikszentmihalyi (1990), creativity requires dynamic interactions among
three subsystems: the individual creator, the knowledge domain (i.e., the Kuhnian para-
digm), and the field, which consists of those persons who work in the same domain, and
thus have their creativity governed by the same domain-specific guidelines. As a field for
our study, we chose a specialty, defined as ‘‘a group of researchers and practitioners who
have similar training, attend the same conferences, read and cite the same body of literature
(Fuchs 1993; Chen et al. 2009, p. 3)’’. This choice was made for two reasons. Concep-
tually, it is correct to segregate science into subfields displaying cohesive dynamics of both
knowledge concepts and scientists working within them. Scientists do select their readings
and relations according to their interests, and thus identify a specific reference community
and their shared knowledge bases (Borner et al. 2004). In practice, this allowed us to
solve the methodological problem of defining the boundary of the epistemic network, by
selecting a field which is computationally tractable, but also socially and thematically
closed.
To trace the boundary of the RTT specialty, we examined whether any convergence
of the field (i.e., important topics and reference people) existed, according to experts’
assessment of key scientists and papers collected through questionnaires, lists of topics
addressed in specialized conferences, scientific reviews, and numerous descriptions of the
field which are available to the general public through the internet and other informational
sources. We also mined all papers in PubMed mentioning the term ‘‘Rett Syndrome’’ in the
abstract and cross-checked the two lists.
Data availability
Another reason for choosing rare diseases, and RTT in particular, is due to their recent
history, which can be traced both on the web and in databases such as PubMed since their
early beginnings. Eighty per cent of rare diseases are of genetic origin. Since the Orphan
Drug Act was passed in 1983 and the Human Genome Project started in 1990, most
research in this field has been carried out in the last 25 years. To sum up, the choice
to study rare diseases appeared to be suitable: they are new specialties of tractable
dimensions.
Data collection
Data for the case-study analysis on RTT was collected in four steps.
First, we decided to conduct research on existing scientific and informational literature
on the evolution of RTT knowledge, in order to extend our understanding of the dynamics
402 M. L. Frigotto, M. Riccaboni
123

of the field, without being a priori guided by the beliefs of RTT experts. We referred to
both specialized and non-technical materials published on the web (especially parents’
associations websites) and in scientific journals. We also attended the 2009 Meeting of the
European Working Group on Rett Syndrome,1 where we recorded the sessions and checked
for the persistence of key concepts/scientists in the discourse (number of times they were
mentioned in presentations).
Second, we contacted a set of RTT experts and proposed a questionnaire to scientists
working in the field (see Appendix). Our goal was to validate the existence of a social
community (field) and common semantic space (domain) corresponding to the specialty
analyzed. In this way, we aimed at ascertaining the existence of a convergence on what
they consider their reference context, in terms of both knowledge and people. In addition,
we used these data to build our understanding on an endogenously and empirically defined
notion of creativity. As regards the identification of interviewees, a primary list of contacts
resulted from the combination of the contacts of two Research Foundations on RTT and
contact with 78 RTT authors listed in PubMed. The list was integrated with participants in
one of the main international conferences in the field (63 names). The questionnaire was
structured with open questions, and was sent to contacts by e-mail. We asked the RTT
experts to rank at least five authors they considered the most important in the field, and the
five most creative.2 We then asked them to cite at least five key scientific publications in
the field and the most important research topics. Our response rate was 11%, including 5 of
the top 30 RTT scientists. Although the results are not statistically significant, given the
small size of the community and the low response rate, all responders were experts with
publications in this field.
Third, we extracted some classical bibliometric indicators from Scopus (Hirsch’s h-
index) and the ISI Web of Knowledge (the sum of the journal impact factor of authors’
publications) and compared them with data on creative scientists and contributions
collected through the questionnaires.
Fourth, to analyze semantic and social networks, we developed a thesaurus of rare
diseases which could be adapted to the great fragmentation of knowledge in the field.
We then extracted all the publications on rare diseases in PubMed. We analyzed the
dynamics of semantic and social networks and identified the connections between the
two, tracing the relationship between authors and their creative concepts. We developed
a tool similar to ConceptLink (White et al. 2004) to generate concept maps with the
Unified Medical Language System (UMLS) co-occurrence database of MeSH descrip-
tors. Thus, one node in our semantic network is a concept (MeSH term) and links among
concepts are computed according to the number of co-occurrences of a pair of concepts
in PubMed abstracts. In a similar fashion, we built a co-authorship network based on the
number of joint publications of biomedical scientists, and computed three simple mea-
sures of author centrality: strength, degree, and k-core. Centrality indicators were
selected to check whether authors with several joint publications (strength), more
co-authors (degree) and members of the inner core of the network (k-core members)
were the most creative scientists.
1 www.rettmeeting.org/.2 We did not provide our interviewees with a definition either of relevance or of creativity, as the aim of theinquiry was to find a definition embedded in the community.
Scientific creativity and network dynamics in the field of rare diseases 403
123

The Rett Syndrome
Case description
In the field of biomedical sciences, rare diseases are emerging research specialties.
According to the European definition, a rare disease is a serious or lethal illness affecting
less than one person every 2,000 individuals (75 cases out of 100,000 individuals according
to the U.S. definition). Recent estimates show that not less than 30 million Europeans
suffer from rare diseases. Nevertheless, the field is far from maturity. In fact, despite rarity,
five new rare diseases are discovered every week and, for 8,284 diseases out of 9,471
(87%), there is no information available in public data sources and no ongoing research
activity (‘‘orphan diseases’’). After the Orphan Drug Act was passed in the United States
(1983), research in some rare disease areas has intensified. However, most rare diseases are
still specialties in which creativity and novelty are pivotal, for both identification of the
disease, and any progression toward a cure.
Our case study focuses on the RTT, a genetic neurodevelopmental disorder which
appears in infancy and predominantly affects girls. RTT patients are normal at birth and
during early development but, after the sixth month of age, display postnatal deceleration
of head growth, psychomotor regression, gait dysfunction, and stereotypic movements such
as the so-called ‘‘hand-washing’’. RTT is the second cause of mental retardation in girls
throughout the world, with an estimated average incidence of one case every 22,800 girls
between 2 and 8 years old. Unfortunately, there is no treatment available for RTT. Several
steps have been taken toward identifying treatment3: they are based, first, on a clear-cut
definition of the disease and, second, on deep understanding of its genetic mechanisms. At
present, knowledge of RTT and its genetic causes is still unstable, as it is constantly being
revised and refined.4
On the question of definition, there is a substantial consensus regarding the descriptive
traits of the disease. However, neither the International Classification of Diseases nor the
Diagnostic and Statistical Manual of Mental Disorders appropriately classify RTT in line
with recent evidence. RTT is not an autistic disorder, although it is categorized among
them. As regards identification of genetic causes, 95% of classic RTT cases reveal a
mutated gene in the X chromosome, which provides instructions for the over- or under-
production of a protein (MeCP2) which is critical for normal brain development. Con-
versely, only 20–40% of girls affected by a variant form also show a MeCP2 mutation. As
a result, other genes, such as CDKL5, have been highlighted as responsible for a set of such
RTT manifestations. Nevertheless, in general, such mutations are not one-to-one associated
with RTT, but may also occur in other diseases.
3 The first phase consists of identifying a set of typical characters of the disease (1a) and its association withthe genetic disorder which is responsible for its onset (1b). As a second stage, precise understanding of themolecular mechanisms underlying the disease is required (2), which recognizes molecules and therapeuticstrategies to be tested in vitro (3), and later in laboratory animals (4). After these four steps (pre-clinicalphases), it is possible to test the treatment on humans and results will show whether any treatment for thedisease has been found or not.4 See, as an example of such a process of redefinition and specification, changes in the topics list concerningthe European Working Group on Rett Syndrome First and Second Conferences, which took place respec-tively in 2007 and 2009: 2007 Topics—The Molecular Cause of Rett Syndrome, MeCP2 Target Genes,Respiration Control and Seizures, Neuronal Plasticity, Future Approaches; 2009 Topics—Basic MolecularMechanism of MeCP2, Circuit Defects in Rett Syndrome, Behavioral Deficits in Mice Lacking a FunctionalMeCP2, Modifier Genes and Other Genes Involved in Rett Syndrome, Therapeutic Approaches, MolecularGenetics.
404 M. L. Frigotto, M. Riccaboni
123

While the causes of the syndrome are challenging researchers, progressive ability to
identify and diagnose RTT has enriched the picture of cases5 and has also added com-
plexity to their potential understanding. For example, not only girls are affected by RTT, as
some cases of male phenotypes have also been discovered. Overall, we may state that
knowledge of RTT is at a stage in which there are some descriptions of empirical facts,
such as clinical evidence, sometimes associated with behavioral traits, and that these facts
are sometimes ordered into clearly defined new diseases over time. However, knowledge is
far from consolidated. Conversely, continuous growth supported by creative discoveries is
acknowledged.
Is Rett Syndrome a specialty?
By the end of 2009, 4,498 researchers had contributed to research on RTT by producing
1,653 scientific articles and 2,243 distinct concepts (MeSH terms). Table 2 lists some key
statistics of the top scientists in the RTT research domain. They are the most frequently
cited scientists by our responders, ordered by year of entry in the RTT community (last
column of the table). We provide in bold those who made the most significant discoveries
about RTT. Questionnaire results, bibliometric indices and network statistics are reported.
With reference to questionnaire results, for each attribute we show both ranking position
and a score proportional to the number of times a scientist was mentioned and the number
of scientists the single responder cited in the answer (columns 1–4). Columns 5–6 reflect
the frequency with which a paper written by a scientist was mentioned among the key
papers. We also provide an average of the first three variables (columns 7–8). With
reference to bibliometric analysis, we report overall production (number of papers) and the
Hirsch’s h-index of each author, as well as the number of papers on RTT and the sum of
the Impact Factor of RTT publications. As network statistics, we report strength, degree,
k-core and year of entry into the network.
The set of key scientists, as recognized by peers in questionnaire results, is restricted to
the group of authors listed in Table 2. Adrian Bird and Huda Zoghbi are unanimously
recognized as the most important scientists in this field; Andreas Rett (the Austrian sci-
entist who first identified the syndrome) ranks fifth. Higher dispersion is displayed with
regard to publications; however, a core of four most important works can be clearly
identified. All respondents except one cited Guy et al. (2007) among the five most
important readings in the field. Only two did not mention MeCP2 as a key concept in the
field. On key concepts for research, both questionnaires and analysis of conference topics
showed that research is focused on the study of MeCP2, the most probable main cause of
RTT. Both informative and specialized literature accounts for the evolution of studies on
RTT, citing the same scientists as keys to the field and the same open challenges for
research.
Overall, these results support the hypothesis that RTT is a specialty, with a definite
reference community (field) and knowledge base (domain). Scientists display high con-
vergence of perceptions on people and topics (community closure). People in the epistemic
community read the same papers, share similar research interests and relate to the same
colleagues.
5 This information is now more easily available to researchers and physicians, as a database on MECP2mutations (RettBase) and a repository of clinical information (InterRett) are being collected.
Scientific creativity and network dynamics in the field of rare diseases 405
123

Ta
ble
2C
reat
ivit
yin
Ret
tS
yndro
me
scie
nti
fic
com
munit
y:
ques
tionnai
rere
sult
s,bib
liom
etri
cin
dic
ators
and
net
work
stat
isti
cs
Key
scie
nti
sta
Ques
tionnai
rere
sult
sB
ibli
om
etri
cin
dic
ators
Net
work
stat
isti
cs
To
tal
Ret
t
Cre
ativ
ity
Rel
evan
ceK
eypap
ers
Tota
lP
aper
sbh
ind
exb
Pap
ersc
IF,
tota
ldIF
,y
earl
yd
Str
eng
thD
egre
ek
-co
reE
ntr
y
Ret
tA
nd
rea
s1
12
.24
15
.66
13
.35
10
.44
2n
.a.
4(4
)4
.90
.39
95
19
52
Hag
ber
gB
eng
t1
03
.35
15
.08
6.6
88
.31
10
12
46
(21
)5
4.3
2.7
10
96
01
51
98
3
Per
cyA
lan
e1
03
.39
3.8
––
15
3.6
15
11
64
3(2
5)
10
1.7
5.1
18
91
26
16
19
89
Zog
hb
iH
ud
a2
24
.62
61
.32
54
.72
46
.92
61
64
51
(36
)2
79
.91
4.7
24
71
73
23
19
90
Nai
du
Sak
ku
Bai
––
16
1.0
––
24
1.0
12
32
64
5(1
8)
15
0.2
7.9
24
21
72
20
19
90
Ker
rA
liso
n–
–1
12
.2–
–1
62
.25
71
74
5(8
)7
9.6
4.2
27
11
90
25
19
90
Arm
stro
ng
Daw
na
––
13
1.7
––
19
1.7
37
22
22
(10
)4
9.5
2.6
82
73
20
19
90
Fra
nck
eU
tae
11
2.2
–0
.05
14
.31
15
.54
32
36
21
(17
)1
05
.75
.99
36
82
01
99
1
Bir
dA
dri
an
16
6.9
17
0.6
17
7.1
17
1.5
15
05
03
3(2
5)
31
3.7
18
.51
13
82
17
19
92
Leo
nar
dH
elen
96
.71
22
.1–
–1
34
.47
11
66
1(2
3)
93
.45
.84
25
20
52
01
99
3
Sch
anen
Car
oly
n1
12
.2–
0.0
12
4.0
17
2.1
34
13
14
(6)
65
.95
.57
36
71
31
99
7
Wad
eP
aul
––
–0
.0–
––
–6
43
31
5(7
)1
05
.09
.54
02
81
01
99
8
Lan
dsb
erg
erN
ico
lett
ae1
03
.3–
0.0
––
19
1.7
28
11
6(2
)5
2.0
4.7
49
39
19
19
98
Chri
sto
dou
lou
Joh
ne
13
1.3
–0
.0–
–2
50
.71
52
27
47
(17
)1
03
.79
.43
35
17
62
01
99
8
Ren
ieri
Ale
ssan
dra
––
13
1.7
––
19
1.7
122
25
23
(13)
75.2
8.4
255
108
23
2000
Bie
nv
enu
Th
ierr
ye
––
–0
.0–
––
–1
48
25
19
(8)
80
.48
.91
66
89
17
20
00
LaS
alle
Jan
ine
61
1.3
71
0.1
15
0.4
10
7.3
45
16
22
(16
)8
6.4
10
.87
54
61
12
00
1
Gu
yJa
cky
11
2.2
–0
.04
21
.69
7.9
87
4(0
)4
3.2
5.4
23
18
10
20
01
Ja
enis
chR
ud
olp
h7
9.7
61
3.2
32
6.9
31
6.6
18
77
81
2(6
)1
04
.51
3.1
61
47
10
20
01
Su
nY
i4
18
.39
3.3
88
.26
10
.03
22
17
(4)
30
.24
.33
12
51
82
00
2
Man
del
Gai
l5
12
.88
9.4
10
4.7
79
.02
81
83
(1)
15
.12
.21
81
71
02
00
2
Eu
ban
ks
Jam
es8
8.0
11
2.2
13
2.2
14
4.1
59
14
9(7
)2
1.7
3.1
35
20
62
00
2
Wo
od
cock
C.L
.1
03
.3–
0.0
14
1.1
20
1.5
86
21
6(4
)3
5.7
5.9
24
12
52
00
3
406 M. L. Frigotto, M. Riccaboni
123

Ta
ble
2co
nti
nu
ed
Key
scie
nti
sta
Ques
tionnai
rere
sult
sB
ibli
om
etri
cin
dic
ators
Net
work
stat
isti
cs
To
tal
Ret
t
Cre
ativ
ity
Rel
evan
ceK
eypap
ers
Tota
lP
aper
sbh
ind
exb
Pap
ersc
IF,
tota
ldIF
,y
earl
yd
Str
eng
thD
egre
ek
-co
reE
ntr
y
Gre
enb
erg
Mic
ha
el3
21
.33
16
.67
9.2
41
5.7
12
06
45
(4)
36
.76
.12
82
21
32
00
3
Chan
gQ
ian
g1
31
.3–
0.0
11
4.4
18
1.9
13
94
(0)
24
.44
.12
62
31
02
00
3
Mo
rett
iP
aolo
11
2.2
–0
.0–
–2
31
.16
44
(4)
8.6
2.1
24
20
10
20
05
Mo
nte
ggia
Lis
aM
.–
–1
41
.3–
–2
21
.35
32
25
(4)
17
.96
.01
39
52
00
6
Kat
zD
avid
96
.71
02
.7–
–1
24
.79
41
86
(4)
2.2
0.7
24
16
62
00
6
Po
zzo-M
ille
rL
uca
s1
21
.71
51
.1–
–2
11
.44
51
93
(3)
7.4
3.7
15
10
82
00
7
Just
ice
Mo
nic
a1
41
.11
51
.1–
–2
31
.11
15
26
––
––
––
–
aS
cien
tist
so
rder
edb
yy
ear
of
entr
yin
toR
TT
(las
tco
lum
n).
Au
tho
rso
fth
em
ost
sig
nifi
can
td
isco
ver
ies
inb
old
bT
ota
ln
um
ber
of
pap
ers,
So
urc
eS
cop
us
cP
ub
Med
pap
ers
on
Ret
t(o
fw
hic
has
the
last
auth
or)
dS
ou
rce
ou
rco
mp
uta
tio
no
nIS
IW
ebo
fS
cien
cee
Ques
tionnai
rere
sponder
s
Scientific creativity and network dynamics in the field of rare diseases 407
123

How can we measure creativity?
The lists of the most creative scientists and of the most important scholars identified by
community members do not perfectly match (see columns 1–4 in Table 2). In addition,
interviewees never report the same names and/or rankings for the two questions. This
shows that the difference between the two attributes has been carefully weighted by
responders. Comparing the ranking of the top ten most creative and most important
scholars, we note that creativity is associated with more recent contributors (although their
papers are not considered to be references in the field); as regards importance responders
recall the ‘‘founding fathers’’ of the field in question: Rett and Hagberg.
The most creative scientist,6 Adrian Bird, has recently shown the reversibility of RTT,
and thus the possibility of finding therapy for patients (Guy et al. 2007). Next in the
ranking, Huda Zoghbi has discovered that the mutation of the MeCP2 gene is one of the
major causes of RTT Syndrome. Michael Greenberg has directed attention to other genes
which may be related to MeCP2 and be the indirect cause of the disorder. Rudolph
Jaenisch has contributed to the advances in knowledge of RTT. By introducing mouse
models and using transgenic animal experiments as suitable methods for gene research, he
has shown that therapeutic cloning can correct genetic defects in mice. He leads a group
which has patented a candidate treatment (IGF-1) and has also recently started a clinical
trial.7
All these contributions lie on the path to definite understanding of the disorder and aim
at finding treatment. On this point, it seems that works which approach a cure (i.e., provide
an answer to the key research question) are clearly assessed as creative by the scientific
community and are very well considered by the community of patient families and donors
which socially and financially supports such research. It also seems that creative scientists
contribute new concepts or establish new associations between key concepts to find a cure
for RTT. Bird introduced the new concept MeCP2 (generative creativity). MeCP2 was then
linked to RTT by Zoghbi (combinatorial creativity). Authors who have introduced new
concepts or new combinations of concepts are recognized as creative by the scientific
community. These two dimensions build up our endogenous definition of creativity, which
also reflects its generative and combinatorial nature, as pointed out in the literature.
Although we found a correspondence between descriptions of RTT and experts’ eval-
uation of creativity, it is not easy to find a good measure of creativity from standard
bibliometric indicators such as number of papers, Impact Factor (IF), h-index and cen-
trality of authors in the community. This is particularly challenging in the case of young
scientists. Centrality indicators in the network of co-authorships, such as strength or
degree, are only loosely related to creativity ranking provided by peers. For instance, the
scientist with the highest strength score was not even mentioned by our responders as being
a creative person. The number of years of contributions to the field do not appear to be
significant in relation to creativity, whereas IF scores (especially when divided by pro-
duction time) and the h-index can replicate the very top positions (like Bird and Zoghbi),
but appear to be highly unsuitable to capture the phenomenon as a whole.8 As a result,
6 Cfr. Table 2, scientists in bold.7 http://www.disabled-world.com/medical/clinical-trials/rett-trial.php.8 Adrian Bird, who was identified as the most creative and important, has the highest IF, but other indicatorsdo not correspondingly highlight such a prominent position in the network. This weak correspondence is lostfor other authors who are ranked lower, such as Michael Greenberg or Rudolph Jaenisch. Young researchers,e.g. Monica Justice, were mentioned by peers for their creativity, but are not present in the network yet.
408 M. L. Frigotto, M. Riccaboni
123

there is no direct mapping of creativity as has been ‘‘declared’’ by experts with a single
bibliometric indicator as already pointed out by van den Beemt and van Raan (1995) and
Rinia et al. (1998).
Another reason why classical metrics are not effective in signaling creativity may also
lie in the evolutionary path which it has taken within the field. Both the deployment of
creativity and the involvement of authors on RTT have taken place over time in the form of
waves, which have given new impulse to the study of RTT and have enhanced knowledge.
The triangulation of narrative, survey results (and analysis of their correspondence,
described previously) as well as the average IF per year allows us to claim that there are
different generations of creativity within the evolutionary path of RTT knowledge, in
which there is one most creative author in each phase, a person who is linked to the
introduction of a new concept or a new combination of concepts. If we trace the temporal
evolution of the network, we note that, by introducing new (combinations of) concepts,
such authors become the most prominent authors of their cohort.
One last consideration must be added with regard to the results of the questionnaires.
We noted that the answers to the four simple questions are affected by what could be called
a ‘‘recency effect’’ with reference to the behavioral literature. In 90% of cases, the subjects
cited scientists, publications and research topics which have appeared in the field in the last
decade, whereas the creative contribution, for example, of the scholar who identified RTT
as a rare disease is mentioned only once.9 This supports the hypothesis that there is a
thematic and temporal range which scientists implicitly consider to be relevant, which
makes them discount creative or influential but ‘‘old’’ contributions, although they were
central in the field taken as a whole (Borner et al. 2004). Old contributions and contributors
are present in cumulative networks built on data drawn from publication datasets. The
understanding of time windows is very important from a methodological point of view, for
calibrating the representation of such networks in a dynamic way, so that what is forgotten
or remains in the background can be deleted from the picture.
Who are the most creative scientists?
We distinguish two types of creativity: generative and combinatorial. Generative creativity
is defined as the introduction of new concepts. Combinatorial creativity is the creation of
new relationships among concepts. To measure creativity, we use a paper as the basic unit
of analysis. A paper may be seen as a set of authors (a) and concepts (c):
p c1; . . .; ci; . . .; cnja1; . . .; aj; . . .; am
� �
The collection of papers about RTT defines a socio-semantic or epistemic network. A
paper is a hyperlink in the co-authorship network and, at the same time, a hyperlink in the
semantic network of concept co-occurrences (Taramasco et al. 2010). More in general, it
defines a set of relationships in the socio-semantic network of concepts and authors. This
approach may be generalized to the case in which more than two categories are considered
(such as citations and research methods). To be published, a paper must contain some
Footnote 8 continuedConversely, scientists Wade and Bienvenu have a significant position in the community, as reflected bybibliometric and network indicators, but this role is not elicited by the community when directly asked.9 The most cited paper of Adrian Rett on MeCP2 is never mentioned among the top readings in the RTTfield.
Scientific creativity and network dynamics in the field of rare diseases 409
123

degree of novelty (generative, combinatorial, or both). By analogy, we can identify two
changes in the network of co-authorships:
1. A paper contains a new author: a new node is added to the co-authorship network;
2. A paper contains a new combination of authors: a new link is added to the co-
authorship network.
In the evolution of the socio-semantic network, new nodes (authors/concepts) enter and
new links are formed. New authors can either be already active scientists entering a given
specialty from other scientific communities, or new researchers. Thus, we must further
distinguish new nodes in the scientific community from new nodes in the specialty. Let us
identify new actors in a given specialty s by ns(a), of which n(a) have never published
before, and new scientific collaborations (co-authorships) by n(a2). Similarly, generative
creativity is the entry of new concepts n(c), whereas combinatorial creativity has to do with
the creation of new links among previously unrelated concepts, n(c2). As before, we can
distinguish locally new combinations ns(c) in a given specialty from globally new concepts
and concept associations in science. The degree of novelty of a paper may thus be mea-
sured as:
ns pð Þ ¼ t cð Þ; ts cð Þ; t c2� �jt að Þ; ts að Þ; t a2
� �� �
where t(c) is the number of previous occurrences of concept c in the literature (e.g.
PubMed); ts(c) the number of previous occurrences of concept c in a given specialty (e.g.
RTT); t(c2) the number of previous co-occurrences of two concepts; t(a) the number of
papers of author a; ts(a) is the number of papers of author a in a given specialty; and t(a2) is
the number of times two authors have worked together.
For instance, a hypothetical paper p with novelty ns(p) = {(9, 6), (7,2); 0|10, 20; 4} has
two concepts and two authors. The first concept has been used 9 times (6 in specialty s), the
second 7 times (of which 2 in specialty s), but this is the first time the two concepts are
used together. The authors have already published 10 and 20 papers respectively, of which
4 are co-authored. The creativity of a given author can now be measured by looking at the
ns(p) statistics of the papers he wrote.
In PubMed we found 1,653 papers on RTT, with about 4,500 authors and 2,300
concepts. On average, each paper has 4.73 authors and 12.23 concepts. The most central
specific concepts in the RTT network are RTT and MeCP2, discovered by Rett and Bird,
respectively. The first link between the two concepts was established by Zoghbi. Jaenisch
demonstrated the association between Rett and MeCP2 in a mouse model (first Rett-
Mice-MeCP2 combination). More recently, Bird has shown the reversibility of the
pathology in mice (first Rett-Therapy combination, albeit limited to transgenic mice).
The distributions of the share of new combinations of authors/concepts per paper
overlap almost perfectly (Fig. 1). This result indicates a positive relationship between the
openness of scientific teams to new collaborations and combinatorial creativity at the
community level.
The evolution of the RTT network tells us that the centrality of a scientist in a com-
munity is associated with the ability to introduce new useful concepts or concept associ-
ations. However, we find a negative relationship between seniority and the degree of
novelty of the scientific concepts in question (Fig. 2). Conversely, experience has no effect
on combinatorial creativity (novelty of concept combinations). Also, as Fig. 3 shows, a
positive relationship exists between the authors’ centrality and the number of publications
which used the new (associations of) concepts they introduced. First, to become central,
410 M. L. Frigotto, M. Riccaboni
123

researchers must introduce new (combinations of) concepts. Second, the centrality of
creative scientists in the co-authorship network is driven by the replication of concepts they
have brought to the field.
In the first stage of emergence of RTT as a specialty (problem identification), the rate of
entry of new authors, mainly from other areas of research, was high. The first phase was
completed with the introduction of new concepts (e.g., Rett and MeCP2), based on which
Fig. 1 The distribution of new combinations of concepts/authors in the scientific papers on Rett Syndrome(source PubMed, 2009)
Fig. 2 Average number of new concepts, n(c), and the logarithm of the number of new combinations ofconcepts n(c2) by authors’ scientific experience as measured by number of articles previously appearing inPubMed
Scientific creativity and network dynamics in the field of rare diseases 411
123
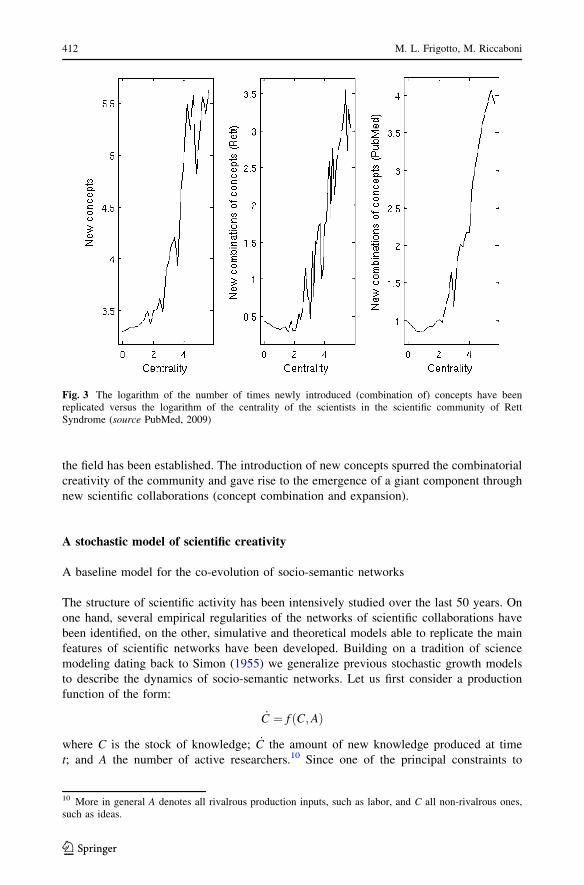
the field has been established. The introduction of new concepts spurred the combinatorial
creativity of the community and gave rise to the emergence of a giant component through
new scientific collaborations (concept combination and expansion).
A stochastic model of scientific creativity
A baseline model for the co-evolution of socio-semantic networks
The structure of scientific activity has been intensively studied over the last 50 years. On
one hand, several empirical regularities of the networks of scientific collaborations have
been identified, on the other, simulative and theoretical models able to replicate the main
features of scientific networks have been developed. Building on a tradition of science
modeling dating back to Simon (1955) we generalize previous stochastic growth models
to describe the dynamics of socio-semantic networks. Let us first consider a production
function of the form:
_C ¼ f C;Að Þ
where C is the stock of knowledge; _C the amount of new knowledge produced at time
t; and A the number of active researchers.10 Since one of the principal constraints to
Fig. 3 The logarithm of the number of times newly introduced (combination of) concepts have beenreplicated versus the logarithm of the centrality of the scientists in the scientific community of RettSyndrome (source PubMed, 2009)
10 More in general A denotes all rivalrous production inputs, such as labor, and C all non-rivalrous ones,such as ideas.
412 M. L. Frigotto, M. Riccaboni
123

publication in science is that no two papers which contain the same knowledge may be
published, new papers must contain new knowledge. Hence, science as an institution may
be described by the production of papers, each proposing a new ‘‘quantum of knowledge’’:
P _C� �¼ f P Cð Þ;Að Þ
where P(C) is the stock of all papers available and P( _C) are new papers produced at time
t. Gilbert (1997) shows that it is possible to generate many of the quantitative features of
the present structure of science by looking at scientific activity as a system in which
scientific papers generate further papers, with authors playing a necessary but incidental
role. Borner et al. (2004) also rely on an author-paper production function to explain the
evolution of scientific networks of co-authorship and citations. In our model, we build on
the growth process originally presented by Simon (1955) in the version modified by
Guimera et al. (2005) to explain team assembly in science. At any time step t, a new
paper, that is a combinatorial set of concepts and authors, is produced. We select authors
and concepts at random based on the following probabilistic rules. We start the simu-
lation with an endless pool of new authors and concepts. First m authors are selected.11
Some authors in the paper may be globally new in science or locally new for a given
specialty. A new author in a given field of research (topic) is called a novice. Novices
become experts after their first publication. Each member of the team has probability p1a
of being a novice (1 - p1a of being an expert). If an author is drawn from the experts’ pool and
there is already another expert in the team, with probability p2a, a new combination of experts
is established otherwise with probability 1 - p2a, the new author is randomly chosen among
the set of collaborators of a randomly selected team member.12 The probability of an expert
being selected is proportional to the number of papers that expert has written. The same
procedure is applied to the concept set. We select n concepts. A new concept is added
(generative creativity) with probability p1c whereas with probability 1 - p1
c a concept which
has been already used is selected. In the second case, with probability p2c, a new concept
association is formed (combinatorial creativity); otherwise an already existing combination
of concepts is replicated with probability 1 - p2c. As for authors, the likelihood of selecting an
existing concept is proportional to the number of times it has already been used. We apply the
same rules for all authors and concepts of a paper, and for all papers. As in the model of
Guimera et al. (2005) this generalized version replicates some of the main topological
properties of the co-authorship network: the presence of a giant component encompassing
about half the authors, a small-world structure, and a power law connectivity distribution with
an exponential cut-off (Lotka 1926; Girvan and Newman 2002; Newman 2004). In our
stochastic framework we can also test the relationship between the four main stochastic
parameters of the model: p1a, new authors; p2
a, new collaborations; p1c, generative creativity; p2
c,
combinatorial creativity.
11 The number of authors and concepts per paper are positive random numbers with mean m andn respectively.12 The probability is p1 = 1 - p and p2 = 1 - q in the model of Guimera et al. (2005). We have modifiedthat model to accommodate teams of different sizes. As in the original model, agents who remain inactivefor longer than T time steps are removed from the network. However, our results do not depend on thespecific value of T which is usually set to the maximum level, since we are analyzing new fields of researchin which the vast majority of authors are still active.
Scientific creativity and network dynamics in the field of rare diseases 413
123

Simulations and model validation
Based on our analysis of RTT, we expect that a relationship is in place between the
evolution of the network of scientific collaborations and creativity, as measured by con-
ceptual generation and combination. In particular, we state that, in a given community, new
collaborations and combinatorial creativity are positively related.
H1 p2a = p2
c. The probability of new co-authorships is the same as the probability of
combinatorial creativity. It should be noted that, unlike the case illustrated in Taramasco
et al. (2010), this relationship holds in probability for a set of related papers and not for a
single paper.
The second relationship is more complex. Figure 2 shows that new authors have a
higher probability of introducing new concepts. However, only a few of them will be
replicated by others, thus contributing to the solution of the problem and the centrality of
creative scientists (Fig. 3). Authors like Bird are recruited in the RTT specialty as the new
concept they introduce contributes to the RTT problem-solving activity. These events
occur rarely, but they are extremely important. Instead, most novices are recruited to help
experts to replicate their findings.
H2 In a scientific community p1a and p1
c are inversely related. The larger is the partici-
pation of novices in scientific production, the smaller is generative creativity. However, at
individual level, newcomers have a higher chance of working on new concepts and the-
ories. A high turnover of scientists prevents the emergence of the giant component of
experts (community closure) which is crucial for the generation of new concepts.
To test our predictions, we selected six rare disease specialties of different sizes and at
different stages of evolution, from problem identification to the development of an
effective treatment. The stage of development of a research field toward a cure can be
identified by looking at the number of active clinical trials and available treatments. Size
can be measured by looking at the prevalence rate (i.e., the total number of cases divided
by the number of individuals in the population). For all the rare diseases we considered,
except PNH, there is no effective treatment available. Horner and Noonan are in a stage of
early development (no active clinical trials). ADA and Rett are at an intermediate stage:
there is growing consensus about the causes of the pathology and potential intervention
strategies, but only a few trials are ongoing. The fields of Mesothelioma and PNH are more
mature (several trials are ongoing, and a new drug was launched in 2007 to treat PNH).
At each stage of evolution, we selected one relatively large specialty (Noonan, Rett,
Mesothelioma) and one small (Horner, ADA, PNH) (see Table 3).
The number of publications ranges from 827 (ADA) to 9,625 (Mesothelioma); the
average number of authors and concepts per paper is relatively stable—around 4 and 11
respectively. The topological properties of the co-authorship networks are widely diver-
sified: size in terms of number of papers, the fraction of authors with at least two publi-
cations (FR), repeated co-authorships (fR) and the share of authors in the giant component
of the network (S) range from 5.88 to 28.06 (FR), 1.36 to 14.07 (fR) and 2.23 to 59.58 (S),
respectively.
We simulated our model for each specialty by taking the average numbers of authors
and concepts as inputs (n and m) to generate several random networks for different values
of p1a, p2
a, p1c and p2
c, ranging from 0 to 1. For each of them, we fitted four statistics of the
simulated network to the same statistics for the real-world semantic and social networks:
414 M. L. Frigotto, M. Riccaboni
123

Tab
le3
Cre
ativ
ity
and
entr
yin
six
rare
dis
ease
sat
dif
fere
nt
stag
eso
fev
olu
tio
n(e
arly
:H
orn
eran
dN
oo
nan
;m
idd
le:
Ret
tan
dA
DA
;ad
van
ced
:P
NH
and
Mes
oth
elio
ma)
Rar
edis
ease
No.
of
pap
ers
Aver
age
num
ber
of
Siz
eF
Rf R
Sp
1p
1a–
p1c
p2
p2a–
p2c
1.
Horn
erN
o.
of
tria
lsA
:0
Pre
val
ence
B:
n.a
.
1,4
73
Auth
ors
2.8
5
real
3,8
60
5.8
81.3
62.2
3
sim
.3,8
72
7.7
71.1
41.2
2.8
50
Conce
pts
9.5
7
real
1,8
68
51.4
523.6
1100
sim
.1,8
41
56.3
622.9
872.0
0.0
7.7
80
–
2.
Noonan
No.
of
tria
lsA
:3(0
)P
reval
ence
B:
50/1
00.0
00
985
Auth
ors
4.7
0
real
3,4
66
14.0
87.6
332.6
0
sim
.3,4
55
20.4
95.5
822.3
1.7
50
Conce
pts
10.4
0
real
1,5
91
43.8
723.9
1100
sim
.1,5
66
45.5
821.9
5100
.15
.60
0–
3.
Mes
oth
elio
ma
No.
of
tria
lsA
:143(4
5)
Pre
val
ence
B:
2.7
/100.0
00
9,6
25
Auth
ors
4.0
4
real
23,7
48
22.2
118.5
431.5
4
sim
.23,7
56
27.2
119.2
129.8
1.6
2.0
5
Conce
pts
11 re
al4,6
77
60.4
531.6
5100
sim
.4,7
31
50.3
029.4
6100
.04
.57
.05
–
Scientific creativity and network dynamics in the field of rare diseases 415
123

Tab
le3
con
tin
ued
Rar
edis
ease
No.
of
pap
ers
Aver
age
num
ber
of
Siz
eF
Rf R
Sp
1p
1a–
p1c
p2
p2a–
p2c
4.
PN
HN
o.
of
tria
lsA
:25(9
)P
reval
ence
B:
.55/1
00.0
00
2,4
76
Auth
ors
3.7
8
real
5,8
49
19.9
411.7
429.7
1
sim
.5,8
33
29.0
011.7
331.0
0.7
2.0
2
Conce
pts
9.3
0
real
2,3
44
54.1
026.6
799.8
7
sim
.2,3
37
52.5
525.2
7100
.10
.53
.02
–
5.
Ret
tN
o.
of
tria
lsA
:13(4
)P
reval
ence
B:
4.1
5/1
0000
1,6
53
Auth
ors
4.7
3
real
4,4
98
24.0
012.1
549.1
3
sim
.4,4
96
29.8
112.4
072.0
6.5
7.0
7
Conce
pts
12.2
3
real
2,2
83
52.0
026.8
1100
sim
.2,2
74
48.2
524.1
9100
.11
.46
.07
–
6.
AD
AN
o.
of
tria
lsA
:8(3
)P
reval
ence
B:
.22/1
00.0
00
827
Auth
ors
3.7
9
real
1,6
18
28.0
614.0
759.5
8
sim
.1,6
20
32.5
314.1
777.2
1.5
2.1
5
MeS
Hte
rms
11.6
3
real
1,3
52
51.8
525.0
9100
sim
.1,3
50
47.9
323.5
4100
.14
.38
.15
–
Str
uct
ura
lin
dic
ators
(num
ber
of
nodes
:si
ze;
shar
eof
nodes
wit
hm
ore
than
one
link:
FR;
shar
eof
repea
ted
links:
f R;
shar
eof
nodes
inth
egia
nt
com
ponen
tof
the
net
work
:S);
max
imum
likel
ihood
esti
mat
esof
model
par
amet
ers
(p1a,
p1c,
p2a,
p2c)
bas
edon
sim
ula
tion
resu
lts
(sim
.,in
ital
ics)
ASourc
ew
ww
.cli
nic
altr
ials
.gov
(act
ive
tria
lsin
tobra
cket
s)B
Sourc
ew
ww
.orp
ha.
net
,re
port
seri
esno.
2,
Novem
ber
2009
416 M. L. Frigotto, M. Riccaboni
123

size, FR, fR, S. Lastly, we computed the maximum likelihood values of p1a, p2
a, p1c and p2
c.
Results are listed in Table 3.
First, the probability of new combinations of concepts and authors are the same across
all the specialties considered. Therefore, combinatorial creativity (i.e., new combinations
of concepts) and the openness of the team assembly mechanism to new partnerships among
incumbent scientists are closely and positively related.
Second, the lower the entry rate of new authors, the higher the entry rate of new
concepts. The generation of new concepts implies closure of the community, repeated
collaborations, and the emergence of a specialty (a giant component composed by an
‘‘invisible college’’ of authors focusing on a specific discipline).
Third, generative creativity is partially independent of combinatorial creativity. Our
preliminary results indicate that generative creativity precedes combinatorial creativity, but
more work is needed to better understand the dynamic interplay between the two forms of
creative enterprise.
All in all, combinatorial creativity in a specialty has some preconditions: (1) a domain
must be established around a set of new concepts (generative creativity); (2) a field of
research composed of a stable nucleus of scientists must emerge (specialty); (3) scientists
must be free to enter into new scientific collaborations to explore promising new concept
associations.
Concluding discussion
In this paper we aimed at establishing a dynamic relationship between scientific collab-
orations and creativity. Although we are aware that our results must be further corroborated
by testing the model in different disciplines and at different stages of scientific evolution,
we believe our findings have several implications.
First, we develop a methodology to identify and measure different kinds of scientific
creativity. Many earlier studies compare bibliometric results with the judgments of
scholars or experts on the quality of research. Most of them find a reasonable corre-
spondence, although a poor correlation was found between citation indicators and the
originality of research proposals in applied research (van den Beemt and van Raan 1995).
In our case study of the RTT community, we also find that traditional bibliometric and
network centrality indicators do not accurately measure creativity. Hence, we introduce
some new indicators, based on counting the new (association of) concepts a scholar
contributes to a given domain of study, which match the result of our expert survey on
creativity better. More work is needed in this direction to control for the recency effect and
to investigate the relationship between generative and combinatorial creativity in scientific
careers, teams and communities.
Second, we develop a stochastic model of network evolution. It replicates most of the
topological properties of socio-semantic networks, including the rate of generative and
combinatorial creativity. In addition, our null-model can be used to measure the expected
level of creativity across domains. Unbiased statistical tests to compare the creative per-
formances of teams of scientists in different research areas can be developed.
Third, independently of the peculiarities of each domain, we find that new collabora-
tions among experienced scientists enhance combinatorial creativity. On the positive side,
there are several reasons why the increase of spontaneous scientific collaborations must be
related to combinatorial creativity rather than to generative creativity. On the negative side,
as stated in the initial quotation of Poincare, most efforts to build scientific networks
Scientific creativity and network dynamics in the field of rare diseases 417
123

through centralized public incentive schemes are doomed to failure. The two combinatorial
processes of team self-assembly and creative discovery are closely interwoven. Owen-
Smith et al. (2002) show that in the United States biomedical innovation system the
combination of new concepts is favored by blurring boundaries between basic and goal-
oriented research, disciplines and institutions, whereas European research institutes are
more frequently organized hierarchically by scientific field. In this paper, we further
corroborate their findings by showing that combinatorial creativity is related to the open
re-combination of scientific teams. Local closure of a community in space, time and by
specialty, and the mobility and collaborations of scientists across disciplines and intuitional
boundaries are two sides of the same coin (Cowan and Jonard 2003; David 2003).
Fourth, generative creativity is linked to the emergence of a scientific community (a
stable giant component of repeated ties in the co-authorship network). Our analysis of
rare diseases reveals that the community closure around a set of relatively stable and
shared concepts is a fundamental prerequisite for creativity. Too high a rate of scientific
turnover prevents identification of important new problems and concepts (Bruckner et al.
1996).
Further research is needed to better understand the dynamic relationship between
generative and combinatorial creativity in the evolution of science. Some of the newly
generated (combinations of) concepts are selected by scientists and replicated. The cen-
trality of a scientist in a given field is driven by the replication and validation of the new
associations of concepts that he contributed to build in that knowledge domain. In this
respect, our study is complementary to that of Bettencourt et al. (2008) regarding the
spread of scientific ideas. It would probably be useful to extend our framework to analyze
replication dynamics in citation networks and also to examine whether scientists in dif-
ferent disciplines and institutional settings differ in terms of strategies for successful
problem-solving: some will leverage social connections to be creative as a consequence of
their ability to collaborate and recruit talented scholars, whereas others may focus on
combinatorial creativity and collaborate with colleagues to validate and replicate their
findings. This relates to the broader problem of distinguishing homophily from contagious
diffusion in networks. Lastly, we hope that our work may contribute toward sustaining
creative problem-solving in rare diseases.
Acknowledgments The authors wish to thank Rita Bernardelli (ProRett Foundation) and Lucia Monaco(Telethon Foundation) for their support in organizing the Rett survey and field study. We also thank BernardMunos, Enrico Zaninotto, two anonymous referees, participants at the Sunbelt XXX meeting in Riva delGarda and the ROCK group at the University of Trento for helpful comments.
Appendix: Questions put to scholars on Rett Syndrome
1. Please write the names of the five most influential scientists (except your own) on Rett
Syndrome, in order of the importance of their scientific contributions;
2. Please write the names of the five most creative scientists (except your own) on Rett
Syndrome;
3. Please rank the five most important scientific publications (except yours) on Rett
Syndrome (any citation style, but include at least: first author, year, title, journal/book
editor);
4. Please list at least five key concepts which define the most important topics of research
on Rett Syndrome.
418 M. L. Frigotto, M. Riccaboni
123

References
Amabile, T. M. (1983). The social psychology of creativity. Berlin: Springer.Barabasi, A. (2005). Network theory. The emergence of the creative enterprise. Science, 308, 639–641.Bettencourt, L., Cintron-Arias, A., Kaiser, D. I., & Castillo-Chavez, C. (2006). The power of a good idea:
Quantitative modeling of the spread of ideas from epidemiological models. Physica A, 364, 513–536.Bettencourt, L. M. A., Kaiser, D. I., Kaur, J., Castillo-Chavez, C., & Wojick, D. E. (2008). Population
modeling of the emergence and development of scientific fields. Scientometrics, 75(3), 495–518.Borner, K., Maru, J. T., & Goldstone, R. L. (2004). The simultaneous evolution of author and paper
networks. The Proceedings of the National Academy of Sciences of the United States of America, 101,5266–5273.
Brass, D. J. (1995). Creativity: It’s all in your social network. In C. M. Ford & D. A. Gioia (Eds.), Creativeaction in organizations (pp. 94–99). Thousand Oaks, CA: Sage.
Bruckner, E., Ebeling, W., Jimenez Motano, M. A., & Scharnhorst, A. (1996). Nonlinear stochastic effectsof substitution: An evolutionary approach. Journal of Evolutionary Economics, 6, 1–30.
Burt, R. S. (2004). Structural holes and good ideas. American Journal of Sociology, 110, 349–399.Cattani, G., & Ferriani, S. (2008). A core/periphery perspective on individual creative performance: Social
networks and cinematic achievements in the Hollywood film industry. Organization Science, 19(6),824–844.
Chen, C., Chen, Y., Horowitz, M., Hou, H., Liu, Z., & Pellegrino, D. (2009). Towards an explanatory andcomputational theory of scientific discovery. Journal of Informetrics, 3(3), 191–209.
Cowan, R., & Jonard, N. (2003). On the workings of scientific communities. In A. Geuna, A. J. Salter, &W. E. Steinmueller (Eds.), Science and innovation: Rethinking the rationales for funding and gov-ernance (pp. 309–333). Cheltenham: Edward Elgar.
Csikszentmihalyi, M. (1990). The domain of creativity. In M. A. Runco & R. S. Albert (Eds.), Theories ofcreativity (pp. 190–212). Newbury Park, CA: Sage.
David, P. (2003). Cooperation, creativity and closure in scientific research networks: Modeling the dynamicsof epistemic communities. In J.-P. Touffut (Ed.), Institutions, innovation and growth: Selected eco-nomic papers (pp. 170–206). Cheltenham: Edward Elgar.
Denzin, N. K., & Lincoln, Y. S. (1994). Handbook of qualitative research. Thousand Oaks, CA: Sage.Fleming, L., Mingo, S., & Chen, D. (2007). Collaborative brokerage, generative creativity and creative
success. Administrative Science Quarterly, 52, 443–475.Fleming, L., & Waguespack, D. M. (2007). Brokerage, boundary spanning, and leadership in open inno-
vation communities. Organization Science, 18(2), 165–180.Fontana, W. (2001). Novelty in evolution. Bioevolutionary concepts for NASA, BEACON.Gilbert, N. (1997). A simulation of the structure of academic science. Sociological Research Online, 2(2).
Accessed May 31, 2011, from www.socresonline.org.uk/2/2/3.html.Girvan, M., & Newman, M. E. J. (2002). Community structure in social and biological networks. The
Proceedings of the National Academy of Sciences of the United States of America, 99, 7821–7826.Goffman, W. (1966). Mathematical approach to the spread of scientific ideas. Nature, 212, 449–452.Goffman, W., & Harmon, G. (1971). Mathematical approach to the prediction of scientific discovery.
Nature, 229, 103–104.Gould, R. (1991). Multiple networks and mobilization in the Paris commune, 1871. American Sociological
Review, 56, 193–201.Guimera, R., Uzzi, B., Spiro, J., & Amaral, L. A. N. (2005). Team assembly mechanisms determine
collaboration structure and team performance. Science, 308(29), 697–702.Guy, J., Gan, J., Selfridge, J., Cobb, S., & Bird, A. (2007). Reversal of neurological defects in a mouse
model of Rett Syndrome. Science, 315, 1143–1147.Hargadon, A., & Sutton, R. I. (1997). Technology brokering in a product development firm. Administrative
Science Quarterly, 42, 716–749.Hennessey, B. A., & Amabile, T. M. (2010). Creativity. Annual Review of Psychology, 61, 569–598.Jones, B. F. (2008). The burden of knowledge and the ‘death of the Renaissance man’: Is innovation getting
harder? Review of Economic Studies, 76(1), 283–317.Kuhn, T. S. (1962). The structure of scientific revolutions. Chicago: Chicago University Press.Kurzberg, T. R., & Amabile, T. M. (2000). From Guilford to creative synergy: Opening the black box of
team-level creativity. Creativity Research Journal, 13, 285–294.Lambiotte, R., & Panzarasa, P. (2009). Communities, knowledge creation and information diffusion.
Journal of Informetrics, 3, 180–190.Lane, D., Malerba, F., Maxfield, R., & Orsenigo, L. (1996). Choice and action. Journal of Evolutionary
Economics, 6(1), 43–76.
Scientific creativity and network dynamics in the field of rare diseases 419
123

Larkin, J., McDermott, J., Simon, D. P., & Simon, H. A. (1980). Expert and novice performance in solvingphysics problems. Science, 208 (4450), 1335.
Latour, B., & Woolgar, S. (1979). Laboratory life: The social construction of scientific facts. ThousandOaks: Sage.
Laumann, E. O., Marsden, P. V., & Prensky, D. (1983). The boundary specification problem in networkanalysis. In R. S. Burt & M. J. Minor (Eds.), Applied Network Analysis: A Methodological In-troduction (pp. 18–34). Beverly Hills, CA: Sage.
Lotka, A. (1926). The frequency distribution of scientific productivity. Journal of the Washington Academyof Sciences, 16, 317–323.
March, J. G. (2007). The study of organizations and organizing since 1945. Organization Studies, 28, 9–19.Merton, R. K. (1973). The sociology of science. Chicago, IL: University of Chicago Press.Newell, A., Shaw, J. C., & Simon, H. A. (1959). The process of creative thinking. Santa Monica, CA: The
RAND Corporation.Newman, M. E. J. (2001). The structure of scientific collaboration networks. The Proceedings of the
National Academy of Sciences of the United States of America, 98, 404–409.Newman, M. E. J. (2004). Coauthorship networks and patterns of scientific collaboration. Proceedings of the
National Academy of Sciences, 101(1), 5200–5205.Orsenigo, L., Pammolli, F., & Riccaboni, M. (2001). Technological change and network dynamics: Lessons
from the pharmaceutical industry. Research Policy, 30, 485–508.Owen-Smith, J., Riccaboni, M., Pammolli, F., & Powell, W. W. (2002). A comparison of US and European
relations in the life sciences. Management Science, 48(1), 24–43.Padgett, J. F., & Powell, W. W. (2011). The emergence of organizations and markets. Princeton, NJ:
Princeton University Press (forthcoming).Perry-Smith, J. E., & Shalley, C. E. (2003). The social side of creativity: A static and dynamic social
network perspective. Academy of Management Review, 28(1), 89–106.Poincare, H. (1921). The foundations of science. New York: The Science Press.Powell, W. W., Koput, K. W., & Smith-Doerr, L. (1996). Interorganizational collaboration and the locus of
innovation: Networks of learning in biotechnology. Administrative Science Quarterly, 41(1), 116–145.Rinia, E. J., van Leeuwen, Th. N., van Vuren, H. G., & van Raan, A. F. J. (1998). Comparative analysis of a
set of bibliometric indicators and central peer review criteria. Research Policy, 27, 95–107.Roth, C., & Cointet, J.-P. (2010). Social and semantic coevolution in knowledge networks. Social Networks,
32, 16–29.Schumpeter, J. A. (1934). The theory of economic development. London: Oxford University Press.Shalley, C. E., & Perry-Smith, J. E. (2008). The emergence of team creative cognition: The role of diverse
outside ties, sociocognitive network centrality, and team evolution. Strategic Entrepreneurship Jour-nal, 2, 23–41.
Simon, H. A. (1955). On a class of skew distribution functions. Biometrika, 42(3–4), 425–440.Simon, H. A. (1962). The architecture of complexity. Proceedings of the American Philosophical Society,
106(6), 467–482.Simonton, D. K. (1988). Scientific genius: A psychology of science. Cambridge: Cambridge University
Press.Simonton, D. K. (2000). Creativity: Cognitive, personal, developmental, and social aspects. American
Psychologist, 55(1), 151–158.Taramasco, C., Cointet, J.-P., & Roth, C. (2010). Academic team formation as evolving hypergraphs.
Scientometrics, 85(3), 721–740.Uzzi, B., & Spiro, J. (2005). Collaboration and creativity: The small world problem. American Journal of
Sociology, 111, 447–504.Valente, T. W. (1995). Network models of the diffusion of innovation. Cresskill, NJ: Hampton Press.van den Beemt, F. C. H. D., & van Raan, A. F. J. (1995). Evaluating research proposals. Nature, 375, 272.Watts, D. J. (2002). A simple model of global cascades on random networks. Proceedings of the National
Academy of Sciences of the United States of America, 99, 5766–5771.Weitzman, M. L. (1998). Recombinant growth. Quarterly Journal of Economics, 113(2), 331–360.White, H. C. (1993). Careers and creativity: Social forces in the arts. Boulder, CO: Westview Press.White, H. D., Lin, X., Buzydlowski, J. W., & Chen, C. (2004). User-controlled mapping of significant
literatures. Proceedings of the National Academy of Sciences of the United States of America, 101,5297–5302.
Wuchty, S., Jones, B. F., & Uzzi, B. (2007). The increasing dominance of teams in production of knowl-edge. Science, 316, 1036–1039.
Yin, R. (1994). Case study research: Design and methods. Thousand Oaks, CA: Sage.
420 M. L. Frigotto, M. Riccaboni
123

Mixed-indicators model for identifying emergingresearch areas
Hanning Guo • Scott Weingart • Katy Borner
Received: 2 June 2011 / Published online: 21 June 2011� Akademiai Kiado, Budapest, Hungary 2011
Abstract This study presents a mixed model that combines different indicators to
describe and predict key structural and dynamic features of emerging research areas. Three
indicators are combined: sudden increases in the frequency of specific words; the number
and speed by which new authors are attracted to an emerging research area, and changes in
the interdisciplinarity of cited references. The mixed model is applied to four emerging
research areas: RNAi, Nano, h-Index, and Impact Factor research using papers published in
the Proceedings of the National Academy of Sciences of the United States of America(1982–2009) and in Scientometrics (1978–2009). Results are compared in terms of
strengths and temporal dynamics. Results show that the indicators are indicative of
emerging areas and they exhibit interesting temporal correlations: new authors enter the
area first, then the interdisciplinarity of paper references increases, then word bursts occur.
All workflows are reported in a manner that supports replication and extension by others.
Keywords Burst detection � Prediction � Emerging trend � Temporal dynamics � Science
of science (Sci2) tool
Introduction and related work
The identification of emerging research trends is of key interest to diverse stakeholders.
Researchers are attracted to promising new topics. Funding agencies aim to identify
H. Guo (&)WISE Lab, Dalian University of Technology, Dalian, Chinae-mail: [email protected]
H. Guo � S. Weingart � K. BornerCyberinfrastructure for Network Science Center, School of Library and Information Science, IndianaUniversity, Bloomington, IN, USA
S. Weingarte-mail: [email protected]
K. Bornere-mail: [email protected]
123
Scientometrics (2011) 89:421–435DOI 10.1007/s11192-011-0433-7

emerging areas early to encourage their growth via interdisciplinary workshops, solicita-
tions, and funding awards. Industry monitors and exploits promising research to gain a
competitive advantage. Librarians need to create new categories and special collections to
capture emerging areas. The public at large has a general interest in understanding cutting-
edge science and its impact on daily life. While it is not recommendable to ‘‘oversell’’ or
‘‘over promise’’ new research, it is desirable to catch the attention of the media, graduate
students, and funding agencies.
Different approaches have been proposed to identify emerging research areas (Lee
2008; Takeda and Kajikawa 2009), their level of maturity (Serenko et al. 2010; Watts and
Porter 2003), and their speed of development (Van Raan 2000; Braun et al. 1997). The first
and perhaps most difficult task is the delineation of all research areas. Zitt and Basse-
coulard (2008) and Lewison (1991) studied how to define research areas. There are various
ways to define research areas such as grouping specialist journals, collecting a list of
authors, running topical queries according to the field terminology, etc. Hence, much work
on emerging areas of research has been done in hindsight—using a set of by then estab-
lished keywords, e.g., nano, neuro, or highly cited ‘‘pioneering’’ papers to run term based
or cited reference searches. Sometimes, all papers published in one or several journals are
analyzed. None of these approaches catch all work published on a topic, however, their
results can be a reasonable proxy for analysis. The method of using established words to
refine an emerging research area is taken in this study.
Science indicators have been deployed to examine the emergence or growth of scientific
fields, such as Price’s index (Price 1970), immediacy index (Garfield and Small 1989) and
currency index (Small 2006). Lucio-Arias and Leydesdorff (2007) explore the emergence of
knowledge from scientific discoveries and its disrupting effects in the structure of scientific
communication. They apply network analysis to illustrate this emergence in terms of journals,
words and citations. Work by Leydesdorff and Schank (2008) examines changes in journal
citation patterns during the emergence of a new area. Kajikawa et al. (2008) detects emerging
technologies by using citation network analysis, finding that fuel and solar cell research are
rapidly growing domains. Scharnhorst and Garfield (2010) proposed author- and text-based
approaches of historiography and field mobility to trace the influence of a specific paper of
Robert K. Merton (1968). The historiograph of the citation flows around Merton’s paper of 1968
reveals the emergence of the new field of Science and Technology Studies in the 1970s. They
show that studying a research area’s origin papers or following a scholar’s academic trajectory
are pragmatic ways to trace the spread of knowledge.
Many researchers use quantitative models to study how ideas spread within scientific
communities and how scientific fields develop over time. Goffman conducted several
studies (1966, 1971; Goffman and Harmon 1971; Goffman and Newill 1964) to mathe-
matically model the temporal development of scientific fields. He maintains that an epi-
demic model can predict the rise and fall of a particular research area. Luıs M.
A. Bettencourt et al. (2008) analyze the temporal evolution of emerging areas within
several scientific disciplines according to numbers of authors and publications using
contagion models developed in epidemiology.
Several studies identify emerging topic trends using Kleinberg’s (2003) burst detection
algorithm. This algorithm employs a probabilistic automaton whose states correspond to
the frequencies of individual words and state transitions correspond to points in time
around which the frequency of the word changes significantly. Given a set of time stamped
text, e.g., abstracts and publication years of papers, the algorithm identifies those abstract
words that experience a sudden increase in usage frequency and outputs a list of these
words together with the begin and end of the burst and the burst strength that indicates the
422 H. Guo et al.
123

change in usage frequency. Mane and Borner (2004) applied the burst algorithm to identify
highly bursting words as indicators of future trends in a Proceedings of the NationalAcademy of Sciences (PNAS) dataset covering biomedical and other research in
1982–2001. Chen (2006) applied the same algorithm to identify emergent research-front
concepts in datasets retrieved via term search. Later work by Chen et al. (2009) combines
burst detection as a temporal property with betweenness centrality as a structural property
to evaluate the impact of transformative science and knowledge diffusion.
‘‘Mixed indicators model’’ section of this paper introduces a mixed model approach to
the identification of emerging research areas. ‘‘Data acquisition and preparation’’ section
introduces two datasets used to exemplify and validate the model. ‘‘Model application to
h-Index, impact factor for Scientometrics and RNAi, Nano* for PNAS’’ section applies the
mixed model approach to four research areas and the interdisciplinarity indicator to the two
datasets from section ‘‘Data acquisition and preparation’’ and discusses the results. ‘‘Model
validation’’ section compares and validates the different indicators. ‘‘Discussion and out-
look’’ section concludes this paper with a general discussion and an outlook to future work.
Mixed indicators model
This paper introduces, applies, and validates a combination of partial indicators to identify
emerging research areas. Specifically, the following three hypotheses are examined as indicators:
1. Word bursts precede the widespread usage of words and indicate new research trends,
2. Emerging areas quickly attract new authors, and
3. Emerging areas cite interdisciplinary references.
The first indicator utilizes prior research by Mane, Borner, and Chen (see ‘‘Introduction
and related work’’ section). The second indicator was inspired by the work of Kuhn (1970)
and Menard (1971). Kuhn argued that scientific revolutions are begun and adopted by new
scientists in the field. Menard’s work on the growth of scientific areas showed that an area
does not grow by ‘‘old scientists’’ accepting and working on new ideas but by attracting
new, typically young scientists. The third indicator was inspired by the fact that emerging
research areas grow out of existing research, i.e., expertise taught in school and practice,
and it cites existing relevant work from diverse lines of research. Intra-area citation is not
possible as no research yet exists on the new topic. The two following datasets will be used
to introduce, exemplify, and validate the proposed set of indicators.
Data acquisition and preparation
The study uses two datasets: all 75,389 papers published in the Proceedings of the NationalAcademy of Sciences in 1982–2009 and all 2,653 papers published in Scientometrics from
its creation in 1978 to 2009. PNAS is highly interdisciplinary and unlikely to capture the
entire work of any single author. Scientometrics is domain specific, might capture main
works of single authors, and is much smaller in size.
PNAS data and statistics
PNAS data was downloaded from Thomson Reuters’s Web of Science (WoS) (Thomson
Reuters 2010) on 2/18/2010 with the publication name query Proceedings of the National
Mixed-indicators model 423
123

Academy of Sciences of the United States of America or Proceedings of the NationalAcademy of Sciences of the United States of America Physical Science or Proceedings ofthe National Academy of Sciences of the United States of America Biological Science.
The retrieval resulted in 95,715 records. Using WoS’s ‘‘Refine Results’’ function, the
dataset was restricted to those 75,389 records published in 1982–2009. It comprises 69,939
articles, 1,892 editorial materials, 1,112 proceedings papers, 1,060 corrections, 770 cor-
rection additions, 206 reviews, 181 letters, 157 biographical items, 60 notes, 2 reprints, and
1 tribute to Roger Revelle’s contribution to carbon dioxide and climate change studies.
Employing the Science of Science (Sci2) Tool (Sci2 Team 2009a), the number of new
unique authors per year, unique references (CR), unique ISI keywords, and unique author
keywords were calculated (see Fig. 1). As no author or ISI keywords existed before 1991,
184,246 MeSH terms were added using the procedure introduced by Boyack (2004). All
terms from the paper titles, author keywords, ISI keywords, and MeSH terms were merged
into one ‘‘ID’’ field. The ‘‘ID’’ field was further processed by
• Removing a common set of stop words using the Sci2 Tool stop word list (Sci2 Team
2009b), and all individual letters and numbers.
• Removing all punctuations except ‘‘-’’ or ‘‘/.’’
Fig. 1 Number of unique PNAS papers, authors, ISI keywords, author keywords, MeSH terms, references/10 and new authors from 1982 to 2009
424 H. Guo et al.
123
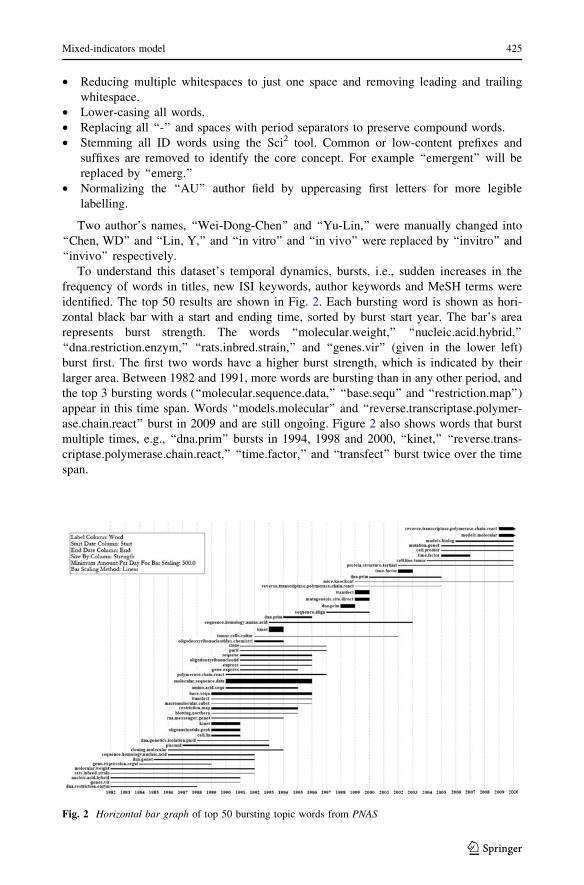
• Reducing multiple whitespaces to just one space and removing leading and trailing
whitespace.
• Lower-casing all words.
• Replacing all ‘‘-’’ and spaces with period separators to preserve compound words.
• Stemming all ID words using the Sci2 tool. Common or low-content prefixes and
suffixes are removed to identify the core concept. For example ‘‘emergent’’ will be
replaced by ‘‘emerg.’’
• Normalizing the ‘‘AU’’ author field by uppercasing first letters for more legible
labelling.
Two author’s names, ‘‘Wei-Dong-Chen’’ and ‘‘Yu-Lin,’’ were manually changed into
‘‘Chen, WD’’ and ‘‘Lin, Y,’’ and ‘‘in vitro’’ and ‘‘in vivo’’ were replaced by ‘‘invitro’’ and
‘‘invivo’’ respectively.
To understand this dataset’s temporal dynamics, bursts, i.e., sudden increases in the
frequency of words in titles, new ISI keywords, author keywords and MeSH terms were
identified. The top 50 results are shown in Fig. 2. Each bursting word is shown as hori-
zontal black bar with a start and ending time, sorted by burst start year. The bar’s area
represents burst strength. The words ‘‘molecular.weight,’’ ‘‘nucleic.acid.hybrid,’’
‘‘dna.restriction.enzym,’’ ‘‘rats.inbred.strain,’’ and ‘‘genes.vir’’ (given in the lower left)
burst first. The first two words have a higher burst strength, which is indicated by their
larger area. Between 1982 and 1991, more words are bursting than in any other period, and
the top 3 bursting words (‘‘molecular.sequence.data,’’ ‘‘base.sequ’’ and ‘‘restriction.map’’)
appear in this time span. Words ‘‘models.molecular’’ and ‘‘reverse.transcriptase.polymer-
ase.chain.react’’ burst in 2009 and are still ongoing. Figure 2 also shows words that burst
multiple times, e.g., ‘‘dna.prim’’ bursts in 1994, 1998 and 2000, ‘‘kinet,’’ ‘‘reverse.trans-
criptase.polymerase.chain.react,’’ ‘‘time.factor,’’ and ‘‘transfect’’ burst twice over the time
span.
Fig. 2 Horizontal bar graph of top 50 bursting topic words from PNAS
Mixed-indicators model 425
123

Scientometrics data and statistics
All papers published in the journal Scientometrics from 1978 to 2009 were downloaded
from WoS (Thomson Reuters 2010) on 3/15/2010. The dataset includes 2,653 records:
1,894 articles, 387 proceedings papers, 93 book reviews, 74 notes, 73 editorial materials,
34 reviews, 27 letters, 22 biographical-items, 17 bibliographies, 11 meeting abstracts, 8
items about an individual, 7 corrections/additions, 4 corrections, 1 discussion, and 1 news
item.
The number of unique papers per year, authors, references, ISI keywords and new
authors were identified, and unique ISI keywords were further processed as those in ‘‘PNASdata and statistics’’ section. Author names ‘‘VANRAAN, AFJ,’’ ‘‘vanRaan, AFJ,’’ ‘‘Van-
Raan, AFJ,’’ ‘‘Van Raan, AFJ,’’ and ‘‘van Raan, AFJ’’ were manually replaced by
‘‘Vanraan, AFJ’’ and the ISI keyword ‘‘Hirsch-index’’ was replaced by ‘‘h-index.’’ Counts
per year for all six variables are plotted in Fig. 3.
The same temporal analysis workflows as ‘‘PNAS data and statistics’’ section were then
run to identify bursts in ISI keywords and results are shown in Fig. 4 (see ‘‘PNAS data and
statistics’’ section for how to read horizontal bar graphs). In the early 1990s, studies in
Scientometrics mainly focused on Scientometrics indicators, especially of relative citation
impact. These studies originated from Braun et al. (1987, 1989a, b) and were followed by
several publications with ‘‘facts and figures’’ in the titles. The amount of bursting words
per year suddenly increased after 2000. Only 10 bursting words appeared from 1991 to
1999, while 50 bursting words appeared in the following 10 years. Studies related to
‘‘scienc,’’ ‘‘impact’’ and ‘‘journal’’ are the top three bursting topics in the 2000s. Indicators
of scientometric methodologies bursted in this time period, as evidenced by the burstiness
of ‘‘impact factor,’’ ‘‘indic,’’ ‘‘index,’’ ‘‘h.index,’’ ‘‘cocit,’’ ‘‘citat’’ and ‘‘self.cit.’’ Figure 4
shows that ‘‘h.index’’ was the burstiest word related to indicators over the entire timespan
of the dataset. The h-index, proposed by Hirsch (2005), inspired discussions on its
Fig. 3 Number of unique papers published in Scientometrics, their authors, ISI keywords, references/10and new authors for the years 1978–2009
426 H. Guo et al.
123

strengths and limitations, as well as research on improved indicators. The word ‘‘countri’’
is the only word that burst twice, from 1991 to 1993 and from 1999 to 2001, indicating the
interest in country level, geospatially explicit studies such as Chu (1992), Adamson (1992),
Tsipouri (1991), Kim (2001), etc. The Triple Helix innovation model was another bursting
topic, as indicated by the burstiness of ‘‘triple.helix,’’ and it contributed to the burstiness of
‘‘univers’’ and ‘‘innov.’’
Model application to h-Index, impact factor for Scientometrics and RNAi,Nano* for PNAS
Construction of datasets
A single journal such as PNAS or Scientometrics records the (often parallel) emergence of
multiple areas of research over time. To understand the structure and temporal dynamics of
different indicators for concrete areas of research, publications for four emerging areas
Fig. 4 Horizontal bar graph of all bursting ISI keywords from Scientometrics
Mixed-indicators model 427
123
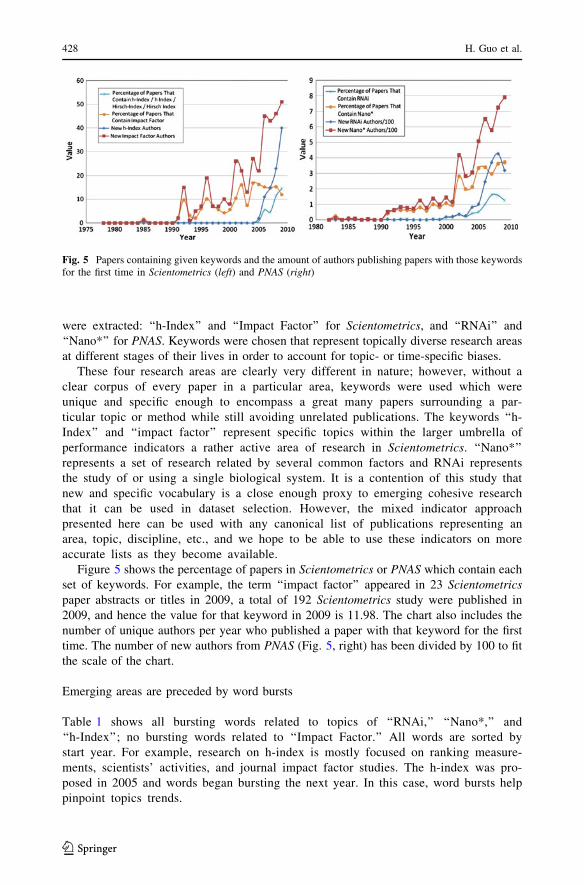
were extracted: ‘‘h-Index’’ and ‘‘Impact Factor’’ for Scientometrics, and ‘‘RNAi’’ and
‘‘Nano*’’ for PNAS. Keywords were chosen that represent topically diverse research areas
at different stages of their lives in order to account for topic- or time-specific biases.
These four research areas are clearly very different in nature; however, without a
clear corpus of every paper in a particular area, keywords were used which were
unique and specific enough to encompass a great many papers surrounding a par-
ticular topic or method while still avoiding unrelated publications. The keywords ‘‘h-
Index’’ and ‘‘impact factor’’ represent specific topics within the larger umbrella of
performance indicators a rather active area of research in Scientometrics. ‘‘Nano*’’
represents a set of research related by several common factors and RNAi represents
the study of or using a single biological system. It is a contention of this study that
new and specific vocabulary is a close enough proxy to emerging cohesive research
that it can be used in dataset selection. However, the mixed indicator approach
presented here can be used with any canonical list of publications representing an
area, topic, discipline, etc., and we hope to be able to use these indicators on more
accurate lists as they become available.
Figure 5 shows the percentage of papers in Scientometrics or PNAS which contain each
set of keywords. For example, the term ‘‘impact factor’’ appeared in 23 Scientometricspaper abstracts or titles in 2009, a total of 192 Scientometrics study were published in
2009, and hence the value for that keyword in 2009 is 11.98. The chart also includes the
number of unique authors per year who published a paper with that keyword for the first
time. The number of new authors from PNAS (Fig. 5, right) has been divided by 100 to fit
the scale of the chart.
Emerging areas are preceded by word bursts
Table 1 shows all bursting words related to topics of ‘‘RNAi,’’ ‘‘Nano*,’’ and
‘‘h-Index’’; no bursting words related to ‘‘Impact Factor.’’ All words are sorted by
start year. For example, research on h-index is mostly focused on ranking measure-
ments, scientists’ activities, and journal impact factor studies. The h-index was pro-
posed in 2005 and words began bursting the next year. In this case, word bursts help
pinpoint topics trends.
Fig. 5 Papers containing given keywords and the amount of authors publishing papers with those keywordsfor the first time in Scientometrics (left) and PNAS (right)
428 H. Guo et al.
123

Emerging areas quickly attract new authors
To understand the attraction of emerging research areas to authors, all unique authors and
the year of their first published paper in the dataset was found (see Fig. 6). Topics ‘‘RNAi’’
and ‘‘Nano*’’ experience a noticeable increase in the number of new authors. The number
of new authors in ‘‘Impact Factor’’ and ‘‘h-Index’’ also increase remarkably quickly. The
sudden increase of new authors to ‘‘h-Index’’ research after 2005 is attributable to the
influence of Hirsch’s paper published in 2005.
In future work we plan to analyze the origin of new authors (from what areas of science
are they coming?) and to study their key features such as career age.
Emerging areas cite highly interdisciplinary references
It is assumed that papers in a new research area cite papers from many areas of research, as
no papers yet exist in the nascent area. Thus, sudden increases in the diversity of cited
references might indicate an emerging research area. In order to test the interdisciplinarity
of the sets of papers containing ‘‘Nano*,’’ ‘‘RNAi,’’ ‘‘Impact Factor,’’ and ‘‘h-Index,’’ each
set was mapped to the UCSD Map of Science (Klavans and Boyack 2009). This map
clusters more than 16,000 journals into 554 disciplines and gives the similarity between
these disciplines. An interdisciplinarity score (see Eq. 1) per year was given to ‘‘Nano*,’’
Table 1 Bursting topic wordsfor ‘‘RNAi’’, ‘‘Nano*’’, and ‘‘h-Index’’
Word Strength Start End
RNAi
messenger.rna 6.36 1993 2002
antisense.rnai 3.11 1994 2002
caenorhabditis.elegan 3.87 2000 2006
functional.genomic.analysi 3.09 2001 2003
double.stranded.rna 5.16 2002 2003
gene 2.96 2003 2005
Nano*
express 6.73 1991 1999
bind 3.90 1991 2001
sequenc 3.77 1991 2003
rat.brain 4.83 1992 2001
gene 3.90 1992 1997
clone 3.48 1992 1999
site 3.18 1992 1996
inhibit 3.37 1993 2002
identif 3.48 1994 2000
design 4.01 2000 2003
microscopi 3.67 2005 2005
peptid 3.64 2006 2006
h-Index
rank 2.97 2006 2007
scientist 2.56 2006 2006
journal 2.43 2008
Mixed-indicators model 429
123
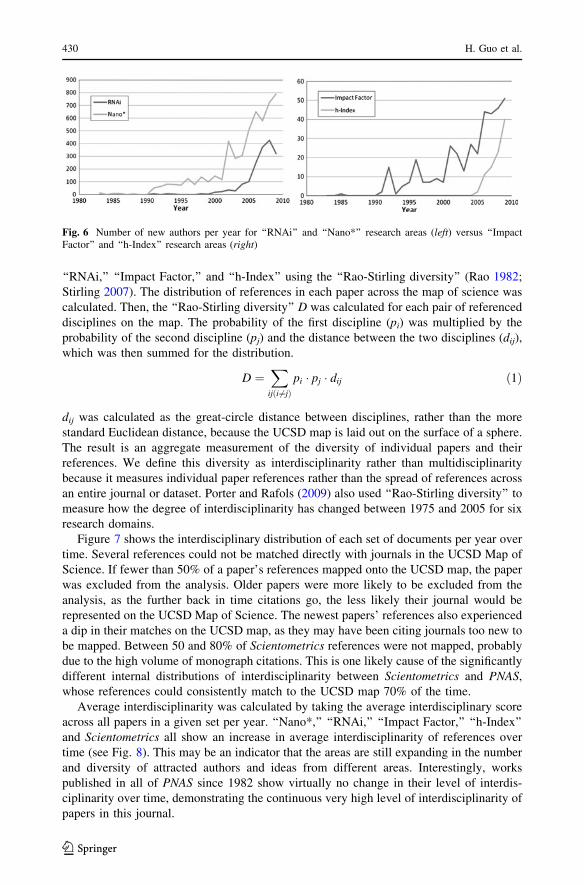
‘‘RNAi,’’ ‘‘Impact Factor,’’ and ‘‘h-Index’’ using the ‘‘Rao-Stirling diversity’’ (Rao 1982;
Stirling 2007). The distribution of references in each paper across the map of science was
calculated. Then, the ‘‘Rao-Stirling diversity’’ D was calculated for each pair of referenced
disciplines on the map. The probability of the first discipline (pi) was multiplied by the
probability of the second discipline (pj) and the distance between the two disciplines (dij),
which was then summed for the distribution.
D ¼X
ijði 6¼jÞpi � pj � dij ð1Þ
dij was calculated as the great-circle distance between disciplines, rather than the more
standard Euclidean distance, because the UCSD map is laid out on the surface of a sphere.
The result is an aggregate measurement of the diversity of individual papers and their
references. We define this diversity as interdisciplinarity rather than multidisciplinarity
because it measures individual paper references rather than the spread of references across
an entire journal or dataset. Porter and Rafols (2009) also used ‘‘Rao-Stirling diversity’’ to
measure how the degree of interdisciplinarity has changed between 1975 and 2005 for six
research domains.
Figure 7 shows the interdisciplinary distribution of each set of documents per year over
time. Several references could not be matched directly with journals in the UCSD Map of
Science. If fewer than 50% of a paper’s references mapped onto the UCSD map, the paper
was excluded from the analysis. Older papers were more likely to be excluded from the
analysis, as the further back in time citations go, the less likely their journal would be
represented on the UCSD Map of Science. The newest papers’ references also experienced
a dip in their matches on the UCSD map, as they may have been citing journals too new to
be mapped. Between 50 and 80% of Scientometrics references were not mapped, probably
due to the high volume of monograph citations. This is one likely cause of the significantly
different internal distributions of interdisciplinarity between Scientometrics and PNAS,
whose references could consistently match to the UCSD map 70% of the time.
Average interdisciplinarity was calculated by taking the average interdisciplinary score
across all papers in a given set per year. ‘‘Nano*,’’ ‘‘RNAi,’’ ‘‘Impact Factor,’’ ‘‘h-Index’’
and Scientometrics all show an increase in average interdisciplinarity of references over
time (see Fig. 8). This may be an indicator that the areas are still expanding in the number
and diversity of attracted authors and ideas from different areas. Interestingly, works
published in all of PNAS since 1982 show virtually no change in their level of interdis-
ciplinarity over time, demonstrating the continuous very high level of interdisciplinarity of
papers in this journal.
Fig. 6 Number of new authors per year for ‘‘RNAi’’ and ‘‘Nano*’’ research areas (left) versus ‘‘ImpactFactor’’ and ‘‘h-Index’’ research areas (right)
430 H. Guo et al.
123

Model validation
Comparison of indicators
The three different indicators provide different insights. The number and type of bursting
words is an indicator of the intensity and topical direction of change. The number of new
authors an area manages to attract reveals the brain drain from other research areas to itself.
The interdisciplinarity of paper references gives an indicator of the diversity and topical
origin of the base knowledge from which the new area draws.
Each of the four datasets do have a steady increase in the number of new authors and
interdisciplinarity scores which might be an indicator that all four of them are emerging
Fig. 7 Interdisciplinarity of references cited in ‘‘Nano*’’ (upper left), ‘‘RNAi’’ (middle left), ‘‘ImpactFactor’’ (upper right), ‘‘h-Index’’ (middle right), PNAS (bottom left) and Scientometrics (bottom right)datasets. Darker areas indicate earlier publications, the y axis indicates the number of papers with a certaininterdisciplinarity score, where x = 0 is the least interdisciplinarity possible
Mixed-indicators model 431
123
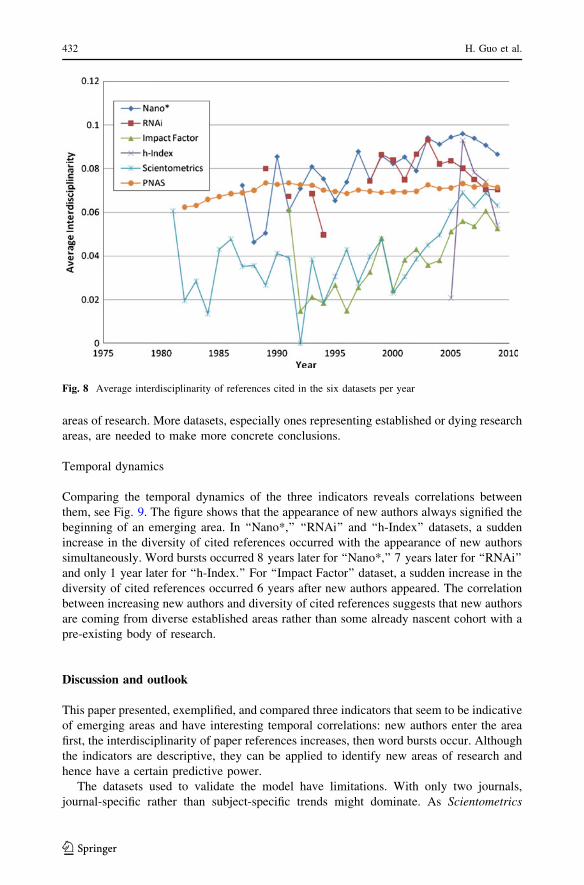
areas of research. More datasets, especially ones representing established or dying research
areas, are needed to make more concrete conclusions.
Temporal dynamics
Comparing the temporal dynamics of the three indicators reveals correlations between
them, see Fig. 9. The figure shows that the appearance of new authors always signified the
beginning of an emerging area. In ‘‘Nano*,’’ ‘‘RNAi’’ and ‘‘h-Index’’ datasets, a sudden
increase in the diversity of cited references occurred with the appearance of new authors
simultaneously. Word bursts occurred 8 years later for ‘‘Nano*,’’ 7 years later for ‘‘RNAi’’
and only 1 year later for ‘‘h-Index.’’ For ‘‘Impact Factor’’ dataset, a sudden increase in the
diversity of cited references occurred 6 years after new authors appeared. The correlation
between increasing new authors and diversity of cited references suggests that new authors
are coming from diverse established areas rather than some already nascent cohort with a
pre-existing body of research.
Discussion and outlook
This paper presented, exemplified, and compared three indicators that seem to be indicative
of emerging areas and have interesting temporal correlations: new authors enter the area
first, the interdisciplinarity of paper references increases, then word bursts occur. Although
the indicators are descriptive, they can be applied to identify new areas of research and
hence have a certain predictive power.
The datasets used to validate the model have limitations. With only two journals,
journal-specific rather than subject-specific trends might dominate. As Scientometrics
Fig. 8 Average interdisciplinarity of references cited in the six datasets per year
432 H. Guo et al.
123
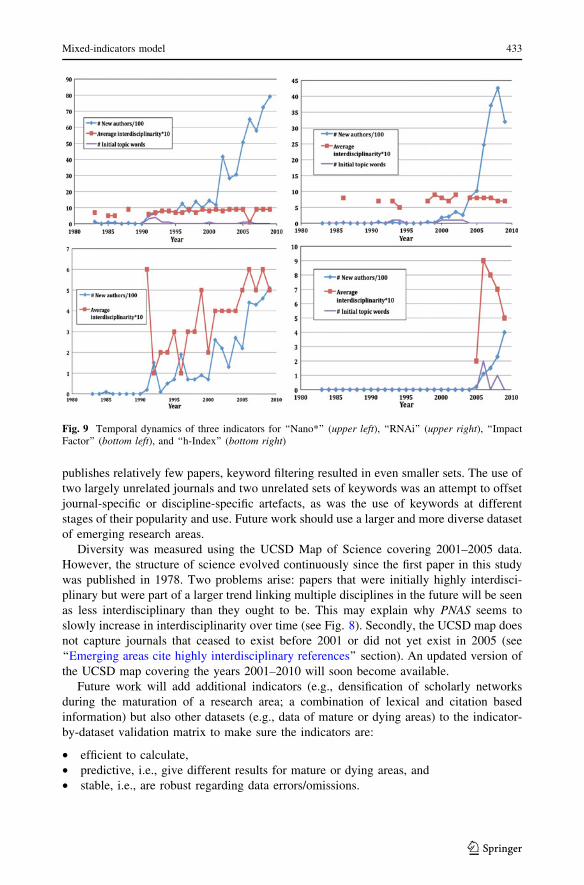
publishes relatively few papers, keyword filtering resulted in even smaller sets. The use of
two largely unrelated journals and two unrelated sets of keywords was an attempt to offset
journal-specific or discipline-specific artefacts, as was the use of keywords at different
stages of their popularity and use. Future work should use a larger and more diverse dataset
of emerging research areas.
Diversity was measured using the UCSD Map of Science covering 2001–2005 data.
However, the structure of science evolved continuously since the first paper in this study
was published in 1978. Two problems arise: papers that were initially highly interdisci-
plinary but were part of a larger trend linking multiple disciplines in the future will be seen
as less interdisciplinary than they ought to be. This may explain why PNAS seems to
slowly increase in interdisciplinarity over time (see Fig. 8). Secondly, the UCSD map does
not capture journals that ceased to exist before 2001 or did not yet exist in 2005 (see
‘‘Emerging areas cite highly interdisciplinary references’’ section). An updated version of
the UCSD map covering the years 2001–2010 will soon become available.
Future work will add additional indicators (e.g., densification of scholarly networks
during the maturation of a research area; a combination of lexical and citation based
information) but also other datasets (e.g., data of mature or dying areas) to the indicator-
by-dataset validation matrix to make sure the indicators are:
• efficient to calculate,
• predictive, i.e., give different results for mature or dying areas, and
• stable, i.e., are robust regarding data errors/omissions.
Fig. 9 Temporal dynamics of three indicators for ‘‘Nano*’’ (upper left), ‘‘RNAi’’ (upper right), ‘‘ImpactFactor’’ (bottom left), and ‘‘h-Index’’ (bottom right)
Mixed-indicators model 433
123

We welcome replications of this study and suggestions for improvements. The open
source Science of Science Tool (Sci2 Team 2009a) can be downloaded from
http://sci2.cns.iu.edu. All workflows used in this study as well as the Scientometrics dataset
are available online as part of the Sci2 Tool tutorial (Weingart et al. 2010).
Acknowledgments We would like to thank Joseph Biberstine and Russell J. Duhon for developing customqueries and code and appreciate the expert comments from the three anonymous reviewers. This work isfunded by the James S. McDonnell Foundation and the National Institutes of Health under awardsR21DA024259 and U24RR029822.
References
Adamson, I. (1992). Access and retrieval of information as coordinates of scientific development andachievement in Nigeria. Scientometrics, 23(1), 191–199.
Bettencourt, L., Kaiser, D., Kaur, J., Castillo-Chavez, C., & Wojick, D. (2008). Population modeling of theemergence and development of scientific fields. Scientometrics, 75(3), 495–518.
Boyack, K. W. (2004). Mapping knowledge domains: Characterizing PNAS. Proceedings of the NationalAcademy of Sciences of the United States of America, 101(Suppl 1), 5192–5199.
Braun, T., Glanzel, W., & Schubert, A. (1987). One more version of the facts and figures on publicationoutput and relative citation impact of 107 countries, 1978–1980. Scientometrics, 11(1), 9–15.
Braun, T., Glanzel, W., & Schubert, A. (1989a). Assessing assessments of British science: Some facts andfigures to accept or decline. Scientometrics, 15(3), 165–170.
Braun, T., Glanzel, W., & Schubert, A. (1989b). The newest version of the facts and figures on publicationoutput and relative citation impact: A collection of relational charts, 1981–1985. Scientometrics,15(1–2), 13–20.
Braun, T., Schubert, A., & Zsindely, S. (1997). Nanoscience and nanotechnology on the balance.Scientometrics, 38(2), 321–325.
Chen, C. (2006). Citespace II: Detecting and visualizing emerging trends and transient patterns in scientificliterature. Journal of the American Society for Information Science and Technology, 57(3), 359–377.
Chen, C., Chen, Y., Horowitz, M., Hou, H., Liu, Z., & Pellegrino, D. (2009). Towards an explanatory andcomputational theory of scientific discovery. Journal of Informetrics, 3(3), 191–209.
Chu, H. (1992). Communication between Chinese and non-Chinese scientists in the discovery of high-TCsuperconductors: II. The informal perspective. Scientometrics, 25(2), 253–277.
Garfield, E., & Small, H. (1989). Identifying the change frontiers of science. In M. Kranzberg, Y. Elkana, &Z. Tadmor (Eds.), Conference proceedings of innovation: At the crossroads between science andtechnology (pp. 51–65). Haifa, Israel: The S. Neaman Press.
Goffman, W. (1966). Mathematical approach to the spread of scientific ideas: The history of mast cellresearch. Nature, 212(5061), 452–499.
Goffman, W. (1971). A mathematical method for analyzing the growth of a scientific discipline. Journal ofAssociation for Computing Machinery, 18(2), 173–185.
Goffman, W., & Harmon, G. (1971). Mathematical approach to the prediction of scientific discovery.Nature, 229(5280), 103–104.
Goffman, W., & Newill, V. A. (1964). Generalization of epidemic theory: An application to the transmissionof ideas. Nature, 204(4955), 225–228.
Hirsch, J. E. (2005). An index to quantify an individual’s scientific research output. Proceedings of theNational Academy of Sciences of the USA, 102(46), 16569–16572.
Kajikawa, Y., Yoshikawaa, J., Takedaa, Y., & Matsushima, K. (2008). Tracking emerging technologies inenergy research: Toward a roadmap for sustainable energy. Technological Forecasting and SocialChange, 75(6), 771–782.
Kim, M.-J. (2001). A bibliometric analysis of physics publications in Korea, 1994–1998. Scientometrics,50(3), 503–521.
Klavans, R., & Boyack, K. W. (2009). Toward a consensus map of science. Journal of the American Societyfor Information Science and Technology, 60(3), 455–476.
Kleinberg, J. (2003). Bursty and hierarchical structure in streams. Data Mining and Knowledge Discovery,7(4), 373–397.
Kuhn, T. S. (1970). The structure of scientific revolutions. Chicago: University of Chicago Press.
434 H. Guo et al.
123

Lee, W. H. (2008). How to identify emerging research fields using scientometrics: An example in the field ofinformation security. Scientometrics, 76(3), 1588–2861.
Lewison, G. (1991). The scientific output of the EC’s less favoured regions. Scientometrics, 21(3), 383–402.Leydesdorff, L., & Schank, T. (2008). Dynamic animations of journal maps: Indicators of structural changes
and interdisciplinary developments. Journal of the American Society for Information Science andTechnology, 59(11), 1810–1818.
Lucio-Arias, D., & Leydesdorff, L. (2007). Knowledge emergence in scientific communication: From‘‘Fullerenes’’ to ‘‘nanotubes’’. Scientometrics, 70(3), 603–632.
Mane, K., & Borner, K. (2004). Mapping topics and topic bursts in PNAS. Proceedings of the NationalAcademy of Sciences of the United States of America (PNAS), 101(Suppl 1), 5287–5290.
Menard, H. W. (1971). Science: Growth and change. Cambridge, MA: Harvard Univ Press.Merton, R. K. (1968). The matthew effect in science: The reward and communication systems of science are
considered. Science, 159(3810), 56–63.Porter, A. L., & Rafols, I. (2009). Is science becoming more interdisciplinary? Measuring and mapping six
research fields over time. Scientometrics, 81(3), 719–745.Price, D. J. D. S. (1970). Citation measures of hard science, softscience, technology, and nonscience. In C.
E. A. P. Nelson, D. (Ed.), Communication among scientists and engineers (pp. 3–12): Heath LexingtonBooks, Massachusetts.
Rao, C. R. (1982). Diversity: Its measurement, decomposition, apportionment and analysis. Sankhy: TheIndian Journal of Statistics, Series A, 44(1), 1–22.
Scharnhorst, A., & Garfield, E. (2010 in press). Tracing scientific influence. Dynamic of Socio-EconomicSystem, 2(1).
Sci2 Team. (2009a). Science of Science (Sci2) Tool: Indiana University and SciTech Strategies, Inc.http://sci2.cns.iu.edu. Accessed 8 June 2010.
Sci2 Team. (2009b). Stop word list. http://nwb.slis.indiana.edu/svn/nwb/trunk/plugins/preprocessing/edu.iu.nwb.preprocessing.text.normalization/src/edu/iu/nwb/preprocessing/text/normalization/stopwords.txt. Accessed 11 June 2010.
Serenko, A., Bontis, N., Booker, L., Sadeddin, K., & Hardie, T. (2010). A scientometric analysis ofknowledge management and intellectual capital academic literature (1994–2008). Journal of Knowl-edge Management, 14(1), 3–23.
Small, H. (2006). Tracking and predicting growth areas in science. Scientometrics, 63(3), 595–610.Stirling, A. (2007). A general framework for analysing diversity in science, technology and society. Journal
of the Royal Society Interface, 4(15), 707–719.Takeda, Y., & Kajikawa, Y. (2009). Optics: A bibliometric approach to detect emerging research domains
and intellectual bases. Scientometrics, 78(3), 543–558.Thomson Reuters (2010). Web of science. http://scientific.thomsonreuters.com/products/wos/. Accessed 8
June 2010.Tsipouri, L. (1991). Effects of EC R&D policy on Greece: Some thoughts in view of the stride programme.
Scientometrics, 21(3), 403–416.Van Raan, A. F. J. (2000). On growth, ageing, and fractal differentiation of science. Scientometrics, 47(2),
1588–2861.Watts, R. J., & Porter, A. L. (2003). R&D cluster quality measures and technology maturity. Technological
Forecasting and Social Change, 70(8), 735–758.Weingart, S., Guo, H., Borner, K., Boyack, K. W., Linnemeier, M. W., & Duhon, R. J., et al. (2010). Science
of Science (Sci2) Tool User Manual. http://sci2.wiki.cns.iu.edu. Accessed 28 Jan 2011.Zitt, M., & Bassecoulard, E. (2008). Challenges for scientometric indicators: Data de-mining, knowledge
flows measurements and diversity issues. Ethics in Science and Environmental Politics, 8, 49–60.
Mixed-indicators model 435
123


Does cumulative advantage affect collective learningin science? An agent-based simulation
Christopher Watts • Nigel Gilbert
Received: 6 June 2011 / Published online: 21 June 2011� Akademiai Kiado, Budapest, Hungary 2011
Abstract Agent-based simulation can model simple micro-level mechanisms capable of
generating macro-level patterns, such as frequency distributions and network structures
found in bibliometric data. Agent-based simulations of organisational learning have pro-
vided analogies for collective problem solving by boundedly rational agents employing
heuristics. This paper brings these two areas together in one model of knowledge seeking
through scientific publication. It describes a computer simulation in which academic papers
are generated with authors, references, contents, and an extrinsic value, and must pass
through peer review to become published. We demonstrate that the model can fit biblio-
metric data for a token journal, Research Policy. Different practices for generating authors
and references produce different distributions of papers per author and citations per paper,
including the scale-free distributions typical of cumulative advantage processes. We also
demonstrate the model’s ability to simulate collective learning or problem solving, for
which we use Kauffman’s NK fitness landscape. The model provides evidence that those
practices leading to cumulative advantage in citations, that is, papers with many citations
becoming even more cited, do not improve scientists’ ability to find good solutions to
scientific problems, compared to those practices that ignore past citations. By contrast,
what does make a difference is referring only to publications that have successfully passed
peer review. Citation practice is one of many issues that a simulation model of science can
address when the data-rich literature on scientometrics is connected to the analogy-rich
literature on organisations and heuristic search.
Keywords Simulation � Cumulative advantage � Landscape search � Science models �Science policy
C. Watts (&) � N. GilbertDepartment of Sociology, Centre for Research in Social Simulation, University of Surrey,Guildford, Surrey GU2 7XH, UKe-mail: [email protected]: www.simian.ac.uk
123
Scientometrics (2011) 89:437–463DOI 10.1007/s11192-011-0432-8

Mathematic subject classification 91D10 (primary) � 91D30 � 90B70
JEL classification C63 � D83 � D85
Introduction
It has long been recognised that academic sciences show evidence of processes of
cumulative advantage, or what Merton called ‘the Matthew Effect’ (Merton 1968, 1988):
to those that have, more shall be given. That success breeds success Merton identified from
Zuckerman’s interviews with Nobel laureates (Zuckerman 1977). Within bibliometric data
the telltale sign is a power-law, or scale-free, frequency distribution, as demonstrated for
the numbers of papers per author (Lotka 1926; Simon 1955), and the numbers of citations
per paper (Price 1976). Opportunities for publishing tend to go to those who already have
papers to their name. References in a new paper tend to be made to publications already
rich in citations. Most scientists will publish little and be cited little. A tiny minority of
authors will enjoy a prolific publishing career, and a minority of publications will become
citation classics. With this in mind, it might be asked what this concentration of resources
and attention on so few academics and publications does for the advancement of scientific
fields. Do collectives of academic scientists perform better for following the practices that
generate cumulative advantage patterns? To answer such a question, it is not possible to
rerun the course of science using an alternative set of publishing practices. Instead, we
show in this paper that an agent-based computer simulation model of academic publication
can provide insight into the role played by publication practices.
In what follows, we provide a brief introduction to the idea of modelling scientific
publication. In the past this has been attempted through stochastic process models, and so
we need to explain why agent-based simulation is called for. Both types of model employ
simple micro-level mechanisms to generate macro-level patterns, but agent-based simu-
lations can readily incorporate several such mechanisms in the one model. In particular, to
address questions of scientists’ performance we combine the mechanisms that lead to
cumulative advantage with those of searching for better solutions to problems. These latter
mechanisms, called heuristic search algorithms, have already been incorporated in simu-
lations of organisational learning (March 1991; Lazer and Friedman 2007), and so our
model connects this field to that of science modelling. We then describe the simulation
model, flagging up some issues involved in its design and highlighting where alternative
design decisions could be taken. With the help of bibliometric data from a real journal,
Research Policy, we calibrate the model, and then perform an experiment with it, by
varying the mechanism by which references are created for each new paper. This suggests
that the cumulative-advantage process operating on citations has little or no effect on
search performance, that is, on scientists’ ability to find good solutions to scientific
problems. This is in contrast to the effects on search performance of filtering papers for
publication, achieved through peer review and through a preference for recency when
selecting which papers to refer to. However, this paper is only intended to give an indi-
cation of the opportunities offered by computer simulation, and we end with some pointers
for further research. In spelling out here the structure and issues behind the model we hope
to inspire other attempts at designing and validating simulation models capable of pro-
viding insight into scientific organisation and performance.
438 C. Watts, N. Gilbert
123
Models of science
Empirical patterns to be explained with stochastic models
Activity by academics and scientists leaves a data trail of their publications that readily
lends itself to modelling. In the age of electronic databases of journal publications this kind
of data is widely available, but awareness of its patterns predates these. As noted already,
Lotka (1926) showed that the numbers of papers per author followed a power-law or scale-
free distribution, while Price (1976) found such a distribution for citations per paper. Price
(1963) had earlier observed exponential growth rates in papers and authors in the field of
physics and reflected on the implications of this.
To explain how these distributions come about, a model of a stochastic process, or urnmodel, is usually employed. Simon (1955) presented a simple stochastic-process model to
generate a scale-free frequency distribution, and fitted it to Lotka’s data. Items which could
be new papers or references in new papers are allocated to selected ‘urns’ or categories,
such as authors. In the case of the power-law distributions, the stochastic process involved
growth over time in the number of urns, and some kind of cumulative advantage: those rich
in papers or citations were expected to get richer.
Contributions to science modelling since Simon have explored the mathematical
implications of such stochastic process models (Schubert and Glaenzel 1984; Glaenzel and
Schubert 1990, 1995; Glaenzel and Schubert 1995; Burrell 2001). For example Burrell
(2001) relates the citation process to the ageing and eventual obsolescence of papers.
Redner (1998) argues for there being at least two mechanisms generating citations in the
data he analyses, including one for more highly cited classics. Burrell (2007) employs a
stochastic model to estimate the behaviour under different conditions of Hirsch’s h-index
for measuring research output and impact based on citations.
Beyond simple distributions of papers and citations, bibliometric data have also yielded
networks of relations for analysis. Price (1965) relates papers by citations. Newman
(2001a, b, c) relates co-authors by their having collaborated together on at least one paper.
He then employs social network analysis metrics, including node degree or the number of
co-authors, centrality and the shortest path between pairs of nodes, and clustering or the
extent to which my neighbours are neighbours of each other. With increased interest in
simple processes by which ‘small-world’ and ‘scale-free’ networks may be generated
(Watts and Strogatz 1998; Barabasi and Albert 1999; Watts 2004), it seems desirable to
extend science models to explaining network patterns as well as distributions (Boerner
et al. 2004).
At this point it becomes desirable to employ computer simulations and so-called ‘agent-
based’, ‘multi-agent’ or individual-level simulation models in particular (Axelrod 1997;
Gilbert and Troitzsch 2005). Mathematical treatments of network formation, like those of
distribution formation, are certainly possible (Newman 2003). But for non-specialists,
simulation has a number of advantages over mathematical models (Gilbert and Troitzsch
2005), not least that it can model agents as heterogeneous in behaviour rules, attributes and
location in pre-existing network structures. When one wants to combine several interacting
processes or factors in modelling the behaviour of scientific authors, mathematical analyses
become too difficult compared to the programming and exploration of simulation models.
In the case of modelling publications, mechanisms that generate the distributions of papers
per author, the distributions of citations per paper, the growth over time in numbers of
papers and authors, and ideally also the structures in the networks formed by co-authorship
and co-citation all need to be combined.
Does cumulative advantage affect collective learning in science? 439
123
A concept of knowledge seeking as organisational learning
Scientific publications offer the opportunity to inform others of one’s findings, obtain
validation for one’s work through others’ responses to it, and provide the starting points
and stepping stones for future research. It is hard to represent this aspect of science through
stochastic-process models. In the field of organisational studies, however, there is a tra-
dition of constructing computer simulations of humans’ collective problem solving, or
‘organisational learning’ (March 1991; Lazer and Friedman 2007). This offers two addi-
tions to the components of a science model: methods of problem solving, and represen-
tation of the problems to be solved or the knowledge to be found.
Beginning with Simon’s conception of human actors as ‘boundedly rational’, it has been
proposed that problem solving in the workplace involves heuristics (March and Simon
1958; Cyert and March 1963). Psychological studies in the 1970 s and 1980 s bore out this
view (Kahneman et al. 1982). Heuristics are simple principles or rules of thumb for seeking
solutions to problems that would require impractical amounts of time and other resources
to solve by exhaustive search methods. While not guaranteed to find the optimal solution,
heuristic search algorithms are used to obtain sufficiently good solutions within a rea-
sonably short number of search steps. It has been proven that no heuristic algorithm will
perform well in every situation (the ‘no-free-lunch theorem’, Wolpert and Macready 1997),
but experience has shown several methods perform well on a variety of problems in which
different combinations of values must be explored to find a solution.
The use of relatively simple rules to make decisions among combinations of fixed sets
of values make heuristic search processes particularly easy to replicate in computer code.
Many simulation models of learning in organisations employ combinations of heuristics,
including trial-and-error exploration, learning from successful others (either through direct
imitation or some more indirect channel for social influence) and recalling past successful
ideas. In March’s (1991) model of organisational learning, good search performance for a
limited amount of search resources requires a balance between the exploration of new
views, and the exploitation of those already evaluated. If the population of searching agents
is too diverse, agents will spend much of their time exploring variations of poor solutions,
not good ones. If the agents converge in their solutions too soon, however, search comes to
an end, with a consensus solution that may not be very close to the optimum. Constraints
on the processes that lead to convergence thus become important for search performance
(Lazer and Friedman 2007). These have included organising agents into social networks
(which then restrict who can imitate whom) and restricting imitation so that imitator agents
make only partial copies.
The behaviour of scientists publishing within academic fields has also been compared to
heuristic search (Scharnhorst and Ebeling 2005; Chen et al. 2009). Various algorithms
offer potential analogies for aspects of scientific publication. By insisting on new papers
being original contributions to knowledge, authors are forced to explore more widely, in a
similar manner to tabu search (Glover 1989, 1990). The combination of ideas from
multiple co-authors and multiple references produces both exploration of new combina-
tions, but also the exploitation of past experience, perhaps the main attraction of geneticalgorithms (Mitchell 1996). The sharing between authors of information about past
experiences resembles particle swarm optimisation (Clerc and Kennedy 2002). Search
performance by swarms of agents can be improved through dividing the agents into tribes,
whose members only communicate information within their own tribe, and roles, where
‘managers’ maintain a record of the best solution found so far while ‘workers’ concentrate
440 C. Watts, N. Gilbert
123

on further exploration (Clerc 2006; Jin and Branke 2005). There may be scope for clus-
tering and stratification among scientists to produce analogous effects.
Sandstrom (1999) compares information seekers to foraging ants, themselves the
metaphor for another heuristic search algorithm, ant-colony optimisation (Corne et al.
1999). Recently successful foragers attract others to re-use their paths rather than the paths
of the less successful foragers or those that are older and potentially out-of-date. Having
attracted more foragers to them, the signals to good paths become renewed more often and
with greater strength. Thus under a cumulative-advantage principle, relatively short paths
to good sources become increasingly easy to identify from their relative popularity. In like
manner when constructing reference lists for a new academic paper a preference for the
already well-cited causes some papers to emerge as ‘citation classics’ that other researchers
can be relied upon to be familiar with (Merton 1968). This suggests that practices among
scientists that generate the Matthew Effect serve to simplify the task of new entrants to a
field by selecting the most important texts, and the shortest path to the research frontier.
But the organisational learning models also suggest that there may be a need for some
balance between exploration and exploitation. Does cumulative advantage operate too fast
among scientists?
It may not be possible to answer this question for real scientists. But one can begin to
answer it for a simulated search of an artificial problem space and then draw an analogy
with human systems (Steels 2001).
One analogy is based on the use of similarity or proximity. To get accepted by journals,
scientists’ publications must satisfy two sources of constraint on their contents: originality
and similarity. With respect to similarity, they must be intelligible and relevant to readers,
especially peer reviewers. With respect to originality, publications must differ from what
has been published before, or at least from what a reviewer has read before, but their
contents cannot be too unfamiliar. To be recognised as a contribution to the journal’s field
certain keywords, paradigm problems or classic references must be mentioned because
they are the symbols of membership to this field.
It might be asked, however, whether scientists also face some extrinsic source of value
and constraint for their work, call it ‘material reality’. In this conception, scientists’
activities have costs in material resources and time, and their publications describe
activities and equipment that may be prone to failure and breakages if the science justi-
fying them is in some sense wrong, or out of tune with reality. To simulate problem solving
activities addressing this external reality we can borrow the notion of a fitness landscape,
often used when discussing problem solving using heuristic search methods (Kauffman
1993). The use of various tools and techniques is represented by a set of variables. In the
simplest case, these are binary variables, representing presence or absence of some idea,
material, technology or practice. The combinations of values of these variables describe the
coordinates of a position in some multi-dimensional space. The fitness value of occupying
that position, that is, the benefit or cost incurred by employing the particular combination
of tools and techniques, can be thought of as the altitude at that point on a landscape. The
most desirable combination becomes the tallest peak, but a rugged landscape may have
multiple peaks of varying height. A heuristic search method, such as performing a random
walk and rejecting any local step that goes downhill, may lead to a nearby peak, but is not
guaranteed to find the tallest peak in the whole landscape. The more rugged the landscape,
the harder it is to find good peaks. Heuristic search algorithms typically involve many
agents each performing searches from various starting positions, sometimes with the
sharing of information between search agents about the heights reached.
Does cumulative advantage affect collective learning in science? 441
123

One fitness landscape suitable for simulating heuristic search is Kauffman’s NK model.
Initially presented as a theoretical model of biological evolution (Kauffman 1993), this has
since been reapplied in models of technological evolution (Kauffman 2000), strategic
management (Levinthal 1997; Levinthal and Warglien 1999; McKelvey 1999) and
organisational learning (Lazer and Friedman 2007). Among its attractions are that it is
relatively simple. A solution, or position on the landscape, consists of a string of N binary
variables. It uses just one other parameter, K, the number of interdependencies between
binary variables. Using this parameter, one is able to ‘tune’ the model to produce land-
scapes of varying ruggedness, and thereby varying degrees of difficulty for heuristic
search. The use of this landscape in different models also means that it is possible to
transfer code between and compare experiences of programs written for different audi-
ences. Against the use of the NK model, however, is the fact that it lacks any empirical
foundation. Whether one is interpreting it as a model of biological evolution or of
organisational learning, the numbers that go into defining the NK fitness landscape are
arbitrary and have no empirical referent.
That scientists seek better combinations of tools, techniques and other components is
plausible enough. The literature from actor-network theorists contains many examples of
scientists and other interested parties negotiating the satisfaction of their varied and often
conflicting demands (Latour 1987), a pattern repeated in analyses of technological projects
(Latour 1996; Law and Callon 1992). Kauffman (2000) also draws an analogy between
technological evolution and constraint satisfaction problems. However, if the effectiveness
of scientists’ search practices is to be replicated in simulations it will be desirable to match
as far as possible the structure of the problems faced by real scientists. Realistic landscapes
may be derivable from bibliometric data (Scharnhorst 1998), just as ‘maps’ of science have
been drawn up based on co-citation and co-word relations. Scharnhorst (2002), for
example, describes inferring the structure of a ‘valuation landscape’ from rates of change
in the proportion of papers being published in particular areas. So although the NKlandscape model has sufficed for models of organisation learning, more plausible looking
landscapes for science models may yet emerge from future research.
Agent-based science models
Stochastic process models give insight into the generation of the patterns observed in
bibliometric data. Models of organisational learning show how heuristic search algorithms
applied to fitness landscapes can help with understanding how problem-solving perfor-
mance in social groups depends upon communication practices, especially those that
determine the rate at which past solutions are borrowed. A good science model should aim
at combining these processes. It should generate patterns analogous to those seen in real
journal publications and it should reflect the fact that scientists’ activities serve a purpose,
namely that of seeking knowledge or solving problems.
Agent-based simulation models already exist that capture some of these components.
Whereas Simon’s (1955) urn model simply generated a frequency distribution for papers
per author, Gilbert (1997) represented individual academic papers with references to past
papers and some contents. Using two continuous variables to represent paper topics, his
model depicts an academic field as a two-dimensional plane. Subfields appear within this
model as clusters of points. The TARL model (‘Topics, Aging and Recursive Linking’) of
Boerner et al. represents both authors and papers, including references and ‘topics’ for
papers, and generates network data. In both of these models, the contents of papers are
constrained. For example, papers must be both original, that is, occupy distinct coordinates
442 C. Watts, N. Gilbert
123

in the plane, and also sufficiently similar to the papers they refer to, that is, occupy a point
within a radius of some given size from their reference papers. But in neither of these
models do papers undergo any kind of selection for the extrinsic value of their contents.
Drawing on models of organisational learning, we propose to remedy this. Weisberg and
Muldoon (2009) also employ landscape search as a model for science. In the 2009
‘Modelling Science’ workshop at the Virtual Knowledge Studio, Amsterdam, there were
several researchers working on simulation models of different aspects of science, including
Muldoon on the division of labour among scientists, Payette on modelling ‘science as
process’, and Wouters on the peer review system. (See the presentations available at
http://modelling-science.simshelf.virtualknowledgestudio.nl/.) Agent-based models now
promise to take the discipline of scientometrics far beyond the scope of stochastic-process
models.
Outline of the model
Figure 1 summarises the simulation.1 At initialisation, a number of ‘foundational’ publi-
cations are written. Being foundational these make no reference to other papers but may be
referred to by later papers. Thereafter, at each time step a number of new papers are
written. The number added grows geometrically over time at a given rate. For each new
paper a number of authors, a number of references to past papers, some contents for the
paper and their extrinsic fitness value, and a number of peer reviewers are generated. The
paper then undergoes review by the reviewers. The prime determinant of the review’s
outcome is a paper’s fitness as a solution to some extrinsic, complex problem, as defined by
a fitness landscape. Papers that satisfy peer review become journal publications. Option-
ally, the mechanisms for generating authors, references and reviewers can be restricted to
publications rather than all papers. Papers compete to become cited through the fitness
value of their contents. The selection pressure placed on them is intended to produce ever-
fitter solutions or knowledge as the academic field grows.
Generating authors
Every paper needs at least one author. As in Simon’s urn model (Simon 1955), there is a
given chance that this is a new agent with no previous papers in this field. A new agent has
no past papers, but does have opinions concerning this scientific field, represented as a bit
string of length N = 20. If the author is not new, then one is selected from the stock of
existing authors, using one of four methods (Table 1). There are two key distinctions
involved. Firstly, we distinguish between using a past journal publication (options 2 and 4),
and using a past, written paper, which may or may not have been published (options 1 and
3). Secondly, we distinguish between selecting authors from recent papers/publications
(options 1 and 2), thus showing a preference for recently prolific authors, and selecting
authors from papers contained in the reference lists of recent papers/publications (options
3 and 4), thus favouring recently well-cited authors. So depending on which option is
1 The simulation model, CitationAgents1, was developed initially in VBA within Excel 2003, and then, aftera break of several months, reproduced using NetLogo 4.1. Replicating a simulation model in this way helpsto verify that the program is working as intended. The extra work involved in replicating the model wasworthwhile, as several minor errors in the original version were exposed. A version of it may be downloadedfrom OpenABM: http://www.openabm.org/model/2470.
Does cumulative advantage affect collective learning in science? 443
123

chosen, prolific authors may become more prolific (options 1 and 2, a rich-get-richer
principle), or writing opportunities may go to authors with many publications (option 2), or
to those with many citations (options 3 and 4), the last being often suggested as a measure
of the quality of a publication.
When selecting authors, preference might be given to the most prolific and recent
authors (emphasising recent quantity, not quality), but authors whose output is unread or
unrated often command little respect and struggle to attract those resources (doctoral
students, research funds, writing sabbaticals) that help in the generation of new papers.
Selecting from publications rather than papers is one way to ensure that what is chosen has
passed a quality assessment. If instead recent citations are preferred, those whose past
works are currently in fashion or well read are rewarded. In addition an author may be
spurred into action by a new paper critiquing one of his or her own, for conflict in
intellectual social circles is particularly energising (Collins 1998). This points towards
using options 3 and 4 in the experiments below.
Real authors also age and the author of a citation classic might not be active in the field
anymore. Both Gilbert (1997) and Boerner et al. (2004) represent authors as having an
‘age’ or duration in the field. Authors’ ageing may be added to future versions of the
model, but for now it is assumed that even early arrivals last the whole of the simulated
period (30 years).
To model the recency of papers stratified sampling is used. Past papers are weighted for
sampling with a Weibull function of the age of the paper. There are several reasons for
choosing the Weibull function for definitions of recency (as well as for numbers of authors
and references per papers). It is parsimonious, taking only two parameters: alpha, con-
trolling variability, and beta, controlling basic rate. It is faster to compute than certain other
functions such as log normal, yet depending on its parameters it can approximate the bell
curve of a normal distribution and the skew of a log normal, and produces the negative
exponential when alpha is 1. Analysis of bibliometric data (see the next section) suggested
Table 1 Author-selection options: for choosing which past authors become authors of a new paper
1. Select author from a recent paper (published or unpublished)
2. Select author from a recent journal publication
3. Select author from a paper in the reference list of a recent paper. (If the recent paper has nothing in itsreference list, then select from its own authors instead.)
4. Select author from a paper in the reference list of a recent journal publication. (If the reference list isempty, select author from the authors of the recent publication instead.)
Generate foundational publications For each time step
For each new paper Generate first author Generate list of co-authors Generate list of references Generate contents Calculate fitness of contents Generate list of peer reviewers Decide whether paper becomes journal publication
Next new paper Output periodically statistics on simulation evolution
Next time step Output final statistics and distributions
Fig. 1 Stages in the simulationmodel
444 C. Watts, N. Gilbert
123
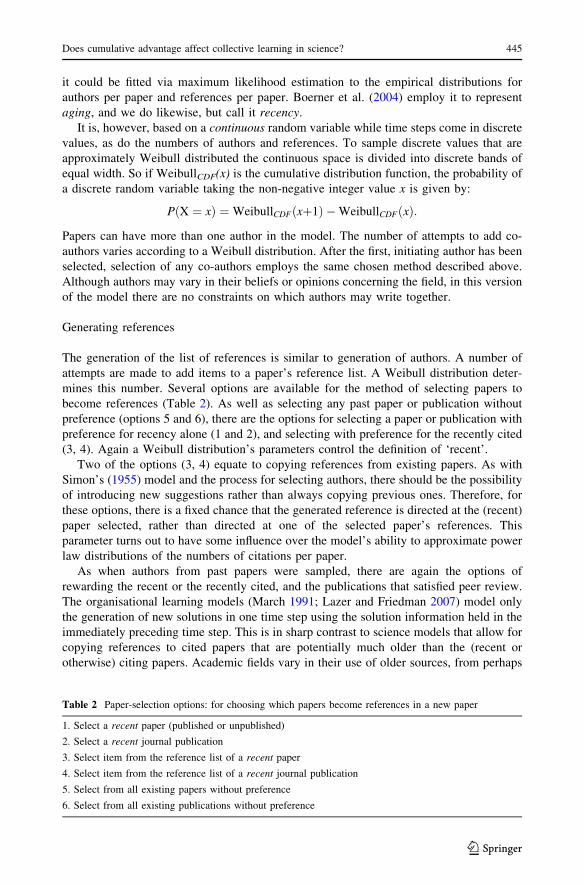
it could be fitted via maximum likelihood estimation to the empirical distributions for
authors per paper and references per paper. Boerner et al. (2004) employ it to represent
aging, and we do likewise, but call it recency.
It is, however, based on a continuous random variable while time steps come in discrete
values, as do the numbers of authors and references. To sample discrete values that are
approximately Weibull distributed the continuous space is divided into discrete bands of
equal width. So if WeibullCDF(x) is the cumulative distribution function, the probability of
a discrete random variable taking the non-negative integer value x is given by:
P X ¼ xð Þ ¼WeibullCDF xþ1ð Þ �WeibullCDF xð Þ:
Papers can have more than one author in the model. The number of attempts to add co-
authors varies according to a Weibull distribution. After the first, initiating author has been
selected, selection of any co-authors employs the same chosen method described above.
Although authors may vary in their beliefs or opinions concerning the field, in this version
of the model there are no constraints on which authors may write together.
Generating references
The generation of the list of references is similar to generation of authors. A number of
attempts are made to add items to a paper’s reference list. A Weibull distribution deter-
mines this number. Several options are available for the method of selecting papers to
become references (Table 2). As well as selecting any past paper or publication without
preference (options 5 and 6), there are the options for selecting a paper or publication with
preference for recency alone (1 and 2), and selecting with preference for the recently cited
(3, 4). Again a Weibull distribution’s parameters control the definition of ‘recent’.
Two of the options (3, 4) equate to copying references from existing papers. As with
Simon’s (1955) model and the process for selecting authors, there should be the possibility
of introducing new suggestions rather than always copying previous ones. Therefore, for
these options, there is a fixed chance that the generated reference is directed at the (recent)
paper selected, rather than directed at one of the selected paper’s references. This
parameter turns out to have some influence over the model’s ability to approximate power
law distributions of the numbers of citations per paper.
As when authors from past papers were sampled, there are again the options of
rewarding the recent or the recently cited, and the publications that satisfied peer review.
The organisational learning models (March 1991; Lazer and Friedman 2007) model only
the generation of new solutions in one time step using the solution information held in the
immediately preceding time step. This is in sharp contrast to science models that allow for
copying references to cited papers that are potentially much older than the (recent or
otherwise) citing papers. Academic fields vary in their use of older sources, from perhaps
Table 2 Paper-selection options: for choosing which papers become references in a new paper
1. Select a recent paper (published or unpublished)
2. Select a recent journal publication
3. Select item from the reference list of a recent paper
4. Select item from the reference list of a recent journal publication
5. Select from all existing papers without preference
6. Select from all existing publications without preference
Does cumulative advantage affect collective learning in science? 445
123

physics at one extreme, to footnotes-to-Plato philosophy at the other, suggesting that
references can play different roles. For this paper, only their role in providing material for
new solutions to problems is modelled, not any role that references to classics might play
in signalling membership and evoking a sense of belonging to a tradition.
Generating contents and fitness
The authors and references for a paper are employed in the generation of that paper’s
contents. Each author has a vector of binary variables representing his or her opinions,
beliefs or preferred practices within the field. The contents of papers are encoded as a
vector of binary variables of the same length, N. When constructing a new paper, for each
variable a value is sampled. With a fixed chance (0.01), this comes from a Bernoulli-
distributed random process, in which case it represents the possibility of a new discovery or
practice entering from outside the field, and hence not obtained from the literature.
Otherwise, the value is sampled from the set of contents of all papers in the references and
from the opinions of all authors of the new paper. Thus, like genetic algorithms (Mitchell
1996), the production of content involves both mutation and recombination processes.
When values have been sampled for every variable, a fitness value is calculated for the
corresponding bit string. Like Lazer and Friedman (2007) in their model of organisational
learning, the fitness value is taken from Kauffman’s NK fitness landscapes using Lazer and
Friedman’s choice of parameters (N = 20; K = 5), which generates a moderately difficult
landscape to explore. Descriptions of this fitness measure have been given in detail else-
where (Kauffman 1993, 1995, 2000; Levinthal 1997) but we recap briefly here. For each of
the N = 20 bits or variables there exists a table of fitness values and dependency relations
to other variables. A variable’s fitness table has one row for every combination of values (1
or 0) of that bit plus its K = 5 dependency variables––i.e. 26 = 64 combinations or rows.
The network of inter-variable dependency relations is randomly assigned at the start of the
simulation. Given the current state of a variable and its K neighbours, the corresponding
row of its table is examined. In each row there is a number, set at the start of the simulation
by sampling from a uniform distribution (0, 1). This is the current contribution to total
fitness for that variable. The actual fitness value for a paper or author is the mean fitness
contribution from all N variables or bits.
Given fitness values, papers may be ordered as more or less fit in their contents or
solutions, and authors in their beliefs. The fitness values have two consequences. Firstly, if
an author has just co-constructed a paper with a better solution than that represented by
the author’s own beliefs, then the author updates its beliefs with the paper’s contents.
Secondly, fitness values are compared when peer reviewers evaluate a new paper.
Generating peer review and publication
A completed paper is evaluated to decide whether it will become a journal publication.
Peer reviewers are selected for a new paper using a method chosen from the same list as
that for selecting authors (Table 1). The choice might be between recently active authors,
more likely to be junior researchers building their experience of the field, and well-cited,
well-regarded senior academics, confident in their interpretation of what should or should
not be accepted. Of course, juniors often collaborate with seniors on a paper so the
distinction may not be as significant in the real world as it can be in the simulation. We
shall focus on option 2 here: preferring as reviewers the authors of recent publications.
446 C. Watts, N. Gilbert
123

Nine attempts are made to find peer reviewers. Papers are rejected if the number of
reviewers recommending the paper is below a threshold (set to 3). These numbers are
chosen arbitrarily: although the journal Research Policy does claim to send submitted
papers to three referees, how its editor chooses these we do not know.
A reviewer recommends a paper if:
• The reviewer is not an author of the paper,
• The paper’s contents are not identical to the reviewer’s own beliefs,
• The paper’s contents are not identical to those of any of its referenced papers, and
• The paper’s fitness value is not less than that of the reviewer.
Having non-inferior fitness to that of reviewers is a strong requirement. The simulated
authors and reviewers have perfectly accurate estimations of the value of their papers and
of their own beliefs. The costs and benefits of real academic papers may be much harder to
judge and inferior papers do sometimes creep into print, their errors to be identified later.
One solution to this modelling issue would be to introduce softer methods of fitness
evaluation using stochastic elements, such as those used by the search algorithm of sim-ulated annealing (Kirkpatrick et al. 1983), but this would add more parameters to the
simulation and is omitted for the present.
Generating output data
The simulation outputs frequency distribution data: authors, references and citations per
paper and per publication, and papers and publications per author. It also plots the growth
of the field as the numbers of papers, publications and authors over time. Network data on
collaboration (co-authorship) and citation relations can also be generated and analysed. In
common with the organisational learning models, statistics concerning the fitness of the
solutions currently contained in papers and agents’ opinions are calculated. By plotting
these over time search performance can be compared with the evolution in the field.
Calibrating the model: the case of Research Policy
Validation strategy
A good simulation model should provide knowledge and understanding that one would like
to have had from a real-world system, but for practical reasons cannot obtain (Ahrweiler
and Gilbert 2005). To address what-if questions about the science system, simulation
models should occupy the middle ground between being, on the one hand, a detailed
replica of some complex social system, and on the other hand some abstract mathematical
construction that is difficult to derive real-world implications from. The former involve too
much work in designing, programming, validating and computing to be of practical use. To
obtain an answer, things need to be left out of the model. On the other hand, a science
model needs to be a plausible representation of scientists’ activities, and not just a
mathematician’s fiction. With this caveat in mind, parameter values can be sought that fit
the simulation model to some real bibliometric data. This step is common to previous
presenters of science models (Simon 1955; Price 1976; Gilbert 1997; Boerner et al. 2004).
The speed of the simulation is such that trial-and-error exploration of the simulation’s
parameter space suffices for obtaining the following fits. To achieve this, however, the
model is simplified in one important respect: agents’ problem-solving capabilities are
Does cumulative advantage affect collective learning in science? 447
123

omitted by setting all fitness values to 1, irrespective of paper contents or author beliefs.
This means that peer review is doing nothing more than checking for originality. The NKfitness landscape is then reintroduced, but data fitting while using the fitness landscape is a
much harder task. A summary of the parameters employed in the simulations is shown in
Table 3.
Growth over time
Desiring a small-scale simulation for faster runtimes during experiments, we took data
from ISI Web of Science for a single journal, Research Policy, which sits at the heart of its
particular field, innovation studies. Founded in 1974, this journal has shown fairly steady
increases in its growth, in terms of both the number of papers per year and the number of
authors per year. Taking 1974 to be the model’s year 1 (so omitting the foundational
papers used for initialisation, which appear in year 0), Fig. 2 shows the number of papers
per year for each year thereafter, and the total number of papers for a typical run of the
simulation, as well as the real data from Research Policy (hereafter RP). The results were
obtained assuming 14 foundational papers, 16 papers in year 1, and each year thereafter the
number of new papers was 1.067 times that of the year before. After 30 simulation
iterations the number of papers generated was 1432, comparable with the 1389 papers
Table 3 Summary of model parameters, with example values
Parameter description Example value
Field parameters
No. of time steps 30
No. of foundational publications 14
No. of papers added in first year after foundation, P1 16
Field growth, G (# papers to be added at time t = P1 * G(t-1)) 1.067
Authors parameters
Method for selecting authors 2 or 4 (Table 1)
No. of authors per paper: 2 parameters (alpha, beta) for a Weibull distribution 1.4, 1.3
Chance of author being new to field 0.6
Author Recency: 2 parameters (alpha, beta) for a Weibull distribution 1.3, 1
References parameters
Method for selecting papers to cite 4 (see Table 2)
No. of references per paper: 2 parameters for a Weibull distribution 1, 4.2
Chance of using recent paper itself rather than copying its reference 0.3
Reference Recency: 2 parameters for a Weibull distribution 1.3, 2
Contents parameters
Chance of innovation in one bit during contents construction 0.01
No. of bits of information in paper (the N in NK fitness landscape) 20
No. of interdependencies between bits (the K in NKfitness) 5
Peer Review parameters
Method for selecting past authors to be peer reviewers 2 (see Table 1)
No. of attempts to find reviewers for paper 9
No. of recommendations required for publication 3
Reviewer Recency: 2 parameters for a Weibull distribution 1, 4
448 C. Watts, N. Gilbert
123

published in RP by end of 2003, or model year 30. So far, this shows only that the field is
growing exponentially.
Matching the number of authors per year is also straightforward. By 2003, the simu-
lation model’s Weibull function approximates the actual distribution of authors per paper
for each year (Fig. 3). The mean number of authors per paper rose slightly during the
30-year period for RP, but for simplicity constant parameter values were assumed in
the simulation: alpha = 1.4; beta = 1.3. The number of authors available for writing the
papers grows over time. Starting with an empty field, all the authors in the journal’s
volume for 1974 must be new to that journal. However Fig. 4 shows a fall over time in the
proportion of authors in a year’s volume who are new, that is, publishing in the journal for
the first time. Again for simplicity, the simulation assumes a constant chance of an author
of a paper being new to the field: 0.6. This assumption of a constant chance is common to
the models by Simon (1955); Gilbert (1997) and Bentley et al. (2009). The combination of
0
20
40
60
80
100
120
140
Year
# N
ew P
aper
s
Simulation
ResPolicy
0
200
400
600
800
1000
1200
1400
1600
0 10 20 30
0 10 20 30Year
# P
aper
s to
dat
e
Simulation
ResPolicy
Fig. 2 Field growth: (top) the number of papers added to the field each year and (bottom) the total numberof papers to date. Output from a typical simulation run (crosses) is shown with actual data from the journalResearch Policy (squares)
Does cumulative advantage affect collective learning in science? 449
123

number of authors per paper and proportion of authors who are new to the field gives the
growth in authors seen in Fig. 5, with the corresponding figures for RP.
Distributions: authors and papers
When the authors for a new paper are not new to the journal, they can be found from earlier
papers. For sampling them, options 2 or 4 from Table 1 will generate a similar distribution.
Figure 6 (first chart) shows the distribution from a typical run for option 4, plotted against
the empirical distribution from RP. In addition, Fig. 6 (second chart) shows a line with an
exponent of -3.07, the average exponent from power laws fitted to the results of 20
simulation runs. The exponents for the 20 fits ranged from 2.99 to 3.18.
1
10
100
1000
0 2 4 6 8 10
# Authors per paper
Fre
qu
ency
Simulation
ResPolicy
Fig. 3 Number of authors per paper after 30 years: probability density functions fitted for a typical run ofthe simulation and for Research Policy
0.0
0.2
0.4
0.6
0.8
1.0
0 10 20 30 40Year
Ch
ance
th
at a
uth
or
is n
ew
ResPolicy
y=(1-c)*exp(-bx) + c
Fig. 4 Proportion of the authorspublishing in each year who arenew to the journal ResearchPolicy
450 C. Watts, N. Gilbert
123

One other aspect of authorship remains to be defined, that of recency when selecting
publications to obtain authors. To determine this, relations across time between papers
having a common author are examined. Taking all pairs of papers that share at least one
author and restricting attention to those pairs where the latest paper of the pair was
published in year 30, Fig. 7 shows plots for the simulation and RP of the distribution of
time gaps between these common-author papers. Like the papers-per-author distribution,
and unlike the growth curves and authors-per-paper distribution, the simulation’s distri-
bution is a non-trivial outcome of its workings. Decisions concerning the method of
selecting authors, including the definition of recency, will affect this distribution. The
weighting of ‘recent publications’ used a Weibull function of the time since their publi-
cation with parameters alpha = 1.3 and beta = 1. The simulation output shown is the
aggregate results of 20 simulation runs with 95% confidence intervals for each data point.
0
20
40
60
80
100
120
140
160
Year
# N
ew A
uth
ors
Simulation
ResPolicy
0
200
400
600
800
1000
1200
1400
1600
0 10 20 30
0 10 20 30Year
# A
uth
ors
to
dat
e
SimulationResPolicy
Fig. 5 Growth in authors in a typical run of the simulation and in Research Policy: (top) new arrivals foreach year; (bottom) total authors to date
Does cumulative advantage affect collective learning in science? 451
123

Distributions: references and citations
Turning now to the generation of references, there is a problem. The papers of any journal
contain references to papers in other journals, including those written prior to the foun-
dation of the target journal. To simulate the journals outside the target would be prohib-
itively complicated. The solution taken here is to restrict attention to references that point
to other papers inside the target journal. Other modellers might try different solutions.
Having made this simplification, there are several data-fitting tasks analogous to those
faced for authors-related distributions. The distribution of the numbers of references per
paper can be taken straight from the bibliometric data. The Weibull distribution has again
been used for this (alpha = 1, so equivalent to a negative exponential distribution;
beta = 4.2). The distribution of time gaps between citing papers in year 30 and the papers
cited by their references is used to guide the choice of parameters to define recency, when
1
10
100
1000
10000
1 10 100
# Papers per author
Fre
qu
ency
SimulationResPolicy
0.01
0.1
1
10
100
1000
10000
1 10 100
# Papers per author
Fre
qu
ency
MeanSim
ResPolicy
Fig. 6 Frequency distributions of the numbers of papers per author: (top) a typical simulation run; (bottom)curve taking the mean exponent from power laws fitted to each of 20 simulation runs
452 C. Watts, N. Gilbert
123

selecting past papers for their references. To generate the distribution in Fig. 8 ‘recent
publications’ were defined using a Weibull function with parameters alpha = 1.3 and
beta = 2. The mean figures from 20 simulation runs suggest papers published more than
20 time steps ago are receiving slightly too few citations, but the simulation has captured
the general peak-and-decay pattern.
As in the model of Boerner et al. (2004), the initial or foundational papers in the
simulation provide a means for representing papers outside the target dataset. An exami-
nation of the numbers of citations received by papers in each year (Fig. 9) shows that the
papers in the model’s year 1 tend to receive slightly more citations than those in the next
few years, despite the number of new papers in those years increasing gradually. (For these
0
5
10
15
20
25
30
35
40
45
0 10 20 30 40
Years ago
Fre
qu
ency
Sim MeanResPolicy
Fig. 7 The time between authorship events. For all pairs of papers one published in year 30 and sharing atleast one author, frequency distributions of the ages of the earlier paper: mean results from 20 simulationruns together with 95% confidence intervals for each point, and corresponding data from RP
0
10
20
30
40
50
60
70
80
0 10 20 30 40
Years ago
Fre
qu
ency
Sim MeanResPolicy
Fig. 8 The time between citing and cited papers. Frequency distributions of the ages of all papersreferenced by papers published in year 30 for mean results from 20 simulation runs, with 95% confidenceintervals indicated, and corresponding data from RP
Does cumulative advantage affect collective learning in science? 453
123
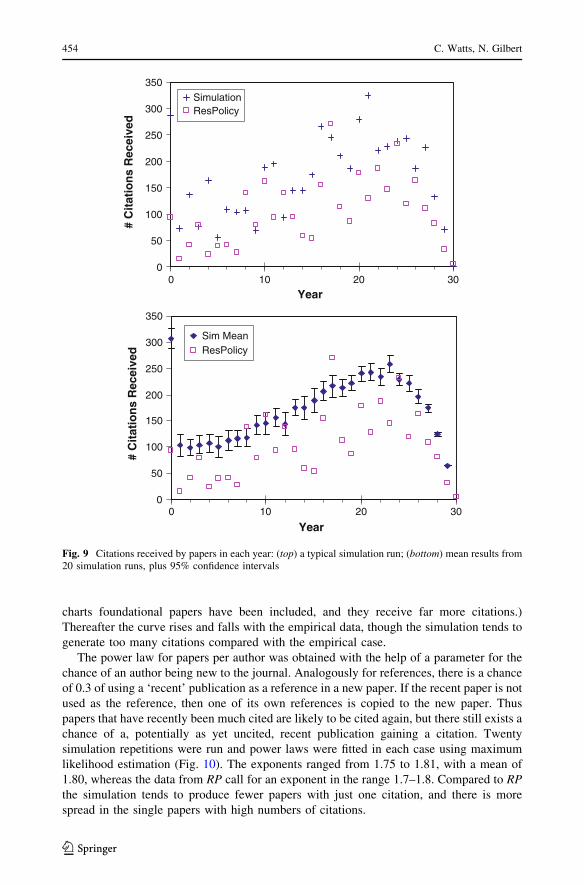
charts foundational papers have been included, and they receive far more citations.)
Thereafter the curve rises and falls with the empirical data, though the simulation tends to
generate too many citations compared with the empirical case.
The power law for papers per author was obtained with the help of a parameter for the
chance of an author being new to the journal. Analogously for references, there is a chance
of 0.3 of using a ‘recent’ publication as a reference in a new paper. If the recent paper is not
used as the reference, then one of its own references is copied to the new paper. Thus
papers that have recently been much cited are likely to be cited again, but there still exists a
chance of a, potentially as yet uncited, recent publication gaining a citation. Twenty
simulation repetitions were run and power laws were fitted in each case using maximum
likelihood estimation (Fig. 10). The exponents ranged from 1.75 to 1.81, with a mean of
1.80, whereas the data from RP call for an exponent in the range 1.7–1.8. Compared to RPthe simulation tends to produce fewer papers with just one citation, and there is more
spread in the single papers with high numbers of citations.
0
50
100
150
200
250
300
350
Year
# C
itat
ion
s R
ecei
ved
SimulationResPolicy
0
50
100
150
200
250
300
350
0 10 20 30
0 10 20 30
Year
# C
itat
ion
s R
ecei
ved
Sim MeanResPolicy
Fig. 9 Citations received by papers in each year: (top) a typical simulation run; (bottom) mean results from20 simulation runs, plus 95% confidence intervals
454 C. Watts, N. Gilbert
123

The distribution is sensitive to changes in the parameter that sets the chance of refer-
ences pointing to recent papers rather than to papers referenced by recent papers. With
extreme values, the results are far from a power law (Fig. 11). If the recent paper rather
than one of its references (equivalent to methods 1 and 2 in Table 2) is selected, then the
resulting distribution is exponential, not power law. If the recent paper’s referenced paper,
never the recent paper itself, is chosen, then the distribution bends away from the kind of
power law that would fit RP.
To summarise, using empirically grounded assumptions for growth in papers and in
authors, and distributions for authors per paper and references per paper, so far the dis-
tributions of papers per author, citations per paper, the time gaps between authors’ papers,
the ages of papers when chosen for references, and the number of citations received per
year found in RP has been matched closely by the output from the simulation. These fits
were achieved through processes for selecting authors and references that included
1
10
100
1000
# Citations per paper
Fre
qu
ency
SimulationResPolicy
0.1
1
10
100
1000
1 10 100 1000
1 10 100 1000
# Citations per paper
Fre
qu
ency
MeanSimResPolicy
Fig. 10 Frequency distributions for numbers of citations per paper: (top) a typical simulation run; (bottom)curve taking the mean exponent from power laws fitted to each of 20 simulation runs
Does cumulative advantage affect collective learning in science? 455
123

choosing parameters for the Weibull-distributed weighting of past papers in the definition
of what constitutes a ‘recent paper’ (see Table 3), but also the choice of procedure for
sampling papers to become new references. Papers were mostly selected with preference
for those with recent citations. This is clearly better than selecting recent papers without
regard to their citations, which fails to generate a plausible distribution of citations per
paper, but over-concentration on citations would also generate the wrong distribution. So,
although there is no guarantee that the former generation mechanism is the best, it is clear
that some methods give distributions that clearly fail to fit.
Introducing fitness and peer review
So far, peer review has played little part in the model. Papers may be rejected by reviewers
for being unoriginal, but this is a very weak constraint. With N = 20 bits of information in
the contents of each simulated paper, there are 220, or over one million, possible combi-
nations of binary values for papers to explore during 30 time steps, and so a paper is rarely
rejected for matching a reviewer’s beliefs. Once NK fitness is introduced, however, peer
review places a significant selection pressure on papers. As Fig. 12 shows for a typical
simulation run, in most years only about 20% of the generated papers are accepted as
publications. If methods for selecting authors or references are restricted to journal
1
10
100
1000
1 10 100
# Citations per paper
Fre
qu
ency
Simulation
Genuine power law
0.1
1
10
100
1000
1 10 100 1000
# Citations per paper
Fre
qu
ency
Simulation
Genuine power law
Fig. 11 Citations per paper, but no power law. Results of (top) always choosing the recent paper instead ofits reference, and (bottom) always copying the recent paper’s reference, never the recent paper itself. Thelines indicate what power laws would look like, and have gradients similar to those fitted to RP
456 C. Watts, N. Gilbert
123

publications rather than including unpublished material (representing working papers,
unreviewed conference proceedings, and drafts), reviewing for fitness is likely to have
some impact on the model’s ability to match the empirical distributions.
This turns out to be the case. The number of publications per year, the number of
citations received and the time-gap distributions no longer match the RP distributions. To
compensate for this, paper production can be increased, by raising year 1’s papers from 16,
in anticipation of the fact that only 20% will be published. Since each of these extra papers
needs authors, the chance of an author being new to the journal and the impact of the
recency functions may also have to be changed. However, raising the number of papers
increases computation times for the simulation.2 Instead of results being returned in sec-
onds on a modern PC, they can take minutes, and the simulation no longer encourages user
interaction. Further data fitting will have to wait for faster computers, or for the addition of
automated methods for searching the parameter space.
We do not know what proportion of papers submitted to Research Policy is accepted.
We would not expect to match it: the representation of contents and extrinsic fitness value
was not intended to be that realistic. But data supplied by the journal Management Sciencesuggest that an acceptance rate of roughly 10% is plausible for that journal. It has been
found that many papers rejected from one journal eventually make it into print in another
journal, typically one of lesser status (Bornmann 2010). Otherwise, bibliometric data do
not generally reveal about what happens outside of publication success.
Experimenting with cumulative advantage
We turn next from generating plausible distributions to exploring the impact on search
performance of the choice of method for generating reference lists in simulated papers.3
0%
20%
40%
60%
80%
100%
0 10 20 30Year
% A
ccep
ted
Fig. 12 Percentage of papers being accepted for publication per year in a typical simulation run thatincludes a fitness function and peer review process
2 The exact relation between computing time and model scale is difficult to state, and differs between theVBA and NetLogo versions, for reasons internal to those software environments.3 The options for generating author lists also include those that produce cumulative advantage (in papers perauthor), but preliminary testing showed that these mechanisms have smaller effects than those for generatingreferences, perhaps because papers have more references than authors on average.
Does cumulative advantage affect collective learning in science? 457
123

Keeping the parameter values found during calibration, we experiment with varying the
reference-selection method. The fitness of the best solution found during each simulation
run is recorded. Figure 13 shows mean results for 200 simulation runs, with 95% confi-
dence intervals for each mean, for each of the methods in Table 2. It is clear that methods
involving publications (even-numbered methods) beat their paper-based equivalents (odd-
numbered). Secondly, the method associated with the scale-free distributions of citations
per paper (method 4) is not the best, but the difference between it and method 2, which is
known to generate a distinct distribution, is not statistically significant. So in this exper-
iment the cumulative-advantage process for generating citations failed to make a notice-
able difference to the search performance of the agents. The preference for recency in
methods 2 and 4 helps when compared with method 6, which samples from any past
publication with no preference for recency. However, the most important aspect of gen-
erating references is still the use of publications, that is, the use of filtering provided by
peer review.
To test the sensitivity of these results, alternative methods of generating references were
tried. For an alternative to methods 1 and 2, instead of sampling papers (or publications)
with preference for recency, a recent year can be randomly chosen, then any paper (or
publication) from that year selected. This would simulate a reference seeker who went to a
particular journal volume simply because it was recent, and who ignored how many papers
the volume had in it. This alternative did not differ statistically significantly from methods
1 and 2. As an alternative to methods 3 and 4, sampling stratified by recency and citations
received was used, as opposed to stratification by citations received from recent papers.
Methods 3 and 4 allow for generating references to ‘citation classics’ that are not them-
selves recent, but have recently been in fashion. The alternative method prefers well-cited
items that are still themselves recent. Again, the results from the alternative method failed
to differ statistically significantly. However, a field with a different growth rate might
result in some differences. We leave this investigation for further work.
0.70
0.71
0.72
0.73
0.74
0.75
0.76
1. A recentpaper
2. A recentpublication
3. Recentlycited bypapers
4. Recentlycited bypubs.
5. Any pastpaper
6. Any pastpub.
Reference Selection Method
Bes
t F
itn
ess
Fig. 13 Best fitness found using various methods for selecting papers for references. Method numbers arethose in Table 2. Results shown are the means of 200 simulation runs using each method, with 95%confidence intervals. For descriptions of the methods see the text
458 C. Watts, N. Gilbert
123

Discussion and future work
The model described in this paper has the ability to generate distributions and other
patterns similar to those found in bibliometric data, including papers per author and
citations per paper. Through its simulation of peer review it has the ability to perform
searches on fitness landscapes, an analogy for problem solving. As demonstrated here, the
pursuit of the second task turns out to disturb that of the first task. Obtaining distributions
that fit a particular set of bibliometric data while searching the current, artificial fitness
landscape would require further work, not least because of the extra computing time
needed as the number of papers increases. Instead, we examined whether searching an
artificial fitness landscape was affected by the choice of methods for generating references
and citations. As it turned out, the impact on search performance was not statisticallysignificant for cumulative-advantage processes. Whether it is significant in the sense of
important is a question to be asked when we can replace NK fitness with landscapes that
have some empirical grounding. By contrast, the use of publications rather than papers, that
is, choosing to refer only to papers that have passed through peer review, did make a
noticeable difference.
Of course, real academic authors and reviewers might not be employing the optimalpublishing practices. They make choices about their own practices, and there is no guar-
antee that their attempts to pursue their own individual interests will lead to the best
collective performance. Nevertheless, simulation models of academic publication can
suggest areas in which different practices might come with different costs. These sug-
gestions can then be turned into theories to be investigated in further research, including
through other approaches. When the practices that performed best in the simulation are not
followed by real scholars, why is this so? What extra utility to those practices is not
captured by the theory represent by the model?
Our simulation has a wealth of options and parameters, perhaps inevitably given the
need to bring together several different processes from the science system. Even so we
omit or simplify aspects of the generation of scientific papers, as well as other activities
related to the dissemination of scientific knowledge such as conferences and teaching. But
each choice of process or parameter value can be debated, with arguments drawing upon
empirical sources, such as ethnographic studies of scientists at work (Latour 1987) and, of
course, scientometric analyses. Clearly the exploration of this model has only just begun,
but we pick out here a few suggested directions for future research, several of them
demonstrating the interplay of endogenous and exogenous influences on the model’s
workings.
What are the effects on search performance of varying the parameters underlying the
generation of recency and the numbers of co-authors, references and reviewers? For
example, what would be the impact of a limit on the number of references per paper? At
present, most authors can choose the number of references, and those that supply a higher
number wield a larger amount of influence in determining which papers will become
citation classics, and who among the field will receive the best citation count (Fuller 2000).
Work in filtering the list of publications in a field and reducing it to a more manageable
size for future researchers and students is not rewarded. Profligate reference creators are
not penalised. Is there scope for gaming the system to favour one’s own allies or research
interests? Do some methods of selecting peer reviewers lead to elites controlling what gets
published in a field?
There are several issues to address concerning how a science simulation represents
connections to things outside its area of focus. For example, to keep the program fast and
Does cumulative advantage affect collective learning in science? 459
123

responsive, we only simulated the generation of as many papers as are found in a single
journal. Generated references in these papers were to previous papers in the simulation.
Contents for new papers were largely sampled from these references. The model’s sen-
sitivity to the number of foundational papers and the chance of innovation during contents
sampling––the only extrinsic sources of information––should be examined, but better
approaches to representing a journal’s connections to other literature may exist.
The model’s sensitivity to different types of landscape should be also investigated, both
before and after learning more about the structure of real epistemic landscapes. For the NKlandscape, increasing K, the number of interdependencies between components, is known
to lead to more rugged landscapes, and more difficult searches. How does search difficulty
affect distributions, and collaboration and citation networks? Will there be an analogue to
Whitley’s (2000) finding that the social organisation of scientists varied with the degrees of
task uncertainty and mutual dependency faced by those scientists? For sufficiently long
simulation runs, the difficulty of finding improvements and getting published will increase.
Will this lead to identifiable stages of growth in the research field, like those described by
Mulkay et al. (1975): exploration, unification and decline/displacement?
As Scharnhorst’s (2002) two-landscape conception of science highlights, the value of a
particular position in science is dependent on the occupation by others of that and sur-
rounding positions. Our model included one such constraint on where an agent can publish,
that of originality. Future work will consider the impact of a requirement for a degree of
similarity between publications and authors. Papers will be rejected if their contents are too
unlike what has gone before in the referenced papers or in the experience of reviewers and
potential co-authors. The evidence from Axelrod’s cultural model (Axelrod 1997;
Castellano et al. 2000), opinion dynamics models (Hegselmann and Krause 2002) and
Gilbert’s (1997) science model suggests that homophily (McPherson et al. 2001) or
requirements for similarity or proximity, in our case defined as a required number of
matching bits, will lead to the formation of clusters among publications and cultural groups
among their authors. To be accepted by particular agents will require that many of their
cultural practices, such as their terminology, techniques and assumptions, are matched by
authors while still presenting them with something at least slightly novel. If originality and
similarity are the only constraints on scientific publications, then the value of a paper’s
contents is endogenous to science and the meaning of a publication event is a social
construction generated by the surrounding publication events. This is the situation repre-
sented by Gilbert’s (1997) model and also by the TARL (‘Topics, Aging and Recursive
Linking’) model of Boerner et al. (2004) which arbitrarily assigned ‘topics’ to each paper
and to each author, then used these to restrict who could publish with whom and on what
topic. Ideally a science model should combine these endogenous influences with exoge-
nous influences, such as a fitness landscape.
A new, exogenous source of constraint on publishing activity would be social networks
among author agents, be they informal, institutional, geographical, linguistic or cultural
in origin. For example, authors who do not share a common language are unlikely to
co-author a paper together. As Lazer and Friedman (2007) demonstrated, the network
structure among agents can affect search performance. The presence of networks, whether
endogenous or exogenous, will also raise questions of social capital. Do positions of
brokerage and closure in the network (Burt 2005; Chen et al. 2009) lead to different roles
in the generation and diffusion of novel ideas in the simulation?
As these proposals make clear, simulation models connecting, on the one hand, science
models and bibliometric data, to, on the other hand, organisational learning models and
heuristic search on fitness landscapes should provide a fruitful avenue for much research.
460 C. Watts, N. Gilbert
123
By connecting these areas, understanding is gained into the extent to which authoring and
publishing practices affect the ability to explore and exploit the range of positions in
science.
Acknowledgments This research was supported by SIMIAN (Simulation Innovation: A Node), a part ofthe UK’s National Centre for Research Methods, funded by the Economic and Social Research Council.
References
Ahrweiler, P., & Gilbert, G. N. (2005). Caffe Nero: The evaluation of social simulation. Journal of ArtificialSocieties and Social Simulation, 8(4), 14. Retrieved 26, Feb 2010 from http://jasss.soc.surrey.ac.uk/8/4/14.html.
Axelrod, R. (1997). The complexity of cooperation: agent-based models of competition and collaboration.Princeton: Princeton University Press.
Barabasi, A.-L., & Albert, R. (1999). Emergence of scaling in random networks. Science, 286, 509–512.Bentley, R. A., Ormerod, P., & Batty, M. (2009). An evolutionary model of long tailed distributions in the
social sciences. arXiv:0903.2533v1 [physics.soc-ph] March 14, 2009. Retrieved 1, May 2010 fromhttp://arxiv.org/PS_cache/arxiv/pdf/0903/0903.2533v1.pdf.
Boerner, K., Maru, J. T., & Goldstone, R. L. (2004). The simultaneous evolution of author and papernetworks. Proceedings of the National Academy of Science USA, 101(suppl. 1), S266–S273.
Bornmann, L. (2010). Does the journal peer review select the ‘best’ from the work submitted? The state ofempirical research. IETE Technical Review, 27(2), 93–96.
Burrell, Q. L. (2001). Stochastic modelling of the first-citation distribution. Scientometrics, 52(1), 3–12.Burrell, Q. L. (2007). Hirsch’s h-index: a stochastic model. Journal of Informetrics, 1, 16–25.Burt, R. (2005). Brokerage and closure: an introduction to social capital. Oxford: Oxford Univerity Press.Castellano, C., Marsili, M., & Vespignani, A. (2000). Nonequilibrium phase transition in a model for social
influence. Physical Review Letters, 85(16), 3536–3539.Chen, C., Chen, Y., Horowitz, H., Hou, H., Liu, Z., & Pellegrino, D. (2009). Towards an explanatory and
computational theory of scientific discovery. Journal of Informetrics, 3, 191–209.Clerc, M. (2006). Particle swarm optimisation. London: ISTE.Clerc, M., & Kennedy, J. (2002). The particle swarm—explosion, stability, and convergence in a multi-
dimensional complex space. IEEE Transactions on Evolutionary Computation, 6(1), 58–73.Collins, R. (1998). The sociology of philosophies: a global theory of intellectual change. London: Belknap
Press, Harvard University Press.Corne, D., Dorigo, M., & Glover, F. (Eds.). (1999). New ideas in optimisation. London: McGraw-Hill.Cyert, R. M., & March, J. G. (1963). A behavioral theory of the firm. Englewood Cliffs: Prentice-Hall.Fuller, S. (2000). The governance of science. Buckingham: Open University Press.Gilbert, N. (1997). A simulation of the structure of academic science. Sociological Research Online, 2(2), 3.
Retrieved 10, Feb 2009 from http://www.socresonline.org.uk/socresonline/2/2/3.html.Gilbert, G. N., & Troitzsch, K. G. (2005). Simulation for the social scientist. Maidenhead: Open University
Press.Glaenzel, W., & Schubert, A. (1990). The cumulative advantage function. A mathematical formulation
based on conditional expectations and its application to scientometric distributions. Informetrics,89/90, 139–147.
Glaenzel, W., & Schubert, A. (1995). Predictive aspects of a stochastic model for citation processes.Information Processing and Management, 31(1), 69–80.
Glover, F. (1989). Tabu Search—Part I. ORSA Journal on Computing, 1(3), 190–206.Glover, F. (1990). Tabu search—Part II. ORSA Journal on Computing, 2(1), 4–32.Hegselmann, R., & Krause, U. (2002). Opinion dynamics and bounded confidence models, analysis, and
simulation. Journal of Artificial Societies and Social Simulation, 5(3), 2. Retrieved 28, Sep 2009 fromhttp://jasss.soc.surrey.ac.uk/5/3/2.html.
Jin, Y., & Branke, J. (2005). Evolutionary optimization in uncertain environments–a survey. IEEE Trans-actions on Evolutionary Computation, 9(3), 303–317.
Kahneman, D., Slovic, P., & Tversky, A. (1982). Judgment under uncertainty: Heuristics and biases.Cambridge: Cambridge University Press.
Kauffman, S. (1993). The origins of order: self-organization and selection in evolution. New York: OxfordUniversity Press.
Does cumulative advantage affect collective learning in science? 461
123

Kauffman, S. (1995). At home in the universe: the search for laws of complexity. London: Penguin.Kauffman, S. (2000). Investigations. Oxford: Oxford University Press.Kirkpatrick, S., Gelatt, C. D., & Vecchi, M. P. (1983). Optimization by simulated annealing. Science, 220,
671–680.Latour, B. (1987). Science in action. Cambridge: Harvard University Press.Latour, B. (1996). Aramis or the love of technology. Cambridge: Harvard University Press.Law, J., & Callon, M. (1992). The life and death of an aircraft: A network analysis of technical change.
In W. Bijker & J. Law (Eds.), Shaping technology/building society: Studies in sociotechnical change(pp. 21–52). Cambridge: The MIT Press.
Lazer, D., & Friedman, A. (2007). The network structure of exploration and exploitation. AdministrativeScience Quarterly, 52, 667–694.
Levinthal, D. A. (1997). Adaptation on rugged landscapes. Management Science, 43(7), 934–950.Levinthal, D. A., & Warglien, M. (1999). Landscape design: Designing for local action in complex worlds.
Organization Science, 10(3), 342–357.Lotka, A. J. (1926). The frequency distribution of scientific productivity. Journal of the Washington
Academy of Sciences, 16, 317–323.March, J. G. (1991). Exploration and exploitation in organisational learning. Organization Science, 2(1),
71–87.March, J. G., & Simon, H. A. (1958). Organizations. New York: Wiley.McKelvey, B. (1999). Avoiding complexity catastrophe in coevolutionary pockets: Strategies for rugged
landscapes. Organization Science, 10(3), 294–321.McPherson, M., Smith-Lovin, L., & Cook, J. M. (2001). Birds of a feather: Homophily in social networks.
Annual Review of Sociology, 27, 415–444.Merton, R. K. (1968). The Matthew effect in science. Science, 159(3810), 56–63.Merton, R. K. (1988). The Matthew effect in science, II. Cumulative advantage and the symbolism of
intellectual property. ISIS, 79, 606–623.Mitchell, M. (1996). An introduction to genetic algorithms. Cambridge: MIT Press.Mulkay, M. J., Gilbert, G. N., & Woolgar, S. (1975). Problem areas and research networks in science.
Sociology, 9, 187–203.Newman, M. E. J. (2001a). Scientific collaboration networks. I. Network construction and fundamental
results. Physical Review E, 64, 016131.Newman, M. E. J. (2001b). Scientific collaboration networks. II. Shortest paths, weighted networks, and
centrality. Physical Review E, 64, 016132.Newman, M. E. J. (2001c). The structure of scientific collaboration networks. Proceedings of the National
Academy of Science USA, 98(2), 404–409.Newman, M. E. J. (2003). The structure and function of complex networks. SIAM Review, 45, 167–256.Price, D. J. de S. (1963). Little science, big science. New York: Columbia University Press.Price, D. J. de S. (1965). Networks of scientific papers. Science, 149(3683), 510–515.Price, D. J. de S. (1976). A general theory of bibliometric and other cumulative advantage processes.
Journal of the American Society for Information Science, 27, 292–306.Redner, S. (1998). How popular is your paper? An empirical study of the citation distribution. The European
Physical Journal B, 4, 131–134.Sandstrom, P. E. (1999). Scholars as subsistence foragers. Bulletin of the American Society for Information
Science, 25(3), 17–20.Scharnhorst, A. (1998). Citation–networks, science landscapes and evolutionary strategies. Scientometrics,
43(1), 95–106.Scharnhorst, A. (2002). Evolution in adaptive landscapes - examples of science and technology develop-
ment. Discussion Paper FS II 00–302. Berlin: Wissenschaftszentrum Berlin fur Sozialforschung.Scharnhorst, A., & Ebeling, W. (2005). Evolutionary search agents in complex landscapes. A new model for
the role of competence and meta-competence (EVOLINO and other simulation tools). arXiv:0511232.Retrieved April 16, 2010 from http://arxiv.org/abs/physics/0511232.
Schubert, A., & Glaenzel, W. (1984). A dynamic look at a class of skew distributions. A model withscientometric applications. Scientometrics, 6(3), 149–167.
Simon, H. A. (1955). On a class of skew distribution functions. Biometrika, 42(3/4), 425–440.Steels, L. (2001). The methodology of the artificial. Commentary on Webb, B. (2001) Can robots make good
models of biological behaviour? Behavioral and Brain Sciences, 24(6), 1071–1072. Retrieved May 52008 from http://www.csl.sony.fr/downloads/papers/2001/steels.html.
Watts, D. J. (2004). The ‘New’ science of networks. Annual Review of Sociology, 30, 243–270.Watts, D. J., & Strogatz, S. H. (1998). Collective dynamics of ‘small-world’ networks. Nature, 393,
440–442.
462 C. Watts, N. Gilbert
123

Weisberg, M., & Muldoon, R. (2009). Epistemic landscapes and the division of cognitive labor. Philosophyof Science, 76(2), 225–252.
Whitley, R. (2000). The intellectual and social organization of the sciences. Oxford: Oxford UniversityPress.
Wolpert, D. H., & Macready, W. G. (1997). No free lunch theorems for optimization. IEEE Transactions onEvolutionary Computation, 1(1), 67–82.
Zuckerman, H. (1977). Scientific Elite: Nobel Laureates in the United States. New York: Free Press.
Does cumulative advantage affect collective learning in science? 463
123