Modeling potassium balance in dairy cows - OPUS 4 · URIN are speci ed in gram. The uptaken amount...
21
Takustraße 7 D-14195 Berlin-Dahlem Germany Konrad-Zuse-Zentrum f¨ ur Informationstechnik Berlin J. P L ¨ ONTZKE 12 , M. B ERG 1 , A. OLANY 3 , S. L EONHARD-MAREK 4 , K. E. M ¨ ULLER 3 , S. R ¨ OBLITZ 1 Modeling potassium balance in dairy cows 1 Zuse-Institut Berlin, Takustrasse 7, 14195 Berlin, Germany 2 Corresponding author E-mail: [email protected] 3 Department of Veterinary Medicine, Clinic for Ruminants, K¨ onigsweg 65, 14163 Berlin, Germany 4 University of Veterinary Medicine, B¨ unteweg 2, 30559 Hannover, Germany ZIB-Report 13-09 (April 2013)
Transcript of Modeling potassium balance in dairy cows - OPUS 4 · URIN are speci ed in gram. The uptaken amount...

Takustraße 7D-14195 Berlin-Dahlem
GermanyKonrad-Zuse-Zentrumfur Informationstechnik Berlin
J. PLONTZKE12, M. BERG1, A. OLANY3, S. LEONHARD-MAREK4,K. E. MULLER3, S. ROBLITZ1
Modeling potassium balance in dairy cows
1Zuse-Institut Berlin, Takustrasse 7, 14195 Berlin, Germany2Corresponding author E-mail: [email protected] of Veterinary Medicine, Clinic for Ruminants, Konigsweg 65, 14163 Berlin, Germany4University of Veterinary Medicine, Bunteweg 2, 30559 Hannover, Germany
ZIB-Report 13-09 (April 2013)

Herausgegeben vomKonrad-Zuse-Zentrum fur Informationstechnik BerlinTakustraße 714195 BerlinGermany
Telefon: 030-84185-0Telefax: 030-84185-125
e-mail: [email protected]: http://www.zib.de
ZIB-Report (Print) ISSN 1438-0064ZIB-Report (Internet) ISSN 2192-7782


Modeling potassium balance in dairy cows
J. Plontzke, M. Berg, A. Olany, S. Leonhard-Marek, K. E. Muller, S. Roblitz
April 2013
Abstract
Potassium is fundamental for cell functioning including signal transduction, acid-base andwater metabolism. Since diet of dairy cows is generally rich in potassium, hypokalemia wasnot in the focus of research for long time. Furthermore, hypokalemia was not frequently diag-nosed because blood potassium content is difficult to measure. In recent years, measurementmethods have been improved. Nowadays hypokalemia is increasingly diagnosed in cows withdisorders such as abomasal displacement, ketosis or down cow syndrome, calling for intensi-fied research on this topic. In this report we describe the development of a basic mechanistic,dynamic model of potassium balance based on ordinary differential and algebraic equations.Parameter values are obtained from data of a clinical trial in which potassium balance andthe influence of therapeutic intervention in glucose and electrolyte metabolism on potassiumbalance in non-lactating dairy cows were studied. The model is formulated at a high abstrac-tion level and includes information and hypotheses from literature. This work represents afirst step towards the understanding and design of effective prophylactic feed additives andtreatment strategies.
1

Contents
1 Introduction 3
2 Model Development 32.1 Experimental Data . . . . . . . . . . . . . . . . . . . . . . . . . . . . . . . . . . . . 42.2 Units . . . . . . . . . . . . . . . . . . . . . . . . . . . . . . . . . . . . . . . . . . . . 42.3 Mechanisms . . . . . . . . . . . . . . . . . . . . . . . . . . . . . . . . . . . . . . . . 5
2.3.1 Potassium Uptake . . . . . . . . . . . . . . . . . . . . . . . . . . . . . . . . 52.3.2 Metabolic Components . . . . . . . . . . . . . . . . . . . . . . . . . . . . . 62.3.3 Potassium Homeostasis . . . . . . . . . . . . . . . . . . . . . . . . . . . . . 72.3.4 Potassium Excretion . . . . . . . . . . . . . . . . . . . . . . . . . . . . . . . 8
3 Simulation Results 93.1 Potassium Balance . . . . . . . . . . . . . . . . . . . . . . . . . . . . . . . . . . . . 9
3.1.1 Potassium Uptake . . . . . . . . . . . . . . . . . . . . . . . . . . . . . . . . 93.1.2 Metabolic Components . . . . . . . . . . . . . . . . . . . . . . . . . . . . . 93.1.3 Potassium Homeostasis . . . . . . . . . . . . . . . . . . . . . . . . . . . . . 103.1.4 Potassium Excretion . . . . . . . . . . . . . . . . . . . . . . . . . . . . . . . 11
3.2 Simulating Feeding Experiments . . . . . . . . . . . . . . . . . . . . . . . . . . . . 123.2.1 Oral Potassium Administration . . . . . . . . . . . . . . . . . . . . . . . . . 123.2.2 Varying Potassium Intake . . . . . . . . . . . . . . . . . . . . . . . . . . . . 123.2.3 Feeding Experiments . . . . . . . . . . . . . . . . . . . . . . . . . . . . . . . 13
4 Discussion 14
A Equations 15
B Initial values for ODEs 15
C Rates 16
D List of Parameters 17
2

1 Introduction
Potassium is a monovalent cation with little tendency to form complexes. In the organism, itsaction is mainly associated with the translocation of charges. It is fundamental for cell functioningbeing involved in signal transduction, acid-base- and water metabolism. Potassium is uptakencontinuously with the diet. After resorption from the intestinal tract it distributes dynamicallybetween intra- and extracellular space in all tissues. In interplay with natrium it determinescellular excitability [11]. Its main excretion pathway is via the kidneys. However, the knowledgeabout detailed mechanisms and regulation of potassium balance in mammals is still incomplete[27].
High performing dairy cows require a particular composition of nutritional ingredients adaptedto their production status. The optimal dimensioning of minerals in diet including potassium isindispensable for the prevention of disbalances. Current nutritional recommendations proposea diet low in potassium before calving [8]. Depending on soil and fertilisation, diet of dairycows is generally rich in potassium. Thus for a long time hypokalemia was not in the focusof research. Furthermore hypokalemia is not frequently diagnosed because the measurement ofserum potassium content needs special attention. In cattle and other mammals serum potassiumconcentration is maintained in the narrow range between 3.5 and 5.8 mmol/l [21]. While themajority of potassium is located intracellular, little cell damages may lead to large overestimationof serum potassium content [21]. In recent years, measurement methods have been improved, andhypokalemia has increasingly been diagnosed in cows in conjunction with metabolic and mineralicdisbalances, abomasal displacement, ketosis and recumbency [12, 15, 20], calling for intensifiedresearch on this topic.
Potassium balance closely interacts with glucose and electrolyte metabolism [9], in which post-partum veterinary treatments frequently intervene. Administration of corticosteroids or dextroseinfusions have been shown to favour hypokalemia [15, 20, 9].
In cooperation between veterinarians and mathematicians we set out to develop a mechanisticmodel for potassium balance in dairy cows. We focus on the whole organism instead of cellularlevel, with a clear emphasis on developing a mechanistic functional model, since data in this field isusually too inhomogene to reproduce it exactly. To our knowledge, no one has published work thatexplicitly describes a bio-mathematical, mechanistic model of potassium balance in dairy cows, orin another livestock species, yet. Mathematical modeling of the involved mechanisms gives insightinto the underlying biological processes and enables predictions. The long-term goal of developingsuch a model is to assist development of feed additives and effective treatment strategies, tosupport herd management decisions as well as to optimize individual cow management, and toreduce costs for dairy farmers by an overall better performance and by decreasing expenses fordrugs.
2 Model Development
The modeling objective was to obtain a system of ordinary differential (ODEs) and algebraicequations, which is able to simulate the dynamics of potassium balance in dairy cows. A practicalmathematical tool for modeling stimulatory or inhibitory effects are positive and negative Hillfunctions:
H+(S, T ;n) =(S/T )n
1 + (S/T )n, H−(S, T ;n) =
1
1 + (S/T )n
Here, S ≥ 0 denotes the influencing substance, T ≥ 0 the threshold, and n ≥ 1 the Hill coefficient.A Hill function is a sigmoidal function between zero and one that switches at the threshold S = Tfrom one level to the other with a slope specified by n.
To build up essential components for potassium balance, the model was designed on a wholeorganism level, based on clinical study data and scientific knowledge. The model consists of 8ODEs, 4 algebraic equations and 33 parameters. The mechanisms of our model are pictured in
3

the flowchart in Figure 1. Model components and their units are summarized in Table 1. Table 2contains the list of parameter values and units.
Figure 1: Schematic representation of the components and relationships in the herein presentedmechanistic model of potassium balance in the cow. Each box represents a component, the pinkcolor represents potassium cation flow. The green circles represent metabolic components andgrey arrows stimulatory or inhibitory effects. T denotes threshold dependent effects.
2.1 Experimental Data
In the Clinic for Ruminants of Freie Universitat Berlin a clinical study has been conducted tostudy potassium balance in six non lactating dairy cows.
Experimental data from this study were available for parameter estimation, which was per-formed with the algorithms NLSCON [13, 5] and simulated annealing. In the currently useddataset from the clinical study, we noticed strong interindividual variations between the six studycows, most notably in intracellular potassium and insulin measurements. As the study cohort istoo small to calculate means, some parameters are set to cow-specific values. Thus we obtain aspecific set of parameters that adapts the model to the considered cow.
2.2 Units
To obtain a model for potassium balance with uptake and excretion and to account for distributioninside the organism the model needs to handle masses and concentrations and to convert betweenthose. The in- and output components KFEED and KURIN are specified in gram. The uptakenamount of potassium from KFEED is dissolved in the non cellular compartment of the cow’s blood,KECF . For the convertion of mass to concentration we need the volume in which potassium is
4

Component Explanation Unit
y1 KECF potassium in the extracellular blood fluid mmol/ly2 KICF potassium in the intracellular blood fluid mmol/ly3 KURIN potassium excreted with urine, accumulated gy4 KGIT potassium in the gastro intestinal tract gy5 KTISS potassium in tissues except blood and bone gy6 KSAL potassium in saliva gy7 KEX total potassium excreted gy8 Insulin insulin in blood µU/mly9 pH ph of blood -y10 Glucose glucose in blood mmol/ly11 KFEED potassium content in the diet gy12 Metabolic Activity virtual compound -
Table 1: Components and units of the herein presented model for potassium balance in dairy cows.
dissolved. Blood volume calculation is made on the base of 55 ml blood per kg bodyweight asreported by Reynolds et al. [19]. The bodyweight is a cow-specific parameter (p10) given fromexperimental data. The intra- and extracellular volume of blood tissue is calculated with thehelp of the hematocrit, which represents the volume of the cellular components in the blood.Hematocrit (p17) is a cow-specific parameter obtained from experimental data.
2.3 Mechanisms
Potassium balance is determined by dietary potassium content, its resorption, homeostasis andexcretion. Potassium homeostasis is characterized by fluent intra- and extracellular drift, pow-ered by numerous passive and active forces and regulated by complex interactions which are notcompletely understood yet.
2.3.1 Potassium Uptake
Feed intake In our model the ingested amount of potassium is represented by KFEED, thedriving force of the model. The model cow ingests feed between 7:00 am and 11:00 pm, so feedingestion occurs over 16 hours/day. Between 23 pm and 7 am the cow does not ingest any feed.From the clinical study potassium uptake was given with 132.8 g per day.
0 10 20 30 40 50 605
7
8,3
9
11
Time in min
KF
EE
D in
g/h
Figure 2: Randomized (solid line) and continuous (dashed line) KFEED over an examplary timeperiod
5

To simulate KFEED one can choose between a continuous and a randomized feed intake (seeFig. 2). If the input component KFEED is randomized the model reproduces an oscillatorybehaviour of the components similar to the experimental data, see e.g. Fig. 5(a). For randomizedfeed intake, every 5 minutes a random value is created using the Matlab command randn witha standard deviation of 3 g and a mean value of 8.3 g/h to achieve a potassium uptake of 8.3 g/hover 16 hours which is equivalent to 132.8 g/d.
If the input component KFEED is modeled constantly we can observe the mechanisms moreclearly. For continuous feed intake under default condition 8.3 g/h are ingested. To conduct sim-ulations with different amounts of potassium, the hourly potassium intake can be varied.
KFEED: y11 =
{8.3, continuous option
8.3 + 3 · ξ, with ξ random variable with standard normal distribution
Resorption The resorption of potassium from diet is up to 97% in the cow and increases withincreasing amount of potassium in the rumen [18]. In our model 95% of KFEED is passing to thegastrointestinal tract KGIT with the rate KfKg.
KfKg = p30 · y11
Detailed mechanisms of potassium resorption are different throughout the different segments of thegastrointestinal tract. We pool this whole system in one component KGIT . In KGIT potassiumaccumulates and is resorbed to KECF with the rate KgKe.
KgKe = p31 · y4
In addition potassium is transported with saliva to KGIT with the rate KsKg.
KsKg = p32 · y6
KGIT :d
dty4 = KfKg −KgKe+KsKg
2.3.2 Metabolic Components
Potassium balance closely interacts with the metabolism. To keep the system in reasonable di-mensions we model a minimal number of metabolic components. The current model containsexcerpts from glucose and acid-base metabolism represented by the components Glucose, Insulin,Metabolic activity and pH.
Glucose Metabolism In vivo, insulin is secreted from pancreatic beta cells in response toelevated blood levels of nutrients such as glucose or amino acids. It causes glucose uptake intocells of liver, muscle and fat tissue, and storage as glycogen inside these tissues. Furthermore itcauses cellular uptake of potassium in insulin sensitive cells by enhancing the activity of Na/K-ATPase [27]. Glucose concentration in blood tissue is modeled with an algebraic equation.
Glucose: y10 = p1 + (y11 − 8.3) · p28
The scaled KFEED is added to a cow-specific mean value p1 received from experimental data,counting for feed dependency of blood glucose. Insulin is modeled with a growth-decay equation,whereby the growth depends on Glucose.
Insulin:d
dty8 = (
p3p1
· y10 − y8) · p2
Thus, in our simulation the curve for Insulin is similar to Glucose, but slightly delayed in time.
6

Acid-base Metabolism Metabolic activity is a dimensionless value, which depends on Glucoseand the amount of potassium in KGIT , because potassium is uptaken together with all othernutritional components.
Metabolic activity: y12 = 0.1 · y4 + y10
The Metabolic activity component has been introduced with the purpose to model pH dependencyof metabolism. The pH has a cow-specific mean value, received from experimental data, fromwhich we subtract 1
40 of Metabolic activity to obtain a decaying pH when Metabolic activity ishigh and vice versa.
pH: y9 = 7.5 − y1240
2.3.3 Potassium Homeostasis
Potassium homeostasis in the cow is characterized by a consistent flow of potassium cations be-tween different compartments and tissues, in our model represented by the components KICF ,KECF , KTISS and KSAL.
In the normokalemic cow, serum potassium concentration KECF is maintained between 3.5 to5.8 mmol/l [21]. High serum potassium levels (hyperkalemia) lead to heart arrythmia and othersevere dysfunctions in excitable cells [23]. Low serum potassium levels (hypokalemia) lead to alack of motility and excitability of cells [22]. In our model after resorption from KGIT to KECF ,potassium is moved to the intracellular fluid KICF , excreted with urine KURIN and sudor, storedin tissue KTISS or recycled via the saliva KSAL to KGIT .
Saliva In our model the component KSAL represents the amount of potassium in the saliva.Potassium in KSAL is nourished by KECF with the rate KeKs.
KeKs = p18 · y1
Depending on diet, cows produce up to 138-179 l saliva per day [24] with a varying content ofpotassium [26]. Saliva is swallowed with the feed to the rumen, in the model from KSAL to KGIT
with the rate KsKg.
KSAL:d
dty6 =
KeKs
con−KsKg,
where con =1mol
39.0983g
p10·(1−p17)·55·10−3· lkg
≈ 465p10kg ·(1−p17)
mmoll·g is the cow-specific conversion factor from g
to mmol/l in KECF , which is calculated using the molar mass of potassium (39.0983 gmol ) and the
assumption that the cow has 55 ml blood per kg body weight (see 2.2).
Cellular Uptake In our model potassium is shifted from KECF to KICF with the rate KeKi,which is basically the constant parameter p8. Under certain conditions KeKi is modified as follows.If Insulin rises and passes a cow-specific mean value (p3), it enhances cellular uptake with the ratep9. If pH is above the cow-specific mean value p20, KeKi is increased by p21. If potassium inKECF drops under p33 = 2 mmol/l the complete rate KeKi is slowly switched off and becomes 0,to avoid KECF from dropping more.
KeKi = (p8 + p9 ·H+(y8, p3; 10)) ·H+(y1, p33; 2) · (1 + p21 ·H+(y9, p20; 10))
Cellular Exit Potassium drifts from KICF to KECF with the rate KiKe. Under certain condi-tions the KiKe rate is modified as follows. If pH drops under the threshold p20, up to 100% morepotassium drifts to KECF . If KECF drops under p29, up to 100% more of potassium drifts fromKICF to KECF . If KICF drops under p23, the rate KiKe gets slowly faded out to prevent KICF
from getting too small. If KICF exceeds p14, the rate is increased by p19.
7

KiKe = (1 +H−(y1, p29; 10)) · p5 · (1 +H−(y9, p20; 10)) ·H+(y2, p23; 2) · (1 + p19 ·H+(y2, p14; 2))
KECF :d
dty1 = con · (KgKe−KeKu) −KeKt+KtKe+KiKe−KeKi−KeR−KeKs
KICF :d
dty2 = (KeKi−KiKe) · convol
where convol = 1−p17p17
is the conversion factor for volume of extracellular fluid to volume of intra-cellular fluid, which is calculated using the cow-specific hematocrit p17.
Tissue Storage KTISS represents the potassium content in all tissues except blood and bonetissue. The initial value of KTISS depends on the bodyweight. Bennink et al. [1] studied thepotassium content of different tissues in cattle. They found a mean potassium content of 3 g perkg bodyweight, which we used to calculate the initial value for KTISS , representing the reservoirfor potassium at the beginning of the simulation. KTISS serves as a compensating potassiumstorage and fills up from KECF with the rate KeKt, which is only active when KGIT > p15.
Potassium leaves KTISS to KECF with the rate KtKe only when KGIT < p15. KtKe isintended to increase when the value of KECF decreases, so the current rate KtKe is a multipleof p27 − KECF . If KTISS has diminished by 1% KtKe rate is faded out with the help of a Hillfunction to account for the fact that only a part of potassium in the tissues can be mobilized forthe extracellular fluid.
KeKt = H+(y4, p15; 10) · p25 · y1KtKe = H−(y4, p15; 10) · p26 · (p27 − y1) ·H+(y5, 0.99 · y5(0); 100)
KTISS :d
dty5 =
1
con(KeKt−KtKe)
2.3.4 Potassium Excretion
Potassium is excreted mainly with urine [26], in our model KURIN , with the rate KeKu. Inaddition, saliva, milk and sudor contain remarkable amounts of potassium. In our model potassiumcontent of saliva is represented by KSAL (see 2.3.3 for detailed mechanism). Potassium in sudoris fed by KECF with the rate KeR.
KeR = p4 · y1Milk did not play a role in the development of the model in its present form, since the used datasethas been collected in non lactating cows.
It is still not fully understood how serum potassium excretion is regulated exactly. Thereare known mechanisms and evidence based hypotheses. In hyperkalemia, potassium excretion isregulated by aldosterone [17], a mineralocorticoid from the cortex of the adrenal gland. In ourmodel aldosterone is activated when KECF rises above p24 = 5 mmol/l by adding p13 · 100% onKeKu and thereby enhancing excretion. There is strong evidence for a feedforward regulation ofpotassium excretion, because an increase in excretion can be observed without significant rise inserum potassium [10]. There are three supposed mechanisms for feedforward regulation: (1) agut receptor, which enhances potassium excretion after a potassium rich meal; (2) a portal veinreceptor, which is confirmed to be bumethanid sensitive in the rat and (3) regulation from thecentral nervous system [14, 10]. In our model we account for feedforward regulation via a directdependency of KeKu on the actual value of KGIT . Furthermore KeKu prevents KECF fromgrowing above life-threatening levels as for KECF > 8 mmol/l [4] a Hill function increases theexcretion via urine.
KURIN :d
dty3 = KeKu
8

KeKu = (1 + p13 ·H+(y1, p24; 5)) · p6 · y4 · (1 + p16 · y1 ·H+(y1, p22; 10))
To calculate the amount of total potassium excreted we introduce the component KEX . Thiscomponent simply consists of the sum of the rates with which potassium is excreted, i.e. withurine, sudor, and feces.
KEX :d
dty7 = KeKu+
KeR
con+ 0.05 · y11
3 Simulation Results
In order to revise the model mechanisms we conducted experiments and evaluated the simula-tion outcomes quantitatively. The experimental data from the clinical study are noisy and differbetween individual cows. Especially the values for KICF , the measured potassium content inerythrocytes, show a strong interindividual variability. This phenomenon has been described byChristinaz et al. [2], who found it to be based on genetic variation with no breed influence. Inthe same study [2], cows were found with erythrocyte potassium concentrations between 7 and70 mmol/l, while most individuals were found to have an erythrocyte potassium concentrationof around either 20 mmol/l or 50 mmol/l. In our study animals we observe a similar tendency.Furthermore, experimental data of insulin show strong interindividual variations, too. Therefore,some parameters have general values which stay constant for all cows, whereas some parameterswere set individually for each cow (see Table 2 in Appendix).
To solve the differential equations we use a linearly implicit Euler method with extrapolationimplemented in the code LIMEX [6]. In section 3.1 we first present outcomes from the simulationof potassium balance without intervention. To verify the mechanistic functions of the model, insection 3.2.1 we vary the potassium intake by simulating the administration of a potassium bolusas well as varying the feed potassium content as previously studied in field feeding experiments.
3.1 Potassium Balance
In this section we present the simulation outcomes including experimental data from one of the sixstudy cows. We present two kinds of simulation: Every component will be explained and shownunder both randomized and constant input conditions. The starting point of simulations (t = 0)equates 6:00 am.
3.1.1 Potassium Uptake
KFEED (Figure 3(a)) is input and driving force of the model. The clinical study involved apotassium intake of 132.8 g/d. This corresponds to a diet with 1.13 % potassium in dry matter(DM), a sufficient to elevated potassium supply for the non lactating study animals. Simulationof KFEED can be conducted randomized or constant, in both cases the mean potassium uptakeis supposed to be 8.3 g/h over 16 h (for explanation see 2.3.1).
The trend induced by KFEED continues through the whole system. In Figure 3(b) we observethe simulation outcome for the component KGIT , representing the potassium content of the gas-trointestinal tract. As potassium accumulates herein we observe an accumulation as long as thecow constantly ingests feed and a decline when no feed is ingested.
3.1.2 Metabolic Components
Simulation outcomes for the metabolic components are presented in Figure 4. For Glucose (a) andInsulin (b) experimental data are extremely noisy. Furthermore, the interindividual variabilityfor insulin in the experimental data is very high. As our aim for the metabolic components wasto obtain their mechanistic influence on potassium metabolism, we model mechanisms with littledetails (see 2.3.2). Glucose depends on the feed intake KFEED and Insulin follows Glucose slightlydelayed in time. The simulation of the virtual component Metabolic activity is similar to KGIT
9

0 10 20 30 40 500
2
4
6
8
10
12
14
16
18
Time in h
KF
EE
D in
g/h
(a) KFEED
0 10 20 30 40 500
5
10
15
20
25
Time in h
KG
IT in
g
(b) KGIT
Figure 3: Simulation outcome for potassium uptake.
on which it mainly depends. Simulation outcome for pH is contrary to Metabolic activity. WhenMetabolic activity is high pH decays and vice versa.
0 10 20 30 40 502.5
3
3.5
4
4.5
5
Time in h
Glu
cose
in m
mol
/l
(a) Glucose
0 10 20 30 40 5010
15
20
25
30
35
Time in h
Insu
lin in
µU
/ml
(b) Insulin
0 10 20 30 40 503
4
5
6
7
8
Time in h
Met
abol
ic A
ctiv
ity
(c) Metabolic activity
0 10 20 30 40 507.3
7.32
7.34
7.36
7.38
7.4
7.42
7.44
7.46
Time in h
pH
(d) pH
Figure 4: Simulation outcome for metabolic components
3.1.3 Potassium Homeostasis
In Figure 5 we show the simulation outcome for intra- and extracellular potassium as well as thebasic characteristics of experimental data. As previously reported by Christinaz et al. [2] wewere confronted with a high interindividual variability in the experimental data for intracellularpotassium. To overcome this difficulty we introduced cow-specific parameters. Nevertheless,during parameter estimation it turned out to be complicated also for general parameters to find asetting that fits the data for all six study cows simultaniously.
Simulation outcomes for the tissue storage mechanism (KTISS) and saliva (KSAL) representthe actual potassium content in these components (Figure 6).
10

0 10 20 30 40 502.5
3
3.5
4
4.5
5
5.5
6
Time in h
KE
CF in
mm
ol/l
(a) KECF
0 10 20 30 40 5016
18
20
22
24
26
28
30
Time in h
KIC
F in
mm
ol/l
(b) KICF
Figure 5: Simulation outcome for intra- and extracellular potassium distribution
0 10 20 30 40 501478
1480
1482
1484
1486
1488
1490
Time in h
KT
ISS in
g
(a) KTISS
0 10 20 30 40 500.42
0.44
0.46
0.48
0.5
0.52
0.54
Time in h
KS
AL in
g
(b) KSAL
Figure 6: Simulation outcome of recycling and storage mechanisms
3.1.4 Potassium Excretion
The main part of potassium is excreted via KURIN (Figure 7(a)). In the simulation outcomeand in the experimental data potassium is accumulated over time. In our model the componentKURIN depends on uptake and extracellular content. The very complex renal mechanisms aremodeled at a high abstraction level. In Figure 7(b) we observe total potassium excreted in themodel which is the sum of potassium excreted via urine, feces and sudor. In the lactating cowremarkable amounts are also excreted with the milk, which is not included in our model yet, asexperimental data was taken in non lactating dairy cows.
0 10 20 30 40 500
50
100
150
200
250
300
Time in h
KU
RIN
in g
(a) KURIN
0 10 20 30 40 500
50
100
150
200
250
300
Time in h
KE
X in
g
(b) total potassium excretion
Figure 7: Simulation outcome for potassium excretion
11
3.2 Simulating Feeding Experiments
3.2.1 Oral Potassium Administration
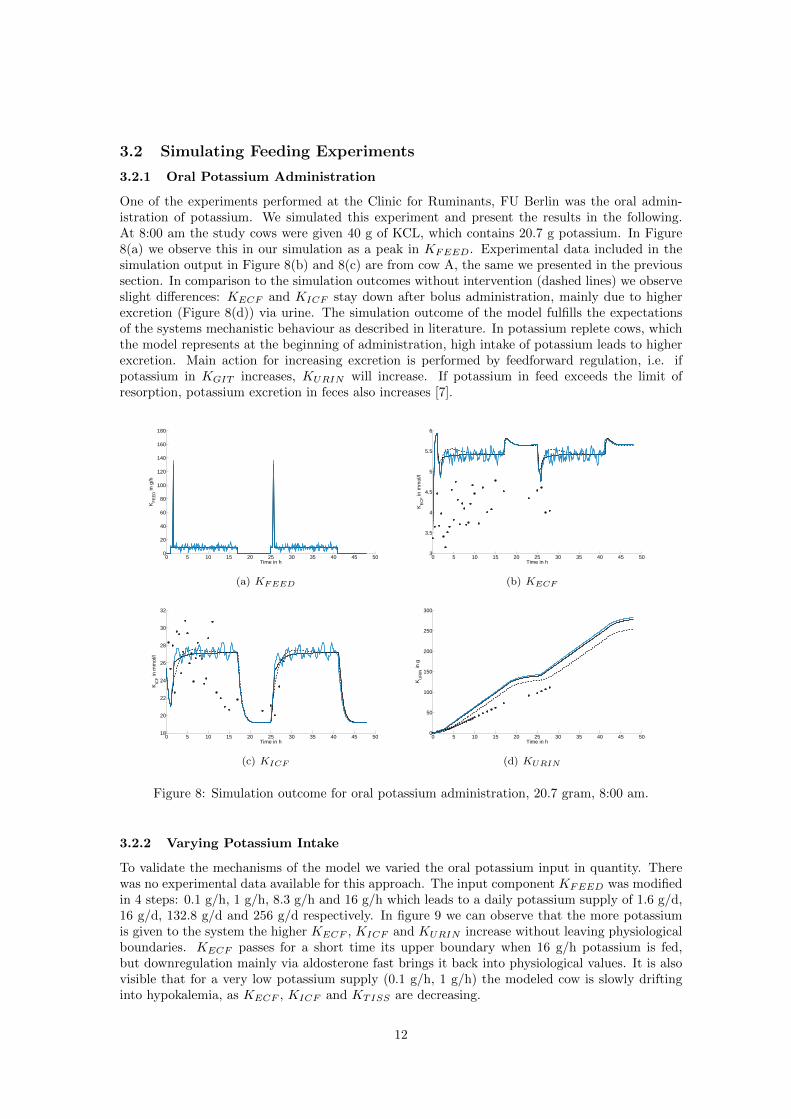
One of the experiments performed at the Clinic for Ruminants, FU Berlin was the oral admin-istration of potassium. We simulated this experiment and present the results in the following.At 8:00 am the study cows were given 40 g of KCL, which contains 20.7 g potassium. In Figure8(a) we observe this in our simulation as a peak in KFEED. Experimental data included in thesimulation output in Figure 8(b) and 8(c) are from cow A, the same we presented in the previoussection. In comparison to the simulation outcomes without intervention (dashed lines) we observeslight differences: KECF and KICF stay down after bolus administration, mainly due to higherexcretion (Figure 8(d)) via urine. The simulation outcome of the model fulfills the expectationsof the systems mechanistic behaviour as described in literature. In potassium replete cows, whichthe model represents at the beginning of administration, high intake of potassium leads to higherexcretion. Main action for increasing excretion is performed by feedforward regulation, i.e. ifpotassium in KGIT increases, KURIN will increase. If potassium in feed exceeds the limit ofresorption, potassium excretion in feces also increases [7].
0 5 10 15 20 25 30 35 40 45 500
20
40
60
80
100
120
140
160
180
Time in h
KF
EE
D in
g/h
(a) KFEED
0 5 10 15 20 25 30 35 40 45 503
3.5
4
4.5
5
5.5
6
Time in h
KE
CF in
mm
ol/l
(b) KECF
0 5 10 15 20 25 30 35 40 45 5018
20
22
24
26
28
30
32
Time in h
KIC
F in
mm
ol/l
(c) KICF
0 5 10 15 20 25 30 35 40 45 500
50
100
150
200
250
300
Time in h
KU
RIN
in g
(d) KURIN
Figure 8: Simulation outcome for oral potassium administration, 20.7 gram, 8:00 am.
3.2.2 Varying Potassium Intake
To validate the mechanisms of the model we varied the oral potassium input in quantity. Therewas no experimental data available for this approach. The input component KFEED was modifiedin 4 steps: 0.1 g/h, 1 g/h, 8.3 g/h and 16 g/h which leads to a daily potassium supply of 1.6 g/d,16 g/d, 132.8 g/d and 256 g/d respectively. In figure 9 we can observe that the more potassiumis given to the system the higher KECF , KICF and KURIN increase without leaving physiologicalboundaries. KECF passes for a short time its upper boundary when 16 g/h potassium is fed,but downregulation mainly via aldosterone fast brings it back into physiological values. It is alsovisible that for a very low potassium supply (0.1 g/h, 1 g/h) the modeled cow is slowly driftinginto hypokalemia, as KECF , KICF and KTISS are decreasing.
12

0 20 40 60 80 100 1203
3.5
4
4.5
5
5.5
6
Time in h
KE
CF in
mm
ol/l
0.1 g/h
1 g/h
8.3 g/h
16 g/h
(a) KECF
0 20 40 60 80 100 12015
20
25
30
35
40
45
Time in h
KIC
F in
mm
ol/l
(b) KICF
0 20 40 60 80 100 1200
200
400
600
800
1000
1200
Time in h
KU
RIN
in g
(c) KURIN
0 20 40 60 80 100 1201440
1460
1480
1500
1520
1540
1560
1580
Time in h
KT
ISS in
g
(d) KTISS
Figure 9: Simulation outcome for oral potassium supply variation with 0.1 g/h, 1.0 g/h, 8.3 g/hand 16.0 g/h.
3.2.3 Feeding Experiments
In another attempt oriented on feeding experiments by Fisher et al. [7] and Pradhan et al. [16]we varied KFEED according to their study design. Fisher et al. [7] studied potassium excess inlactating dairy cows, feeding total mixed ration with 1.6 %, 3.1 % and 4.6 % potassium. Pradhanet al. [16] studied potassium depletion in lactating cows, feeding a diet with 0.15 %. The inputcomponent KFEED was modified according to the studies with 1.3 g/h, 23 g/h, 46 g/h and 64g/h, leading to a daily potassium supply of 21 g/d, 368 g/d, 738 g/d and 1028 g/d, respectively.The results are shown in Figure 10. Especially for the medium potassium supply (orange) themodel reproduces the measurements notably accurate.
0 20 40 60 80 100 1203
3.5
4
4.5
5
5.5
6
Time in h
KE
CF in
mm
ol/l
(a) KECF
0 5 10 15 20 250
100
200
300
400
500
600
700
800
900
1000
Time in h
KU
RIN
in g
(b) KURIN
Figure 10: Feed potassium variations of 1.3 g/h (grey), 23 g/h (blue), 46 g/h (orange) and 64 g/h(green) as given from the studies of [7] and [16]. In (b) we compare data points for potassium inurine from the study [7] with simulation curves.
13

4 Discussion
With our model we are able to simulate dynamics of potassium balance at a whole animal level.The structural design of the model is based on the available experimental data and mechanismsfrom literature. The motivation to build such a model was an increased interest in hypokalemiain the dairy cow in recent clinical research. Hypokalemia is clinically relevant in postpartum highproducing dairy cows. It can be caused by low feed intake, high milk production, hypovolemia,hyperglycemia and metabolic alkalosis [3], corticoid treatment [20] and exo- and endogenous insulinrelease [9]. A strong correlation between hypokalemia and displaced abomasum has been observedin several studies [3]. Detailed mechanisms are not entirely identified yet and optimal treatmentstrategies are currently under development. Developing a model for mechanistic relationshipsof potassium balance in dairy cows is a first holistic approach to gain insight into underlyingmechanisms.
When comparing our simulation results with the feeding experiments by Fisher et al. [7] weobserve a qualitatively satisfying outcome in the forecast of the excretion of potassium via urinefor a given input. Variations can be attributed to individuality of potassium measurements indifferent studies. Contrary to our model, the cows in Fisher’s study produced milk, which containsremarkable amounts of potassium, and milk production itself influences in the functioning of theentire metabolism.
In the default condition the body weight of the modeled cow is 600 kg with 33 l blood volume.The total potassium in blood tissue, i.e. model components KICF and KECF at the initial timeis 13.19 g. Therefore the concentration of potassium in blood tissue is 0.46 g/l. Compared to3 g/kg mean potassium concentration of tissues as found by Bennink et al. [1] the potassiumconcentration in blood tissue used in our model is very low. Though we show the experimentaldata from a cow with low potassium erythrocyte content, this can be explained by differentpotassium concentrations in the different tissues, indicating a low concentration of potassium inblood tissue, much lower than mean. Vogel et al. [25] compared the potassium content of serumand erythrocytes in different mammalian species and found important differences also amongspecies. Their as well as our findings can possibly be traced back to uncertainties in measuringmethods, which complicates comparability of studies.
A quantitatively satisfying fit between experimental data and simulation results could not beobtained due to large interindividual variations in the data. Overall, more experimental data formore components involved in potassium balance in more individuals is needed to perform suitableparameter estimation for high and low potassium cows and to extend the model. With a suitableset of data, milk would be a promising approach to fit the model to the individual cow as Ward[26] found potassium milk content to be constant in the individual cow. As hypokalemia mainlyoccurs in lactating dairy cows, modeling potassium excretion via milk will be indispensable whenin a next step we will explore mechanisms for hypokalemia.
The herein presented model and performed experiments are a first attempt to simulate potas-sium balance in dairy cows. There are still several mechanistic shortcomings, e.g. in renal excretionmechanisms, potassium storage dynamics and mechanisms of hypokalemia, which will be refinedwith the corresponding experimental data in future.
14

A Equations
The equations listed below are the full notations of the equations developed in Section 2.Parameters are denoted with p and are numbered according to Table 2.
d
dty1 = con · (KgKe−KeKu) −KeKt+KtKe+KiKe−KeKi−KeR−KeKs
d
dty2 = (KeKi−KiKe) · convol
d
dty3 = KeKu
d
dty4 = KfKg −KgKe+KsKg
d
dty5 =
1
con(KeKt−KtKe)
d
dty6 =
KeKs
con−KsKg
d
dty7 = KeKu+
KeR
con+ 0.05 · y11
d
dty8 = (
p3p1
· y10 − y8) · p2
y9 = 7.5 − y1240
y10 = p1 + (y11 − 8.3) · p28
y11 =
{8.3, continuous option
8.3 + 3 · ξ,with ξ random variable with standard normal distribution
y12 = 0.1 · y4 + y10
B Initial values for ODEs
y1(0) = p11
y2(0) = p12
y3(0) = 0
y4(0) = 3.073
y5(0) = p10 · 0.86 · 2.9 − 1
con· (
p12convol
+ p11)
y6(0) = 0.434
y7(0) = 0
y8(0) = p3
15

C Rates
KfKg = p30 · y11KgKe = p31 · y4KeKs = p18 · y1KsKg = p32 · y6KeKi = (p8 + p9 ·H+(y8, p3; 10)) ·H+(y1, p33; 2) · (1 + p21 ·H+(y9, p20; 10))
KiKe = (1 +H−(y1, p29; 10)) · p5 · (1 +H−(y9, p20; 10)) ·H+(y2, p23; 2) · (1 + p19 ·H+(y2, p14; 2))
KtKe = H−(y4, p15; 10) · p26 · (p27 − y1) ·H+(y5, 0.99 · y5(0); 100)
KeKt = H+(y4, p15; 10) · p25 · y1KeR = p4 · y1
KeKu = (1 + p13 ·H+(y1, p24; 5)) · p6 · y4 · (1 + p16 · y1 ·H+(y1, p22; 10)
16

D List of Parameters
No. Value Unit Cow Explanation
specifity
p1 3.73 mmoll y Glucose mean value
p2 28 1h n Scaling factor in insulin equation
p3 22 µUml y Insulin mean value
p4 0.0002 1h n Fraction of y1 per hour leaving via sudor
p5 14.04 mmol/lh n Constant rate KICF to KECF
p6 0.05 1h n Scaling factor for influence of KGIT on KeKu
p7 75 - n State of random value
p8 14.91 mmol/lh n Constant rate KECF to KICF
p9 9.99 mmol/lh n KeKi rate amplification through insulin
p10 600 kg y Body weight
p11 3.43 mmoll y Initial value KECF
p12 25.42 mmoll y Initial value KICF
p13 6.01 - n KeKu amplification through aldosterone
p14 4 mmoll n Threshold for KICF
p15 22 g n Threshold for KGIT influencing KeKt and KtKe
p16 3 lmmol n Scaling factor for KECF influencing KeKu
p17 0.309 - y Hematocrit
p18 0.08 1h n Fraction of KECF transported to KSAL
p19 0.1373 - n KiKe amplification through high KICF levels
p20 7.38 - y PH mean value
p21 0.1085 - n PH dependent increase of KeKi rate
p22 8 mmoll n Threshold for KECF
p23 15 - n Threshold for KICF
p24 5 mmoll n Threshold for KECF
p25 0.2898 1h n Fraction of KECF moved to KTISS
p26 2.15 1h n Scaling factor for KtKe
p27 5.95 mmoll n Threshold for KECF
p28 3 mmol/lg n Scaling factor KFEED to Glucose
p29 3 mmoll n Threshold for KECF
p30 0.95 - n Fraction of KFEED transported to KGIT per hour
p31 0.35 1h n Fraction of KGIT transported to KECF per hour
p32 0.8 1h n Fraction of KSAL transported to KGIT per hour
p33 2 mmoll n Threshold for KECF
Table 2: Parameter values.
17
References[1] Bennink, M., Ward, G., Johnson, J., and Cramer, D. Potassium content of carcass components and internal
organs of cattle as determined by 40k and atomic absorption spectrometry. Journal of Animal Science 27, 3(1968), 600–603.
[2] Christinaz, P., and Schatzmann, H. High potassium and low potassium erythrocytes in cattle. The Journalof Physiology 224, 2 (1972), 391–406.
[3] Constable, P., Grunberg, W., Staufenbiel, R., and Stampfli, H. R. Clinicopathologic variables associatedwith hypokalemia in lactating dairy cows with abomasal displacement or volvulus. Journal of the AmericanVeterinary Medical Association 242, 6 (2013), 826–835.
[4] Dennis, J., and Harbaugh, F. The experimental alteration of blood potassium and calcium levels in cattle.Am. J. Vet. Res 9 (1948), 20–25.
[5] Deuflhard, P. Newton Methods for Nonlinear Problems: Affine Invariance and Adaptive Algorithms. No. 35in Springer Series in Computational Mathematics. Springer Verlag, Berlin, 2004.
[6] Deuflhard, P., and Nowak, U. Extrapolation integrators for quasilinear implicit ODEs. Univ., Sonder-forschungsbereich 123, 1985.
[7] Fisher, L., Dinn, N., Tait, R., and Shelford, J. Effect of level of dietary potassium on the absorption andexcretion of calcium and magnesium by lactating cows. Canadian Journal of Animal Science 74, 3 (1994),503–509.
[8] Goff, J. P. Macromineral physiology and application to the feeding of the dairy cow for prevention of milkfever and other periparturient mineral disorders. Animal feed science and technology 126, 3 (2006), 237–257.
[9] Grunberg, W., Morin, D. E., Drackley, J. K., and Constable, P. D. Effect of rapid intravenous ad-ministration of 50% dextrose solution on phosphorus homeostasis in postparturient dairy cows. Journal ofveterinary internal medicine 20, 6 (2006), 1471–1478.
[10] Lee, F. N., Oh, G., McDonough, A. A., and Youn, J. H. Evidence for gut factor in k+ homeostasis.American journal of physiology Renal physiology 293(2) (2007), 541–547.
[11] Macknight, A. D. C., et al. Epithelial transport of potassium. Kidney Int 11, 6 (1977), 391–414.
[12] Mokhber Dezfouli, M., Eftekhari, Z., Sadeghian, S., Bahounar, A., and Jeloudari, M. Evaluation ofhematological and biochemical profiles in dairy cows with left displacement of the abomasum. ComparativeClinical Pathology (2011), 1–5.
[13] Nowak, U., and Weimann, L. NLSCON, Nonlinear Least Squares with nonlinear equality CONstraints, 1993.http://www.zib.de/en/numerik/software/codelib/nonlin.html retrieved 16 April 2013.
[14] Oh, K. S., Oh, Y. T., Kim, S., Kita, T., Kang, I., and Youn, J. Gut sensing of dietary k(+) intake increasesrenal k(+)excretion. American journal of physiology Regulatory, integrative and comparative physiology 301(2)(2011), 421–429.
[15] Peek, S. F., Divers, T., Guard, C., Rath, A., Rebhun, W., et al. Hypokalemia, muscle weakness, andrecumbency in dairy cattle. Veterinary Therapeutics 1, 4 (2000), 235–244.
[16] Pradhan, K., and Hemken, R. Potassium depletion in lactating dairy cows. Journal of dairy science 51, 9(1968), 1377–1381.
[17] Rabinowitz, L. Aldosterone and potassium homeostasis. Kidney international 49(6) (1996), 1738–1742.
[18] Reynolds, C., Huntington, G., Tyrrell, H., and Reynolds, P. Net absorption of macrominerals byportal-drained viscera of lactating holstein cows and beef steers. Journal of dairy science 74, 2 (1991), 450–459.
[19] Reynolds, M. Plasma and blood volume in the cow using the t-1824 hematocrit method. The Americanjournal of physiology 173(3) (1953), 421–427.
[20] Sattler, N., Fecteau, G., Girard, C., and Couture, Y. Description of 14 cases of bovine hypokalaemiasyndrome. Veterinary record 143, 18 (1998), 503–507.
[21] Sejersted, O., and Sjøgaard, G. Dynamics and consequences of potassium shifts in skeletal muscle andheart during exercise. Physiological Reviews 80, 4 (2000), 1411–1481.
[22] Turck, G., and Leonhard-Marek, S. Potassium and insulin affect the contractility of abomasal smoothmuscle. Journal of dairy science 93, 8 (2010), 3561–3568.
[23] Unwin, R. J., Luft, F. C., and Shirley, D. G. Pathophysiology and management of hypokalemia: a clinicalperspective. Nature reviews Nephrology 7(2) (2011), 75–84.
[24] Van’t Klooster, A. T., Rogers, P., and Gaillard, B. D. Observations on the digestion and absorptionof food along the gastro-intestinal tract of fistulated cows. No. 69. H. Veenman, 1969.
[25] Vogel, G., and Ketz, H. Vergleichende untersuchungen zum natrium-, kalium-und glukosegehalt von serumund erythrozyten. Journal of Comparative Physiology A: Neuroethology, Sensory, Neural, and BehavioralPhysiology 38, 6 (1956), 558–562.
[26] Ward, G. M. Potassium metabolism of domestic ruminantsa review. Journal of Dairy Science 49, 3 (1966),268–276.
[27] Youn, J. H., and McDonough, A. A. Recent advances in understanding integrative control of potassiumhomeostasis. Annual review of physiology 71 (2009), 381–401.
18