Modeling of Vapour Liquid Equilibrium Data for Thyme ... · Vapour Liquid Equilibrium (VLE) data...
5
Volume 4 • Issue 1 • 1000145 J Chem Eng Process Technol ISSN: 2157-7048 JCEPT, an open access journal Research Article Open Access Varasteh et al., J Chem Eng Process Technol 2013, 4:1 DOI: 10.4172/2157-7048.1000145 Research Article Open Access Modeling of Vapour Liquid Equilibrium Data for Thyme Essential Oil Based on UNIQUAC Thermodynamic Model A. Varasteh 1 *, H.A. Tahmasebi 2 and R. Gheshlaghi 3 1 Chemical Engineering, Islamic Azad University, Shahrood Branch, Semnan, Shahrood, Iran 2 Chemical Engineering Department, Islamic Azad University, Quchan Branch, Asian Road, Quchan, Iran 3 Department of Chemical Engineering, Ferdowsi University of Mashhad, Mashhad, Khorasan, Iran *Corresponding author: A. Varasteh, Chemical Engineering, Islamic Azad University, Shahrood Branch, Semnan, Shahrood, Iran, E-mail: [email protected] Received August 07, 2012; Accepted December 08, 2012; Published December 11, 2012 Citation: Varasteh A, Tahmasebi HA, Gheshlaghi R (2013) Modeling of Vapour Liquid Equilibrium Data for Thyme Essential Oil Based on UNIQUAC Thermodynamic Model. J Chem Eng Process Technol 4: 146 doi:10.4172/2157- 7048.1000145 Copyright: © 2013 Varasteh A, et al. This is an open-access article distributed under the terms of the Creative Commons Attribution License, which permits unrestricted use, distribution, and reproduction in any medium, provided the original author and source are credited. Abstract Vapour Liquid Equilibrium (VLE) data for natural ingredients and essential oils has not studied at all yet. It is because of complexity of these mixtures. In this study, the equilibrium concentration of the mixture components was studied by using the UNIQUAC model at different pressure. This model is capable of determining temperature between 70°C to 170°C and the pressure limits 30 Kpa to 202 Kpa. The modeling’s results showed thymol in the liquid phase were increased from 50% molar to 90% molar in constant pressure by increasing temperature from bubble point to dew point’s temperature. Thymol concentration in the liquid phase was increased from 42% molar to 78% molar by increasing water concentration of the mixture at a constant pressure of 100 Kpa and constant temperature 177°C. Another obtaining result showed that thymol concentration in the triple mixture, which includes 30% molar water, 35% molar thymol and 35% molar Cymene in liquid phase, was increased from 60% molar to 82% molar at constant temperature of 177°C by decreasing pressure from 100 Kpa to 20 Kpa. Keywords: yme; Essential oil; VLE; UNIQUAC; Modeling; ermodynamic phases Introduction ymus vulgaris plants of the family lamiaceae are fragrant [1]. Distribution of 215 species worldwide and 14 species of ymus vulgaris has been reported in Iran [2]. is plant food is as traditional as the digestive, antispasmodic, antitussive, and due to the main compound thymol, in the food industry, pharmaceutical, health and beauty uses [3]. e aqueous extract, aqueous Ethanol and Propylene Glycol in the preparation of ymus vulgaris shampoo, creams and ointments are used [4]. is plant is antifungal effects, antibacterial and ant parasite and its therapeutic efficacy for treatment of asthma, recurrent dry cough and bronchitis has been proved. is medical plant, syrups, pill, incense and extracts were prepared and has approved by the drug unit of supervision, ministry of health and medical education [5]. e treatment plant, flowering shoot and its leaves are dried. World wages species ymus vulgaris (ymus Daensis Celak) are distributed in different regions of Qazvin province. is plant is propagated by seed and can be divided. thymol is the main compound of ymus vulgaris plant and the molar amount of thymol dittany have been reported about 40% to more than 70% of the world wages. Based on the results of extraction ymus vulgaris world wages sample collected from the Hamedan which includes 26 compounds 95.1% of the thymol with 44.7%, Para Cymene with 18.6% and Alpha Trypen with 16.5% in most combinations [6]. Garden ymus vulgaris every year in large areas of farmland in Europe, North Africa and the United states is grown. In Figure 1 and Table 1 the essential oils yield is 2 to 3 percent and thymol in the essential oil has been reported about 40 to 65 percent [7]. Gas chromatography Chemical analysis was performed on a Hewlett–Packard 5890 series II gas chromatograph fitted with a HP-5 capillary column (25 m×0.20 mm, film thickness 0.33 µm). e carrier gas was hydrogen at a flow of 1.0 ml min-1 and a split ratio 1:100. e column temperature was programmed from 60–250°C at 2.0°C min-1; the injector temperature was 250°C and the detector (FID) temperature was 280°C [8]. Gas chromatography/mass spectroscopy e analysis was performed on a Hewlett–Packard 5890 series II gas chromatograph coupled to a HP 5970 mass selective detector using a fused silica capillary column HP-5 (25 m×0.20 mm, film thickness 0.33 µm). e column temperature was programmed from 60-250°C Intensity 3000 2000 1000 0 3.3507 4.287 8.6997 2.494 3.072 0 5 10 15 20 min Figure 1: Chromatogram of the Thyme essential oil. Journal of Chemical Engineering & Process Technology J o u r n a l o f C h e m i c a l E n g i n e e r i n g & P r o c e s s T e c h n o l o g y ISSN: 2157-7048
Transcript of Modeling of Vapour Liquid Equilibrium Data for Thyme ... · Vapour Liquid Equilibrium (VLE) data...
Volume 4 • Issue 1 • 1000145J Chem Eng Process Technol ISSN: 2157-7048 JCEPT, an open access journal
Research Article Open Access
Varasteh et al., J Chem Eng Process Technol 2013, 4:1 DOI: 10.4172/2157-7048.1000145
Research Article Open Access
Modeling of Vapour Liquid Equilibrium Data for Thyme Essential Oil Based on UNIQUAC Thermodynamic ModelA. Varasteh1*, H.A. Tahmasebi2 and R. Gheshlaghi31Chemical Engineering, Islamic Azad University, Shahrood Branch, Semnan, Shahrood, Iran2Chemical Engineering Department, Islamic Azad University, Quchan Branch, Asian Road, Quchan, Iran3Department of Chemical Engineering, Ferdowsi University of Mashhad, Mashhad, Khorasan, Iran
*Corresponding author: A. Varasteh, Chemical Engineering, Islamic Azad University, Shahrood Branch, Semnan, Shahrood, Iran, E-mail: [email protected]
Received August 07, 2012; Accepted December 08, 2012; Published December 11, 2012
Citation: Varasteh A, Tahmasebi HA, Gheshlaghi R (2013) Modeling of Vapour Liquid Equilibrium Data for Thyme Essential Oil Based on UNIQUAC Thermodynamic Model. J Chem Eng Process Technol 4: 146 doi:10.4172/2157-7048.1000145
Copyright: © 2013 Varasteh A, et al. This is an open-access article distributed under the terms of the Creative Commons Attribution License, which permits unrestricted use, distribution, and reproduction in any medium, provided the original author and source are credited.
AbstractVapour Liquid Equilibrium (VLE) data for natural ingredients and essential oils has not studied at all yet. It is
because of complexity of these mixtures. In this study, the equilibrium concentration of the mixture components was studied by using the UNIQUAC model at different pressure. This model is capable of determining temperature between 70°C to 170°C and the pressure limits 30 Kpa to 202 Kpa. The modeling’s results showed thymol in the liquid phase were increased from 50% molar to 90% molar in constant pressure by increasing temperature from bubble point to dew point’s temperature. Thymol concentration in the liquid phase was increased from 42% molar to 78% molar by increasing water concentration of the mixture at a constant pressure of 100 Kpa and constant temperature 177°C. Another obtaining result showed that thymol concentration in the triple mixture, which includes 30% molar water, 35% molar thymol and 35% molar Cymene in liquid phase, was increased from 60% molar to 82% molar at constant temperature of 177°C by decreasing pressure from 100 Kpa to 20 Kpa.
Keywords: Thyme; Essential oil; VLE; UNIQUAC; Modeling;Thermodynamic phases
IntroductionThymus vulgaris plants of the family lamiaceae are fragrant [1].
Distribution of 215 species worldwide and 14 species of Thymus vulgaris has been reported in Iran [2]. This plant food is as traditional as the digestive, antispasmodic, antitussive, and due to the main compound thymol, in the food industry, pharmaceutical, health and beauty uses [3]. The aqueous extract, aqueous Ethanol and Propylene Glycol in the preparation of Thymus vulgaris shampoo, creams and ointments are used [4]. This plant is antifungal effects, antibacterial and ant parasite and its therapeutic efficacy for treatment of asthma, recurrent dry cough and bronchitis has been proved. This medical plant, syrups, pill, incense and extracts were prepared and has approved by the drug unit of supervision, ministry of health and medical education [5]. The treatment plant, flowering shoot and its leaves are dried. World wages species Thymus vulgaris (Thymus Daensis Celak) are distributed in
different regions of Qazvin province. This plant is propagated by seed and can be divided. thymol is the main compound of Thymus vulgaris plant and the molar amount of thymol dittany have been reported about 40% to more than 70% of the world wages. Based on the results of extraction Thymus vulgaris world wages sample collected from the Hamedan which includes 26 compounds 95.1% of the thymol with 44.7%, Para Cymene with 18.6% and Alpha Trypen with 16.5% in most combinations [6]. Garden Thymus vulgaris every year in large areas of farmland in Europe, North Africa and the United states is grown. In Figure 1 and Table 1 the essential oils yield is 2 to 3 percent and thymol in the essential oil has been reported about 40 to 65 percent [7].
Gas chromatography
Chemical analysis was performed on a Hewlett–Packard 5890 series II gas chromatograph fitted with a HP-5 capillary column (25 m×0.20 mm, film thickness 0.33 µm). The carrier gas was hydrogen at a flow of 1.0 ml min-1 and a split ratio 1:100. The column temperature was programmed from 60–250°C at 2.0°C min-1; the injector temperature was 250°C and the detector (FID) temperature was 280°C [8].
Gas chromatography/mass spectroscopy
The analysis was performed on a Hewlett–Packard 5890 series II gas chromatograph coupled to a HP 5970 mass selective detector using a fused silica capillary column HP-5 (25 m×0.20 mm, film thickness 0.33 µm). The column temperature was programmed from 60-250°C
Intensity
3000
2000
1000
0
3.35
074.
287
8.69
97
2.49
4 3.07
2
0 5 10 15 20min
Figure 1: Chromatogram of the Thyme essential oil.
Journal of Chemical Engineering & Process TechnologyJournal
of C
hem
ical E
ngineering & Process Technology
ISSN: 2157-7048
Page 2 of 5
Citation: Varasteh A, Tahmasebi HA, Gheshlaghi R (2013) Modeling of Vapour Liquid Equilibrium Data for Thyme Essential Oil Based on UNIQUAC Thermodynamic Model. J Chem Eng Process Technol 4: 146 doi:10.4172/2157-7048.1000145
Volume 4 • Issue 1 • 1000145J Chem Eng Process Technol ISSN: 2157-7048 JCEPT, an open access journal
at 2.0°C min-1 using helium as the carrier gas at a flow rate of 1.0 ml min-1. The ion source temperature was 300°C and the electron energy 70 eV. Identification of components was based on comparison of their mass spectra with those found in the literature on retention indices, the mass spectrometry data bank (NIST) and a computer search of the Wiley library [8].
TheoryModeling the vapour and liquid equilibrium
A number of important industrial processes such as distillation, absorption, and extraction, make two phases in contact with each other. Mass transfer between two phases occurs when the phases are not in equilibration. The amount and speed of transfer depend on the distance from the device and equilibrium. Quantitative analysis of mass transfer will require data and information about the equilibrium conditions (pressure, temperature and mole fraction of components). In the most industrial processes, coexistence phases are of kinds of liquid and vapour, although the liquid-liquid, vapour-solid and liquid-solid are also exist. This section is going to analyze and describe the qualitative and general behavior of the liquid and vapour phase in the essential oil distillation process, calculate the temperature, pressure and mole fraction of components for liquid and vapour equilibrium. Equilibrium is a static condition, which cause no change in the main properties of a device. This is because of the balance among all factors that may cause changes. In engineering practice, the equilibrium assumption is confirmed when the results would be satisfactory. For example, in the distillation column reboiler, it is generally assumed that the equilibrium is established between vapour and liquid phases. This is an approximation for certain evaporation, although this approximation in engineering calculations does not make an error. In a system with a constant amount of chemicals that contain vapour and liquid phases that are in close contact, there is no desire to change the system.
Temperature, pressure and phase component are reached to final value and amount, and then remain constant. So the system is in equilibrium but at a molecular level, it is not a constant condition. Molecules forming one phase at a given moment are not the same as molecules as that phase in another moment. High speed molecules which are located near the boundary between the phases are overcome to the surface forces and go to another phase [9]. In vapour and liquid equilibrium condition the amount of molecules that leave the interface, and go to the vapour phase are equal with the number of another molecules component which returns to the liquid phase. Therefore, the concentration of each component in the vapour and liquid phase does not change during the time. Although theoretically, equilibrium required a long time, if the vapour liquid are placed vicinity and no reaction occurs between them, the equilibrium will come quickly (Figure 2).
According to thermodynamic relation, the equilibrium condition is the equality of chemical potential of component (i) in liquid and vapour phase in a constant temperature and pressure [10].
Macroscopic state of liquid vapour equilibrium is in constant temperature and pressure that the chemical potential of each component in liquid phase equal to chemical potential of each component in vapour phase [11].
( , ) V Li iT P cteµ µ= = (1)
On the other hand, with the help of the following thermodynamic relations, the chemical potential of each component in the liquid phase can associate to fugacity and activity coefficient of each component in the liquid phase. For complex mixture such as essential oils, using fugacity model for both vapour and liquid phase to predicting equilibrium data is necessary. Therefore, suitable activity model is used for liquid phase [12].
lnV Vi id RTd fµ = (2)
lnL Li id RTd fµ = (3)
Thus, we have the equilibrium condition: V Li if f= (4)
If ,V Li if f values for each component are in the vapour and liquid
phase, the fugacity which is a pressure unit is used for two non-ideal phases. Fugacity for vapour phase is as follows [13].
Vapor
Liquid
Figure 2: Schematic representation of VLE.
NO NAME RI Percent%1 Tricyclene 925 0.532 β-Pinene 928 0.183 α-Tujene 931 0.334 Camphene 945 0.325 Myrcene 992 0.8876 α-phlladrene 1005 0.137 α-Terpinene 1016 0.758 Р-Cymene 1027 4.69 Limonene 1032 0.3310 Carvacrol 1035 1.411 1,8-Cineole 1043 1.6412 γ-Terpinene 1062 4.4813 Cis-Sabinene Hydrate 1074 0.814 Terpinolene 1088 0.1215 Trans-Sabinene Hydrate 1097 0.2716 Borneol 1164 1.6117 Terpinene-4-Ol 1188 0.5718 Carvacrol/Methyl Ether 1246 4.2719 Thymol 1297 73.6120 β-Caryophylene 1416 0.9921 Germacrene B 1487 0.6422 α-Murolene 1499 0.9423 β-Bisabolene 1509 0.1724 δ-Cadinene 1525 0.16
Table 1: The type and composition of Thyme essential oil.

Page 3 of 5
Citation: Varasteh A, Tahmasebi HA, Gheshlaghi R (2013) Modeling of Vapour Liquid Equilibrium Data for Thyme Essential Oil Based on UNIQUAC Thermodynamic Model. J Chem Eng Process Technol 4: 146 doi:10.4172/2157-7048.1000145
Volume 4 • Issue 1 • 1000145J Chem Eng Process Technol ISSN: 2157-7048 JCEPT, an open access journal
. .Vi i if y Pϕ=
(5)
The amount of fugacity in the liquid phase is calculated from the following equation:
. .Li i i if x fγ= (6)
. . . .i i i i iy P x fϕ γ= (7)
The required equilibrium information is usually expressed by the K value [14]: Ki=yi/xi (8)
Where yi is the mole fraction (i) in vapour phase and xi is the mole fraction (i) in liquid phase. Ki is the equilibrium constant of component (i) at T temperature and P pressure [15]. By using thermodynamics, fugacity and activity coefficients can be related to the K value [16]:
0 /i i i iK f Pγ= Φ (9)
γi is the activity coefficient of component (i) in the liquid phase and Φi is fugacity coefficient of component (i) in the vapour phase and P is the total pressure of the mixture. For compressible components, 0
if is pure fugacity of component (i) at T system temperature and P pressure [17]. Activity coefficients may be based on thermodynamic theory models, which based on rather strong scientific theory or based on an experimental model for example UNIQUAC, NRTL, UNIFAC, Wilson [18].
1 2( , ....., )
E
nG g X X XRT
= (10)
21 1
1 2
.....EG a bX cX
X X RT= + + +
(11)
lnEi ii
G RT n γ= ∑ (12)
, ,ln ( )E
ii T P n
i
n GRTn
γ ∂=
∂ (13)
Equation UNIQUAC, with EG
RT and consists of two additive, the case
course seeks to puts. The union sector gc, for calculating the molecular size and shape differences. Other sector gR, for calculating the molecule effects [19].
G=gc+gR (14)
Function gc only includes pure material parameters, while the function gR includes the interaction of two parameters, which is formed for each pair of molecules. For a multi-components system [20]:
ln 5 lnc i ii i ii i
i i
g x q xxφ θ
φ= +∑ ∑ (15)
g ln( )Ri i j jii i
q x θ τ= −∑ ∑ (16)
i ii
i ij
x rx r
φ =∑
(17)
i ii
j jj
x qx q
θ =∑
(18)
(i) represents the material and (j) is an index. All calculations is for all materials and the value τ is equal to 1 for i=j [21].
In these equations, ri (relative molecular size) and qi (relative molecular level), are pure material parameter [22]. The temperature dependence of gR at the above equation is determined by the following equations [23]: exp ( )ji ii
ij
u uRT
τ−
= − (19)
Interaction parameters in the UNIQUAC equation are (uji–uii). To obtain equation lnγ, is as follows [24]:
ln ln lnc Ri i iγ γ γ= + (20)
ln 1 ln 5 (1 ln )jic ii i i i
j
sjj j qL
γη
= − + − − + (21)
ln (1 ln ) ( ln )ji jiRi i i ij
ij j
s sq L qγ θ
τ η= − − −∑ (22)
ii
j jj
rJr x
=∑ (23)
ii
j jj
qLq x
=∑ (24)
i iiq xθ =∑ (25)
ji i mjms qτ=∑ (26)
j ji iis xη =∑ (27)
exp( )ij ijmj
u uRT
τ−
= (28)
In these equations (i), is the material expression. (m) and (j) are counters. All calculations is for all materials and for m=j we have τmj=1 [25].
All calculations have been performed using MATLAB software [26-28].
Values of parameters for the Margules, van Laar, and Wilson, NRTL, and UNIQUAC equations are given for many binary pairs by Gmehling [29].
DiscussionIn this section, the data is shown in a graph for thymol component
to achieve a better picture of the results. Diagrams show thymol concentration in the liquid phase according to temperature and pressure. This chart shows the change of thymol concentration in the liquid phase that is depending on temperature, and each curve represents the change of concentration in certain pressure.
As you see in Figure 3, the concentration of thymol in the liquid phase increases by increasing the temperature at constant pressure. At higher pressures, to achieve a certain amount of thymol concentration, the higher temperature is required. Due to sensitivity of plant
473
453
433
413
393
373
353
202 kpa 160 kpa
101.33 kpa
60 kpa
30 kpa
0.4 0.5 0.6 0.7 0.8 0.9 1Mole Fraction Thymol
Tem
pera
ture
k
Pressure=30Kpa
Pressure=60Kpa
Pressure=101.33Kpa
Pressure=160Kpa
Pressure=202Kpa
Figure 3: Thymol concentration changes in the liquid phase depending on temperature at constant pressure.
Page 4 of 5
Citation: Varasteh A, Tahmasebi HA, Gheshlaghi R (2013) Modeling of Vapour Liquid Equilibrium Data for Thyme Essential Oil Based on UNIQUAC Thermodynamic Model. J Chem Eng Process Technol 4: 146 doi:10.4172/2157-7048.1000145
Volume 4 • Issue 1 • 1000145J Chem Eng Process Technol ISSN: 2157-7048 JCEPT, an open access journal
compounds to temperature, low pressure is recommended. Change of thymol concentration in liquid phase depending on pressure at constant temperature.
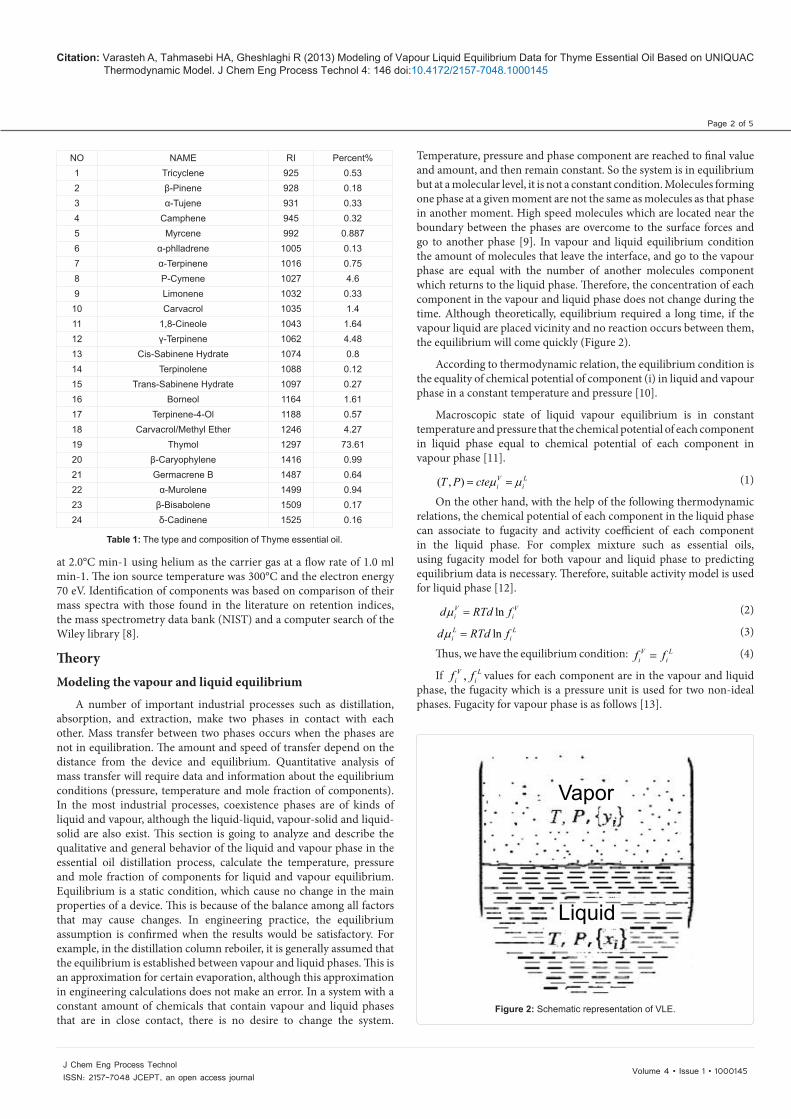
Figure 4 shows the changes of thymol concentration in the liquid
phase, depending on pressure in certain temperatures. This figure shows that by increasing pressure at constant temperature, the amount of thymol in the liquid phase decreases. In constant pressure at higher temperatures, the amount of thymol in the liquid phase increases. As it is indicated in the chart the highest concentration of thymol is in the lowest pressure.
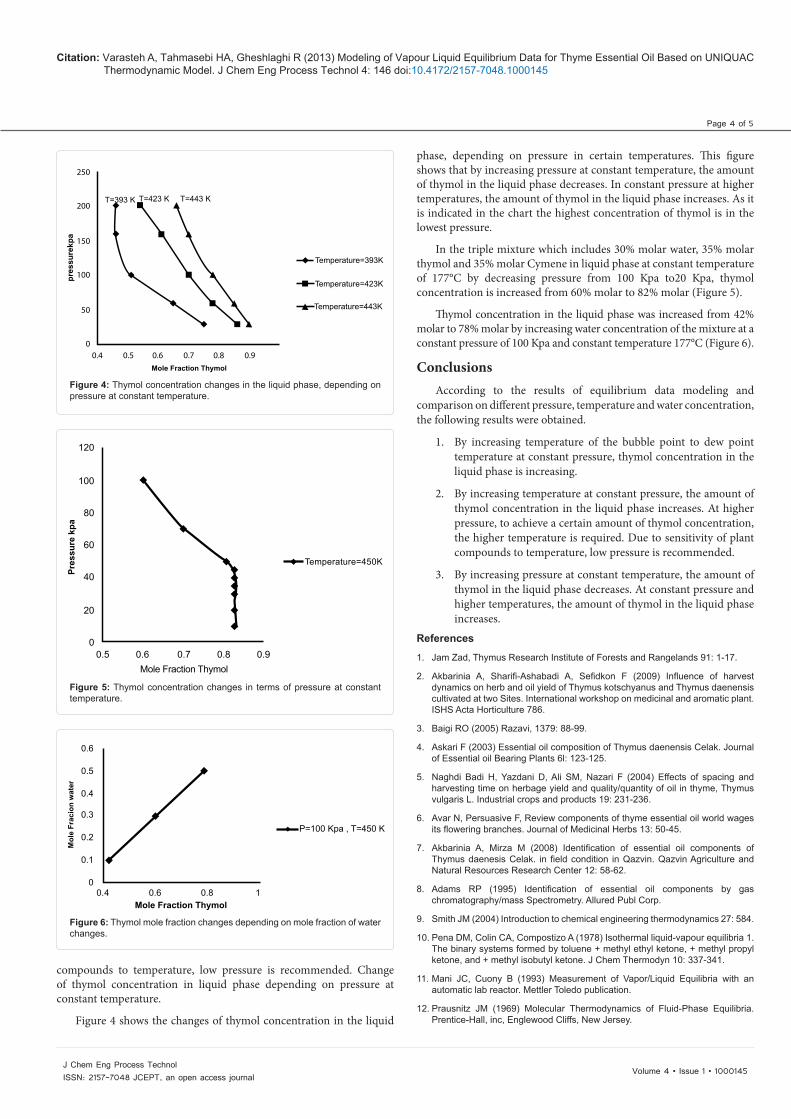
In the triple mixture which includes 30% molar water, 35% molar thymol and 35% molar Cymene in liquid phase at constant temperature of 177°C by decreasing pressure from 100 Kpa to20 Kpa, thymol concentration is increased from 60% molar to 82% molar (Figure 5).
Thymol concentration in the liquid phase was increased from 42% molar to 78% molar by increasing water concentration of the mixture at a constant pressure of 100 Kpa and constant temperature 177°C (Figure 6).
ConclusionsAccording to the results of equilibrium data modeling and
comparison on different pressure, temperature and water concentration, the following results were obtained.
1. By increasing temperature of the bubble point to dew point temperature at constant pressure, thymol concentration in the liquid phase is increasing.
2. By increasing temperature at constant pressure, the amount of thymol concentration in the liquid phase increases. At higher pressure, to achieve a certain amount of thymol concentration, the higher temperature is required. Due to sensitivity of plant compounds to temperature, low pressure is recommended.
3. By increasing pressure at constant temperature, the amount of thymol in the liquid phase decreases. At constant pressure and higher temperatures, the amount of thymol in the liquid phase increases.
References
1. Jam Zad, Thymus Research Institute of Forests and Rangelands 91: 1-17.
2. Akbarinia A, Sharifi-Ashabadi A, Sefidkon F (2009) Influence of harvest dynamics on herb and oil yield of Thymus kotschyanus and Thymus daenensis cultivated at two Sites. International workshop on medicinal and aromatic plant. ISHS Acta Horticulture 786.
3. Baigi RO (2005) Razavi, 1379: 88-99.
4. Askari F (2003) Essential oil composition of Thymus daenensis Celak. Journal of Essential oil Bearing Plants 6l: 123-125.
5. Naghdi Badi H, Yazdani D, Ali SM, Nazari F (2004) Effects of spacing and harvesting time on herbage yield and quality/quantity of oil in thyme, Thymus vulgaris L. Industrial crops and products 19: 231-236.
6. Avar N, Persuasive F, Review components of thyme essential oil world wages its flowering branches. Journal of Medicinal Herbs 13: 50-45.
7. Akbarinia A, Mirza M (2008) Identification of essential oil components of Thymus daenesis Celak. in field condition in Qazvin. Qazvin Agriculture and Natural Resources Research Center 12: 58-62.
8. Adams RP (1995) Identification of essential oil components by gas chromatography/mass Spectrometry. Allured Publ Corp.
9. Smith JM (2004) Introduction to chemical engineering thermodynamics 27: 584.
10. Pena DM, Colin CA, Compostizo A (1978) Isothermal liquid-vapour equilibria 1. The binary systems formed by toluene + methyl ethyl ketone, + methyl propyl ketone, and + methyl isobutyl ketone. J Chem Thermodyn 10: 337-341.
11. Mani JC, Cuony B (1993) Measurement of Vapor/Liquid Equilibria with an automatic lab reactor. Mettler Toledo publication.
12. Prausnitz JM (1969) Molecular Thermodynamics of Fluid-Phase Equilibria. Prentice-Hall, inc, Englewood Cliffs, New Jersey.
250
200
150
100
50
00.4 0.5 0.6 0.7 0.8 0.9
Mole Fraction Thymol
pres
sure
kpa
T=393 K T=423 K T=443 K
Temperature=393K
Temperature=423K
Temperature=443K
Figure 4: Thymol concentration changes in the liquid phase, depending on pressure at constant temperature.
120
100
80
60
40
20
00.5 0.6 0.7 0.8 0.9
Mole Fraction Thymol
Temperature=450K
Pres
sure
kpa
Figure 5: Thymol concentration changes in terms of pressure at constant temperature.
0.6
0.5
0.4
0.3
0.2
0.1
00.4 0.6 0.8 1
Mole Fraction Thymol
Mol
e Fr
acio
n w
ater
P=100 Kpa , T=450 K
Figure 6: Thymol mole fraction changes depending on mole fraction of water changes.

Page 5 of 5
Citation: Varasteh A, Tahmasebi HA, Gheshlaghi R (2013) Modeling of Vapour Liquid Equilibrium Data for Thyme Essential Oil Based on UNIQUAC Thermodynamic Model. J Chem Eng Process Technol 4: 146 doi:10.4172/2157-7048.1000145
Volume 4 • Issue 1 • 1000145J Chem Eng Process Technol ISSN: 2157-7048 JCEPT, an open access journal
13. Renon H, Prausnitz JM (1968) Local compositions in thermodynamic excess functions for liquid mixtures. AIChE J 14: 135-144.
14. Debye P, Hückel E (1923) The theory of electrolytes. I. Lowering of freezing point and related phenomena. Physikalische Zeitschrift: 185-206.
15. Ohannes Jacobus van Laar (1860-1938) Dutch physical chemist.
16. Abrams DS, Prausnitz JM (1975) AIChE J 21: 116-128.
17. Wilson GM (1964) Vapor-Liquid Equilibrium. XI. A New Expression for the Excess Free Energy of Mixing. J Am Chem Soc 86: 127-130.
18. Redlich O, Kister AT, Turnquist CE (1952) Chem Eng Progr Symp Ser 48: 49-61.
19. McGlashan L, Rastogi RP, Tmns (1958) Faraday Soc 54: 496.
20. Van Ness HC (1995) Thermodynamics in the treatment of (vapor + liquid) equilibria. J Chem Thermodynamics 27: 113-134.
21. Van Ness HC (1995) Thermodynamics in the treatment of vapor/liquid equilibrium (VLE) data. Pure & Appl Chem 67: 859-872.
22. Eubank PT, Lamonte BG, Javier Alvarado JF (2000) Consistency Tests for Binary VLE Data. J Chem Eng Data 45: 1040-1048.
23. Van Ness HC, Abbott MM (1982) Classical Thermodynamics of Nonelectrolyte Solutions: With Applications to Phase Equilibria. McGraw-Hill, New York.
24. UNIQUAC Functional-group Activity Coefficients; proposed by Fredenslund Aa, Jones RL, Prausnitz JM.
25. AIChE J (1977) given detailed treatment in the monograph: Fredenslund Aa, Gmehling J, Rasmussen P, Vapor-Liquid Equilibrium using UNIFAC, Elsevier, Amsterdam 21: 1086-1099.
26. Reid RC, Prausnitz JM, Sherwood TK (1977) The Properties of Gases and liquids. (3rdedn), McGraw-Hill Book Co, New York, USA.
27. Hayden JG, O’Connell JP (1975) A Generalized Method for Predicting Second Virial Coefficients. Ind Eng Chem Process Des Dev 14: 209-216.
28. Sinor JE, Weber JH (1960) Vapor-Liquid Equilibria at Atmospheric Pressure. Systems Containing Ethyl Alcohol, n-Hexane, Benzene, and Methylcyclopentane. J Chem Eng Data 5: 243-247.
29. Gmehling J, Onken U, Arlt W (1977) Vapor-Liquid Equilibrium Data Collection. DECHEMA, Chemistry Data Series. Frankfurt/ Main.