
Modeling of the carbonation kinetics of a synthetic CaO-based sorbent
8
Modeling of the carbonation kinetics of a synthetic CaO-based sorbent Zhiming Zhou n , Pan Xu, Miaomiao Xie, Zhenmin Cheng, Weikang Yuan State Key Laboratory of Chemical Engineering, East China University of Science and Technology, Shanghai 200237, China HIGHLIGHTS A synthetic CaO-based sorbent showed excellent CO 2 capture capa- city and stability. The carbonation kinetics of the sor- bent was investigated by two different models. The random pore model (RPM) was compared to the overlapping grain model (OGM). The kinetic and diffusion parameters obtained by OGM were higher than those by RPM. The carbonation behavior of the sorbent over multiple cycles was well predicted. GRAPHICAL ABSTRACT article info Article history: Received 26 January 2013 Received in revised form 13 March 2013 Accepted 20 March 2013 Available online 29 March 2013 Keywords: CaO-based sorbent Carbonation Absorption Kinetics Diffusion Stability abstract A synthetic CaO-based sorbent composed of 20 wt% Ca 9 Al 6 O 18 and 80 wt% CaO showed excellent activity and stability over multiple carbonation–calcination cycles. The improved CO 2 capture performance was mainly ascribed to the even distribution of the inert Ca 9 Al 6 O 18 within the sorbent. The random pore model (RPM) and the overlapping grain model (OGM) were used to predict the carbonation behaviors of CaO–Ca 9 Al 6 O 18 that experienced one cycle or many cycles over a temperature range of 500–700 1C and the CO 2 partial pressure of 0.005−0.015 MPa. Both models described the carbonation of the sorbent very well, and the estimated activation energies by the RPM model for the surface reaction and for the effective product layer diffusion were 28.4 and 88.7 kJ/mol, respectively, which were comparable to those obtained by the OGM model, 32.3 and 113.1kJ/mol, respectively. As far as the intrinsic rate constant and the effective product layer diffusion coefficient were concerned, the values obtained by the OGM model (average values of 1.67 10 −5 m/s and 2.74 10 –13 m 2 /s at 500−700 1C) were somewhat higher than those by the RPM model (5.44 10 −6 m/s and 1.03 10 –14 m 2 /s), which was related with the different approaches of the two models in dealing with the carbonation of the sorbent. This study is expected to contribute to a better understanding of the carbonation kinetics between CO 2 and the CaO-based sorbents. & 2013 Elsevier Ltd. All rights reserved. 1. Introduction Anthropogenic CO 2 is widely recognized as a major contributor to global warming and climate changes, and reduction of CO 2 emissions from fossil fuels has become a worldwide topic in the last decade (IEA, 2008). Integration of the CO 2 capture and sequestration techniques into the fossil fuel conversion processes is regarded as an effective way to reduce CO 2 emissions (Fan, 2010). Among various techniques the calcium looping technology, which makes use of the reversible reaction between CaO and CO 2 (CaO(s)+CO 2 (g)↔CaCO 3 (s)), has attracted much attention due to its high efficiency and low cost (Blamey et al., 2010; Anthony, 2011; Yu et al., 2012a). It is well known that pure CaO and natural limestone or dolomite sorbents are usually subject to a sharp decay in the CO 2 capture capacity after multiple carbonation-calcination cycles Contents lists available at SciVerse ScienceDirect journal homepage: www.elsevier.com/locate/ces Chemical Engineering Science 0009-2509/$ - see front matter & 2013 Elsevier Ltd. All rights reserved. http://dx.doi.org/10.1016/j.ces.2013.03.047 n Corresponding author. Tel.: +86 21 6425 2230; fax: +86 21 6425 3528. E-mail addresses: [email protected], [email protected] (Z. Zhou). Chemical Engineering Science 95 (2013) 283–290
Transcript of Modeling of the carbonation kinetics of a synthetic CaO-based sorbent

Chemical Engineering Science 95 (2013) 283–290
Contents lists available at SciVerse ScienceDirect
Chemical Engineering Science
0009-25http://d
n CorrE-m
journal homepage: www.elsevier.com/locate/ces
Modeling of the carbonation kinetics of a synthetic CaO-based sorbent
Zhiming Zhou n, Pan Xu, Miaomiao Xie, Zhenmin Cheng, Weikang YuanState Key Laboratory of Chemical Engineering, East China University of Science and Technology, Shanghai 200237, China
H I G H L I G H T S
G R A P H I C A L A� A synthetic CaO-based sorbentshowed excellent CO2 capture capa-city and stability.
� The carbonation kinetics of the sor-bent was investigated by two differentmodels.
� The random pore model (RPM) wascompared to the overlapping grainmodel (OGM).
� The kinetic and diffusion parametersobtained by OGM were higher thanthose by RPM.
� The carbonation behavior of thesorbent over multiple cycles was wellpredicted.
09/$ - see front matter & 2013 Elsevier Ltd. Ax.doi.org/10.1016/j.ces.2013.03.047
esponding author. Tel.: +86 21 6425 2230; faxail addresses: [email protected], michaelz
B S T R A C T
a r t i c l e i n f o
Article history:Received 26 January 2013Received in revised form13 March 2013Accepted 20 March 2013Available online 29 March 2013
Keywords:CaO-based sorbentCarbonationAbsorptionKineticsDiffusionStability
a b s t r a c t
A synthetic CaO-based sorbent composed of 20 wt% Ca9Al6O18 and 80 wt% CaO showed excellent activityand stability over multiple carbonation–calcination cycles. The improved CO2 capture performance wasmainly ascribed to the even distribution of the inert Ca9Al6O18 within the sorbent. The random poremodel (RPM) and the overlapping grain model (OGM) were used to predict the carbonation behaviors ofCaO–Ca9Al6O18 that experienced one cycle or many cycles over a temperature range of 500–700 1C andthe CO2 partial pressure of 0.005−0.015 MPa. Both models described the carbonation of the sorbent verywell, and the estimated activation energies by the RPM model for the surface reaction and for theeffective product layer diffusion were 28.4 and 88.7 kJ/mol, respectively, which were comparable to thoseobtained by the OGM model, 32.3 and 113.1 kJ/mol, respectively. As far as the intrinsic rate constant andthe effective product layer diffusion coefficient were concerned, the values obtained by the OGM model(average values of 1.67�10−5 m/s and 2.74�10–13 m2/s at 500−700 1C) were somewhat higher thanthose by the RPM model (5.44�10−6 m/s and 1.03�10–14 m2/s), which was related with the differentapproaches of the two models in dealing with the carbonation of the sorbent. This study is expected tocontribute to a better understanding of the carbonation kinetics between CO2 and the CaO-based sorbents.
& 2013 Elsevier Ltd. All rights reserved.
1. Introduction
Anthropogenic CO2 is widely recognized as a major contributorto global warming and climate changes, and reduction of CO2
emissions from fossil fuels has become a worldwide topic inthe last decade (IEA, 2008). Integration of the CO2 capture and
ll rights reserved.
: +86 21 6425 [email protected] (Z. Zhou).
sequestration techniques into the fossil fuel conversion processesis regarded as an effective way to reduce CO2 emissions (Fan,2010). Among various techniques the calcium looping technology,which makes use of the reversible reaction between CaO and CO2
(CaO(s)+CO2(g)↔CaCO3(s)), has attracted much attention due toits high efficiency and low cost (Blamey et al., 2010; Anthony,2011; Yu et al., 2012a).
It is well known that pure CaO and natural limestone ordolomite sorbents are usually subject to a sharp decay in theCO2 capture capacity after multiple carbonation-calcination cycles
Z. Zhou et al. / Chemical Engineering Science 95 (2013) 283–290284
(Barker, 1973; Abanades and Alvarez, 2003; Grasa and Abanades,2006), and the loss-in-capacity is believed to be caused bysintering of the sorbents and loss of suitable pore volumeoccurring at high regeneration temperature (Feng et al., 2006;Liu et al., 2010a; Blamey et al., 2010). To date, many methods havebeen tried to improve the sintering-resistant performance of theCaO-based sorbents, among which incorporation of CaO particlesinto inert support materials is a promising and effective approach(Manovic and Anthony, 2010; Yu et al., 2012a; Liu et al., 2012a).These inert materials act as a matrix to stabilize CaO particles(Li et al., 2013), and include a variety of metal oxides and salts suchas Al2O3 (Feng et al., 2006; Gruene et al., 2011; Broda et al., 2012a,2012b, 2012c), MgO (Liu et al., 2010b), Y2O3 (Derevschikov et al.,2011), CaTiO3 (Wu and Zhu, 2010), Ca12Al14O33 (mayenite) (Li et al.,2005, 2006; Martavaltzi and Lemonidou, 2008a, 2008b), Ca9Al6O18
(Zhou et al., 2012), etc.Various preparation methods have been developed to incorpo-
rate the inert support materials into CaO particles, e.g., mixing (Liuet al., 2010b; Zhou et al., 2012; Qin et al., 2012), sol–gel (Brodaet al., 2012a, 2012b, 2012c; Kierzkowska and Müller, 2013), andflame spray pyrolysis (Lu et al., 2009; Koirala et al., 2012). Veryrecently, we (Zhou et al., 2012) prepared a CaO–Ca9Al6O18 sorbentby following a wet mixing method proposed by Liu et al. (2010b),which displayed high CO2 capture capacity over multiple conse-cutive cycles. Furthermore, this sorbent was applied to hydrogenproduction by the sorption-enhanced steam methane reformingprocess, and showed good stability over eight reaction-regenerationcycles (Xie et al., 2012). Therefore, the CaO–Ca9Al6O18 sorbentappears to be very attractive, and it is necessary to investigate itscarbonation kinetics in order to optimize the operation conditions ofthe sorbent.
A lot of models have been reported to describe the carbonationbehavior between CaO and CO2. In general, these models can beclassified into several types: apparent model (Lee, 2004; Li andCai, 2007), shrinking core model (Szekely and Evans, 1970;Johnsen et al., 2006), random pore model (RPM) (Bhatia andPerlmutter, 1980, 1981, 1983; Grasa et al., 2009), grain model(GM) (Heesink et al., 1993; Stendardo and Foscolo, 2009; Liu et al.,2012b; Yu et al., 2012b), ion reaction mechanism model (Wu andLan, 2012), and rate equation theory model (Li et al., 2012). Ofparticular interest are RPM and GM models. The RPM modelcorrelates the carbonation behavior with the internal pore struc-ture by three structural parameters, while the GM model assumesthat the sorbent is composed of small grains that are dispersed ingas, and each grain is converted according to the shrinking coremodel. Thus, the RPM model is derived from pores and the solidphase is regarded as the continuous phase, while the GM model isbased on grains and gas is the continuous phase. Although the twomodels are widely used to study the carbonation reaction, fewresearchers (Bhatia and Perlmutter, 1980, 1981) have comparedthem, probably because of the limitations in the early GM model,e.g., the structure change occurring during carbonation used to beignored. However, the GM model has been intensively developedin recent years and is quite different from its original form. Forexample, an overlapping grain model (OGM) developed by Liuet al. (2012b) takes into account not only the grain size distribu-tion, the overlapping effect of grains, but also the structure change.Therefore, it will be interesting to compare the RPM model withthe OGM model, especially the kinetic and diffusion parametersobtained from the two models.
In this work, the carbonation kinetics of a syntheticCaO–Ca9Al6O18 sorbent is studied by using the RPM model andthe OGM model, respectively. The carbonation behaviors rangingfrom one cycle to multiple cycles are considered. The objectives ofthis research are: (1) to obtain a reliable kinetic model to describethe carbonation behavior of the CaO–Ca9Al6O18 sorbent, and (2) to
compare the RPM model with the OGM model for a betterunderstanding of the carbonation kinetics in terms of pores andof grains.
2. Experimental section
The CaO–Ca9Al6O18 sorbent with a CaO content of 80 wt%(weight fraction) was prepared by a simple wet mixing method,and calcium citrate and aluminum nitrate were used as calciumand aluminum precursors, respectively. Detailed information waspresented in our previous work (Zhou et al., 2012). For simplicity,the as-prepared sorbent was denoted by CC-AN-80.
The carbonation–calcination experiments were carried out atnormal pressure in a thermogravimetric analyzer (TGA, WRT-3P,Shanghai Precision & Scientific Instrument Co., Ltd.), wheretemperature, gas (N2, CO2) flow rate, and sample weight werecontinuously recorded in a computer. For each run about 10 mg offresh sorbent was loaded in a platinum basket. The carbonationreaction was conducted at a preset temperature and under a mixtureof CO2 and N2 for 30 min, and then the temperature was increased at10 1C/min to the calcination temperature (800 1C in all the experi-ments) under an atmosphere of N2 for 10 min. After calcination thetemperature was decreased at 10 1C/min to the preset temperaturefor next cycle.
Preliminary tests were carried out to determine the effects ofthe total gas flow rate through the TGA and the particle size of thesorbent on the carbonation reaction. The results showed that theeffect of the total gas flow rate was negligible when it was higherthan 40 mL/min. In addition, the particle size of the sorbent,varying from 50 to 375 μm, had almost no effect on the carbona-tion behavior, which was consistent with those results reported byBhatia and Perlmutter (1983) and Grasa et al. (2009). Therefore,the kinetic experiments in this work were performed at the totalgas flow rate of 50 mL/min by using sorbent particles with adiameter of 50−75 μm. The temperature ranged from 500 to700 1C, and the partial pressure of CO2 was varied between0.005 and 0.015 MPa.
The carbonation conversion of the synthetic sorbent is definedas follows:
X ¼ ðWt−W0ÞW0f
MCaO
MCO2
ð1Þ
where W0 is the initial sorbent weight after complete calcination,Wt is the sorbent weight at time t, f is the weight fraction of CaO inthe sorbent (f¼0.8 for CC-AN-80), and MCaO and MCO2 are themolar weights of CaO and CO2, respectively. The ultimate conver-sion of CC-AN-80 during the Nth cycle, Xu(N), is the conversionthat CC-AN-80 achieves after 30 min of carbonation at this cycle.
3. Model of the carbonation kinetics
3.1. Random pore model (RPM)
According to the RPM model developed by Bhatia and Perlmutter(1980, 1981, 1983), a general expression for the instantaneous localreaction rate in the presence of a product layer diffusion resistance isgiven by
dXdt
¼ kRPMS0Cð1−XÞffiffiffiffiffiffiffiffiffiffiffiffiffiffiffiffiffiffiffiffiffiffiffiffiffiffi1−ψ lnð1−XÞ
pð1−ε0Þ½1þ βZ=ψð
ffiffiffiffiffiffiffiffiffiffiffiffiffiffiffiffiffiffiffiffiffiffiffiffiffiffi1−ψ lnð1−XÞ
p−1Þ�
ð2Þ
where ψ is the structural parameter, which is correlated with thetextural property of the sorbent by
ψ ¼ 4πL0ð1−ε0ÞS20
ð3Þ

Fig. 1. SEM images (A and B) of the fresh CC-AN-80 sorbent and its EDS mapping (C).Red spots: calcium; green spots: aluminum. (For interpretation of the references tocolor in this figure legend, the reader is referred to the web version of this article.)
Z. Zhou et al. / Chemical Engineering Science 95 (2013) 283–290 285
where L0 and S0 are the initial total length and surface area per unitvolume, respectively, and ε0 is the initial porosity. L0, S0 and ε0 can becalculated from the pore size distribution of the sorbent, obtainedfrom the mercury porosimetry, as follows (Bhatia and Perlmutter,1980; Grasa et al., 2009)
L0 ¼Z ∞
0
v0ðrÞπr2
dr ð4Þ
S0 ¼ 2Z ∞
0
v0ðrÞr
dr ð5Þ
ε0 ¼Z ∞
0v0ðrÞdr ð6Þ
The parameter Z in Eq. (2) represents the ratio of the molarvolume of the carbonation product to that of the reactant, whichcan be calculated by
Z ¼ Vn
CaCO3
Vn
CaOð7Þ
Vn
CaCO3¼ MCaCO3
ρCaCO3
þMCaOð1−f Þf ρCa9Al6O18
ð8Þ
Vn
CaO ¼ MCaO
ρCaOþMCaOð1−f Þ
f ρCa9Al6O18
ð9Þ
where ρCao; ρCaCO3and ρCa9Al6O18
are the densities of CaO, CaCO3 andCa9Al6O18, which are equal to 3.34, 2.70, and 3.04 g/cm3, respec-tively. For the CC-AN-80 sorbent, Z is calculated to be 1.95.Corresponding to the well-known two stages during the carbona-tion period, the rapid surface reaction-controlled stage and theslow product layer diffusion-controlled stage, two expressions canbe derived from Eq. (2), respectively (Bhatia and Perlmutter, 1983;Grasa et al., 2009),
1ψ
ffiffiffiffiffiffiffiffiffiffiffiffiffiffiffiffiffiffiffiffiffiffiffiffiffiffi1−ψ lnð1−XÞ
p−1
h i¼ kRPMS0ðCb−CeÞt
2ð1−ε0Þð10Þ
1ψ
ffiffiffiffiffiffiffiffiffiffiffiffiffiffiffiffiffiffiffiffiffiffiffiffiffiffi1−ψ lnð1−XÞ
p−1
h i¼ S0
1−ε0
ffiffiffiffiffiffiffiffiffiffiffiffiffiffiffiffiffiffiffiffiffiffiffiffiffiffiffiffiffiDRPMMCaOCbt
2ρCaOZ
sð11Þ
Based on the experimental data, the intrinsic rate constant kRPMcan be estimated by plotting the left side in Eq. (10) vs. time, and,similarly, the effective product layer diffusion coefficient DRPM canbe determined by plotting the left side in Eq. (11) vs. the squareroot of time.
3.2. Overlapping grain model (OGM)
The OGM model developed by Liu et al. (2012b) is used todescribe the carbonation kinetics of the synthetic CC-AN-80sorbent. For the sake of simplicity, several assumptions are madein the development of the model, which are:
(1)
Each sorbent particle is composed of spherical grains withdifferent sizes, which is evidenced by the SEM images of thefresh sorbent (Fig. 1A and B);(2)
The active CaO is uniformly mixed with the inert Ca9Al6O18within the sorbent, which is reasonable from the SEM-EDSmapping of the sorbent (Fig. 1C);
(3)
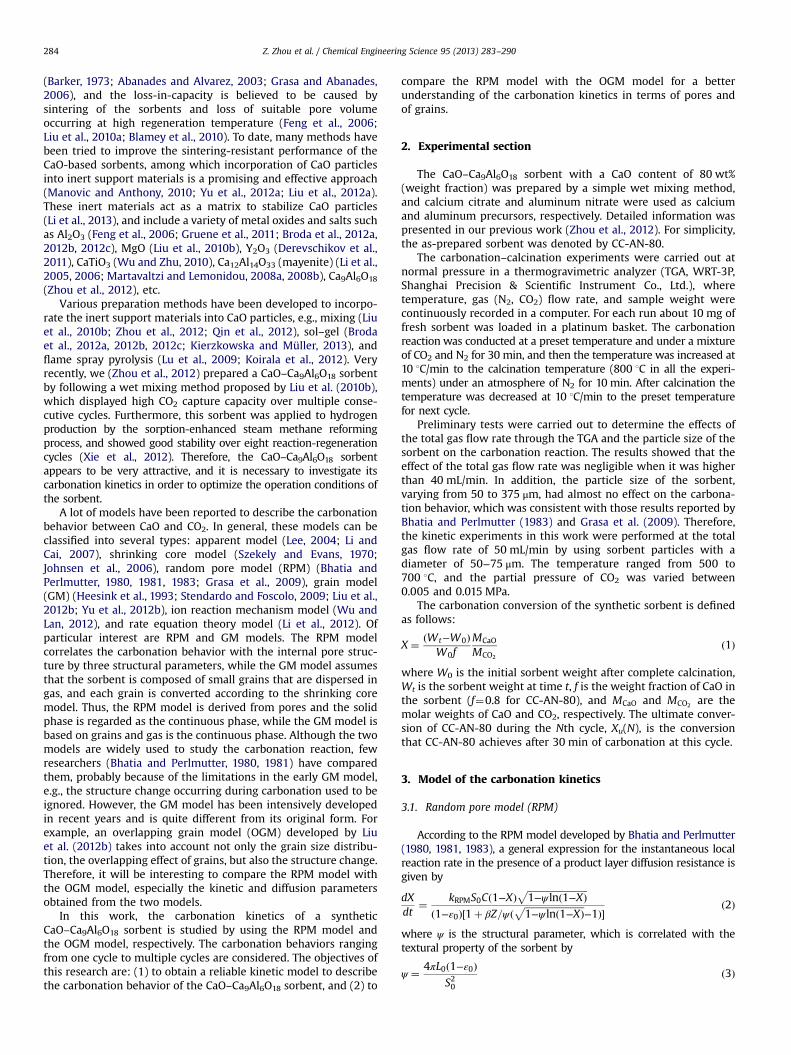
The local concentration of CO2 within the voids of the sorbentparticle is constant and equal to the bulk concentration, which isreasonable by taking into account the relatively large pore size ofCC-AN-80 (Fig. 2). Large pores can not only prevent the poreblockage due to the carbonate layer formed on the surface of CaO(the critical product layer thickness is around 50 nm (Alvarez andAbanades, 2005)), but also supply accessible pathways for CO2diffusion with negligible gas diffusion resistances within thesorbent particle. This assumption is also proved to be correct formodeling the carbonation behavior of another synthetic sorbentcomposed of 85 wt% CaO and 15 wt% mayenite (Ca12Al14O33) (Liuet al., 2012b).
The OGM model consists of a set of equations (Eqs. (12)–(16)),and detailed information on the model development was pre-sented elsewhere (Liu et al., 2012b).
drc;idt
¼−VCaODOGMðCb−CeÞ
rc;i½1−ðrc;i=rg;iÞ� þ ðDOGM=kOGMÞ ð12Þ
drg;idt
¼ −drc;idt
ðZ−1Þ εcεg
r2c;ir2g;i
" #ð13Þ
1 10 100 1000
0.0000
0.0005
0.0010
0.0015
0.0020
0.0025
dV/d
D /
cm3 /(
g.nm
)
D / nm
Fig. 2. Pore size distribution of the fresh CC-AN-80 sorbent.
0 10 20 30 40 500.0
0.2
0.4
0.6
0.8
1.0Experimental; Predicted
Xu(
N)
Number of cycles
0 500 1000 1500 2000 2500 3000 35000.0
0.1
0.2
0.3
0.4
0.5
0.6
0.7
CO
2 ca
ptur
e ca
paci
ty /
g/g
Time / min
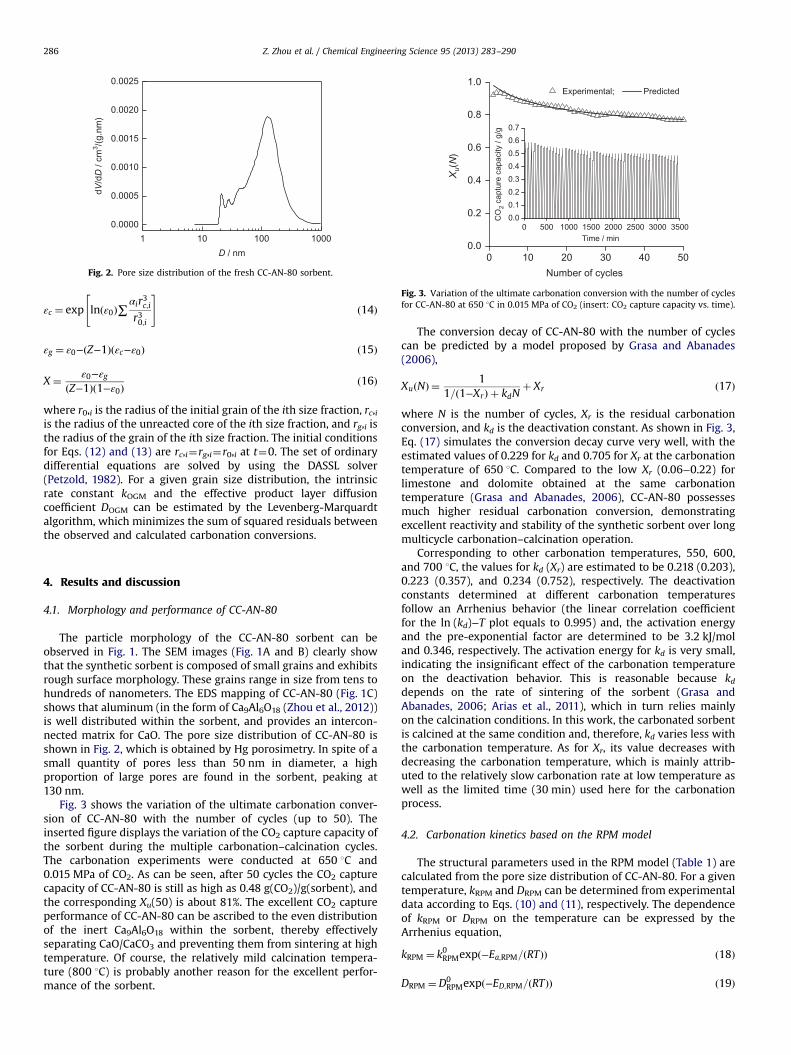
Fig. 3. Variation of the ultimate carbonation conversion with the number of cyclesfor CC-AN-80 at 650 1C in 0.015 MPa of CO2 (insert: CO2 capture capacity vs. time).
Z. Zhou et al. / Chemical Engineering Science 95 (2013) 283–290286
εc ¼ exp lnðε0Þ∑αir3c;ir30;i
" #ð14Þ
εg ¼ ε0−ðZ−1Þðεc−ε0Þ ð15Þ
X ¼ ε0−εgðZ−1Þð1−ε0Þ
ð16Þ
where r0,i is the radius of the initial grain of the ith size fraction, rc,iis the radius of the unreacted core of the ith size fraction, and rg,i isthe radius of the grain of the ith size fraction. The initial conditionsfor Eqs. (12) and (13) are rc,i¼rg,i¼r0,i at t¼0. The set of ordinarydifferential equations are solved by using the DASSL solver(Petzold, 1982). For a given grain size distribution, the intrinsicrate constant kOGM and the effective product layer diffusioncoefficient DOGM can be estimated by the Levenberg-Marquardtalgorithm, which minimizes the sum of squared residuals betweenthe observed and calculated carbonation conversions.
4. Results and discussion
4.1. Morphology and performance of CC-AN-80
The particle morphology of the CC-AN-80 sorbent can beobserved in Fig. 1. The SEM images (Fig. 1A and B) clearly showthat the synthetic sorbent is composed of small grains and exhibitsrough surface morphology. These grains range in size from tens tohundreds of nanometers. The EDS mapping of CC-AN-80 (Fig. 1C)shows that aluminum (in the form of Ca9Al6O18 (Zhou et al., 2012))is well distributed within the sorbent, and provides an intercon-nected matrix for CaO. The pore size distribution of CC-AN-80 isshown in Fig. 2, which is obtained by Hg porosimetry. In spite of asmall quantity of pores less than 50 nm in diameter, a highproportion of large pores are found in the sorbent, peaking at130 nm.
Fig. 3 shows the variation of the ultimate carbonation conver-sion of CC-AN-80 with the number of cycles (up to 50). Theinserted figure displays the variation of the CO2 capture capacity ofthe sorbent during the multiple carbonation–calcination cycles.The carbonation experiments were conducted at 650 1C and0.015 MPa of CO2. As can be seen, after 50 cycles the CO2 capturecapacity of CC-AN-80 is still as high as 0.48 g(CO2)/g(sorbent), andthe corresponding Xu(50) is about 81%. The excellent CO2 captureperformance of CC-AN-80 can be ascribed to the even distributionof the inert Ca9Al6O18 within the sorbent, thereby effectivelyseparating CaO/CaCO3 and preventing them from sintering at hightemperature. Of course, the relatively mild calcination tempera-ture (800 1C) is probably another reason for the excellent perfor-mance of the sorbent.
The conversion decay of CC-AN-80 with the number of cyclescan be predicted by a model proposed by Grasa and Abanades(2006),
XuðNÞ ¼1
1=ð1−XrÞ þ kdNþ Xr ð17Þ
where N is the number of cycles, Xr is the residual carbonationconversion, and kd is the deactivation constant. As shown in Fig. 3,Eq. (17) simulates the conversion decay curve very well, with theestimated values of 0.229 for kd and 0.705 for Xr at the carbonationtemperature of 650 1C. Compared to the low Xr (0.06−0.22) forlimestone and dolomite obtained at the same carbonationtemperature (Grasa and Abanades, 2006), CC-AN-80 possessesmuch higher residual carbonation conversion, demonstratingexcellent reactivity and stability of the synthetic sorbent over longmulticycle carbonation–calcination operation.
Corresponding to other carbonation temperatures, 550, 600,and 700 1C, the values for kd (Xr) are estimated to be 0.218 (0.203),0.223 (0.357), and 0.234 (0.752), respectively. The deactivationconstants determined at different carbonation temperaturesfollow an Arrhenius behavior (the linear correlation coefficientfor the ln (kd)−T plot equals to 0.995) and, the activation energyand the pre-exponential factor are determined to be 3.2 kJ/moland 0.346, respectively. The activation energy for kd is very small,indicating the insignificant effect of the carbonation temperatureon the deactivation behavior. This is reasonable because kddepends on the rate of sintering of the sorbent (Grasa andAbanades, 2006; Arias et al., 2011), which in turn relies mainlyon the calcination conditions. In this work, the carbonated sorbentis calcined at the same condition and, therefore, kd varies less withthe carbonation temperature. As for Xr, its value decreases withdecreasing the carbonation temperature, which is mainly attrib-uted to the relatively slow carbonation rate at low temperature aswell as the limited time (30 min) used here for the carbonationprocess.
4.2. Carbonation kinetics based on the RPM model
The structural parameters used in the RPM model (Table 1) arecalculated from the pore size distribution of CC-AN-80. For a giventemperature, kRPM and DRPM can be determined from experimentaldata according to Eqs. (10) and (11), respectively. The dependenceof kRPM or DRPM on the temperature can be expressed by theArrhenius equation,
kRPM ¼ k0RPMexpð−Ea;RPM=ðRTÞÞ ð18Þ
DRPM ¼D0RPMexpð−ED;RPM=ðRTÞÞ ð19Þ

Table 1Structural and kinetic parameters of CC-AN-80 (RPM model).
L0 (m/m3) S0 (m2/m3) ε0 ψ k0RPM (m4/(mol s)) Ea,RPM (kJ/mol) D0RPM (m2/s) ED,RPM (kJ/mol)
6.131�1013 1.525�107 0.487 1.698 5.664�10−9 28.4 1.460�10−9 88.7
9.0x10⁻⁴ 1.0x10⁻³ 1.1x10⁻³ 1.2x10⁻³ 1.3x10⁻³ 1.4x10⁻³-35.0
-34.0
-33.0
-32.0
-31.0
-23.6
-23.4
-23.2
-23.0
-22.8
-22.6
-22.4
ln(D
RP
M)
1/T / K-1
R2 = 0.989
ln(K
RP
M)
R2 = 0.988
Fig. 4. ln(kRPM) or ln(DRPM) against 1/T.
0 500 1000 1500 20000.0
0.2
0.4
0.6
0.8
0.0
0.2
0.4
0.6
0.8
0.0
0.2
0.4
0.6
0.8
1.0
t / s
X
Fig. 5. Comparison of experimental conversion curves and those predicted by theRPM model under various carbonation conditions. Symbols: experimental data;lines: predicted results.
Table 2Discrete grain size distribution of CC-AN-80 (OGMmodel).
r0,i (nm) αi
50 0.40100 0.30200 0.15400 0.10800 0.05
Z. Zhou et al. / Chemical Engineering Science 95 (2013) 283–290 287
As shown in Fig. 4, a good linear relationship is observedbetween ln (kRPM) or ln (DRPM) and 1/T. The estimated pre-exponential factors and activation energies are listed in Table 1.The activation energy at the reaction-controlled stage for CC-AN-80is 28.4 kJ/mol, which agrees well with the values reported by Sunet al. (2008a), 29±4. kJ/mol for Strassburg limestone and 2476kJ/mol for Arctic dolomite, by Grasa et al. (2009), 21.3 kJ/mol forImeco limestone and 19.2 kJ/mol for Katowice limestone, and byWu and Lan (2012), 30.2 kJ/mol for nano-CaO. In the reaction-controlled regime, effects of all diffusion resistances can beneglected, i.e., the carbonation reaction between CaO and CO2 couldbe regarded as a pure surface reaction. As a result, the activationenergy in the kinetic regime has no correlation with the type ofsorbents as well as the textural properties.
The activation energy in the product layer diffusion-controlledregime for CC-AN-80 is 88.7 kJ/mol. A literature survey indicatesthat the activation energy in this regime varies with the type ofsorbent, e.g., 179.277.0 kJ/mol for Quincy limestone (Bhatia andPerlmutter, 1983), 238.5 kJ/mol for nonporous CaO crystals (Messet al., 1999), 102.5 kJ/mol for mesoporous PCC-CaO prepared by awet precipitation method (Gupta and Fan, 2002; Lee, 2004),70.3 kJ/mol for nano-CaO (Shi et al., 2009), and 163 kJ/mol forImeco and Katowice limestones (Grasa et al., 2009). In view ofdifferent values reported, it can be concluded that the carbonationreaction of CaO-based sorbents in the diffusion control regime isstrongly dependent on the morphology and texture of thesorbents (Gupta and Fan, 2002; Lee, 2004; Sun et al., 2008b).
The carbonation of CC-AN-80 can be well predicted by using theRPM model with the structural, kinetic, and diffusion parameterslisted in Table 1. As shown in Fig. 5, the predicted conversion curvesare in good agreement with the experimental data over the range oftemperatures and CO2 concentrations tested.
4.3. Carbonation kinetics based on the OGM model
In the OGM model, the grain size distribution of the sorbent isan input parameter, which cannot be determined from the poresize distribution curve. Here we follow the method proposed byHeesink et al. (1993) and Liu et al. (2012b), i.e., by analyzing theSEM images of the sorbent to obtain a discrete grain size
distribution (Table 2). By applying this grain size distribution tofit the experimental data, kOGM and DOGM can be estimated. Fig. 6presents the predicted conversion curve and the experimentaldata for carbonation in 10 vol% CO2 (CO2 partial pressure:0.010 MPa) at 600 1C. A good agreement between experimentaland predicted conversions is observed with the estimated valuesof kOGM and DOGM equal to 1.53�10−5 m/s and 2.15�10–13 m2/s,respectively.
The same kOGM and DOGM together with the same grain sizedistribution are further used to predict the carbonation conver-sions under other CO2 partial pressures (0.005 and 0.015 MPa) at600 1C. It can be seen from Fig. 7 that the predicted conversionsagree with the experimental data, indicating the accuracy of thegrain size distribution obtained by the SEM analysis. Next, thisdiscrete grain size distribution is used to fit the conversion curvesat other temperatures in order to obtain the corresponding valuesof kOGM and DOGM.

0 500 1000 1500 20000.0
0.2
0.4
0.6
0.8
1.0X
t / s
Fig. 6. Experimental and predicted conversion curves by the OGM model at 600 1Cin 0.010 MPa of CO2.
0 500 1000 1500 20000.0
0.2
0.4
0.6
0.8
1.0
600°C, 0.015 MPa CO2
Predicted by the OGM model
X
t / s
600°C, 0.015 MPa CO2
Fig. 7. Experimental and predicted conversion curves by the OGM model at 600 1Cin 0.005 and 0.015 MPa of CO2.
0 500 1000 1500 20000.00.20.40.60.80.00.20.40.60.80.00.20.40.60.80.00.20.40.60.81.0
t / s
X
700 °C
650 °C
550 °C
Predicted by the OGM model 500 °C
Fig. 8. Experimental and predicted conversion curves by the OGMmodel at varioustemperatures in 0.010 MPa of CO2.
9.0x10⁻⁴ 1.0x10⁻³ 1.1x10⁻³ 1.2x10⁻³ 1.3x10⁻³ 1.4x10⁻³-33.0
-32.0
-31.0
-30.0
-29.0
-28.0
-11.8-11.6-11.4-11.2-11.0-10.8-10.6-10.4
R2 = 0.976
ln(D
OG
M)
1/T / K-1
R2 = 0.992ln
(KO
GM
)
Fig. 9. ln(kOGM) or ln(DOGM) against 1/T.
Z. Zhou et al. / Chemical Engineering Science 95 (2013) 283–290288
Corresponding to the reaction temperatures of 500, 550, 650and 700 1C, the estimated values of kOGM are equal to 9.26�10–6,1.23�10–5, 2.08�10−5, and 2.60�10−5 m/s, respectively, and forDOGM the values are 2.07�10–14, 5.46�10–14, 4.21�10–13, and6.61�10–13 m2/s, respectively, as presented in Fig. 8. It can be seenthat the OGM model is able to predict the carbonation behavior ofCC-AN-80 very well for the experimental conditions tested.As shown in Fig. 9, the temperature dependence of kOGM and DOGM
follows, as expected, the Arrhenius equation: kOGM¼1.39�10−3
exp(−32330/(RT)) m/s and DOGM¼9.51�10−7exp(−113096/(RT))m2/s. The estimated activation energies based on the OGM modelare 32.3 kJ/mol for the surface reaction and 113.1 kJ/mol for theeffective product layer diffusion, which are comparable to thoseobtained by the RPM model, viz. 28.4 and 88.7 kJ/mol.
As far as the effective product layer diffusion coefficient (D)is concerned, DOGM (average value of 2.74�10–13 m2/s at 500−700 1C) derived from the OGM model is higher than DRPM
(average value of 1.03�10–14 m2/s) from the RPM model.Similarly, for the intrinsic rate constant (k), kOGM (average value of1.67�10−5 m/s) is also higher than kRPM0 (kRPM0 ¼ kRPM=V
n
CaO, averagevalue of 5.44�10−6 m/s). These discrepancies might be related to thefact that the two models make use of different methods to handlethe carbonation conversion curve. For the RPM model, the conver-sion curve is divided into two regions: in the reaction-controlledregion, the product layer diffusion is not considered; in the productlayer diffusion-controlled region, the surface reaction is neglected.But for the OGM model, the conversion curve is treated as a whole,and both the surface reaction and the product layer diffusion areconsidered throughout the carbonation process.
It should be noted that the intrinsic rate constant of CC-AN-80is somewhat smaller than that of limestone (average values of
3.52�10−5 m/s by Bhatia and Perlmutter (1983) and 2.22�10−5 m/s by Grasa et al. (2009)). The same result was also obtainedby Dennis and Pacciani (2009), who reported 3.5�10−6 m/s for asynthetic HA-85-850 sorbent composed of 85 wt% CaO and 15 wt%mayenite. This is because the mixture of active CaO and inertsupport material (Ca9Al6O18 for CC-AN-80 or Ca12Al14O33 for HA-85-850) in the synthetic sorbents decreases the effective concen-tration of CaO per unit area of pore surface (Dennis and Pacciani,2009). In contrast, the effective product layer diffusion coefficientof CC-AN-80 is higher than that of limestone (10–18–10–21 m2/s byBhatia and Perlmutter (1983) and 3.3�10–17–7.7�10–15 m2/s byGrasa et al. (2009)). The higher effective product layer diffusivity ofCC-AN-80 arises from Ca9Al6O18 that remains inert during carbo-nation, and therefore supplies additional pore volume to facilitatethe diffusion of CO2 through the product layer of the sorbent.
4.4. Prediction of multicycle carbonation
As reported above, both the RPM model and the OGM modelcan predict the carbonation conversion of CC-AN-80 at the firstcycle. However, the major concern is whether these models areable to describe the carbonation behavior over multiple cycles

Z. Zhou et al. / Chemical Engineering Science 95 (2013) 283–290 289
since the CO2 capture capacity of CaO-based sorbents is known todecrease with the number of carbonation–calcination cycles. Wefind that the carbonation conversion of CC-AN-80 at the Nth cyclecan be predicted from the conversion at the first cycle byintroducing a simple factor as follows,
XðNÞ ¼ Xð1ÞXuðNÞXuð1Þ
ð20Þ
where XuðNÞ=Xuð1Þ represents the effect of the conversion decay ofCC-AN-80 after multiple cycles. An implicit assumption in Eq. (20)is that the conversion decay obtained from the ultimate conver-sion is applicable to the entire carbonation process. This assump-tion is not unreasonable because the decay of the sorption capacityis mostly caused by degradation of the texture of the sorbent,which in turn influences the whole carbonation process. Strictlyspeaking, in order to apply the RPM or OGM model to predict themulticycle carbonation process, one should know the pore sizedistribution or the grain size distribution of the sorbent after everycalcination step. However, there is no detailed sintering modelcapable of describing variation of pore- or grain-size distributionduring the cyclic process. In the present work, the factorXuðNÞ=Xuð1Þ is used to express the activity variation of the sorbentderived mainly from the textural evolution during multiple cycles.A similar simplification was made by Grasa et al. (2009), whoassumed that the textural evolution of the sorbent could becorrelated with the maximum carbonation conversion whichwas calculated from Eq. (17).
Fig. 10 compares experimental and predicted conversions at 5,10, 20, 30, 40, and 50 cycles. It can be seen that both the RPMmodel (solid lines) and the OGM model (dashed lines) cansuccessfully describe the carbonation behavior of CC-AN-80 overmultiple cycles, which demonstrates the reliability of the method
0 400 800 1200 1600 20000.00.20.40.60.80.00.20.40.60.80.00.20.40.60.80.00.20.40.60.80.00.20.40.60.80.00.20.40.60.81.0
50 th
t / s
40 th
30 th
X(N
) 20 th
5 th
10 th
Predicted by the RPM model Predicted by the OGM model
Fig. 10. Prediction of the carbonation conversion over multiple cycles (650 1C,0.015 MPa of CO2) by the RPM model and the OGM model.
that makes use of the factor (Xu(N)/Xu(1)) to describe the activitydecay of the sorbent with the number of cycles.
5. Conclusions
A synthetic CaO–Ca9Al6O18 sorbent composed of 80 wt% CaOand 20 wt% Ca9Al6O18 exhibited high CO2 capture capacity andgood stability over multiple carbonation–calcination cycles (up to50 cycles). The excellent performance of CaO–Ca9Al6O18 is ascribedto the even distribution of the inert Ca9Al6O18 that acts as asupport matrix to stabilize CaO particles. Both RPM and OGMmodels were used to describe the carbonation behaviors of thesorbent. In the RPM model (a pore model) the carbonation periodwas divided into two stages, viz., the surface reaction-controlledstage and the product layer diffusion-controlled stage, and accord-ingly, the carbonation behavior was predicted separately.In contrast to the RPM model, the OGM model (a grain model)dealt with the carbonation as a whole. A comparison of experi-mental and predicted conversion profiles for the carbonation ofCaO–Ca9Al6O18 demonstrated the reliability of both RPM and OGMmodels. Under the experimental conditions investigated, theintrinsic rate constants and the effective product layer diffusioncoefficients estimated by the OGM model were higher than thoseby the RPM model, which was probably caused by the differentmethods of the two models in coping with the carbonation of thesorbent. The RPM and OGM models together with the kinetic anddiffusion parameters obtained from one cycle were successfullyextended to predict the carbonation behaviors of CaO–Ca9Al6O18
during multiple carbonation–calcination cycles.
Nomenclature
C concentration of CO2, mol/m3
Cb bulk concentration of CO2, mol/m3
Ce equilibrium concentration of CO2, mol/m3
DOGM effective product layer diffusion coefficient based on theOGM model, m2/s
DRPM effective product layer diffusion coefficient based on theRPM model, m2/s
Ea activation energy at the surface reaction-controlledstage, kJ/mol
ED activation energy at the product layer diffusion-controlled stage, kJ/mol
f weight fraction of CaO in the sorbentkd deactivation constant of the sorbentkOGM intrinsic rate constant based on the OGM model, m/skRPM intrinsic rate constant based on the RPM model,
m4/(mol s)L0 initial total length of pore system per unit volume, m/m3
MCaCO3 molar mass of CaCO3, g/molMCaO molar mass of CaO, g/molMCO2 molar mass of CO2, g/molN number of cyclesR gas constant, J/(mol K)r radial position within a grain, mr0,i radius of the initial grain of the ith size fraction, mrc,i radius of the unreacted core of the ith size fraction, mrg,i radius of the grain of the ith size fraction, mS0 initial surface area per unit volume, m2/m3
T temperature, Kt time, sVn
CaCO3diluted molar volume of CaCO3 in the sorbent, m3/mol
Vn
CaO diluted molar volume of CaO in the sorbent, m3/molv0(r) pore radii distribution, 1/m

Z. Zhou et al. / Chemical Engineering Science 95 (2013) 283–290290
W0 initial sorbent weight after complete calcination, gWt sorbent weight at time t, gX carbonation conversion of the sorbentX(N) carbonation conversion of the sorbent at the Nth cycleXr residual carbonation conversion of the sorbentXu(N) ultimate carbonation conversion of the sorbent at the
Nth cycleZ ratio of the molar volume of the carbonation product to
that of the reactant
Greek letters
αi fraction of solid occupied by grains of the ith size fractionβ modified Biot modulus, 2kRPMð1−ε0Þ=Vn
CaODRPMS0ε0 initial porosity of the sorbentεc volume fraction occupied by the unreacted coresεg local porosity within the sorbentρCa9Al6O18
mass density of Ca9Al6O18, kg/m3
ρCaCO3mass density of CaCO3, kg/m3
ρCaO mass density of CaO, kg/m3
ψ structural parameter, 4πL0ð1−ε0Þ=S20
Acknowledgments
We gratefully acknowledge financial supports from the NationalNatural Science Foundation of China (No. 21276076) and the “111”Project (No. B08021).
References
Abanades, J.C., Alvarez, D., 2003. Conversion limits in the reaction of CO2 with lime.Energy Fuels 17, 308–315.
Alvarez, D., Abanades, J.C., 2005. Determination of the critical product layerthickness in the reaction of CaO with CO2. Ind. Eng. Chem. Res. 44, 5608–5615.
Anthony, E.J., 2011. Ca looping technology: current status, developments and futuredirections. Greenhouse Gases: Sci. Technol. 1, 36–47.
Arias, B., Abanades, J.C., Grasa, G.S., 2011. An analysis of the effect of carbonationconditions on CaO deactivation curves. Chem. Eng. J. 167, 255–261.
Barker, R., 1973. The reversibility of the reaction CaCO3¼CaO+CO2. J. Appl. Chem.Biotechnol. 23, 733–742.
Bhatia, S.K., Perlmutter, D.D., 1980. A random pore model for fluid–solid reactions:I. Isothermal, kinetic control. AIChE J. 26, 379–386.
Bhatia, S.K., Perlmutter, D.D., 1981. A random pore model for fluid–solid reactions:II. Diffusion and transport effects. AIChE J. 27, 247–254.
Bhatia, S.K., Perlmutter, D.D., 1983. Effect of the product layer on the kinetics of theCO2–lime reaction. AIChE J. 29, 79–86.
Blamey, J., Anthony, E.J., Wang, J., Fennell, P.S., 2010. The calcium looping cycle forlarge-scale CO2 capture. Prog. Energy Combust. Sci. 36, 260–279.
Broda, M., Kierzkowska, A.M., Müller, C.R., 2012a. Application of the sol–geltechnique to develop synthetic calcium-based sorbents with excellent carbondioxide capture characteristics. ChemSusChem 5, 411–418.
Broda, M., Müller, C.R., 2012b. Synthesis of highly efficient, Ca-based, Al2O3-stabilized, carbon gel-templated CO2 sorbents. Adv. Mater. 24, 3059–3064.
Broda, M., Kierzkowska, A.M., Müller, C.R., 2012c. Influence of the calcination andcarbonation conditions on the CO2 uptake of synthetic Ca-based CO2 sorbents.Environ. Sci. Technol. 46, 10849–10856.
Dennis, J.S., Pacciani, R., 2009. The rate and extent of uptake of CO2 by a synthetic,CaO-containing sorbent. Chem. Eng. Sci. 64, 2147–2157.
Derevschikov, V.S., Lysikov, A.I., Okunev, A.G., 2011. High temperature CaO/Y2O3
carbon dioxide absorbent with enhanced stability for sorption-enhancedreforming applications. Ind. Eng. Chem. Res. 50, 12741–12749.
Fan, L.S., 2010. Chemical Looping Systems for Fossil Energy Conversion. Wiley, New York.Feng, B., Liu, W.Q., Li, X., An, H., 2006. Overcoming the problem of loss-in-capacity
of calcium oxide in CO2 capture. Energy Fuels 20, 2417–2420.Grasa, G.S., Abanades, J.C., 2006. CO2 capture capacity of CaO in long series of
carbonation/ calcination cycles. Ind. Eng. Chem. Res. 45, 8846–8851.Grasa, G., Murillo, R., Alonso, M., Abanades, J.C., 2009. Application of the random
pore model to the carbonation cyclic reaction. AIChE J. 55, 1246–1255.Gruene, P., Belova, A.G., Yegulalp, T.M., Farrauto, R.J., Castaldi, M.J., 2011. Dispersed
calcium oxides as a reversible and efficient CO2-sorbent at intermediatetemperatures. Ind. Eng. Chem. Res. 50, 4042–4049.
Gupta, H., Fan, L.S., 2002. Carbonation–calcination cycle using high reactivitycalcium oxide for carbon dioxide separation from flue gas. Ind. Eng. Chem.Res. 41, 4035–4042.
Heesink, A.B.M., Prins, W., van Swaaij, W.P.M., 1993. A grain size distribution modelfor non-catalytic gas–solid reactions. Chem. Eng. J. 53, 25–37.
International Energy Agency (IEA), 2008. CO2 Capture and Storage: A Key CarbonAbatement Option. IEA Publications, Paris.
Johnsen, K., Grace, J.R., Elnashaie, S.S.E.H., Kolbeinsen, L., Eriksen, D., 2006.Modeling of sorption-enhanced steam reforming in a dual fluidized bubblingbed reactor. Ind. Eng. Chem. Res. 45, 4133–4144.
Kierzkowska, A.M., Müller, C.R., 2013. Sol–gel derived, calcium-based, copper-functionalised CO2 sorbents for an integrated chemical looping combustion-calcium looping CO2 capture process. ChemPlusChem 78, 92–100.
Koirala, R., Reddy, G.K., Smirniotis, P.G., 2012. Single nozzle flame-made highlydurable metal doped Ca-based sorbents for CO2 capture at high temperature.Energy Fuels 26, 3103–3109.
Lee, D.K., 2004. An apparent kinetic model for the carbonation of calcium oxide bycarbon dioxide. Chem. Eng. J. 100, 71–77.
Li, Z.S., Cai, N.S., Huang, Y.Y., Han, H.J., 2005. Synthesis, experimental studies, and analysisof a new calcium-based carbon dioxide absorbent. Energy Fuels 19, 1447–1452.
Li, Z.S., Cai, N.S., Huang, Y.Y., 2006. Effect of preparation temperature on cyclic CO2
capture and multiple carbonation–calcination cycles for a new-based sorbent.Ind. Eng. Chem. Res. 45, 1911–1917.
Li, Z.S., Cai, N.S., 2007. Modeling of multiple cycles for sorption-enhanced steammethane reforming and sorbent regeneration in fixed bed reactor. Energy Fuels21, 2909–2918.
Li, Z.S., Sun, H.M., Cai, N.S., 2012. Rate equation theory for the carbonation reactionof CaO with CO2. Energy Fuels 26, 4607–4616.
Li, Z.S., Liu, Y., Cai, N.S., 2013. Understanding the effect of inert support on the reactivitystabilization for synthetic calcium based sorbents. Chem. Eng. Sci. 89, 235–243.
Liu, W.Q., Low, N.W., Feng, B., Wang, G.X., Diniz Da Costa, J.C., 2010a. Calciumprecursors for the production of CaO sorbents for multicycle CO2 capture.Environ. Sci. Technol. 44, 841–847.
Liu, W.Q., Feng, B., Wu, Y.Q., Wang, G.X., Barry, J., Diniz Da Costa, J.C., 2010b.Synthesis of sintering-resistant sorbents for CO2 capture. Environ. Sci. Technol.44, 3093–3097.
Liu, W.Q., An, H., Qin, C.L., Yin, J.J, Wang, G.X., Feng, B., Xu, M.H., 2012a. Performanceenhancement of calcium sorbents for cyclic CO2 capture—a review. EnergyFuels 26, 2751–2767.
Liu, W., Dennis, J.S., Sultan, D.S., Redfern, S.A.T., Scott, S.A., 2012b. An investigationof the kinetics of CO2 uptake by a synthetic calcium based sorbent. Chem. Eng.Sci. 69, 644–658.
Lu, H., Khan, A., Pratsinis, S.E., Smirniotis, P.G., 2009. Flame-made durable doped-CaO nanosorbents for CO2 capture. Energy Fuels 23, 1093–1100.
Manovic, V., Anthony, E.J., 2010. Lime-based sorbents for high-temperature CO2
capture—a review of sorbent modification methods. Int. J. Environ. Res. PublicHealth 7, 3129–3140.
Martavaltzi, C.S., Lemonidou, A.A., 2008a. Development of new CaO based sorbentmaterials for CO2 removal at high temperature. Microporous MesoporousMater. 110, 119–127.
Martavaltzi, C.S., Lemonidou, A.A., 2008b. Parametric study of the CaO–Ca12Al14O33
synthesis with respect to high CO2 sorption capacity and stability on multicycleoperation. Ind. Eng. Chem. Res. 47, 9537–9543.
Mess, D., Sarofim, A.F., Longwell, J.P., 1999. Product layer diffusion during thereaction of calcium oxide with carbon dioxide. Energy Fuels 13, 999–1005.
Petzold, L.R., 1982. A Description of DASSL: A Differential/Algebraic System Solver.Sandia National Laboratories, Albuquerque, NM, Report SAND82-8637.
Qin, C.L., Liu, W.Q., An, H., Yin, J.J., Feng, B., 2012. Fabrication of CaO-based sorbentsfor CO2 capture by a mixing method. Environ. Sci. Technol. 46, 1932–1939.
Shi, Q., Wu, S.F., Jiang, M.Z., Li, Q.H., 2009. Reactive sorption–decomposition kineticsof nano Ca-based CO2 sorbents. CIESC J. 60, 641–648.
Sun, P., Grace, J.R., Lim, C.J., Anthony, E.J., 2008a. Determination of intrinsic rateconstants of the CaO–CO2 reaction. Chem. Eng. Sci. 63, 47–56.
Sun, P., Grace, J.R., Lim, C.J., Anthony, E.J., 2008b. A discrete-pore-size-distribution-based gas–solid model and its application to the CaO+CO2 reaction. Chem. Eng. Sci.63, 57–70.
Stendardo, S., Foscolo, P.U., 2009. Carbon dioxide capture with dolomite: a modelfor gas–solid reaction within the grains of a particulate sorbent. Chem. Eng. Sci.64, 2343–2352.
Szekely, J., Evans, J.W., 1970. A structural model for gas–solid reactions with amoving boundary. Chem. Eng. Sci. 25, 1091–1107.
Wu, S.F., Zhu, Y.Q., 2010. Behavior of CaTiO3/nano-CaO as a CO2 reactive adsorbent.Ind. Eng. Chem. Res. 49, 2701–2706.
Wu, S.F., Lan, P.Q., 2012. A kinetic model of nano-CaO reactions with CO2 in asorption complex catalyst. AIChE J. 58, 1570–1577.
Xie, M.M., Zhou, Z.M., Qi, Y., Cheng, Z.M., Yuan, W.K., 2012. Sorption-enhancedsteam methane reforming by in situ CO2 capture on a CaO–Ca9Al6O18 sorbent.Chem. Eng. J. 207–208, 142–150.
Yu, F.C., Phalak, N., Sun, Z.C., Fan, L.S., 2012a. Activation strategies for calcium-basedsorbents for CO2 capture: a perspective. Ind. Eng. Chem. Res. 51, 2133–2142.
Yu, Y.S., Liu, W.Q., An, H., Yang, F.S., Wang, G.X., Feng, B., Zhang, Z.X., Rudolph, V.,2012b. Modeling of the carbonation behavior of a calcium based sorbent forCO2 capture. Int. J. Greenhouse Gas Cont. 10, 510–519.
Zhou, Z.M., Qi, Y., Xie, M.M., Cheng, Z.M., Yuan, W.K., 2012. Synthesis of CaO-basedsorbents through incorporation of alumina/aluminate and their CO2 captureperformance. Chem. Eng. Sci. 74, 172–180.