MODELING OF TA-50 RADIOACTIVE LIQUID WASTE … OF TA-50 RADIOACTIVE LIQUID WASTE PROCESSING ... are...
16
WM’04 Conference, February 29-March 4, 2004, Tucson, AZ WM-4179 MODELING OF TA-50 RADIOACTIVE LIQUID WASTE PROCESSING M. M. Choi, T. J. Farish, V. P. Worland Los Alamos National Laboratory P.O. Box 1663, Los Alamos, NM 87545 ABSTRACT Most radioactive liquid wastes from the Los Alamos National Laboratory (LANL) are treated at the Technical Area 50 (TA-50) Radioactive Liquid Waste Treatment Facility (RLWTF). In 2002, 1,684 liters of caustic waste, 14,602 liters of acid waste, and 11.489 million liters of industrial wastes were treated. The acid and caustic wastes come primarily from Plutonium Facility 4 (PF-4) located at TA-55, and contain significant concentrations of radioactive materials, such as Plutonium (Pu) and Americium (Am), which are sensitive nuclear materials closely monitored by LANL. A new model of the RLWTF was developed using the simulation software EXTEND TM . The model simulates chemical processes within the RLWTF and predicts the amount of radioactive materials output by the RLWTF for different input scenarios. The model also tracks Am and Pu isotopes within the facility. Performance data for the major chemical separation units in the model were benchmarked using RLWTF historical processing data from 1994 to 2000. The model was then used to predict the impact that changes in upstream processing at TA-55 would have on the processing needs and waste drum productions at the RLWTF. ACRONYMS AND ABBREVIATIONS Am Americium Ci Curie(s) CL Clarifier CMR Chemistry and Metallurgy Research CST Chemical Science and Technology CUF Centrifugal ultra filtration D-2 Decision Applications Division, Group D-2, also known as the Stockpile Complex Modeling and Analysis group DOP Detailed Operating Procedure EDR Electro dialysis reversal FWO-WFM Facility and Waste Operations - Waste Facility Management LANL Los Alamos National Laboratory NaOH Sodium hydroxide NE Northeast NPDES National Polluntant Discharge Elimination System NW Northwest
Transcript of MODELING OF TA-50 RADIOACTIVE LIQUID WASTE … OF TA-50 RADIOACTIVE LIQUID WASTE PROCESSING ... are...

WM’04 Conference, February 29-March 4, 2004, Tucson, AZ WM-4179
MODELING OF TA-50 RADIOACTIVE LIQUID WASTE PROCESSING
M. M. Choi, T. J. Farish, V. P. Worland Los Alamos National Laboratory
P.O. Box 1663, Los Alamos, NM 87545
ABSTRACT Most radioactive liquid wastes from the Los Alamos National Laboratory (LANL) are treated at the Technical Area 50 (TA-50) Radioactive Liquid Waste Treatment Facility (RLWTF). In 2002, 1,684 liters of caustic waste, 14,602 liters of acid waste, and 11.489 million liters of industrial wastes were treated. The acid and caustic wastes come primarily from Plutonium Facility 4 (PF-4) located at TA-55, and contain significant concentrations of radioactive materials, such as Plutonium (Pu) and Americium (Am), which are sensitive nuclear materials closely monitored by LANL. A new model of the RLWTF was developed using the simulation software EXTENDTM. The model simulates chemical processes within the RLWTF and predicts the amount of radioactive materials output by the RLWTF for different input scenarios. The model also tracks Am and Pu isotopes within the facility. Performance data for the major chemical separation units in the model were benchmarked using RLWTF historical processing data from 1994 to 2000. The model was then used to predict the impact that changes in upstream processing at TA-55 would have on the processing needs and waste drum productions at the RLWTF. ACRONYMS AND ABBREVIATIONS
Am Americium Ci Curie(s) CL Clarifier CMR Chemistry and Metallurgy Research CST Chemical Science and Technology CUF Centrifugal ultra filtration D-2 Decision Applications Division, Group D-2, also known as the Stockpile
Complex Modeling and Analysis group DOP Detailed Operating Procedure EDR Electro dialysis reversal FWO-WFM Facility and Waste Operations - Waste Facility Management LANL Los Alamos National Laboratory NaOH Sodium hydroxide NE Northeast NPDES National Polluntant Discharge Elimination System NW Northwest

WM’04 Conference, February 29-March 4, 2004, Tucson, AZ WM-4179
PF Plutonium facility Pu Plutonium PVDF Polyvinylidene fluoride RLWCS Radioactive liquid wastewater collection system RLWTF Radioactive Liquid Waste Treatment Facility RO Reverse osmosis SE Southeast SM South Mesa SW Southwest TA Technical Area TK Tank TUF Tubular ultra filtration WM Waste management
DESCRIPTION OF THE TA-50 RLWTF TREATMENT PROCESS LANL has many laboratories and facilities that generate radioactive liquid wastes. The vast majority of these liquid wastes are treated at TA-50 RLWTF. Mainly these radioactive liquid wastes are divided into three different streams: acid, caustic, and industrial. The acid and caustic wastes are generated in TA-55, the Pu processing facility. These wastes are small in volume but contain significant concentrations of radioactive materials such as Pu-238, Pu-239, and Am-241. Due to their high radioactive content, they are treated at Room 60 of the RLWTF. The industrial stream is a collection of low-level radioactive liquid waste discharged from the various laboratories and facilities including the Chemistry and Metallurgy Research (CMR) facility; TA-48, South Mesa (SM)-66; TA-59; TA-21; and TA-16. This stream is treated at the TA-50 main treatment facility. In 2002, 14,602 liters of acid stream and 1,684 liters of caustic stream from TA-55 were treated [1], producing twenty 208-liter drums of transuranic solid waste [2] and 29,334 liters of evaporator bottoms. The same year, 11.01 million liters of industrial stream were processed through the main treatment facility, producing 47,088 kg of 208-liter drums of solid waste and 19906 kg of cemented evaporative bottoms [3]. The treated acid and caustic waste streams are volume reduced by an evaporator. The distillate goes to a National Pollutant Discharge Elimination System (NPDES) permitted outfall, and the evaporator bottoms are dried to a solid and disposed of at the TA-54 Radioactive Solid Waste Operations Facility. The industrial stream, after going through several separation units, is discharged to Mortandad Canyon at LANL, while all the solid waste drums and the dried evaporator bottoms are disposed of at the TA-54 Radioactive Solid Waste Operations Facility [4]. Room 60 Processes The acid and caustic wastes are transported through independent double-walled pipelines. The acid pipe is made of Teflon, polyvinylidene fluoride (PVDF), and the caustic polypropylene. These two pipes, carrying wastes generated at the TA-55 Pu processing facility, pass through Waste Management 201 (WM-201), a covered underground pit containing shutoff valves [5].

WM’04 Conference, February 29-March 4, 2004, Tucson, AZ WM-4179
The acid and caustic wastes are stored in separate stainless steel holding tanks of size 17,000 liters and 15,000 liters, respectively. These tanks are located at WM-66 at the RLWTF. The acid and caustic wastes are stored in the tank until they are processed. The amount of waste treated each year is different (see Table I).
Table I Room 60 summary of caustic and acid waste treated (1996-2002) [6]
Caustic Waste Treated Acid Waste Treated CY Pu(Ci) Am(Ci) Liters Pu(Ci) Am(Ci) Liters 1996 3.87 0.4 3257 7 0.24 24592 1997 12.7 5.8 11058 9.3 0.4 45746 1998 0.84 0.25 41930 1999 5.94 3.82 7930 1.79 1.38 40364 2000 1.17 3.1 4335 0.21 0.036 12755 2001 9.1 3.02 8670 1.1 0.15 14094
2002 0.005 0.0067 1684 0.333 0.054 14602 From Table I, it is also observed that the waste contents of the acid and caustic wastes keep changing. This depends on activities of other Laboratory facilities that produce these wastes. Acid Waste Treatment The acid waste is treated separately from the caustic waste. A fraction of the acid waste is transferred from the WM-66 holding tank into Tank 1 (TK-1), a 2,300-liter stainless steel tank in Room 60 at the RLWTF. The batch is then neutralized with sodium hydroxide (NaOH) from Chemical Science and Technology 2 (CST-2). Since TK-1 is considerably smaller in volume than the WM-66 acid tank, several acid batches will be created for each treatment. These neutralized acid batches are named B-1, B-2, B-3, and so forth [7]. TK-1 is equipped with a water-cooling system to avoid excessive heating during the neutralization process. However, for the last few years, the TK-1 water-cooling system has not been operational. Therefore, smaller amounts of wastes have been processed, waiting approximately one day for the contents to cool off before the batch is processed again. The neutralized batch enters TK-2 feeding tank and then to the clarifier (CL). After solids are settled on the bottom of the CL, the water leaves the CL, passes through the sand filter, and enters TK-3. The TK-3 contents are then pumped to the tank farm at the main RLWTF. The sludge from the CL enters TK-7 sludge holding tank. The sludge remains in TK-7 until 833 liters of it are pumped to TK-6 where it is mixed with cement, sodium silicate, vermiculite, and water in a 208-liter drum, which is then tumbled. The solid wastes from Room 60 are all generated from the tumbling process.

WM’04 Conference, February 29-March 4, 2004, Tucson, AZ WM-4179
Caustic Waste Treatment The caustic waste from WM-66 is also pumped to TK-1. Depending on the pH of the caustic waste, a small amount of WM-66 acid may be added. Caustic batches created from TK-1 are named B0-1, B0-2, B0-3, and so forth [8]. The caustic batches are sent to TK-7 directly where they are mixed with sludge for about an hour. Afterwards, TK-7 decant is sent to TK-3, and then to TK-2. The decant is then reprocessed through the CL and its effluent comes back to TK-3. Once the recycle is through, the effluent is pumped into the tank farm at the RLWTF. Main Treatment A process schematic of the main treatment facility is illustrated in Fig. 1.
Fig. 1 The process schematic of the main treatment facility at RLWTF developed with EXTEND
TM Model
Industrial wastes that enter the main treatment facility come from the Radioactive Liquid Wastewater Collection System (RLWCS). The RLWCS collects wastewater from various TAs, buildings and programs supported by the TA-50 RLWTF. It consists of a double contained
WM’04 Conference, February 29-March 4, 2004, Tucson, AZ WM-4179
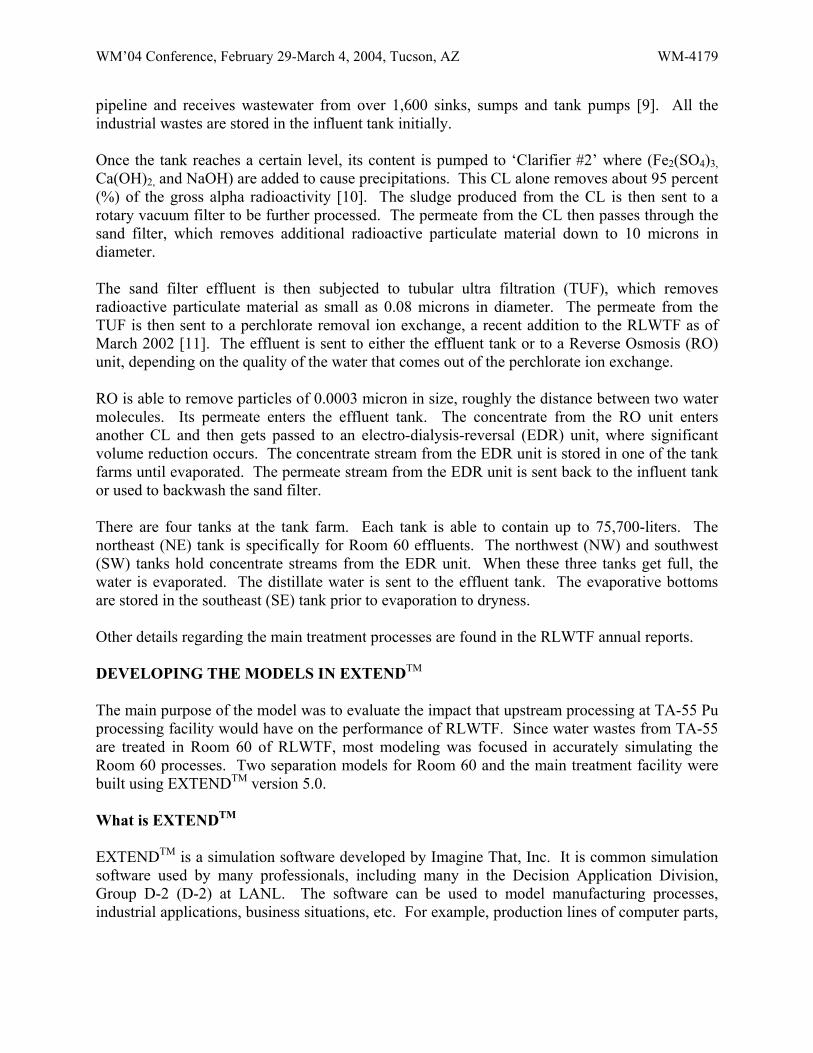
pipeline and receives wastewater from over 1,600 sinks, sumps and tank pumps [9]. All the industrial wastes are stored in the influent tank initially. Once the tank reaches a certain level, its content is pumped to ‘Clarifier #2’ where (Fe2(SO4)3, Ca(OH)2, and NaOH) are added to cause precipitations. This CL alone removes about 95 percent (%) of the gross alpha radioactivity [10]. The sludge produced from the CL is then sent to a rotary vacuum filter to be further processed. The permeate from the CL then passes through the sand filter, which removes additional radioactive particulate material down to 10 microns in diameter. The sand filter effluent is then subjected to tubular ultra filtration (TUF), which removes radioactive particulate material as small as 0.08 microns in diameter. The permeate from the TUF is then sent to a perchlorate removal ion exchange, a recent addition to the RLWTF as of March 2002 [11]. The effluent is sent to either the effluent tank or to a Reverse Osmosis (RO) unit, depending on the quality of the water that comes out of the perchlorate ion exchange. RO is able to remove particles of 0.0003 micron in size, roughly the distance between two water molecules. Its permeate enters the effluent tank. The concentrate from the RO unit enters another CL and then gets passed to an electro-dialysis-reversal (EDR) unit, where significant volume reduction occurs. The concentrate stream from the EDR unit is stored in one of the tank farms until evaporated. The permeate stream from the EDR unit is sent back to the influent tank or used to backwash the sand filter. There are four tanks at the tank farm. Each tank is able to contain up to 75,700-liters. The northeast (NE) tank is specifically for Room 60 effluents. The northwest (NW) and southwest (SW) tanks hold concentrate streams from the EDR unit. When these three tanks get full, the water is evaporated. The distillate water is sent to the effluent tank. The evaporative bottoms are stored in the southeast (SE) tank prior to evaporation to dryness. Other details regarding the main treatment processes are found in the RLWTF annual reports. DEVELOPING THE MODELS IN EXTENDTM The main purpose of the model was to evaluate the impact that upstream processing at TA-55 Pu processing facility would have on the performance of RLWTF. Since water wastes from TA-55 are treated in Room 60 of RLWTF, most modeling was focused in accurately simulating the Room 60 processes. Two separation models for Room 60 and the main treatment facility were built using EXTENDTM version 5.0. What is EXTENDTM EXTENDTM is a simulation software developed by Imagine That, Inc. It is common simulation software used by many professionals, including many in the Decision Application Division, Group D-2 (D-2) at LANL. The software can be used to model manufacturing processes, industrial applications, business situations, etc. For example, production lines of computer parts,

WM’04 Conference, February 29-March 4, 2004, Tucson, AZ WM-4179
build-up of pollutants in a lake, or a simulation of a bank with customers being aided by tellers can all be developed using EXTENDTM. Modeling these processes offers several advantages. For those who are thinking about building a new processing facility, building a simulation model of the facility first could save them large amounts of money. The model could serve to give estimates on the performance of the new facility. It could also be used to identify inefficiencies in the plant. Modeling becomes especially effective when changes are to be made within the plant. Instead of making real changes in the plant, a simple modification in the model could give insights as to how the changes would affect other processes. For example, a company is thinking of replacing an RO unit in a water treatment facility that is better at eliminating Pu content by 50% but allows more nitrates to pass through than the old RO unit. To estimate the impact that the new RO unit would have on the overall discharged water quality, the developed model can be updated with information about the RO unit, saving the company large amounts of money and providing rough estimates of how the new RO unit will affect the whole plant. Other uses for a simulation software like EXTENDTM, according to the EXTENDTM user manual [12], are to:
• Predict the course and results of certain actions. • Understand why observed events occur. • Identify problem areas before implementation. • Explore the effects of modifications. • Confirm that all variables are known. • Evaluate ideas and identify inefficiencies. • Gain insight and stimulate creative thinking. • Communicate the integrity and feasibility of your plans.
Modeling Room 60 The Room 60 model is stored in a file named room60.mox. Once the model is opened, EXTENDTM will display a screen similar to Fig. 2. The process schematic of Room 60 operation was developed in the EXTENDTM model.

WM’04 Conference, February 29-March 4, 2004, Tucson, AZ WM-4179
Fig. 2 The process schematic of Room 60 constructed in EXTENDTM
The Model Inputs To run the model, the following need to be specified:
• The monthly inflows of the acid and the caustic waste with their respective volumes, Pu and Am contents.
• The normality of the acid stream. • The performance settings of TK-7 and CL-1, such as their water recoveries and their
removal efficiencies of Pu and Am. • The Pu deposit ratio of CL-1. • The holding capacity of TK-3, TK-7, and CL-1 (if needed, the starting contents of Pu and
Am in each tank can be specified). These specifications can be entered using the notebook provided by EXTENDTM. They can also be entered by finding each specific block that controls these variables and entering them directly. The model assumes that the specified monthly inflows of the acid and the caustic waste are treated each month. The user can also specify the residence time of each batch. The model default for the residence time of each batch is set as 1 day for TK-1, CL-1, TK-7, and the Tumbler. The units for the volume and the radioactive species are liters and curie (Ci).
WM’04 Conference, February 29-March 4, 2004, Tucson, AZ WM-4179
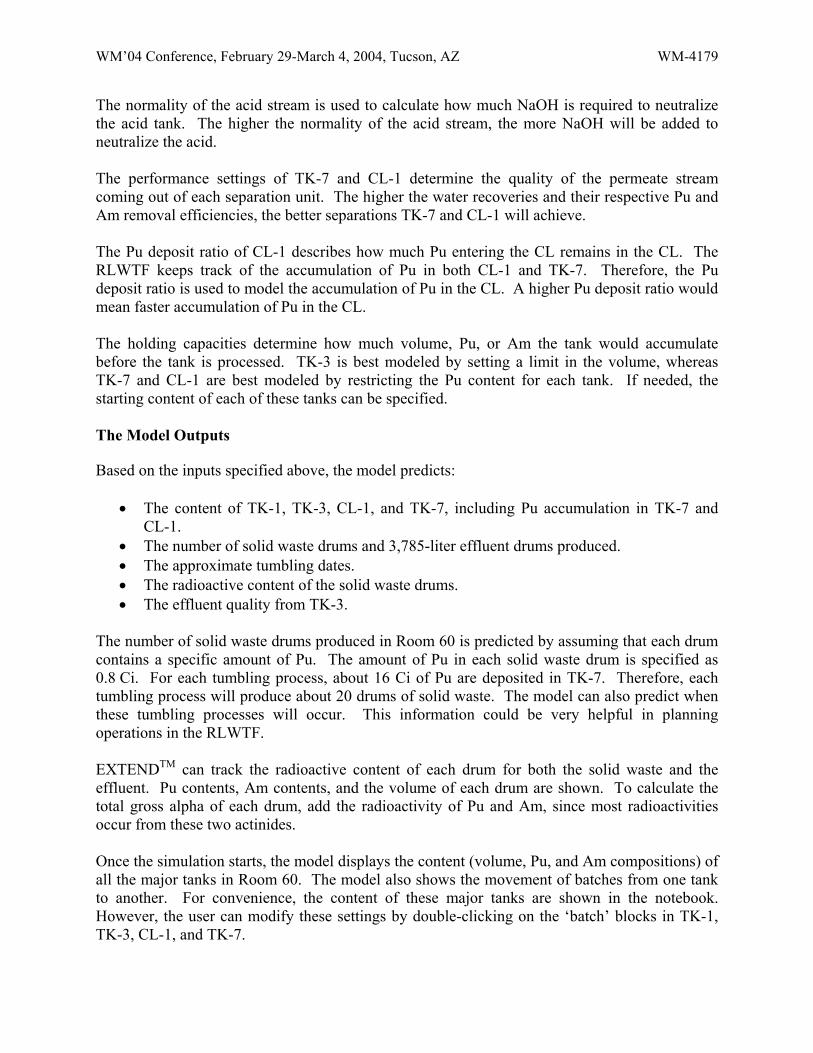
The normality of the acid stream is used to calculate how much NaOH is required to neutralize the acid tank. The higher the normality of the acid stream, the more NaOH will be added to neutralize the acid. The performance settings of TK-7 and CL-1 determine the quality of the permeate stream coming out of each separation unit. The higher the water recoveries and their respective Pu and Am removal efficiencies, the better separations TK-7 and CL-1 will achieve. The Pu deposit ratio of CL-1 describes how much Pu entering the CL remains in the CL. The RLWTF keeps track of the accumulation of Pu in both CL-1 and TK-7. Therefore, the Pu deposit ratio is used to model the accumulation of Pu in the CL. A higher Pu deposit ratio would mean faster accumulation of Pu in the CL. The holding capacities determine how much volume, Pu, or Am the tank would accumulate before the tank is processed. TK-3 is best modeled by setting a limit in the volume, whereas TK-7 and CL-1 are best modeled by restricting the Pu content for each tank. If needed, the starting content of each of these tanks can be specified. The Model Outputs Based on the inputs specified above, the model predicts:
• The content of TK-1, TK-3, CL-1, and TK-7, including Pu accumulation in TK-7 and CL-1.
• The number of solid waste drums and 3,785-liter effluent drums produced. • The approximate tumbling dates. • The radioactive content of the solid waste drums. • The effluent quality from TK-3.
The number of solid waste drums produced in Room 60 is predicted by assuming that each drum contains a specific amount of Pu. The amount of Pu in each solid waste drum is specified as 0.8 Ci. For each tumbling process, about 16 Ci of Pu are deposited in TK-7. Therefore, each tumbling process will produce about 20 drums of solid waste. The model can also predict when these tumbling processes will occur. This information could be very helpful in planning operations in the RLWTF. EXTENDTM can track the radioactive content of each drum for both the solid waste and the effluent. Pu contents, Am contents, and the volume of each drum are shown. To calculate the total gross alpha of each drum, add the radioactivity of Pu and Am, since most radioactivities occur from these two actinides. Once the simulation starts, the model displays the content (volume, Pu, and Am compositions) of all the major tanks in Room 60. The model also shows the movement of batches from one tank to another. For convenience, the content of these major tanks are shown in the notebook. However, the user can modify these settings by double-clicking on the ‘batch’ blocks in TK-1, TK-3, CL-1, and TK-7.

WM’04 Conference, February 29-March 4, 2004, Tucson, AZ WM-4179
Modeling the Main Treatment Operations The RLWTF main treatment facility was modeled in a similar method to the Room 60 model. A process schematic of the main treatment facility was developed using EXTENDTM and is shown in Fig. 1. The process schematic of the model was developed to resemble the current process flowchart used by the RLWTF. However, there were some minor changes that were applied to the model that are not shown in the original process flowchart. These include the processing of the sludge stream from CL-1 to the rotary vacuum filter, the elimination of pilot test models, and the elimination of a Memcor micro filter, which in the original flowchart was attached to the TUF. The Model Inputs for Main Treatment Operations To run the main treatment model, the user needs to specify:
• The monthly volume, including the Pu and Am content of the industrial wastes coming into the RLWTF.
• The holding capacity of the influent tank. This is to determine when the influent tank is processed.
• The performance settings of the CL-2, TUF system, RO unit, CL-1, EDR, rotary vacuum filter, centrifugal ultra filtration (CUF) system, and the evaporator.
• The residence time of each batch for the CL-2, TUF system, RO unit, CL-1, EDR, rotary vacuum filter, CUF system, evaporator, and the condenser.
The sand filter, the bag filter, the perchlorate ion exchange, and the 10 millimeter (mm) cartridge filter for the RO unit are assumed to have negligible influence in removing Pu and Am from the waste streams. Therefore, their performance settings are ignored in the model. The above variables can be entered directly by the user by going to each specific block that controls these events and altering them, or by accessing the notebook in the model. The Model Outputs for Main Treatment Operations Based on the inputs specified above, the main treatment model predicts:
• The tank content of the effluent tank and the tank farm. • The number of 3,785-liter effluent drums and the 208-liter solid waste drums. • The radioactive contents of all the drums produced in the main treatment.
Other than the predictions that are displayed in the EXTENDTM notebook, there are other factors that could be monitored by the model. For instance, the model can trace the total amount of radioactive wastes that enter the influent tank from various sources such as the RLWCS, rotary vacuum filter, EDR, or the CUF system. Essentially, the model can monitor the volume, the Pu content, and the Am content of all the streams in the main treatment facility.

WM’04 Conference, February 29-March 4, 2004, Tucson, AZ WM-4179
RUNNING THE MODEL WITH HISTORICAL DATA In the previous section, the basic schematics of the model for Room 60 and the main treatment facility were discussed. Once the structure of the model was built, historical data was used to obtain the performance settings of the major separation units. Since the ultimate purpose of the project was to estimate the impact that changes in upstream processing from TA-55 would have on the facility, a majority of the time was spent on validating the Room 60 model. The main treatment facility model was analyzed briefly but did not go through as much testing as the Room 60 model. Obtaining the Data RLWTF keeps records of the caustic and acid wastes that are treated in Room 60. Gathering and analyzing the collected data is beneficial in several ways; and a more accurate process schematic of Room 60 was developed as the data indicated accumulation of Pu in both TK-7 and in CL-1. Another discovery about the Room 60 operation was made when the data seemed to have discrepancies between the grams of Pu accumulated in TK-7 and CL-1. Since the amount of Pu entering and leaving Room 60 was known, the sum of the Pu accumulated in TK-7 and CL-1 could be calculated. However, this amount did not match what was in the report. It turned out that the report that kept track of the Pu accumulated in these tanks reported the equivalent grams of Pu, not the actual grams. The Room 60 operators measured the total gross alpha from these tanks, subtracted the radioactivity of Am, and then divided this value by 0.1 Ci per gram. The final value was reported as the grams of Pu. Since Pu has several isotopes and each of these isotopes has a different specific activity (the rate of radioactive decay per mass), the value reported was only an estimate of the real grams of Pu accumulated in the tanks. Initializing the Room 60 Model Although data from 1982 to 2000 were obtained, it was only after 1994 that the effluent quality was recorded in the reports. Therefore, the data from 1994 to 2000 were used to obtain performance settings for the separation units in Room 60. Using Microsoft Excel and EXTENDTM together, the best fit for the historical data was found with the performance settings shown in Table II.
Table II Performance Settings of TK-7 and the CL-1 in Room 60 (adjusted to best fit the historical data of Room 60 from 1994 to 2000)
Water Recovery
Plutonium Recovery
Americium Recovery
Gross Alpha Recovery
Deposit Ratio
CL-1 99% 95% 97% 96% 0.47 TK-7 99% 80% 80% 80% n/a
A minor adjustment was made to the numbers shown in Table II as the actual value was rounded to its two significant digits. This was to represent the range of errors that the model could make. The discharge quality of Room 60 does not only depend on the volume and the concentrations of

WM’04 Conference, February 29-March 4, 2004, Tucson, AZ WM-4179
Pu and Am entering the facility. The discharge quality also depends on numerous other factors, such as other chemicals present in the waste streams affecting the purification process, operating procedures, machine failure, etc. Validating the Model with 1994-2000 Data The Room 60 model was run with the 1994-2000 data to evaluate the accuracy of the model. The Pu accumulations in TK-7 and CL-1 were predicted by the model, and are compared with what has been measured in Table III.
Table III Comparison of the Predicted Result with the Measured Data MODEL (Ci) Measured (Ci)
Date CL-1 TK-7 CL-1 TK-7 7/7/1995 5.05 14.04 5.06 14.2 2/2/1996 6.21 15.79 6.87 16 4/5/1996 6.38 17.68 6.92 17.54 8/8/1996 6.65 20.2 6.93 20.36 11/5/1996 6.69 0 6.95 0 4/4/1997 7.11 5.61 6.98 7.12 6/13/1997 7.78 10.31 7.05 12.01 8/18/1997 7.95 10.46 7.44 12.01 12/22/1997 8.4 11.73 8.29 13.09 3/31/1998 8.87 12.14 8.74 13.09 5/20/1998 9.02 12.29 8.95 13.09 8/4/1998 9.08 12.33 9.13 13.09 10/2/1998 9.12 12.37 9.13 13.09 12/1/1998 9.13 12.37 9.52 13.09 3/5/1999 9.62 0.13 10.29 0 6/8/1999 9.8 0.27 10.88 0 8/4/1999 0.26 12.05 0.14 11.71 10/29/1999 0.66 15.56 0.27 13.03 12/6/1999 0.99 16.56 0.48 16.81
As Table III shows, the model predicts the accumulation of Pu in CL-1 and TK-7 very well. Discrepancies between the model and the measured data are not necessarily because the model is inadequate. It could be due to measurement errors as well. For example, the measured radioactivity of Pu in TK-7 for June 8th of 1999 is 0.0. In other words, the operators in the RLWTF did not detect any radioactive material in TK-7. However, the monthly inflow chart of Room 60 shows that some radioactive wastes were treated between March and June of the respective year. Therefore, some Pu must have been deposited in CL-1 and TK-7, which makes the measured data unreliable.

WM’04 Conference, February 29-March 4, 2004, Tucson, AZ WM-4179
ESTIMATING HOW THE CHANGES IN UPSTREAM PROCESSING AT TA-55 WOULD AFFECT THE DRUM PRODUCTION AT THE RLWTF Different input scenarios were run with the model to estimate how the changes in upstream processing at TA-55 would affect the waste production at RLWTF. Two different scenarios are illustrated below. Scenario 1: Increasing Both the Caustic and the Acid Waste Line Volumes The first input scenario comprised the increase in both the caustic and the acid waste lines from TA-55. The average monthly inflow of both the caustic and the acid wastes from 1997-2000 was used to run the model. Currently, about six 208-liter solid waste drums are produced annually in Room 60 according to the model. Table IV shows the relationship of the annual drum production at RLWTF with the increase in the incoming waste flow. The multiplication factor indicates the ratio of the incoming waste used in the model to the average monthly inflow of waste from 1997-2000. For example, a multiplication factor of 10 symbolizes an increase in both the acid and the caustic waste by a factor of 10.
Table IV Model Prediction of the Annual Drum Production Due to Room 60 as Both the Acid and the Caustic Waste Amount Increase
Annual drum production of
Mult. Factor 208-liter
Solid Waste
3,785-liter Effluent
3,785-liter Evap. Bottoms
0.5 3.0 4.2 2.0 1 8.0 9.0 4.3 2 14.7 20.1 9.57 3 25.7 34.6 16.5 4 35.1 46.1 22.0 5 44.6 57.7 27.5 6 52.7 69.1 32.9 7 62.2 80.6 38.4 8 71.6 92.1 43.9 9 79.7 103.7 49.4 10 89.2 115.2 54.9
Figure 3 shows a histogram chart with the same information as that presented in Table IV.

WM’04 Conference, February 29-March 4, 2004, Tucson, AZ WM-4179
Fig. 3 The effect of increasing the acid and caustic waste production
at TA-55 on the drum productions. The model predicts an increase in the annual drum productions as the amount of waste streams increase, which is logical. The relationship between the number of drums produced and the multiplication factor is not completely linear. The current annual drum production due to Room 60 is about 8 solid waste drums and 9 effluent drums. When the current amount of the acid and caustic wastes increases by a factor of 10, the model does not predict the number of these drums to also increase by a factor of 10. Instead, the model predicts about 89 solid waste drums and 115 effluent drums. Scenario 2: Changing the Volume Fraction of the Waste Streams into Room 60 The amount of acid and the caustic wastes coming into Room 60 depends on the operations at TA-55. Currently, about 14% of the total wastes from TA-55 are caustic. As the pit production increase or as the Pu processing at TA-55 change, it is plausible that more of the waste streams will come from the caustic line. The model was used to estimate how this change in the waste stream will affect the drum production at RLTWF. The model results are shown in Table V and in Fig. 4.

WM’04 Conference, February 29-March 4, 2004, Tucson, AZ WM-4179
Table V Effect of the Volume Fraction of the Waste Stream on the Drum Production at RLWTF
Annual drum production of
Vol. Fraction of caustic
208-liter Solid Waste
3,785-liter Effluent
3,785-liter Evap. Bottoms
0 2.6 11.5 5.48 0.1 6.7 9.1 4.3 0.2 9.1 9.7 4.6 0.3 12.6 9.8 4.7 0.4 18.1 10 4.8 0.5 23.7 9.6 4.6 0.6 26.8 9.5 4.5 0.7 27.3 9 4.3 0.8 29.5 8.6 4.1 0.9 39.1 8.1 3.9 1.0 45 11.4 5.43
Fig. 4 A histogram chart illustrating the effect of the volume fraction of the
waste stream on the drum production at RLWTF. As the caustic waste is more concentrated with radioactive materials than the acid waste, it is expected that more solid waste drums will be produced as the volume fraction of the caustic waste increases. Indeed, this is what the model predicts. Also, the number of 3,785-liter effluent drums should not fluctuate very much as the volume fraction changes since the total amount of wastes treated in Room 60 is the same and since most of the waste should be discharged in the effluent drums. The model also predicts that the numbers of 3,785-liter effluent drums for different volume fractions of caustic waste stay pretty constant. Unlike the model predictions made from the first scenario where the increase in the total waste resulted in a pretty proportional increase in the waste drum productions, the model does not show a very linear relationship between the volume fraction of the caustic waste and the number of drums produced. Instead, as the volume fraction of the caustic waste changes from 0.5 to 0.8, there is not as significant a change in the number of solid waste drums produced compared to the change that occurs in the other range.

WM’04 Conference, February 29-March 4, 2004, Tucson, AZ WM-4179
As stated before, currently, about 14% of the total wastes from TA-55 are caustic. As the operations at TA-55 change and as the compositions of the waste streams from TA-55 change, the model could be very helpful in estimating the impact these changes would have on the RLWTF. SUMMARY The RLWTF at TA-50 serves a vital role for facilities and operations that occur at LANL. Most radioactive liquid wastes from LANL’s laboratories and other facilities are treated in the RLWTF. During the summer of 2003, a new model of the RLWTF was developed using the simulation software EXTEND
TM. The model simulates chemical processes within RLWTF and predicts the
amount of radioactive materials output by RLWTF with different input scenarios. The model also features tracking of Am and Pu isotopes within the facility. Using the model, the impact that changes in upstream processing would have on the RLWTF was estimated. Two different input scenarios were used to predict the number of drum productions at RLWTF due to the change in the upstream processing. These results are summarized above. REFERENCES 1 V.P. Worland, “RLWTF Annual Report 2002”, LA-UR-03-2728, April 2003, page 5. 2 V.P. Worland , “Waste volumes to and from the RLWTF during CY 1998 – CY 2002”,
January 16, 2003, private communication. 3 V.P. Worland, “RLWTF Annual Report 2002”, LA-UR-03-2728, April 2003, page 5. 4 Ibid. 5 Detailed Operating Procedure (DOP)-50RLWTF-01, R07, page 6. 6 D. Moss, V.P Worland, C. Schepens, “Room 60 Annual Summary (1996-2002)”, February
28th 2003, private communication. 7 C. Fischahs, “DOP for TA-50-1 Pretreatment Plant”, DOP-50RLWTF-01,R07, August 4,
1997, page 18. 8 C. Fischahs, “DOP for TA-50-1 Pretreatment Plant”, DOP-50RLWTF-01,R07, August 4,
1997, page 14. 9 V.P. Worland, “RLWTF Annual Report 2002”, LA-UR-03-2728, April 2003, page 7. 10 Ibid.

WM’04 Conference, February 29-March 4, 2004, Tucson, AZ WM-4179
11 Ibid. 12 EXTEND
TM User’s Guide, Version 5, page E4.