Modeling of porosity and grain size effects on mechanical ...
31
1 Modeling of porosity and grain size effects on mechanical behavior of additively manufactured structures Mehdi Hamid a,§,* , M. Sadeq Saleh b , Ali Afrouzian a , Rahul Panat b,* , Hussein M. Zbib a a School of Mechanical and Materials Engineering, Washington State University, Pullman, WA 99164, United States b Department of Mechanical Engineering, Carnegie Mellon University, Pittsburgh, PA 15213, United States * Corresponding authors: Email: [email protected]; [email protected] § Current address: IBM Systems, 3605 Highway 52 North Rochester, MN 55901
Transcript of Modeling of porosity and grain size effects on mechanical ...

1
Modeling of porosity and grain size effects on mechanical behavior of additively
manufactured structures
Mehdi Hamida,§,*, M. Sadeq Salehb, Ali Afrouziana, Rahul Panatb,*, Hussein M. Zbiba
aSchool of Mechanical and Materials Engineering, Washington State University,
Pullman, WA 99164, United States
bDepartment of Mechanical Engineering, Carnegie Mellon University,
Pittsburgh, PA 15213, United States
*Corresponding authors: Email: [email protected]; [email protected] §Current address: IBM Systems, 3605 Highway 52 North Rochester, MN 55901

2
Abstract
Additive manufacturing (AM) methods such as Aerosol Jet (AJ) printing allow the fabrication
of structures via sintering of micro and/or nanoparticles, leading to microstructures that consist
of various combinations of pore and grain sizes. It has been reported that AJ printed and sintered
silver micropillars show an unusual behavior of high stiffness and high strain-to-failure for
structures with high porosity and vice versa [1]. This behavior, however, is accompanied by the
stiffer structures having smaller grain sizes and softer structures having larger grain sizes. To
explain the physics of this behavior where a trade-off between hardening caused by size effects
(grain refinement and gradients) and softening caused by porosity is expected to play a critical
role, a multi-scale modeling approach is proposed in this paper. The model formulation consists
of a continuum dislocation dynamics (CDD) framework, coupled with continuum plasticity and
finite element analysis. The dislocation dynamics formulation is introduced into a user material
subroutine and coupled with a finite element commercial solver, in this case, LS-DYNA, to solve
the model in three-dimensional scale with the same size as the AM micropillars. The results from
the model capture the general trends observed in compression tests of AM micropillars. In
particular, it is shown that the grain size and dislocation density have a disproportionately higher
influence over the mechanical deformation of metallic structures when compared to the porosity.
These results show that the behavior of AM structures in the plastic regime is dominated by grain
size effects rather than porosity. Some limitations of the model and possible future refinements are
discussed. The paper provides an important analytical framework to model the mechanical
behavior of AM structures with internal porosity in the plastic regime.
Keywords: Additive manufacturing; Mechanical behavior of AM structures; Continuum
mechanics; Strain gradient plasticity; Grain size; Dislocation dynamics; Finite element analysis
(FEA)

3
Dedication:
This paper is dedicated to the loving memory of Prof. Hussein Zbib (1958-2020), a mentor, colleague, and friend, who passed away during the course of this investigation.
1. Introduction
Additive manufacturing (AM) has allowed the fabrication of metallic parts having complex
architectures, unique material combinations, and controlled microstructures [2]. The AM of metal
part involves sintering and/or melting-solidification of micro or nanoparticles, which often leads
to an internal part porosity [3]. In fact, the porosity and other defects are common to parts
fabricated by AM [4] . Further, the AM methods allow the control of the grain size via changes to
the starting powders and the process parameters. In addition, the microstructures of parts made by
AM are complex[5], which can give rise to local stress and strain gradients that can affect their
mechanical performance. The mechanical behavior of AM parts is thus expected to be an interplay
between the defects such as internal porosity, the grain size/distribution, and their evolution during
deformation.
Aerosol Jet (AJ) nanoparticle printing is an AM method that can be used to fabricate three-
dimensional microscale structures. Such structures can be used as electrodes for high-capacity Li-
ion batteries [6] where typical forces on the structures during lithiation and delithiation cycles can
be of the order of tens of MPa [7]. In our previous work [1], AJ nanoparticle printing was used to
create 3D micropillars of pure polycrystalline silver having a diameter of 80 to 90 µm and a height
of about 900 µm. Different average grain sizes - between 250 nm and 5 µm - were obtained by
sintering of the micropillars at four different temperatures of 250°C, 350°C, 450°C, and 550°C.
The sintering conditions also produced porosities in the range of 20% - 0%, respectively [1]. The
complexity of AJ printed, and sintered microstructures is demonstrated in Figs. 1a-1c. The
micropillars in Fig. 1a are fabricated using nanoparticles with 50-150 nm size, which after
sintering, resulted in the microstructures shown in Figs. 1b and 1c. It is clear from Fig. 1 that the
AM microstructures tend to be complex in nature, consisting of internal porosity with pores having
irregular sizes and shapes, and a characteristic grain size distribution that arises from sintering and

4
growth of the printed nanoparticles (also see Ref. [8]). In addition, these microstructures are
expected to give rise to local stress and strain gradients that can affect their global deformation.
The AM micropillars (e.g. similar to that shown in Fig. 1) were subjected to compressive loads by
Saleh et al. [1], which showed an unusual behavior consisting of an increase in effective modulus
and decrease in strain-to-failure with increasing porosity. This was, however, accompanied by a
decrease in grain size. In other words, the mechanical behavior of the AM micropillars could be
attributed to two competing mechanisms, namely, strengthening arising from strain gradients [9]
and grain size effect [10], and softening arising from degradation of strength caused by porosity.
Although a semi-empirical two-phase model [11] was used to qualitatively explain these trends, a
multi-scale modeling approach is needed to explain the physics of deformation of AM structures
4 µm
4 µm 200 µm
(a) (b)
(c) (c)
500 µm
Figure 1: Complex microstructures created by Aerosol Jet nanoparticle printing process. (a, b) Scanning electron microscope (SEM) images of additively manufactured 3×3 silver micropillar array showing a microstructure consisting of grains that are 2-4 µm in size. (c) Cross-section of a micropillar made by focused ion beam (FIB) showing internal porosity due to particle sintering.

5
that takes into account the physical processes occurring at microscale (dislocations density effects)
and at macroscale (global strain and stress, size effects, porosity).
There have been a few modeling efforts that take into account the multiscale features observed
in AM structures [12]. A 2D crystal plasticity-based model was developed for structures of 316
stainless steel fabricated by Selective Laser Melting (SLM) to capture the role of texture, process
defects, mechanical loading direction, and laser hatch space [13]. In this work [13], a Voronoi
tessellation method was applied to create different microstructures to analyze the effect of spatial
grain distribution on the mechanical properties of SLM printed samples. A crystal plasticity model
was developed for single crystal metallic samples with voids and was interfaced with a finite
element solver to analyze the effect of stress triaxiality, initial porosity, crystal orientation, void
growth, and coalescence [14]. None of the prior models take into account the interplay between
porosity and grain sizes created by particle coalescence in AM structures in a three-dimensional
stress-state.
The CDD theory consists of a novel constitutive law, based on dislocation density evolution
mechanisms coupled with continuum plasticity, and is able to predict phenomenological
representation of dislocation evolution, production, and annihilation within the samples under
stress. The benefit of this method over conventional continuum mechanics is that it allows the
implementation of small-scale parameters associated with Burger’s vector, grain size, and grain
boundary that are physical properties of the materials. These parameters cannot be incorporated in
a conventional continuum mechanics formulation. Incorporation of these parameters improves the
accuracy of prediction of deformation of a part in the plastic regime [15-18].
The impetus for the present work is thus twofold. First, we aimed to create a realistic
modeling framework to capture the deformation of AM parts that takes into account the multi-
scale microstructural features arising from the additive processes. These features include a
combination of grain sizes, porosities, dislocations densities, and shape imperfections resulting
from different processing conditions. Continuum dislocation dynamics (CDD) model developed
earlier by the authors (Aksari et al [19] and Li et al. [15]) is coupled with continuum plasticity and
finite element method to capture the interaction of grain sizes, porosity, stress-strain gradients, and
sample length scales observed in experiments [1] during deformation. The porosity is incorporated
via a viscoplasticity model, which is coupled with the CDD framework. Second, we aimed to use
6
this modeling framework to capture the physics of the mechanical behavior of AJ printed metallic
micropillars [1] under compressive stress. The focus of this part was to employ a stress-strain
gradient theory which combined a stress-gradient theory [20-22], with a strain-gradient theory [17,
23-25] into the CDD framework in order to analyze the grain size and porosity effects for the
microstructures and length scales observed in the AM micropillar to explain the results from Saleh
et al. [1].
We note that one of the novelties of this work lies in coupling of the continuum mechanics-
based FEA solver (LS-DYNA) with a CDD-based viscoplastic formulation. For example, in
continuum mechanics, length scale parameters like grain size and porosity do not exist. By
applying the CDD viscoplastic formulation, grain size, porosity, initial dislocation density, and its
evolution are implemented in the study. It should be noted that all these parameters can be
experimentally measured, so the coupled model has the advantage of taking physical inputs based
on material properties and the work hardening history, which is not the case for any other
commercial continuum mechanics-based FEA solvers such as Ansys and Abaqus. This capability
is of significant importance for AM samples, since they typically undergo some level of post-
processing and heat treatment prior to usage in the field.
We first introduce the continuum mechanics formulation which incorporates the effect of
porosity. The dislocation dynamics formulation and its coupling with the continuum model are
then discussed. The coupled model is introduced into a finite element framework for a simple
tensile model and test verification. The modeling predictions of tensile stress vs strain curve for
various initial dislocation densities are compared with the experimental data from literature [21]
to determine the optimum value for initial dislocation density. Finally, the FEM simulation results
for micropillars are presented, discussed, and compared to experimental results.
2. Viscoplasticity-Porosity Model coupled with Continuum Dislocation Dynamics
In order to model the AM fabricated metallic structures, a viscoplasticity-porosity model
is developed and coupled with the CDD model, which is implemented into a finite element
framework. The finite element method is used to investigate the deformation of the micropillars
for various grain sizes and porosities. The geometry of the micropillars is designed in LS-PrePost
[26] using dimensions of the 3D printed structures [21]. A set of plasticity equations are

7
implemented into a user material subroutine based on dislocation density interaction mechanisms
and stress/strain gradient theories. The simulations are performed with LS-DYNA and a user
material subroutine (UMAT) is written in Fortran environment. Also, in order to compute spatial
gradients, a Matlab-based code is developed which identifies the surrounding neighbors for each
solid element. The output of the Matlab code is read by UMAT which is used for finding
neighboring elements in the stress and strain gradient calculations. The plasticity model is
compared to tensile test results with available experimental data for 99.9% pure silver from
literature. Next, a 3D model with solid elements is designed with the same geometry of additively
manufactured micropillars, and a parametric study is carried out to investigate the influence of
microstructural and material parameters.
2.1. Viscoplasticity-Porosity Model
To develop the viscoplasticity-porosity model, we first note that in continuum mechanics
framework, the velocity gradient tensor, L, is decomposed into a symmetric part, D, and an
antisymmetric part, W, as [27],
𝑳 = 𝑫 +𝑾 (1)
with D being the strain rate tensor, and W being the spin tensor given by,
𝑫 =12 [𝑳 + 𝑳
𝑻] (2)
𝑾 = "#[𝑳 − 𝑳𝑻]. (3)
The strain rate tensor, 𝑫, is further decomposed as the sum of elastic (𝑫𝒆) and plastic (𝑫𝒑) terms
such that,
𝑫 = 𝑫𝒆 +𝑫𝒑. (4)
Assuming linear elastic isotropic material with isotropic damage due to porosity, Hooke’s law is
given by the following relation [28],
𝝈- = (1 − ∅)[𝑪𝒆]𝑫𝒆 (5)
where [𝑪𝒆] is the fourth order elasticity tensor, 𝝈- is co-rotational rate of the Cauchy stress tensor,
𝝈, and ∅ is the porosity. Note that the growth of microvoids (and hence porosity ∅) plays a
significant role during the process of plastic deformation in crystal plasticity of metals during
nonlinear deformation. In our calculations, we are assuming that the voids are uniformly
8
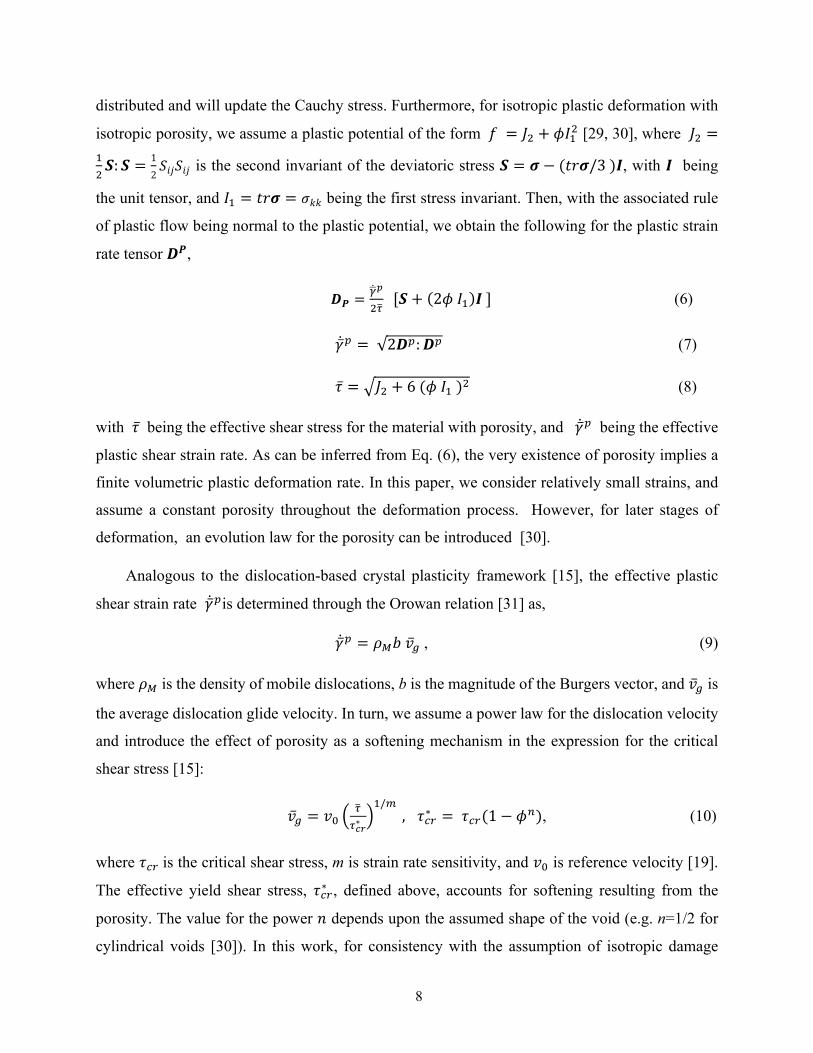
distributed and will update the Cauchy stress. Furthermore, for isotropic plastic deformation with
isotropic porosity, we assume a plastic potential of the form 𝑓 = 𝐽# + 𝜙𝐼"# [29, 30], where 𝐽# ="#𝑺: 𝑺 = 1
2𝑆𝑖𝑗𝑆𝑖𝑗 is the second invariant of the deviatoric stress 𝑺 = 𝝈 − (𝑡𝑟𝝈/3)𝑰, with 𝑰 being
the unit tensor, and 𝐼" = 𝑡𝑟𝝈 = 𝜎𝑘𝑘 being the first stress invariant. Then, with the associated rule
of plastic flow being normal to the plastic potential, we obtain the following for the plastic strain
rate tensor 𝑫𝑷,
𝑫𝑷 ='(̇!
#*+[𝑺 + (2𝜙𝐼")𝑰] (6)
�̇̅�, =√2𝑫,: 𝑫, (7)
𝜏̅ = B𝐽# + 6(𝜙𝐼")# (8)
with 𝜏̅ being the effective shear stress for the material with porosity, and �̇̅�, being the effective
plastic shear strain rate. As can be inferred from Eq. (6), the very existence of porosity implies a
finite volumetric plastic deformation rate. In this paper, we consider relatively small strains, and
assume a constant porosity throughout the deformation process. However, for later stages of
deformation, an evolution law for the porosity can be introduced [30].
Analogous to the dislocation-based crystal plasticity framework [15], the effective plastic
shear strain rate �̇̅�,is determined through the Orowan relation [31] as,
�̇̅�, = 𝜌-𝑏�̅�., (9)
where 𝜌- is the density of mobile dislocations, b is the magnitude of the Burgers vector, and �̅�. is
the average dislocation glide velocity. In turn, we assume a power law for the dislocation velocity
and introduce the effect of porosity as a softening mechanism in the expression for the critical
shear stress [15]:
�̅�. = 𝑣/ G*+*"#∗H"/1
,𝜏23∗ =𝜏23(1 − 𝜙5), (10)
where 𝜏23 is the critical shear stress, m is strain rate sensitivity, and 𝑣/ is reference velocity [19].
The effective yield shear stress, 𝜏23∗ , defined above, accounts for softening resulting from the
porosity. The value for the power 𝑛 depends upon the assumed shape of the void (e.g. n=1/2 for
cylindrical voids [30]). In this work, for consistency with the assumption of isotropic damage

9
model, we assume n=1. The matrix material (surrounding the spherical voids, n=1) is also assumed
to be isotropic that obeys the von Mises flow rule according to the J2 theory of plasticity. The yield
function for the voided material is then obtained by modifying the J2 yield function by adding a
hydrostatic term [32]. Also, ductile damage is usually approached by using isotropic damage
models in which voids are assumed to be spherical while the matrix material is assumed to be
isotropic [33]. In the above formulation, porosity decreases the overall elastic stiffness, load
carrying capacity of the material, and the local critical shear stress for plastic shearing; and can be
deduced from Eqs. (5), (8) and (10).
2.2. Coupling of Viscoplasticity-Porosity Model with Continuum Dislocation Dynamics
In the viscoplasticity-porosity formulation, there are two internal state variables, in addition
to porosity, that depend on the microstructure, namely, the dislocation density and the critical shear
stress. Assuming one internal variable to describe the dislocation density, the rate equation of the
dislocation density was derived by Kocks [34] and consists of two terms - production and
annihilation. Here, we assume that the total statistically stored dislocation density can be written
as the sum of mobile dislocation density 𝜌- and immobile dislocation density 𝜌6,
𝜌7 = 𝜌- + 𝜌6. (11)
This way, only the mobile dislocation density contributes to plastic shearing via Eq. (9), while the
sum of the mobile and immobile dislocations contributes to strain hardening by the Baily-Hirsch
relation. The evolution equations for the mobile and immobile dislocation densities, derived in
[15], are as follows:
�̇�- = (𝛽" −𝛽9)𝜌- − 𝛽#𝜌-# + 𝛽:𝜌6 − 𝛽;𝜌6𝜌- (12)
�̇�6 = 𝛽9𝜌- − 𝛽:𝜌6 − 𝛽;𝜌6𝜌- (13)
where 𝛽" =𝛼"<+%=%̅, 𝛽# = 2𝛼#𝑅2�̅�., 𝛽9 = 𝛼9
<+%=%̅, 𝛽: = 𝛼:
<+%=%̅N *+*"#N3, 𝛽; = 𝛼;𝑅2�̅�., with 𝑙.̅ being
the dislocation mean-free path which has an inverse square root relationship with the sum of the
geometrical and total dislocation densities as given in Eq. (17) of the next section. Also, 𝑅2 is the
capture radius for the interaction between two dislocations, and r is a numerical constant, which
are set at 15b and 0.5, respectively, based on curve fit in Fig. 2 (discussed in the next section). In the

10
equations above, there are 5 terms which represent specific dislocation interaction mechanisms.
For single crystals, the parameters α1 to α5 may be calculated from smaller scale modeling of
discrete dislocation dynamics and then adjusted to polycrystals by experimental curve fitting [15,
19]. Table 1 explains the mechanism corresponding to each of these parameters. For the sake of
brevity, the details of these 5 parameters are not explained here and the readers are referred to
previous publications on this topic [15-17, 19]. For example, α1 to α5 have been selected based on
reference [17]. The evolution Eqs. (12) and (13) are nonlinear and coupled with strong interactions
between the mobile and immobile dislocations.
Table 1. Description of mechanisms and parameters
Parameters Mechanisms 𝜶𝟏 Multiplication of dislocations from sources 𝜶𝟐 Mobile-mobile dislocation annihilation 𝜶𝟑 Locking of mobile dislocations 𝜶𝟒 Unlocking of immobile dislocations 𝜶𝟓 Mobile-immobile annihilation
The critical shear stress 𝜏23 appearing in Eq. (10) is the sum of reference shear stress 𝜏/,
forest dislocation hardening 𝜏D, and stress-gradient dependent term 𝜏E [15, 19], i.e.,
𝜏23 = 𝜏/ + 𝜏D + 𝜏E (14)
The forest dislocation hardening term 𝜏D is determined by the classical Baily-Hirsch relation
[35],
𝜏D = 𝛼∗𝑏𝜇B𝜌7 (15)
where the parameters 𝛼∗and 𝜇 are Baily-Hirsch parameter and elastic shear modulus, respectively,
and shown in Table 2.
2.3 Size Effect and gradient-dependent hardening
In the continuum dislocation dynamics framework, size effects arise from two mechanisms:
geometrically necessary dislocations (GNDs), 𝜌FGH, and dislocation pile-ups under heterogeneous
state of stress. In a rigorous treatment, the geometrically necessary dislocations can be directly

11
related to the dislocation density Nye’s tensor [36, 37]. Here we adopt the following scalar form
developed in [23, 38],
ρIJK =1𝑏 |∇�̅�
,| (16)
with �̅�,being the effective plastic shear strain. The effect of the GNDs is incorporated into the
model through the expression for the dislocation mean free path appearing in Eqs. (12)-(13), i.e.,
𝑙.̅ ="
LM&NM'() (17)
By introducing the GNDs in the mean-free path, they act as barriers to mobile dislocations. Their
trapping effect will accelerate the production of statistically stored dislocations where strain
gradients are present, which then leads to an increase in dislocation density.
As discussed in [20, 21], the mechanism of dislocation pile-ups under a heterogenous state of
stress results in a stress- gradient dependent term τP , given by the following expression,
τP =
𝐾√𝐿
(1 +𝐿′4τZ|∇τZ|)
(18)
Here 𝐿 and 𝐿′’ are length scales representing the average grain size and the obstacle (dislocation
pile-ups) spacing respectively. The gradient of effective shear stress is represented by |∇τZ|. Also,
K is the Hall-Petch numerical coefficient. The theory is implemented into the CDD framework and
was shown to predict size effects in various microstructures [16].
The above equations are implemented into a user material subroutine in LS-DYNA to model
the mechanical behavior of the polycrystalline silver micropillars. The LS-DYNA material card
*MAT_USER_DEFINED_MATERIAL_MODELS [39] is used for this modeling purpose.
Numerical calculation of the stress and strain gradient terms required a special treatment, which
also turned out to be computationally intensive. We developed a Matlab-based code, external to
LSDYNA, which identifies the surrounding neighbors for each solid mesh element. Each element
is defined by an ID number and the Matlab code uses the node numbers of solid elements as an
input to find neighboring elements. If any two elements share a node then the elements are counted
as neighboring elements. The output of the Matlab code is then read by UMAT which is used for
stress and strain gradient calculation using the central difference method. By implementing the
12
above system of equations into a UMAT subroutine, physical parameters, like porosity, mobile
and immobile dislocation densities, dislocation glide velocity, and other microstructural
parameters can be directly related to plastic deformation of micropillars.
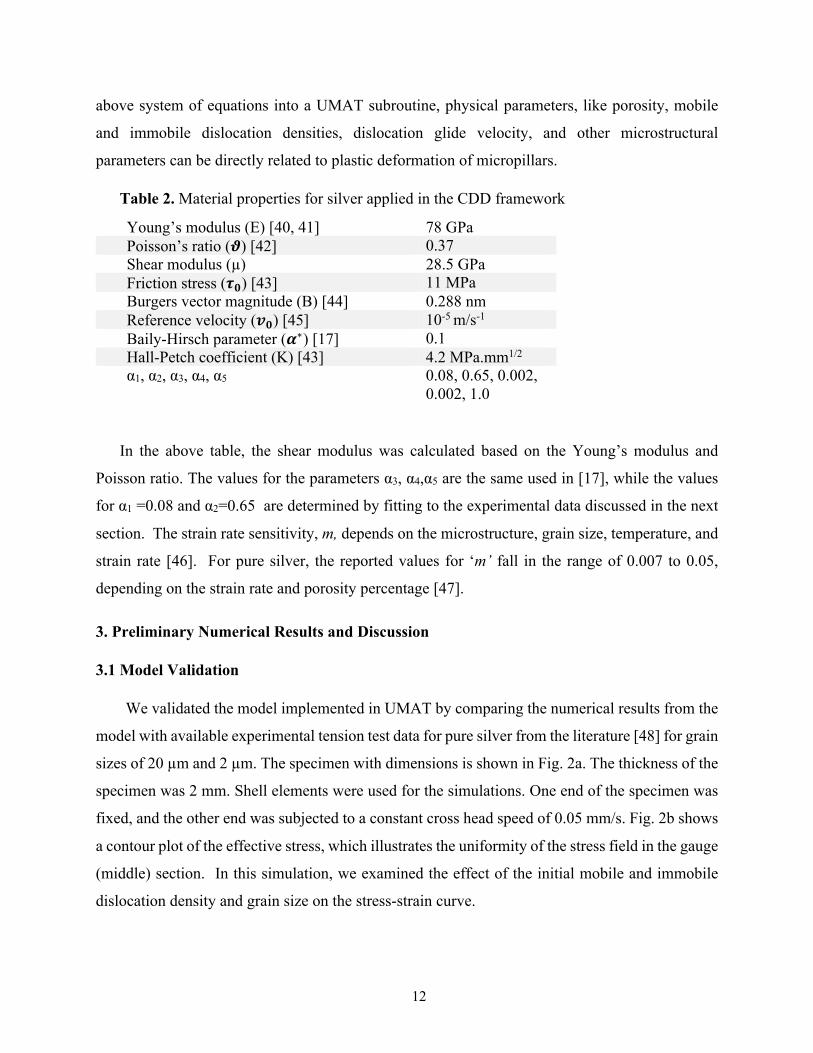
Table 2. Material properties for silver applied in the CDD framework
Young’s modulus (E) [40, 41] 78 GPa Poisson’s ratio (𝝑) [42] 0.37 Shear modulus (µ) 28.5 GPa Friction stress (𝝉𝟎) [43] 11 MPa Burgers vector magnitude (B) [44] 0.288 nm Reference velocity (𝒗𝟎) [45] 10-5 m/s-1
Baily-Hirsch parameter (𝜶∗) [17] 0.1 Hall-Petch coefficient (K) [43] 4.2 MPa.mm1/2 α1, α2, α3, α4, α5 0.08, 0.65, 0.002,
0.002, 1.0
In the above table, the shear modulus was calculated based on the Young’s modulus and
Poisson ratio. The values for the parameters α3, α4,α5 are the same used in [17], while the values
for α1 =0.08 and α2=0.65 are determined by fitting to the experimental data discussed in the next
section. The strain rate sensitivity, m, depends on the microstructure, grain size, temperature, and
strain rate [46]. For pure silver, the reported values for ‘m’ fall in the range of 0.007 to 0.05,
depending on the strain rate and porosity percentage [47].
3. Preliminary Numerical Results and Discussion
3.1 Model Validation
We validated the model implemented in UMAT by comparing the numerical results from the
model with available experimental tension test data for pure silver from the literature [48] for grain
sizes of 20 µm and 2 µm. The specimen with dimensions is shown in Fig. 2a. The thickness of the
specimen was 2 mm. Shell elements were used for the simulations. One end of the specimen was
fixed, and the other end was subjected to a constant cross head speed of 0.05 mm/s. Fig. 2b shows
a contour plot of the effective stress, which illustrates the uniformity of the stress field in the gauge
(middle) section. In this simulation, we examined the effect of the initial mobile and immobile
dislocation density and grain size on the stress-strain curve.

13
(c)
(b)
(a) 20 mm
50 mm
6 m
m
14
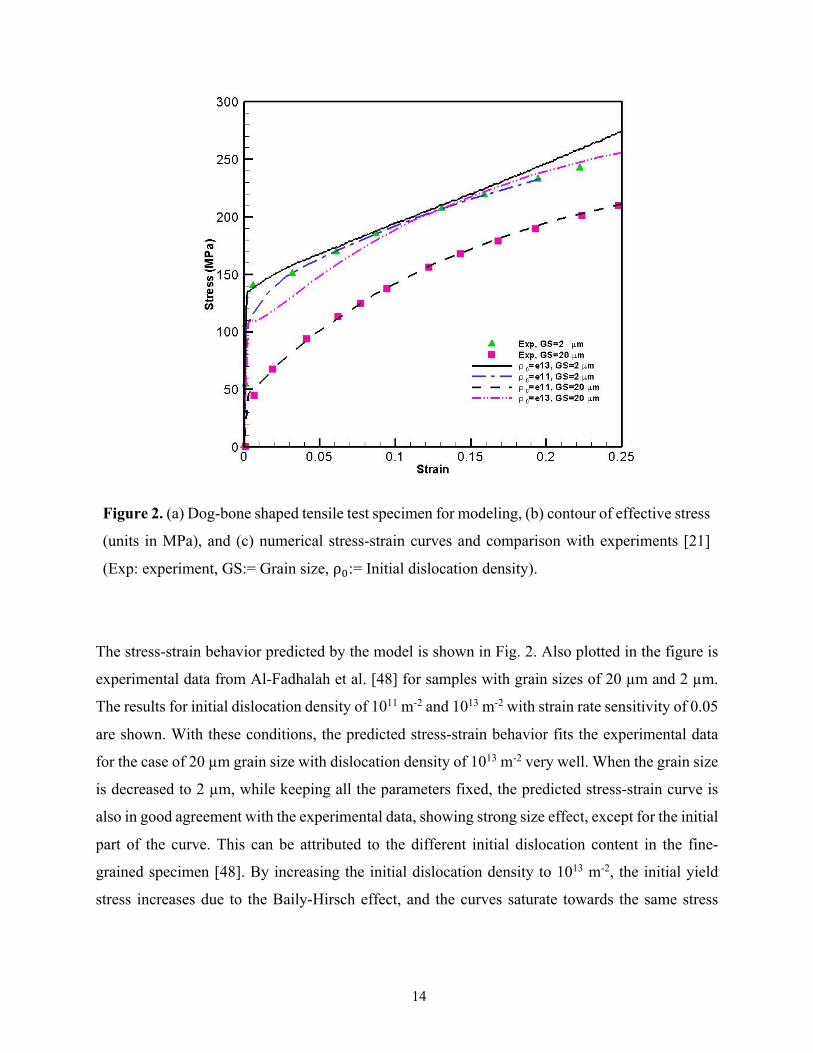
Figure 2. (a) Dog-bone shaped tensile test specimen for modeling, (b) contour of effective stress
(units in MPa), and (c) numerical stress-strain curves and comparison with experiments [21]
(Exp: experiment, GS:= Grain size, ρ/:= Initial dislocation density).
The stress-strain behavior predicted by the model is shown in Fig. 2. Also plotted in the figure is
experimental data from Al-Fadhalah et al. [48] for samples with grain sizes of 20 µm and 2 µm.
The results for initial dislocation density of 1011 m-2 and 1013 m-2 with strain rate sensitivity of 0.05
are shown. With these conditions, the predicted stress-strain behavior fits the experimental data
for the case of 20 µm grain size with dislocation density of 1013 m-2 very well. When the grain size
is decreased to 2 µm, while keeping all the parameters fixed, the predicted stress-strain curve is
also in good agreement with the experimental data, showing strong size effect, except for the initial
part of the curve. This can be attributed to the different initial dislocation content in the fine-
grained specimen [48]. By increasing the initial dislocation density to 1013 m-2, the initial yield
stress increases due to the Baily-Hirsch effect, and the curves saturate towards the same stress
15
levels as the plastic strain is increased. These simulations show the interaction between dislocation
content and size effects as captured by the CDD model.
3.2 Micropillars under compression
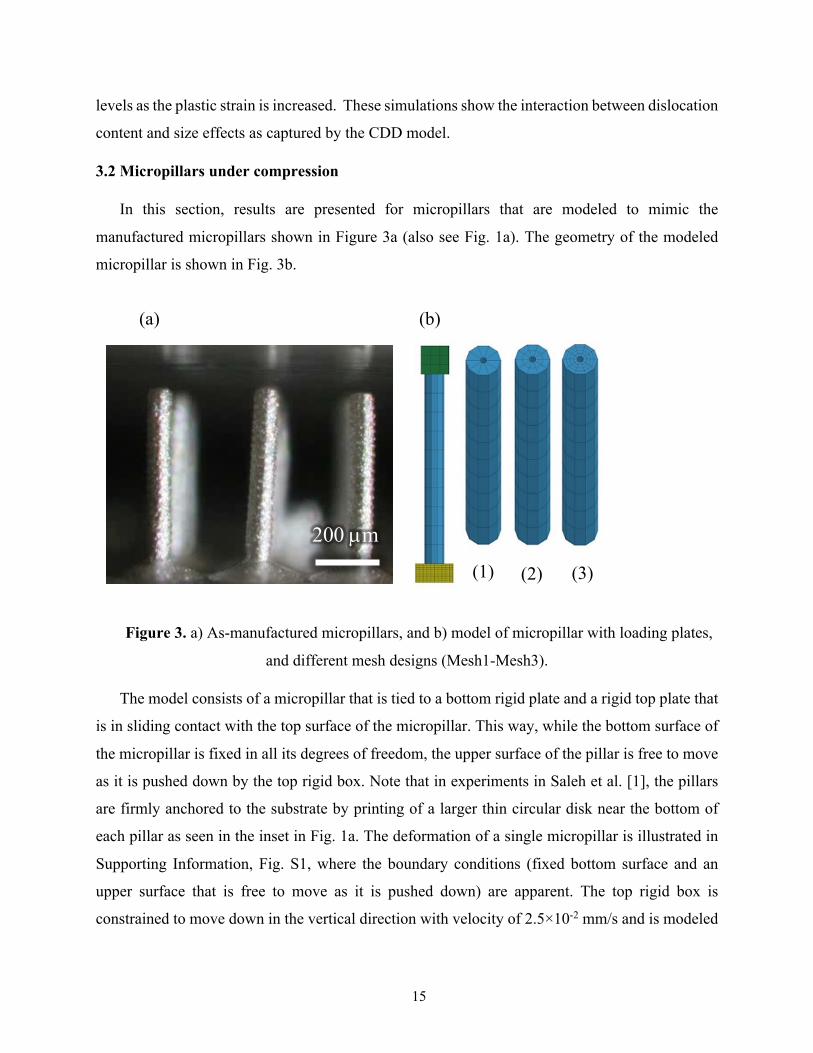
In this section, results are presented for micropillars that are modeled to mimic the
manufactured micropillars shown in Figure 3a (also see Fig. 1a). The geometry of the modeled
micropillar is shown in Fig. 3b.
Figure 3. a) As-manufactured micropillars, and b) model of micropillar with loading plates,
and different mesh designs (Mesh1-Mesh3).
The model consists of a micropillar that is tied to a bottom rigid plate and a rigid top plate that
is in sliding contact with the top surface of the micropillar. This way, while the bottom surface of
the micropillar is fixed in all its degrees of freedom, the upper surface of the pillar is free to move
as it is pushed down by the top rigid box. Note that in experiments in Saleh et al. [1], the pillars
are firmly anchored to the substrate by printing of a larger thin circular disk near the bottom of
each pillar as seen in the inset in Fig. 1a. The deformation of a single micropillar is illustrated in
Supporting Information, Fig. S1, where the boundary conditions (fixed bottom surface and an
upper surface that is free to move as it is pushed down) are apparent. The top rigid box is
constrained to move down in the vertical direction with velocity of 2.5×10⁻² mm/s and is modeled
200 µm
(a) (b)
(1) (2) (3)

16
as rigid body in the LS-DYNA model. The contacts between moving and fixed rigid boxes and
micropillar are “automatic surface-to-surface” and “tied node-to-surface”, respectively.
The micropillar is a hollow cylinder with a length of 1000 µm, inside diameter of 20 µm, and
outside diameter of 90 µm. These slender cylinders are designed with eight-node brick elements.
The computations turned out to be computationally intensive due to the calculations of the stress
and strain gradient terms that appear in Eqs. (16) and (18). For various mesh densities, mesh1-
mesh3, shown in Fig. 3b, the results in Fig. 4 shows an insignificant mesh dependency. The applied
grain size for this mesh sensitivity study was 3 µm and with 0% porosity. The simulations were
then performed using mesh2. In all these cases the initial dislocation density was set at 1013/m2,
which was selected based on the curve fitting discussed in the previous section.
Figure 4. Effect of mesh density on force-displacement curve.
The primary objective of these simulations was to investigate the interaction and trade-off
between hardening resulting from size effects (grain refinement and gradients) and softening
caused by porosity. We run a set of cases for porosities ranging from 0% to 20%, and grain sizes
ranging from 250 nm to 5 µm. The results are summarized in Fig. 5. The figure shows force versus

17
displacement of the upper surface of the micropillar. It can be deduced from the figure that the
linear part of the curves is dependent upon the porosity as expected from Eq. (5); while the onset
of yielding followed by buckling, depicted in Fig. 5, is dependent upon the grain size which is a
result of the size dependent Eqs. (16) and (18). It is clear from Fig. 5 that the effect of grain size
on the stress-strain relation is more dominant than the percentage porosity.
Figure 5. Force-displacement curves for various porosities and grain sizes (GS).
18
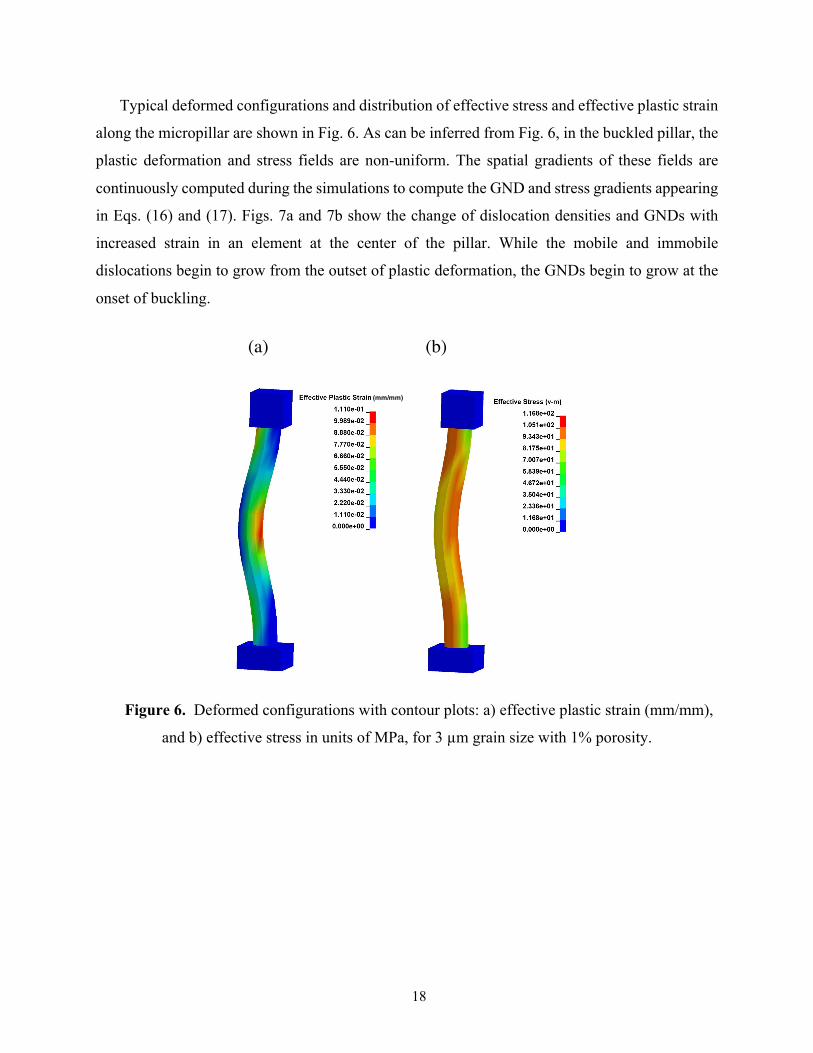
Typical deformed configurations and distribution of effective stress and effective plastic strain
along the micropillar are shown in Fig. 6. As can be inferred from Fig. 6, in the buckled pillar, the
plastic deformation and stress fields are non-uniform. The spatial gradients of these fields are
continuously computed during the simulations to compute the GND and stress gradients appearing
in Eqs. (16) and (17). Figs. 7a and 7b show the change of dislocation densities and GNDs with
increased strain in an element at the center of the pillar. While the mobile and immobile
dislocations begin to grow from the outset of plastic deformation, the GNDs begin to grow at the
onset of buckling.
Figure 6. Deformed configurations with contour plots: a) effective plastic strain (mm/mm),
and b) effective stress in units of MPa, for 3 µm grain size with 1% porosity.
(a) (b)
(mm/mm)

19
Figure 7. a) Mobile and immobile dislocation densities and b) GND density as a function of
strain at the center of the pillar, for 3 µm with 1% porosity.
The initiation of buckling coincides with the first drop in the force as can be observed from
Fig. 5. The maximum force where buckling initiates is extracted from these figures and the results
are depicted in Figs. 8 and 9. Fig. 8 shows a family of curves corresponding to the various porosity
densities, while Fig. 9 depicts a family of curves of force versus porosity for the various grain
sizes. These results show that strengthening from grain refinement can be much stronger than
softening caused by porosity. The result in Fig. 8 shows a power-law dependence of the buckling
force p on grain size L, while the result in Fig. 9 shows linear dependence on porosity 𝜙, suggesting
a relationship of the form:
𝑝 ∝ 𝐿R5(1 − 𝜙) (19)
(a) (b)

20
Figure 8. Force at the onset of buckling versus grain size for micropillars with different
porosities.
The dotted curves in Figs. 8 and 9 are fitted to the numerical results in the figure with n=0.227.
This value indicates a strong deviation from the classical Hall-Petch effect where typically n=0.5.
This deviation is attributed to gradient effects that enter in Eqs. (16) and (18). The deviation from
the classic Hall-Petch is attributed to the presence of stress gradients and the specimen size of a
few micrometers [17, 20, 21].

21
The
Figure 9. Force at the onset of buckling versus porosity for micropillars with different grain
sizes (GS).
3.3 Micropillars with geometrical imperfections
As it is known, the AM processes give rise to a complex microstructure as well as
manufacturing imperfections (e.g. Fig. 1) that need to be considered while modeling the
mechanical behavior of the part. In this section, we analyze two additional micropillar geometries
that account for imperfections. The micropillar geometry analyzed in Section 3.2 is referred to as
case-I and the following cases in this part are referred to as case-II and case-III. Micropillars for
case II, III are shown in Fig. 10 where the micropillar for case II has a reduced diameter at the
bottom of the cylinder. For case-III, the micropillar has a reduced diameter at the bottom and is
tilted about 5 degrees with respect to the vertical axis.

22
Figure 10. Micropillars with imperfections. a) A micropillar with reduced diameter at the bottom
(case-II), and b) A micropillar with reduced diameter at the bottom and a tilt with respect to the
vertical axis (case-III).
The same user material subroutine and formulation as case-I was applied for micropillars in
case-II and case-III. The force vs displacement for these new categories are shown in Fig.11 and
Fig.12.
(a) (b)

23
Figure 11. Force vs. displacement for various porosity (P) and grain size (GS) values for case-II.
By comparing Fig. 11, 12, and Fig. 5, it is obvious that introducing geometrical imperfections
to micropillars (case-II and case-III) leads to lowering the maximum force value while the
deflection of pillars is increased by an order of magnitude. Further, comparing the slope of the
curves after onset of buckling in the aforementioned figures shows the effect of localized hardening
due to geometrical imperfections, which was absent in Fig. 5. The geometrical irregularities in
these sets of micropillars cause a non-uniform distribution of stress intensity along the micropillars
which leads to stress gradients which, in turn, and according to Eq. (18), causes additional
hardening.

24
Figure 12. Force vs. displacement for various porosity (P) and grain size (GS) values for case-
III.

25
The variation of buckling forces for micropillars in case-II and case-III for different porosity
and grain sizes are shown in Fig. 13 a-d.
Figure 13. Buckling force for micropillars with imperfections. (a) Force vs grain size (GS), and
(b) force vs porosity for micropillars in case-II. (c) Force vs grain size, and (d) force vs porosity
for micropillars in case-III.
The stress at which the onset of buckling occurs is the highest for micropillars with the smallest
grain sizes and lowest porosity, while this value drops down for higher grain sizes and higher
porosity. The onset of buckling forces for micropillars in all three categories show a stronger
(b) (a)
(c) (d)

26
dependency on grain size changes rather than the porosity variation, especially for grain sizes
below 1 micrometer. Further, a comparison of Fig.13 with Figs. 8 and 9 shows that the presence
of geometrical imperfections lowers the maximum buckling force for a given grain size and
porosity.
4. Comparison with Experiments and Discussion
Figure 14 shows a comparison of the modeling results with experiments in Saleh et al. [1].
Two sets of micropillars tested in compression are included in Fig. 14: One set of results for
micropillars sintered at 250 ˚C and having 17% - 20% porosity with the void sizes of 250 nm-300
nm, while another set of micropillars sintered at 550 ˚C and having less than 1% porosity with a
pore size of 170 nm. According to the parametric findings discussed in the previous section, and
summarized in Figs. 8, 9, and 13, it is expected that the micropillars sintered at 250 ˚C should be
stronger than that sintered at 550 ̊ C even though the latter have much less porosity than the former.
These experimental trends are qualitatively comparable to the numerical findings as shown in Fig.
14. The experimental and numerical results for the maximum force are comparable for the case of
micropillars with an average grain size of 250 nm where there is less than 5% difference between
the predicted maximum force and experimental result (Table 3).
Although the model is able to capture the experimental trends qualitatively, it is clear that there
is a quantitative difference between the two for the force-displacement curves. This is especially
true for micropillars with an average grain size of 3.31 µm. We speculate that this difference comes
from the fact that our model does not include damage and therefore the ultimate elongation cannot
be matched with experimental data. Further, the pores and their facets can act as sources or sinks
of dislocations, which has not been taken into account. It is clear from Fig. 2 that the dislocation
density can significantly affect the predicted stress-strain response from this model. Further, higher
sintering temperature in the case with an average grain size of 3.31 µm can increase the percentage
of low-angle grain boundaries and dislocation density transfer amongst neighboring grains, which
can lead to higher ductility and lower yield point [18, 45, 49]; where none of these phenomena are
considered in our model. We would like to emphasize that the microstructures demonstrated in
Fig. 1 are highly complex and the trends in the mechanical behavior captured by our model are
reasonable. The disparities mentioned above, however, point to the fact that further refinements to
the model can be incorporated.

27
Figure 14. A comparison between experimental and simulation results for force vs displacement
graph at different grain size (GS) and porosity values.

28
Table 3. Force at the onset of buckling
Grain size
P Buckling
(experiment)
(N)
P Buckling
(case I)
(model) (N)
P Buckling
(case II)
(model) (N)
P Buckling
(case III)
(model) (N)
250 nm 0.54 0.48 0.533 0.456
3.31 µm 0.14 0.37 0.293 0.25
Another noticeable difference between the modeling and the experimental results is that the
experimental load for the micropillars with 250 nm grain size drops sharply after 0.025 mm
deflection which represents catastrophic failure. Although in the modeling result, the load drop is
visible for these micropillars, since no failure criterion is implemented into the model, the drop is
not as catastrophic as that observed in the experiments. This difference can also be attributed to
void sizes and distribution. The void sizes and distribution for the two experimental micropillars
are shown in Fig. 15. Voids can act as stress concentrators where shear bands and cracks can
initiate, which indicates that in addition to porosity percentage, the void size and distribution will
also influence the pillar behavior. These results indicate that additively manufactured micropillars
can possess high strength despite their high porosity content as long as their microstructure is
composed of submicron-grains.
Figure 15. FIB cross-section images showing distribution and average void size of micropillars
a) with 250 ˚C sintering temperature and average grain size of 250 nm, and b) 550 ˚C sintering
temperature and average grain size of 3.31 µm.
1 µm 1 µm
(a) (b)

29
5. Conclusion
In this paper, a modeling framework that describes the mechanical behavior of AM parts is
developed and used to explain prior experimental results by the authors in the context of a
competition between softening caused by porosity and hardening caused by grain refinement. The
following conclusions can be drawn from the study:
• A stress-strain gradient model where deformation is described via equations of
dislocation density evolution is implemented into a UMAT subroutine and coupled
with LS-DYNA solver to analyze the mechanical behavior of additively manufactured
structures. This formulation incorporates the grain size and porosity of the structure via
a viscoplasticity model, which is coupled with the continuum dislocation dynamics
framework.
• The model reveals that the mechanical behavior of AM structures is governed by a
competition between strengthening caused by grain refinement and softening caused
by the porosity within the structures.
• The model was used to analyze experimentally observed compression behavior of AM
micropillars previously studied by the authors, where three sets of geometries (with and
without shape imperfections) were analyzed for grain sizes ranging from a few hundred
nanometers to a few micrometers and porosities ranging from 0% to 20%.
• The model showed that the hardening caused by grain refinement was a stronger effect
compared to softening caused by porosity. This led to structures with larger micron-
sized grains with low porosity having a highly ductile behavior with lower effective
modulus compared to those with sub-micron grains and high porosity. This unusual
prediction was consistent with the experimental results on AM micropillars.
• The localized stress and strain originated due to shape imperfection were captured by
the model. The existing shape imperfection caused early buckling and lowered the
maximum buckling force for the AM micropillar structures considered in this work.
Acknowledgement:
This work was supported by the National Science Foundation under Grant No. 1757117.

30
References:
1. Saleh, M.S., et al., Polycrystalline micropillars by a novel 3-D printing method and their behavior under compressive loads. Scripta Materialia, 2018. 149: p. 144-149.
2. Herzog, D., et al., Additive manufacturing of metals. Acta Materialia, 2016. 117: p. 371-392. 3. Gibson, I., D.W. Rosen, and B. Stucker, Additive manufacturing technologies. Vol. 17. 2014:
Springer. 4. Paulson, N.H., et al., Correlations between thermal history and keyhole porosity in laser powder
bed fusion. Additive Manufacturing, 2020: p. 101213. 5. Collins, P., et al., Microstructural control of additively manufactured metallic materials. Annual
Review of Materials Research, 2016. 46: p. 63-91. 6. Saleh, M.S., et al., 3D printed hierarchically-porous microlattice electrode materials for
exceptionally high specific capacity and areal capacity lithium ion batteries. Additive Manufacturing, 2018. 23: p. 70-78.
7. Zhu, Y., et al., Towards high-performance Li-ion batteries via optimized three-dimensional micro-lattice electrode architectures. Journal of Power Sources, 2020. 476: p. 228593.
8. Rahman, M.T., et al., Structure, electrical characteristics, and high-temperature stability of aerosol jet printed silver nanoparticle films. Journal of Applied Physics, 2016. 120(7): p. 075305.
9. Fleck, N., et al., Strain gradient plasticity: theory and experiment. Acta Metallurgica et materialia, 1994. 42(2): p. 475-487.
10. Wang, N., et al., Effect of grain size on mechanical properties of nanocrystalline materials. Acta Metallurgica et Materialia, 1995. 43(2): p. 519-528.
11. Fan, Z., A. Miodownik, and P. Tsakiropoulos, Microstructural characterisation of two phase materials. Materials science and technology, 1993. 9(12): p. 1094-1100.
12. Wang, Y.M., et al., Additively manufactured hierarchical stainless steels with high strength and ductility. Nature materials, 2018. 17(1): p. 63.
13. Andani, M.T., et al., Micromechanics modeling of metallic alloys 3D printed by selective laser melting. Materials & Design, 2018. 137: p. 204-213.
14. Siddiq, A., A porous crystal plasticity constitutive model for ductile deformation and failure in porous single crystals. International Journal of Damage Mechanics, 2018. 28(2): p. 233-248.
15. Li, D.S., et al., Predicting plastic flow and irradiation hardening of iron single crystal with mechanism-based continuum dislocation dynamics. International Journal of Plasticity, 2014. 52: p. 3-17.
16. Lyu, H., et al., Stress/strain gradient plasticity model for size effects in heterogeneous nano-microstructures. International Journal of Plasticity, 2017. 97: p. 46-63.
17. Hamid, M., H. Lyu, and H. Zbib, A dislocation-based stress-strain gradient plasticity model for strength and ductility in materials with gradient microstructures. Philosophical Magazine, 2018. 98(32): p. 2896-2916.
18. Hamid, M., et al., Modeling and characterization of grain boundaries and slip transmission in dislocation density-based crystal plasticity. Crystals, 2017. 7(6): p. 152.
19. Askari, H., et al., A study of the hot and cold deformation of twin-roll cast magnesium alloy AZ31. Philosophical Magazine, 2014. 94(4): p. 381-403.
20. Taheri-Nassaj, N. and H.M. Zbib, On dislocation pileups and stress-gradient dependent plastic flow. International Journal of Plasticity, 2015. 74: p. 1-16.
21. Akarapu, S. and J. Hirth, Dislocation pile-ups in stress gradients revisited. Acta Materialia, 2013. 61(10): p. 3621-3629.
22. Chakravarthy, S.S. and W. Curtin, Stress-gradient plasticity. Proceedings of the National Academy of Sciences, 2011. 108(38): p. 15716-15720.
23. Ohashi, T., M. Kawamukai, and H. Zbib, A multiscale approach for modeling scale-dependent yield stress in polycrystalline metals. International Journal of Plasticity, 2007. 23(5): p. 897-914.

31
24. Shizawa, K. and H.M. Zbib, A Strain-Gradient Thermodynamic Theory of Plasticity based on Dislocation Density and Incompatibility Tensor. Materials Science and Engineering A, 2000.
25. Ohashi, T., Crystal plasticity analysis of dislocation emission from micro voids. International Journal of Plasticity, 2005. 21(11): p. 2071-2088.
26. Livemore Software Technology Corporation. Software Products and Documentation,. 2011; Available from: http://www.lstc.com/download.
27. Tome, C.N. and R.A. Lebensohn, Manual for code Visco Plastic Self Consistent (VPSC). 2009. 28. Xu, W., et al., A continuum thermo-inelastic model for damage and healing in self-healing glass
materials. Int. J Plasticity, 2014. 62: p. 1-16. 29. Perzyna, P., Constitutive modeling of dissipative solids for postcritical behavior and fracture.
Trans ASME, 1984. 106: p. 410-419. 30. Khaleel, M., H.M. Zbib, and E.A. Nyberg, Constitutive Modeling of Deformation and Damage in
Superplastic Materials. Int. J. of Plasticity, 2001. 17: p. 277-296. 31. Orowan, E., Problems of plastic gliding. Proceedings of the Physical Society, 1940. 52(1): p. 8-
22. 32. Khaleel, M., H. Zbib, and E. Nyberg, Constitutive modeling of deformation and damage in
superplastic materials. International Journal of Plasticity, 2001. 17(3): p. 277-296. 33. Steglich, D., H. Wafai, and J. Besson, Interaction between anisotropic plastic deformation and
damage evolution in Al 2198 sheet metal. Engineering Fracture Mechanics, 2010. 77(17): p. 3501-3518.
34. Kocks, U.F., Laws for work-hardening and low-temperature creep. ASME, Transactions, Series H-Journal of Engineering Materials and Technology, 1976. 98: p. 76-85.
35. Bailey, J.E. and P.B. Hirsch, The dislocation distribution, flow stress, and stored energy in cold-worked polycrystalline silver. Philosophical Magazine, 1960. 5(53): p. 485-497.
36. Nye, J., Some geometrical relations in dislocated crystals. Acta metallurgica, 1953. 1(2): p. 153-162.
37. Shizawa, K. and H. Zbib, A thermodynamical theory of gradient elastoplasticity with dislocation density tensor. I: Fundamentals. International Journal of Plasticity, 1999. 15(9): p. 899-938.
38. Ohashi, T., Finite-element analysis of plastic slip and evolution of geometrically necessary dislocations in fcc crystals. Philosophical Magazine Letters, 1997. 75(2): p. 51-58.
39. (LSTC), L.S.T.C., LS DYNA keyword user's manual. 2013. 40. Wu, B., et al., Microstructure-hardened silver nanowires. Nano letters, 2006. 6(3): p. 468-472. 41. Matweb, http://www.matweb.com. 42. Smith, D.R. and F.R. Fickett, Low temperature properties of silver. Journal of research of the
national inistitute of standards and technology, 1995. 100(2). 43. Li, Y., A.J. Bushby, and D.J. Dunstan, The Hall–Petch effect as a manifestation of the general
size effect. Proceedings of the Royal Society A: Mathematical, Physical and Engineering Sciences, 2016. 472(2190): p. 20150890.
44. Schoeck, G. and W. Püschl, The kink energy in anisotropic media. physica status solidi (b), 1987. 144(1): p. 105-114.
45. Hamid, M. and H.M. Zbib, Dislocation Density-Based Multiscale Modeling of Deformation and Subgrain Texture in Polycrystals. JOM, 2019. 71(11): p. 4136-4143.
46. Dao, M., et al., Strength, strain-rate sensitivity and ductility of copper with nanoscale twins. Acta Materialia, 2006. 54: p. 5421-5432.
47. Long, X., et al., Strain rate-sensitivity of sintered silver nanoparticles using rate-jump indenation. Int. J. Mechanical Sciences, 2018. 140: p. 60-67.
48. Al-Fadhalah, K.J.H., et al., Microplastic processes developed in pure Ag with mesoscale annealing twins. Acta Materialia, 2008. 56(19): p. 5764-5774.
49. Jamalian, M., et al., Creation of heterogeneous microstructures in copper using high-pressure torsion to enhance mechanical properties. Materials Science and Engineering: A, 2019. 756: p. 142-148.