Modeling of Phase Transformation in Induction Hardening · Modeling of Phase Transformation in...
10
64 The Open Materials Science Journal, 2010, 4, 64-73 1874-088X/10 2010 Bentham Open Open Access Modeling of Phase Transformation in Induction Hardening K. Palaniradja * , N. Alagumurthi and V. Soundararajan Department of Mechanical Engineering, Pondicherry Engineering College, Pondicherry – 605 014, India Abstract: Mechanical properties of machined components are controlled by inducing phase transformations in the outer layer of the materials. Induction hardening is one such manufacturing process where the surface hardness is enhanced while the core is retained with the original structure and characteristics. In this study, a mathematical model had been developed to predict the hardness and the volume fraction of martensite present in the hardened surface. Experiments applying induction hardening were conducted on the following specimen materials AISI 1040, AISI 4140, AISI 4340, AISI 1055, AISI 6150 and AISI 9255. The microstructures obtained from the experiment showed a moderate phase transformation of austenite to martensite. The hardness and the volume fraction of martensite estimated from the experiments were found to match the results of mathematical modeling as well as the theoretical model using regression analysis. Keywords: Modeling, phase transformation, induction hardening, volume fraction, validation 1. INTRODUCTION Induction hardening is an important manufacturing process to control the mechanical properties of metal parts where surface hardness is enhanced while the core retains the original structure and toughness characteristics [1]. This is possible by inducing suitable phase transformation in the outer layer of the material. Two types of modification occur when phase transformation takes place while quenching. The first type called metallurgical interaction is kinetic modifi- cation which sometimes leads to a different morphology in the phase produced. The second type (commonly called transformation plasticity) is a mechanical modification related to the progress of transformation, and takes place when plastic deformation occurs under [2] stresses lower than the yield stress of the material (Denis, S., et al., 1985). The importance of thorough knowledge of the transformation characteristics of steel in the solution of heat treatment and steel selection problems and in the explanation of stress related phenomena has long been realized. It is obvious that for the quick decisions, which are the order of the day, metallurgists and materials engineers cannot undertake expensive and time-consuming metallographic experiments to determine volume fraction of martensite and maximum hardness value obtainable, considering heating and cooling curves relevant to their actual technology and the work material. Instead, they must turn to the literature, but unfortunately the data found, i.e. the chemical composition, grain size, heating and cooling curves indicated on the existing diagrams, differ from those required [3,4]. It is felt that the most direct assistance to the materials engineers employed in heat treatment industry is to provide them with solution in the form of mathematical models to predict the hardness and volume fraction of martensite at any point in the Induction hardened zone of a given steel *Address correspondence to this author at the Department of Mechanical Engineering, Pondicherry Engineering College, Pondicherry-605014, India; Tel: 91 413 2655281-287, Ext. 252,259; Fax: 91 413 2655101; E-mail: [email protected] component with any composition within the allowed range for the induction hardening steel type. Hence, in this paper a mathematical modeling has been developed to predict the volume fraction of martensite and hardness for the materials considered in the current research [5]. 2. MODELING OF INDUCTION HARDENING Modeling of induction hardening is a complex issue which involves numerically solving the Maxwell’s equations for electromagnetic field around workpiece, coupled with heat transfer principles for modeling the product thermal process (Nemkov, V.S., and Goldstein, R., 1999). The system is inevitably highly nonlinear because of temperature dependent material properties of workpiece. In the past, more attention of numerical simulation was paid to modeling only certain aspects of the induction hardening problem; little effort has been paid to model the integrated process from heating to final hardening. Numerical simulation of the magnetic field was ever conducted. They provided valuable analysis for the magnetic vector potential which was a very important parameter for eddy current and Joule heat determination. Simulation of induction heating has been carried out and provided models for solving coupled electromagnetic/thermal analysis. Recently, quenching and phase transformation process has been simulated. And the Koistinen-Marburger law and Avrami equation was applied for determination of volume fraction of micro-constituents formed in the quench cooling process. However, few studies have been found to predict the hardness distribution using numerical simulation. Jiankun Yuan et al., (2003) [6] developed an integrated FEA based modeling system with the capabilities to simulate the electromagnetic field induced heating process, austenite state holding processes, and severe quenching processes. This modeling system helps in determining volume fraction of micro constituent such as martensite formed in the quench cooling process, and final hardness distribution pattern in work piece. However, there is a restriction in using this model because this model involves analysis of interaction of
Transcript of Modeling of Phase Transformation in Induction Hardening · Modeling of Phase Transformation in...
64 The Open Materials Science Journal, 2010, 4, 64-73
1874-088X/10 2010 Bentham Open
Open Access
Modeling of Phase Transformation in Induction Hardening
K. Palaniradja*, N. Alagumurthi and V. Soundararajan
Department of Mechanical Engineering, Pondicherry Engineering College, Pondicherry – 605 014, India
Abstract: Mechanical properties of machined components are controlled by inducing phase transformations in the outer layer
of the materials. Induction hardening is one such manufacturing process where the surface hardness is enhanced while the
core is retained with the original structure and characteristics. In this study, a mathematical model had been developed to
predict the hardness and the volume fraction of martensite present in the hardened surface. Experiments applying induction
hardening were conducted on the following specimen materials AISI 1040, AISI 4140, AISI 4340, AISI 1055, AISI 6150 and
AISI 9255. The microstructures obtained from the experiment showed a moderate phase transformation of austenite to
martensite. The hardness and the volume fraction of martensite estimated from the experiments were found to match the
results of mathematical modeling as well as the theoretical model using regression analysis.
Keywords: Modeling, phase transformation, induction hardening, volume fraction, validation
1. INTRODUCTION
Induction hardening is an important manufacturing process to control the mechanical properties of metal parts where surface hardness is enhanced while the core retains the original structure and toughness characteristics [1]. This is possible by inducing suitable phase transformation in the outer layer of the material. Two types of modification occur when phase transformation takes place while quenching. The first type called metallurgical interaction is kinetic modifi-cation which sometimes leads to a different morphology in the phase produced. The second type (commonly called transformation plasticity) is a mechanical modification related to the progress of transformation, and takes place when plastic deformation occurs under [2] stresses lower than the yield stress of the material (Denis, S., et al., 1985).
The importance of thorough knowledge of the transformation characteristics of steel in the solution of heat treatment and steel selection problems and in the explanation of stress related phenomena has long been realized. It is obvious that for the quick decisions, which are the order of the day, metallurgists and materials engineers cannot undertake expensive and time-consuming metallographic experiments to determine volume fraction of martensite and maximum hardness value obtainable, considering heating and cooling curves relevant to their actual technology and the work material. Instead, they must turn to the literature, but unfortunately the data found, i.e. the chemical composition, grain size, heating and cooling curves indicated on the existing diagrams, differ from those required [3,4]. It is felt that the most direct assistance to the materials engineers employed in heat treatment industry is to provide them with solution in the form of mathematical models to predict the hardness and volume fraction of martensite at any point in the Induction hardened zone of a given steel
*Address correspondence to this author at the Department of Mechanical
Engineering, Pondicherry Engineering College, Pondicherry-605014, India;
Tel: 91 413 2655281-287, Ext. 252,259; Fax: 91 413 2655101; E-mail:
component with any composition within the allowed range for the induction hardening steel type. Hence, in this paper a mathematical modeling has been developed to predict the volume fraction of martensite and hardness for the materials considered in the current research [5].
2. MODELING OF INDUCTION HARDENING
Modeling of induction hardening is a complex issue which involves numerically solving the Maxwell’s equations for electromagnetic field around workpiece, coupled with heat transfer principles for modeling the product thermal process (Nemkov, V.S., and Goldstein, R., 1999). The system is inevitably highly nonlinear because of temperature dependent material properties of workpiece. In the past, more attention of numerical simulation was paid to modeling only certain aspects of the induction hardening problem; little effort has been paid to model the integrated process from heating to final hardening. Numerical simulation of the magnetic field was ever conducted. They provided valuable analysis for the magnetic vector potential which was a very important parameter for eddy current and Joule heat determination. Simulation of induction heating has been carried out and provided models for solving coupled electromagnetic/thermal analysis. Recently, quenching and phase transformation process has been simulated. And the Koistinen-Marburger law and Avrami equation was applied for determination of volume fraction of micro-constituents formed in the quench cooling process. However, few studies have been found to predict the hardness distribution using numerical simulation.
Jiankun Yuan et al., (2003) [6] developed an integrated FEA based modeling system with the capabilities to simulate the electromagnetic field induced heating process, austenite state holding processes, and severe quenching processes. This modeling system helps in determining volume fraction of micro constituent such as martensite formed in the quench cooling process, and final hardness distribution pattern in work piece. However, there is a restriction in using this model because this model involves analysis of interaction of
Modeling of Phase Transformation in Induction Hardening The Open Materials Science Journal, 2010, Volume 4 65
continuous cooling curve with Temperature –Time – Transformation diagram. It must be remembered that cooling curves are difficult to obtain in Induction hardening applications. This is because the exact conditions are difficult to duplicate in the laboratory (Scott Mackenzie., 2002).
This paper deals with the model, which may be considered as an extension of Yuan model, developed to predict the volume fraction of martensite theoretically. A Regression model has also been developed to estimate the Hardness in HRA for steel materials, AISI 1040, AISI 4140, AISI 4340, AISI 1055, AISI 6150 and AISI 9255. These models overcome the drawbacks in the modeling system explained above. Experimental validation of the developed model has also been presented here.
3. MATHEMATICAL MODEL TO PREDICT THE HARDNESS
In order to develop the mathematical model to predict the hardness and volume fraction of martensite for Induction hardening of steel materials (G1 – Material and G2 – Material), Induction hardening experiments have been conducted.
Table 1 shows the details about the operating conditions and the materials.
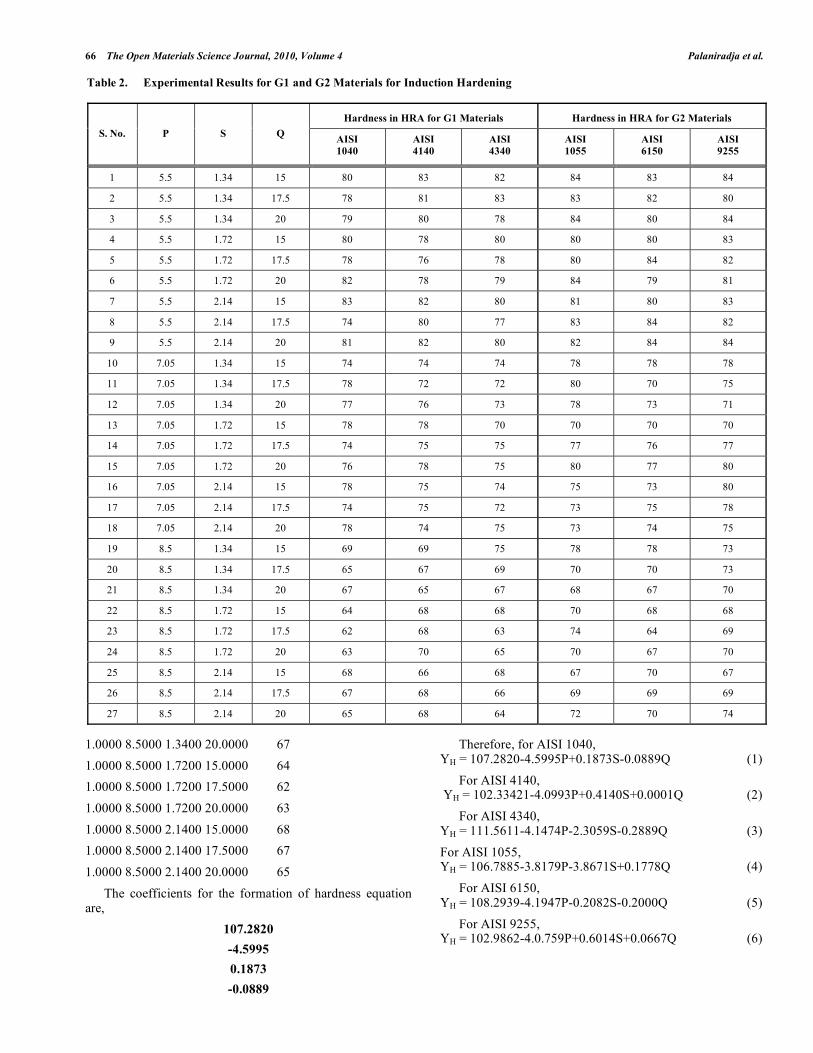
Table 2 shows the experimental results in the 33 Design
Matrix for the G1 and G2 Induction hardening rack materials respectively.
Regression analysis has been carried out using MATLAB and the Regression equations (Equation to predict the hardness of the materials) have been found and the same are given below:
3.1. Model Regression Analysis
AISI 1040
Coeff =
1.0000 5.5000 1.3400 15.0000 80
1.0000 5.5000 1.3400 17.5000 78
1.0000 5.5000 1.3400 20.0000 79
1.0000 5.5000 1.7200 15.0000 80
1.0000 5.5000 1.7200 17.5000 78
1.0000 5.5000 1.7200 20.0000 82
1.0000 5.5000 2.1400 15.0000 83
1.0000 5.5000 2.1400 17.5000 74
1.0000 5.5000 2.1400 20.0000 81
1.0000 7.0500 1.3400 15.0000 74
1.0000 7.0500 1.3400 17.5000 78
1.0000 7.0500 1.3400 20.0000 77
1.0000 7.0500 1.7200 15.0000 78
1.0000 7.0500 1.7200 17.5000 74
1.0000 7.0500 1.7200 20.0000 76
1.0000 7.0500 2.1400 15.0000 78
1.0000 7.0500 2.1400 17.5000 74
1.0000 7.0500 2.1400 20.0000 78
1.0000 8.5000 1.3400 15.0000 69
1.0000 8.5000 1.3400 17.5000 65
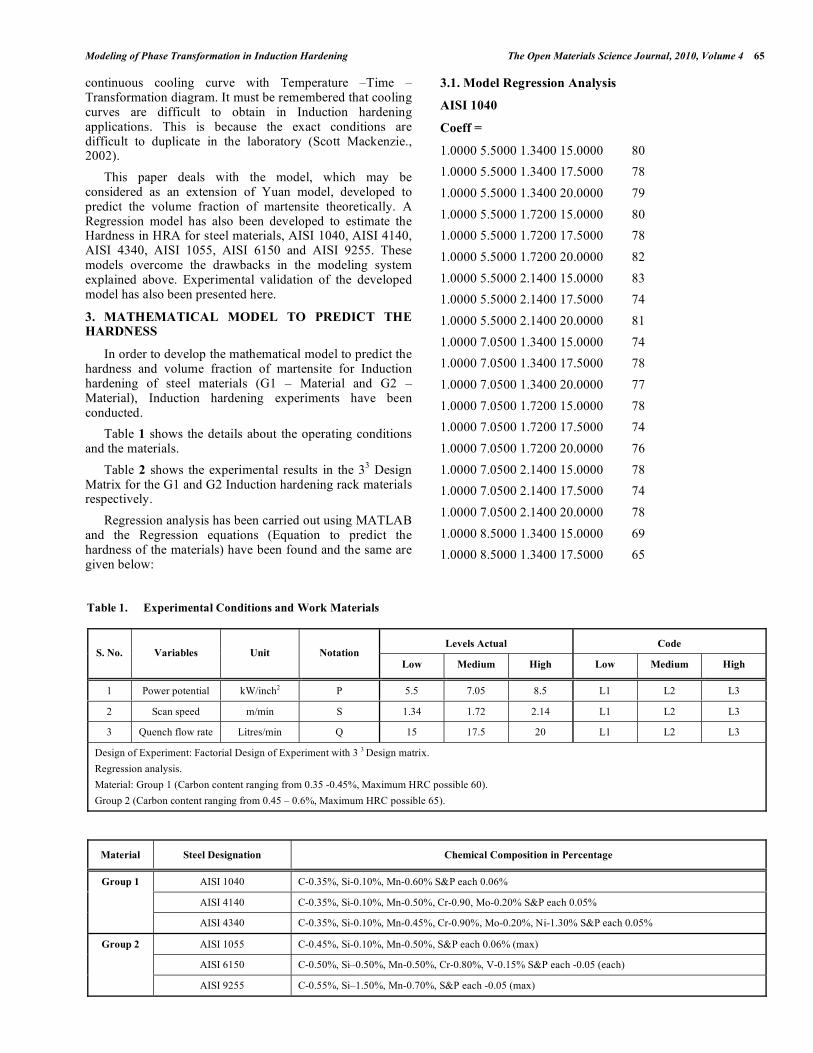
Table 1. Experimental Conditions and Work Materials
Levels Actual Code S. No. Variables Unit Notation
Low Medium High Low Medium High
1 Power potential kW/inch2 P 5.5 7.05 8.5 L1 L2 L3
2 Scan speed m/min S 1.34 1.72 2.14 L1 L2 L3
3 Quench flow rate Litres/min Q 15 17.5 20 L1 L2 L3
Design of Experiment: Factorial Design of Experiment with 3 3 Design matrix.
Regression analysis.
Material: Group 1 (Carbon content ranging from 0.35 -0.45%, Maximum HRC possible 60).
Group 2 (Carbon content ranging from 0.45 – 0.6%, Maximum HRC possible 65).
Material Steel Designation Chemical Composition in Percentage
AISI 1040 C-0.35%, Si-0.10%, Mn-0.60% S&P each 0.06%
AISI 4140 C-0.35%, Si-0.10%, Mn-0.50%, Cr-0.90, Mo-0.20% S&P each 0.05%
Group 1
AISI 4340 C-0.35%, Si-0.10%, Mn-0.45%, Cr-0.90%, Mo-0.20%, Ni-1.30% S&P each 0.05%
AISI 1055 C-0.45%, Si-0.10%, Mn-0.50%, S&P each 0.06% (max)
AISI 6150 C-0.50%, Si–0.50%, Mn-0.50%, Cr-0.80%, V-0.15% S&P each -0.05 (each)
Group 2
AISI 9255 C-0.55%, Si–1.50%, Mn-0.70%, S&P each -0.05 (max)
66 The Open Materials Science Journal, 2010, Volume 4 Palaniradja et al.
1.0000 8.5000 1.3400 20.0000 67
1.0000 8.5000 1.7200 15.0000 64
1.0000 8.5000 1.7200 17.5000 62
1.0000 8.5000 1.7200 20.0000 63
1.0000 8.5000 2.1400 15.0000 68
1.0000 8.5000 2.1400 17.5000 67
1.0000 8.5000 2.1400 20.0000 65
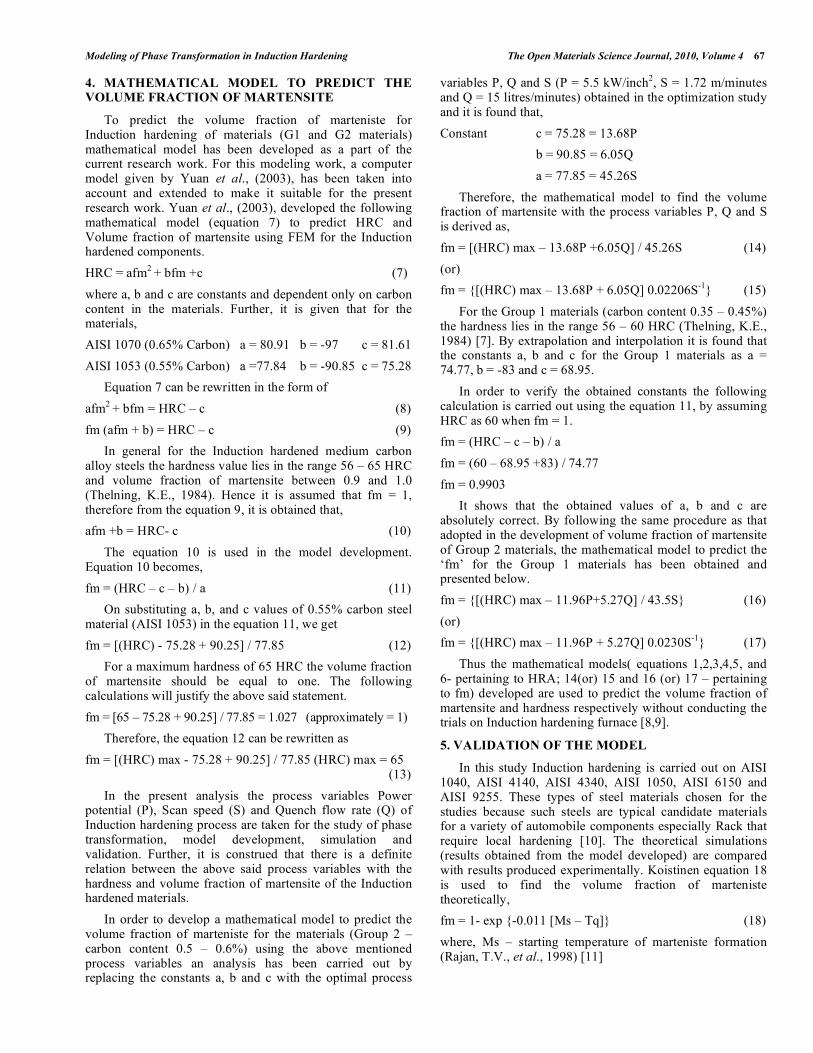
The coefficients for the formation of hardness equation are,
107.2820
-4.5995
0.1873
-0.0889
Therefore, for AISI 1040, YH = 107.2820-4.5995P+0.1873S-0.0889Q (1)
For AISI 4140, YH = 102.33421-4.0993P+0.4140S+0.0001Q (2)
For AISI 4340, YH = 111.5611-4.1474P-2.3059S-0.2889Q (3)
For AISI 1055, YH = 106.7885-3.8179P-3.8671S+0.1778Q (4)
For AISI 6150, YH = 108.2939-4.1947P-0.2082S-0.2000Q (5)
For AISI 9255, YH = 102.9862-4.0.759P+0.6014S+0.0667Q (6)
Table 2. Experimental Results for G1 and G2 Materials for Induction Hardening
Hardness in HRA for G1 Materials Hardness in HRA for G2 Materials
S. No. P S Q AISI
1040
AISI
4140
AISI
4340
AISI
1055
AISI
6150
AISI
9255
1 5.5 1.34 15 80 83 82 84 83 84
2 5.5 1.34 17.5 78 81 83 83 82 80
3 5.5 1.34 20 79 80 78 84 80 84
4 5.5 1.72 15 80 78 80 80 80 83
5 5.5 1.72 17.5 78 76 78 80 84 82
6 5.5 1.72 20 82 78 79 84 79 81
7 5.5 2.14 15 83 82 80 81 80 83
8 5.5 2.14 17.5 74 80 77 83 84 82
9 5.5 2.14 20 81 82 80 82 84 84
10 7.05 1.34 15 74 74 74 78 78 78
11 7.05 1.34 17.5 78 72 72 80 70 75
12 7.05 1.34 20 77 76 73 78 73 71
13 7.05 1.72 15 78 78 70 70 70 70
14 7.05 1.72 17.5 74 75 75 77 76 77
15 7.05 1.72 20 76 78 75 80 77 80
16 7.05 2.14 15 78 75 74 75 73 80
17 7.05 2.14 17.5 74 75 72 73 75 78
18 7.05 2.14 20 78 74 75 73 74 75
19 8.5 1.34 15 69 69 75 78 78 73
20 8.5 1.34 17.5 65 67 69 70 70 73
21 8.5 1.34 20 67 65 67 68 67 70
22 8.5 1.72 15 64 68 68 70 68 68
23 8.5 1.72 17.5 62 68 63 74 64 69
24 8.5 1.72 20 63 70 65 70 67 70
25 8.5 2.14 15 68 66 68 67 70 67
26 8.5 2.14 17.5 67 68 66 69 69 69
27 8.5 2.14 20 65 68 64 72 70 74
Modeling of Phase Transformation in Induction Hardening The Open Materials Science Journal, 2010, Volume 4 67
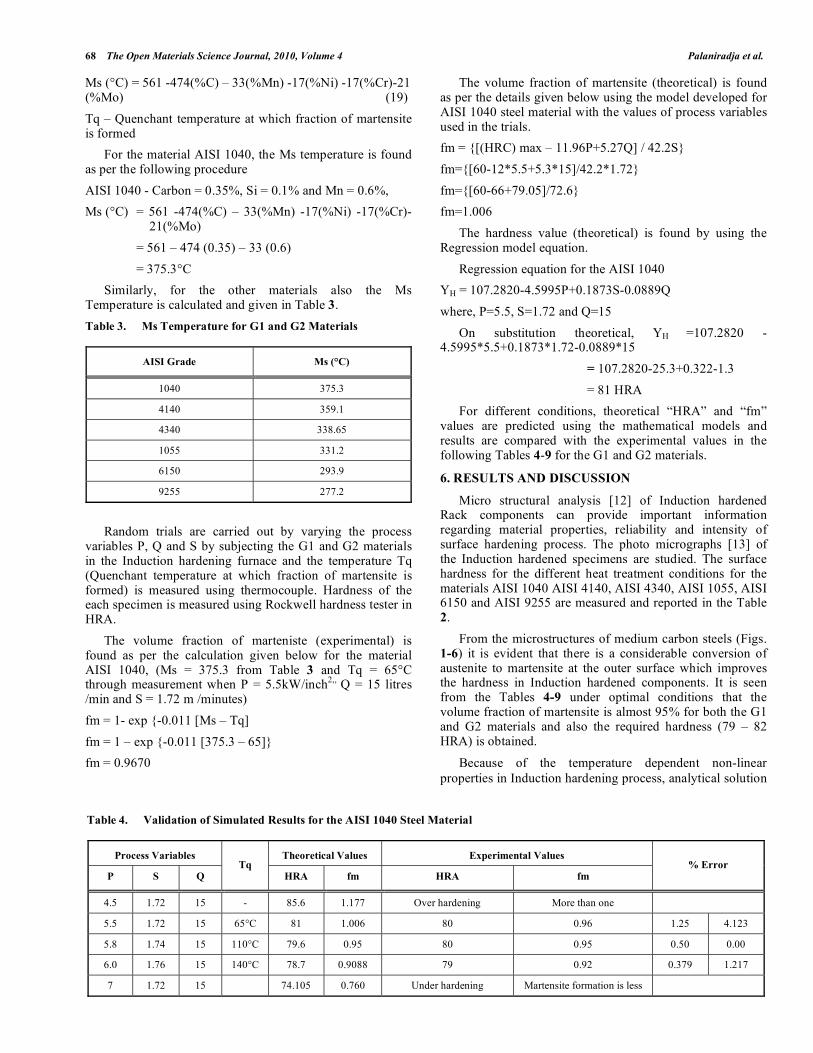
4. MATHEMATICAL MODEL TO PREDICT THE VOLUME FRACTION OF MARTENSITE
To predict the volume fraction of marteniste for Induction hardening of materials (G1 and G2 materials) mathematical model has been developed as a part of the current research work. For this modeling work, a computer model given by Yuan et al., (2003), has been taken into account and extended to make it suitable for the present research work. Yuan et al., (2003), developed the following mathematical model (equation 7) to predict HRC and Volume fraction of martensite using FEM for the Induction hardened components.
HRC = afm2
+ bfm +c (7)
where a, b and c are constants and dependent only on carbon content in the materials. Further, it is given that for the materials,
AISI 1070 (0.65% Carbon) a = 80.91 b = -97 c = 81.61
AISI 1053 (0.55% Carbon) a =77.84 b = -90.85 c = 75.28
Equation 7 can be rewritten in the form of
afm2
+ bfm = HRC – c (8)
fm (afm + b) = HRC – c (9)
In general for the Induction hardened medium carbon alloy steels the hardness value lies in the range 56 – 65 HRC and volume fraction of martensite between 0.9 and 1.0 (Thelning, K.E., 1984). Hence it is assumed that fm = 1, therefore from the equation 9, it is obtained that,
afm +b = HRC- c (10)
The equation 10 is used in the model development. Equation 10 becomes,
fm = (HRC – c – b) / a (11)
On substituting a, b, and c values of 0.55% carbon steel material (AISI 1053) in the equation 11, we get
fm = [(HRC) - 75.28 + 90.25] / 77.85 (12)
For a maximum hardness of 65 HRC the volume fraction of martensite should be equal to one. The following calculations will justify the above said statement.
fm = [65 – 75.28 + 90.25] / 77.85 = 1.027 (approximately = 1)
Therefore, the equation 12 can be rewritten as
fm = [(HRC) max - 75.28 + 90.25] / 77.85 (HRC) max = 65 (13)
In the present analysis the process variables Power potential (P), Scan speed (S) and Quench flow rate (Q) of Induction hardening process are taken for the study of phase transformation, model development, simulation and validation. Further, it is construed that there is a definite relation between the above said process variables with the hardness and volume fraction of martensite of the Induction hardened materials.
In order to develop a mathematical model to predict the volume fraction of marteniste for the materials (Group 2 – carbon content 0.5 – 0.6%) using the above mentioned process variables an analysis has been carried out by replacing the constants a, b and c with the optimal process
variables P, Q and S (P = 5.5 kW/inch2, S = 1.72 m/minutes
and Q = 15 litres/minutes) obtained in the optimization study and it is found that,
Constant c = 75.28 = 13.68P
b = 90.85 = 6.05Q
a = 77.85 = 45.26S
Therefore, the mathematical model to find the volume fraction of martensite with the process variables P, Q and S is derived as,
fm = [(HRC) max – 13.68P +6.05Q] / 45.26S (14)
(or)
fm = {[(HRC) max – 13.68P + 6.05Q] 0.02206S-1
} (15)
For the Group 1 materials (carbon content 0.35 – 0.45%) the hardness lies in the range 56 – 60 HRC (Thelning, K.E., 1984) [7]. By extrapolation and interpolation it is found that the constants a, b and c for the Group 1 materials as a = 74.77, b = -83 and c = 68.95.
In order to verify the obtained constants the following calculation is carried out using the equation 11, by assuming HRC as 60 when fm = 1.
fm = (HRC – c – b) / a
fm = (60 – 68.95 +83) / 74.77
fm = 0.9903
It shows that the obtained values of a, b and c are absolutely correct. By following the same procedure as that adopted in the development of volume fraction of martensite of Group 2 materials, the mathematical model to predict the ‘fm’ for the Group 1 materials has been obtained and presented below.
fm = {[(HRC) max – 11.96P+5.27Q] / 43.5S} (16)
(or)
fm = {[(HRC) max – 11.96P + 5.27Q] 0.0230S-1
} (17)
Thus the mathematical models( equations 1,2,3,4,5, and 6- pertaining to HRA; 14(or) 15 and 16 (or) 17 – pertaining to fm) developed are used to predict the volume fraction of martensite and hardness respectively without conducting the trials on Induction hardening furnace [8,9].
5. VALIDATION OF THE MODEL
In this study Induction hardening is carried out on AISI 1040, AISI 4140, AISI 4340, AISI 1050, AISI 6150 and AISI 9255. These types of steel materials chosen for the studies because such steels are typical candidate materials for a variety of automobile components especially Rack that require local hardening [10]. The theoretical simulations (results obtained from the model developed) are compared with results produced experimentally. Koistinen equation 18 is used to find the volume fraction of marteniste theoretically,
fm = 1- exp {-0.011 [Ms – Tq]} (18)
where, Ms – starting temperature of marteniste formation (Rajan, T.V., et al., 1998) [11]
68 The Open Materials Science Journal, 2010, Volume 4 Palaniradja et al.
Ms (°C) = 561 -474(%C) – 33(%Mn) -17(%Ni) -17(%Cr)-21 (%Mo) (19)
Tq – Quenchant temperature at which fraction of martensite is formed
For the material AISI 1040, the Ms temperature is found as per the following procedure
AISI 1040 - Carbon = 0.35%, Si = 0.1% and Mn = 0.6%,
Ms (°C) = 561 -474(%C) – 33(%Mn) -17(%Ni) -17(%Cr)- 21(%Mo)
= 561 – 474 (0.35) – 33 (0.6)
= 375.3°C
Similarly, for the other materials also the Ms Temperature is calculated and given in Table 3.
Table 3. Ms Temperature for G1 and G2 Materials
AISI Grade Ms (°C)
1040 375.3
4140 359.1
4340 338.65
1055 331.2
6150 293.9
9255 277.2
Random trials are carried out by varying the process variables P, Q and S by subjecting the G1 and G2 materials in the Induction hardening furnace and the temperature Tq (Quenchant temperature at which fraction of martensite is formed) is measured using thermocouple. Hardness of the each specimen is measured using Rockwell hardness tester in HRA.
The volume fraction of marteniste (experimental) is found as per the calculation given below for the material AISI 1040, (Ms = 375.3 from Table 3 and Tq = 65°C through measurement when P = 5.5kW/inch
2,, Q = 15 litres
/min and S = 1.72 m /minutes)
fm = 1- exp {-0.011 [Ms – Tq]
fm = 1 – exp {-0.011 [375.3 – 65]}
fm = 0.9670
The volume fraction of martensite (theoretical) is found as per the details given below using the model developed for AISI 1040 steel material with the values of process variables used in the trials.
fm = {[(HRC) max – 11.96P+5.27Q] / 42.2S}
fm={[60-12*5.5+5.3*15]/42.2*1.72}
fm={[60-66+79.05]/72.6}
fm=1.006
The hardness value (theoretical) is found by using the Regression model equation.
Regression equation for the AISI 1040
YH = 107.2820-4.5995P+0.1873S-0.0889Q
where, P=5.5, S=1.72 and Q=15
On substitution theoretical, YH =107.2820 -4.5995*5.5+0.1873*1.72-0.0889*15
= 107.2820-25.3+0.322-1.3
= 81 HRA
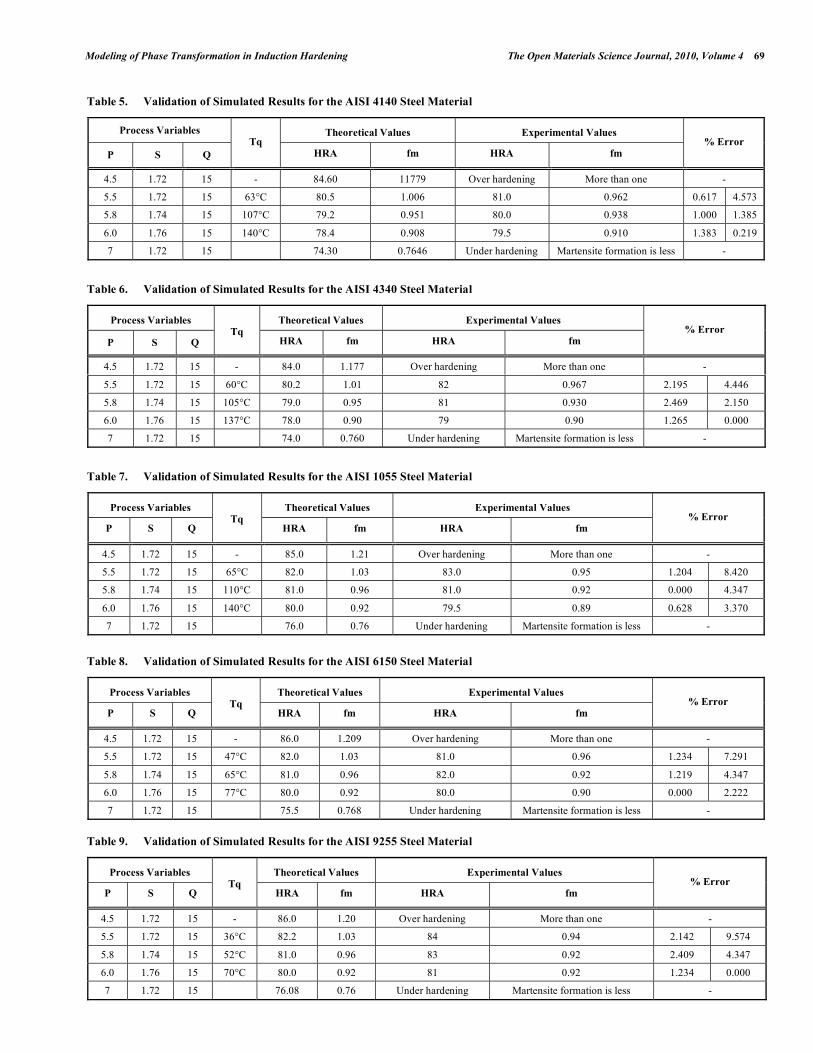
For different conditions, theoretical “HRA” and “fm” values are predicted using the mathematical models and results are compared with the experimental values in the following Tables 4-9 for the G1 and G2 materials.
6. RESULTS AND DISCUSSION
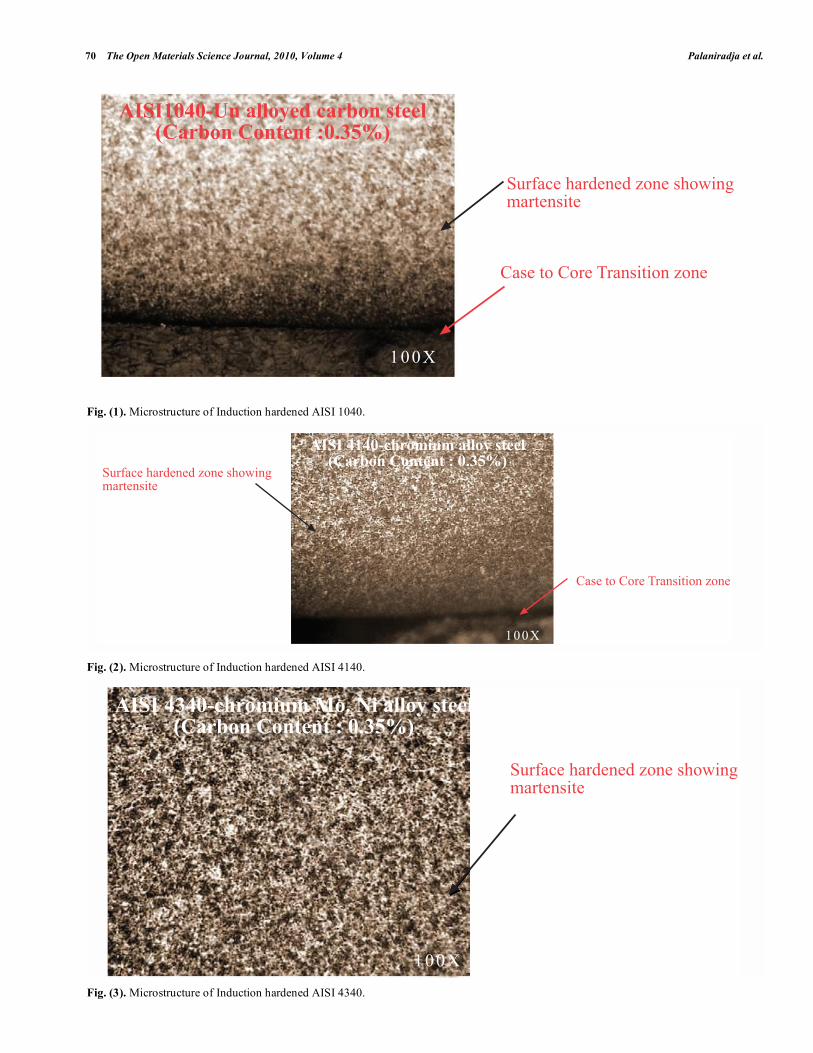
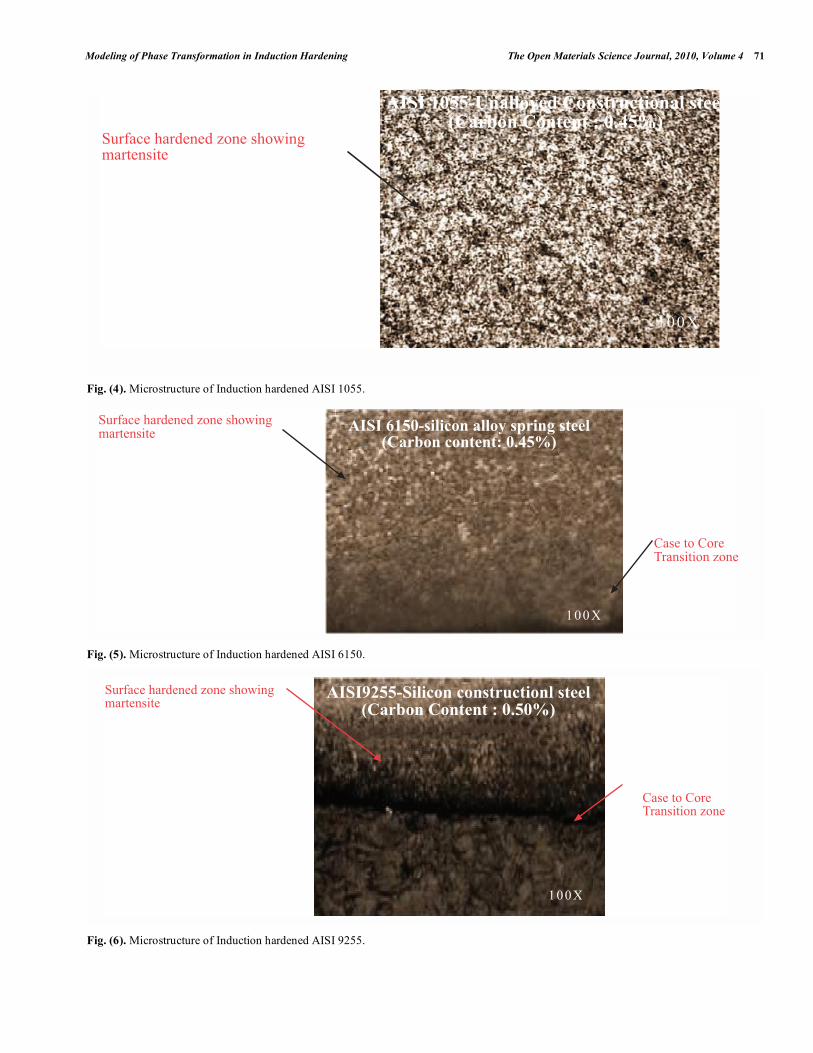
Micro structural analysis [12] of Induction hardened Rack components can provide important information regarding material properties, reliability and intensity of surface hardening process. The photo micrographs [13] of the Induction hardened specimens are studied. The surface hardness for the different heat treatment conditions for the materials AISI 1040 AISI 4140, AISI 4340, AISI 1055, AISI 6150 and AISI 9255 are measured and reported in the Table 2.
From the microstructures of medium carbon steels (Figs. 1-6) it is evident that there is a considerable conversion of austenite to martensite at the outer surface which improves the hardness in Induction hardened components. It is seen from the Tables 4-9 under optimal conditions that the volume fraction of martensite is almost 95% for both the G1 and G2 materials and also the required hardness (79 – 82 HRA) is obtained.
Because of the temperature dependent non-linear
properties in Induction hardening process, analytical solution
Table 4. Validation of Simulated Results for the AISI 1040 Steel Material
Process Variables Theoretical Values Experimental Values
P S Q Tq
HRA fm HRA fm % Error
4.5 1.72 15 - 85.6 1.177 Over hardening More than one
5.5 1.72 15 65°C 81 1.006 80 0.96 1.25 4.123
5.8 1.74 15 110°C 79.6 0.95 80 0.95 0.50 0.00
6.0 1.76 15 140°C 78.7 0.9088 79 0.92 0.379 1.217
7 1.72 15 74.105 0.760 Under hardening Martensite formation is less
Modeling of Phase Transformation in Induction Hardening The Open Materials Science Journal, 2010, Volume 4 69
Table 5. Validation of Simulated Results for the AISI 4140 Steel Material
Process Variables Theoretical Values Experimental Values
P S Q
Tq HRA fm HRA fm
% Error
4.5 1.72 15 - 84.60 11779 Over hardening More than one -
5.5 1.72 15 63°C 80.5 1.006 81.0 0.962 0.617 4.573
5.8 1.74 15 107°C 79.2 0.951 80.0 0.938 1.000 1.385
6.0 1.76 15 140°C 78.4 0.908 79.5 0.910 1.383 0.219
7 1.72 15 74.30 0.7646 Under hardening Martensite formation is less -
Table 6. Validation of Simulated Results for the AISI 4340 Steel Material
Process Variables Theoretical Values Experimental Values
P S Q Tq
HRA fm HRA fm % Error
4.5 1.72 15 - 84.0 1.177 Over hardening More than one -
5.5 1.72 15 60°C 80.2 1.01 82 0.967 2.195 4.446
5.8 1.74 15 105°C 79.0 0.95 81 0.930 2.469 2.150
6.0 1.76 15 137°C 78.0 0.90 79 0.90 1.265 0.000
7 1.72 15 74.0 0.760 Under hardening Martensite formation is less -
Table 7. Validation of Simulated Results for the AISI 1055 Steel Material
Process Variables Theoretical Values Experimental Values
P S Q Tq
HRA fm HRA fm % Error
4.5 1.72 15 - 85.0 1.21 Over hardening More than one -
5.5 1.72 15 65°C 82.0 1.03 83.0 0.95 1.204 8.420
5.8 1.74 15 110°C 81.0 0.96 81.0 0.92 0.000 4.347
6.0 1.76 15 140°C 80.0 0.92 79.5 0.89 0.628 3.370
7 1.72 15 76.0 0.76 Under hardening Martensite formation is less -
Table 8. Validation of Simulated Results for the AISI 6150 Steel Material
Process Variables Theoretical Values Experimental Values
P S Q Tq
HRA fm HRA fm % Error
4.5 1.72 15 - 86.0 1.209 Over hardening More than one -
5.5 1.72 15 47°C 82.0 1.03 81.0 0.96 1.234 7.291
5.8 1.74 15 65°C 81.0 0.96 82.0 0.92 1.219 4.347
6.0 1.76 15 77°C 80.0 0.92 80.0 0.90 0.000 2.222
7 1.72 15 75.5 0.768 Under hardening Martensite formation is less -
Table 9. Validation of Simulated Results for the AISI 9255 Steel Material
Process Variables Theoretical Values Experimental Values
P S Q Tq
HRA fm HRA fm % Error
4.5 1.72 15 - 86.0 1.20 Over hardening More than one -
5.5 1.72 15 36°C 82.2 1.03 84 0.94 2.142 9.574
5.8 1.74 15 52°C 81.0 0.96 83 0.92 2.409 4.347
6.0 1.76 15 70°C 80.0 0.92 81 0.92 1.234 0.000
7 1.72 15 76.08 0.76 Under hardening Martensite formation is less -
70 The Open Materials Science Journal, 2010, Volume 4 Palaniradja et al.
Fig. (1). Microstructure of Induction hardened AISI 1040.
Fig. (2). Microstructure of Induction hardened AISI 4140.
Fig. (3). Microstructure of Induction hardened AISI 4340.
����������� ��������������� ��������������������
�������������� �������������������
�������������������� ���
����
�������������� �������������������
�������������������� ���
�������������� !" �� ������� ���������������������
����
�������������� �������������������
�������������� !" �#���$!�� ������� ���������������������
����
Modeling of Phase Transformation in Induction Hardening The Open Materials Science Journal, 2010, Volume 4 71
Fig. (4). Microstructure of Induction hardened AISI 1055.
Fig. (5). Microstructure of Induction hardened AISI 6150.
Fig. (6). Microstructure of Induction hardened AISI 9255.
�������������� �������������������
����������� ����������"��!�� ����� ���������������������
����
�����%�����! !���� ����&�!'����� ��������������������
�������������� �������������������
�������������������� ���
����
�������������� �������������������
�������������������� ���
����()����! !��������"��!� ����� ���������������������
����
72 The Open Materials Science Journal, 2010, Volume 4 Palaniradja et al.
is very difficult to obtain [14]. When surfaces with complex geometric shape are heat treated the problems become more cumbersome. It must also be remembered that cooling curves are difficult to obtain in Induction hardening applications [15]. Hence, mathematical models will allow engineers/metallurgists to experiment with the critical process variables such as Power potential, Scan speed Quench flow rate and Frequency before expensive investment or unforeseen failures in mass produced items.
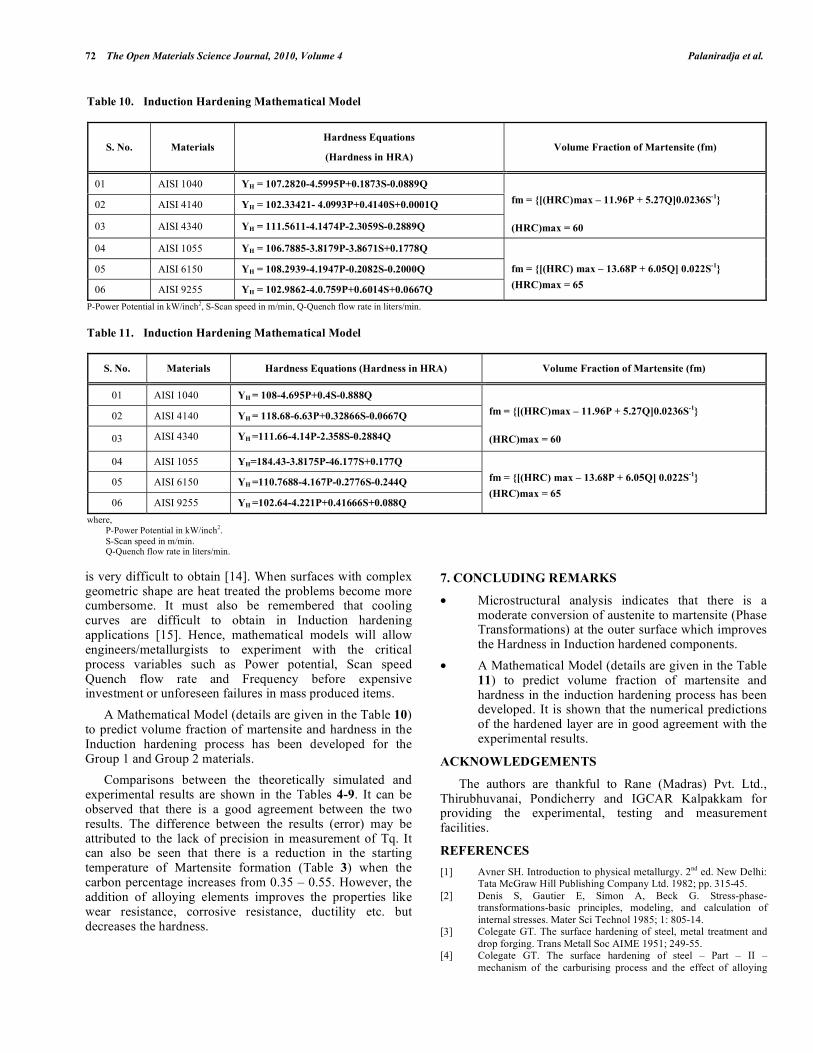
A Mathematical Model (details are given in the Table 10) to predict volume fraction of martensite and hardness in the Induction hardening process has been developed for the Group 1 and Group 2 materials.
Comparisons between the theoretically simulated and experimental results are shown in the Tables 4-9. It can be observed that there is a good agreement between the two results. The difference between the results (error) may be attributed to the lack of precision in measurement of Tq. It can also be seen that there is a reduction in the starting temperature of Martensite formation (Table 3) when the carbon percentage increases from 0.35 – 0.55. However, the addition of alloying elements improves the properties like wear resistance, corrosive resistance, ductility etc. but decreases the hardness.
7. CONCLUDING REMARKS
• Microstructural analysis indicates that there is a moderate conversion of austenite to martensite (Phase Transformations) at the outer surface which improves the Hardness in Induction hardened components.
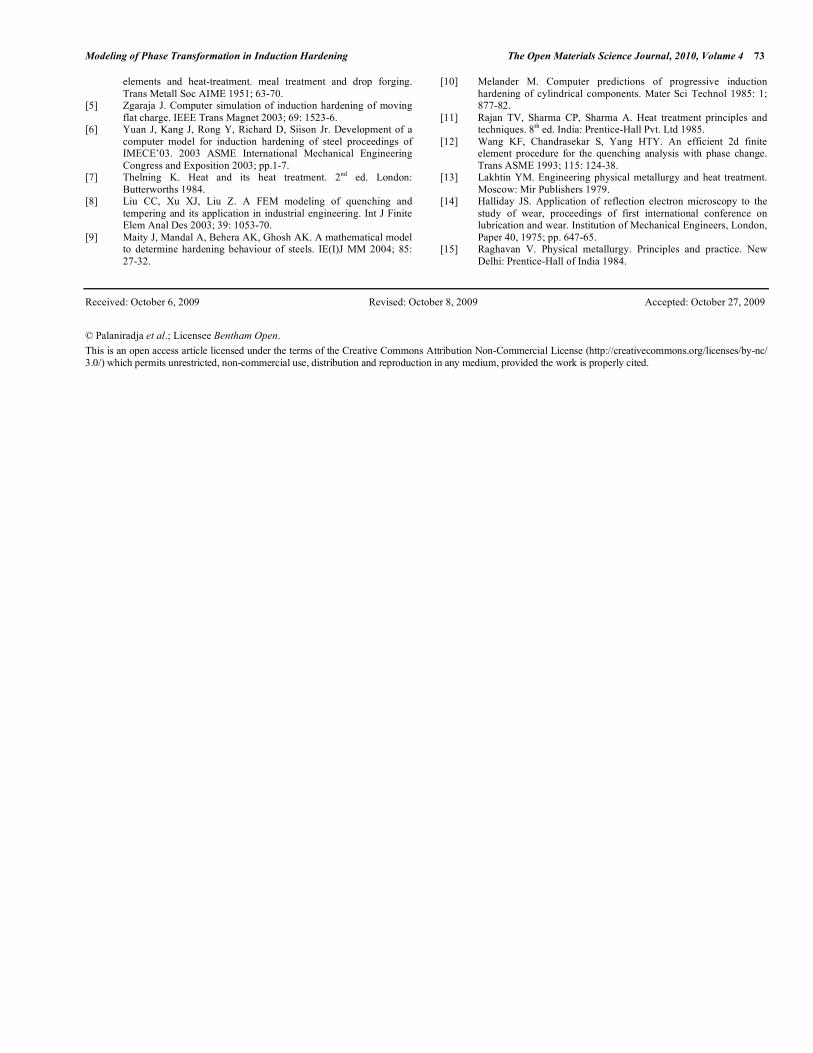
• A Mathematical Model (details are given in the Table 11) to predict volume fraction of martensite and hardness in the induction hardening process has been developed. It is shown that the numerical predictions of the hardened layer are in good agreement with the experimental results.
ACKNOWLEDGEMENTS
The authors are thankful to Rane (Madras) Pvt. Ltd., Thirubhuvanai, Pondicherry and IGCAR Kalpakkam for providing the experimental, testing and measurement facilities.
REFERENCES
[1] Avner SH. Introduction to physical metallurgy. 2nd ed. New Delhi: Tata McGraw Hill Publishing Company Ltd. 1982; pp. 315-45.
[2] Denis S, Gautier E, Simon A, Beck G. Stress-phase-transformations-basic principles, modeling, and calculation of
internal stresses. Mater Sci Technol 1985; 1: 805-14. [3] Colegate GT. The surface hardening of steel, metal treatment and
drop forging. Trans Metall Soc AIME 1951; 249-55. [4] Colegate GT. The surface hardening of steel – Part – II –
mechanism of the carburising process and the effect of alloying
Table 10. Induction Hardening Mathematical Model
S. No. Materials Hardness Equations
(Hardness in HRA) Volume Fraction of Martensite (fm)
01 AISI 1040 YH = 107.2820-4.5995P+0.1873S-0.0889Q
02 AISI 4140 YH = 102.33421- 4.0993P+0.4140S+0.0001Q
03 AISI 4340 YH = 111.5611-4.1474P-2.3059S-0.2889Q
fm = {[(HRC)max – 11.96P + 5.27Q]0.0236S-1
}
(HRC)max = 60
04 AISI 1055 YH = 106.7885-3.8179P-3.8671S+0.1778Q
05 AISI 6150 YH = 108.2939-4.1947P-0.2082S-0.2000Q
06 AISI 9255 YH = 102.9862-4.0.759P+0.6014S+0.0667Q
fm = {[(HRC) max – 13.68P + 6.05Q] 0.022S-1
}
(HRC)max = 65
P-Power Potential in kW/inch2, S-Scan speed in m/min, Q-Quench flow rate in liters/min.
Table 11. Induction Hardening Mathematical Model
S. No. Materials Hardness Equations (Hardness in HRA) Volume Fraction of Martensite (fm)
01 AISI 1040 YH = 108-4.695P+0.4S-0.888Q
02 AISI 4140 YH = 118.68-6.63P+0.32866S-0.0667Q
03 AISI 4340 YH =111.66-4.14P-2.358S-0.2884Q
fm = {[(HRC)max – 11.96P + 5.27Q]0.0236S-1
}
(HRC)max = 60
04 AISI 1055 YH=184.43-3.8175P-46.177S+0.177Q
05 AISI 6150 YH =110.7688-4.167P-0.2776S-0.244Q
06 AISI 9255 YH =102.64-4.221P+0.41666S+0.088Q
fm = {[(HRC) max – 13.68P + 6.05Q] 0.022S-1
}
(HRC)max = 65
where, P-Power Potential in kW/inch2. S-Scan speed in m/min. Q-Quench flow rate in liters/min.
Modeling of Phase Transformation in Induction Hardening The Open Materials Science Journal, 2010, Volume 4 73
elements and heat-treatment. meal treatment and drop forging.
Trans Metall Soc AIME 1951; 63-70. [5] Zgaraja J. Computer simulation of induction hardening of moving
flat charge. IEEE Trans Magnet 2003; 69: 1523-6. [6] Yuan J, Kang J, Rong Y, Richard D, Siison Jr. Development of a
computer model for induction hardening of steel proceedings of IMECE’03. 2003 ASME International Mechanical Engineering
Congress and Exposition 2003; pp.1-7. [7] Thelning K. Heat and its heat treatment. 2nd ed. London:
Butterworths 1984. [8] Liu CC, Xu XJ, Liu Z. A FEM modeling of quenching and
tempering and its application in industrial engineering. Int J Finite Elem Anal Des 2003; 39: 1053-70.
[9] Maity J, Mandal A, Behera AK, Ghosh AK. A mathematical model to determine hardening behaviour of steels. IE(I)J MM 2004; 85:
27-32.
[10] Melander M. Computer predictions of progressive induction
hardening of cylindrical components. Mater Sci Technol 1985: 1; 877-82.
[11] Rajan TV, Sharma CP, Sharma A. Heat treatment principles and techniques. 8th ed. India: Prentice-Hall Pvt. Ltd 1985.
[12] Wang KF, Chandrasekar S, Yang HTY. An efficient 2d finite element procedure for the quenching analysis with phase change.
Trans ASME 1993; 115: 124-38. [13] Lakhtin YM. Engineering physical metallurgy and heat treatment.
Moscow: Mir Publishers 1979. [14] Halliday JS. Application of reflection electron microscopy to the
study of wear, proceedings of first international conference on lubrication and wear. Institution of Mechanical Engineers, London,
Paper 40, 1975; pp. 647-65. [15] Raghavan V. Physical metallurgy. Principles and practice. New
Delhi: Prentice-Hall of India 1984.
Received: October 6, 2009 Revised: October 8, 2009 Accepted: October 27, 2009
© Palaniradja et al.; Licensee Bentham Open.
This is an open access article licensed under the terms of the Creative Commons Attribution Non-Commercial License (http://creativecommons.org/licenses/by-nc/
3.0/) which permits unrestricted, non-commercial use, distribution and reproduction in any medium, provided the work is properly cited.