Modeling of flux decline during crossflow ultrafiltration of colloidal suspensions
22
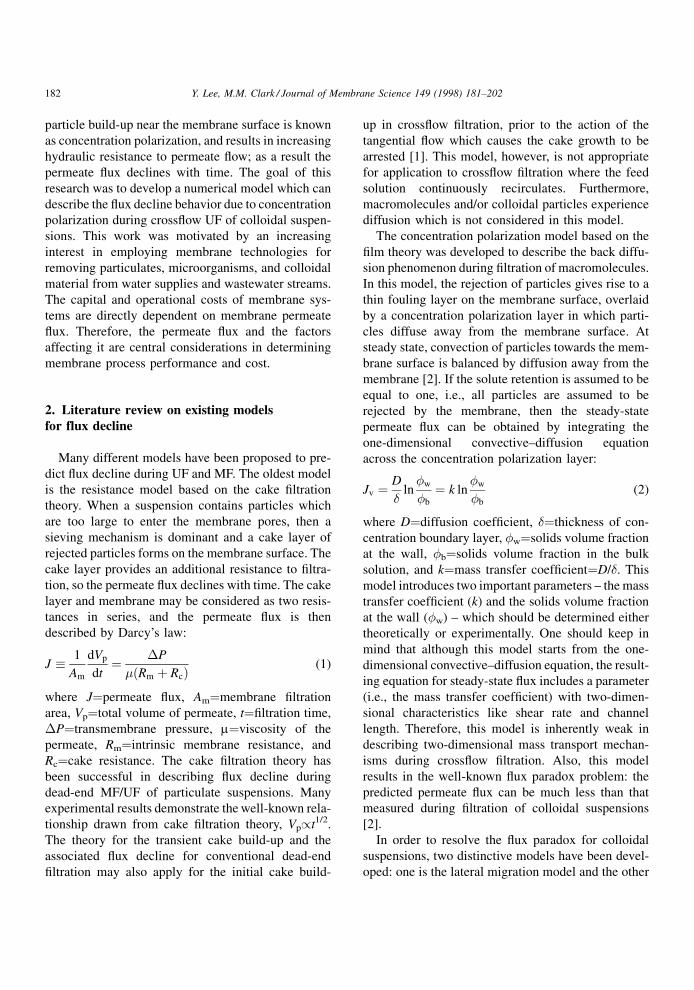
Modeling of flux decline during crossflow ultrafiltration of colloidal suspensions Yonghun Lee, Mark M. Clark * Department of Civil and Environmental Engineering, University of Illinois at Urbana-Champaign, 205 N. Mathews Avenue, Urbana, IL 61801, USA Received 7 January 1998; accepted 1 May 1998 Abstract Mass transfer during crossflow ultrafiltration is mathematically expressed using the two-dimensional convective–diffusion equation. Numerical simulations showed that mass transfer in crossflow filtration quickly reaches a steady-state for constant boundary conditions. Hence, the unsteady nature of the permeate flux decline must be caused by changes in the hydraulic boundary condition at the membrane surface due to cake formation during filtration. A step-wise pseudo steady-state model was developed to predict the flux decline due to concentration polarization during crossflow ultrafiltration. An iterative algorithm was employed to predict the amount of flux decline for each finite time interval until the true steady-state permeate flux is established. For model verification, crossflow filtration of monodisperse polystyrene latex suspensions ranging from 0.064 to 2.16 mm in diameter was studied under constant transmembrane pressure mode. Besides the crossflow filtration tests, dead-end filtration tests were also carried out to independently determine a model parameter, the specific cake resistance. Another model parameter, the effective diffusion coefficient, is defined as the sum of molecular and shear-induced hydrodynamic diffusion coefficients. The step-wise pseudo steady-state model predictions are in good agreement with experimental results of flux decline during crossflow ultrafiltration of colloidal suspensions. Experimental variations in particle size, feed concentration, and crossflow velocity were also effectively modeled. # 1998 Elsevier Science B.V. All rights reserved. Keywords: Ultrafiltration; Concentration polarization; Diffusion; Flux decline; Specific cake resistance 1. Introduction In addition to applications in a large number of industrial processes, membrane technologies have been receiving increasing interest as an alternative or add-on process to conventional drinking water treatment in meeting the current and future demands for high quality drinking water. Ultrafiltration (UF) and microfiltration (MF) have a great potential for removing particulates, microorganisms, and colloidal material from potable water supplies and wastewater streams. A major obstacle to these applications is the permeate flux decline due to concentration polariza- tion and fouling. During ultrafiltration of colloidal suspensions, particles within the feed stream are con- vectively driven to the membrane surface where they accumulate and tend to form a cake or gel layer. This Journal of Membrane Science 149 (1998) 181–202 *Corresponding author. Tel.: +1-217-3333629; fax: +1-217- 3339464; e-mail: [email protected] 0376-7388/98/$ – see front matter # 1998 Elsevier Science B.V. All rights reserved. PII: S0376-7388(98)00177-X
-
Upload
yonghun-lee -
Category
Documents
-
view
213 -
download
0
Transcript of Modeling of flux decline during crossflow ultrafiltration of colloidal suspensions
Modeling of ¯ux decline during cross¯owultra®ltration of colloidal suspensions
Yonghun Lee, Mark M. Clark*
Department of Civil and Environmental Engineering, University of Illinois at Urbana-Champaign, 205 N. Mathews Avenue,
Urbana, IL 61801, USA
Received 7 January 1998; accepted 1 May 1998
Abstract
Mass transfer during cross¯ow ultra®ltration is mathematically expressed using the two-dimensional convective±diffusion
equation. Numerical simulations showed that mass transfer in cross¯ow ®ltration quickly reaches a steady-state for constant
boundary conditions. Hence, the unsteady nature of the permeate ¯ux decline must be caused by changes in the hydraulic
boundary condition at the membrane surface due to cake formation during ®ltration. A step-wise pseudo steady-state model
was developed to predict the ¯ux decline due to concentration polarization during cross¯ow ultra®ltration. An iterative
algorithm was employed to predict the amount of ¯ux decline for each ®nite time interval until the true steady-state permeate
¯ux is established. For model veri®cation, cross¯ow ®ltration of monodisperse polystyrene latex suspensions ranging from
0.064 to 2.16 mm in diameter was studied under constant transmembrane pressure mode. Besides the cross¯ow ®ltration tests,
dead-end ®ltration tests were also carried out to independently determine a model parameter, the speci®c cake resistance.
Another model parameter, the effective diffusion coef®cient, is de®ned as the sum of molecular and shear-induced
hydrodynamic diffusion coef®cients. The step-wise pseudo steady-state model predictions are in good agreement with
experimental results of ¯ux decline during cross¯ow ultra®ltration of colloidal suspensions. Experimental variations in
particle size, feed concentration, and cross¯ow velocity were also effectively modeled. # 1998 Elsevier Science B.V. All
rights reserved.
Keywords: Ultra®ltration; Concentration polarization; Diffusion; Flux decline; Speci®c cake resistance
1. Introduction
In addition to applications in a large number of
industrial processes, membrane technologies have
been receiving increasing interest as an alternative
or add-on process to conventional drinking water
treatment in meeting the current and future demands
for high quality drinking water. Ultra®ltration (UF)
and micro®ltration (MF) have a great potential for
removing particulates, microorganisms, and colloidal
material from potable water supplies and wastewater
streams. A major obstacle to these applications is the
permeate ¯ux decline due to concentration polariza-
tion and fouling. During ultra®ltration of colloidal
suspensions, particles within the feed stream are con-
vectively driven to the membrane surface where they
accumulate and tend to form a cake or gel layer. This
Journal of Membrane Science 149 (1998) 181±202
*Corresponding author. Tel.: +1-217-3333629; fax: +1-217-
3339464; e-mail: [email protected]
0376-7388/98/$ ± see front matter # 1998 Elsevier Science B.V. All rights reserved.
P I I : S 0 3 7 6 - 7 3 8 8 ( 9 8 ) 0 0 1 7 7 - X
particle build-up near the membrane surface is known
as concentration polarization, and results in increasing
hydraulic resistance to permeate ¯ow; as a result the
permeate ¯ux declines with time. The goal of this
research was to develop a numerical model which can
describe the ¯ux decline behavior due to concentration
polarization during cross¯ow UF of colloidal suspen-
sions. This work was motivated by an increasing
interest in employing membrane technologies for
removing particulates, microorganisms, and colloidal
material from water supplies and wastewater streams.
The capital and operational costs of membrane sys-
tems are directly dependent on membrane permeate
¯ux. Therefore, the permeate ¯ux and the factors
affecting it are central considerations in determining
membrane process performance and cost.
2. Literature review on existing modelsfor flux decline
Many different models have been proposed to pre-
dict ¯ux decline during UF and MF. The oldest model
is the resistance model based on the cake ®ltration
theory. When a suspension contains particles which
are too large to enter the membrane pores, then a
sieving mechanism is dominant and a cake layer of
rejected particles forms on the membrane surface. The
cake layer provides an additional resistance to ®ltra-
tion, so the permeate ¯ux declines with time. The cake
layer and membrane may be considered as two resis-
tances in series, and the permeate ¯ux is then
described by Darcy's law:
J � 1
Am
dVp
dt� �P
��Rm � Rc� (1)
where J�permeate ¯ux, Am�membrane ®ltration
area, Vp�total volume of permeate, t�®ltration time,
�P�transmembrane pressure, m�viscosity of the
permeate, Rm�intrinsic membrane resistance, and
Rc�cake resistance. The cake ®ltration theory has
been successful in describing ¯ux decline during
dead-end MF/UF of particulate suspensions. Many
experimental results demonstrate the well-known rela-
tionship drawn from cake ®ltration theory, Vp/t1/2.
The theory for the transient cake build-up and the
associated ¯ux decline for conventional dead-end
®ltration may also apply for the initial cake build-
up in cross¯ow ®ltration, prior to the action of the
tangential ¯ow which causes the cake growth to be
arrested [1]. This model, however, is not appropriate
for application to cross¯ow ®ltration where the feed
solution continuously recirculates. Furthermore,
macromolecules and/or colloidal particles experience
diffusion which is not considered in this model.
The concentration polarization model based on the
®lm theory was developed to describe the back diffu-
sion phenomenon during ®ltration of macromolecules.
In this model, the rejection of particles gives rise to a
thin fouling layer on the membrane surface, overlaid
by a concentration polarization layer in which parti-
cles diffuse away from the membrane surface. At
steady state, convection of particles towards the mem-
brane surface is balanced by diffusion away from the
membrane [2]. If the solute retention is assumed to be
equal to one, i.e., all particles are assumed to be
rejected by the membrane, then the steady-state
permeate ¯ux can be obtained by integrating the
one-dimensional convective±diffusion equation
across the concentration polarization layer:
Jv � D
�ln�w
�b
� k ln�w
�b
(2)
where D�diffusion coef®cient, ��thickness of con-
centration boundary layer, �w�solids volume fraction
at the wall, �b�solids volume fraction in the bulk
solution, and k�mass transfer coef®cient�D/�. This
model introduces two important parameters ± the mass
transfer coef®cient (k) and the solids volume fraction
at the wall (�w) ± which should be determined either
theoretically or experimentally. One should keep in
mind that although this model starts from the one-
dimensional convective±diffusion equation, the result-
ing equation for steady-state ¯ux includes a parameter
(i.e., the mass transfer coef®cient) with two-dimen-
sional characteristics like shear rate and channel
length. Therefore, this model is inherently weak in
describing two-dimensional mass transport mechan-
isms during cross¯ow ®ltration. Also, this model
results in the well-known ¯ux paradox problem: the
predicted permeate ¯ux can be much less than that
measured during ®ltration of colloidal suspensions
[2].
In order to resolve the ¯ux paradox for colloidal
suspensions, two distinctive models have been devel-
oped: one is the lateral migration model and the other
182 Y. Lee, M.M. Clark / Journal of Membrane Science 149 (1998) 181±202

is the shear-induced hydrodynamic diffusion model.
According to the lateral migration model proposed by
Green and Belfort [3], the permeate ¯ux declines until
the permeation velocity equals the lift velocity eval-
uated at the surface of cake layer. However, during
®ltration of colloidal suspensions, diffusion is another
important mass transport mechanism, and this was not
considered in Green and Belfort's model. Zydney and
Colton [4] proposed to modify the concentration
polarization model by replacing the Brownian diffu-
sion coef®cient with the shear-induced hydrodynamic
diffusion coef®cient. Davis et al. [5,6] developed a
more comprehensive model based on the shear-
induced hydrodynamic diffusion phenomenon. They
deliberately incorporated two-dimensional character-
istics of cross¯ow ®ltration into the one-dimensional
convective±diffusion equation by de®ning the shear-
induced hydrodynamic diffusion coef®cient.
As an alternative to back-transport of particles away
from the membrane by mechanisms such as shear-
induced diffusion and inertial lift, it is possible that the
particles are carried to the membrane surface by
permeate ¯ow and then roll or slide along the mem-
brane surface due to the tangential ¯ow. The rejected
particles are assumed to form a ¯owing cake layer.
Convective-¯ow mathematical models describe the
simultaneous deposition of particles into the cake
layer and the ¯ow of this layer toward the ®lter exit
[7,8]. The fully-developed laminar ¯ow equations
were solved for the velocity pro®les in the bulk
suspension and in the cake layer, and the thickness
and the permeate ¯ux at a steady-state cake can be
determined. In general, the cake layer thickness
increases and the permeate ¯ux decreases with
increasing distance from the ®lter entrance. This sur-
face transport model predicts that the steady-state
permeate ¯ux increases with shear rate and particle
radius.
Recently, many attempts have been made to fully
describe two-dimensional mass transport mechanisms
involved in cross¯ow ®ltration. The most popular one
is the continuum approach. The particle movement
during cross¯ow ®ltration is governed by the two-
dimensional convective±diffusion equation. Many dif-
ferent authors have tried to solve the differential
equation numerically in order to obtain the concentra-
tion pro®les inside the membrane channel; most of
these efforts were limited to the steady-state case.
Although the concentration pro®les can explain the
trends in ¯ux decline, they cannot be directly used to
predict the ¯ux decline. Therefore, it is necessary
to develop a comprehensive model which can predict
the ¯ux decline during cross¯ow ®ltration. The
model presented here can be a powerful tool
for choosing optimal module length and channel
height, and for determining the optimal operating
conditions like transmembrane pressure and cross¯ow
velocity.
3. Experimental
3.1. Materials
All suspensions were prepared using ultrapure
water produced from a Milli-Q system (Millipore,
Bedford, MA). The Milli-Q system consists of four
stages of puri®cation: one activated carbon cartridge,
two mixed-bed ion exchange units, and a ®nal 0.22 mm
micro®ltration ®lter. A buffer solution was added to
the Milli-Q water (10 ml of 0.01 M NaHCO3 per liter),
and the ®nal pH was adjusted to 7.0�0.1 using 0.05 N
HCl or 0.02 N NaOH.
Ideal colloidal suspensions were prepared for ¯ux
tests using monodisperse polystyrene (PS) latex
microspheres (Duke Scienti®c). Particles of ®ve dif-
ferent sizes were used for ¯ux tests, and their proper-
ties are listed in Table 1. Each latex particle
suspension is available in 15 ml bottles of 10% solids.
First, 0.1% stock solutions were prepared by diluting
10% solids with the buffered Milli-Q water. Then feed
suspensions were prepared by diluting the stock solu-
tions to the desired concentration.
Table 1
Properties of latex particles
Material Polystyrene particles (PS)
Color White
Diameter (standard deviation, �) 0.064, 0.121, 0.300, 0.966,
2.16 mm (0.0070, 0.0050,
0.0057, 0.0126, 0.054 mm)
% solids (g/100 g) 10%
Specific gravity 1.05
Refractive index 1.59 at 589 nm at 258CAcid content Low sulfate content
Bacteria/Fungus 0 cfu/ml
Y. Lee, M.M. Clark / Journal of Membrane Science 149 (1998) 181±202 183

A hydrophilic UF membrane with 100 KDa mole-
cular weight cut-off (MWCO) was used in this study,
and its properties are summarized in Table 2. The
membrane was purchased as a sheet (36 in. long-
�12 in. wide), and membranes of the required size
were cut for the experiments. All membranes were
conditioned prior to use by presoaking for 4 h in Milli-
Q water. The water was changed every half hour, up to
2 h, after which no additional water exchanges were
made. Additionally, the membrane was ¯ushed with
enough Milli-Q water at 25 psi until a steady initial
clean water ¯ux was established.
3.2. Filtration systems and methods
Two kinds of membrane ®ltration units were used
for this study. One is a dead-end ®ltration unit, and the
other is a cross¯ow ®ltration unit. Both ¯ux tests were
conducted in constant transmembrane pressure mode.
The temperature effects were neglected in calculating
permeate volume and ¯ux. Since all ¯ux tests were
performed in the range of 21�28C, there was less than
0.4% error due to density/viscosity changes.
Dead-end ®ltration tests were performed using an
Amicon model 8200 dead-end ®ltration cell in order to
independently determine the speci®c cake resistance,
which is an important model parameter. All ¯ux tests
were carried out under unstirred conditions unless
otherwise stated. After determining the clean water
¯ux, the cell was ®lled with 200 ml of a prepared latex
suspension, and ®ltration was continued until the total
permeate volume reached 120 ml. The permeate ¯ow
rate was measured using a ¯ow sensor (Model H-
32703-50, Cole-Palmer Instruments, Chicago, IL),
and the readings were continuously logged into a
computer through a LabView data acquisition system
(National Instruments, Austin, TX).
A channel-type cross¯ow UF/MF membrane ®ltra-
tion unit (Model SEPA CF System, Osmonics, Min-
netonka, MN) was used for cross¯ow ®ltration tests.
Instead of the manufacturer's mesh spacer, a special
silicon rubber feed spacer was fabricated to form a
long rectangular channel (3.9 cm wide, 13.8 cm long
and 0.16 cm high). The feed stream supplied by the
pump ¯ows only through this channel, so the effective
membrane surface area is 53.8 cm2 and the cross-
sectional area normal to the ¯ow is 0.62 cm2.
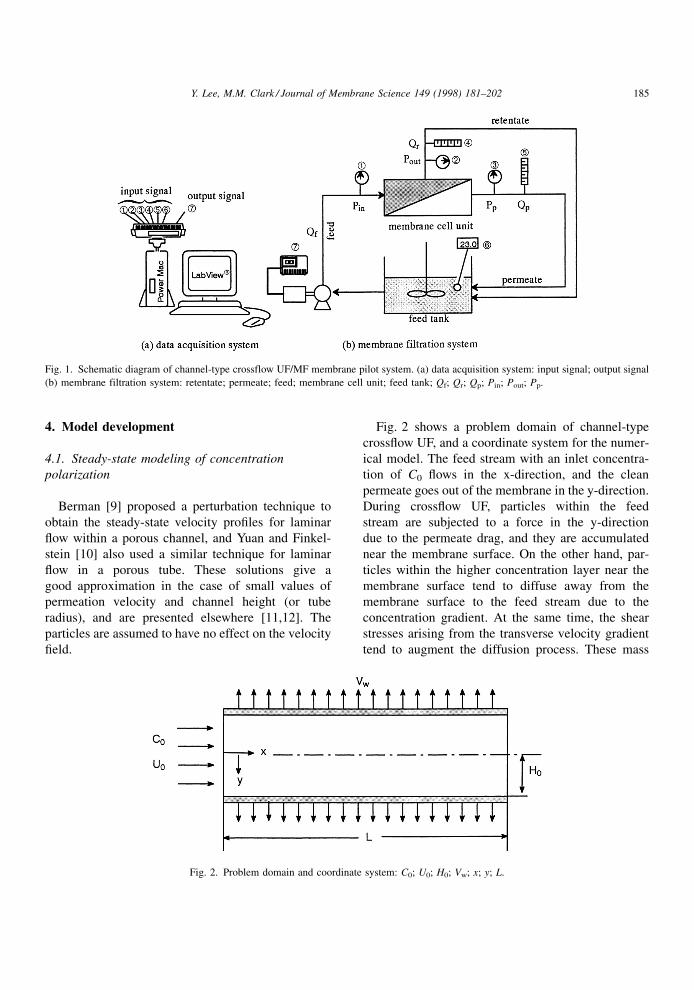
A schematic diagram of the pilot scale cross¯ow
membrane ®ltration system is shown in Fig. 1. A 12 l
glass jar served as a feed tank, and a large magnetic
stirrer was used for mixing the feed tank. A Master¯ex
paristaltic pump (Model H-07017-00, Cole-Palmer
Instruments, Chicago, IL) was used to drive the feed
water to the membrane cell. The pump was driven by
an adjustable speed gearmotor (Model Type
42DSBEPM-E1, Bodine Electric Company, Chicago,
IL) and a permanent magnet control with analog
interface board (Model Type FPM 856, Bodine Elec-
tric, Chicago, IL). Two pulsation dampeners (Model
H-07596-20, Cole-Palmer Instruments, Chicago, IL)
were installed serially close to the pump to reduce the
pulsations created by the peristaltic pump. This pro-
vided almost pulsation-free feed to the channel-type
cross¯ow UF/MF membrane ®ltration unit.
A general-purpose programming system called
LabView was employed to control the system as well
as to continuously log data onto a computer during
®ltration tests. All measurement instruments in the
system generate analog signals, which could be logged
onto a computer. Inlet, outlet, and permeate pressures
were measured by digital pressure transmitters (Model
PG-4/20, PSI-Tronix, Tulare, CA). Permeate and
retentate ¯owrate were measured by 150 mm variable
area ¯owmeters (Model H-03229-31 and H-03229-35,
respectively, Cole-Palmer Instruments, Chicago, IL)
equipped with ¯owmeter electronic conversion mod-
ules (Model H-03298-00, Cole-Palmer Instruments,
Chicago, IL). Temperature was measured by an RTD
probe (Model DD93560-02, Cole-Plamer Instruments,
Chicago, IL), which was inserted into the permeate
tube line. The temperature probe was connected to an
RTD indicator-transmitter (Model H-08099-00, Cole-
Palmer Instruments, Chicago, IL).
Table 2
Properties of membrane used
Membrane ID UF100K
Manufacturer Millipore
Membrane type UF
Nominal pore size 100 K MWCO
Base material Cellulose acetate
Pore structure Anisotropic
Hydrophilicity Hydrophilic
Clean water flux [l/m2/h] 360±600@10 psi, 208CTemperature/pH/pressure limit 1008C/4±11/55 psi
184 Y. Lee, M.M. Clark / Journal of Membrane Science 149 (1998) 181±202
4. Model development
4.1. Steady-state modeling of concentration
polarization
Berman [9] proposed a perturbation technique to
obtain the steady-state velocity pro®les for laminar
¯ow within a porous channel, and Yuan and Finkel-
stein [10] also used a similar technique for laminar
¯ow in a porous tube. These solutions give a
good approximation in the case of small values of
permeation velocity and channel height (or tube
radius), and are presented elsewhere [11,12]. The
particles are assumed to have no effect on the velocity
®eld.
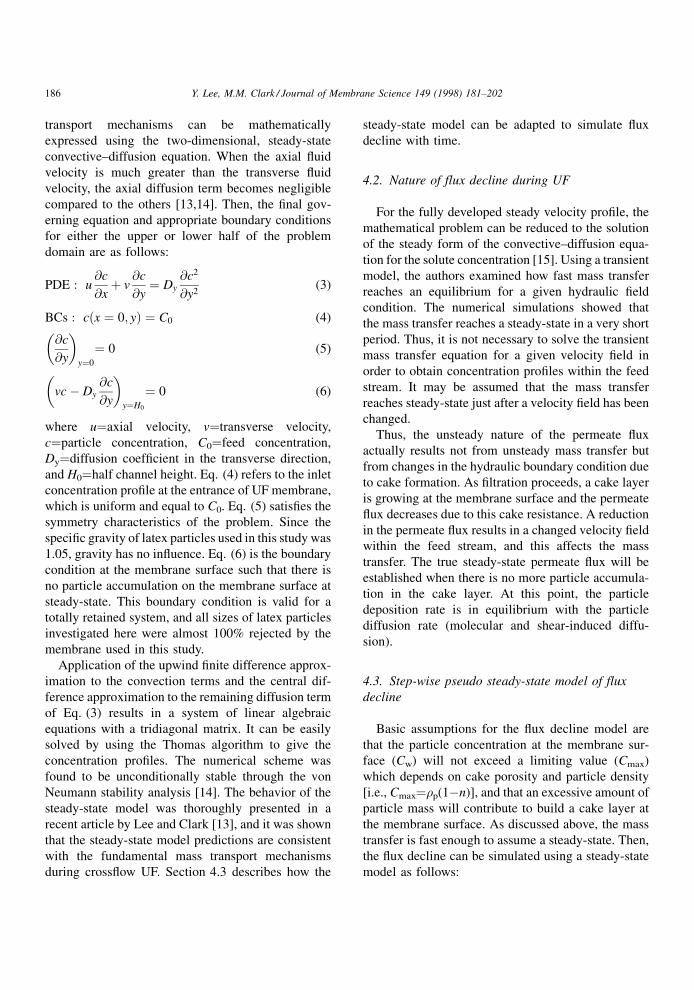
Fig. 2 shows a problem domain of channel-type
cross¯ow UF, and a coordinate system for the numer-
ical model. The feed stream with an inlet concentra-
tion of C0 ¯ows in the x-direction, and the clean
permeate goes out of the membrane in the y-direction.
During cross¯ow UF, particles within the feed
stream are subjected to a force in the y-direction
due to the permeate drag, and they are accumulated
near the membrane surface. On the other hand, par-
ticles within the higher concentration layer near the
membrane surface tend to diffuse away from the
membrane surface to the feed stream due to the
concentration gradient. At the same time, the shear
stresses arising from the transverse velocity gradient
tend to augment the diffusion process. These mass
Fig. 1. Schematic diagram of channel-type crossflow UF/MF membrane pilot system. (a) data acquisition system: input signal; output signal
(b) membrane filtration system: retentate; permeate; feed; membrane cell unit; feed tank; Qf; Qr; Qp; Pin; Pout; Pp.
Fig. 2. Problem domain and coordinate system: C0; U0; H0; Vw; x; y; L.
Y. Lee, M.M. Clark / Journal of Membrane Science 149 (1998) 181±202 185
transport mechanisms can be mathematically
expressed using the two-dimensional, steady-state
convective±diffusion equation. When the axial ¯uid
velocity is much greater than the transverse ¯uid
velocity, the axial diffusion term becomes negligible
compared to the others [13,14]. Then, the ®nal gov-
erning equation and appropriate boundary conditions
for either the upper or lower half of the problem
domain are as follows:
PDE : u@c
@x� v
@c
@y� Dy
@c2
@y2(3)
BCs : c�x � 0; y� � C0 (4)
@c
@y
� �y�0
� 0 (5)
vcÿ Dy
@c
@y
� �y�H0
� 0 (6)
where u�axial velocity, v�transverse velocity,
c�particle concentration, C0�feed concentration,
Dy�diffusion coef®cient in the transverse direction,
and H0�half channel height. Eq. (4) refers to the inlet
concentration pro®le at the entrance of UF membrane,
which is uniform and equal to C0. Eq. (5) satis®es the
symmetry characteristics of the problem. Since the
speci®c gravity of latex particles used in this study was
1.05, gravity has no in¯uence. Eq. (6) is the boundary
condition at the membrane surface such that there is
no particle accumulation on the membrane surface at
steady-state. This boundary condition is valid for a
totally retained system, and all sizes of latex particles
investigated here were almost 100% rejected by the
membrane used in this study.
Application of the upwind ®nite difference approx-
imation to the convection terms and the central dif-
ference approximation to the remaining diffusion term
of Eq. (3) results in a system of linear algebraic
equations with a tridiagonal matrix. It can be easily
solved by using the Thomas algorithm to give the
concentration pro®les. The numerical scheme was
found to be unconditionally stable through the von
Neumann stability analysis [14]. The behavior of the
steady-state model was thoroughly presented in a
recent article by Lee and Clark [13], and it was shown
that the steady-state model predictions are consistent
with the fundamental mass transport mechanisms
during cross¯ow UF. Section 4.3 describes how the
steady-state model can be adapted to simulate ¯ux
decline with time.
4.2. Nature of flux decline during UF
For the fully developed steady velocity pro®le, the
mathematical problem can be reduced to the solution
of the steady form of the convective±diffusion equa-
tion for the solute concentration [15]. Using a transient
model, the authors examined how fast mass transfer
reaches an equilibrium for a given hydraulic ®eld
condition. The numerical simulations showed that
the mass transfer reaches a steady-state in a very short
period. Thus, it is not necessary to solve the transient
mass transfer equation for a given velocity ®eld in
order to obtain concentration pro®les within the feed
stream. It may be assumed that the mass transfer
reaches steady-state just after a velocity ®eld has been
changed.
Thus, the unsteady nature of the permeate ¯ux
actually results not from unsteady mass transfer but
from changes in the hydraulic boundary condition due
to cake formation. As ®ltration proceeds, a cake layer
is growing at the membrane surface and the permeate
¯ux decreases due to this cake resistance. A reduction
in the permeate ¯ux results in a changed velocity ®eld
within the feed stream, and this affects the mass
transfer. The true steady-state permeate ¯ux will be
established when there is no more particle accumula-
tion in the cake layer. At this point, the particle
deposition rate is in equilibrium with the particle
diffusion rate (molecular and shear-induced diffu-
sion).
4.3. Step-wise pseudo steady-state model of flux
decline
Basic assumptions for the ¯ux decline model are
that the particle concentration at the membrane sur-
face (Cw) will not exceed a limiting value (Cmax)
which depends on cake porosity and particle density
[i.e., Cmax��p(1ÿn)], and that an excessive amount of
particle mass will contribute to build a cake layer at
the membrane surface. As discussed above, the mass
transfer is fast enough to assume a steady-state. Then,
the ¯ux decline can be simulated using a steady-state
model as follows:
186 Y. Lee, M.M. Clark / Journal of Membrane Science 149 (1998) 181±202

First, obtain concentration profiles by solving the
steady-state model using the velocity field at the
previous time step. For example, at time zero the
initial velocity field is determined using the initial
clean water flux and inlet axial velocity.
Second, determine whether flux decline occurs at
that time period based on the above assumption. At
any axial location where the simulated concentra-
tion at the membrane surface is greater than Cmax,
a cake layer will grow and the local permeate flux
will decrease. The cake growth at that axial
location can be calculated from a mass balance
between mass convection rate and mass accumula-
tion rate at the membrane surface, and the
permeate flux decline can be determined using
the resistance model. Therefore, the local permeate
flux changes at each axial location are known.
Next, determine a new velocity field with the
above flux boundary condition, and simulate
concentration profiles again using the steady-state
model.
Then, repeat the 2nd and 3rd steps untill Cw�Cmax
at every axial location.
The main idea of this approach is based on calcula-
tion of the step-wise pseudo steady-state, i.e., for a
given hydraulic condition, the mass transfer within a
membrane channel/tube reaches an equilibrium
(steady-state) very fast, but this steady state is mod-
i®ed by the transient characteristics of the ¯ux bound-
ary condition (¯ux reduction due to cake formation).
In other words, the mass transfer time scale is much
smaller than that for cake formation. The true steady
state can be maintained when there is no more change
in the ¯ux boundary condition. The algorithm for this
iteration is shown in Fig. 3.
4.4. Sensitivity analysis for the step-wise pseudo
steady-state model
Numerical experiments were performed in order to
show the behavior of the step-wise pseudo steady-state
model. The parameters like operating conditions,
Cmax, and rc were arbitrarily chosen to emphasize
or amplify the effect of a speci®c parameter on the
¯ux decline. All the parameter values for these simu-
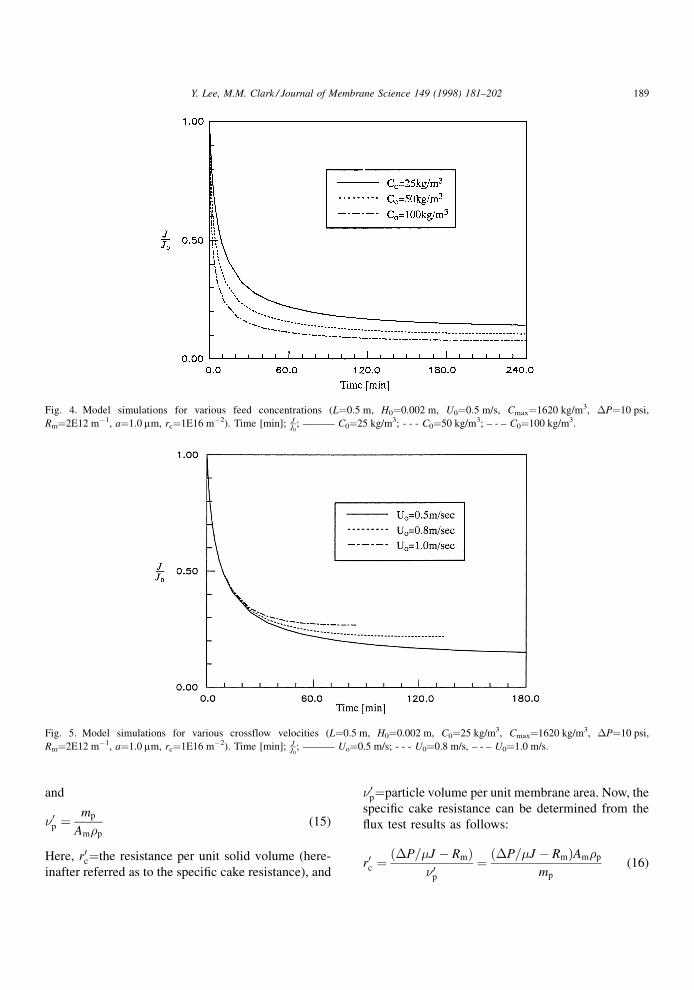
lations were within reasonable ranges. Figs. 4 and 5
show the model behavior in response to various feed
concentrations and cross¯ow velocities. As expected,
the model simulations show that the permeate ¯ux
becomes smaller as the feed concentration increases.
Fig. 5 shows the effect of cross¯ow velocity on ¯ux
decline behavior. Model simulations show that a
higher cross¯ow velocity results in a higher permeate
¯ux. Note that less time is required to reach steady-
state as the cross¯ow velocity increases.
Fig. 6(a) shows that effect of cake thickness on the
permeate ¯ux decline with and without a correction of
the velocity ®eld for the channel constriction. As
®ltration proceeds, the cake thickness tends to grow
so the effective channel height for feed stream
decreases. This would result in increasing shear rate
at the membrane surface, so it is expected that the ¯ux
prediction will be more accurate if the more realistic
channel height is used. The model simulations in
Fig. 6(a) show the effect of channel height on ¯ux
decline. Fig. 6(b) shows the cake thickness along the
x-axis at steady-state.
5. Results and discussion
5.1. Determination of specific cake resistance from
dead-end filtration
The speci®c cake resistance is an important para-
meter affecting the ¯ux decline rate [see Fig. 8(a)].
Dead-end ®ltration tests were performed to indepen-
dently determine the speci®c cake resistance. Accord-
ing to the resistance model, the permeate ¯ux is
J � �P
��Rm � Rc� (7)
where �P�transmembrane pressure, ��permeate
viscosity, Rm�intrinsic membrane resistance, and
Rc�cake resistance. The values of �P and Rm remain
constant during ®ltration. The ¯ux declines because
the value of Rc increases due to cake formation on the
membrane surface. The speci®c cake resistance is
de®ned as the resistance per unit thickness of cake
layer,
Rc �Z �c
0
rcd� (8)
where rc �speci®c cake resistance and �c�cake layer
thickness. If the cake layer is assumed to be
Y. Lee, M.M. Clark / Journal of Membrane Science 149 (1998) 181±202 187

homogeneous, the above equation becomes
Rc � rc�c (9)
and
J � �P
��Rm � rc�c� (10)
In order to determine the speci®c cake resistance
from the ¯ux test results, the cake thickness should be
known. However, it is hard to physically measure the
cake thickness without disturbing the cake layer. For a
homogeneous cake, the cake thickness is
�c � volume of cake
area of membrane� mp
�p�1ÿ n�Am
(11)
where mp�total dried mass of cake, �p�density of
particles, n�porosity of cake layer, and Am� mem-
brane ®ltration area. Substituting Eq. (11) into
Eq. (9), and combining with the Carmen±Kozeny
equation,
Rc � 180�1ÿ n�2
d2pn3
mp
�1ÿ n�Am�p
� 180�1ÿ n�
d2pn3
mp
Am�p
(12)
Then, Eq. (10) becomes
J � �P
��Rm � r0c�0p�(13)
where
r0c � 180�1ÿ n�
d2pn3
(14)
Fig. 3. Algorithm for step-by-step pseudo steady-state model.
188 Y. Lee, M.M. Clark / Journal of Membrane Science 149 (1998) 181±202
and
�0p �mp
Am�p
(15)
Here, r0c�the resistance per unit solid volume (here-
inafter referred as to the speci®c cake resistance), and
�0p�particle volume per unit membrane area. Now, the
speci®c cake resistance can be determined from the
¯ux test results as follows:
r0c ���P=�J ÿ Rm�
�0p� ��P=�J ÿ Rm�Am�p
mp
(16)
Fig. 4. Model simulations for various feed concentrations (L�0.5 m, H0�0.002 m, U0�0.5 m/s, Cmax�1620 kg/m3, �P�10 psi,
Rm�2E12 mÿ1, a�1.0 mm, rc�1E16 mÿ2). Time [min]; JJ0
; ÐÐÐ C0�25 kg/m3; - - - C0�50 kg/m3; ± - ± C0�100 kg/m3.
Fig. 5. Model simulations for various crossflow velocities (L�0.5 m, H0�0.002 m, C0�25 kg/m3, Cmax�1620 kg/m3, �P�10 psi,
Rm�2E12 mÿ1, a�1.0 mm, rc�1E16 mÿ2). Time [min]; JJ0
; ÐÐÐ Uo�0.5 m/s; - - - U0�0.8 m/s, ± - ± U0�1.0 m/s.
Y. Lee, M.M. Clark / Journal of Membrane Science 149 (1998) 181±202 189

There was no irreversible fouling during ®l-
tration tests with latex suspensions. The initial
clean water ¯ux was always fully recovered after
back¯ushing. The total particle mass of the cake
layer formed during ®ltration can be determined as
follows:
Fig. 6. Model simulations for effective channel height changes (L�0.5 m, H0�0.002 m, U0�0.5 m/s, C0�1 kg/m3, Cmax�600 kg/m3,
�P�10 psi, Rm�5E11 mÿ1, a�4.0 mm). (a) Flux decline versus time: Time [min]; JJ0
; ÐÐÐ rc�1E15 mÿ2 (with correction for channel
restriction); ~ rc�1E15 mÿ2 (without correction for channel restriction); ± ± ± rc�2E15 mÿ2 (without correction for channel restriction); *rc�2E15 mÿ2 (without correction for channel restriction); (b) Cake thickness along x-axis: x[m]; �c
H0Ð Ð Ð rc�5E15 mÿ2; ± ± ±
rc�1E16 mÿ2.
190 Y. Lee, M.M. Clark / Journal of Membrane Science 149 (1998) 181±202
mp � C0V0 ÿ CrVr ÿ CpVp (17)
where C0, Cr, and Cp are concentration of feed,
retentate, and permeate, respectively, and V0, Vr,
and Vp are volume of feed, retentate, and permeate,
respectively. The permeate concentration is nearly
zero because the membrane pore sizes are small
enough to retain all latex particles. The concentrations
were indirectly measured using a turbidimeter (Model
43900, Hach, Ames, IA). There was a linear relation-
ship between concentration of latex suspensions and
turbidity. After ®ltration, the turbidity of the retentate
was measured, and it turned out to be almost identical
to the initial feed concentration. Therefore, the total
particle mass in the cake becomes
mp � C0�V0 ÿ Vr� � C0Vp (18)
where Vp�120 ml for all ¯ux tests.
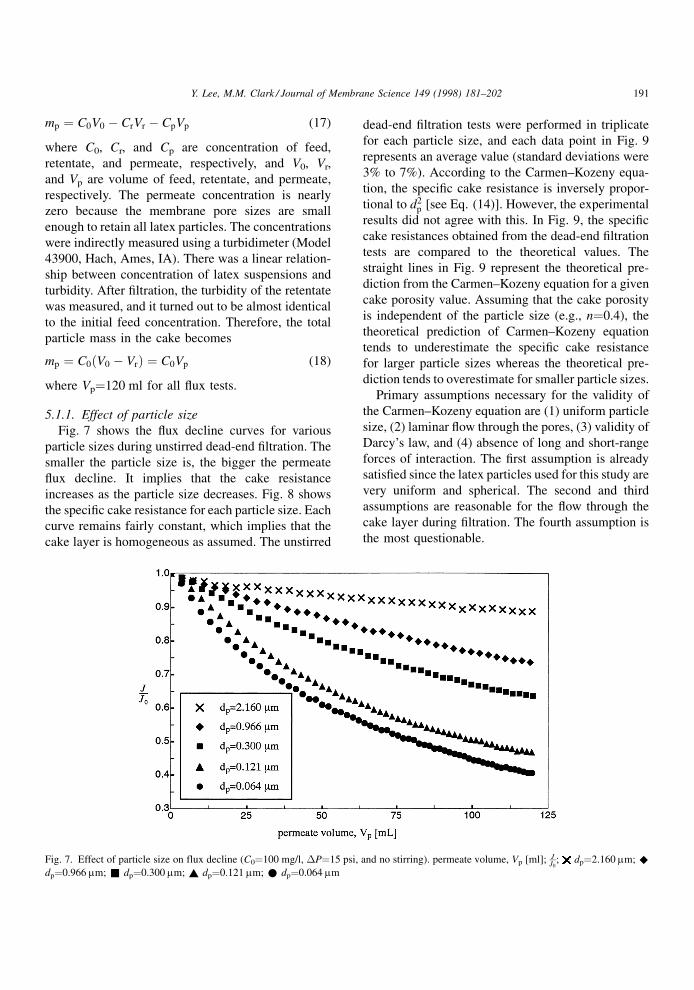
5.1.1. Effect of particle size
Fig. 7 shows the ¯ux decline curves for various
particle sizes during unstirred dead-end ®ltration. The
smaller the particle size is, the bigger the permeate
¯ux decline. It implies that the cake resistance
increases as the particle size decreases. Fig. 8 shows
the speci®c cake resistance for each particle size. Each
curve remains fairly constant, which implies that the
cake layer is homogeneous as assumed. The unstirred
dead-end ®ltration tests were performed in triplicate
for each particle size, and each data point in Fig. 9
represents an average value (standard deviations were
3% to 7%). According to the Carmen±Kozeny equa-
tion, the speci®c cake resistance is inversely propor-
tional to d2p [see Eq. (14)]. However, the experimental
results did not agree with this. In Fig. 9, the speci®c
cake resistances obtained from the dead-end ®ltration
tests are compared to the theoretical values. The
straight lines in Fig. 9 represent the theoretical pre-
diction from the Carmen±Kozeny equation for a given
cake porosity value. Assuming that the cake porosity
is independent of the particle size (e.g., n�0.4), the
theoretical prediction of Carmen±Kozeny equation
tends to underestimate the speci®c cake resistance
for larger particle sizes whereas the theoretical pre-
diction tends to overestimate for smaller particle sizes.
Primary assumptions necessary for the validity of
the Carmen±Kozeny equation are (1) uniform particle
size, (2) laminar ¯ow through the pores, (3) validity of
Darcy's law, and (4) absence of long and short-range
forces of interaction. The ®rst assumption is already
satis®ed since the latex particles used for this study are
very uniform and spherical. The second and third
assumptions are reasonable for the ¯ow through the
cake layer during ®ltration. The fourth assumption is
the most questionable.
Fig. 7. Effect of particle size on flux decline (C0�100 mg/l, �P�15 psi, and no stirring). permeate volume, Vp [ml]; JJ0
; dp�2.160 mm; ^dp�0.966 mm; & dp�0.300 mm; ~ dp�0.121 mm; * dp�0.064 mm
Y. Lee, M.M. Clark / Journal of Membrane Science 149 (1998) 181±202 191

It is not yet clear how the particle±water and
particle±particle interaction forces affect the ¯ow
through the cake layer and membrane pores. However,
it is likely that the presence of these interaction forces
in¯uences the permeate migration through the pores.
The presence of these forces creates immobilized
Fig. 8. Effect of particle size on specific cake resistance (C0�100 mg/l, �P�15 psi, and no stirring). permeate volume, Vp [ml]; r0c (1E16) [1/
m2]; dp�2.160 mm; ^ dp�0.966 mm; & dp�0.300 mm; ~ dp�0.121 mm; * dp�0.064 mm.
Fig. 9. Comparison of experimental results with Carmen±Kozeny equation particle size. 1d2
p[1/mm2]; r0 (1E16) [1/m2]; ÐÐÐ r0c from
Carmen±Kozeny equation, * r0c from experimental results.
192 Y. Lee, M.M. Clark / Journal of Membrane Science 149 (1998) 181±202
hydrodynamic layers surrounding each particle (dou-
ble layer or diffuse ion layer). The thickness of these
immobilized hydrodynamic layers is dependent on the
interaction characteristics. For example, increasing
the ionic strength results in compressing these layers,
and correspondingly affects the ¯ow rate for the same
porosity [16]. Faibish et al. [17] studied the effect of
double layer interaction on ¯ux decline during cross-
¯ow ultra®ltration of colloidal silica suspensions, and
they found that ¯ux decline is faster for higher ionic
strength conditions because the Debye screening
length decreases with increasing ionic strength result-
ing in a denser cake layer. Harment and Aimar [18]
have included effects of permeation drag and short-
and long-range colloidal forces on the cake structure
during unstirred dead-end UF of 0.22 mm latex parti-
cles. They showed that for suf®ciently high ¯ux, ionic
strength, and cake mass, the cake layer could be
inhomogeneous, and become dense and less reversible
near the membrane surface. The cake porosity
depends on separation distance between adjacent par-
ticles in the cake layer as well as particle size.
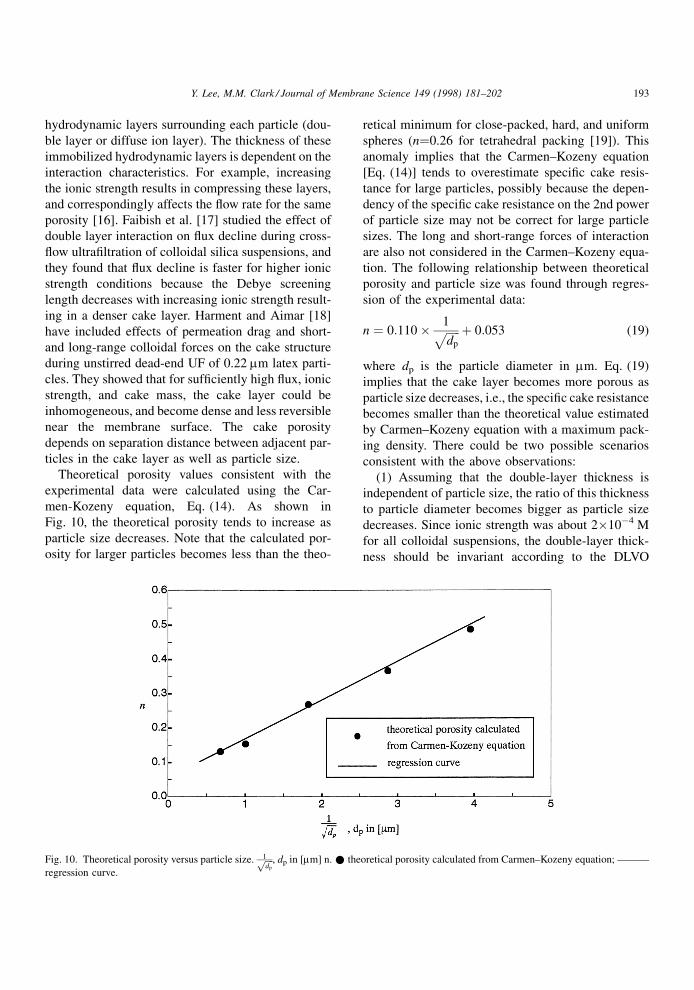
Theoretical porosity values consistent with the
experimental data were calculated using the Car-
men-Kozeny equation, Eq. (14). As shown in
Fig. 10, the theoretical porosity tends to increase as
particle size decreases. Note that the calculated por-
osity for larger particles becomes less than the theo-
retical minimum for close-packed, hard, and uniform
spheres (n�0.26 for tetrahedral packing [19]). This
anomaly implies that the Carmen±Kozeny equation
[Eq. (14)] tends to overestimate speci®c cake resis-
tance for large particles, possibly because the depen-
dency of the speci®c cake resistance on the 2nd power
of particle size may not be correct for large particle
sizes. The long and short-range forces of interaction
are also not considered in the Carmen±Kozeny equa-
tion. The following relationship between theoretical
porosity and particle size was found through regres-
sion of the experimental data:
n � 0:110� 1�����dp
p � 0:053 (19)
where dp is the particle diameter in mm. Eq. (19)
implies that the cake layer becomes more porous as
particle size decreases, i.e., the speci®c cake resistance
becomes smaller than the theoretical value estimated
by Carmen±Kozeny equation with a maximum pack-
ing density. There could be two possible scenarios
consistent with the above observations:
(1) Assuming that the double-layer thickness is
independent of particle size, the ratio of this thickness
to particle diameter becomes bigger as particle size
decreases. Since ionic strength was about 2�10ÿ4 M
for all colloidal suspensions, the double-layer thick-
ness should be invariant according to the DLVO
Fig. 10. Theoretical porosity versus particle size. 1����dp
p , dp in [mm] n. * theoretical porosity calculated from Carmen±Kozeny equation; ÐÐÐ
regression curve.
Y. Lee, M.M. Clark / Journal of Membrane Science 149 (1998) 181±202 193

theory, about 30 nm. Therefore, the in¯uence of this
layer becomes more signi®cant as particle size
decreases. At the same time, the volume occupied
by this layer becomes bigger because of larger surface
area as particle size decreases. As a result, the porosity
increases as particle size decreases.
(2) The maximum repulsion for two approaching
colloids, which is a measure of resistance to aggrega-
tion, decreases as particle size decreases [20]. So,
small colloids are more likely to aggregate with each
other than large colloids. If small colloids or primary
particles aggregate into doublets, triplets, and larger
aggregates, it is possible these aggregates can effec-
tively behave as larger primary particles. Thus, a cake
formed of aggregates of small particles could be more
like a cake formed by larger primary particles. Similar
concepts were used by Clark and Flora [21] in a study
of ¯oc restructuring. Therefore, the measured speci®c
cake resistance tends to be smaller than the theoretical
value as particle size decreases because the aggrega-
tion of primary particles results in an increased effec-
tive particle size [see Eq. (14)].
5.1.2. Effect of feed concentration
The effect of feed concentration was investigated
with latex suspensions of dp�0.121 and 0.966 mm at
15psi in the unstirred dead-end ®ltration mode.
Fig. 11 shows the effect of feed concentration on ¯ux
decline. As expected, the higher the feed concentra-
tion, the more the permeate ¯ux declines. The total
particle mass in the cake layer is directly proportional
to the permeate volume passing through the mem-
brane, and the cake thickness is proportional to the
total particle mass of the cake layer [see Eq. (11)]. So,
it is obvious that the cake resistance increases with the
feed concentration.
As shown in Fig. 12, the cake resistance increases
linearly with the feed concentration, while the speci®c
cake resistance remains constant regardless of feed
concentrations. This supports the idea that the feed
concentration only in¯uences the total particle mass of
the cake layer and the cake layer thickness (i.e., a
higher feed concentration only results in a thicker cake
layer). However, the feed concentration does not affect
the speci®c cake resistance. In conclusion, the feed
concentration would not in¯uence the properties of the
cake layer formed during unstirred dead-end ®ltration
of latex suspensions.
5.1.3. Effect of transmembrane pressure
The permeate ¯ux would be expected to increase
with the transmembrane pressure. However, there is a
negative effect of a higher transmembrane pressure:
the cake layer may become more compact as the
transmembrane pressure increases, leading to a greater
¯ux reduction.
Fig. 13 shows the variations in speci®c cake resis-
tance with permeate volume for various transmem-
brane pressures obtained from the unstirred dead-end
®ltration tests. For a given transmembrane pressure,
the speci®c cake resistance values stay fairly constant
during ®ltration. It suggests that the cake layer is
homogeneous during ®ltration, as assumed. However,
the speci®c cake resistance increases with transmem-
brane pressure. As shown in Fig. 14, both the cake
resistance and speci®c cake resistance are linearly
proportional to the transmembrane pressure.
The theoretical porosity values which agree with the
speci®c cake resistance values were calculated for
different transmembrane pressures using Eqs. (14)
and (16). The porosity tends to decrease with increas-
ing transmembrane pressure. It indicates that a higher
transmembrane pressure results in a denser and more
compact cake layer. The cake porosity can be
expressed as follows:
n � n�p�10 � 10
�P
� ��(20)
where� is the compressibility factor, which was found
to be 0.17 from regression analysis.
5.1.4. Effect of stirring
The effect of stirring was investigated with two
monodisperse latex suspensions of different particle
size. The experimental results are shown in Figs. 15
and 16. Regardless of particle size, there was no
evidence of the in¯uence of stirring on the ¯ux
decline, cake resistance, and speci®c cake resistance
during ®ltration.
For polydisperse colloidal suspensions, it has been
found that stirring or increasing the cross¯ow velocity
can result in a lowering of the permeate ¯ux [22±25].
Electron microscopy has shown that stirred conditions
result in a more ®nely dispersed cake than unstirred
conditions [22]. Under stirred conditions, the propor-
tion of small particles in the cake layer could be
194 Y. Lee, M.M. Clark / Journal of Membrane Science 149 (1998) 181±202

increased due to preferential removal of larger parti-
cles by shear-induced hydrodynamic diffusion, and it
is more likely that small particles will ®ll the pores
between larger particles remaining in the cake. As a
result, stirring may produce a higher speci®c resis-
tance. However, for the monodisperse colloidal sus-
pensions studied here, this negative in¯uence of
stirring was not observed.
Fig. 11. Effect of feed concentration on flux decline (�P�15 psi and no stirring). (a) dp�0.121 mm permeate volume, Vp [ml] JJ0
*C0�50 mg/l; ~ C0�100 mg/l; & C0�150 mg/l; (b) dp�0.966 mm permeate volume, Vp [ml] J
J0; * C0�50 mg/l; ~ C0�100 mg/l; &
C0�150 mg/l.
Y. Lee, M.M. Clark / Journal of Membrane Science 149 (1998) 181±202 195

5.2. Comparison of crossflow filtration test results
with model simulations
It is necessary to determine two parameters for
cross¯ow model simulations; one is the speci®c cake
resistance and the other is the diffusion coef®cient.
The speci®c cake resistance was independently mea-
sured in the dead-end ®ltration tests. The diffusion
coef®cient is another parameter affecting ¯ux decline
behavior, so it is important to determine which diffu-
sion coef®cient is appropriate. As the particle size
decreases, the molecular diffusion coef®cient (Dm)
increases, whereas the shear-induced diffusion coef®-
cient (Ds) decreases. The sum of those two diffusion
Fig. 12. Effect of feed concentration on cake properties at Vp�120 ml (�P�15 psi and no stirring). (a) dp�0.121 mm; C0�50 mg/l;
C0�100 mg/l; C0�150 mg/l; Rc (1E16) [1/m2]; r0c (1E16) [1/m2]; (b) dp�0.966 mm; C0�50 mg/l, C0�100 mg/l; C0�150 mg/l; Rc (1E11) [1/
m]; r0c (1E16) [1/m2].
196 Y. Lee, M.M. Clark / Journal of Membrane Science 149 (1998) 181±202

coef®cients was used as an effective diffusion coef®-
cient (Deff) for the numerical simulations [13,26],
Dy � Deff � Dm � Ds � �T
6��a� 0:03a2 (21)
where ��Boltzman constant, T�absolute tempera-
ture, ��dynamic viscosity, a�particle radius, and
�shear rate.
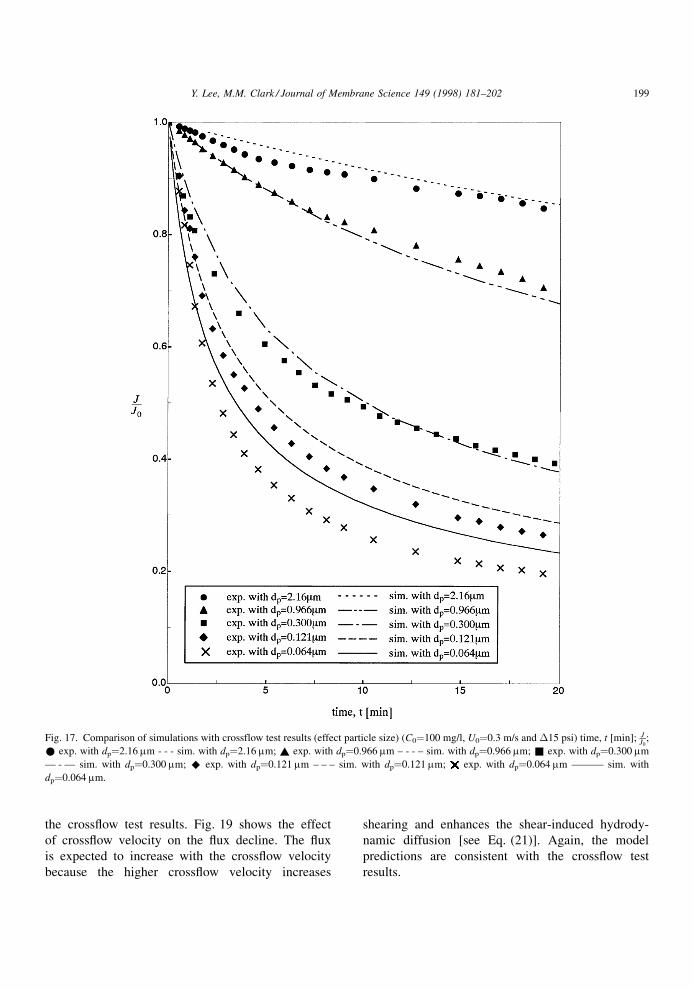
The cross¯ow ®ltration results for various particle
sizes are compared with the model simulations in
Fig. 17. Although the model tends to predict a
slightly higher ¯ux than the experimental results,
Fig. 13. Effect of transmembrane pressure on specific cake resistance (dp�0.300 mm, C0�150 mg/l, and no stirring). permeate volume, Vp
[mL]; r0c (1E16) [1/m2]; * �P�10 psi; ~ �P�15 psi; & �P�20 psi.
Fig. 14. Effect of transmembrane pressure on cake properties at Vp�120 ml (dp�0.300 mm, C0�150 mg/l, and no stirring). �P�10 psi,
�P�15 psi, �P�20 psi; Rc (1E11) [1/m]; r'c (1E16) [1/m2].
Y. Lee, M.M. Clark / Journal of Membrane Science 149 (1998) 181±202 197

the model predictions are quite consistent with
the experimental results. Fig. 18 shows the effect of
feed concentration during cross¯ow ®ltration. As
expected, the higher the feed concentration, the
greater the ¯ux decline. The model predictions
for different feed concentrations agree well with
Fig. 15. Effect of stirring on flux decline (C0�300 mg/l and �P�10 psi). permeate volume, Vp [ml]; JJ0
; dp�0.300 mm; dp�0.966 mm; ÐÐÐ
without stirring; - - - with stirring.
Fig. 16. Effect of stirring on cake properties at Vp�120 ml (C0�300 mg/l and �P�10 psi) (a) dp�0.300 mm: without stir; with stir (b)
dp�0.966 mm: without stir; with stir; Rc (1E11) [1/m]; r'c (1E16) [1/m2].
198 Y. Lee, M.M. Clark / Journal of Membrane Science 149 (1998) 181±202
the cross¯ow test results. Fig. 19 shows the effect
of cross¯ow velocity on the ¯ux decline. The ¯ux
is expected to increase with the cross¯ow velocity
because the higher cross¯ow velocity increases
shearing and enhances the shear-induced hydrody-
namic diffusion [see Eq. (21)]. Again, the model
predictions are consistent with the cross¯ow test
results.
Fig. 17. Comparison of simulations with crossflow test results (effect particle size) (C0�100 mg/l, U0�0.3 m/s and �15 psi) time, t [min]; JJ0
;
* exp. with dp�2.16 mm - - - sim. with dp�2.16 mm; ~ exp. with dp�0.966 mm ± - - ± sim. with dp�0.966 mm; & exp. with dp�0.300 mm
Ð - Ð sim. with dp�0.300 mm; ^ exp. with dp�0.121 mm ± ± ± sim. with dp�0.121 mm; exp. with dp�0.064 mm ÐÐÐ sim. with
dp�0.064 mm.
Y. Lee, M.M. Clark / Journal of Membrane Science 149 (1998) 181±202 199

Fig. 18. Comparison of simulations with crossflow test results (effect of feed concentration) (dp�0.300 mm, U0�0.3 m/s and �P�15 psi).
time, t [min]; JJ0
; ~ exp. with C0�50 mg/l; * exp. with C0�100 mg/l; & exp. with C0�200 mg/l; ± ± ± sim. with C0�50 mg/l; Ð - Ð sim.
with C0�100 mg/l; ÐÐÐ sim. with C0�200 mg/l.
Fig. 19. Comparison of simulations with crossflow test results (effect of crossflow velocity) (dp�0.300 mm, C0�100 mg/l and �P�15 psi);
time, t [min]; JJ0
; ~ exp. with U0�0.1 m/s; * exp. with U0�0.3 m/s; & exp. with U0�0.5 m/s; ± ± ± sim. with U0�0.1 m/s; Ð - Ð sim. with
U0�0.3 m/s; ÐÐÐ sim. with U0�0.5 m/s.
200 Y. Lee, M.M. Clark / Journal of Membrane Science 149 (1998) 181±202

6. Conclusions
From the study of dead-end ®ltration of monodis-
perse colloidal suspensions, the following conclusions
can be drawn:
1. As particle size decreases, the speci®c cake
resistance increases. However, it does not increase
quadratically as predicted by the Carmen±Kozeny
equation.
2. A higher transmembrane pressure results in a
denser cake layer, which increases the specific
cake resistance. A general power law can be
applied to describe the effect of transmembrane
pressure on the specific cake resistance.
3. There is no influence of feed concentration and
stirring on the specific cake resistance.
The numerical model of crossflow filtration developed
here successfully explains the fundamental mechan-
isms involved in flux decline during crossflow UF of
colloidal suspensions. The model provides a helpful
tool for investigating the effect of various operating
parameters such as the particle size, feed concentra-
tion, axial velocity, and membrane dimensions. The
model requires a parameter, the specific cake resis-
tance which was independently obtained from the
dead-end filtration tests. The simulations show that
the model predictions are in good agreement with the
crossflow experimental results. A future modification
of the model might involve incorporating the effect of
polydisperse suspensions. Physico-chemical interac-
tions at the particle-to-particle and membrane-to-par-
ticle levels also need to be further investigated.
7. List of symbols
Am membrane filtration area (m2)
a particle radius (m)
c particle concentration (kg/m3)
C0 feed concentration (kg/m3)
Cp permeate concentration (kg/m3)
Cr retentate concentration (kg/m3)
Cw concentration at membrane surface (kg/m3)
D diffusion coefficient (m2/s)
Deff effective diffusion coefficient (m2/s)
Dm molecular diffusion coefficient (m2/s)
Ds shear-induced hydrodynamic diffusion coeffi-
cient (m2/s)
Dy transverse diffusion coefficient (m2/s)
dp particle diameter (m)
H0 half channel height (m)
J permeate flux (m/s)
Jv steady-state permeate flux (m/s)
k mass transfer coefficient (�Dm/�)mp total dried mass of cake (kg)
n porosity of cake layer
Rc cake layer resistance (mÿ1)
Rm intrinsic membrane resistance (mÿ1)
rc specific cake resistance (mÿ2)
r0c resistance per unit solid volume (m/m3)
T temperature (C)
t filtration time (s)
U0 average inlet axial velocity (m/s)
u axial velocity (m/s)
V0 volume of feed (m3)
Vp volume of permeate (m3)
Vr volume of retentate (m3)
v transverse velocity (m/s)
�0p particle volume per unit area (m3/m2)
� compressibility factor
�P transmembrane pressure (Pa)
� thickness of concentration boundary layer (m)
�c thickness of cake layer (m)
%p density of particles (kg/m3)
� solids volume fraction
�b solids volume fraction in the bulk solution
�p solids volume fraction in the permeate
�w solids volume fraction in the wall
shear rate (sÿ1)
� Boltzman constant
� dynamic viscosity (Pa s)
Acknowledgements
The authors wish to thank the National Science
Foundation under Grant No. BCS 90-57387, and U.S.
Army Construction Engineering Research Labora-
tories under Contract No. DACA88-93-D-0010 and
DACA88-93-D-0023 for providing ®nancial support.
References
[1] R.H. Davis, Modeling of fouling of crossflow microfiltration
membranes, Sep. Purif. Methods 21 (1992) 75±126.
Y. Lee, M.M. Clark / Journal of Membrane Science 149 (1998) 181±202 201

[2] M.C. Porter, Concentration polarization with membrane
ultrafiltration, Ind. Eng. Chem. Prod. Res. Dev. 11(3)
(1972) 234±248.
[3] G. Green, G. Belfort, Fouling of ultrafiltration membranes:
lateral migration and the particle trajectory model, Desalina-
tion 35 (1980) 129±147.
[4] A.L. Zydney, C.K. Colton, A concentration polarization
model for the filtrate flux in cross-flow microfiltration of
particulate suspensions, Chem. Eng. Commun. 47 (1985) 1±
21.
[5] R.H. Davis, D.T. Leighton, Shear-induced transport of a
particle layer along a porous wall, Chem. Eng. Sci. 42(2)
(1987) 275±281.
[6] C.A. Romero, R.H. Davis, Global model of crossflow
microfiltration based on hydrodynamic particle diffusion, J.
Membr. Sci. 39 (1988) 157±185.
[7] E.F. Leonard, C.S. Vassilieff, The deposition of rejected
matter in membrane separation processes, Chem. Eng.
Commun. 30 (1984) 209±217.
[8] R.H. Davis, S.A. Birdsell, Hydrodynamic model and experi-
ments for crossflow microfiltration, Chem. Eng. Commun. 49
(1987) 217±234.
[9] A.S. Berman, Laminar flow in channels with porous walls, J.
Appl. Phys. 24(9) (1953) 1232±1235.
[10] S.W. Yuan, A.B. Finkelstein, Laminar pipe flow with
injection and suction through a porous wall, Trans. ASME
78 (1956) 719±724.
[11] R.P. Ma, C.H. Gooding, W.K. Alexander, A dynamic model
for low-pressure hollow-fiber ultrafiltration, AIChE J. 31(10)
(1985) 1728±1732.
[12] M.R. Wiesner, S. Chellam, Mass transport considerations for
pressure-driven membrane processes, J. AWWA (January
1992) 88±95.
[13] Y. Lee, M.M. Clark, A numerical model of steady-state
permeate flux during cross-flow ultrafiltration, Desalination
109 (1997) 241±251.
[14] Y. Lee, Modeling of Flux Decline Behavior during the
Crossflow Ultrafiltration Membrane Process, MS thesis at
University of Illinois at Urbana-Champaign, 1993.
[15] Probstein, Ronald F., Physicochemical Hydrodynamics: and
Introduction, Butterworth Publishers, 1989.
[16] M. Elimelech, O'Melia, Kinetics of Deposition of Colloidal
Particles, Environ. Sci. Technol. 21(10) (1990) 1528±
1536.
[17] R.S. Faibish, M. Elimelech, Y. Cohen, Effect of Interparticle
Interactions on Flux Decline in Crossflow Membrane
Filtration of Colloidal Suspensions, Proceedings, 9th Annual
Meeting, North American Membrane Society, Baltimore,
May, 1997.
[18] P. Harmant, P. Aimar, Coagulation of colloids retained by
porous wall, AIChE. J. 42(12) (1996) 3523±3532.
[19] R.N. Yong, B.P. Warkentin, Soil Properties and Behavior,
Elsevier, Amsterdam, 1975.
[20] W.B. Russel, D.A. Saville, W.R. Schowalter, Colloidal
Dispersions, Cambridge University Press, 1989.
[21] M.M. Clark, J.R.V. Flora, Floc restructuring in varied
turbulent mixing, J. Colloid Interface Sci. 147(2) (1991)
407±421.
[22] R.J. Baker, A.G. Fane, C.J.D. Fell, B.H. Yoo, Factors
affecting flux in crossflow filtration, Desalination 53 (1985)
81±93.
[23] Kyu-Jin Kim, V. Chen, A.G. Fane, Ultrafiltration of colloidal
silver particles: flux, rejection and fouling, J. Colloid
Interface Sci. 155 (1993) 347±359.
[24] M.M. Clark, Y. Lee, Removal of Colloidal Material from NC
Wastewater Using UF/MF: Characterization of Wastewater
and Minimization of Fouling, Final report to U.S.
Army CERL under contract No. DACA88-92-D-005-0030,
1994.
[25] M.M. Clark, Y. Lee, Removal of Colloidal Materials from NC
Wastewater Using the Crossflow Ultrafiltration/Microfiltra-
tion Membrane Process, Final report to U.S. Army CERL
under contract No. DACA88-93-D-0018, 1995.
[26] S. Chellam, M.R. Weisner, A First Principles Approach
towards Understanding Concentration Polarization, AWWA
Seminar Proceeding March 1991 (1991) 675±689.
202 Y. Lee, M.M. Clark / Journal of Membrane Science 149 (1998) 181±202