Modeling land-use change with Logic Scoring of Preference...
109
Modeling land-use change with Logic Scoring of Preference Method, GIS and Cellular Automata by Richard Minardi B.A., Arizona State University, 1998 THESIS SUBMITTED IN PARTIAL FULFILLMENT OF THE REQUIREMENTS FOR THE DEGREE OF MASTER OF SCIENCE in the Department of Geography Faculty of Environment Richard Minardi 2012 SIMON FRASER UNIVERSITY Summer 2012 All rights reserved. However, in accordance with the Copyright Act of Canada, this work may be reproduced, without authorization, under the conditions for “Fair Dealing.” Therefore, limited reproduction of this work for the purposes of private study, research, criticism, review and news reporting is likely to be in accordance with the law, particularly if cited appropriately.
Transcript of Modeling land-use change with Logic Scoring of Preference...

Modeling land-use change with Logic Scoring of Preference Method, GIS and
Cellular Automata
by Richard Minardi
B.A., Arizona State University, 1998
THESIS SUBMITTED IN PARTIAL FULFILLMENT OF THE REQUIREMENTS FOR THE DEGREE OF
MASTER OF SCIENCE
in the Department of Geography Faculty of Environment
Richard Minardi 2012 SIMON FRASER UNIVERSITY
Summer 2012
All rights reserved. However, in accordance with the Copyright Act of Canada, this work may be reproduced, without authorization, under the conditions for “Fair Dealing.” Therefore, limited reproduction of this work for the
purposes of private study, research, criticism, review and news reporting is likely to be in accordance with the law, particularly if
cited appropriately.

ii
Approval
Name: Richard D. Minardi Degree: Master of Science (Geography) Title of Thesis: Modeling land-use change with Logic Scoring of
Preference Method, GIS and Cellular Automata
Examining Committee: Chair: Dr. Peter V. Hall, Associate Professor
Dr. Suzana Dragićević Senior Supervisor Professor
Dr. Margaret Schmidt Supervisor Associate Professor
Dr. Shivanand Balram Supervisor Senior Lecturer
Dr. Vincent Robinson External Examiner Professor, Department of Geography and Planning University of Toronto
Date Defended/Approved:
August 21, 2012

iii
Partial Copyright Licence

iv
Abstract
Multicriteria Evaluation (MCE) has been used as a land suitability method
and is often coupled with Cellular Automata (CA) for land-use and urban growth
modeling. MCE, however, exhibits limitations including data loss and insufficient
logical requirements. The Logic Scoring of Preference (LSP) is an alternative
approach that can overcome these issues. LSP is a soft computing system evaluation
method efficient in nonlinear aggregation with flexible logic requirements. The main
objective of this research study was to develop an integrated LSP and geographic
information system (GIS) methodology for modeling land-use change. Moreover, the
LSP method was further integrated into a CA to model urban growth. The LSP
methodology was tested with geospatial datasets of coastal BC, Canada and several
scenarios of future land-use change were generated. This research contributes to the
field of spatio-temporal modeling with a novel integration of LSP, GIS, and CA for
land-use suitability analysis and modeling.
Keywords: Cellular Automata; Fuzzy Logic; Land-Use Change; Logic Scoring of Preference; Suitability Analysis

v
Dedication
For Leah and Bodi

vi
Acknowledgements
I would like to acknowledge the Natural Sciences and Engineering Research
Council of Canada (NSERC) for full support of this study under the Discovery Grant
Program awarded to Dr. Suzana Dragićević. I would like to extend thanks to Jodi
Wilson of the Engineering Department, City of Nanaimo, who provided access to
several datasets used for this study.
This research study would not have been possible without the assistance,
patience and critical insight offered by my senior supervisor Dr. Suzana Dragićević
over the past two years. I would like to thank Dr. Shivanand Balram and Dr.
Margaret Schmidt for reviewing an initial draft and providing valuable comments.
My special thanks go to Dr. Jozo Dujmović, Professor, San Francisco State
University for his contributions to the second chapter. Acknowledgements are also
extended to my fellow graduate students in the Geography Department and the
Spatial Analysis and Modeling Laboratory for their support and friendship.
I would like to thank my parents for supporting my decision to become a
student once again after many years. Thanks to Leah for her amazing meals and
making our home a warm and inviting place. I thank Bodi who came into this world
midway through my program, for his wonderful smiles at the end of the day.

vii
Table of Contents
Approval ......................................................................................................................... ii Partial Copyright Licence ............................................................................................ iii Abstract ......................................................................................................................... iv Dedication ...................................................................................................................... v Acknowledgements ....................................................................................................... vi Table of Contents ......................................................................................................... vii List of Tables................................................................................................................. ix List of Figures ................................................................................................................ x
1. Chapter 1: Introduction ................................................................................... 1 1.1. Introduction .......................................................................................................... 1 1.2. Research Problem ................................................................................................. 3 1.3. Research Objectives .............................................................................................. 6 1.4. Study Sites and Data ............................................................................................ 7 1.5. Background ........................................................................................................... 8 1.6. Overview ............................................................................................................. 12 1.7. References ........................................................................................................... 13
2. Chapter 2: GIS-based Logic Scoring of Preference (LSP) Method for Suitability Analysis................................................................................... 17
2.1. Abstract ............................................................................................................... 17 2.2. Introduction ........................................................................................................ 18 2.3. Logic Scoring of Preference Approach: Theoretical Background ....................... 22
2.3.1. Background .............................................................................................. 22 2.4. Elements of the LSP approach ........................................................................... 23
2.4.1. Models of Preference Logic ...................................................................... 26 2.5. Methodology ........................................................................................................ 28
2.5.1. Integration of raster GIS with the LSP method ..................................... 29 2.5.2. Elementary Criteria Definition ............................................................... 29 2.5.3. The Attribute Tree ................................................................................... 30 2.5.4. The Aggregation Structure ...................................................................... 30
2.6. The Case Study - GIS-LSP Prototype ................................................................. 31 2.6.1. Study Area and Datasets ........................................................................ 31 2.6.2. Step 1. Elementary Criteria Definition................................................... 32 2.6.3. Step 2. Attribute Tree .............................................................................. 35 2.6.4. Step 3. Aggregation structure ................................................................. 37
2.7. Results ................................................................................................................. 38 2.7.1. GIS and LSP Integration......................................................................... 38 2.7.2. LSP suitability map output ..................................................................... 40 2.7.3. Comparison of MCE and LSP Approaches ............................................. 41
2.8. Conclusion ........................................................................................................... 47 2.9. Acknowledgements ............................................................................................. 48 2.10. References ........................................................................................................... 48

viii
3. Chapter 3: Urban Growth Simulations with Logic Scoring of Preference Method and Cellular Automata ............................................... 52
3.1. Abstract ............................................................................................................... 52 3.2. Introduction ........................................................................................................ 53 3.3. LSP Theoretical Background .............................................................................. 59 3.4. Methods ............................................................................................................... 61
3.4.1. LSP-CA Model ......................................................................................... 61 3.4.2. Part 1: LSP analysis ................................................................................ 61 3.4.3. Part 2 ....................................................................................................... 65
3.4.3.1. CA Model Development............................................................. 65 3.4.3.2. Simulation Scenarios ................................................................ 67
3.4.3.2.1. Trial 1 ....................................................................... 67 3.4.3.2.2. Trial 2 ....................................................................... 69 3.4.3.2.3. Trial 3 ....................................................................... 70
3.5. Results ................................................................................................................. 70 3.5.1. Data Sets ................................................................................................. 70 3.5.2. Simulation ............................................................................................... 72
3.5.2.1. Trial 1 Simulations ................................................................... 72 3.5.2.2. Trial 2 ........................................................................................ 80 3.5.2.3. Trial 3 ........................................................................................ 83
3.6. Discussion and Conclusion ................................................................................. 85 3.7. Acknowledgements ............................................................................................. 87 3.8. References ........................................................................................................... 88
4. Chapter 4: Conclusion .................................................................................... 93 4.1. General Conclusions ........................................................................................... 93 4.2. Contributions ...................................................................................................... 95 4.3. Future Directions ................................................................................................ 95 4.4. References ........................................................................................................... 97
ix
List of Tables
Table 2-1. Attribute tree .............................................................................................. 36
Table 2-2. Input scores and comprehensive scores for the LSP and MCE suitability maps. ......................................................................................... 47
Table 3-1. LSP criteria inputs ..................................................................................... 64
Table 3-2. Simulation scenarios .................................................................................. 67
Table 3-3. Summary of map comparison procedure .................................................... 77

x
List of Figures
Figure 1-1. Study areas: Bowen Island Municipality, BC, Canada, and Nanaimo, BC, Canada .................................................................................. 8
Figure 1-2. LSP aggregators and parameters ............................................................. 11
Figure 2-1. Different levels of simultaneity and replaceability .................................. 26
Figure 2-2. Map of Bowen Island Municipality with surface elevation visualized as shaded relief ......................................................................... 32
Figure 2-3. Fuzzy transformation functions for criteria definition. ........................... 33
Figure 2-4. Elementary criteria maps: (i) slope, (ii) aspect, (iii) road access, (iv) park access, (v) coast access, and (vi) ferry terminal access. .............. 34
Figure 2-5. Aggregation Structure .............................................................................. 38
Figure 2-6. Integration of LSP in IDRISI's Macro Modeler environment .................. 40
Figure 2-7. LSP suitability map .................................................................................. 41
Figure 2-8. MCE diagram ............................................................................................ 43
Figure 2-9. MCE suitability map................................................................................ 43
Figure 2-9. A comparison of LSP and MCE suitability map results .......................... 45
Figure 3-1. Aggregation structures used for scenario development ........................... 69
Figure 3-2. Study area ................................................................................................. 71
Figure 3-3. Simulation 1A: Transportation oriented growth ...................................... 73
Figure 3-4. Scenario 1B: Growth in environmentally sensitive areas........................ 74
Figure 3-5. Scenario 1C: Compact growth .................................................................. 75
Figure 3-6. Scenario 1D: "Control" simulation using neutral logic ............................ 76
Figure 3-7. Map Comparisons 1a, 1b, and 1c .............................................................. 78
Figure 3-8. Map Comparisons 2a, 2b and 2c ............................................................... 79
Figure 3-9. Simulation 2A: Accelerated growth .......................................................... 81
Figure 3-10. Scenario 2B: Slow growth dynamics....................................................... 82

xi
Figure 3-11: Scenario 3A: Asynchronous growth ........................................................ 84

1
1. Chapter 1: Introduction
1.1. Introduction
Explaining and understanding urban growth with mathematical models has been an
active area of research since the beginning of the quantitative revolution in geography
(Batty 2005). The post WWII urban planning field became influenced by two bodies of
thought: systems theory and the then rediscovered field of locational theory (Hall 2002).
The pioneering Garin-Lowry model predicted land-use patterns based on transportation
and employment data (Hall 2002). Early approaches considered the city as an entity in
equilibrium with well-defined linear relationships between inputs and outputs (Torrens
2000). Many of these models, however, failed to account for complexity of human-
environmental interactions that comprise real world urban systems. Over the past two
decades, research efforts have been made to describe cities as complex systems that share
the dynamic properties of ecological systems (Tomalty 2009). Urban models employing
complexity theory address the limitations of early approaches.
Studying cities as complex systems has led to the development of specialized
modeling approaches that attempt to capture the spatial and temporal processes of urban
development (Torrens & O’Sullivan 2001). Computational models of complexity such as
cellular automata (CA) and agent-based models (ABMs) linked to geographic information
systems (GIS) have been used with success to simulate processes of land-use change and
urban growth (White 2000).

2
Cellular Automata (CA) are a class of spatially explicit modeling approaches used for
studying spatial and temporal change based on local interactions. Tobler’s (1970) model of
Detroit, Michigan, USA, was the first CA to be used in a geographical context (as cited by
Batty 1997). Modellers from a range of disciplines working in CA have employed different
theoretical frameworks for predicting cities of the future (Torrens 2000).
Some CA approaches relied on simplified, abstract representations of cities
consisting of, for example, two competing land uses or social groups represented as different
cell states. Portugali et al. (1994) and Portugali & Benenson (1995) developed CA models
demonstrating emergent residential spatial patterns. CA were shown to be capable of
generating realistic results, such as fractal structures seen in real cities (White & Engelen
1993; Batty & Xie 1996). CA linked with GIS and geospatial data were used to forecast
future urban development (White et al. 1997; Clarke et al. 1997). Constraining the
dynamics of urban CA using GIS signified a major step towards geographic realism (White
& Engelen 1994; Takeyama & Couclelis 1997; Batty et al. 1999). Urban growth has been
modeled using a range of hybrid and more improved GIS-CA structures including neural
networks (Li & Yeh 2001), principle components analysis (Li & Yeh 2002) and data mining
procedures (Li & Yeh 2004). CA also has the potential to augment spatial decision support
systems (SDSSs), however, research on CA and SDSS integrated tools is still limited. For
example, White et al. (2004) described a CA based Decision Support System (DSS) used for
land-use forecasting. Advances in addressing the needs of operational modeling and model
testing have been an active area of research as well. The effects of resolution and
neighbourhood size have been explored (Menard & Marceau 2005). Model assessment has
also been addressed with spatial metrics (Herold et al. 2005) and sensitivity analysis
(Kocabas & Dragićević 2006). More recent CA modeling approaches have incorporated ant

3
colony optimization (Liu et al. 2007) and load balancing (Li et al. 2010), and also was used
to explain historical patterns of growth in Metropolitan London, UK (Stanilov and Batty
2011).
Spatial multicriteria evaluation (MCE) is a decision making approach often used in
suitability analysis within SDSSs. MCE approaches linked with GIS constituting an SDSS
framework were proposed in the literature for a range of land-use decision problems
(Carver 1991; Laaribi et al. 1996; Jankowski et al. 2001). GIS-MCE approaches score
locations from a set of alternatives for a variety of land-use and land allocation decision-
making tasks (Malczewski 1999). The analytical capabilities of MCE have been harnessed
to guide the state transitions of urban CA models. Wu and Webster (1998) developed a
MCE-based CA model for alternative land-use growth under scenarios of different economic
conditions for an urbanizing region of China. MCE methods can be used to characterize a
policy or development preference, while a linked CA can be used to forecast future
development resulting from these preferences.
Several approaches for modeling optimized urban growth exist in the literature.
Ward, et al. (2003) developed a CA-based method employing a land-use allocation analytical
engine for simulating compact development in a fast-growing region of Australia. Ligman-
Zielinska, et al. (2008) apply an iterative optimization approach under the conditions of
compact growth. An optimization and simulation system employing CA and agent-based
modeling techniques is described by Li, et al. (2010).
1.2. Research Problem
The behaviour of cities is perceived as a complex system; their macro-level behaviour
and growth is driven by local processes and activities (Allen 1997). City systems, however,

4
are not entirely local by nature. Global factors exist, economic and cultural, that shape the
trajectory of urban growth patterns (Batty 2005). Conceptual approaches to defining global
factors for modeling urban growth with geographic CA include neural networks ( Li & A.
Yeh 2002a) and ant colony optimization (Liu et al. 2007). These approaches attempt to
represent growth patterns based on past data and are useful for making accurate
predictions. GIS planning and decision models such as MCE are yet another approach to
defining global factors. Variables such as municipal policies that control the built
environment in a city can be formalized as part of a decision model that in turn feeds into
an urban CA. A GIS-CA integrated with a decision model is a way to go for creating models
useful for urban and land-use planners and therefore serves as the lead idea for this
research.
A GIS based CA using a decision model (such as MCE) may be parameterized to
develop cell suitabilities and define the trajectory of urban growth over time. Simple MCE-
CA models of urban growth operating on raster GIS data consist of “developed” and
“undeveloped” land units or cells. Additionally, each cell is given a suitability score ranging
from 0% to 100% (or 0 to 1). This score communicates the attractiveness of a land unit for
future development. Therefore, cells that have a higher score will convert to a developed
state before cells that are less attractive. This conceptual structure offers flexibility for
researching policy and possible future states of urban systems. Expert knowledge and/or
the input of different competing stakeholders could be employed to collaboratively shape an
optimal pattern of urban growth. Modeling different land-use planning strategies could be
presented as a series of “what if” scenarios. Despite its utility, MCE approaches have two
significant drawbacks.

5
The first problem is that an MCE approach is meaningful only for a limited number
of inputs. This is related to the linear additive rule used to calculate a global suitability
score known as the weighted linear combination (WLC). In a WLC operation each input is
weighted and added; the weights reflect “importance” or rank among the other inputs. This
is referred to as a cardinal weighting system in which all weights sum to unity. Under this
approach, a small number of data inputs gives the user a fair amount of flexibility to
distribute weights and represent the “tradeoff” between different factors. As inputs increase
the weights employed are necessarily thinned out as they are distributed to each factor
(Dujmović & De Tré 2011). This results in a reduced significance of factors, and as a
consequence, a loss of detail.
The second drawback of MCE approaches generally is related to the decision logic
associated with the linear additive rule. MCE by default uses a fixed average logic that is
positioned between AND and OR (conjunction and disjunction). Average logic is necessary
for the “tradeoff” function in MCE. Real decision-making however is shaped by variety of
conditions including mandatory, optional, and sufficient requirements(Dujmović & Scheer
2010). The mathematical approach used in MCE does not accommodate a system for
representing a spectrum of different requirements.
An appropriate method, therefore is required that minimizes the loss of input data
and represents logical requirements needed for evaluation. While MCE-CA has been shown
to be effective for developing transition rules for urban systems, an alternative decision
model coupled with a CA that addresses the key shortcomings of linear additive rules does
not exist. Therefore this research study examines the use of the Logic Scoring of Preference
(LSP) approach and its usefulness in integration with a GIS-based CA in order to overcome
the drawbacks of MCE-GIS. LSP can be used to define the global variables of urban growth.

6
LSP is an alternative multicriteria suitability analysis approach that allows decision
makers to combine multiple criteria. The LSP method, unlike MCE approaches, express
flexible logic conditions observed in human decision-making such as the optional or
mandatory nature of criteria. The inherent flexibility of the LSP approach overcomes issues
related to MCE aggregation (combination) rules based on linear additive rules. LSP-derived
solutions are justifiable and model human reasoning and decision-making processes (De
Tré et al. 2009; Dujmović et al. 2009). LSP integration with a GIS has been defined;
however, the LSP method currently has not been fully integrated in a GIS using raster
based geospatial data in a practical application, nor used as an input for urban CA models
of land-use change.
Dujmović et al.(2009) states that the strength of the LSP method relies on its
resemblance to observable patterns of human reasoning. The assertion that the complexity
of human behaviour can be fully computed is philosophically rooted in rationalism.
Therefore, this thesis assumes a rationalist position through a structured research enquiry.
1.3. Research Objectives
The main goal of this thesis is to develop an integrated LSP methodology that uses a
GIS framework and CA for the purpose of modeling urban land suitability, land-use change
and for simulations of different scenarios of future urban growth. The specific objectives of
the thesis are as follows:
1) Implementation and testing of the LSP method in a raster GIS environment
in order to apply the LSP-GIS approach on real geospatial data sets for
land-use suitability analysis;

7
2) Assessment of an integrated GIS-LSP and commonly used GIS-MCE methods
for land-use suitability analysis;
3) Development of a LSP-CA model for land-use change and its
implementation in real urban-rural settings.
This study extends the existing research efforts on land-use suitability modeling and
CA modeling. Urban growth is a spatial process and is well handled by the mechanics of
CA. The LSP approach leverages the power of multiple geospatial data layers and returns
highly detailed results. The LSP approach functions as a selective and flexible method for
defining land-use suitabilities and CA transition rules.
1.4. Study Sites and Data
Two different geospatial datasets of study sites located in coastal British Columbia,
Canada were selected to accomplish the objectives of this research study (Figure 1-1). The
GIS-LSP integrated prototype was tested on geospatial data of the Municipality of Bowen
Island, BC, Canada. The LSP-CA approach was tested on comprehensive geospatial data
sets representing the City of Nanaimo on the coast of Vancouver Island, BC, Canada.

8
Figure 1-1. Study areas: Bowen Island Municipality, BC, Canada, and Nanaimo, BC, Canada
1.5. Background
The Logic Scoring of Preference (LSP) is a general multicriteria decision modeling
approach with origins in soft computing, or computing with values that are a matter of
degree. The LSP method has been applied to software, web and GUI interface evaluation

9
(Dujmović & Nagashima 2006), and more recently theorized for spatial applications (De Tré
et al. 2009). While GIS frameworks and geospatial datasets have not been employed, LSP
analysis has been implemented in a Google Maps environment (Dujmović & De Tré 2011)
Additionally, a non-spatial assessment of conservation planning policy has been performed
using LSP methods (Allen et al. 2011).
The first step in implementing a LSP approach involves the construction of an
attribute tree that organizes the decision problem and contains all the relevant attributes
and parameters (Dujmović & Scheer 2010). Attribute trees must accurately reflect the
needs and knowledge base of the decision-maker and represent the problem at hand.
Elementary criteria function as the basic elements of the attribute tree and each should be
relevant and non-redundant (Dujmović et al. 2009). Redundancy refers a condition in which
a mitigating factor is duplicated (Malczewski 1999).Careful study of all possible factors and
their relevancy should be assessed as a means of verifying the non-redundancy of inputs.
Elementary criteria are defined using fuzzy membership functions with suitability
indicated by a continuous value (0-1).
The attribute tree facilitates the design of an aggregation structure. An aggregation
structure is composed of a linked series of LSP aggregators and describes the
parameterization and step-wise combination of inputs. LSP aggregators combine inputs
based on logical requirements and a weighting parameter. LSP aggregators express
mandatory and optional requirements associated with input criteria. Modeled logic
requirements are represented as a spectrum of conditions between full disjunction and full
conjunction. Requirements are referred to in terms of fuzzy degrees of ANDness and
ORness. LSP aggregators are theoretically based on the Generalized Conjunction

10
Disjunction (GCD) function and computed using a weighted power mean (WPM) operation
as follows (Dujmović et al. 2010):
10,,1
,,...,1,10,10,
1
/1
1
≤≤+∞≤≤∞−=
=≤≤<<
=
∑
∑
=
=
Srw
nixwxwS
n
ii
ii
rn
i
rii
(eq.1-1)
where s represents the suitability degree, W is the user defined criteria weight, r is
the parameter that determines the logical behaviour of the function and expresses a user
selected degree of mandatory or optional satisfaction.
Values for the r parameter represent the range of logical requirements needed for
evaluation (Figure 1-2) (Dujmović et al. 2010). LSP aggregators can be used as building
blocks for the construction of compound operators to suit a range of special cases used in
routine evaluations. The aggregation of a mandatory input with an optional input is one
such case and may be approached with the construction of a conjunctive partial absorption
(CPA) aggregator employed to combine asymmetrical or logically incompatible inputs (De
Tré et al. 2009). Figure 1-2 depicts seven cases of ANDness and ORness (adapted from (De
Tré et. al 2009)). As many as 17 cases exist (Dujmović & Nagashima 2006) and their use
depends on the needs of the decision-maker.

11
Figure 1-2. LSP aggregators and parameters
Generally, the aggregation structure design is arbitrary and entirely dependent on
the conditions specified in the decision problem. Decision problems are, however, theorized
to fall under several identifiable patterns. These patterns are referred by Dujmović and De
Tré (2011) as canonical aggregation structures (CAGs), and are useful as a starting point for
building up and structuring the LSP analysis.
Computing a comprehensive suitability score involves the aggregation of each
elementary criteria as defined and parameterized in the aggregation structure. Elementary
criteria are aggregated in stages until the structure terminates. Termination returns a
global suitability score. Scores representing suitability are measured on a continuous scale
from 0% to 100% (or 0 to 1) where 0 is “not suitable,” and 1 is “most suitable.” In fuzzy set
theory variables are expressed as degrees of membership between 2 or more sets (Robinson
2009). The LSP approach relies on inexact definitions of suitability based in this theory to
account for uncertainty in the decision-making process.

12
1.6. Overview
This thesis contains four chapters. The Introduction section outlines the theoretical
and conceptual framework for the study. The second chapter describes the development of
the integrated GIS-LSP method. The prototype was designed and tested on raster
geospatial data of Bowen Island Municipality, BC, Canada, to derive a suitability map for
residential development based on a number of input criteria. Model input criteria were
selected and an aggregation structure containing LSP operators was designed and
implemented in a raster GIS framework. The LSP approach was compared to a similarly
structured MCE approach using a linear additive rule. Output maps are presented and
compared. The primary purpose of this section is to test the ability of integration of the LSP
approach in a raster GIS environment. This provides the basis for further development of
the method that integrates LSP and GIS into a CA model of an urban land-use change
system.
Chapter three describes the development of the integrated LSP-GIS-CA structure
for modeling different urban growth scenarios. A series of CA simulations were constructed
employing an LSP approach for assessing cell suitability for residential development based
on numerous input criteria. The CA was calibrated to produce different outcomes and alter
model behaviour by systematically adjusting the LSP parameters. As a result, several
simulation scenarios of possible urban growth at the urban-rural fringe of the City of
Nanaimo, BC, Canada were generated.
Chapter four is the Conclusion section and presents a summary of the thesis results
and insights into additional applications for this research study. Contributions to the field
of computational spatial modeling are discussed as well as future directions for this
research work.

13
1.7. References
Allen, P.M., 1997. Cities and Regions as Self-organizing Systems: Models of Complexity, Taylor and Francis. London 300p
Allen, W., L. III et al., 2011. Identifying and selecting strategic mitigation opportunities; criteria design and project evaluation using Logic Scoring of Preference and optimization. Journal of Conservation Planning, 7, pp.61–68.
Batty, M. & Xie, Y., 1996. Preliminary evidence for a theory of the fractal city. Environment and Planning A, 28(10), pp.1745 – 1762.
Batty, M., Xie, Y. & Sun, Z., 1999. Modeling urban dynamics through GIS-based cellular automata. Computers, Environment and Urban Systems, 23(3), pp.205–233.
Batty, M., 1997. Cellular Automata and Urban Form: A Primer. Journal of the American Planning Association, 63(2), pp.266–274.
Batty, M., 2005. Cities and Complexity: Understanding Cities with Cellular Automata, Agent-Based Models, and Fractals, Cambridge, Mass: MIT Press.
Carver, S.J., 1991. Integrating multi-criteria evaluation with geographical information systems. International Journal of Geographical Information Systems, 5(3), p.321.
Clarke, K C, Hoppen, S. & Gaydos, L., 1997. A self-modifying cellular automaton model of historical urbanization in the San Francisco Bay area. Environment and Planning B: Planning and Design, 24(2), pp.247–261.
Dujmovic, J. & Scheer, D., 2010. Logic aggregation of suitability maps. In 2010 IEEE International Conference on Fuzzy Systems (FUZZ). 2010 IEEE International Conference on Fuzzy Systems (FUZZ). IEEE, pp. 1–8.
Dujmović, J. & Tré, G.D., 2011. Multicriteria methods and logic aggregation in suitability maps. International Journal of Intelligent Systems, 26(10), pp.971–1001.
Dujmovic, J.J. & Nagashima, H., 2006. LSP method and its use for evaluation of Java IDEs. International Journal of Approximate Reasoning, 41(1), pp.3–22.
Dujmović, J.J., De Tre, G. & Dragicević, S., 2009. Comparison of Multicriteria Methods for Land-use Suitability Assessment. IFSA/EVSFLAT Conference.pp. 1404-1409.
Dujmović, J.J., Tré, G. & Weghe, N., 2010. LSP suitability maps. Soft Computing, 14(5), pp.421–434.
Eastman, J.R. et al., 1995. Raster Procedures for Multi-Criteria/Multi-Objective Decisions. Photogrammetric Engineering and Remote Sensing (PE&RS), 61(5), pp.539–547.
Hall, P.G., 2002. Cities of Tomorrow: An Intellectual History of Urban Planning and Design in the Twentieth Century 3rd ed., Malden, MA: Blackwell Publishers. 576p.

14
Herold, M., Couclelis, Helen & Clarke, Keith C., 2005. The role of spatial metrics in the analysis and modeling of urban land use change. Computers, Environment and Urban Systems, 29(4), pp.369–399.
Jankowski, P., Andrienko, N. & Andrienko, G., 2001. Map-centred exploratory approach to multiple criteria spatial decision making. International Journal of Geographical Information Science, 15(2), pp.101–127.
Kocabas, V. & Dragicević, S., 2006. Assessing cellular automata model behaviour using a sensitivity analysis approach. Computers, Environment and Urban Systems, 30(6), pp.921–953.
Laaribi, A., Chevallier, J.J. & Martel, J.M., 1996. A spatial decision aid: A multicriterion evaluation approach. Computers, Environment and Urban Systems, 20(6), pp.351–366.
Li, X. & Yeh, A.G., 2001. Calibration of cellular automata by using neural networks for the simulation of complex urban systems. Environment and Planning A, 33(8), pp.1445–1462.
Li, X, Chen, Y., et al., 2010. Concepts, methodologies, and tools of an integrated geographical simulation and optimization system. International Journal of Geographical Information Science, 25(4) pp.633-655
Li, X,, Zhang, X., et al., 2010. Parallel cellular automata for large-scale urban simulation using load-balancing techniques. International Journal of Geographical Information Science, 24(6), pp.803–820.
Li, X. & Yeh, A.G.-O., 2004. Data mining of cellular automata’s transition rules. International Journal of Geographical Information Science, 18(8), pp.723–744.
Li, X. & Yeh, A.G.-O., 2000. Modelling sustainable urban development by the integration of constrained cellular automata and GIS. International Journal of Geographical Information Science, 14(2), pp.131–152.
Li, X.,& Yeh, A.G.-O., 2002a. Neural-network-based cellular automata for simulating multiple land use changes using GIS. International Journal of Geographical Information Science, 16(4), pp.323–343.
Li, Xia & Yeh, A.G.-O., 2002b. Urban simulation using principal components analysis and cellular automata for land-use planning. Photogrammetric Engineering and Remote Sensing, 68(4), pp.341–351.
Ligmann-Zielinska, A., Church, R.L. & Jankowski, P., 2008. Spatial optimization as a generative technique for sustainable multiobjective land-use allocation. International Journal of Geographical Information Science, 22(6), p.601.
Liu, X. et al., 2007. Discovery of transition rules for geographical cellular automata by using ant colony optimization. Science in China, Series D: Earth Sciences, 50(10), pp.1578–1588.

15
Malczewski, J., 1999. GIS and Multicriteria Decision Analysis, New York: John Wiley. 408p.
Malczewski, J., 2000. On the Use of Weighted Linear Combination Method in GIS: Common and Best Practice Approaches. Transactions in GIS, 4(1), pp.5–22.
Menard, A. & Marceau, D.J., 2005. Exploration of spatial scale sensitivity in geographic cellular automata. Environment and Planning B: Planning and Design, 32(5), pp.693–714.
Portugali, J & Benenson, I, 1995. Artificial planning experience by means of a heuristic cell-space model: simulating international migration in the urban process. Environment and Planning A, 27(10), pp.1647–1665.
Portugali, J., Benenson, I. & Omer, I., 1994. Sociospatial Residential Dynamics: Stability and Instability within a Self-Organizing City. Geographical Analysis, 26(4), pp.321–340.
Robinson, V.B. Fuzzy Sets and Spatial Analysis. In The Sage Handbook of Spatial Analysis. eds. P. Rogerson and S. Fotheringham, Sage Publishing. pp.204-219.
Stanilov, K. & Batty, Michael, 2011. Exploring the Historical Determinants of Urban Growth Patterns through Cellular Automata. Transactions in GIS, 15(3), pp.253–271.
Takeyama, M. & Couclelis, H., 1997. Map dynamics: integrating cellular automata and GIS through geo-algebra. International Journal of Geographical Information Science, 11(1), pp.73–91.
Tobler, W. 1970. A Computer Movie Simulating Urban Growth in the Detroit Region. Economic Geography 26:234-240
Tomalty, R., 2009. The Ecology of Cities. Alternatives Journal, 35(4), pp.19–21.
Torrens, P.M., 2000. How cellular models of urban systems work.
Torrens, P.M. & O’Sullivan, D., 2001. Cellular automata and urban simulation: where do we go from here? Environment and Planning B: Planning and Design, 28(2), pp.163 – 168.
De Tré, G., Dujmovic, J. & Van De Weghe, N., 2009. Supporting Spatial Decision Making by Means of Suitability Maps. In J. Kacprzyk, F.E. Petry & A. Yazici, eds. Uncertainty Approaches for Spatial Data Modeling and Processing. Berlin, Heidelberg: Springer Berlin Heidelberg, pp. 9-27.
Ward, D.P., Murray, A.T. & Phinn, S.R., 2003. Integrating spatial optimization and cellular automata for evaluating urban change. The Annals of Regional Science, 37(1), pp.131–148.
White, R, 2000. High-resolution integrated modelling of the spatial dynamics of urban and regional systems. Computers, Environment and Urban Systems, 24(5), pp.383–400.

16
White, R. & Engelen, G., 1993. Cellular automata and fractal urban form: a cellular modelling approach to the evolution of urban land-use patterns. Environment & Planning A, 25(8), pp.1175–1199.
White, R. & Engelen, G., 1994. Cellular dynamics and GIS: modelling spatial complexity. Geographical Systems, 1(3), pp.237–253.
White, R., Engelen, G. & Uljee, I., 1997. The use of constrained cellular automata for high-resolution modelling of urban land-use dynamics. Environment and Planning B: Planning and Design, 24(3), pp.323–343.
White, R, Straatman, B. & Engelen, G, 2004. Planning Scenario Visualization and Assessment: A Cellular Automata Based Integrated Spatial Decision Support System. In Best Practices in Spatially Integrated Social Science. New York: Oxford University Press, pp. 420–442.
Wu, F. & Webster, C.J., 1998. Simulation of land development through the integration of cellular automata and multicriteria evaluation. Environment and Planning B: Planning and Design, 25(1), pp.103–126.

17
2. Chapter 2: GIS-based Logic Scoring of Preference (LSP) Method for Suitability Analysis
2.1. Abstract
Multicriteria Evaluation (MCE) is a common approach for building suitability maps
in raster based geographic information systems (GIS). MCE aggregation can be performed
by a linear additive model also known as the Weighted Linear Combination (WLC) or
simple additive scoring. MCE methods see a decrease in factor significance with an increase
in the quantity of inputs and do not reflect logical requirements needed for decision
making. The Logic Scoring of Preference (LSP) approach is presented here as an alternative
to MCE models. The LSP approach features an efficient nonlinear system for suitability
aggregation, and allows the expression of a spectrum of logical requirements. The objective
of this research study is to integrate the LSP method into a raster–based GIS in order to (a)
test the approach within a GIS framework and by using real geospatial datasets, and (b)
compare the GIS-LSP approach to a GIS-MCE approach. The two approaches were applied
to a land-use suitability analysis problem using GIS data for Bowen Island Municipality,
Canada. Obtained results indicate that the integrated GIS-LSP approach is a flexible and
useful approach for suitability analysis. The GIS-LSP approach outperformed the GIS-MCE
approach with respect to selectivity and level of detail present in the output.
A version of this chapter is in preparation for submission to the International Journal of Geographic Information Science under the title: GIS-based Logic Scoring of Preference (LSP) Method for Suitability Maps and coauthored with S. Dragićević and J.Dujmović

18
2.2. Introduction
In the context of geographic information systems (GIS), decision-making is an
iterative and interactive process geared towards understanding the problem, objectives,
tradeoffs and uncertainties in identifying a solution or choice from a set of alternatives.
Decision-making can be conceptualized as structured or unstructured (Malczewski 1999).
The terms refer to the level of computability associated with the problem. A problem with a
high degree of computability is one in which all factors can be exhaustively decomposed and
accounted for (Malczewski 1999). Spatial Decision Support Systems (SDSSs) facilitate
spatial decision-making research for semi-structured decision tasks, involving a special
hybrid computational and expert knowledge approach (Densham 1991). SDSS frameworks
combine spatial data management, analytical modeling, visualization, and require the
interaction of a decision-maker analyst or group of stakeholders. SDSSs may function as
stand-alone software tools customized for a narrow domain and application or integrated
within a GIS framework (Church, et al. 2000). Broadly defined, GIS comprises spatial data
input, storage, retrieval, output and analysis (Goodchild 1987). A GIS-SDSS integration
methodology builds on the visualization, data processing and database management
capabilities of fully developed GIS applications. Integration was recognized as an
appropriate approach for implementing SDSS methods and more particular multicriteria
evaluation (MCE) procedures, first implemented in raster GIS by Carver ( 1991).
Spatial multicriteria evaluation (MCE) is a general term given to decision modeling
approaches that can be used within SDSSs operating on geospatial data (Malczewski 2010).
A spatial MCE approach consists of a set of mapped choice alternatives (locations), a set of
preference criteria, and a means of evaluating each choice alternative based on the criteria
set (Jankowski 1995). Alternatives are given cumulative suitability scores presented

19
spatially as a mapped suitability index or suitability map. Suitability maps are the product
of a suitability analysis used for the visualization of preference, likelihood, or consequences
surrounding a phenomenon, or activity (Hopkins 1977).
Different types of MCE exist in the GIS literature and include but are not limited to
a Boolean approach used with a maximum or minimum operators ( Jiang & Eastman 2000),
a Fuzzy MCE (FMCE) approach based on fuzzy, continuous variables employing a linear
additive rule (Eastman, et al 1995), and MCE augmented with Ordered Weighted
Averaging used to evaluate the level of risk associated with a decision model outcome
(Malczewski 2006). The term MCE as used in this study refers specifically to the FMCE
approach employing fuzzy inputs encoded as a spectrum of varying degrees ranging from 0
(not suitable) to 1 (most suitable) (Eastman et al. 1995). In fuzzy set theory, such continuous
variables belong to more than one set and are defined by a function used to address vague
or incomplete knowledge (Robinson 2009). MCE used in this way accommodates a flexible
and inexact definition of suitability.
Numerous linked MCE and GIS approaches have been proposed that represent a
wide range of spatial decision-making objectives including species habitat suitability (Store
& Kangas 2001), agricultural suitability analysis (Ceballos-Silva & Lopez-Blanco 2003),
risk and hazard assessment (Aceves-Quesada et al. 2007), and infrastructure planning
(Rybarczyk & Wu 2010). MCE as an analytical approach for land-use planning forms a
large area of research. A prototype urban planning support tool based on MCE was
developed for the Queensland region of Australia (Pettit & Pullar 1999). Joerin, et al. (2001)
introduced MCE to study residential suitability under the conditions of environmental
noise pollution. Hill et al. (2005) document an operational decision support system
(ASSESS) used for agricultural land-use policy analysis in Australia.

20
In addition to different applications, researchers have also focused on preferences of
decision makers and modeling optimal solutions among competing planning objectives.
Rinner and Taranu (2006) developed an interactive tool for MCE-based decision making.
Proctor and Dreschler (2006) developed and tested an MCE approach for collaborative
planning. A GIS-MCE approach was used to study competing goals in forest conservation
planning in Malaysia (Phua & Minowa 2005). Wood and Dragićević (2007) employed a
multi-objective GIS decision support framework for identifying optimal marine protection
locations based on criteria representing the conflicting objectives of conservation and
resource extraction.
Spatial MCE approaches based on linear models, however, fall under criticism for
producing an oversimplified representation of human reasoning and decision-making that
is difficult to interpret (Dujmović et al. 2009; Malczewski 2006). Linearized MCE has two
significant methodological issues: (a) the number of data inputs that may be combined to
produce meaningful results is limited and (b) the decision logic employed does not reflect
logic conditions needed for decision problems. These two issues are related to the linear
aggregation process that is used in MCE. A linear additive combination rule is used, known
as the Weighted Linear Combination (WLC) rule. In a WLC procedure, criteria are first
assigned a weight and summed returning suitability scores used to make a suitability map
(Eastman et al. 1995):
∑∑==
==<<=n
ii
n
iiii wniwxwS
111,,...,1,10, , (eq. 2-1)
where S is the aggregated overall suitability, w is an array of positive normalized
weights representing the relative importance of elementary decision criteria. The WLC rule
is compensatory; a low criteria score may always be compensated by higher criteria scores

21
in the same location. By selecting a different distribution of weights a different outcome
may be produced (Malczewski 2000).
The amount of inputs n in such a system is limited; the compensatory relationship
between MCE factors functions well if the inputs are minimized. As the number of input
factors increase, the significance of each input decreases. Because the total sum of factor
weights must sum to unity, the mean value of weights is 1/n and it can become insignificant
for large numbers of input attributes. For WLC systems the total impact of input ix is
iniiniii wxxxxSxxxxS =−= +−+− ),...,,0,,...,(),...,,1,,...,( 111111δ Obviously, the average impact
is nnn /1/)...( 1 =++= δδδ and as n increases the average impact becomes negligible.
This problem relates to the amount of detail that can be transmitted through MCE/WLC
methods.
MCE/WLC models also exhibit limitations with respect to decision logic. In many
cases decisions require the application of logical requirements to compare and select a set of
locations over the alternatives. Traditional logic operators model simultaneity (AND) and
replaceability (OR). AND denotes partial or full conjunction and is similar to a minimum
function, whereas OR denotes partial or full disjunction and is similar to a maximum
function. The WLC approach yields a fully neutral decision logic that is neither AND nor
OR. Neutral logic is only one of necessary logic aggregators. According to Dujmović et al.,
(2009) logical requirements such as conjunctive, disjunctive, mandatory, nonmandatory,
sufficient, optional, and others are necessary for real-world decision-making. In order to
accommodate real-world reasoning for decision-making, the Logic Scoring of Preference
(LSP) method is necessary as a new approach capable of overcoming WLC-based MCE
limitations.

22
The Logic Scoring of Preference (LSP) approach is a multicriteria approach to
decision-making with origins in soft computing (computing with variables that are matter
of a degree). The LSP approach features nonlinear attribute criteria and aggregation
structures that model decision requirements. These features make LSP an appropriate
method for researching complex spatial problems requiring numerous data inputs
(attributes) and a high level of detail. LSP has been used primarily as a utility for
evaluating software and web interfaces. Spatial applications and LSP method have been
proposed, but full GIS integration using geospatial data sets has not yet been implemented.
Therefore the main objective of this study is to develop an integrated GIS and LSP
model for the purpose of defining land-use suitability. Suitability was expressed as raster
suitability maps representing a geographic study area. The model was built primarily to
test the LSP approach in a spatial context using geospatial data in a raster GIS framework.
The LSP approach was also compared to a MCE/WLC structured approach. A comparison
served two purposes: (a) to address the limitations of MCE/WLC suitability maps and (b) to
highlight the relevant qualities of LSP (nonlinear aggregation and flexible logic
aggregators) in addressing those limitations. The LSP approach was tested in a residential
land-use suitability analysis procedure using geospatial data attributes of Bowen Island
Municipality, BC, Canada.
2.3. Logic Scoring of Preference Approach: Theoretical Background
2.3.1. Background
The Logic Scoring of Preference (LSP) is presented here as a novel approach for
researching semi-structured spatial decision problems in a GIS framework. LSP was

23
originally conceived as a general multicriteria approach and has been used for evaluating
complex software development environments, web browsers and user interfaces (Dujmović
& Nagashima 2006). More recently the approach has been extended to the evaluation of
complex spatial systems (Dujmović et al. 2009). De Tré et al. (2010) describe a framework
for building LSP suitability maps, also often called s-maps. LSP suitability maps have been
described using empirically derived data for a hypothetical optimal home location siting
(Dujmovic and Scheer 2010). Dujmović and De Tré (2011) develop this research problem
and describe an interactive, dynamic web-based LSP system integrated with Google Maps
(SEAS 2012). A spatial LSP system may be configured to provide analysis on the financial
components and costs related to a decision strategy (De Tré et al 2010). De Tré et al. (2009)
have proposed suitability maps that express bipolar satisfaction representing degrees of
satisfaction and dissatisfaction of decision criteria incorporating LSP aggregators.
2.4. Elements of the LSP approach
The LSP approach comprises a set of components: (i) elementary criteria, (ii) an
attribute tree, (iii) an aggregation structure, and a computed global suitability score.
Elementary criteria function as the inputs of an LSP evaluation. Criteria are scaled using a
fuzzy membership function to define suitability. An attribute tree is used to organize the
elementary criteria for the purpose of structuring the problem. Criteria must be organized
categorically and non-redundantly. For example, a category such as “access to transit” in a
decision problem may contain bus, train, and street car accessibility factors. Factors may
also be categorized based on logic requirements.
The expression of logic requirements is a key feature of the LSP approach. In many
cases criteria may require mandatory satisfaction, or reflect a requirement that is merely

24
optional. For example, a slope criterion must be satisfied for many land-use decision
problems. However, satisfying a “view criteria” may be entirely optional. Ultimately, if the
mandatory slope criteria is not satisfied (assigned a 0 score on a scale of 0 to 1) in any
location, the result will be a null score for that location. An optimal view criteria with an
optional satisfaction requirement is more replaceable. A null score of an optional criterion
will not disqualify the location. Mandatory and optional requirements are modeled in terms
of fuzzy degrees or strengths. For example, a mandatory criteria is modeled as a degree of
ANDness, and an optional requirement is conversely modeled as a degree of ORness.
ANDness and ORness occur on a continuum between logical AND and OR. The two types of
logic have an inverse relationship. Therefore a strong mandatory requirement (strong
ANDness) is equivalent to a weak optional requirement (weak ORness), and vice versa.
Structuring the criteria categorically by fuzzy logical requirements and problem
domain facilitates the mathematical aggregation or combination of inputs. Categorically
defined inputs are introduced into a hierarchical stem and leaf aggregation structure. The
aggregation structure combines smaller categories into more comprehensive suitability
layers. For example, in a hypothetical evaluation, the “transit” category is first aggregated,
and then this comprehensive suitability is subsequently combined with “road, highway, and
airport” accessibility into generalized “transportation” suitability. Aggregation is performed
mathematically using LSP aggregators. LSP aggregators accept a set of inputs and weight
and logical strength parameters are applied. Aggregators are based in the generalized
conjunction disjunction (GCD) function (Dujmović et al. 2009, Dujmović and Larsen 2007).
GCD provides the means for combining or aggregating criteria scores to model different
strengths of satisfaction requirements (i.e. mandatory or optional) needed by the analyst.
GCD is a theoretical structure that can be mathematically implemented through different

25
approaches including a logarithmic mean, a counter-harmonic mean or a weighted power
mean (WPM) (Dujmović 2008). In this research study the GCD function is computed with a
WPM and is used to calculate an aggregated suitability score as follows:
10,,1
,,...,1,10,10,
1
/1
1
≤≤+∞≤≤∞−=
=≤≤<<
=
∑
∑
=
=
Srw
nixwxwS
n
ii
ii
rn
i
rii
(eq. 2-2)
where S represents the aggregated suitability score, ix denotes an input attribute
suitability score, iw is the user defined attribute weight reflecting the relative importance
of the selected input, and r is the parameter that determines the logical behaviour of the
function and expresses a user selected degree of mandatory or optional requirements. The
LSP aggregator “nodes” of the aggregation structure systematically combine the
categorically grouped inputs and the system terminates returning a global suitability map.
The map ranks each location with a score ranging from 0 not suitable to 1 most suitable.
The set of methods under the LSP approach handles input data more efficiently than
the MCE approach and result in more data-rich and expressive suitability models. The
nonlinear method of aggregation permits an unlimited amount of inputs to be included in
an evaluation with a minimization of data loss. The LSP aggregators employing the WPM
facilitate aggregation and allow modeling of different types of conditional logic needed to
conceptualize suitability. A more in-depth review of fuzzy models of preference logic follows
in the next section.

26
2.4.1. Models of Preference Logic
The LSP approach models fuzzy ANDness (conjunction) and ORness (disjunction)
with models of simultaneity and replaceability (Dujmović & Nagashima 2006). Figure 2-1
describes different levels of simultaneity and replaceability, and their associated unit
intervals, r parameters, and symbolic notation. LSP aggregators used in evaluation include
(i) full conjunction (C) and partial conjunction (PC) for modeling simultaneity between
inputs; (ii) the mean average (A) to model balanced neutrality; (iii) full (D) and partial
disjunction (PD) for modeling replaceability among inputs; and (iv) specially configured
aggregators designed to combine mandatory and desired/optional inputs, and sufficient
and desired /optional inputs.
Figure 2-1. Different levels of simultaneity and replaceability
Selecting a LSP aggregator is a matter of determining the strength of logical
requirements needed to evaluate criteria. To model a stronger, more restrictive
simultaneity, a hard partial conjunction (HPC) or full conjunction (FC) operator may be
selected. A defining feature of the HPC operator is that any null criteria input will return a
0 output. This property of the HPC aggregator makes it appropriate for combining criteria

27
with mandatory satisfaction requirements. Alternatively, a less restrictive satisfaction
requirement may be appropriate, such as a soft partial conjunction (SPC). Likewise,
different intensities of replaceability modeled with disjunction may be represented as either
hard partial disjunction (HPD) or soft partial disjunction (SPD). A HPD operator will
output a score of 1 to any input that is fully satisfied. The mean average (A) is another
model that represents logical neutrality. Neutrality refers to a logic that is expresses
neither ANDness nor ORness. Non-mandatory criteria may be aggregated using a SPC, A,
SPD, or HPD operator. A strong model of replaceability will give a high score to locations in
which at least one of the inputs is satisfied, representing trade-off of non-mandatory
criteria. The strength of one criteria score may replace or compensate for the absence of the
weaker criteria score.
The approach was designed for flexibility and LSP aggregators may be configured to
handle special situations such as the aggregation of logically incompatible inputs. The
aggregation of a mandatory input and an optional input is approached using a conjunctive
partial absorption (CPA) aggregator (Dujmović & De Tré 2011). A CPA aggregator is built
with basic LSP operators: models of partial conjunction and partial disjunction or
neutrality along with a preference weighting structure. In a hypothetical LSP evaluation, a
CPA aggregator is used to combine mandatory input x and desired input y. If the
mandatory input (x) is 0, then the corresponding output preference (z) is 0. However, if the
desired input y is 0 and falls on the range of 0 < x ≤ 1 then a penalty is applied. In other
words, the null satisfaction of the mandatory criteria eliminates the location under
evaluation, whereas the null satisfaction of the desired input merely detracts from the
overall suitability score. In the case of the desired input y = 1, and the mandatory input x is
greater than 0, a reward is applied. If a desired input is fully satisfied (1), given that the
28
mandatory input is also satisfied, the desired input compensates the output score. A lookup
table may be employed (Dujmović 1979) or specialized software for selecting penalty and
reward pairs (De Tré et al. 2009).
It is theorized that system evaluations follow identifiable patterns. Dujmović & De
Tré (2011) refers to these evaluation patterns as canonical aggregation structures (CAS). In
an LSP system, criteria are aggregated and combined in a stepwise, nonlinear fashion.
With increasing degree of aggregation the cumulative strength of aggregators increases.
Dujmović and De Tré (2011) refer theoretically to the accumulation of logical strength as a
shadow defined as the quantity of inputs and aggregated inputs that accumulate in an
aggregation structure and influence the output. Aggregators, for example, positioned at the
beginning of the aggregation structure may have 2 inputs, and the output is influenced by a
shadow of size 2. As more input attributes are combined into subgroups, their collective
importance and logical strength increases resulting in a larger shadow of size n. A
conjunctive CAG, for example, uses less restrictive logical operators at lower levels in the
aggregation structure. As additional criteria merge into larger aggregates, the level of
ANDness increases. Stronger conjunctive aggregators are needed to reflect stronger
requirements, requiring a hard partial conjunction or full conjunction operator to derive the
final solution. In the case of a conjunctive CAG, the model of simultaneity (ANDness)
needed is directly related to the size of its shadow. A full discussion of less commonly
applied CAG structures and their applications are presented in Dujmović & De Tré (2011).
2.5. Methodology
This section is divided into three parts. The first part presents the framework of an
integrated GIS-LSP prototype model. The second part describes the prototype used in a

29
suitability analysis case study. The third part describes a GIS-MCE structured approach to
facilitate comparison of the GIS-LSP and GIS-MCE approaches.
2.5.1. Integration of raster GIS with the LSP method
The LSP approach described assumes a tight integration with a raster GIS. A GIS-
LSP framework uses geographically referenced GIS data layers as input, and relies on
existing GIS operations to standardize and define elementary attributes, implement LSP
operators, and calculate suitability scores for each choice alternative. The GIS-LSP
integrated approach may be used to formulate a suitability index, or alternatively select the
top ranked locations in the study site. Inputs and results may be visualized in map form.
Using map visualization, users may perform model validation, a sensitivity analysis,
or create a series of alternative decision scenarios. By changing different features (the
attribute tree, factor weights, LSP aggregators, and the aggregation structure) of the LSP
system a series suitability scenarios may be generated.
The integrated GIS and LSP model is built in the following stages: (i) elementary
criteria definition (ii) development of an attribute tree (iii) aggregation structure selection
and (iv) computation of a global suitability score.
2.5.2. Elementary Criteria Definition
Elementary criteria are the basic elements of the attribute tree as designed by the
decision-maker. The spatial application of LSP suitability maps proposed by De Tré et
al.(2009) specifies a field-based model, therefore the approach described is implemented
using a raster GIS data model. Furthermore, raster cells are well suited for the
representation of fuzzy sets used to express vague definitions of suitable distances related to
spatial accessibility (Malczewski 1999). Each elementary criteria is defined as a spatial
30
attribute pertaining to a user preference value. Preferences are specified using natural
language and formalized with a continuous membership function. This procedure is similar
to the standard approach used in fuzzy GIS-MCE approaches. For each mapped criteria
layer, each cell or raster at (x,y) location is ranked and assigned a continuous value (0-1)
related to a suitability score for a specific purpose required by the decision-maker or
analyst. For example, a trapezoidal linear function may be used to model a preference of
housing location, for example, corresponding to the level of spatial accessibility to a major
airport. Data conversion procedures using linear transformation functions are necessary;
yet do not eliminate the possibility of using nonlinear and more realistic functions to
represent meaningful decision-maker preferences.
2.5.3. The Attribute Tree
The first step in creating an LSP suitability map involves the construction of an
attribute tree that organizes the decision problem and contains all the relevant attributes.
Within the structure of the attribute tree, elementary criteria are defined by problem
domain and with qualities of decision logic. All attributes that share a similarity or
relationship within the decision problem are grouped accordingly. Structuring the decision
problem facilitates the mathematical aggregation of criteria.
2.5.4. The Aggregation Structure
The second step involves selecting an appropriate aggregation structure to combine
criteria. Elementary criteria structured within the attribute tree described above are fed
into a user designed aggregation structure. The structure employs LSP aggregators based
in the GCD function and implemented using the WPM. The aggregation structure combines
criteria according to the categorization of the attribute tree. Categorically grouped inputs

31
are then aggregated. Aggregation structure design is relatively arbitrary and dependant on
the application domain. A CAS may be used as a template to model decision making. Each
elementary criterion is then aggregated in sequence determined by the attribute tree and
aggregation structure resulting in a suitability map. Each location in the study area given a
suitability score measured on a continuous scale (0 to 1, or 0% - 100%).
2.6. The Case Study - GIS-LSP Prototype
The Municipality of Bowen Island, BC, Canada was chosen as a test study site for
the implementation of the GIS-LSP method. The Idrisi Taiga GIS software (Clark Labs
2012) was used given its raster-based functionalities.
2.6.1. Study Area and Datasets
Bowen Island (Figure 2-2) is comprised of over 5050 hectares of rugged bedrock-
dominated terrain situated at the entrance of Howe Sound, Canada (Block 1978). It is in
close proximity to the fast growing and densely populated Metro Vancouver Region and is a
popular location for vacation cottages and outdoor recreation (Bowen Island Municipality
2002). Under the pressures of intensified residential development, Bowen Island has
experienced significant changes in its natural environments. Raster GIS data sets used in
this study were acquired from Hectares BC (2012), a collaborative pilot project between The
Nature Conservancy of Canada and Biodiversity BC. Layers used for the development of
the elementary criteria included a digital elevation model (DEM), roads, and land-use. The
extent of the study area under analysis was a 14 x 14 km area encompassing Bowen Island
Municipality.

32
Figure 2-2. Map of Bowen Island Municipality with surface elevation visualized as shaded relief
2.6.2. Step 1. Elementary Criteria Definition
Six input criteria were selected for the GIS-LSP prototype and developed using GIS
operations, namely (i) slope, (ii) aspect, (iii) road access, (iv) water access, (v) ferry terminal
access, and (vi) park access. Development on Bowen Island favors vacation cottages and
seasonal homes. While the set of factors is not comprehensive they serve the purpose of
testing the GIS-LSP approach. The input layers are summarized and justified below in
Table 2-1. Additional factors that may be useful may be view shed, terrain, and soil
drainage. Municipal planning documents could be used as a means of developing highly
detailed suitability maps that account for bylaws that determine the nature of development
in different locations based on environmental, economic, or social planning objectives.

33
The input criteria used for the LSP evaluation were derived from GIS data and
standardized. Slope and aspect were obtained from a DEM data set. The road access, ferry
terminal access, and park access were obtained through the application of a raster-based
GIS Euclidian distance function. Linear trapezoidal functions were applied in the
fuzzification of data measurements for the purpose of representing suitability. As this study
investigates novel methodological approaches, criteria variables were chosen arbitrarily.
The descriptions and justifications for the selected functions are summarized in Table 2-1
in the following section. Figure 2-3 shows the functions applied to the GIS raster data sets,
and Figure 2-4 shows the series of individual criteria input layers used in this study.
Figure 2-3. Fuzzy transformation functions for criteria definition. Under the ASPECT function the variable -1 refers to level ground or locations without a measurable
degree of slope.

34
Figure 2-4. Elementary criteria maps: (i) slope, (ii) aspect, (iii) road access, (iv) park access, (v) coast access, and (vi) ferry terminal access.

35
2.6.3. Step 2. Attribute Tree
To structure the decision problem, the criteria were arranged hierarchically into an
attribute tree and first grouped according to problem domain (Table 2-1). Three domain
categories were designed: (i) site, (ii) transportation and (iii) amenities. Slope and Aspect are
grouped under site; ferry terminal access, and road access are grouped under transportation;
and coast access and park access are arranged under the amenities category.
Logical requirement Category Criteria
Mandatory Site(+) Slope (+): 0 - 30 degrees = 100%, 40 degrees = 0%; Reflects the relative costs of residential development on steep graded slopes as opposed to level surfaces. Slopes from level (0 degrees) up to 30 degrees are considered suitable, with monotonically decreasing suitability to 40 degrees. Grades above 40 degrees are considered too costly and unsuitable. Aspect (-) : 0 degrees – 45 degrees = 0%, 135 degrees – 225 degrees = 100%, 315 degrees – 360 degrees = 0%; Reflects the desirability of south-facing sites for development for the objective of maximizing sunlight exposure. Aspect refers to the direction in which a slope faces measured in decimal degrees (180 degrees = south).
Transportation(+) Road access (+): 0m = 0%,100 m – 250m = 100%, 500m = 0%; Locations adjacent to road features are unsuitable with increased suitability to 100m. Car ownership is high in the municipality and many residents use them daily for their commute. Areas with the highest suitability are areas within 100m and 250m of roads with monotonically decreasing suitability from 250 to 500 m. Areas at a distance of 500m are the least suitable and locations beyond that distance are considered unsuitable. Ferry terminal access(+): 0km = 0%, 0.5km – 2km = 100%, 10km = 0% Locations with a greater access to the ferry terminal under 0.5 km are less suitable and coincide with higher noise and traffic levels. Locations between 0.5 and 2km are highly suitable. Distances beyond 2km decrease in suitability to a maximum of 10 km. Distances farther than 10km are considered unsuitable. The ferry terminal is the Municipality’s link to Metro Vancouver for residential commuters.
Optional Amenities(-) Park access(-): 0m – 200m = 100%, 2km = 0% Reflects a desirability of sites with access to parks for recreational purposes. Locations within walking distance (0m -100m) are valued higher than areas at a greater distance that would require cycling or motor vehicles.

36
Coast access(-): 0m -100m = 100%, 2km = 0% Relates to the desirability and value placed on residential locations with access to coastlines and related amenities. Locations adjacent to the coast are considered high risk in terms of home construction, with increasing suitability up to 100m. Locations ranging from 100 m to 200 m represent optimal distances with a gradual decrease in suitability up to 2km.
Table 2-1. Attribute tree
Criteria were then grouped by the nature of logical requirements. Three of the four
criteria contained in the subcategories site and transportation were classified with
mandatory requirements. Any unsuitable (0) location within the mandatory elementary
criteria was expected to remain unsuitable in the final evaluation score. It is important to
note that aspect however, was classified as optional under the mandatory site category.
Mandatory and optional inputs are denoted in Table 2-1 with (+) and (-) respectively. While
the elementary criteria Aspect is optional it also falls under the mandatory Site category.
Logically asymmetrical inputs are allowable and in this case aggregation is facilitated with
a conjunctive partial absorption (CPA) operator resulting in a mandatory Site output (see
Figure 2-5).
Criteria that were grouped under the amenities category were classified as optional.
Coast access and park access refer to the value placed on locations in proximity to areas
with a high aesthetic value. Because they are optional, a null or low value is not necessarily
expected to return a 0 or low score in the comprehensive suitability score. If a number of
mandatory criteria are satisfied in a particular location, a low suitability score in an
optional criteria coinciding with this location will not negatively affect the score in that
location.

37
2.6.4. Step 3. Aggregation structure
A series of connected LSP aggregators were implemented with the WPM to
mathematically combine each elementary criteria into a comprehensive suitability score.
Parameter values r correspond to the different levels of modeled logical requirements and
are as follows: -3.510 (C+ or hard partial conjunction); 1 (A or mean average); and 9.521 (D+
or hard partial disjunction). The land-use suitability assessment was conducted using an
aggregated mandatory/optional CAS and used as a template for modeling the decision
problem. This form of CAS was selected due to (1) the small amount of criteria, and (1) the
need to aggregate mandatory and optional criteria (Dujmović & De Tré 2011).
First the categories by defined by problem domain were aggregated. The park access
and coast access categories were aggregated using an LSP aggregator representing SPD (D-
) to reflect the optional/replaceable nature of these inputs. The road and ferry access
criteria were aggregated with a HPC (CA) aggregator reflecting a mandatory requirement.
Aggregation of the slope and aspect criteria was accomplished with the application of a CPA
structure built from a neutral aggregator (A) and a HPC aggregator (CA). In this case, the
full satisfaction of the optional criteria (aspect) augments the non-zero score of the
mandatory criteria with a reward, and a null aspect score assigns a penalty to the
mandatory criteria. Ultimately, if the mandatory criterion (slope) is not satisfied, the
optional criterion has no compensatory power, and the aggregator returns a zero value. The
final aggregator applied is another CPA structure to combine the mandatory and optional
categories using the A and C+ aggregators. The LSP aggregation structure is presented in
Figure 2-5. The gradual increase in logical strength (from weaker to stronger requirements)
in this aggregation structure is consistent with the theoretical shadow of aggregation logic.
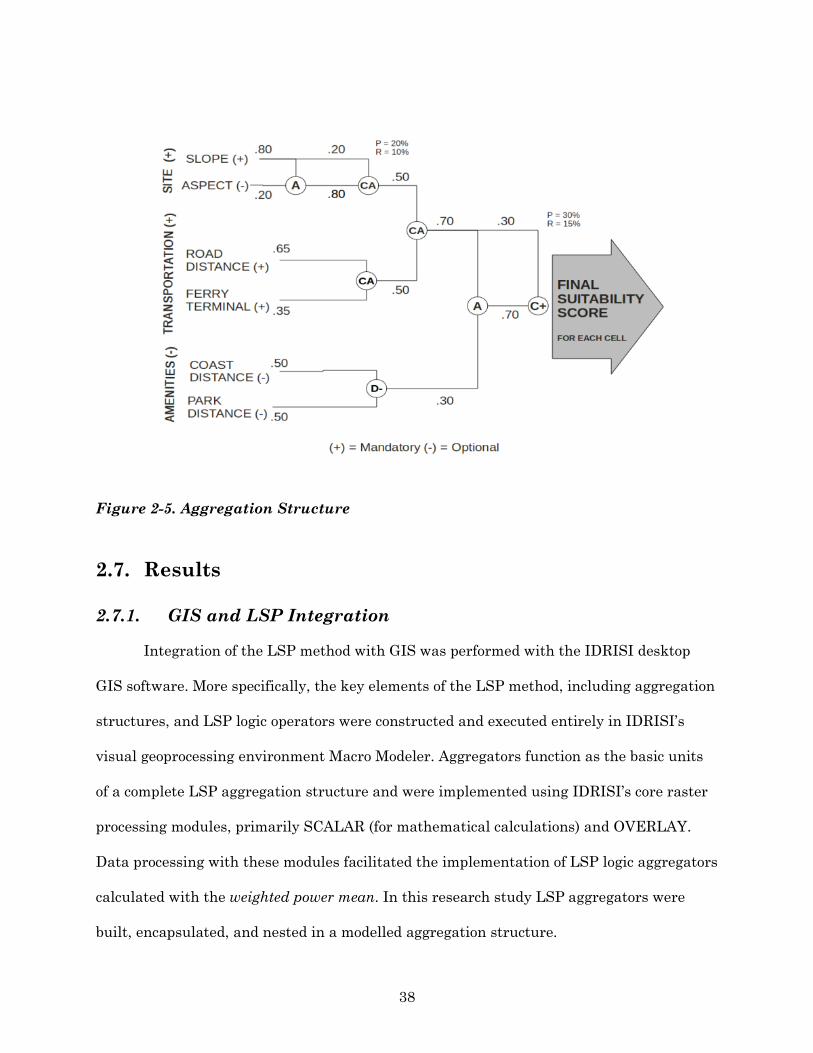
38
Figure 2-5. Aggregation Structure
2.7. Results
2.7.1. GIS and LSP Integration
Integration of the LSP method with GIS was performed with the IDRISI desktop
GIS software. More specifically, the key elements of the LSP method, including aggregation
structures, and LSP logic operators were constructed and executed entirely in IDRISI’s
visual geoprocessing environment Macro Modeler. Aggregators function as the basic units
of a complete LSP aggregation structure and were implemented using IDRISI’s core raster
processing modules, primarily SCALAR (for mathematical calculations) and OVERLAY.
Data processing with these modules facilitated the implementation of LSP logic aggregators
calculated with the weighted power mean. In this research study LSP aggregators were
built, encapsulated, and nested in a modelled aggregation structure.

39
Figure 4-1 below details the basic design of the LSP aggregator and arrangement in
a modeled aggregation structure. The first diagram (i) shows an IDRISI Macro Model of an
LSP aggregation structure. The second diagram (ii) depicts the arrangement of a nested
LSP aggregator calculated with a weighted power mean where r represents logical strength,
x is an input layer, w is the weight parameter, and S is the calculated suitability score.
As the modules used are by no means unique to IDRISI, integration may be
performed similarly in other common raster GIS Desktop environments (ESRI, ArcGIS,
GRASS, etc.).

40
Figure 2-6. Integration of LSP in IDRISI's Macro Modeler environment
2.7.2. LSP suitability map output
Following the stepwise nonlinear aggregation of each of the raster criteria layers, a
LSP suitability map was generated (Figure 2-6). Each location was assigned a suitability
score ranging from 0 to 1. The resulting map based in logic requirements displays regions
that are scored and regions that are unsuitable (0%).
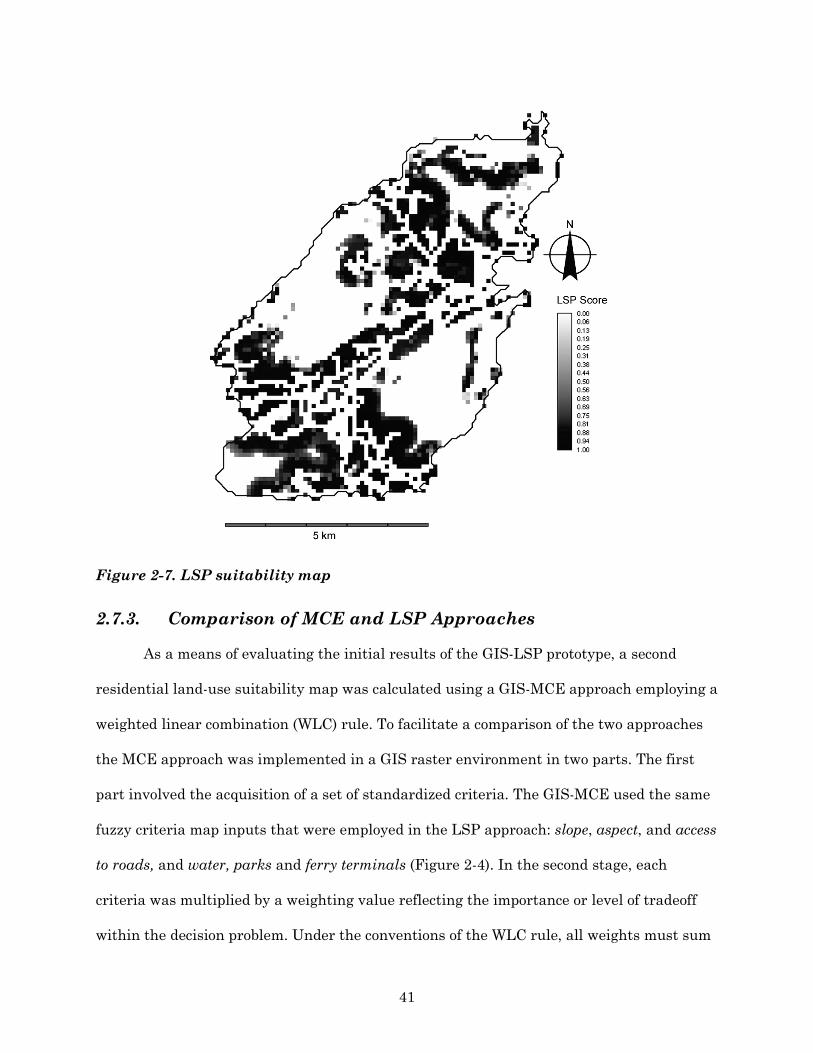
41
Figure 2-7. LSP suitability map
2.7.3. Comparison of MCE and LSP Approaches
As a means of evaluating the initial results of the GIS-LSP prototype, a second
residential land-use suitability map was calculated using a GIS-MCE approach employing a
weighted linear combination (WLC) rule. To facilitate a comparison of the two approaches
the MCE approach was implemented in a GIS raster environment in two parts. The first
part involved the acquisition of a set of standardized criteria. The GIS-MCE used the same
fuzzy criteria map inputs that were employed in the LSP approach: slope, aspect, and access
to roads, and water, parks and ferry terminals (Figure 2-4). In the second stage, each
criteria was multiplied by a weighting value reflecting the importance or level of tradeoff
within the decision problem. Under the conventions of the WLC rule, all weights must sum

42
to unity. The assigned weights were selected for each criteria layer: slope (.30), aspect (.10),
road access (.30), coast access (.15), park access (.05), ferry terminal access (.10). A diagram
of the GIS-MCE structure is shown in Figure 2-6. Following the application of weights the
criteria were summed, resulting in a comprehensive MCE suitability map and presented in
Figure 2-7

43
Figure 2-8. MCE diagram
Figure 2-9. MCE suitability map

44
The results demonstrate that the LSP approach can be integrated within a raster
GIS framework and can be used to create a land-use suitability map. The question remains:
do LSP suitability maps outperform their MCE counterparts? In addressing this question it
must be considered that LSP and MCE approaches employ different conceptualizations of
human decision-making. Because of this fact the two approaches will yield very different
measurements of suitability. MCE approaches assume all inputs are non-mandatory,
whereas the LSP approach considers inputs as mandatory or non-mandatory. The LSP
suitability map illustrates specific advantages in terms of (1) logical expression and (2)
aggregation efficiency.
A map comparing the LSP suitability map and the MCE suitability map results is
presented in Figure 2-9 below. A visual comparison of the outcomes of the LSP and MCE
procedures demonstrate significant differences in the selective power of LSP. Many
locations (1715 hectares total) in the LSP suitability map are unsuitable compared to
identical locations in the MCE output. This is expected under the logical mandatory
conditions stated in the LSP aggregation structure: any low or null mandatory input will
result in a resulting low or null score in the output. The input criteria in the MCE are
uniformly treated as non-mandatory, which implies that any location that is not satisfied
by an input may still be considered suitable. Some areas in the MCE suitability map are
scored as high as 50% whereas the same locations are unsuitable in the LSP suitability
map. LSP excludes locations based on mandatory conditions and is therefore a more
realistic model of decision-making that voices logical requirements.

45
Figure 2-9. A comparison of LSP and MCE suitability map results Locations 1-3 indicated on this map are described in detail in Table 2-2
The LSP and MCE suitability maps also differ in their representation of areas
classified as suitable. The LSP map displays 900 hectares scoring greater than 90% and the
MCE ranks only 185 hectares above 90%. This difference in the LSP suitability map is
attributed primarily to the method of aggregation. In the LSP approach inputs are
hierarchically categorized and combined in stages. The results also reflect the relationships
based on logical requirements. For example, the inputs grouped under transportation and
site were combined with strong conjunctive aggregators; areas that contain a measure of
satisfaction of all these factors simultaneously will yield a greater suitability score in the
final outcome. It is important to note that factors such as coastline access and park access
are treated as optional and their level of non-satisfaction does not negatively impact
locations with high-scoring mandatory inputs.

46
The MCE approach simply combines and averages all six inputs without conditions.
In this case the global suitability score is primarily affected by the use of a weighting
system (WLC) that must be distributed among all six criteria. The impact of some inputs
will necessarily suffer from a loss of significance. The high scoring areas in MCE/WLC
maps are more influenced by idempotency, or the coinciding location of high ranking scores
in all inputs (Dujmović and Scheer 2010). This principle explains the results from the MCE
procedure.
Table 2-2 compares the input and output scores used in both models that
characterize three different locations. In location 1, the MCE and LSP methods return
similarly high scores (91% and 99% respectively). The high score awarded by the LSP
analysis results from satisfaction of all three mandatory inputs. The MCE score (91%) is a
result of the principle of idempotency described above. In location 2, The LSP analysis
returns a 0% score and the MCE procedure scores this location differently at 50%. The
unsuitable score given by the LSP analysis reflects the mandatory requirement of the slope
input. This criteria was not satisfied simultaneously with the other mandatory inputs. In
Location 3 the LSP suitability score returned a 90% compared to an 83% score assessed
with MCE. Again, The LSP score is derived from a measure of satisfaction of the mandatory
inputs. The lower MCE score reflects the negative impact of the lower scores attributed to
negative impact of the logically optional aspect criteria.

47
Mandatory Optional Output criteria Slope Road
access Ferry access
Coast access
Park access
Aspect LSP MCE
Location 1 100% 100% 93% 41% 100% 100% 99% 91% Location 2 0% 100% 76% 0% 49% 100% 0% 50% Location 3 100% 100% 100% 100% 100% 0% 90% 83%
Table 2-2. Input scores and comprehensive scores for the LSP and MCE suitability maps.
Locations 1 -3 are indicated in Figure 2-9
The quality of a suitability map is related to how well it reflects the needs and
objectives of the decision-maker. A comparison of the two suitability maps suggests that
MCE procedures lack the mathematical sophistication for modeling human reasoning in a
realistic way. LSP suitability maps outperform MCE/WLC maps in this respect. Ultimately,
an assessment of any suitability map requires the user to perform a visual check to validate
the map (Dujmović & Scheer 2010). Modifying the strength of logic aggregators and
aggregation structure will influence the suitability map outcomes. Therefore an LSP map
will benefit from a sensitivity analysis procedure to maximize its usefulness.
2.8. Conclusion
The selection of logic qualifiers and aggregators is highly subjective and unique to
the decision problem and expertise of the decision-maker. Model output is sensitive to the
decision-makers choice of aggregation structure, weights, and aggregators used. While the
MCE has a very intuitive way of combining criteria, the LSP model is not as readily
accessible and requires specialized training for effective use. As an academic prototype, the
GIS-LSP approach functions as a means of exploring the mechanics and possibilities of
LSP. The approach merits further development in terms of criteria design. Municipal

48
planning documents could be used as a means of developing highly detailed suitability
maps that account for bylaws that determine the nature of development in different
locations based on environmental, economic, or social planning objectives.
In this study it has been demonstrated that the LSP approach and GIS can be
integrated. A GIS-LSP approach was successfully tested on geospatial data for land-use
suitability analysis. Additionally, the LSP approach addresses the limitations of MCE and
the WLC through the application of modeled logic requirements resulting in more selective
and detailed suitability maps. The LSP approach offers many possibilities to explore highly
complex relationships among factors and multiple objectives in the analysis of complex
land-use suitability problems.
2.9. Acknowledgements
The Natural Sciences and Engineering Research Council (NSERC) of Canada
provided full support of this study under a Research Discovery Grant awarded to Dr.
Suzana Dragićević. Special thanks to Biodiversity BC and the Nature Conservancy of
Canada for providing the data sets used in this research study through the collaborative
pilot project Hectares BC.
2.10. References
Aceves-Quesada, J.F., Diaz-Salgado, J. & Lopez-Blanco, J., 2007. Vulnerability assessment in a volcanic risk evaluation in Central Mexico through a multi-criteria-GIS approach. Natural Hazards, 40(2), pp.339–356.
Block, J., 1978. Bowen Island: A Resource Analysis for Land Use Planning, Victoria, B.C: Islands Trust, Ministry of Municipal Affairs and Housing.
HectaresBC, 2012. Data Catalogue. Biodiversity BC, and the Nature Conservancy of Canada, Available at: http:// www.hectaresbc.org [Accessed August 4, 2012]

49
Carver, S.J., 1991. Integrating multi-criteria evaluation with geographical information systems. International Journal of Geographical Information Systems, 5(3), p.321-339
Ceballos-Silva, A. & Lopez-Blanco, J., 2003. Evaluating biophysical variables to identify suitable areas for oat in Central Mexico: A multi-criteria and GIS approach. Agriculture, Ecosystems and Environment, 95(1), pp.371–377.
Church, R.L. et al., 2000. Support system development for forest ecosystem management. European Journal of Operational Research, 121(2), pp.247-258.
Densham, P., 1991. Spatial Decision Support Systems. In Longman, pp. 403-412.
Dujmović, J.J. 1979. Partial Absorption Function. Journal of the University of Belgrade, EE Dept., Series Mathematics and Physics, No. 659, pp 156-163.
Dujmovic, J.J., 2008. Characteristic forms of generalized conjunction/disjunction. In IEEE International Conference on Fuzzy Systems, 2008. FUZZ-IEEE 2008. (IEEE World Congress on Computational Intelligence). IEEE International Conference on Fuzzy Systems, 2008. FUZZ-IEEE 2008. (IEEE World Congress on Computational Intelligence). IEEE, pp. 1075–1080.
Dujmović, J.J.& Nagashima, H., 2006. LSP method and its use for evaluation of Java IDEs. International Journal of Approximate Reasoning, 41(1), pp.3-22.
Dujmović, J.J. & Larsen, H.L., 2007. Generalized conjunction/disjunction. International Journal of Approximate Reasoning, 46(3), pp.423-446.
Dujmovic, J.J. & Scheer, D., 2010. Logic aggregation of suitability maps. In IEEE, pp. 1-8.
Dujmović, J.J., De Tré, G.D. & Dragićević, S., 2009. Comparison of Multicriteria Methods for Land-use Suitability Assessment. IFSA World Congress 8 EVSFLAT Conference, Lisbon, Portugal. Pp. 1404-1409.
Dujmović, J.J., De Tré, G. & Weghe, N., 2009. LSP suitability maps. Soft Computing, 14(5), pp.421–434.
Dujmović, J.J. & De Tré, G.D., 2011. Multicriteria methods and logic aggregation in suitability maps. International Journal of Intelligent Systems, 26(10), pp.971–1001.
Eastman, J.R. et al., 1995. Raster Procedures for Multi-Criteria/Multi-Objective Decisions. Photogrammetric Engineering and Remote Sensing (PE&RS), 61(5), pp.539-547.
Goodchild, M., 1987. A spatial analytical perspective on geographical information systems. International Journal of Geographical Information Science, 1(4), pp.327-334.
Hill, M.J. et al., 2005. Multi-criteria decision analysis in spatial decision support: the ASSESS analytic hierarchy process and the role of quantitative methods and spatially explicit analysis. Environmental Modeling & Software, 20(7), pp.955-976.
Hopkins, L., 1977. Methods for Generating Land Suitability Maps: A Comparative Evaluation. Journal of the American Planning Association, 43(4), pp.386-400.

50
Jankowski, P., 1995. Integrating geographical information systems and multiple criteria decision-making methods. International Journal of Geographical Information Science, 9(3), pp.251–273.
Joerin, F., Theriault, M. & Musy, A., 2001. Using GIS and outranking multicriteria analysis for land-use suitability assessment. International Journal of Geographical Information Science, 15(2), pp.153-174.
Malczewski, J., 1999. GIS and Multicriteria Decision Analysis, New York: John Wiley. 576p.
Malczewski, J., 2000. On the Use of Weighted Linear Combination Method in GIS: Common and Best Practice Approaches. Transactions in GIS, 4(1), pp.5–22.
Malczewski, J., 2010. Multiple Criteria Decision Analysis and Geographic Information Systems. In M. Ehrgott, J. R. Figueira, & S. Greco, eds. Boston, MA: Springer US, pp. 369-395
Malczewski, J., 2006. Ordered weighted averaging with fuzzy quantifiers: GIS-based multicriteria evaluation for land-use suitability analysis. International Journal of Applied Earth Observation and Geoinformation, 8(4), pp.270-277.
Pettit, C. & Pullar, D., 1999. An integrated planning tool based upon multiple criteria evaluation of spatial information. Computers, Environment and Urban Systems, 23(5), pp.339-357.
Phua, M.-H. & Minowa, M., 2005. A GIS-based multi-criteria decision making approach to forest conservation planning at a landscape scale: a case study in the Kinabalu Area, Sabah, Malaysia. Landscape and Urban Planning, 71(2-4), pp.207-222.
Proctor, W. & Drechsler, M., 2006. Deliberative multicriteria evaluation. Environment and Planning C: Government and Policy, 24(2), pp.169–190
Rinner, C. & Taranu, J.P., 2006. Map-based exploratory evaluation of non-medical determinants of population health. Transactions in GIS, 10(4), pp.633–649.
Robinson, V.B. Fuzzy Sets and Spatial Analysis. In The Sage Handbook of Spatial Analysis. eds. P. Rogerson and S. Fotheringham, Sage Publishing. pp.204-219.
Rybarczyk, G. & Wu, C., 2010. Bicycle facility planning using GIS and multi-criteria decision analysis. Applied Geography, 30(2), pp.282–293.
SEAS. 2012. LSPmap. Available at: http://www.seas.com/LSPmap/index2.php [Accessed August 23, 2012].
Store, R. & Kangas, J., 2001. Integrating spatial multi-criteria evaluation and expert knowledge for GIS-based habitat suitability modelling. Landscape and Urban Planning, 55(2), pp.79–93.

51
De Tré, G., Dujmovic, J. & Van De Weghe, N., 2009. Supporting Spatial Decision Making by Means of Suitability Maps. In J. Kacprzyk, F.E. Petry & A. Yazici, eds. Uncertainty Approaches for Spatial Data Modeling and Processing. Berlin, Heidelberg: Springer Berlin Heidelberg, pp. 9-27.
De Tré, G. et al., 2009. Heterogeneous bipolar criteria satisfaction handling in geographical decision support systems: an LSP based approach. In Proceedings of the 2009 ACM symposium on Applied Computing. SAC ’09. Honolulu, Hawaii: ACM, pp. 1704–1708.
Wood, L. & Dragićević, S., 2007. GIS-Based Multicriteria Evaluation and Fuzzy Sets to Identify Priority Sites for Marine Protection. Biodiversity and Conservation, 16(9), pp.2539-2558.

52
3. Chapter 3: Urban Growth Simulations with Logic Scoring of Preference Method and Cellular Automata
3.1. Abstract
Geospatial modeling approaches using linear additive rules, such as multicriteria
evaluation (MCE) are used to compliment cellular automata (CA)-based urban growth
models. Such approaches have limitations with respect to the expression of decision logic
and the allowable number of factor inputs. The Logic Scoring of Preference (LSP) approach
exhibits unique aggregation capabilities that allow numerous inputs without loss of
significance and the expression of continuous decision logic such as ANDness and ORness.
The main objective was to use the LSP approach as an input for an urban CA. Integration
of the LSP approach with geographic information systems (GIS) and CA techniques were
developed and implemented. Geospatial datasets of the City of Nanaimo, Canada were used
as a case study to develop, implement and test the model. Several simulation scenarios
were developed to predict urban growth (i) transportation oriented, (ii) growth in
environmentally sensitive areas, (iii) compact growth, (iv) accelerated and slow dynamics,
and (v) asynchronous growth. Map comparisons of simulation results demonstrate that CA
is highly sensitive to different LSP parameterization. Results obtained from the LSP-CA
approach has demonstrated improvement over existing MCE-CA modeling approaches
A version of this chapter is in preparation to be submitted to Transactions in GIS under title: An Integrated Logic Scoring of Preference and Cellular Automata Approach for Urban Growth Simulation and coauthored with S. Dragićević

53
3.2. Introduction
The science of complexity and its body of theory provides a framework for explaining
and understanding real world natural and social systems. Complex phenomena exhibit
properties such as hierarchical aggregate structures, emergence, path dependence, self-
organization, chaos-oriented behaviour, and geometric signatures (such as fractals)
(Manson 2001). Complexity science offers a universality that has attracted the attention of
researchers a range of disciplines in the social and physical sciences (O’Sullivan 2009). A
central concern in complexity studies is the concept of global structures that evolve from
individual autonomous units. This particular behaviour of complex systems is termed
“bottom-up,” as opposed to “top-down,” as illustrated in applications of complex system
modeling approaches (White & Engelen 2000).
The concept of localized “bottom-up” processes giving rise to the generation of larger
scale pattern and structure has been embraced by researchers for the purpose of studying
urban and regional systems (Torrens & Benenson 2005). Complexity science offers a
powerful framework for analyzing urban systems characterized by unstable nonlinear
growth rooted in the individual actions of households, developers and the configuration of
different land uses (Batty 2005). Studying urban growth is a difficult task given the limits
of geographical and temporal scales. For this reason, computational simulation models are
well suited for the study of complex urban and regional systems.
A two-dimensional cellular automaton is a common approach for modeling cities as
complex spatial systems (Santé et al. 2010). CA are self-reproducing computational
structures used to present as Toffoli and Margolus (1987) assert, a “stylized” depiction of
the universe. Each individual unit or cell is assigned a state that changes or remains
unchanged as a result of simple rules based on the collective states of neighbouring cells. A
54
classical CA introduced by mathematician John Conway known as the “Game of Life”
requires a regular lattice of cells, a neighbourhood function, a temporal element, in addition
to cell states and transition rules (Gardner 1970). Cellular automata simulation applied to
geographical systems was first pioneered by Tobler (1970), however, Lathrop and Hamburg
(1965) and Chapin and Weiss (1968) theorized CA-like approaches for urban modeling (as
cited by Batty 1997). The past few decades have seen much of the development of
Geographic CA in urban systems research (Torrens & Benenson 2005). CA has been used
to caricature social and structural systems by presenting a hypothetical image of how cities,
regions and social structures self-organize in geographic space. Semboloni (1997) modeled
the hypothetical development and evolution of human settlements. Portugali, et al., (1994)
developed a spatial cellular automata system designed to represent dynamic social
aggregation in an urban system. Researchers began simulating fractal (self-similarity at
different scales) morphologies seen in real cities (M. Batty & Xie 1996; White & Engelen
1993; White & Engelen 1994). The “classical” “Game of Life” structure is generally too
rigid, requiring modification in order to represent and model phenomena that operate
within diverse and richly patterned geographic landscapes (Couclelis 1985). In an attempt
to capture the growth of real urban systems CA has been used in conjunction with
geospatial datasets and geographic information systems (GIS).
GIS is used for the management, creation, storage, analysis and visualization of
geospatial data (Goodchild & Haining 2004). Raster based GIS offers many features to
enhance CA models with the necessary realism to represent urban growth. Most
importantly, the raster data structure, and neighbourhood functions are routine, universal
GIS operations and are compatible with the requirements of CA (White & Englen 2000). In
addition to compatibility, high resolution data in the form of remotely sensed images

55
contain a wealth of information needed to represent the conditions of real study areas
(White & Engelen 1994). GIS based CA models have been used extensively since the 1990's
to model urban growth. White et al. (1997) simulated development in Cincinnati, OH, USA
using historical GIS datasets. Batty et al.’s (1999) work with a standalone CA simulation
system was used to simulate growth and decline in North American Rust Belt cities. The
SLEUTH CA simulation modeling system was also developed to simulate historical
patterns of growth in the San Francisco Region using multiple layers of geospatial data
(Clarke et al. 1997). GIS and CA structures have been prototyped as a part of Spatial
Decision Support Systems (SDSSs) featuring different types of configurations and applied
to different regions globally. A multi-scale simulation and decision-support system was
developed to simulate regional growth in The Netherlands (White & Engelen 2000). Ward
et. al. (2003) approach combined spatial optimization and CA for modeling sustainable
development in Australia. Optimization and CA were also coupled recently to study policy
surrounding industrial development in a rapidly growing region in China (Li et al. 2011).
Stanilov and Batty (2011) have also used CA as an approach to discover pre-existing
conditions for urban growth using London as a case study.
Additionally a variety of techniques has been applied for developing improved
transition rules including artificial neural networks (Li & Yeh 2001; Yeh & Li 2003;
Almeida et al. 2008), and ant colony optimization (Liu et al. 2007). Multicriteria Evaluation
(MCE) based transition rules were used to model different growth scenarios in a rural
region in China (Wu & Webster 1998). MCE offers the advantages of a rich body of applied
research in the geographic information science literature, and a conceptually simple
structure.

56
MCE is a GIS-based approach for modeling human decision-making, preferences and
suitability for a given purpose with in a geographic study area (Malczewski 1999).
Suitability analysis using MCE can be approached to create a suitability map ranking all
locations in a study area from “most suitable” to “least suitable.” Alternatively MCE can be
used to map only the “optimal locations” based on a score threshold or a required number of
top ranked locations (Eastman et al. 1995). While many variations of MCE exist in the
literature, for the purposes of this article, the MCE approach uses raster GIS data model
and, mathematically operates on continuous or fuzzy data inputs (Jiang & Eastman 2000;
Malczewski 2002). GIS-MCE integrated approaches for suitability analysis were supported
by many researchers in the 1990s (Carver 1991; Laaribi et al. 1996; Jankowski 1995).
Linked GIS and MCE approaches have been used as a means for studying and
understanding a range of environmental issues such as marine resources management
conflicts (Wood & Dragićević 2007), and defining wilderness regions (Comber et al. 2010).
MCE methods have been applied towards facilitating multi-stakeholder group decision-
making (Boroushaki & Malczewski 2010) and public participation in institutional planning
processes (Bailey & Grossardt 2010).
Despite its advantages MCE has two significant issues that create problems with
interpreting the meaning of results. In discussing these issues it is important to introduce
the generic MCE decision rule known as the weighted linear combination rule, or WLC:
∑∑==
==<<=n
ii
n
iiii wniwxwS
111,,...,1,10, (eq. 3-1)
Where S is the global suitability, w is the cardinal weight, and x is the factor
variable. The first limitation relates to number of input factors that may be aggregated

57
(Dujmović et al. 2009). Each factor input representing a unique suitability is assigned a
cardinal weight (the total of all weights must sum to unity). The user manipulates weight
parameters representing the importance of each input layer relative to one another to
define a problem and produce a desired end result. This quality known as “tradeoff” is the
most important aspect of MCE; by manipulating factor weights, a different suitability maps
may be created. Tradeoff is an important feature for generating MCE transition rules; if
linked to a CA, an MCE system may be used to develop different initial conditions for the
purposes of generating alternative urban growth scenarios. It must be noted that as the
number of MCE inputs increase their individual significance within the system decreases
(Dujmović & De Tré 2011). Despite the conceptual simplicity of factor tradeoff, the
restriction on the number of inputs places constraints on representing the richness and
complexity of a geographic region needed for spatial decision-making and analysis. Urban
growth is a very complex and layered process operating on different scales with a multitude
of factors. If the allowable inputs are limited or overloaded, a MCE-driven urban CA runs
the risk of producing erroneous or unrealistic results.
The second problem lies in the logic implied by the linear additive rule. Typically
logic is expressed in binary terms with Boolean AND, and OR to query and select
observations or locations from a data based on conditions. AND functions mathematically
like multiplication, and OR operates much like addition; the former is much more
restrictive, while the latter is permissive. The WLC rule integral to MCE expresses an
“average” logic that is neither AND nor OR. The sacrifice of logic is necessary for the
existence of the tradeoff feature. As a result, suitability indices produced with “average”
logic do not have the realism required to represent real decision problems (De Tré, et al.

58
2009). Decision making requires the expression of mandatory (ANDness) or optional
(ORness) conditions of decision factors.
In Wu and Webster's (1998) urban modeling approach employing MCE, a structure
was applied to the suitability layer to influence the performance of the CA model. A
nonlinear scaling function applied with different strengths via a user selected coefficient.
By increasing or decreasing the coefficient, the areas of higher suitability were amplified,
increasing or decreasing the selectivity of the CA. It is believed that this scaling function
was necessary to overcome MCE's methodological shortcomings as an input to a CA.
Therefore the objective of this study is to develop an urban GIS-based CA model that
overcomes the limitations of the existing MCE-CA approach for developing transition rules
through the application of an alternative suitability modeling approach, the Logic Scoring
of Preference (LSP). LSP is a soft computing approach developed originally for software
evaluation (Dujmović & Nagashima 2006). The approach has recently been applied to site
suitability problems, yet has not been integrated with in a GIS framework (De Tré et al.
2009; Dujmović et al. 2009). To address the methodological problems with MCE derived
transition rules, LSP was used because of (i) its ability to aggregate an unlimited amount of
inputs, and (ii) express a wide range of flexible logic conditions between AND and OR. LSP
offers users the manipulation of more inputs allowable than MCE, and the addition of
logical operators without sacrificing the expressive power of a tradeoff parameterization.
LSP logic operators are more efficient for affecting the selectivity of CA models and do not
require additional procedures such as scaling functions to increase the performance and
selective behaviour of the CA.
This study reports on a LSP-CA integrated model that was developed for the
purpose of testing the utility of LSP in formulating transition rules for urban CA. Different

59
urban growth scenarios were created using a database representation of The City of
Nanaimo, BC, Canada.
3.3. LSP Theoretical Background
LSP refers to a set of methods used for system evaluation and comparison using
logic that is observed in human decision-making processes that are based intuitively on
preference requirements (Dujmović 2007). A decision between two or more alternatives
involves an assessment of how mandatory or optional the factors are. The following
example illustrates the concept of logic requirements that are fundamental to the LSP
approach.
The requirements used in evaluating for example numerous parcels for the
institutional acquisition of land for a given purpose are evaluated in terms of slope and
directional orientation. The measured slope of different locations necessitates a narrow
range of requirements in order to keep building costs down. The slope requirement is
therefore considered mandatory. A location with unsuitable slope conditions is disqualified
as a choice alternative. Additionally each candidate location permits the proposed facility to
be built in a particular directional orientation. While the developers favor a south-facing
orientation, an alternative orientation is just as acceptable. In this example orientation is
optional and different locations are replaceable.
The significance of the LSP approach lies in its ability to model fuzzy conditional
requirements. Conditional logic is traditionally represented by Boolean AND and OR.
Mandatory conditions are modeled with AND and optional or replaceable conditions are
modeled with OR. LSP permits a fuzzy definition of requirements; mandatory requirements
can be expressed as a degree of ANDness, and optional requirements may be represented

60
with a corresponding degree of ORness. Furthermore, requirements can be conceptualized
as a spectrum of conditions between AND and OR. This implies that a requirement
representing a high degree of ANDness is also expressing a low degree of ORness, and vice-
versa.
The LSP approach handles fuzzy logic requirements mathematically using an
application of the Generalized Conjunction Disjunction (GCD) function. The GCD function
can be used to generate an average value of a series of inputs while imposing logic
requirements. The GCD function is implemented using the weighted power mean (WPM) as
follows (Dujmović et al. 2009):
GCD(s1 … sn) = (W1s1r + … + Wn snr)1/r (eq. 3-2)
where s represents the suitability degree of each raster cell in the array, W is the
user defined criteria weight, and r is the parameter that defines the fuzzy logic
requirement.
The GCD implemented with the WPM functions as aggregators or operators within
the LSP approach that is composed of elementary input criteria that are combined in a
nonlinear fashion using a leaf and stem aggregation structure. Inputs are combined
mathematically where they converge at nodes containing LSP aggregators. The elementary
input criteria are fuzzy-scaled factors or variables used to describe suitability. The inputs
are initially grouped categorically and aggregated in parallel until the processing
terminates and returns a final suitability score.
The aggregation structure design is arbitrary and depends on the decision-making
problem and needs of the decision-maker. Dujmović and De Tré (2011) theorize that
aggregation structures fall into a set of identifiable patterns known as Canonical

61
Aggregation Structures (CAS). CASs can therefore be used as a template or starting point
for designing an aggregation structure for system evaluation.
The LSP approach has been used in a wide array of routine evaluations including
computer hardware design (Dujmović 1996), web services evaluations (Yip & Mendes 2005),
and software design (Soni et al. 2010). Allen et al. (2011) describe a non-spatial evaluation
of environmental policy assessment employing LSP. LSP suitability maps have been
reported but not fully implemented in a GIS software environment (De Tré et al. 2009;
Dujmović et al. 2009; Dujmovic & Scheer 2010).
3.4. Methods
3.4.1. LSP-CA Model
The methodological approach to developing the urban model was conducted in two
parts. The first part involved the design of the input of the LSP-CA consisting of a cell state
expressing development status and development suitability. The second part dealt with
development of a series of LSP-CA simulations and for the purpose of modeling different
urban growth scenarios.
3.4.2. Part 1: LSP analysis
The first objective of creating the model involved the creation of an input layer
encoded with cell states expressing two kinds of information. The first was a suitability
score for development in the form of a continuous score ranging from 0 (unsuitable) and 1
(suitable). In addition to suitability, each cell was assigned a developed or undeveloped
state. The development conditions were derived from 2012 vector GIS data layers
representing cadastral parcels supplied by the City of Nanaimo.
62
The second objective involving model input was the creation of a suitability score for
each location in the study area. Suitabilities were calculated from an application of the LSP
approach. As the predominant development pattern is expected to be single family,
residential homes, a series of factors were created to characterize this type of growth. An
LSP system is built in the following stages: (i) selection of input factors (ii) organization of
input factors into an aggregation tree, (iii) selection of appropriate LSP operators and
weights, and (iv) the calculation of a final suitability score.
A series of unique input factors were developed from a series of geospatial data sets.
Layers supplied by the City of Nanaimo were used to depict water bodies, urban
infrastructure and zoning. A 20m resolution digital elevation model (DEM) was acquired
from GeoBase (2012), a Canadian geospatial data portal, and processed to create elevation
and slope data sets. And finally the current 2011 census data were used to calculate
population characteristics. Following GIS processing, an appropriate scaling function was
applied to each layer converting the original raw units – such as a distance measurement or
slope to a new continuous value representing suitability ranging from 0 to 1. Cells
coinciding with the location of water bodies, roads, and developed land areas were assigned
a value of 0, disallowing growth in those cells.
The data were divided into four basic categories to characterize urban growth
namely: (1) urban factors, (2) topography, (3) environmentally sensitive areas, (4) and
transportation. The urban factor category was composed of three individual suitability
layers. The factors access to urban land-use and access to urban core are self explanatory
and were developed from applying a cost distance analysis routine using a road network
layer (supplied by Statistics Canada (2012d)). The third layer was constructed from a 2011
Census Canada geographic boundary file and attribute file (Statistics Canada 2012b,

63
2012c) depicting total population per census dissemination unit and used to calculate
population densities. The topography category contained an elevation suitability and slope
suitability layer. Transportation consisted of three layers depicting access to highways,
access to roads and access to rail. All three were calculated using a Euclidian distance
function. The category environmentally sensitive areas included the factors, access to coast,
access to lakes, and access to streams. These inputs were calculated through the application
of a distance function. The selected inputs are intended as representative set for the
purpose of testing the integrated LSP-CA scenario development abilities, and is by no
means comprehensive. Each category represents a guiding theme of four of the seven
simulations completed for this study. Additional inputs that would be of value would be
layers conveying land ownership, bylaw development controls to represent growth
management policy. A more sophisticated analysis of travel time could be applied in place
of the cost distance analysis.The categories, inputs and scaling functions are summarized in
Table 3-1.
CATEGORY INPUT DESCRIPTION FUNCTION FUNCTION
BREAKPOINTS
a b c d
TOPOGRAPHIC FACTORS
SLOPE Measured in degrees: relates to the relative cost of development on locations with steep grades.
J 0 0 0 40
ELEVATION Measured in meters; relates to the desirability and cost of locations at corresponding to different elevations
Linear 0 0 0 1019
ECOLOGICALLY SENSITIVE
STREAMS
Measured in meters; reflects the desirability of locations within access to biologically diverse riparian areas for aesthetic attributes and recreational purposes.
J 50 50 50 7961
LAKES Measured in meters; reflects J 50 50 50 7000

64
CATEGORY INPUT DESCRIPTION FUNCTION FUNCTION BREAKPOINTS
the desirability of locations within access to lakes for aesthetic attributes and recreation.
COAST Measured in meters; reflects desirability of locations with coast and beach access.
J 150 150 150 12626
TRANSPORTATION
ROADS Measured in meters; reflects the importance of locations situated within 50m of roads
J 50 50 50 10646
HIGHWAYS Measured in meters; reflects the importance of locations situated within 50m of highways
J 50 50 50 12802
RAIL Measures in meters; reflects the negative effect of locations situated near railroad paths and rail yards.
Linear 50 500 500 500
URBAN FACTORS
DEVELOPED AREAS
Developed through cost distance analysis; based in the assumption that areas closer to existing urban locations with develop before areas with less access.
Linear 0 0 0 1378
URBAN CORE
Developed through cost distance analysis; based in the assumption that a locations development is influenced by its location relative to the centre of urban activity.
Linear 0 0 0 1583
POP DENSITY
Measured in population per km2; based in the assumption that lower densities are associated with growth in residential land development.
Linear 0 0 0 750
Table 3-1. LSP criteria inputs
A canonical aggregation structure (CAS) was selected to represent urban growth.
The CAS selected is designed to aggregate inputs employing a logic that is initiated with

65
inputs set at neutrality and as the structure converges, the system globally increases in
ANDness and decreases in ORness. The reason for selecting this structure is rooted in its
simplicity and theoretical strength ( Dujmović & De Tré 2011). Additionally a simple
aggregation structure is useful to highlight the advantages of the LSP approach over
traditional MCE techniques. The advantages are the aggregation of numerous inputs, and
the use of logic conditions to impose increasing or relaxed site selectivity. Using a structure
with increasing ANDness and decreasing ORness ensures that the final suitabilities reflect
a stringent logic for site selection and are more selective. The aggregators used along with
their associated r values are as follows: A or average (1); C-- or soft partial conjunction
(.619); C- or soft partial conjunction (.261); C-+, or hard partial conjunction (-0.148); and CA
or hard partial conjunction (-0.72).
The global suitability score was then calculated through the pair-wise aggregation of
categories into subcategories via the LSP aggregators using the associated weights and
logic parameters. The global suitability score expresses development suitability as a real
number from 0 to 1. For the purpose of this research, the LSP aggregation structure serves
as an exploratory tool to create transition rules for different growth scenarios through
interactively adjusting the parameters.
3.4.3. Part 2
3.4.3.1. CA Model Development
The purpose of the dynamic CA model is to characterize the growth of developed or
residential urban cells at the expense of undeveloped cells over time. For the purpose of
exploring different types of scenarios using the LSP approach to develop cell state
transitions, three different modeling trials were created during the course of this research:

66
(1) Trial 1: the simple LSP-CA approach, (2) Trial 2: The LSP-CA with an annual growth
constraint parameter, and (3) Trial 3: the LSP-CA demonstrated asynchronous urban
growth.
All three operate with a 3x3 Moore neighborhood with the same cell state input
layer derived from the LSP submodel and development condition data. While different
neighbourhood sizes could be applied (5x5 or 7x7), it was found (through an extensive trial-
and-error process) that a simple 9 cell neighbourhood configuration was sufficient and
produced visually satisfying results. The temporal scale used for the three structures was
one year per iteration. Trial 1 operated on a set of simple transition rules based on the LSP
layer that were processed iteratively. While simulations with this type of model are useful,
the structure is difficult to control in terms of dynamics. The approach used in Trial 2 was
formulated to address this problem. The CA was configured to select a specified “best”
number of cells for conversion and exhibited more dynamic control than the simulations
generated for Trial 1. Trial 2 was used to simulate slow and accelerated urban growth. The
LSP-CA approach used in Trial 2 could be used with historical data sets to calibrate a
model for mimicking actual growth over a specified time period. While this approach is
useful for an overall perspective of growth, in many cases urban areas grow at different
rates within their boundaries, and CA models should address this (Stevens and Dragićević
2007).Therefore, Trial 3 was designed to make urban land-use change happen
asynchronously; different growth rates were assigned for different sub-regions in the study
area. The calibration of the LSP-CA for each trial involved and extensive trial and error
process in which the parameters of the LSP structure were adjusted to increase or decrease
the influence of different factors resulting in different simulation outcomes.

67
3.4.3.2. Simulation Scenarios
Simulation scenarios were generated in three different modeling trials and are
summarized below in Table 3-2, and described in detail in the following sections.
Simulation Trial Trial 1 Trial 2 Trial 3 Growth Characteristic
Simple Growth Dynamics Asynchronous Growth
Simulation Scenarios
• 1A: transportation oriented; • 1B: growth in environmentally
sensitive areas • 1C: compact growth • 1D: control simulation
• 2A Accelerated Growth
• 2B Slow growth
• 3A Asynchronous Growth
Table 3-2. Simulation scenarios
The LSP-CA simulations for Trial 1 function as a set of theoretically representative
urban growth patterns: (1) 1A transportation oriented growth, (2) 1B urban growth that
consumes environmentally sensitive areas, and (3) 1C compact growth. The development of
the LSP-CA for Trial 2 generated two scenarios that exhibited (1) 2A an accelerated rate
and (2) 2B slow rate of growth. This was accomplished through setting a global
development rate parameter that limits the amount of land area that converts to a
developed state annually. In Trial 3 the LSP-CA was developed for the purpose of
simulating asynchronously growing sub-regions of the urban system. Each sub-region was
assigned a different development rate parameter that constrained the amount of cells that
converted to a developed state at each cycle, and run simultaneously.
3.4.3.2.1. Trial 1
For Trial 1, three separate scenarios were created: namely Scenario 1A,
“transportation oriented;”Scenario 1B, “growth in environmentally sensitive areas,” and
Scenario 1C, “compact growth.” A fourth simulation, Scenario 1D, was produced using
Average LSP aggregators and balanced weights as a control simulation to compare the

68
effects of parameterization. To demonstrate the utility of the LSP-CA structure for
generating realistic patterns, an LSP aggregation structure was created as basic template
for all simulation trials. The adjustable parameters were (1) the factor weights and (2) the
strength of decision logic. Factor weights were adjusted to amplify the effect of specific
inputs and input categories in the global LSP score, and the decision logic strength was
adjusted to increase the selectivity of the LSP system. By increasing the level of modeled
simultaneity, this results in a more selective than relaxed suitability and corresponds to
more discriminating CA transition rules. The LSP models used for the different scenarios
are shown in Figure 3-1.

69
Figure 3-1. Aggregation structures used for scenario development
In addition to adjusting the LSP submodel, the local transition rules were adjusted
to attain realistic hypothetical growth scenarios. Both the transition rules and the LSP
adjustment were calibrated and fine tuned to produce realistic patterns through a trial and
error process. This process consisted of experimenting with different parameters and
gauging the outcome by employing the GIS framework to inspect results, use visual
feedback, and develop simple animations.
3.4.3.2.2. Trial 2
In Trial 2, the LSP-CA model was calibrated to generate different scenarios
representing accelerated and slow rates of growth (scenarios 2A and 2B). This was
accomplished by specifying a global growth parameter that effectively limits the amount of

70
land units to be converted from an undeveloped to a developed state. This approach was
introduced to limit growth to a more plausible growth dynamic while increasing the
discrimination of the CA transition rule. To represent an accelerated rate of growth over
the course of 25 iterations (years) the global cell conversion parameter was set to 1.25 km2
per year. Additionally a “slow” growth simulation was created using the model with the
growth parameter set to approximately 1 km2 per year. The LSP-derived input used to
simulate the different rates of growth was the “compact growth” scenario used in the
previously mentioned simulations.
3.4.3.2.3. Trial 3
In Trial 3 the LSP-CA was developed to simulate a region divided into three sub-
regions, each growing simultaneously at different rates for a specified number of iterations.
This structure operated in a similar way as the configuration used in Trial 2. The annual
growth rates were specified to limit cell state conversions at each cycle. The key difference
with this variation of the structure is that each sub-region was assigned a unique growth
rate parameter, resulting in a global system that grew asynchronously. One simulation (3A)
was generated to test the performance of this model variant. The CA model was tested
using the LSP-derived “compact” growth scenario.
3.5. Results
3.5.1. Data Sets
The geospatial data used to implement the LSP-CA approach was provided by The
City of Nanaimo, a mid-sized Canadian city on the eastern coast of Vancouver Island,
British Columbia (Figure 3-2).

71
Figure 3-2. Study area
As of 2011, Nanaimo had a population of just over 83,000, with an increase of 6.5%
from 2006 (Statistics Canada 2012a). Nanaimo is geographically hemmed in along the
Strait of Georgia and rugged, mountains to the east. In an effort to grow the city in a
sustainable way, the City has adopted a policy of enacting a growth boundary to limit
services and avoid growth into predominantly rural farmlands that surround the edge of
the city. According to the City of Nanaimo’s official plan, the landbase is composed of mostly
low-density single family dwellings and the expected growth in the next 30 years will be
continued in this type of development (Nanaimo 2008).

72
The datasets used for the LSP analysis covered an area of 20km by 18km at 25m
resolution. The individual spatial units (cells) cover an area of 625m2. Different data
sources in different data formats and projections required some transformations and
conversions to operate at the specified extent and scale.
3.5.2. Simulation
The results of the different modeling structures are presented below in three parts:
(1) Trial 1: demonstrating three different growth patterns, (2) Trial 2: demonstrating
temporally constrained fast and slow growth scenarios, and (3) Trial 3: modeled
asynchronous urban growth.
3.5.2.1. Trial 1 Simulations
As a means of assessing the performance of the LSP-CA model, a LSP aggregation
structure was used as the template for all subsequent pattern simulations. Using the
aggregation structure as a starting point, three different LSP input layers were created to
generate different urban growth simulations. The CA output maps are presented for
Scenario 1A (Figure 3-3) Scenario 1B (Figure 3-4), Scenario 1C (Figure 3-5) and Scenario
1D (Figure 3-6).

73
Figure 3-3. Simulation 1A: Transportation oriented growth

74
Figure 3-4. Scenario 1B: Growth in environmentally sensitive areas

75
Figure 3-5. Scenario 1C: Compact growth

76
Figure 3-6. Scenario 1D: "Control" simulation using neutral logic

77
The Map Comparison Kit (MCK) developed by the Research Institute for Knowledge
Systems (RIKS) (Hagen and Uljee 2003) was used to compare the scenarios from this first
series of trials. The map comparisons are summarized in Table 3-3.
Map Comparison 1a 1b 1c 2a 2b 2c
Simulations compared (Map 1, Map 2) 1D, 1A 1D, 1B 1D,1C 1A, 1B 1A, 1C 1B, 1C Map 1 unique growth land units (km2) 18.4 19.9 15.5 5.3 3.3 3.2 Map 2 unique growth land units (km2) 3.5 2.11 3.7 2.3 6.4 9.1 Overlap (km2) 5.5 4.0 8.4 3.8 5.7 3.0
Table 3-3. Summary of map comparison procedure
First, scenarios 1A, 1B, and 1C were each compared with scenario 1D (referred to as
Map Comparisons 1a, 1b, and 1c in Figure 3-7). 1D mentioned previously served the
purpose of a “control” scenario. This was done to test the sensitivity of the CA to LSP
aggregation logic parameterization. Then, scenarios 1A, 1B, and 1C were each compared to
one another as a means of assessing the ability of the LSP CA to simulate different and
non-redundant growth patterns (referred to as Map Comparisons 2a, 2b, and 2c in Figure 3-
8).

78
Figure 3-7. Map Comparisons 1a, 1b, and 1c

79
Figure 3-8. Map Comparisons 2a, 2b and 2c

80
3.5.2.2. Trial 2
For Trial 2 the LSP-CA was operated on the LSP-generated “compact growth” input
employed for Scenario 1C, Trial 1. In this trial the LSP-CA was used to create two different
growth scenarios, accelerated (2A) and slow (2B) (shown in Figures 3-9 and 3-10). Scenario
2A was set with an annual growth rate of 1.25 km2 per year, and Scenario 2B was set with a
1 km2 per year rate.

81
Figure 3-9. Simulation 2A: Accelerated growth

82
Figure 3-10. Scenario 2B: Slow growth dynamics

83
3.5.2.3. Trial 3
For the Trial 3, simulation 3A, the model output is shown in Figure 3-11. The
growth pattern exhibited demonstrates a higher rate of growth in sub-region C (0.5 km2 per
year), with slower rates of growth in sub-regions A (0.15 km2 per year) and B (0.3 km2 per
year). This output exhibits an unbalanced, asynchronous growth pattern, compared with
the output from the previous structure that relies on a single growth dynamic parameter.

84
Figure 3-11: Scenario 3A: Asynchronous growth

85
3.6. Discussion and Conclusion
The development of an urban model using an LSP-CA integrated structure that
addresses the limitations of MCE-CA approaches was configured in different ways to model
realistic urban growth patterns. Three different modeling trials were designed to satisfy
this research objective. The first trial was used to test the responsiveness of the CA to the
LSP approach. Responsiveness of the CA was measured through map comparison
summarized in Table 3-3. The second trial tested LSP’s utility in modeling different rates of
growth dynamics. The third trial functioned as an extension of the second in which a
simulation was produced representing an asynchronously growing city.
The systematic map comparisons of simulations 1A, 1B, and 1C with “control”
simulation 1D demonstrated the effect of parameterization of the LSP logic aggregators.
The map comparisons 1a, 1b and 1c (Figure 3-7) indicate that the adjustable strength of
logical requirements modeled in the LSP aggregation structure result in a more selective
CA. Simulation 1D exhibits growth that outpaces all scenarios. This is expected because the
aggregators used for simulation 1D were set to Average (neither AND, nor OR). Increasing
the ANDness and reducing the ORness of the LSP Aggregation structure resulted in a more
selective and discriminating CA. The results and map comparisons demonstrate the
expressive power of flexible logic aggregation that is unavailable in MCE. This feature of
the LSP submodel renders scaling functions of the type used by Wu and Webster (1998) for
MCE-CA models unnecessary.
The result of Trial 1 also served to demonstrate that LSP can flexibly be
manipulated to produce different, non-redundant scenarios. Each simulation was
systematically compared and demonstrated significant differences in the locations of
predicted growth. The comparison maps 2a, 2b and 2c and associated graphs (Figure 3-8)

86
indicate that the scenarios do not overlap to a large degree. While each simulation is
unique, each was created with the same inputs and aggregation structure, albeit
parameterized differently. The ability of the LSP-CA to represent different outcomes
implies that the significance of the inputs are maintained and that a high level of detail is
present in the model
Trial 2 was useful for demonstrating the utility of LSP for modeling annual growth
rates. Such a system can be altered to recreate patterns derived from historical datasets.
One issue, however is that the rate of growth remains fixed over the iterations, whereas in
reality growth may not proceed in such a way. Additionally, the annual growth rate
parameter is an essentially “top-down” procedure, detracting somewhat from the “bottom-
up” qualities that characterize CA and complex systems in general.
Urban systems, however, are not completely self-contained and an approach that
merges the effect of global variables such as planning policy with the local neighbourhood
function serve to produce a realistic profile of urban growth. The Trial 3 simulation
functioned as a good compromise between a theoretically strict CA and an operational
policy tool. By setting different dynamic rates among sub-regions, the system operates with
a more realistic interplay between local and global effects.
The LSP-CA performed well, however, the model may benefit from additional
development. This includes more realistic input variables generated from policy documents
or interviews with planning professionals to enhance the LSP model. The choice of CA
parameters also deserves attention. The simulation scenario maps indicated areas that
experienced a rapid initial growth and cessation at a midway the duration of 25 years. This
behaviour is present in all simulations yet most easily observable in Figures 3-3 and 3-5.
These results stem directly from the choice of the 3x3 neighbourhood function. The size of
87
the neighbourhood does not permit growth beyond physical barriers such as streams or
roads represented as unsuitable (0%) contained in the LSP input layer. The limitations of
Moore neighbourhoods are representative of the issues faced in adapting a rigid classical
CA to the complexity of geographic reality.
The integration of the Logic Scoring of Preference approach and cellular automata
techniques was proven to constitute a flexible structure for the exploratory simulation of
realistic spatial and temporal urban growth. Geospatial data of the City of Nanaimo, BC,
Canada was used as a case study for developing different simulations. This research
demonstrated that CA is sensitive to LSP analysis and choice of criteria. LSP is a flexible
front-end for a CA and represents a tool that can be used to leverage the detail and richness
of numerous geospatial data inputs. The findings suggest that LSP is well suited for high
detail, data-rich modeling applications. LSP is a powerful tool for modeling a level of
selectivity necessary to represent decision logic seen in real-world decision-making. The
LSP method could potentially be used as a sophisticated analytical structure for spatio-
temporal SDSS methodologies for modeling growth under the constraints of real world
planning and policy controls. LSP enables the inclusion of unlimited inputs and allows the
expression of continuous logic; two significant features that are unavailable with MCE. The
LSP approach and structure has been shown to have advantages over the more established
MCE suitability analysis approach, generally, and for the purposes of calibrating urban
models in a complex systems theoretical framework.
3.7. Acknowledgements
The Natural Sciences and Engineering Research Council (NSERC) of Canada
provided full support under a Discovery Grant awarded to Dr. Suzana Dragićević. The

88
authors are thankful to the City of Nanaimo, and Jodi Wilson, of the Nanaimo Engineering
Department for providing the datasets used in this study.
3.8. References
Allen, W., L. III et al., 2011. Identifying and selecting strategic mitigation opportunities; criteria design and project evaluation using Logic Scoring of Preference and optimization. Journal of Conservation Planning, 7, pp.61–68.
Almeida, C.M. et al., 2008. Using neural networks and cellular automata for modeling intra-urban land-use dynamics. International Journal of Geographical Information Science, 22(9), pp.943–963.
Bailey, K. & Grossardt, T., 2010. Toward Structured Public Involvement: Justice, Geography and Collaborative Geospatial/Geovisual Decision Support Systems. Annals of the Association of American Geographers, 100(1), pp.57–86.
Batty, M., 1997. Cellular Automata and Urban Form: A Primer. Journal of the American Planning Association, 63(2), pp.266–274.
Batty, M., 2005. Cities and Complexity: Understanding Cities with Cellular Automata, Agent-Based Models, and Fractals, Cambridge, Mass: MIT Press.
Batty, M. & Xie, Y., 1996. Preliminary evidence for a theory of the fractal city. Environment and Planning A, 28(10), pp.1745 – 1762.
Batty, M. & Xie, Y., 1994. From cells to cities. Environment & Planning B: Planning & Design, 21(Celebration Issue), pp.531–548.
Batty, M., Xie, Y. & Sun, Z., 1999. modeling urban dynamics through GIS-based cellular automata. Computers, Environment and Urban Systems, 23(3), pp.205–233.
Boroushaki, S. & Malczewski, J., 2010. Using the fuzzy majority approach for GIS-based multicriteria group decision-making. Computers & Geosciences, 36(3), pp.302–312.
Carver, S.J., 1991. Integrating multi-criteria evaluation with geographical information systems. International Journal of Geographical Information Systems, 5(3), p.321.
Chapin, S., and Weiss, S., 1968. A Probabilistic Model for Residential Growth. Transportation Research 2:375-90.
City of Nanaimo 2008. planNanaimo. Official Community Plan, Nanaimo, BC.
Clarke, K. C., Hoppen, S. & Gaydos, L.J., 1997. A self-modifying cellular automaton model of historical urbanization in the San Francisco Bay area. Environment and Planning B: Planning and Design, 24(2), pp.247 – 261.

89
Clarke, K. C. & Gaydos, L.J., 1998. Loose-coupling a cellular automaton model and GIS: long-term urban growth prediction for San Francisco and Washington/Baltimore. International Journal of Geographical Information Science, 12(7), pp.699–714.
Comber, A. et al., 2010. Different methods, different wilds: Evaluating alternative mappings of wildness using fuzzy MCE and Dempster-Shafer MCE. Computers, Environment and Urban Systems, 34(2), pp.142–152.
Couclelis, H., 1985. Cellular worlds: a framework for modeling micro - macro dynamics. Environment and Planning A, 17(5), pp.585 – 596.
Dujmović, J.J., 1996. A Method For Evaluation And Selection Of Complex Hardware And Software Systems. In CMG 96 Proceedings. pp. 368–378.
Dujmović, J.J., 2007. Continuous Preference Logic for System Evaluation. Fuzzy Systems, IEEE Transactions on, 15(6), pp.1082 –1099.
Dujmović, J.J. & De Tré, G., 2011. Multicriteria methods and logic aggregation in suitability maps. International Journal of Intelligent Systems, 26(10), pp.971–1001.
Dujmović, J.J. & Larsen, H.L., 2007. Generalized conjunction/disjunction. International Journal of Approximate Reasoning, 46(3), pp.423–446.
Dujmović, J.J. & Nagashima, H., 2006. LSP method and its use for evaluation of Java IDEs. International Journal of Approximate Reasoning, 41(1), pp.3–22.
Dujmovic, J.J. & Scheer, D., 2010. Logic aggregation of suitability maps. In 2010 IEEE International Conference on Fuzzy Systems (FUZZ). 2010 IEEE International Conference on Fuzzy Systems (FUZZ). IEEE, pp. 1–8.
Dujmović, J.J., De Tré, G. & Dragićević, S., 2009. Comparison of Multicriteria Methods for Land-use Suitability Assessment. IFSA World Congress 8 EVSFLAT Conference, Lisbon, Portugal.
Dujmović, J.J., De Tré, G. & Weghe, N., 2009. LSP suitability maps. Soft Computing, 14(5), pp.421–434.
Dujmović, J.J., De Tré, G. & Weghe, N., 2008. Suitability Maps Based on the LSP Method. In V. Torra & Y. Narukawa, eds. modeling Decisions for Artificial Intelligence. Berlin, Heidelberg: Springer Berlin Heidelberg, pp. 15–25.
Eastman, J.R. et al., 1995. Raster Procedures for Multi-Criteria/Multi-Objective Decisions. Photogrammetric Engineering and Remote Sensing (PE&RS), 61(5), pp.539–547.
Gardner, M., 1970. Mathematical Games: The fantastic combinations of John Conway’s new solitaire game “life.” Scientific American, (223), pp.120 –123.
GeoBase, 2012. Canadian Digital Elevation Data [computer file]. 2000-2009. Ottawa, ON: Ministry of Natural Resources. Available FTP: ftp://ftp2.cits.rncan.gc.ca/pub/GeoBase/official/cded/ [Accessed August 3, 2012]

90
Goodchild, M.F., & Haining, R.P., 2004. GIS and spatial data analysis: Converging perspectives. Papers in Regional Science, 83, pp.363–385.
Hagen, A. & Uljee, I., 2003. MAP COMPARISON KIT. User manual, RIKS report, July 2003. Available from: http://www.rivm.nl/milieu/modellen or http://www.riks.nl/MCK/
Jankowski, P., 1995. Integrating geographical information systems and multiple criteria decision-making methods. International Journal of Geographical Information Science, 9(3), pp.251–273.
Jiang, H. & Eastman, J.R., 2000. Application of fuzzy measures in multi-criteria evaluation in GIS. International Journal of Geographical Information Science, 14(2), pp.173–184.
Laaribi, A., Chevallier, J.J. & Martel, J.M., 1996. A spatial decision aid: A multicriterion evaluation approach. Computers, Environment and Urban Systems, 20(6), pp.351–366.
Lathrop, G. T., and Hamburg, J. 1965. An Opportunity-Accessibility Model for Allocating Regional Growth. Journal of the American Institute of Planners 31:95-103.
Li, X. & Yeh, A.G., 2001. Calibration of cellular automata by using neural networks for the simulation of complex urban systems. Environment and Planning A, 33(8), pp.1445–1462.
Li, X. et al., 2011. Coupling Simulation and Optimization to Solve Planning Problems in a Fast-Developing Area. Annals of the Association of American Geographers, 101, pp.1032–1048.
Liu, X. et al., 2007. Discovery of transition rules for geographical cellular automata by using ant colony optimization. Science in China, Series D: Earth Sciences, 50(10), pp.1578–1588.
Malczewski, J., 1999. GIS and Multicriteria Decision Analysis, New York: John Wiley.
Malczewski, J., 2002. Fuzzy Screening for Land Suitability Analysis. Geographical & Environmental Modeling, 6(1), pp.27–39.
Manson, S.M., 2001. Simplifying complexity: a review of complexity theory. Geoforum, 32(3), pp.405–414.
O’Sullivan, D., 2009. Complexity Theory, Nonlinear Dynamic Spatial Systems. In International Encyclopedia of Human Geography. Oxford: Elsevier, pp. 239–244.
Santé, I. et al., 2010. Cellular automata models for the simulation of real-world urban processes: A review and analysis. Landscape and Urban Planning, 96(2), pp.108–122.
91
Soni, D., Shrivastava, N. & Kumar, M., 2010. A Methodology for Empirical Quality Assessment of Object-Oriented Design. arXiv:1003.1456. Available at: http://arxiv.org/abs/1003.1456 [Accessed June 18, 2012].
Stanilov, K. & Batty, M., 2011. Exploring the Historical Determinants of Urban Growth Patterns through Cellular Automata. Transactions in GIS, 15(3), pp.253–271.
Statistics Canada, 2012a. Focus on Geography Series, 2011 Census - Census subdivision of Nanaimo, CY (British Columbia). Available at: http://www12.statcan.gc.ca/census-recensement/2011/as-sa/fogs-spg/Facts-csd eng.cfm?Lang=Eng&TAB=0&GK=CSD&GC=5921007 [Accessed June 21, 2012].
Statistics Canada, 2012b. 2011Geographic Boundary File Available at: http://www12.statcan.gc.ca/census-recensement/2011/geo/bound-limit/bound-limit-2011-eng.cfm [Accessed August 3, 2012]
Statistics Canada, 2012c. 2011 Geographic Attribute File. Available at: http://www12.statcan.gc.ca/census-recensement/2011/geo/ref/att-eng.cfm [Accessed August 3, 2012]
Statistics Canada, 2012d. 2011 Road Network File Available at: http://www5.statcan.gc.ca/bsloc/olc-cel?lang=eng&catno=92-500-X [Accessed August 3, 2012]
Stevens, D. & Dragićević, S., 2007. A GIS-based irregular cellular automata model of land-use change. Environment and Planning B: Planning and Design, 34(4), pp.708–724.
Tobler, W. 1970. A Computer Movie Simulating Urban Growth in the Detroit Region. Economic Geography 26:234-40.
Toffoli, T., & Margolus N., 1987. Cellular Automata Machines. Cambridge, MA: MIT Press. ix, 259 p.
Torrens, P.M., 2000. How cellular models of urban systems work. CASA Working Papers. Centre for Advanced Spatial Analysis. University College, London
Torrens, P.M. & Benenson, I., 2005. Geographic Automata Systems. International Journal of Geographical Information Science, 19(4), pp.385–412.
De Tré, G., Dujmović, J. J. & Van De Weghe, N., 2009. Supporting spatial decision making by means of suitability maps.
Ward, D.P., Murray, A.T. & Phinn, S.R., 2003. Integrating spatial optimization and cellular automata for evaluating urban change. The Annals of Regional Science, 37(1), pp.131–148.
White, R. & Engelen, G., 1993. Cellular automata and fractal urban form: a cellular modeling approach to the evolution of urban land-use patterns. Environment & Planning A, 25(8), pp.1175–1199.

92
White, R. & Engelen, G., 1994. Urban systems dynamics and cellular automata: fractal structures between order and chaos. Chaos, Solitons & Fractals, 4(4), pp.563–583.
White, R. & Engelen, G., 1994. Cellular dynamics and GIS: modeling spatial complexity. Geographical Systems, 1(3), pp.237–253.
White, R. & Engelen, G., 2000. High-resolution integrated modeling of the spatial dynamics of urban and regional systems. Computers, Environment and Urban Systems, 24(5), pp.383–400
White, R., 2000. High-resolution integrated modeling of the spatial dynamics of urban and regional systems. Computers, Environment and Urban Systems, 24(5), pp.383–400.
Wood, L. & Dragićević, S., 2007. GIS-Based Multicriteria Evaluation and Fuzzy Sets to Identify Priority Sites for Marine Protection. Biodiversity and Conservation, 16(9), pp.2539–2558
Yeh, A.G.-O. & Li, Xia, 2003. Simulation of development alternatives using neural networks, cellular automata, and GIS for urban planning. Photogrammetric Engineering and Remote Sensing, 69(9), pp.1043–1052.
Yip, M.C.L. & Mendes, E., 2005. Web usability measurement: comparing logic scoring preference to subjective assessment. In Proceedings of the 5th international conference on Web Engineering. ICWE’05. Berlin, Heidelberg: Springer-Verlag, pp. 53–62.

93
4. Chapter 4: Conclusion
4.1. General Conclusions
The focus of this research was to develop an integrated collection of GIS-
based analysis and modeling approaches for the purpose of modeling urban systems
employing the Logic Scoring of Preference (LSP) Method and complex systems
theory. The research was completed in two stages. The first stage involved the
development of a method for land-use suitability analysis using the LSP approach
integrated within GIS. Furthermore the comparison of LSP-GIS and commonly used
GIS-MCE approaches was done to the purpose of evaluating the usability of both
methods in land suitability analysis. The second stage presented a novel LSP-CA
modeling approach in which the LSP method is used to develop transition rules for
various modeling scenarios of urban growth. Both stages of the research were
implemented using the IDRISI GIS software environment (Eastman 2012).
The first stage of the research focused on the integration of LSP and GIS for
modeling suitability for residential development. LSP is a method with origins in
fuzzy reasoning and soft computing for analyzing software development interfaces,
browsers and similar applications. Geographical applications such as raster-based
LSP suitability maps have been mostly theorized and the research literature
describes only spatial applications on hypothetical datasets. This research
demonstrates the first attempt at applying the LSP approach to geospatial datasets

94
of real urban land-use environments. Geospatial data of Bowen Island Municipality
was used as a case study. The results are presented as a suitability map with
regions defined by logical requirements specified by the LSP method. The results
with an integrated GIS-LSP indicate that this approach can be used to structure
decision problems using realistic models of human reasoning in a spatial context.
Moreover, the test of the LSP approach and its comparison to MCE was
performed.Results of this comparison indicate LSP lets users define suitability with
preference requirements and employs nonlinear averaging operators that express
fuzzy logic such as degrees of ANDness and ORness. It was found that the
advantages based in the method aggregation results in a more flexible and
sophisticated toolset for defining land-use suitability than the MCE method.
The second stage of the research project develops an integrated LSP and CA
modeling approach designed and implemented on geospatial data representation of
the City of Nanaimo, BC, Canada, and for the purpose of modeling urban growth.
The results include a series of different development scenarios representing 25 years
of future urban developments. Results of a map comparison procedure indicate that
CA is highly responsive to an LSP input. In addition to producing predictive growth
scenarios, the LSP-CA integrated model was modified to simulate (1) different
growth dynamics, and (2) asynchronous growth. LSP was shown to be a useful and
responsive for land-suitability modeling and for guiding the transition rules of a
GIS-based CA capable of producing a range of realistic urban growth scenarios.

95
4.2. Contributions
The integrated LSP-GIS-CA methods contribute to the fields of geography
GIScience and more particularly spatio-temporal modeling. Moreover it provides an
effective alternative to the existing methods, such as GIS-MCE, used for land-use
site suitability analysis and land-use change modeling. MCE used in the context of
land-use suitability, cannot express realistic logic conditions needed for decision-
making. MCE-CA models used in land-use change modeling require additional
structures such as scaling functions to overcome the limitations of the MCE input
and realistically represent development. In Chapter 2 a novel GIS-LSP prototype
was developed and compared to a similar GIS-MCE approach. In Chapter 3 LSP was
shown to be an effective approach for deriving transition rules for a series of land-
use change scenarios. In both stages of the research the key advantages of the
integrated LSP-GIS-CA approaches were demonstrated that include no limitations
on the number of LSP inputs, and the expression of preference logic. The advantages
of the approach, also presented in this study, include the minimization of data loss
through nonlinear aggregation and the modeling of suitability scores using fuzzy
logic requirements. Additionally the integrated approaches can contribute to fields
such as urban planning or natural resource management and related disciplines
that employ suitability mapping and GIS for facilitating decision making processes.
4.3. Future Directions
This research was successful at demonstrating that the LSP approach can be
integrated in a GIS modeling framework for building land-use suitability maps and

96
for shaping the initial conditions of urban CA models depicting dynamic change. It
provides a first step at exploring the potentials for LSP and its use in GIScience and
geographical applications. In Chapter 3 the modeling structures were used to
simulate different rates of dynamic growth. The LSP-CA prototype has the potential,
therefore, to be case study tested in an actual policy or collaborative planning
context. Such a study could prove useful for developing suitability preferences and
logical requirements.
Further development of a GIS-LSP or LSP-CA could benefit from its use in a
spatial decision support system (SDSS). An SDSS could function as a standalone
application, or as a methodological approach running parallel to a GIS (Densham
1991). Currently the LSP method is integrated and implemented in IDRISI’s
modeling environment, and relies on this specific interface design. The system is
functional, however, in order to be used collaboratively or with non-experts, the
development of an LSP module with a user-friendly and approachable interface is
necessary. Dynamic updating of output maps as parameters change would provide
users with important feedback on the implications of choosing one type of logic over
another (De Tré et al. 2010). In place of LSP oriented terminologies and symbology,
a well-designed semantic import interface could serve as the method of defining
values and parameters. A user-friendly LSP decision-support structure was
developed for Google maps with similar qualities (Dujmović & De Tré 2011) and
should be developed as a part the standard modules within the core of the GIS
software.

97
The third chapter also indicated that LSP is useful for models of geographical
complex systems. This implies that LSP could be applied to other areas of GIS – CA
beyond land-use change and urban growth research domains such as landslides (Lai
& Dragićević 2011), spatio-temporal propagation of insect infestations (Bone et al.
2006), forest fire behaviour (Yassemi et al. 2008), or marine area protection (Wood
and Dragićević 2007). The successful integration of CA and LSP suggest that the
alternative approaches to studying spatio-temporal complexity such as agent based
models (ABMs) of urban or biological systems could benefit from the application of
the LSP approach. The LSP approach could be useful for developing agent models
with sophisticated decision-making parameters employing fuzzy preference logic. As
ABMs often have numerous agents with different objectives and goals (Parker et al.
2003); each agent could be designed with its own unique set of preferences specified
by LSP methods. Furthermore these preferences could be structured to change
dynamically through the processes of agent learning and adaptation under different
environmental conditions.
In closing, the research presented in this thesis offers a glimpse of a rich set
of possibilities and opportunities awaiting further development of LSP in the
contexts of GIS and spatio-temporal modeling.
4.4. References
Bone, C., Dragićević, S. & Roberts, A., 2006. A fuzzy-constrained cellular automata model of forest insect infestations. Ecological Modeling, 192(1-2), pp.107–125.
Densham, P., 1991. Spatial Decision Support Systems. In Geographical Information Systems: principles and applications. Longman, pp. 403–412.

98
Dujmović, J. & De Tré, G.D., 2011. Multicriteria methods and logic aggregation in suitability maps. International Journal of Intelligent Systems, 26(10), pp.971–1001.
Eastman, J.R.2012. Idrisi Selva Edition. Clark Labs. Worcester, MA.
Lai, T. & Dragićević, S., 2011. Development of an urban landslide cellular automata model: a case study of North Vancouver, Canada. Earth Science Informatics, 4(2), pp.69–80.
Parker, D.C. et al., 2003. Multi-agent systems for the simulation of land-use and land-cover change: A review. Annals of the Association of American Geographers, 93(2), pp.314–337.
De Tré, G., Dujmović, J. & Weghe, N., 2010. Supporting Spatial Decision Making by Means of Suitability Maps. In J. Kacprzyk, F. E. Petry, & A. Yazici, eds. Uncertainty Approaches for Spatial Data Modeling and Processing. Berlin, Heidelberg: Springer Berlin Heidelberg, pp. 9–27.
Wood, L. & Dragicević, S., 2007. GIS-Based Multicriteria Evaluation and Fuzzy Sets to Identify Priority Sites for Marine Protection. Biodiversity and Conservation, 16(9), pp.2539–2558.
Yassemi, S., Dragićević, S. & Schmidt, M., 2008. Design and implementation of an integrated GIS-based cellular automata model to characterize forest fire behaviour. Ecological Modeling, 210(1–2), pp.71–84.