
Modeling chronic diseases: the diabetes...
145
RIVM report 260801001/2005 Modeling chronic diseases: the diabetes module Justification of (new) input data CA Baan, G Bos, MAM Jacobs-van der Bruggen (red.) This investigation has been performed by order and for the account of the Dutch Ministry of Health, Welfare and Sport, within the framework of project V/260901, Diabetes. RIVM, P.O. Box 1, 3720 BA Bilthoven, telephone: 31 - 30 - 274 91 11; telefax: 31 - 30 - 274 29 71 Contact: CA Baan Department for Prevention and Health Services Research (PZO) [email protected]
Transcript of Modeling chronic diseases: the diabetes...
RIVM report 260801001/2005 Modeling chronic diseases: the diabetes module Justification of (new) input data CA Baan, G Bos, MAM Jacobs-van der Bruggen (red.)
This investigation has been performed by order and for the account of the Dutch Ministry of Health, Welfare and Sport, within the framework of project V/260901, Diabetes.
RIVM, P.O. Box 1, 3720 BA Bilthoven, telephone: 31 - 30 - 274 91 11; telefax: 31 - 30 - 274 29 71
Contact: CA Baan Department for Prevention and Health Services Research (PZO) [email protected]

page 2 of 145 RIVM report 260801001
Rapport in het kort Modelleren van chronische ziekten: de diabetes module Verantwoording van (nieuwe) invoer Om effecten van verschillende preventieve maatregelen voor diabetes te kunnen berekenen, is het RIVM Chronische Ziekten Model geactualiseerd en aangepast. Het Chronische Ziekten Model is een instrument om effecten van veranderingen in het vóórkomen van risicofactoren, bijvoorbeeld overgewicht en roken, voor chronische ziekten (o.a. hart- en vaatziekten) te schatten op ziektelast en sterfte. Dit rapport geeft de verantwoording van de nieuwe diabetesmodule in dit model. Met deze diabetesmodule kunnen zowel primaire preventiestrategieën als maatregelen in de zorg (=betere behandeling van diabetes en cardiovasculaire risicofactoren) worden doorgerekend en het effect op de volksgezondheid worden geschat. Dit geeft beleidsmakers en zorgverleners inzicht in hoeveel gezondheidswinst er te behalen zou zijn door preventie en het kan ondersteunen bij het prioriteren van verschillende preventiestrategieën. Alle diabetes-gerelateerde informatie in het Chronische Ziekten Model is geactualiseerd. Roken is toegevoegd als risicofactor voor diabetes. HbA1c (een maat voor het bloedglucose niveau) is toegevoegd als risicofactor voor cardiovasculaire complicaties. Nieuwe modelgegevens bij patiënten met diabetes zijn het voorkomen van cardiovasculaire complicaties, het voorkomen van cardiovasculaire risicofactoren (HbA1c, hoge bloeddruk, roken, cholesterol en overgewicht) en de relaties tussen deze risicofactoren en het ontstaan van cardiovasculaire complicaties. Trefwoorden - Diabetes mellitus, hart- en vaatziekten, preventie, behandeling, modelering
RIVM report 260801001 page 3 of 145
Abstract Modeling chronic diseases: the diabetes module A justification of (new) input The RIVM chronic disease model (CDM) is an instrument designed to estimate the effects of changes in the prevalence of risk factors for chronic diseases on disease burden and mortality. To enable the computation of the effects of various diabetes prevention scenarios, the CDM has been updated and adapted. The present report presents a justification of the new diabetes module and the data used. The diabetes module allows the computation of both primary prevention scenarios and care scenarios (i.e. treatment of diabetes and cardiovascular risk factors) and the assessment of the effect on public health. The outcome provides policy makers and health professionals with insight into the potential prevention-associated health gain and may aid them in prioritising prevention scenarios. All diabetes-related information in the CDM has been updated. Smoking has been added as a risk factor for diabetes. HbA1c (a measure of blood glucose level) has been added as a risk factor for cardiovascular complications. New model data regarding patients with diabetes include the prevalence of cardiovascular complications, the prevalence of cardiovascular risk factors (HbA1c, high blood pressure, smoking, cholesterol and overweight) and the relationships between these risk factors and the development of cardiovascular complications. The literature shows that in trials focusing on the prevention of diabetes, the diabetes incidence drops by 60%. Trials focusing on improved treatment of diabetes patients show that the incidence of cardiovascular diseases falls by 25-50%, depending on the type of treatment and research setting. Keywords - Diabetes mellitus, cardiovascular diseases, prevention, treatment, modeling

page 4 of 145 RIVM report 260801001
Voorwoord Dit rapport is een mijlpaal binnen de kennisvraag diabetes uit 2004 (kennisvraag 2.3.3). De kennisvraag Diabetes is een lopend project dat uitgevoerd wordt door het centrum Preventie en ZorgOnderzoek (PZO) van het Rijksinstituut voor Volksgezondheid en Milieu (RIVM) in opdracht van het Ministerie van Volksgezondheid, Welzijn en Sport (VWS). Deze kennisvraag is onderdeel van programma 2 ‘Beleidsondersteuning Volksgezondheid en Zorg’. Het doel van het project is het wetenschappelijk onderbouwen van diverse preventieve maatregelen om diabetes en complicaties ten gevolge van diabetes te voorkómen. Om deze vraag te beantwoorden wordt gebruik gemaakt van het RIVM Chronische Ziekten Model. Het Chronische Ziekten Model was tot nog toe vooral geschikt om primaire preventiestrategieën door te rekenen, maar door diverse aanpassingen is het nu ook mogelijk om effecten van preventiestrategieën in de zorg voor diabetes te schatten met het Chronische Ziekten Model. Het huidige rapport geeft een inhoudelijke verantwoording van de aanpassingen die in de diabetesmodule van het Chronische Ziekten Model zijn uitgevoerd. Het onderzoek is uitgevoerd in nauwe samenwerking met het project ‘Budgetallocatie: methode-ontwikkeling voor prioritering van interventies bij chronische ziekten’ dat binnen het MAP SOR-onderzoeksprogramma ‘Methodologie optimale gezondheidswinst en kwaliteit van zorg’ wordt uitgevoerd. De conceptuele en formele opzet van het model is beschreven in het rapport ‘A conceptual framework for budget allocation in the RIVM Chronic Disease Model. A case study of Diabetes Mellitus’(rapportnummer 260706001/2005). Met het hier beschreven diabetesmodel kunnen berekeningen van effecten van diverse preventiestrategieën worden gemaakt in termen van ziektelast, sterfte, zorggebruik en kosten. De eerste resultaten zullen naar verwachting eind 2005 gepubliceerd worden. Hierbij wil ik iedereen bedanken die heeft bijgedragen aan het tot stand komen van het diabetesmodel en aan deze rapportage. Caroline Baan Projectleider
RIVM report 260801001 page 5 of 145
Contents Summary 7 1. Introduction 9
Part I The Chronic Disease Model and diabetes 11
2. The Chronic Disease Model (CDM) and diabetes 11 3. Adaptations to the CDM with respect to diabetes 15
Part II Diabetes input data in the CDM 17
4. Incidence, prevalence and mortality of diabetes 17 4.1 Introduction 17 4.2 The Dismod method 17 4.3 Incidence and prevalence data 18 4.4 Mortality data 21
5. Diabetes health care utilization, costs and quality of life 29 5.1 Diabetes health care utilization 29 5.2 Diabetes costs 30 5.3 Diabetes Quality of life 33
Part III Prevention of diabetes 35
6. Risk factors for diabetes incidence and primary prevention 35 6.1 Introduction 35 6.2 Methods 35
7. Risk factors for diabetes incidence 39 7.1 Body Mass Index 39 7.2 Physical inactivity 42 7.3 Smoking 45 7.4 Alcohol 48 7.5 Combination of risk factors 49 7.6 Conclusion risk factors for diabetes incidence 50
8. Primary prevention 51 8.1 Lifestyle interventions 51 8.2 Pharmacological interventions 52 8.3 Primary prevention conclusions 53
Part IV Prevention of diabetes complications 55
9. Macrovascular complications of diabetes and tertiary prevention 55 9.1 Introduction 55 9.2 Methods 55 9.3 Prevalence of macrovascular complications in individuals with diabetes 59
10. Risk factors for macrovascular complications in individuals with diabetes 61 10.1 Overweight 61 10.2 Physical inactivity 65 10.3 Smoking 67 10.4 Total cholesterol 70 10.5 Hypertension 72 10.6 HbA1c 74
11. Tertiary prevention 79 11.1 Interventions to reduce bodyweight 79 11.2 Strict control of blood glucose 80 11.3 Blood pressure control 80
page 6 of 145 RIVM report 260801001
11.4 Lipid control 81 11.5 Conclusions tertiary prevention 81
12. Discussion and conclusions 83
References 85
Appendix I Studies reporting relative risk on mortality for diabetic vs non-diabetic subjects 102
Appendix II Care consumption of diabetes mellitus patients in one year 105
Appendix III Relative risks for body mass index (BMI) on diabetes incidence 106
Appendix IVa Relative risks for physical inactivity on diabetes incidence 114
Appendix IVb Calculated relative risks for physical inactivity on diabetes incidence 117
Appendix V Relative risks for current and former smoking on diabetes incidence 119
Appendix VI Relative risks for alcohol consumption on diabetes incidence 122
Appendix VIIa Lifestyle interventions and prevention of diabetes incidence 125
Appendix VIIb Pharmacological interventions and prevention of diabetes incidence 126
Appendix VIII Prevalence of macrovascular disease in diabetic men and women 128
Appendix IX Validation of prevalences of risk factors in diabetes patients based on estimations from CDM 129
Appendix X Relative risks for HbA1c on incidence of macrovascular disease in diabetes patients 132
Appendix XIa Tertiary prevention trials in diabetic patients, lifestyle interventions 134
Appendix XIb Tertiary prevention trials in diabetic patients, pharmacological interventions 138
RIVM report 260801001 page 7 of 145
Summary Background The RIVM Chronic Disease Model (CDM) is a computer program designed to compute the effects of changes in risk factor prevalence on disease specific morbidity and mortality over a prespecified number of years. The RIVM was asked to compare the potential benefits of prevention interventions targeted at diabetes and cardiovascular diabetes complications, using the CDM. This report describes the diabetes module in the CDM and gives a justification of (new) diabetes-related input data in the CDM. Methods Data regarding the incidence and prevalence of diabetes and diabetes mortality were based on Dutch general practitioner registrations. Prevalence of risk factors for diabetes incidence was retrieved from national surveys. Prevalence of risk factors for cardiovascular complications, in diabetes patients, was estimated from the CDM or based on data from Dutch diabetes care projects. Relative risk estimates for risk factors for diabetes incidence and diabetes complications were estimated from the international literature. A literature review was performed to identify effective prevention interventions targeted at diabetes and cardiovascular complications. Results All diabetes-related input data in the CDM were updated. Smoking was added as a risk factor for diabetes incidence. HbA1c (a measure of blood glucose control) was added as a risk factor for diabetes complications. Among diabetes patients, new input data in the CDM comprised the prevalence of cardiovascular complications (acute myocardial infarction, coronary heart disease, congestive heart failure and stroke), the distribution of cardiovascular risk factors (body mass index, physical inactivity, smoking, total cholesterol, blood pressure and HbA1c), and the relative risks between these risk factors and cardiovascular complications. International studies showed that lifestyle programs may reduce diabetes incidence with up to 60% in three to five years, while strict pharmacological treatment of blood pressure or serum cholesterol in diabetes patients may prevent approximately 25% of the cardiovascular complications. Conclusion The CDM has been adapted to allow for the comparison of the benefits of prevention interventions aimed at diabetes or diabetes complications. Ongoing activity is needed to update, expand and validate the diabetes module in the CDM.

page 8 of 145 RIVM report 260801001
RIVM report 260801001 page 9 of 145
1. Introduction CA Baan, G Bos, MAM Jacobs-van der Bruggen Diabetes is a substantial and growing public health problem and has been appointed one of the spearheads of Dutch policy for the coming years. The National Institute for Public Health and the Environment (RIVM) was asked to explore which intervention strategies and measures are most effective in preventing diabetes and diabetes related (macrovascular) complications. The Chronic Disease Model (CDM) has been developed by RIVM as a tool to generate structured data on the effects of autonomous changes (demography) as well as interventions on chronic disease risk factors in terms of expected morbidity and mortality in the future. The merits of using a model like the CDM to evaluate interventions are that the consequences can be extrapolated to the Dutch diabetes population, that long term effects can be computed, and that costs and effects of different interventions can be consistently compared. The CDM will be used to compare the potential benefits of several intervention scenarios aimed at primary prevention (preventing new cases of diabetes) or tertiary prevention (reducing complications in diabetic patients). Secondary prevention (screening for new diabetes patients) is beyond the scope of this report. The effects of prevention will be described in terms of reduced morbidity and mortality and also in expected health care demands, costs and quality of life (disability adjusted life-years). The CDM is in constant development with regular structural changes and updates implemented for different applications. For this extensive diabetes project all input data regarding diabetes in the “old CDM” (CDM-2003) is updated. Also, more specific information is needed. For example, the prevalence of risk factors within the diabetes population (how many diabetes patients have overweight or obesity) was not included in the CDM-2003. Furthermore several structural changes and extensions to the model are needed to model diabetes prevention. For example, HbA1c has to be added as a risk factor for diabetes complications in patients with diabetes. The adaptations with regard to diabetes will be partly implemented in the “new CDM model” (CDM-2005-01), a model version which is available in march 2005. All other diabetes adaptations described in this report are implemented in a CDM version which is available later in 2005 (CDM-2005-02). The CDM-2005-02 will be used for modeling diabetes prevention. In this report we focus on type 2 diabetes as most of the Dutch diabetes patients (>85%) have type 2 diabetes, and risk factors for this type of diabetes are better understood and more suitable for prevention as compared to type 1 diabetes. The objective of this report is twofold. First we outline the structure of the CDM-2003 in relation to diabetes and the extensions and developments to the model that were needed to model diabetes interventions. We describe the diabetes specific input data in the CDM-2005-02 and how these data were collected. Secondly this report reviews the results of primary and tertiary diabetes intervention trials from the international literature. This review gives an indication as to which interventions are potentially beneficial and worth modeling. This report is divided into four parts. In part 1, we briefly describe the CDM-2003 in general and in relation to diabetes. The interrelationships between diabetes, its risk factors, its cardiovascular complications and other risk factors for cardiovascular complications are outlined. We explain how the model was extended to enable the evaluation of interventions to prevent diabetes and its complications. The diabetes specific input data requirements for the
page 10 of 145 RIVM report 260801001
CDM-2005-02 are summarized. For a more elaborated description of diabetes in the CDM-2005-02 we refer to another RIVM report published in 2005 1. In Part II we describe the input data regarding diabetes prevalence, incidence and mortality as well as health care utilization, health care costs and quality of life. We summarize the parameters which were already included in CDM-2003 and their justification. Some of these parameters have been updated. Methods of data collection, the resources that were used (or excluded) and the data that were finally selected for the CDM-2005-02 are discussed. For some new data that should be added to the model (health care and costs) insufficient data are available. We discuss which information is still needed and how we plan to collect this information in 2005. In Part III and IV we focus on risk factors for diabetes incidence (Part III) and risk factors for the development of macrovascular complications of diabetes (Part IV). In Part III we justify the input data regarding prevalence of risk factors in the Dutch population and the strengths of the relations between those risk factors and diabetes incidence in terms of relative risks. In Part IV, a description of all new parameters is given. We describe how the prevalence of cardiovascular complications, the prevalence of risk factors for complications in the Dutch diabetes population and the relative risks between these risk factors and complications in patients with diabetes were retrieved. In addition we review the results of primary (Part III) and tertiary (Part IV) diabetes intervention trials found in the international literature. This gives us some insight in the potential effects of different intervention strategies. Intensive trials however do not mirror real life (health care) practice. The results of these trials still have to be translated into realistic scenarios for the Dutch health care setting. Moreover, many of these trials include pharmacological treatment while medication is not incorporated in the CDM (yet). The results of defining and modeling intervention scenarios will be reported in 2005 and 2006.
RIVM report 260801001 page 11 of 145
Part I The Chronic Disease Model and diabetes
2. The Chronic Disease Model (CDM) and diabetes
RT Hoogenveen, TL Feenstra The RIVM Chronic Disease Model (CDM) has been developed as a tool to describe the effects of changes in chronic disease risk factors on morbidity and mortality while taking into account integrative aspects. The CDM-2003 contains the following risk factors: body mass index (BMI), physical activity, smoking, alcohol, total cholesterol and systolic blood pressure. It models 28 chronic diseases: cardiovascular diseases (subdivided in acute myocardial infarction, other coronary heart disease, stroke, and congestive heart failure), COPD, asthma, diabetes mellitus, dementia, arthrosis (knee, hip and other), osteoporosis, low back pain and 15 different forms of cancer. The model is structured in such a way that new diseases and risk factors can be added relatively easily. The mathematical model structure, which is called a multi-state transition model, is based on the life table method. The model states defined are the risk factor classes and disease states. State transitions are possible between classes for any risk factor, incidence, remission and progress for any disease, and mortality. The model describes the life course of cohorts in terms of changes between risk factor classes and changes between disease states over the simulation time period. Risk factors and diseases are linked through relative risks on disease incidence. The main model parameters are:
• the population numbers (in the year at which we start modeling), • initial class prevalence rates and transition rates for all risk factors, • initial prevalence, incidence and excess mortality for all diseases, and remission rates
(if applicable) and • relative risk values specified by risk factor and chronic disease.
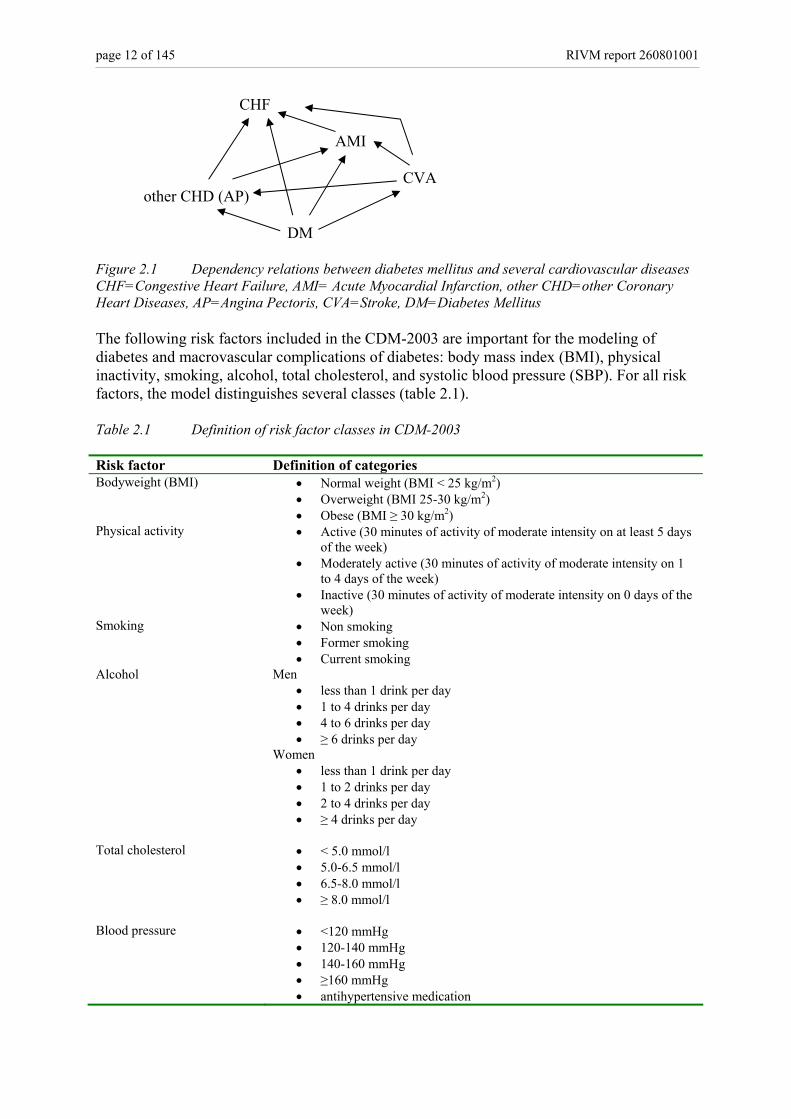
All model parameters and variables are specified by gender and 5-year age-classes. The time step used for modeling is 1 year. The main model outcome variables are incidence, prevalence and mortality numbers specified by disease, and integrative measures such as total and disability-adjusted life years. Examples of the integrative aspects of the model are the joint effects of combined risk levels, different causes of morbidity and mortality being distinguished, the effects of mortality selection and the statistical modeling of dependent competing risks. For further details on the Chronic Disease Model in general, we refer to a recently published technical report 1. Diabetes is modeled in the CDM both as a disease and a risk factor for a number of cardiovascular diseases, which are the most important macrovascular complications of diabetes. The same holds for some cardiovascular diseases. Figure 2.1 shows the dependency structure between diabetes and cardiovascular diseases.
page 12 of 145 RIVM report 260801001
CHF AMI CVA other CHD (AP) DM Figure 2.1 Dependency relations between diabetes mellitus and several cardiovascular diseases CHF=Congestive Heart Failure, AMI= Acute Myocardial Infarction, other CHD=other Coronary Heart Diseases, AP=Angina Pectoris, CVA=Stroke, DM=Diabetes Mellitus The following risk factors included in the CDM-2003 are important for the modeling of diabetes and macrovascular complications of diabetes: body mass index (BMI), physical inactivity, smoking, alcohol, total cholesterol, and systolic blood pressure (SBP). For all risk factors, the model distinguishes several classes (table 2.1). Table 2.1 Definition of risk factor classes in CDM-2003 Risk factor Definition of categories Bodyweight (BMI) • Normal weight (BMI < 25 kg/m2)
• Overweight (BMI 25-30 kg/m2) • Obese (BMI ≥ 30 kg/m2)
Physical activity • Active (30 minutes of activity of moderate intensity on at least 5 days of the week)
• Moderately active (30 minutes of activity of moderate intensity on 1 to 4 days of the week)
• Inactive (30 minutes of activity of moderate intensity on 0 days of the week)
Smoking • Non smoking • Former smoking • Current smoking
Alcohol Men • less than 1 drink per day • 1 to 4 drinks per day • 4 to 6 drinks per day • ≥ 6 drinks per day
Women • less than 1 drink per day • 1 to 2 drinks per day • 2 to 4 drinks per day • ≥ 4 drinks per day
Total cholesterol • < 5.0 mmol/l
• 5.0-6.5 mmol/l • 6.5-8.0 mmol/l • ≥ 8.0 mmol/l
Blood pressure • <120 mmHg
• 120-140 mmHg • 140-160 mmHg • ≥160 mmHg • antihypertensive medication
RIVM report 260801001 page 13 of 145
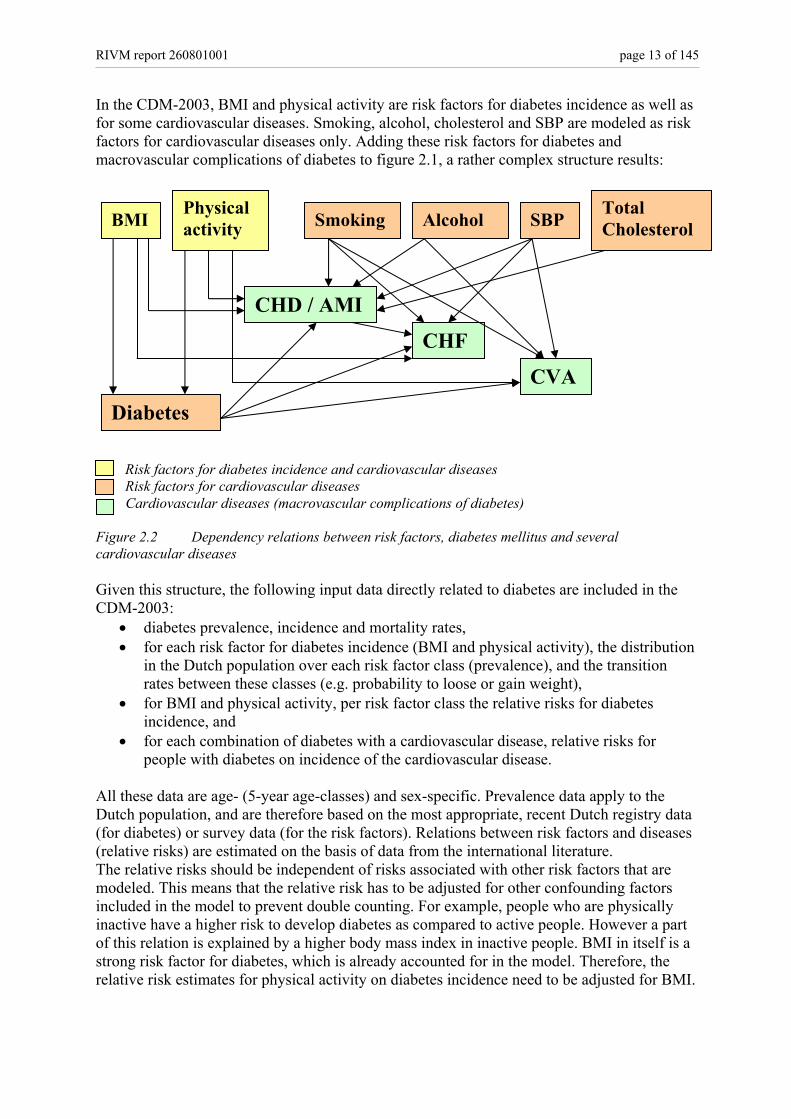
In the CDM-2003, BMI and physical activity are risk factors for diabetes incidence as well as for some cardiovascular diseases. Smoking, alcohol, cholesterol and SBP are modeled as risk factors for cardiovascular diseases only. Adding these risk factors for diabetes and macrovascular complications of diabetes to figure 2.1, a rather complex structure results:
Risk factors for diabetes incidence and cardiovascular diseases Risk factors for cardiovascular diseases Cardiovascular diseases (macrovascular complications of diabetes)
Figure 2.2 Dependency relations between risk factors, diabetes mellitus and several cardiovascular diseases Given this structure, the following input data directly related to diabetes are included in the CDM-2003:
• diabetes prevalence, incidence and mortality rates, • for each risk factor for diabetes incidence (BMI and physical activity), the distribution
in the Dutch population over each risk factor class (prevalence), and the transition rates between these classes (e.g. probability to loose or gain weight),
• for BMI and physical activity, per risk factor class the relative risks for diabetes incidence, and
• for each combination of diabetes with a cardiovascular disease, relative risks for people with diabetes on incidence of the cardiovascular disease.
All these data are age- (5-year age-classes) and sex-specific. Prevalence data apply to the Dutch population, and are therefore based on the most appropriate, recent Dutch registry data (for diabetes) or survey data (for the risk factors). Relations between risk factors and diseases (relative risks) are estimated on the basis of data from the international literature. The relative risks should be independent of risks associated with other risk factors that are modeled. This means that the relative risk has to be adjusted for other confounding factors included in the model to prevent double counting. For example, people who are physically inactive have a higher risk to develop diabetes as compared to active people. However a part of this relation is explained by a higher body mass index in inactive people. BMI in itself is a strong risk factor for diabetes, which is already accounted for in the model. Therefore, the relative risk estimates for physical activity on diabetes incidence need to be adjusted for BMI.
BMI Smoking Alcohol SBP Total Cholesterol
Physical activity
Diabetes
CHD / AMI
CHF
CVA
page 14 of 145 RIVM report 260801001
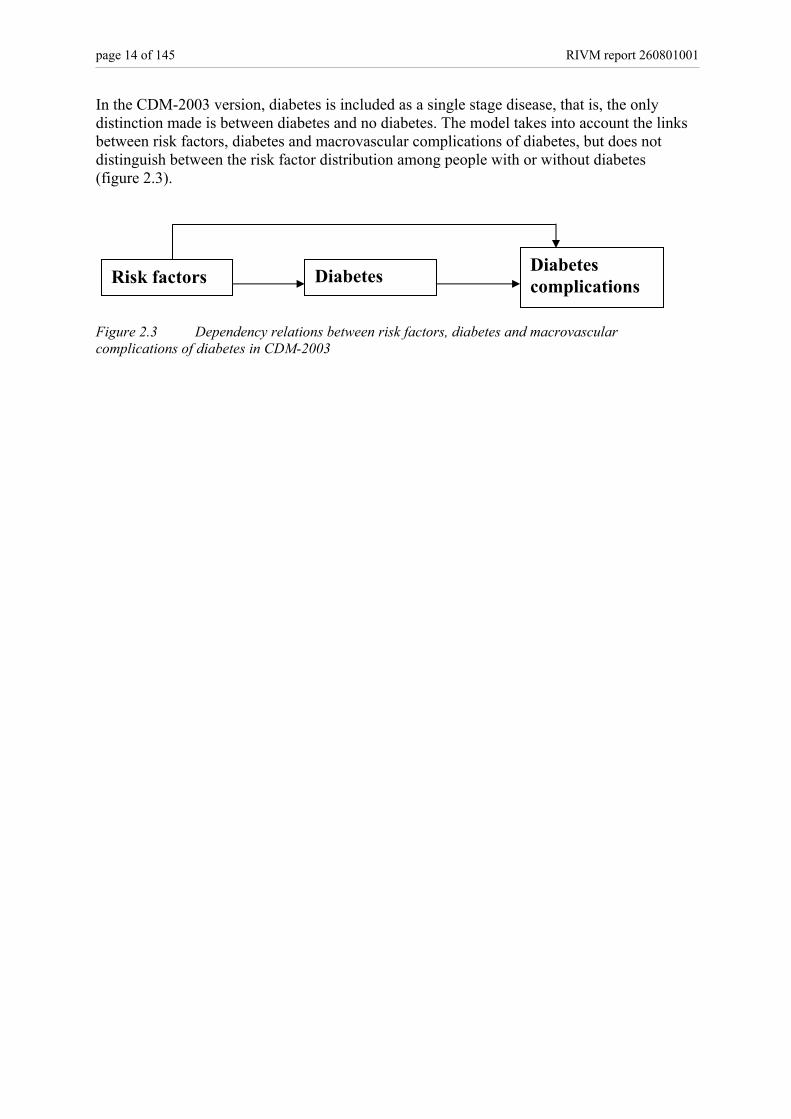
In the CDM-2003 version, diabetes is included as a single stage disease, that is, the only distinction made is between diabetes and no diabetes. The model takes into account the links between risk factors, diabetes and macrovascular complications of diabetes, but does not distinguish between the risk factor distribution among people with or without diabetes (figure 2.3). Figure 2.3 Dependency relations between risk factors, diabetes and macrovascular complications of diabetes in CDM-2003
Risk factors Diabetes Diabetes complications
RIVM report 260801001 page 15 of 145
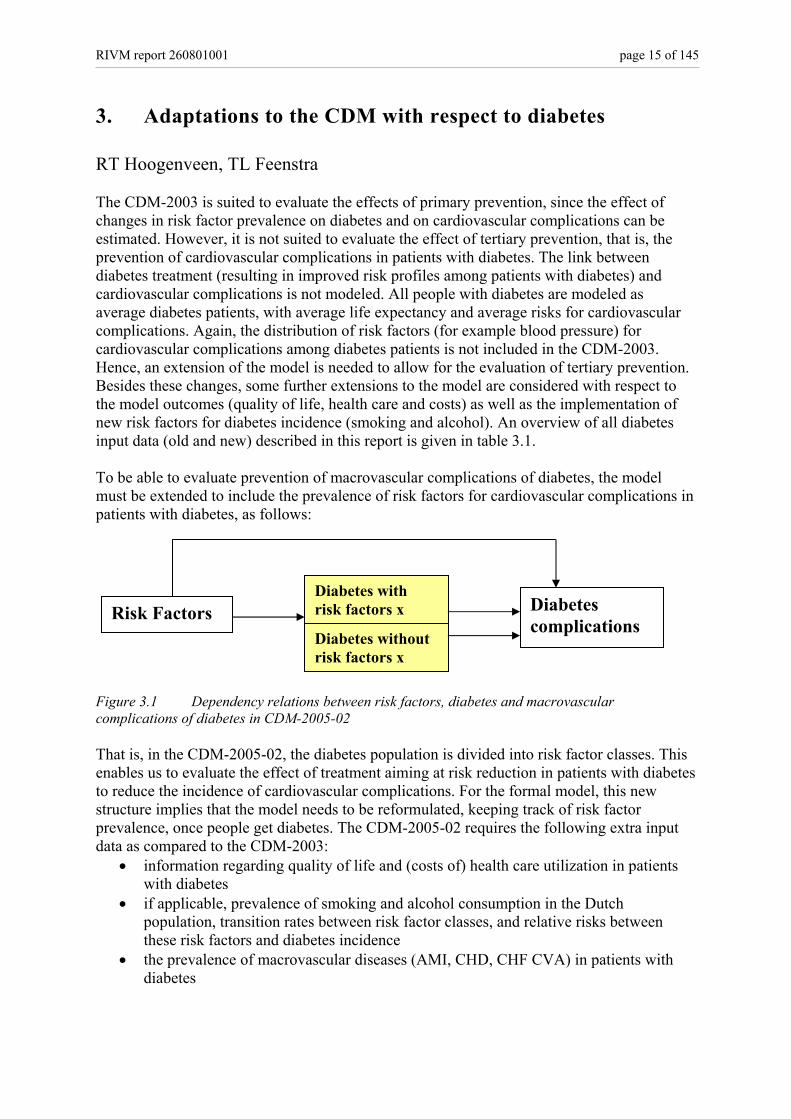
3. Adaptations to the CDM with respect to diabetes RT Hoogenveen, TL Feenstra The CDM-2003 is suited to evaluate the effects of primary prevention, since the effect of changes in risk factor prevalence on diabetes and on cardiovascular complications can be estimated. However, it is not suited to evaluate the effect of tertiary prevention, that is, the prevention of cardiovascular complications in patients with diabetes. The link between diabetes treatment (resulting in improved risk profiles among patients with diabetes) and cardiovascular complications is not modeled. All people with diabetes are modeled as average diabetes patients, with average life expectancy and average risks for cardiovascular complications. Again, the distribution of risk factors (for example blood pressure) for cardiovascular complications among diabetes patients is not included in the CDM-2003. Hence, an extension of the model is needed to allow for the evaluation of tertiary prevention. Besides these changes, some further extensions to the model are considered with respect to the model outcomes (quality of life, health care and costs) as well as the implementation of new risk factors for diabetes incidence (smoking and alcohol). An overview of all diabetes input data (old and new) described in this report is given in table 3.1. To be able to evaluate prevention of macrovascular complications of diabetes, the model must be extended to include the prevalence of risk factors for cardiovascular complications in patients with diabetes, as follows: Figure 3.1 Dependency relations between risk factors, diabetes and macrovascular complications of diabetes in CDM-2005-02 That is, in the CDM-2005-02, the diabetes population is divided into risk factor classes. This enables us to evaluate the effect of treatment aiming at risk reduction in patients with diabetes to reduce the incidence of cardiovascular complications. For the formal model, this new structure implies that the model needs to be reformulated, keeping track of risk factor prevalence, once people get diabetes. The CDM-2005-02 requires the following extra input data as compared to the CDM-2003:
• information regarding quality of life and (costs of) health care utilization in patients with diabetes
• if applicable, prevalence of smoking and alcohol consumption in the Dutch population, transition rates between risk factor classes, and relative risks between these risk factors and diabetes incidence
• the prevalence of macrovascular diseases (AMI, CHD, CHF CVA) in patients with diabetes
Risk Factors Diabetes with risk factors x Diabetes
complications Diabetes without risk factors x
page 16 of 145 RIVM report 260801001
• for each risk factor for cardiovascular complications, the distribution of the diabetes population over risk factor classes (prevalence) and transition rates between those classes
• relative risks for these risk factors in a diabetes population for incidence of cardiovascular diseases
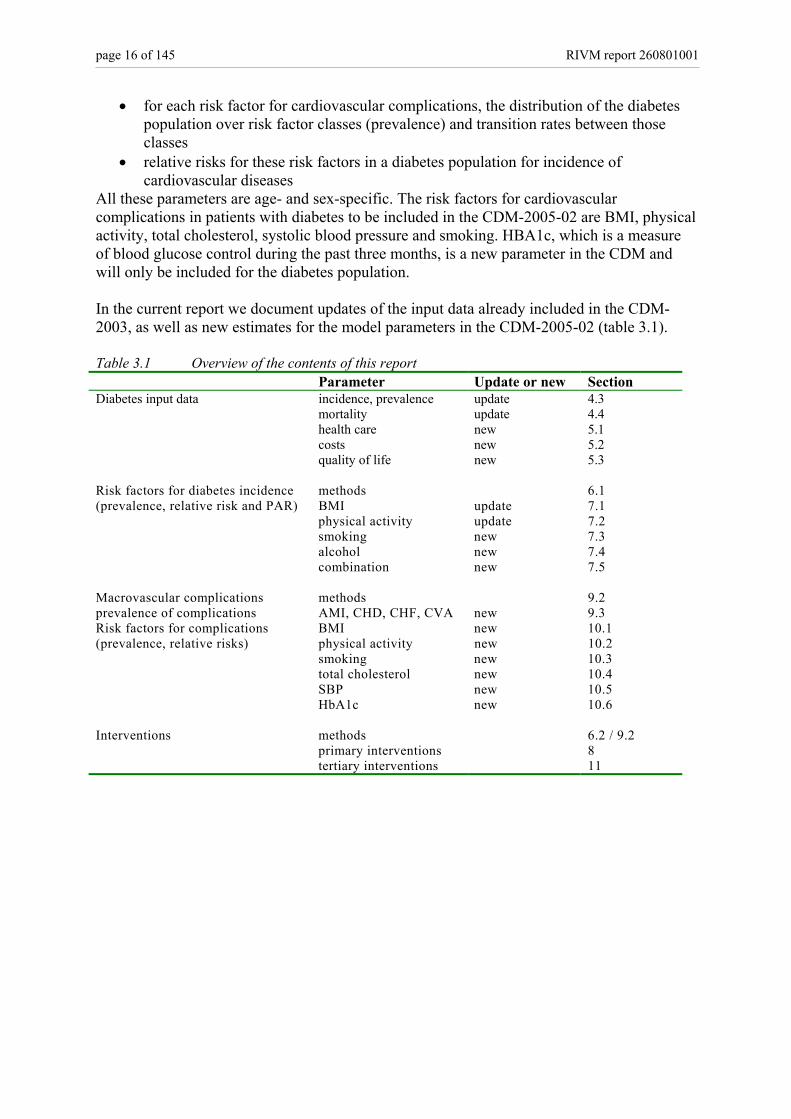
All these parameters are age- and sex-specific. The risk factors for cardiovascular complications in patients with diabetes to be included in the CDM-2005-02 are BMI, physical activity, total cholesterol, systolic blood pressure and smoking. HBA1c, which is a measure of blood glucose control during the past three months, is a new parameter in the CDM and will only be included for the diabetes population. In the current report we document updates of the input data already included in the CDM-2003, as well as new estimates for the model parameters in the CDM-2005-02 (table 3.1). Table 3.1 Overview of the contents of this report Parameter Update or new Section Diabetes input data incidence, prevalence update 4.3 mortality update 4.4 health care new 5.1 costs new 5.2 quality of life new 5.3 Risk factors for diabetes incidence methods 6.1 (prevalence, relative risk and PAR) BMI update 7.1 physical activity update 7.2 smoking new 7.3 alcohol new 7.4 combination new 7.5 Macrovascular complications methods 9.2 prevalence of complications AMI, CHD, CHF, CVA new 9.3 Risk factors for complications BMI new 10.1 (prevalence, relative risks) physical activity new 10.2 smoking new 10.3 total cholesterol new 10.4 SBP new 10.5 HbA1c new 10.6 Interventions methods 6.2 / 9.2 primary interventions 8 tertiary interventions 11
RIVM report 260801001 page 17 of 145
Part II Diabetes input data in the CDM
4. Incidence, prevalence and mortality of diabetes RT Hoogenveen, CA Baan
4.1 Introduction In 2000, incidence, prevalence and mortality rates were estimated for all chronic diseases included in the RIVM Chronic Disease Model 2. For reasons of comparability, the same approach was used for all chronic diseases included in the CDM. At this moment, more recent incidence and prevalence data have become available that enable us to update the Chronic Disease Model parameters. In the current report the analysis made for diabetes mellitus is described. First, the disease modeling analyses (Dismod method) will briefly be introduced and then the recent data on prevalence and incidence of diabetes used will be presented. In the two last sections we will focus in more detail on the methods used for estimating the mortality estimates and discuss the results of mortality estimates.
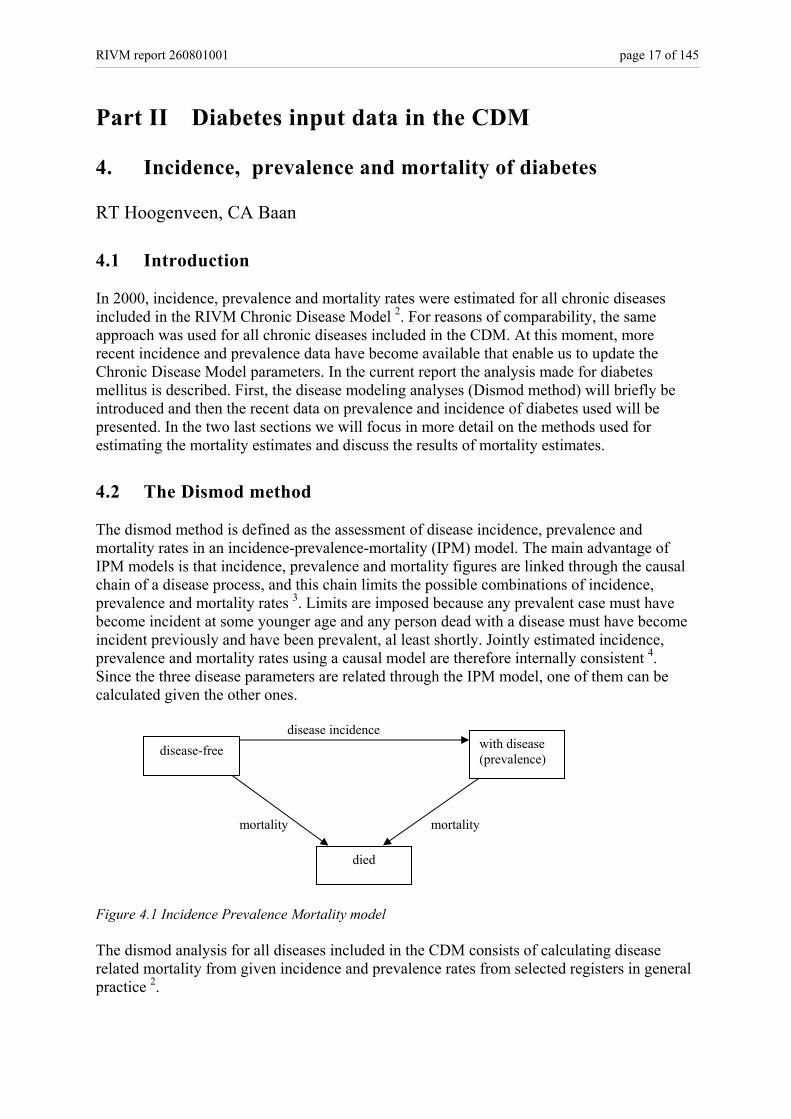
4.2 The Dismod method The dismod method is defined as the assessment of disease incidence, prevalence and mortality rates in an incidence-prevalence-mortality (IPM) model. The main advantage of IPM models is that incidence, prevalence and mortality figures are linked through the causal chain of a disease process, and this chain limits the possible combinations of incidence, prevalence and mortality rates 3. Limits are imposed because any prevalent case must have become incident at some younger age and any person dead with a disease must have become incident previously and have been prevalent, al least shortly. Jointly estimated incidence, prevalence and mortality rates using a causal model are therefore internally consistent 4. Since the three disease parameters are related through the IPM model, one of them can be calculated given the other ones. disease incidence
mortality mortality Figure 4.1 Incidence Prevalence Mortality model The dismod analysis for all diseases included in the CDM consists of calculating disease related mortality from given incidence and prevalence rates from selected registers in general practice 2.
disease-free with disease (prevalence)
died

page 18 of 145 RIVM report 260801001
4.3 Incidence and prevalence data At the internet site the Public Health Compass 2004, Dutch data (age-standardized) on incidence and prevalence of diabetes are presented, both from general practitioner (GP) registrations as well as from epidemiological studies 5. The validity of all data from the GP has been assessed by evaluating the degree of representativeness, continuity, completeness and freedom from ambiguity of each source. The data sources used in the IPM-model have been selected from all studies presented at the internet site, using the following criteria:
1. The observation period is around year 2000 2. The study must be a GP study since we want to assess the effect of diseases in terms
of health care use (i.e. known by the general practitioner) 3. The number of participants in the study must be over 10,000 4. The registration period has to be sufficiently long in order to include patients who
rarely visit the general practitioner (registration period ≥ 1 year)
For diabetes, five data sources have been selected (table 4.1). More detail about the registration projects are given at the internet site The Public Health Compass 2004 6. Table 4.1 Registration projects in general practice used for Dismod analysis diabetes mellitus
Registration projects in general practice
Region Type of registration Period Period used
Size
2nd National Study (NS2) National Contact registration 2000-2002 2000-2002 395,000 Continuos Morbidity Registration (CMR)
Region Nijmegen
Contact registration Since 1971 continuous
1996-2000 12,000
Transition Project - 1 Multi-regional Episode-registration Since 1985 1985-2000
170,000 py
Registration Network General practices (RNH)
Region Limburg
Problem list Since 1988 continuous
1997-2000 79,000
Registration Network University general practices Leiden and environs (RNUH LEO) -2
Region Leiden Problem list Since 1989 1998-2000 30,000
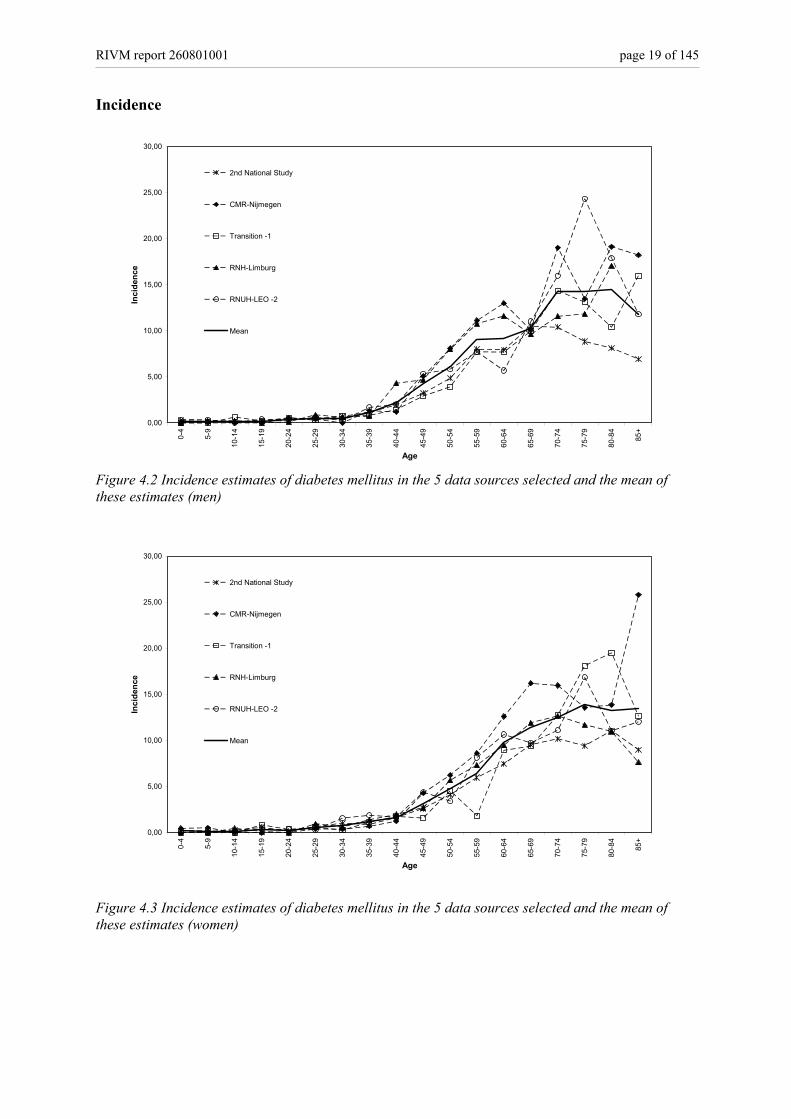
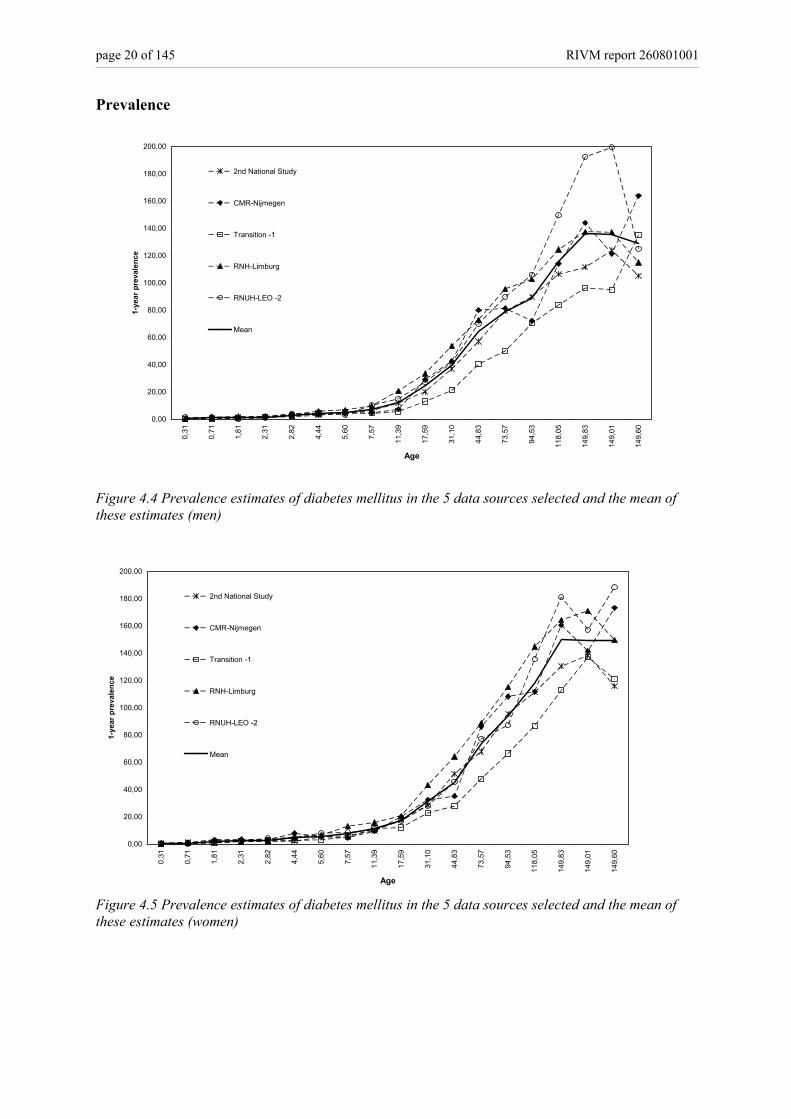
Diabetes incidence and prevalence estimates for men and women are presented in figures 4.2-4.5.
RIVM report 260801001 page 19 of 145
Incidence
0,00
5,00
10,00
15,00
20,00
25,00
30,00
0-4
5-9
10-1
4
15-1
9
20-2
4
25-2
9
30-3
4
35-3
9
40-4
4
45-4
9
50-5
4
55-5
9
60-6
4
65-6
9
70-7
4
75-7
9
80-8
4
85+
Age
Inci
denc
e
2nd National Study
CMR-Nijmegen
Transition -1
RNH-Limburg
RNUH-LEO -2
Mean
Figure 4.2 Incidence estimates of diabetes mellitus in the 5 data sources selected and the mean of these estimates (men)
0,00
5,00
10,00
15,00
20,00
25,00
30,00
0-4
5-9
10-1
4
15-1
9
20-2
4
25-2
9
30-3
4
35-3
9
40-4
4
45-4
9
50-5
4
55-5
9
60-6
4
65-6
9
70-7
4
75-7
9
80-8
4
85+
Age
Inci
denc
e
2nd National Study
CMR-Nijmegen
Transition -1
RNH-Limburg
RNUH-LEO -2
Mean
Figure 4.3 Incidence estimates of diabetes mellitus in the 5 data sources selected and the mean of these estimates (women)
page 20 of 145 RIVM report 260801001
Prevalence
0,00
20,00
40,00
60,00
80,00
100,00
120,00
140,00
160,00
180,00
200,00
0,31
0,71
1,81
2,31
2,82
4,44
5,60
7,57
11,3
9
17,5
9
31,1
0
44,8
3
73,5
7
94,5
3
118,
05
149,
83
149,
01
149,
60
Age
1-ye
ar p
reva
lenc
e
2nd National Study
CMR-Nijmegen
Transition -1
RNH-Limburg
RNUH-LEO -2
Mean
Figure 4.4 Prevalence estimates of diabetes mellitus in the 5 data sources selected and the mean of these estimates (men)
0,00
20,00
40,00
60,00
80,00
100,00
120,00
140,00
160,00
180,00
200,00
0,31
0,71
1,81
2,31
2,82
4,44
5,60
7,57
11,3
9
17,5
9
31,1
0
44,8
3
73,5
7
94,5
3
118,
05
149,
83
149,
01
149,
60
Age
1-ye
ar p
reva
lenc
e
2nd National Study
CMR-Nijmegen
Transition -1
RNH-Limburg
RNUH-LEO -2
Mean
Figure 4.5 Prevalence estimates of diabetes mellitus in the 5 data sources selected and the mean of these estimates (women)
RIVM report 260801001 page 21 of 145
4.4 Mortality data Mortality is divided in mortality with diabetes and mortality without diabetes. The mortality rates with diabetes are specified by age and sex, but unadjusted for other confounders such as epidemiological risk factors and co-morbid diseases. The mortality rates with and without diabetes are fully defined within the IPM model context. This definition has several consequences:
1) the definition does not imply that the mortality rates with diabetes equal the empirical diabetes mortality rates based on death registrations with diabetes as primary or secondary cause of death,
2) the mortality rates with diabetes may result from co-morbid diseases. For diabetes mortality, rates result largely from macro-vascular complications. Thus, aggregating the mortality rates with diabetes and mortality rates with cardiovascular disease results in double counting,
The dismod analyses for diabetes consisted of the following steps:
1) calculate a mean incidence and prevalence rate based on the sources selected (presented above in section 4.3)
2) calculate point prevalence rates by subtracting the incidence rates from the 1-year period prevalence rates obtained in step 1
3) estimate mortality rates with diabetes from these mean incidence and point prevalence rates using the IPM model
4) estimate excess mortality rates using relative risk values presented in epidemiological studies
5) compare the results from step 3 with estimates of mortality with diabetes obtained in step 4 and selection of the mortality rates with diabetes used in the CDM
6) Validation of mortality rates Ad 3: Estimating excess mortality rates from these mean incidence and point prevalence rates using the IPM model In an IPM model, mortality can be estimated by the incidence and prevalence with the following equation 7:
))(1)((
)()(
)()(
tprevtprev
tprevt
tinctmortDM
−∂∂
−= (4.1)
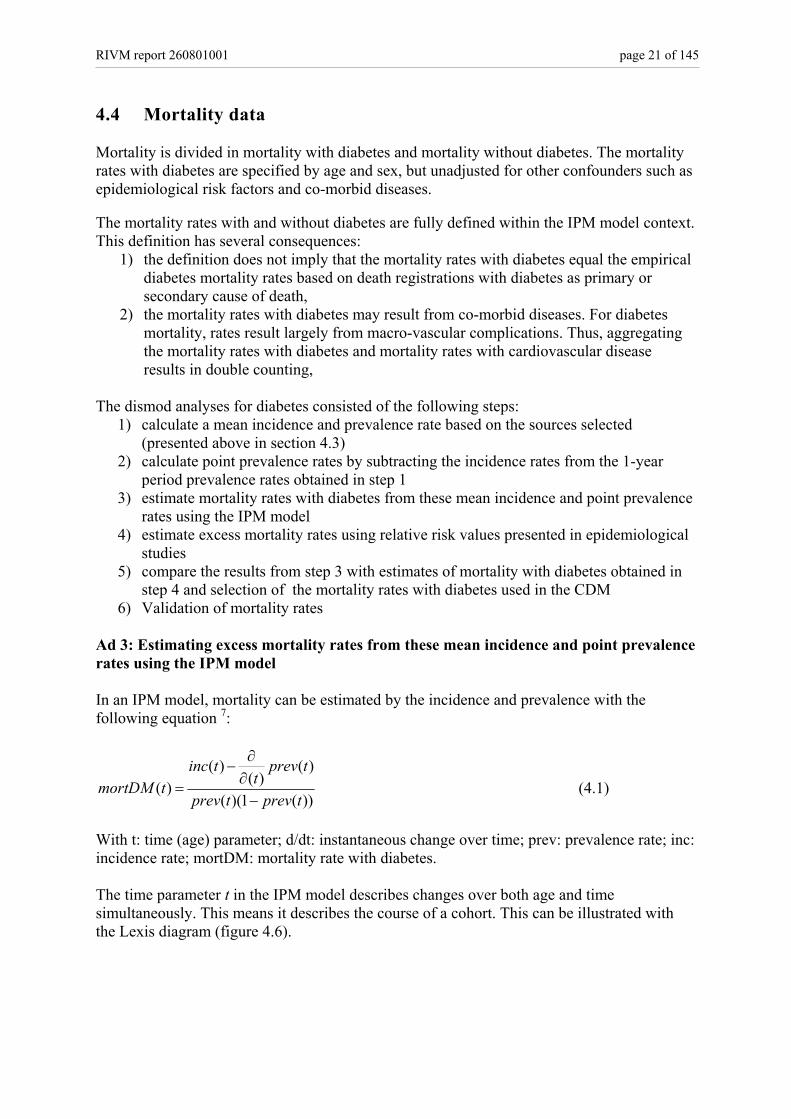
With t: time (age) parameter; d/dt: instantaneous change over time; prev: prevalence rate; inc: incidence rate; mortDM: mortality rate with diabetes. The time parameter t in the IPM model describes changes over both age and time simultaneously. This means it describes the course of a cohort. This can be illustrated with the Lexis diagram (figure 4.6).
page 22 of 145 RIVM report 260801001
Age change over time a+∆t change over age change within cohort a 0 t t+∆t time Figure 4.6 Lexis diagram: the relation between time, age and cohort The Lexis diagram describes a population in terms of changes over age for fixed time (vertical line, age-effects), changes over time for fixed age (horizontal line, period effects), and changes within cohorts (diagonal line). The incidence and prevalence rates available from registries in general practice describe the changes over age and thus follow the vertical line. One study, the CMR-Nijmegen, estimates the incidence and prevalence continuously over a longer period. With these estimates it is possible to estimate age-standardized changes over time of disease prevalence rates and thus follow the horizontal line. Combining these two estimates (horizontal and vertical) gives the change of diabetes prevalence rate during a 1-year time interval. The mortality rate with diabetes is then calculated using:
))(1)((
)()()(
tprevtprev
tprevta
tinctmortDM
−
∂∂
+∂∂
− (4.2)
With δ/δa: age-change for fixed year; δ/δt: time change for standardized age. The time changes for standardized age were derived from CMR Nijmegen. We calculated the 1-year relative changes specified by gender and by age. The relative changes were calculated by weighted linear regression on the calculated empirical 1-year relative changes. ∆ prev (a)/prev (a) is the relative change of the disease prevalence rates over time for given age. α is the autonomous change (intercept) β describes the relation with age. If β > 0 the yearly increase is larger (or the decrease is smaller) for higher ages, if β < 0 the yearly increase is smaller (or the decrease is larger).The regression model applied was:
( )aaprevaprev βα 01.0)()(
+=∆ (4.3)
With a: age (years); prev: disease prevalence rate; ∆ change over time; α intercept; β age regression coefficient. The results are presented in table 4.2. For men aged 40 years, the prevalence rate has increased with 15.5% per year over the period 1990-2000, for women aged 40 years the prevalence rate has increased with 7.1% per year over the period 1990-2003.
RIVM report 260801001 page 23 of 145
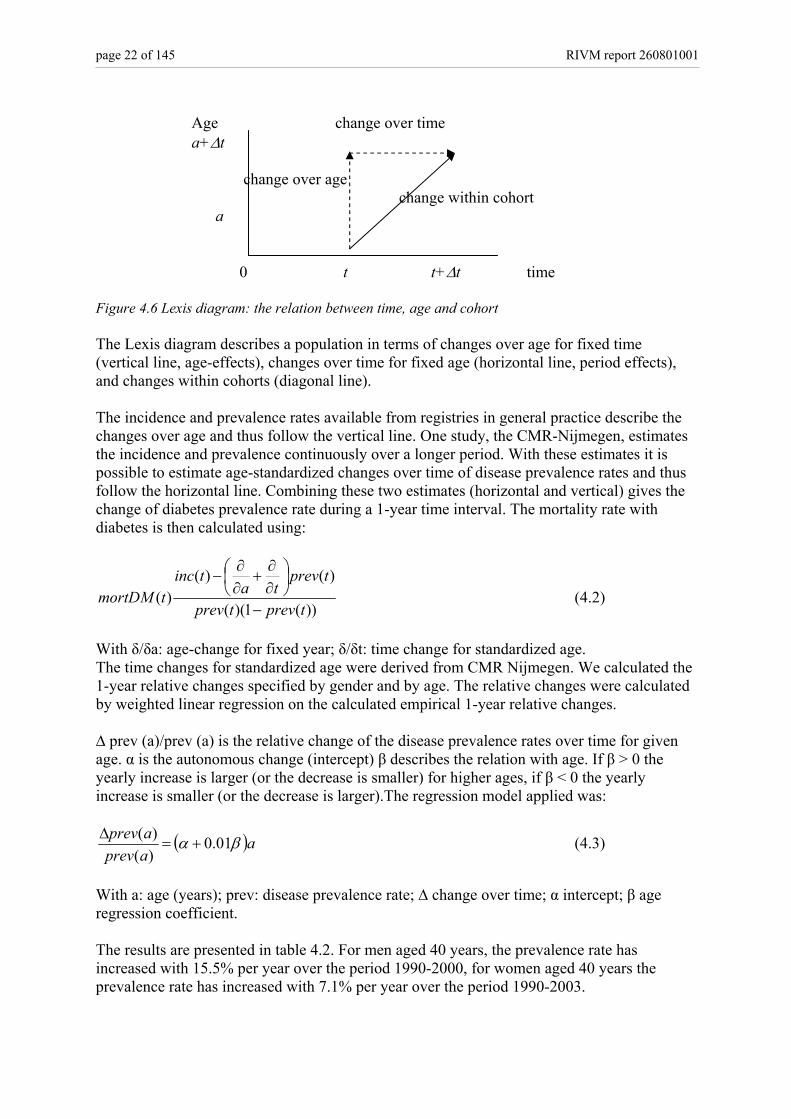
Table 4.2: The relative changes of the diabetes prevalence over the period 1990-2003 and calculated values for age 40 and 60 years Men Women Parameter values α β α β 0.251 -0.241 0.0978 -0.0677 Calculated values for age (%) 40 60 40 60 15.5 10.6 7.1 5.7 Ad 4: Estimating mortality rates with diabetes by using relative risk values presented in epidemiological studies. Mortality for diabetes is also calculated with use of mortality risks obtained from the literature. This method has been described in more detail by Baan and collegues 8. The excess mortality can be estimated by using:
))1(1()1(
−+−
=RRprevRRmortmortDM tot (4.4)
With Morttot: population all cause mortality rates; prev: diabetes prevalence rate; RR: relative risk for total mortality for diabetic versus non-diabetic subjects; mortDM: mortality rate with diabetes. The relative risks for total mortality for diabetic versus non-diabetic subjects are based on prospective population studies and specified by gender and age. A literature search was performed in Medline. For inclusion in our analysis, studies have to fulfill the following criteria:
• Studies have to be performed after 1980 (either started after 1980 or started before 1980 but with a follow-up period after 1980)
• The study population is Caucasian • The reference population is the non-diabetic population • The diabetic population is not a selected subgroup (for instance only hospitalized
diabetic patients, or only insulin treated patients) • The relative risk is reported for men and women separately • The relative risks are reported for age groups not wider than 30 years • The relative risks are not corrected for BMI
Fourty two studies are identified in the medline search, 18 studies are included in the analysis. Details of these studies are summarized in Appendix I. Of the 24 studies not included in the analysis six are excluded because of the study period 9-14. Six of the 24 studies excluded were based on a selective diabetes population 15-20. Four studies used the general population as the reference 21-24, four studies reported relative risks for men and women together 25-27 28, and three studies corrected for BMI 29-31. In addition to the published relative risks, results from one Dutch study are used (CB-project) which are unpublished. All cause mortality rates are obtained from Statistics Netherlands. The relative risks for all cause mortality for diabetics versus non-diabetics are given in figures 4.7 (males) and 4.8 (females).

page 24 of 145 RIVM report 260801001
20 40 50 60 70 80 90age
2
3
4
5
RR
12
3
45
5
6
7
7
7
8
910
11
11
11
12
12
13
14
15
151516
17
1. Balkau, Br Med J, Paris Prospective, 1993 2. Davey Smith, Am J Epid, Whitehall, 1992 3. Ebi, J Clin Epid, Whitehall, 1992 4. Fraser, Arch Intern Med, Adventist Health, 1997 5. Gu, Diab Care, NHANESI, 1998 6. Houterman, Unpublished results, CB Project, 2000 7. Koskinen, AJPH, Social Insurance Finland, 1998 8. Laukkanen, Arch Intern Med, Kuopio, 2001 9. Menotti, J Clin Epid, Seven Countries Netherlands, 2001
10. Menotti, J Clin Epid, Seven Countries Finland, 2001 11. Roper, Diab Care, South Tees UK, 2002 12. Roper, Diab Care, South Tees UK, 2002 13. Simons, Med J Aust, Dubbo, 2000 14. Tan, Diab Care, Tayside Scotland, 2004 15. Tierney, AJPH, North Dakota, 2001 16. Tunstall-Pedoe, Br Med J, Scottish Heart, 1997 17. Vaccaro, Arch Intern Med, MRFIT, 2004
Figure 4.7: All cause mortality risks for males (unadjusted for BMI)
20 40 50 60 70 80 90age
2
3
4
5
RR
1
2
3
3
34
5
6
67
7
7
9
10
11
12
12
13
1. Engstrom, JECH, Malmo Cohort Women, 2000 2. Fraser, Arch Intern Med, Adventist Health, 1997 3. Gu, Diab Care, NHANESI, 1998 4. Houterman, Unpublished results, CB Project, 2000 5. Johansson, Eur Heart J, Goteborg BEDA, 2003 6. Koskinen, AJPH, Social Insurance Finland, 1998 7. Roper, Diab Care, South Tees UK, 2002
8. Roper, Diab Care, South Tees UK, 2002 9. Schopman, Thesis, DOM, 1991 10. Simons, Med J Aust, Dubbo, 2000 11. Tan, Diab Care, Tayside Scotland, 2004 12. T ierney, AJPH, North Dakota, 2001 13. Tunstall-Pedoe, Br Med J, Scottish Heart, 1997
Figure 4.8: All cause mortality risks for females (unadjusted for BMI)
RIVM report 260801001 page 25 of 145
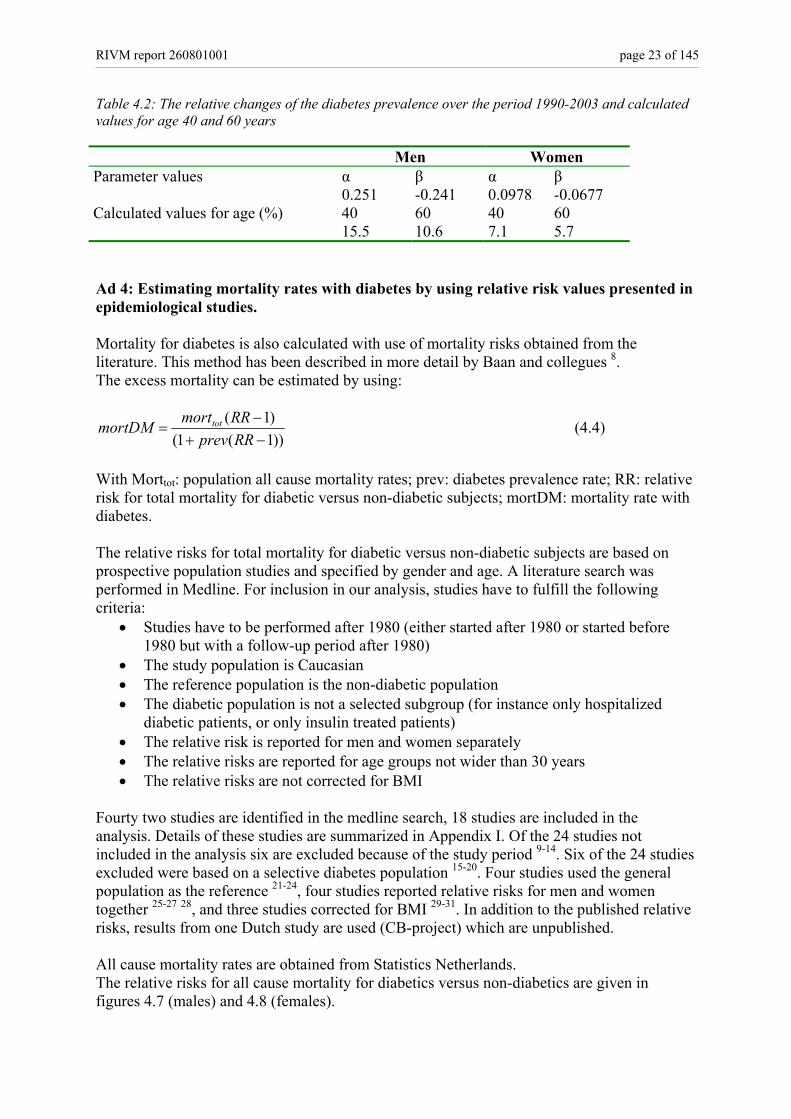
Ad 5: Comparing the mortality rates with diabetes obtained by the IPM model (step 3) with estimates of mortality rates with diabetes using relative risk for mortality (step 4) and selection of the mortality rates with diabetes used in the CDM (figure 4.9).
0
0,02
0,04
0,06
0,08
0,1
0,12
20-2
4
25-2
9
30-3
4
35-3
9
40-4
4
45-4
9
50-5
4
55-5
9
60-6
4
65-6
9
70-7
4
75-7
9
80-8
4
85+
Age
exce
ss m
orta
lity
rate
using Dismod method - men
using mortality risk values literature - men
using Dismod method - women
using mortality risk values literature - women
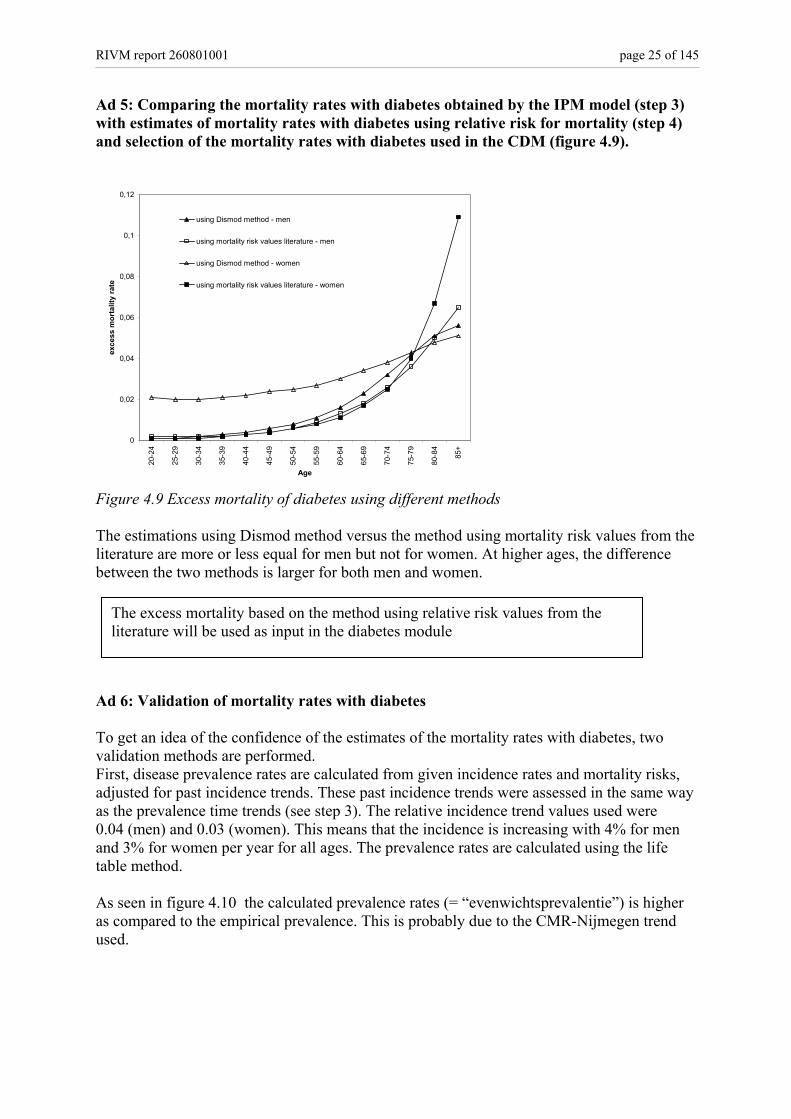
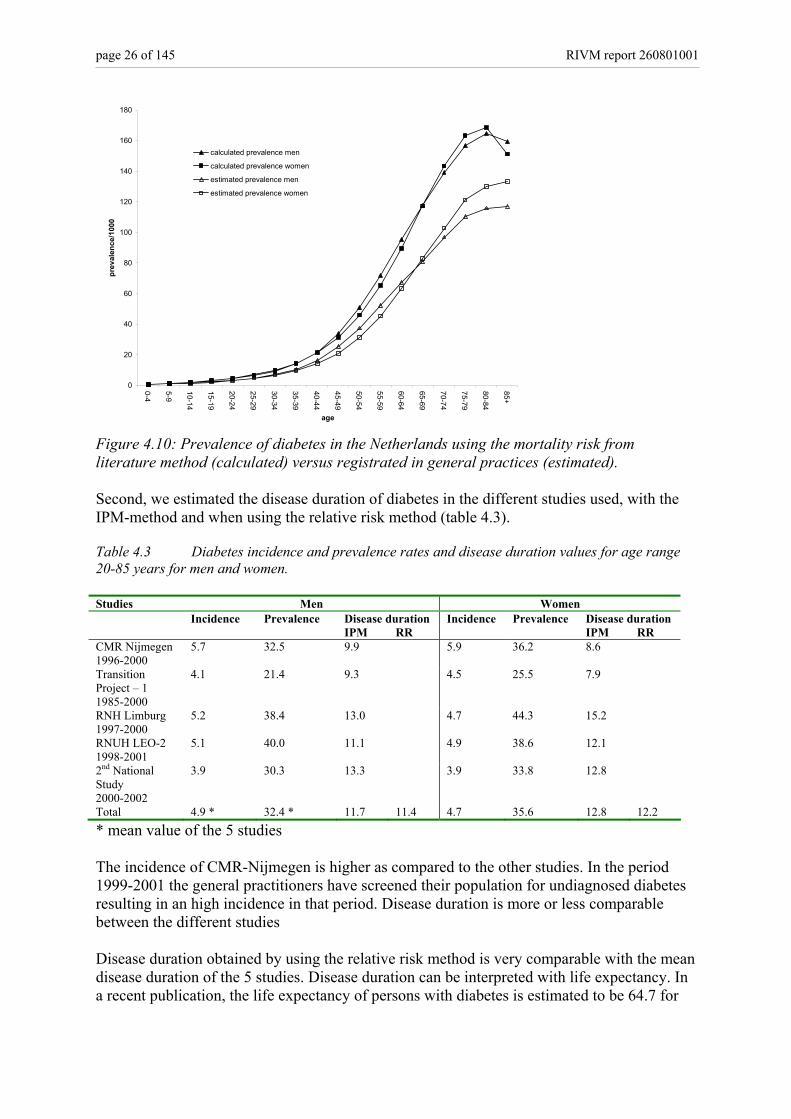
Figure 4.9 Excess mortality of diabetes using different methods The estimations using Dismod method versus the method using mortality risk values from the literature are more or less equal for men but not for women. At higher ages, the difference between the two methods is larger for both men and women. Ad 6: Validation of mortality rates with diabetes To get an idea of the confidence of the estimates of the mortality rates with diabetes, two validation methods are performed. First, disease prevalence rates are calculated from given incidence rates and mortality risks, adjusted for past incidence trends. These past incidence trends were assessed in the same way as the prevalence time trends (see step 3). The relative incidence trend values used were 0.04 (men) and 0.03 (women). This means that the incidence is increasing with 4% for men and 3% for women per year for all ages. The prevalence rates are calculated using the life table method. As seen in figure 4.10 the calculated prevalence rates (= “evenwichtsprevalentie”) is higher as compared to the empirical prevalence. This is probably due to the CMR-Nijmegen trend used.
The excess mortality based on the method using relative risk values from the literature will be used as input in the diabetes module
page 26 of 145 RIVM report 260801001
0
20
40
60
80
100
120
140
160
180
0-4
5-9
10-14
15-19
20-24
25-29
30-34
35-39
40-44
45-49
50-54
55-59
60-64
65-69
70-74
75-79
80-84
85+
age
prev
alen
ce/1
000
calculated prevalence men
calculated prevalence women
estimated prevalence men
estimated prevalence women
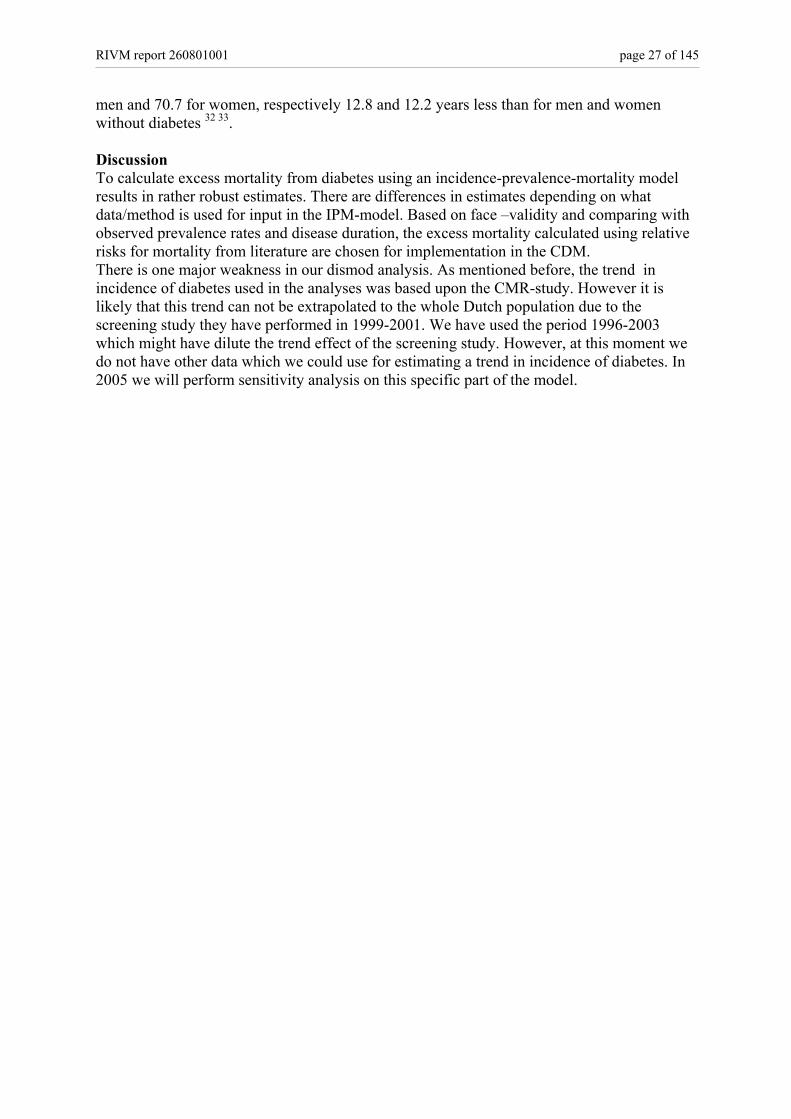
Figure 4.10: Prevalence of diabetes in the Netherlands using the mortality risk from literature method (calculated) versus registrated in general practices (estimated). Second, we estimated the disease duration of diabetes in the different studies used, with the IPM-method and when using the relative risk method (table 4.3). Table 4.3 Diabetes incidence and prevalence rates and disease duration values for age range 20-85 years for men and women. Studies Men Women Incidence Prevalence Disease duration Incidence Prevalence Disease duration IPM RR IPM RR CMR Nijmegen 1996-2000
5.7 32.5 9.9 5.9 36.2 8.6
Transition Project – 1 1985-2000
4.1 21.4 9.3 4.5 25.5 7.9
RNH Limburg 1997-2000
5.2 38.4 13.0 4.7 44.3 15.2
RNUH LEO-2 1998-2001
5.1 40.0 11.1 4.9 38.6 12.1
2nd National Study 2000-2002
3.9 30.3 13.3 3.9 33.8 12.8
Total 4.9 * 32.4 * 11.7 11.4 4.7 35.6 12.8 12.2 * mean value of the 5 studies The incidence of CMR-Nijmegen is higher as compared to the other studies. In the period 1999-2001 the general practitioners have screened their population for undiagnosed diabetes resulting in an high incidence in that period. Disease duration is more or less comparable between the different studies Disease duration obtained by using the relative risk method is very comparable with the mean disease duration of the 5 studies. Disease duration can be interpreted with life expectancy. In a recent publication, the life expectancy of persons with diabetes is estimated to be 64.7 for
RIVM report 260801001 page 27 of 145
men and 70.7 for women, respectively 12.8 and 12.2 years less than for men and women without diabetes 32 33.
Discussion To calculate excess mortality from diabetes using an incidence-prevalence-mortality model results in rather robust estimates. There are differences in estimates depending on what data/method is used for input in the IPM-model. Based on face –validity and comparing with observed prevalence rates and disease duration, the excess mortality calculated using relative risks for mortality from literature are chosen for implementation in the CDM. There is one major weakness in our dismod analysis. As mentioned before, the trend in incidence of diabetes used in the analyses was based upon the CMR-study. However it is likely that this trend can not be extrapolated to the whole Dutch population due to the screening study they have performed in 1999-2001. We have used the period 1996-2003 which might have dilute the trend effect of the screening study. However, at this moment we do not have other data which we could use for estimating a trend in incidence of diabetes. In 2005 we will perform sensitivity analysis on this specific part of the model.

page 28 of 145 RIVM report 260801001

RIVM report 260801001 page 29 of 145
5. Diabetes health care utilization, costs and quality of life JNS Struijs, SMC Vijgen, PHM van Baal 5.1 Diabetes health care utilization As yet the health care utilization of patients with diabetes mellitus has been insufficiently quantified. Detailed information of multidisciplinary health care utilization of diabetes mellitus patients is not collected systematically in the Netherlands. In order to explore the potential benefits of policy interventions, it is necessary to have insight into the use of multidisciplinary health care services of patients with diabetes mellitus. An overview of current knowledge of health care utilization of diabetes mellitus patients is given in Appendix II. Data for Appendix II were obtained from the Dutch Second National Survey of General Practice (DSNGP-2) 34, the National Medical Register 35 and the National Register of ambulatory care 36. Furthermore, available Dutch studies in the literature with quantitative information were used 37-39. General Practitioner care GP care is quantified in “number of complaints expressed to the GP per year” i.e. partial contacts. A partial contact can be a telephone consult or a physical visit. A visit comprises on average 1.4 partial contacts. Male diabetes patients have on average 10.5 partial contacts a year and female patients 13.3, compared to non-diabetics who have on average 2.9 and 4.8 contacts. Of these contacts, only 3.3 (for men) and 3.2 (for women) are related to diabetes mellitus. A clear age gradient is observed in the use of GP care. The younger diabetes patients visit their GP less frequently than diabetes patients in the older age classes, which is in line with other diseases 38. Pharmaceuticals Over 80% of the diabetes patients use prescribed medication versus only one third in non-diabetics. Diabetics are issued 25.8 prescriptions per year by their GPs versus 7.6 prescriptions a year for non-diabetic patients. The vast majority of the prescriptions (18.6) are not related to diabetes mellitus but to other complaints. Medical specialist Yearly, about three-quarters of type 2 diabetes mellitus patients consult a medical specialist 37. For type 1 diabetes mellitus patients the percentage is 96%. The mean number of visits to the medical specialist is slightly higher for women than for men, i.e. 2.7 for women versus 2.6 for men. Hospital care Yearly, about 10.3% of all diabetes patients are admitted to the hospital. This percentage varies from 10.1 for men to 10.5 for women. Male patients who are admitted to the hospital are admitted 2.4 times a year, while female patients who are admitted to the hospital are admitted 2.3 times a year. The average length of stay is 7.0 days for male diabetic patients and 8.0 days for female patients. For the average length of stay a clear age gradient is observed for women, while for men the average length of stay drops in the oldest age class. Most of the discharge diagnoses correspond to complications of diabetes.
page 30 of 145 RIVM report 260801001
Other health care services Yearly, between 13% and 28% of the patients consult a dietician 37 39. The utilization of a dietician can not be specified for age and gender, although a distinction was made for diabetes patients under the age of 44 years (8.2%) and above the age of 44 (13.2%)39. About one fifth of the diabetes patients uses home care. The same percentage of diabetes mellitus patients visits a physiotherapist 37. Both numbers can not be specified by age and gender. Data about nursing home care for diabetes patients are lacking. A tentative estimation is that about 20-30% of the nursing home residents have diabetes mellitus 40. Summary and future research The health care utilization of patients with diabetes mellitus has been quantified for GPs, pharmaceuticals, the medical specialists and hospital care. Current knowledge of health care utilization with regard to other health care services such as home care, dietician, physiotherapist, podiatrist and nursing home care is insufficient. Also, the actual use of the diabetic nurse is still unclear. Therefore, additional data sources and registers need to be investigated to fill up current question marks in Appendix II. Furthermore, a distinction between the health care utilization of diabetes patients with and without complications needs to be made, since the patterns of health care utilization of these different patient groups (with and without complications) differ considerably 41-43. Additional research is necessary.
5.2 Diabetes costs To be able to quantify the potential effect of prevention strategies in terms of preventable (health care) costs, accurate and recent data on the costs of diabetes are required. Although several studies have been performed in the past 10 years, new calculations are necessary. In this section we describe the studies that have been performed so far and the methods we use for our cost analysis. In the Netherlands, four diabetes cost studies have been performed in the past 10 years (table 5.1). Two different estimation procedures have been used in these studies; the top-down method and the bottom-up method. A bottom-up study lists the disease-related care activities (of care for diabetes) and relates these activities to costs. This is a labour intensive way of calculating costs, and can lead to a large variety in cost estimates14. The Code-2 study 44 is such a bottom-up study. In this study the data were collected by primary health care providers, who registered the resource utilization of their patients with type 2 diabetes. With this method it is difficult to determine the complete resource utilization of all diabetic patients in the Netherlands, and to determine which care activities are related to diabetes. The “cost of illness studies” by Polder et al. 45 46 are top-down studies. Top-down studies determine the total costs of a disease by allocating costs to specific combinations of health care services with diagnostic groups, based on the most suitable registrations. For diabetes this method results in an underestimation of the total costs, because costs of (some) complications are not allocated to diabetes but to cardiovascular diseases for example.
RIVM report 260801001 page 31 of 145
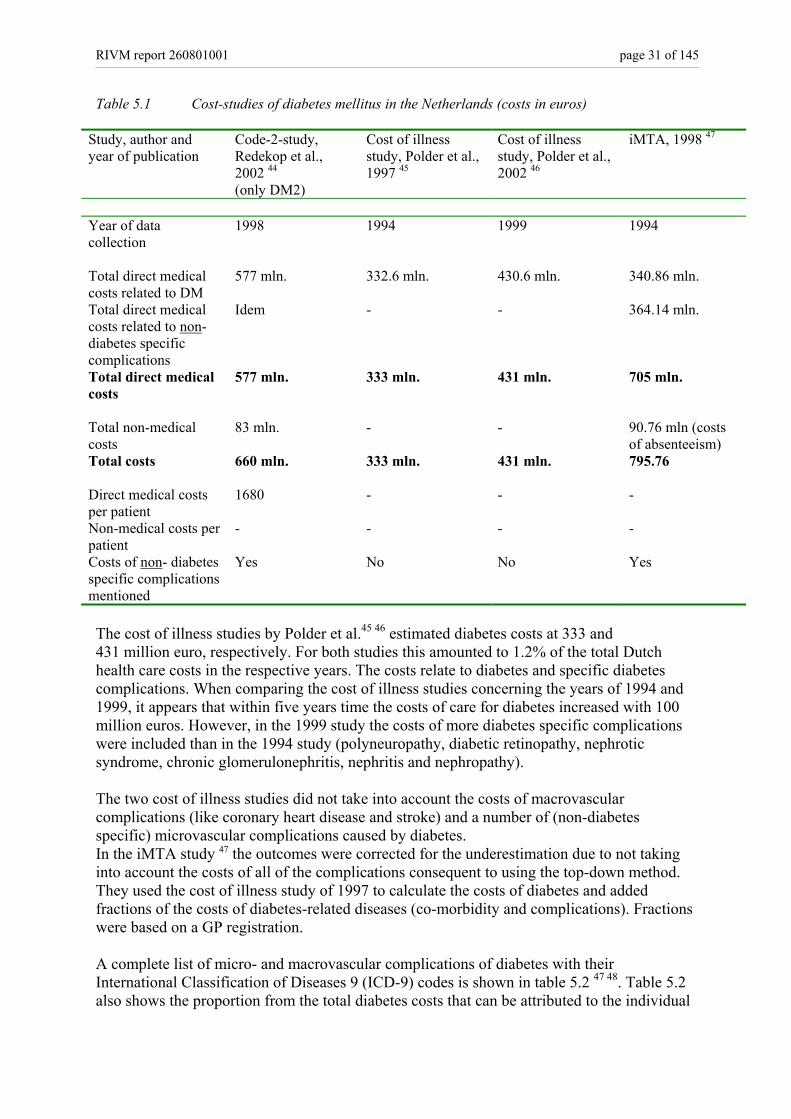
Table 5.1 Cost-studies of diabetes mellitus in the Netherlands (costs in euros)
Study, author and year of publication
Code-2-study, Redekop et al., 2002 44 (only DM2)
Cost of illness study, Polder et al., 1997 45
Cost of illness study, Polder et al., 2002 46
iMTA, 1998 47
Year of data collection
1998 1994 1999 1994
Total direct medical costs related to DM
577 mln. 332.6 mln. 430.6 mln. 340.86 mln.
Total direct medical costs related to non-diabetes specific complications
Idem - - 364.14 mln.
Total direct medical costs
577 mln. 333 mln. 431 mln. 705 mln.
Total non-medical costs
83 mln. - - 90.76 mln (costs of absenteeism)
Total costs
660 mln. 333 mln. 431 mln. 795.76
Direct medical costs per patient
1680 - - -
Non-medical costs per patient
- - - -
Costs of non- diabetes specific complications mentioned
Yes No No Yes
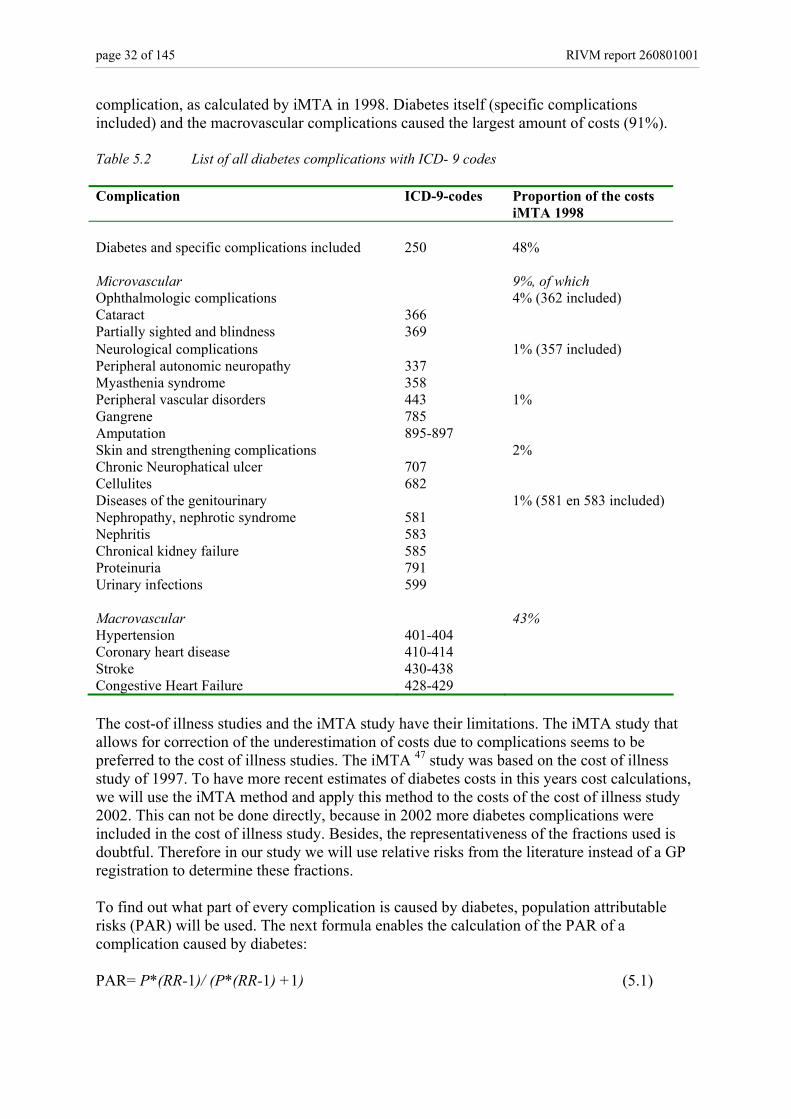
The cost of illness studies by Polder et al.45 46 estimated diabetes costs at 333 and 431 million euro, respectively. For both studies this amounted to 1.2% of the total Dutch health care costs in the respective years. The costs relate to diabetes and specific diabetes complications. When comparing the cost of illness studies concerning the years of 1994 and 1999, it appears that within five years time the costs of care for diabetes increased with 100 million euros. However, in the 1999 study the costs of more diabetes specific complications were included than in the 1994 study (polyneuropathy, diabetic retinopathy, nephrotic syndrome, chronic glomerulonephritis, nephritis and nephropathy). The two cost of illness studies did not take into account the costs of macrovascular complications (like coronary heart disease and stroke) and a number of (non-diabetes specific) microvascular complications caused by diabetes. In the iMTA study 47 the outcomes were corrected for the underestimation due to not taking into account the costs of all of the complications consequent to using the top-down method. They used the cost of illness study of 1997 to calculate the costs of diabetes and added fractions of the costs of diabetes-related diseases (co-morbidity and complications). Fractions were based on a GP registration. A complete list of micro- and macrovascular complications of diabetes with their International Classification of Diseases 9 (ICD-9) codes is shown in table 5.2 47 48. Table 5.2 also shows the proportion from the total diabetes costs that can be attributed to the individual
page 32 of 145 RIVM report 260801001
complication, as calculated by iMTA in 1998. Diabetes itself (specific complications included) and the macrovascular complications caused the largest amount of costs (91%). Table 5.2 List of all diabetes complications with ICD- 9 codes Complication ICD-9-codes Proportion of the costs
iMTA 1998 Diabetes and specific complications included
250
48%
Microvascular
9%, of which
Ophthalmologic complications 4% (362 included) Cataract 366 Partially sighted and blindness 369 Neurological complications 1% (357 included) Peripheral autonomic neuropathy 337 Myasthenia syndrome 358 Peripheral vascular disorders 443 1% Gangrene 785 Amputation 895-897 Skin and strengthening complications 2% Chronic Neurophatical ulcer 707 Cellulites 682 Diseases of the genitourinary 1% (581 en 583 included) Nephropathy, nephrotic syndrome 581 Nephritis 583 Chronical kidney failure 585 Proteinuria 791 Urinary infections 599 Macrovascular
43%
Hypertension 401-404 Coronary heart disease 410-414 Stroke 430-438 Congestive Heart Failure 428-429 The cost-of illness studies and the iMTA study have their limitations. The iMTA study that allows for correction of the underestimation of costs due to complications seems to be preferred to the cost of illness studies. The iMTA 47 study was based on the cost of illness study of 1997. To have more recent estimates of diabetes costs in this years cost calculations, we will use the iMTA method and apply this method to the costs of the cost of illness study 2002. This can not be done directly, because in 2002 more diabetes complications were included in the cost of illness study. Besides, the representativeness of the fractions used is doubtful. Therefore in our study we will use relative risks from the literature instead of a GP registration to determine these fractions. To find out what part of every complication is caused by diabetes, population attributable risks (PAR) will be used. The next formula enables the calculation of the PAR of a complication caused by diabetes: PAR= P*(RR-1)/ (P*(RR-1) +1) (5.1)
RIVM report 260801001 page 33 of 145
with P: prevalence of diabetes in the Netherlands in 1999; RR: relative risk for diabetic patients to develop a complication as compared to non-diabetics. These population attributable risks have been multiplied by the costs for that complication, resulting in costs that could be attributed to diabetes. The prevalence data of diabetes will be standardized to the age- and sex distribution of the Netherlands in 2004. The relative risks for complications implemented in the Chronic Disease Model will be used. These relative risks will be updated first. The etiological fractions will then be calculated for men and women separately in 5-year age classes. The PARs will be multiplied by the total costs of the complications as calculated in the cost of illness study 2002. The costs in 1999 will be corrected for inflation by using the consumer price indexes of Statistics Netherlands in 2004. The results of this study will be presented in 2005.
5.3 Diabetes Quality of life
The CDM is used to compare scenarios not only in terms of mortality but also in terms of morbidity. Two metrics that are often used to combine morbidity and mortality are quality adjusted life years (QALYs) and Disability Adjusted Life Years (DALYs). QALYs and DALYs have in common that they use a “weight” to correct for a health state that is less perfect. This weight is either called a disability weight (using DALYs) or a quality weight (using QALYs). A chronic disease with a severe impact on quality of life could have a disability weight of 0.9 on a scale of 0 (perfect health state) to 1 (death). Correspondingly, this disease would be valued with a quality weight of 0.1 on a scale of 0 (death) to 1 (perfect health state). QALYs aggregate the actual health quality over time, DALYs aggregate the loss of health compared to perfect health. In the CDM we use DALY weights instead of QALY weight to calculate the health quality of time for several reasons: - daly weights are more easily available for more diseases; - the same methodology is used to derive Daly weights for all diseases so the ranking is
more consistent; - the use of DALY weights is common within the RIVM to calculate burden of disease. How the quality adjusted life years are estimated in the CDM, is described in more detail in the RIVM report 260706002 49. In 2005 a review of the literature on quality of life for diabetes patients will be finished. The results of the review will be used to put the estimated quality adjusted life years into perspective.

page 34 of 145 RIVM report 260801001
RIVM report 260801001 page 35 of 145
Part III Prevention of diabetes
6. Risk factors for diabetes incidence and primary prevention MAM Jacobs-van der Bruggen
6.1 Introduction This part of the Technical Report focuses on factors concerning the primary prevention of diabetes mellitus. Primary prevention strategies intend to prevent or delay the development of new cases of diabetes by modifying risk factor exposure in a diabetes-free population. We focus on the risk factors body mass index (BMI), physical inactivity, smoking, and alcohol. These risk factors were already included as risk factors for diabetes (BMI and physical inactivity) or other diseases (smoking and alcohol) in the CDM-2003. The distribution of risk factors in the Dutch population (prevalence), and their relation with diabetes incidence (relative risks) are input variables in the model. The purpose of this part of the report is to justify the updated or new diabetes related input in the CDM, and to review international results of - primary prevention of diabetes - trials.
6.2 Methods Prevalence of risk factors for diabetes incidence in the Dutch population Prevalence data of risk factors in the Dutch population were retrieved from Dutch registries. For overweight, physical inactivity and alcohol consumption, data were used from the lifestyle monitoring surveys (Permanent Onderzoek Leefstijl, POLS) from Statistics Netherlands (CBS). Smoking data were obtained from the Dutch organization for public health and smoking (Stichting Volksgezondheid en Roken, STIVORO). Relative risks of risk factors for incident diabetes Relative risks for diabetes incidence for BMI, physical inactivity, smoking and alcohol consumption were determined from the international literature. Relevant studies were obtained through Pubmed searches, RIVM diabetes-experts, and references tracking of the articles and reviews retrieved. Studies were used to estimate the relative risk of the risk factor involved if the following criteria were met: • publication year 1990-2004 • prospective longitudinal cohort study on diabetes incidence • at least 50 incident cases of diabetes • Caucasian population • measurement of risk factor in units or categories equal or convertible to categories in the
CDM • diabetes incidence rate < 10% if risk estimates are reported as odds ratios because odds
ratios cannot be interpreted as relative risks if the incidence is > 10%, and • if the number of publications is sufficient: sex-specific relative risks
page 36 of 145 RIVM report 260801001
Dutch monitoring studies Relative risks for body mass index, physical inactivity, smoking and alcohol consumption on diabetes incidence were also determined for a Dutch population for which data were available at the RIVM. These calculated relative risks were compared to the updated or new input in the CDM (as estimated from the international literature) for validation. If the results differ substantially, sensitivity analysis will be performed when modeling diabetes scenarios to quantify the variation in outcomes when using different relative risks. The study population comprises Dutch people aged 20-59 years at baseline from Doetinchem and Maastricht, who participated in monitoring studies between 1987 and 2002. The monitoring studies were conducted in three rounds (Peilstationsproject Hart- en vaatziekten, 1987-1991 50, MORGEN-project, 1993-1997 51 52 and the Doetinchem Cohort Study, 1998-2002 53) and took place at the Municipal Health Service in each town. Respondents filled in two self-administered questionnaires and underwent a medical examination. Inhabitants from Doetinchem who participated in the “Peilstationsproject Hart- en vaatziekten”, between 1987 and 1991 were invited for reevaluations 6 and 11 years later in the monitoring studies of 1993-1997 and 1998-2002. Baseline data for Doetinchem participants (collected during 1987-1991) consisted of demographic characteristics, presence of chronic diseases, risk factors for chronic diseases and anthropometric measurements. Self-reported diabetes status, year of diagnosis and familial diabetes were retrieved from the latest follow-up survey available (i.e. 1993-1997 or 1998-2002). In Maastricht, cross-sectional samples were drawn in 1987-1992 and 1993-1997 in which baseline data were collected. Self reported diabetes status and year of diagnosis were assessed with a short questionnaire that was sent to the participants in 1998. Baseline and follow-up data were linked for 21,939 people. From this dataset we excluded individuals with baseline diabetes, pregnancy or cardiovascular disease. Furthermore we excluded individuals with probable type 1 diabetes at follow-up, individuals who were not Dutch and individuals with missing values for risk factors on diabetes incidence. The dataset for the analysis comprised 20,103 Dutch subjects of whom 292 developed diabetes. Duration of follow-up ranged from 0.5 to 14 years with an average of 7.7 year. Analysis, Body mass index was modeled continuously (per unit BMI) as well as in the CDM categories; moderately overweight (BMI 25-30) versus normal weight (BMI<25), and obese (BMI ≥30) versus normal weight (BMI<25). The analysis were adjusted for age, physical inactivity and smoking. Physical inactivity was modeled as active (at least 4 hours of physical activity each week) versus inactive. From the available data it was not possible to make (three) categories according to the CDM. The analysis were adjusted for age, BMI (continuously) and smoking. Smoking was categorized according to the CDM classes as never, former or current smoking. Analysis were adjusted for age BMI and physical inactivity. Alcohol consumption was modeled in the sex-specific CDM-categories. However, because of the low prevalences in the highest category (excessive drinking), heavy and excessive drinking were combined. The analysis were adjusted for age, BMI and smoking. Population Attributable Risk (PAR) The PAR is a measure that expresses (in percentages) how many of the cases of diabetes can be attributed to unhealthy behavior (having the risk factor), or stated otherwise; how many of the new cases of diabetes could be prevented if the risk factor concerned would be totally
RIVM report 260801001 page 37 of 145
removed (for example, how many new cases of diabetes could be prevented if everybody had a normal weight). The PAR depends on the prevalence of the risk factor in the population and the relative risk of this risk factor on diabetes incidence, in formula: PAR = p(RR-1)/(p(RR-1)+1) (6.1) With RR: relative risk of the risk factor on diabetes incidence; p: prevalence of the risk factor in the population Because this report focuses on type 2 diabetes, the PAR will refer to preventable new cases of diabetes in the adult population (20 years and older) which is almost equal to the total type 2 diabetes incidence. The PAR is computed age and sex-specific. Within gender, PARs for all 10-year age-classes are added in which each age-specific PAR is weighted by the relative diabetes incidence in that class. Total PAR is computed by adding up the PARs for men and women, weighted for diabetes incidence (0.486 for men and 0.514 for women 54). Primary prevention A literature search was done searching for primary intervention studies. Studies were included if they met the following criteria:
• published between 1990-2003 • study aim: prevention of diabetes incidence • at least 50 people in the intervention group • inclusion of a control group • relevant outcome data available (change in risk factor level or prevention of diabetes
incidence) • follow-up at least 1 year • Caucasian population
This review of the literature provides information on what primary intervention strategies appear to be effective. Based on this information we can determine which strategies are interesting to model with the CDM. However, issues such as feasibility of implementation in the Netherlands, costs of the intervention and translation of trial results into realistic scenarios need to be addressed.

page 38 of 145 RIVM report 260801001
RIVM report 260801001 page 39 of 145
7. Risk factors for diabetes incidence MAM Jacobs-van der Bruggen, RT Hoogenveen Known risk factors for diabetes incidence which are modifiable (as opposed to genetic factors such as ethnicity) are a high weight and physical inactivity. These risk factors were already modeled in CDM-2003. Less well known but potentially interesting modifiable risk factors for diabetes incidence are smoking and alcohol consumption. In this chapter we will update the input data for BMI and physical inactivity and we will explore whether smoking and alcohol consumption should be implemented as new risk factors for diabetes incidence in the CDM-2005-02. We will also determine the potential benefit of prevention strategies which focus on each of these risk factors by means of calculating the population attributable risk (PAR).
7.1 Body Mass Index A high weight is an important risk factor for diabetes 55-57. The most commonly used measure of relative weight is the Body Mass Index (BMI), which is computed as weight in kilograms divided by height in meters squared. A BMI between 18 and 25 is regarded as normal weight. Individuals with a BMI of 25 to 30 or more than 30 are considered moderately and severely overweight (obese), respectively 58. The risk of diabetes is also dependent on the distribution of fat over the body 56 59-61. Accumulation of fat around the waist gives a higher risk of diabetes as compared to accumulation of fat around the hips. Furthermore, duration of overweight and changes in weight are independent risk factors for diabetes incidence 62-64. In the CDM-2003, BMI is modeled in three classes: normal weight (BMI<25), moderately overweight (BMI 25-30) and obese (BMI ≥30). There are several potential sources of information on prevalence of overweight in the Dutch population1. In a Dutch monitoring study (Monitoring risico factoren en gezondheid Nederland, MORGEN), bodyweight was measured, but the information is outdated (1993-1997). Data from a Dutch survey conducted by Statistics Netherlands (CBS-POLS), are more recent, but a disadvantage of this data source is that bodyweight is self-reported. Furthermore, bodyweight and height was reported in classes only. Dependent on actual weight and gender, bodyweight tends to be underreported. We chose the most recent data (CBS 2000-2002) to update the prevalence of overweight in the CDM-2005-01, but upgraded the percentages of overweight and obesity with approximately 3 percent points to correct for the tendency of people to underreport their weight. How this was done is described in an internal report 65. The calculated prevalence of being moderately overweight or obese for Dutch men and women is illustrated in figure 7.1. Overall, about 36% of the Dutch people > 20 year (40% of the men and 31% of the women) are moderately overweight and about 13% (12% of the men and 15% of the women) are obese (standardized to the age distribution of the Dutch population in 2003). The new prevalence input data, with the accompanying transition rates are documented in input file “BMIinput010305.txt”. 1 The update of prevalences of overweight and physical inactivity was performed within the framework of project V/260301, prevention of overweight.
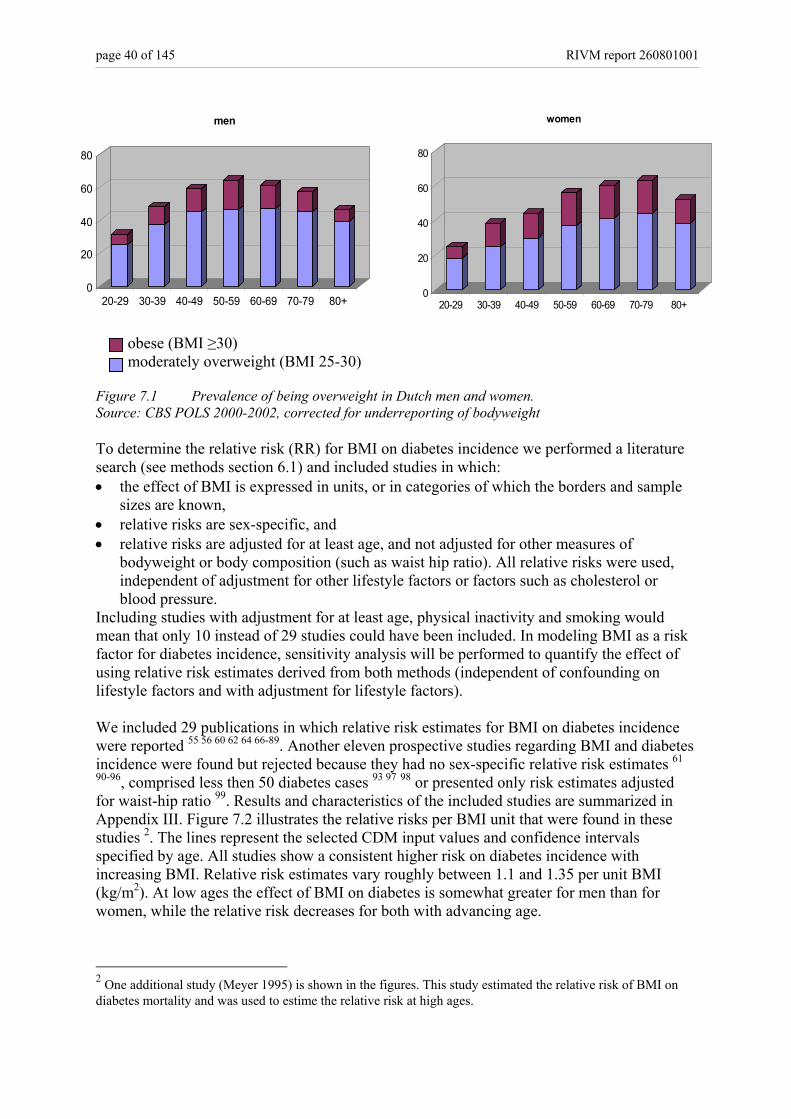
page 40 of 145 RIVM report 260801001
obese (BMI ≥30) moderately overweight (BMI 25-30) Figure 7.1 Prevalence of being overweight in Dutch men and women. Source: CBS POLS 2000-2002, corrected for underreporting of bodyweight To determine the relative risk (RR) for BMI on diabetes incidence we performed a literature search (see methods section 6.1) and included studies in which: • the effect of BMI is expressed in units, or in categories of which the borders and sample
sizes are known, • relative risks are sex-specific, and • relative risks are adjusted for at least age, and not adjusted for other measures of
bodyweight or body composition (such as waist hip ratio). All relative risks were used, independent of adjustment for other lifestyle factors or factors such as cholesterol or blood pressure.
Including studies with adjustment for at least age, physical inactivity and smoking would mean that only 10 instead of 29 studies could have been included. In modeling BMI as a risk factor for diabetes incidence, sensitivity analysis will be performed to quantify the effect of using relative risk estimates derived from both methods (independent of confounding on lifestyle factors and with adjustment for lifestyle factors). We included 29 publications in which relative risk estimates for BMI on diabetes incidence were reported 55 56 60 62 64 66-89. Another eleven prospective studies regarding BMI and diabetes incidence were found but rejected because they had no sex-specific relative risk estimates 61
90-96, comprised less then 50 diabetes cases 93 97 98 or presented only risk estimates adjusted for waist-hip ratio 99. Results and characteristics of the included studies are summarized in Appendix III. Figure 7.2 illustrates the relative risks per BMI unit that were found in these studies 2. The lines represent the selected CDM input values and confidence intervals specified by age. All studies show a consistent higher risk on diabetes incidence with increasing BMI. Relative risk estimates vary roughly between 1.1 and 1.35 per unit BMI (kg/m2). At low ages the effect of BMI on diabetes is somewhat greater for men than for women, while the relative risk decreases for both with advancing age.
2 One additional study (Meyer 1995) is shown in the figures. This study estimated the relative risk of BMI on diabetes mortality and was used to estime the relative risk at high ages.
0
20
40
60
80
20-29 30-39 40-49 50-59 60-69 70-79 80+
men
0
20
40
60
80
20-29 30-39 40-49 50-59 60-69 70-79 80+
women
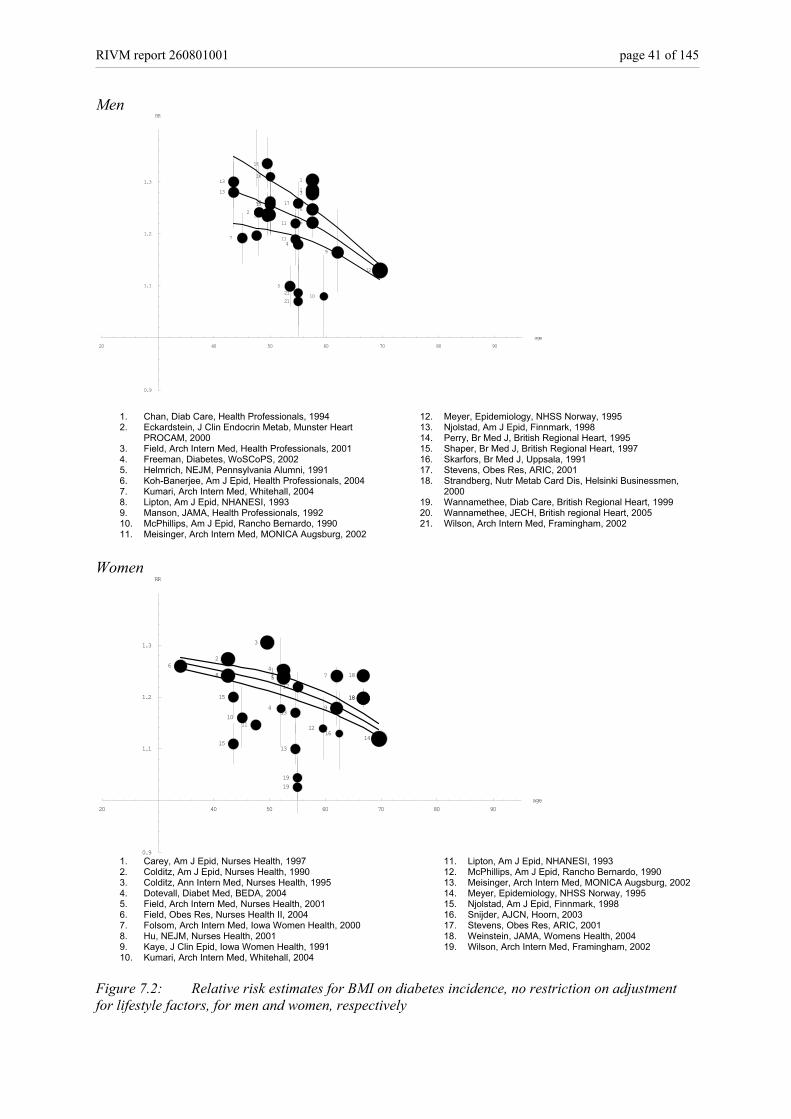
RIVM report 260801001 page 41 of 145
Men
20 40 50 60 70 80 90age
0.9
1.1
1.2
1.3
RR
4
510
11
11
12
1313
7 8
2
14
1515
16
1920
2020
17
2121
113
6
6
9
1. Chan, Diab Care, Health Professionals, 1994 2. Eckardstein, J Clin Endocrin Metab, Munster Heart
PROCAM, 2000 3. Field, Arch Intern Med, Health Professionals, 2001 4. Freeman, Diabetes, WoSCoPS, 2002 5. Helmrich, NEJM, Pennsylvania Alumni, 1991 6. Koh-Banerjee, Am J Epid, Health Professionals, 2004 7. Kumari, Arch Intern Med, Whitehall, 2004 8. Lipton, Am J Epid, NHANESI, 1993 9. Manson, JAMA, Health Professionals, 1992 10. McPhillips, Am J Epid, Rancho Bernardo, 1990 11. Meisinger, Arch Intern Med, MONICA Augsburg, 2002
12. Meyer, Epidemiology, NHSS Norway, 1995 13. Njolstad, Am J Epid, Finnmark, 1998 14. Perry, Br Med J, British Regional Heart, 1995 15. Shaper, Br Med J, British Regional Heart, 1997 16. Skarfors, Br Med J, Uppsala, 1991 17. Stevens, Obes Res, ARIC, 2001 18. Strandberg, Nutr Metab Card Dis, Helsinki Businessmen,
2000 19. Wannamethee, Diab Care, British Regional Heart, 1999 20. Wannamethee, JECH, British regional Heart, 2005 21. Wilson, Arch Intern Med, Framingham, 2002
Women
20 40 50 60 70 80 90age
0.9
1.1
1.2
1.3
RR
12
13
1314
15
1516
62
8
1011
3
4
4
115
17
1919
7
9
18
1818
1. Carey, Am J Epid, Nurses Health, 1997 2. Colditz, Am J Epid, Nurses Health, 1990 3. Colditz, Ann Intern Med, Nurses Health, 1995 4. Dotevall, Diabet Med, BEDA, 2004 5. Field, Arch Intern Med, Nurses Health, 2001 6. Field, Obes Res, Nurses Health II, 2004 7. Folsom, Arch Intern Med, Iowa Women Health, 2000 8. Hu, NEJM, Nurses Health, 2001 9. Kaye, J Clin Epid, Iowa Women Health, 1991 10. Kumari, Arch Intern Med, Whitehall, 2004
11. Lipton, Am J Epid, NHANESI, 1993 12. McPhillips, Am J Epid, Rancho Bernardo, 1990 13. Meisinger, Arch Intern Med, MONICA Augsburg, 2002 14. Meyer, Epidemiology, NHSS Norway, 1995 15. Njolstad, Am J Epid, Finnmark, 1998 16. Snijder, AJCN, Hoorn, 2003 17. Stevens, Obes Res, ARIC, 2001 18. Weinstein, JAMA, Womens Health, 2004 19. Wilson, Arch Intern Med, Framingham, 2002
Figure 7.2: Relative risk estimates for BMI on diabetes incidence, no restriction on adjustment for lifestyle factors, for men and women, respectively
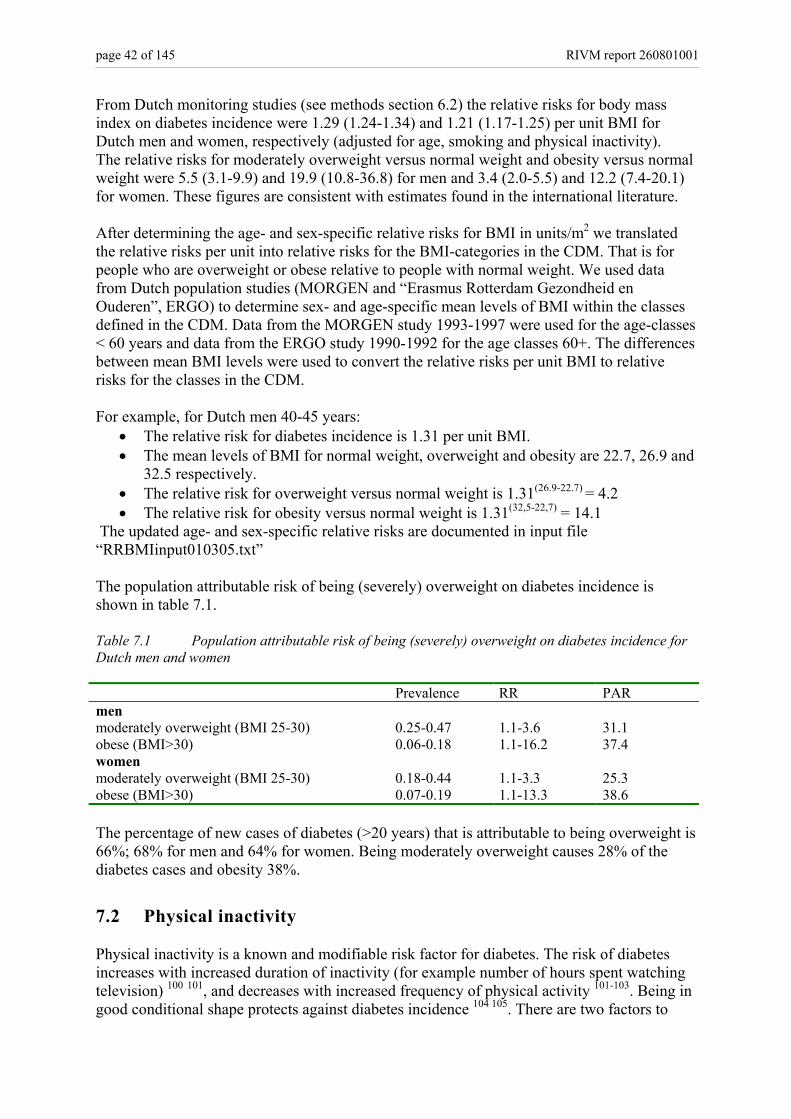
page 42 of 145 RIVM report 260801001
From Dutch monitoring studies (see methods section 6.2) the relative risks for body mass index on diabetes incidence were 1.29 (1.24-1.34) and 1.21 (1.17-1.25) per unit BMI for Dutch men and women, respectively (adjusted for age, smoking and physical inactivity). The relative risks for moderately overweight versus normal weight and obesity versus normal weight were 5.5 (3.1-9.9) and 19.9 (10.8-36.8) for men and 3.4 (2.0-5.5) and 12.2 (7.4-20.1) for women. These figures are consistent with estimates found in the international literature. After determining the age- and sex-specific relative risks for BMI in units/m2 we translated the relative risks per unit into relative risks for the BMI-categories in the CDM. That is for people who are overweight or obese relative to people with normal weight. We used data from Dutch population studies (MORGEN and “Erasmus Rotterdam Gezondheid en Ouderen”, ERGO) to determine sex- and age-specific mean levels of BMI within the classes defined in the CDM. Data from the MORGEN study 1993-1997 were used for the age-classes < 60 years and data from the ERGO study 1990-1992 for the age classes 60+. The differences between mean BMI levels were used to convert the relative risks per unit BMI to relative risks for the classes in the CDM. For example, for Dutch men 40-45 years:
• The relative risk for diabetes incidence is 1.31 per unit BMI. • The mean levels of BMI for normal weight, overweight and obesity are 22.7, 26.9 and
32.5 respectively. • The relative risk for overweight versus normal weight is 1.31(26.9-22.7) = 4.2 • The relative risk for obesity versus normal weight is 1.31(32,5-22,7) = 14.1
The updated age- and sex-specific relative risks are documented in input file “RRBMIinput010305.txt” The population attributable risk of being (severely) overweight on diabetes incidence is shown in table 7.1. Table 7.1 Population attributable risk of being (severely) overweight on diabetes incidence for Dutch men and women Prevalence RR PAR men moderately overweight (BMI 25-30) 0.25-0.47 1.1-3.6 31.1 obese (BMI>30) 0.06-0.18 1.1-16.2 37.4 women moderately overweight (BMI 25-30) 0.18-0.44 1.1-3.3 25.3 obese (BMI>30) 0.07-0.19 1.1-13.3 38.6 The percentage of new cases of diabetes (>20 years) that is attributable to being overweight is 66%; 68% for men and 64% for women. Being moderately overweight causes 28% of the diabetes cases and obesity 38%.
7.2 Physical inactivity Physical inactivity is a known and modifiable risk factor for diabetes. The risk of diabetes increases with increased duration of inactivity (for example number of hours spent watching television) 100 101, and decreases with increased frequency of physical activity 101-103. Being in good conditional shape protects against diabetes incidence 104 105. There are two factors to
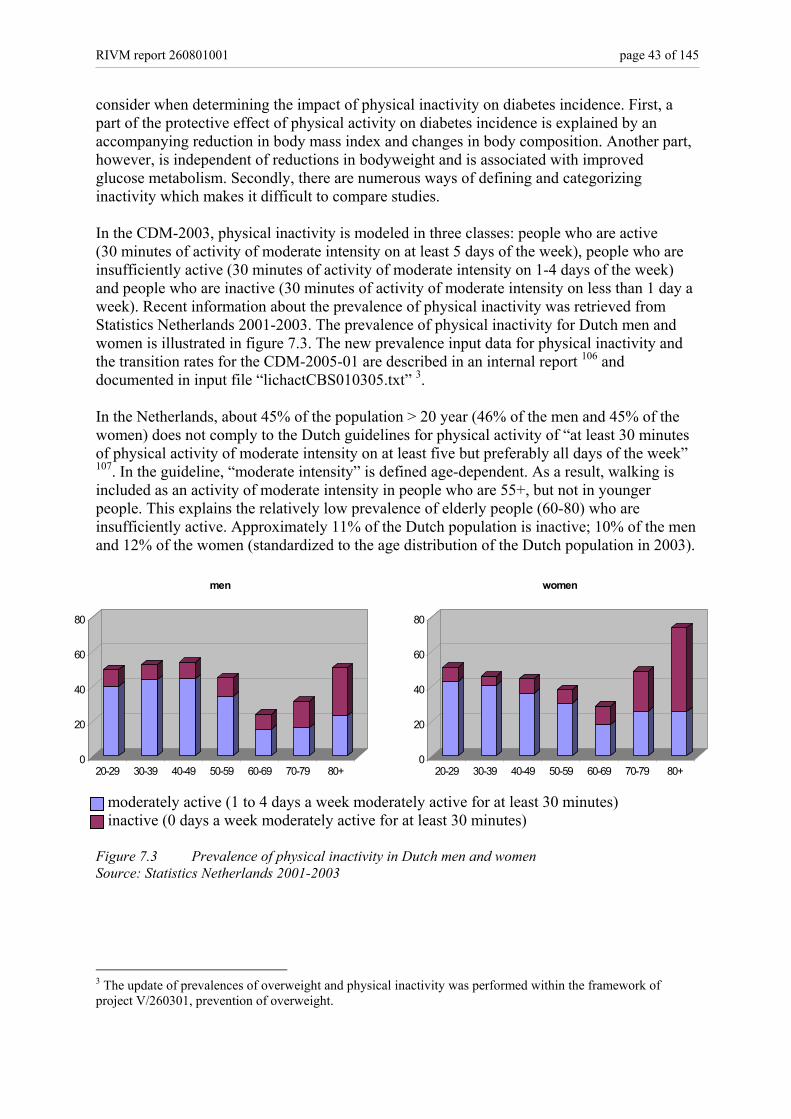
RIVM report 260801001 page 43 of 145
consider when determining the impact of physical inactivity on diabetes incidence. First, a part of the protective effect of physical activity on diabetes incidence is explained by an accompanying reduction in body mass index and changes in body composition. Another part, however, is independent of reductions in bodyweight and is associated with improved glucose metabolism. Secondly, there are numerous ways of defining and categorizing inactivity which makes it difficult to compare studies. In the CDM-2003, physical inactivity is modeled in three classes: people who are active (30 minutes of activity of moderate intensity on at least 5 days of the week), people who are insufficiently active (30 minutes of activity of moderate intensity on 1-4 days of the week) and people who are inactive (30 minutes of activity of moderate intensity on less than 1 day a week). Recent information about the prevalence of physical inactivity was retrieved from Statistics Netherlands 2001-2003. The prevalence of physical inactivity for Dutch men and women is illustrated in figure 7.3. The new prevalence input data for physical inactivity and the transition rates for the CDM-2005-01 are described in an internal report 106 and documented in input file “lichactCBS010305.txt” 3. In the Netherlands, about 45% of the population > 20 year (46% of the men and 45% of the women) does not comply to the Dutch guidelines for physical activity of “at least 30 minutes of physical activity of moderate intensity on at least five but preferably all days of the week” 107. In the guideline, “moderate intensity” is defined age-dependent. As a result, walking is included as an activity of moderate intensity in people who are 55+, but not in younger people. This explains the relatively low prevalence of elderly people (60-80) who are insufficiently active. Approximately 11% of the Dutch population is inactive; 10% of the men and 12% of the women (standardized to the age distribution of the Dutch population in 2003). moderately active (1 to 4 days a week moderately active for at least 30 minutes) inactive (0 days a week moderately active for at least 30 minutes) Figure 7.3 Prevalence of physical inactivity in Dutch men and women Source: Statistics Netherlands 2001-2003
3 The update of prevalences of overweight and physical inactivity was performed within the framework of project V/260301, prevention of overweight.
0
20
40
60
80
20-29 30-39 40-49 50-59 60-69 70-79 80+
men
0
20
40
60
80
20-29 30-39 40-49 50-59 60-69 70-79 80+
women
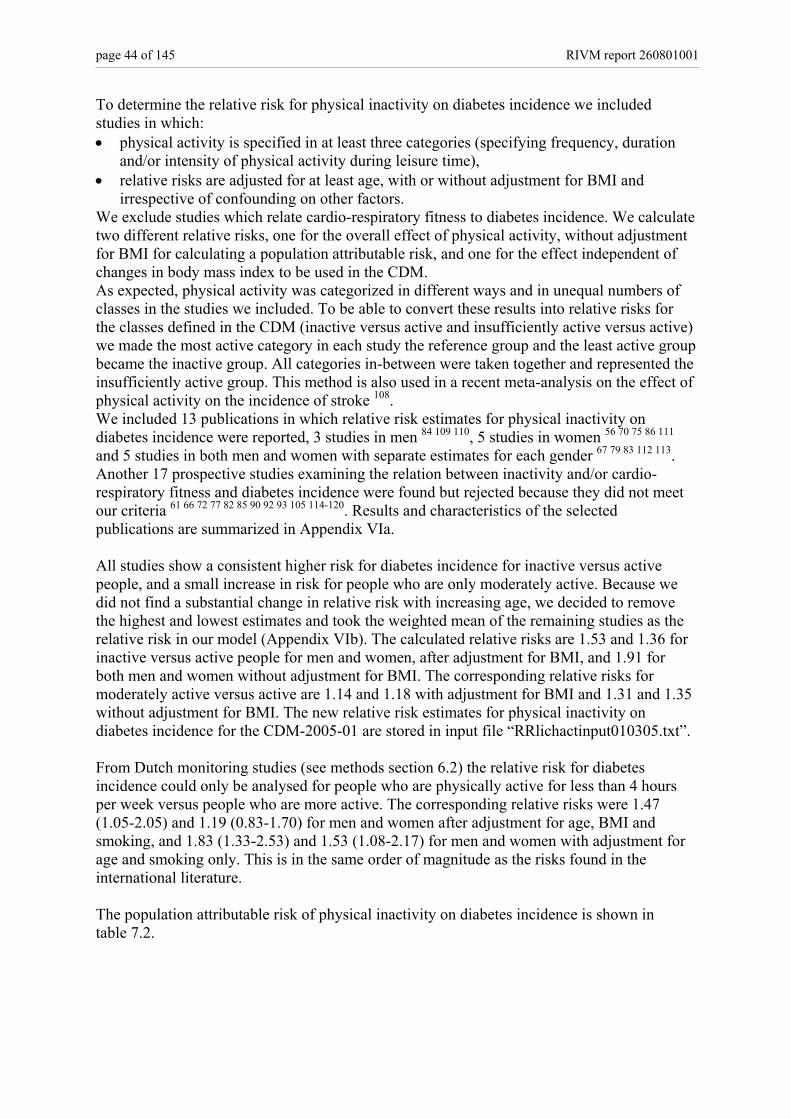
page 44 of 145 RIVM report 260801001
To determine the relative risk for physical inactivity on diabetes incidence we included studies in which: • physical activity is specified in at least three categories (specifying frequency, duration
and/or intensity of physical activity during leisure time), • relative risks are adjusted for at least age, with or without adjustment for BMI and
irrespective of confounding on other factors. We exclude studies which relate cardio-respiratory fitness to diabetes incidence. We calculate two different relative risks, one for the overall effect of physical activity, without adjustment for BMI for calculating a population attributable risk, and one for the effect independent of changes in body mass index to be used in the CDM. As expected, physical activity was categorized in different ways and in unequal numbers of classes in the studies we included. To be able to convert these results into relative risks for the classes defined in the CDM (inactive versus active and insufficiently active versus active) we made the most active category in each study the reference group and the least active group became the inactive group. All categories in-between were taken together and represented the insufficiently active group. This method is also used in a recent meta-analysis on the effect of physical activity on the incidence of stroke 108. We included 13 publications in which relative risk estimates for physical inactivity on diabetes incidence were reported, 3 studies in men 84 109 110, 5 studies in women 56 70 75 86 111 and 5 studies in both men and women with separate estimates for each gender 67 79 83 112 113. Another 17 prospective studies examining the relation between inactivity and/or cardio-respiratory fitness and diabetes incidence were found but rejected because they did not meet our criteria 61 66 72 77 82 85 90 92 93 105 114-120. Results and characteristics of the selected publications are summarized in Appendix VIa. All studies show a consistent higher risk for diabetes incidence for inactive versus active people, and a small increase in risk for people who are only moderately active. Because we did not find a substantial change in relative risk with increasing age, we decided to remove the highest and lowest estimates and took the weighted mean of the remaining studies as the relative risk in our model (Appendix VIb). The calculated relative risks are 1.53 and 1.36 for inactive versus active people for men and women, after adjustment for BMI, and 1.91 for both men and women without adjustment for BMI. The corresponding relative risks for moderately active versus active are 1.14 and 1.18 with adjustment for BMI and 1.31 and 1.35 without adjustment for BMI. The new relative risk estimates for physical inactivity on diabetes incidence for the CDM-2005-01 are stored in input file “RRlichactinput010305.txt”. From Dutch monitoring studies (see methods section 6.2) the relative risk for diabetes incidence could only be analysed for people who are physically active for less than 4 hours per week versus people who are more active. The corresponding relative risks were 1.47 (1.05-2.05) and 1.19 (0.83-1.70) for men and women after adjustment for age, BMI and smoking, and 1.83 (1.33-2.53) and 1.53 (1.08-2.17) for men and women with adjustment for age and smoking only. This is in the same order of magnitude as the risks found in the international literature. The population attributable risk of physical inactivity on diabetes incidence is shown in table 7.2.
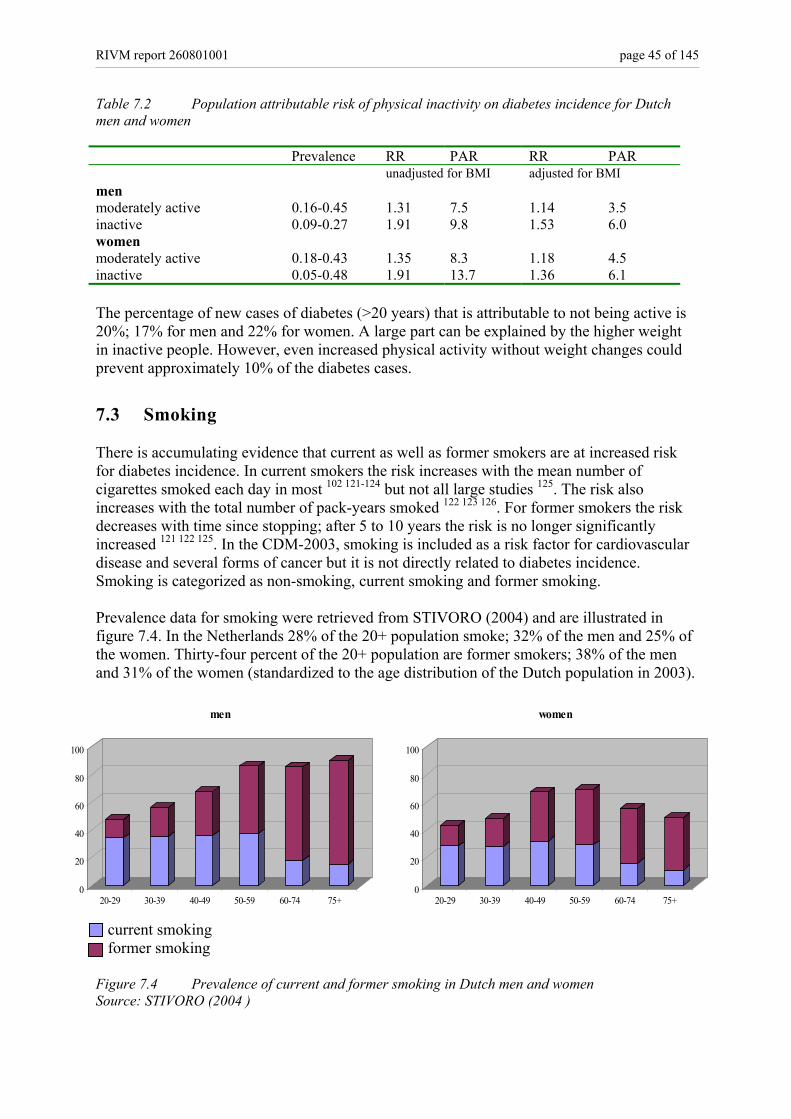
RIVM report 260801001 page 45 of 145
Table 7.2 Population attributable risk of physical inactivity on diabetes incidence for Dutch men and women Prevalence RR PAR RR PAR unadjusted for BMI adjusted for BMI men moderately active 0.16-0.45 1.31 7.5 1.14 3.5 inactive 0.09-0.27 1.91 9.8 1.53 6.0 women moderately active 0.18-0.43 1.35 8.3 1.18 4.5 inactive 0.05-0.48 1.91 13.7 1.36 6.1 The percentage of new cases of diabetes (>20 years) that is attributable to not being active is 20%; 17% for men and 22% for women. A large part can be explained by the higher weight in inactive people. However, even increased physical activity without weight changes could prevent approximately 10% of the diabetes cases.
7.3 Smoking There is accumulating evidence that current as well as former smokers are at increased risk for diabetes incidence. In current smokers the risk increases with the mean number of cigarettes smoked each day in most 102 121-124 but not all large studies 125. The risk also increases with the total number of pack-years smoked 122 123 126. For former smokers the risk decreases with time since stopping; after 5 to 10 years the risk is no longer significantly increased 121 122 125. In the CDM-2003, smoking is included as a risk factor for cardiovascular disease and several forms of cancer but it is not directly related to diabetes incidence. Smoking is categorized as non-smoking, current smoking and former smoking. Prevalence data for smoking were retrieved from STIVORO (2004) and are illustrated in figure 7.4. In the Netherlands 28% of the 20+ population smoke; 32% of the men and 25% of the women. Thirty-four percent of the 20+ population are former smokers; 38% of the men and 31% of the women (standardized to the age distribution of the Dutch population in 2003). current smoking former smoking Figure 7.4 Prevalence of current and former smoking in Dutch men and women Source: STIVORO (2004 )
0
20
40
60
80
100
20-29 30-39 40-49 50-59 60-74 75+
men
0
20
40
60
80
100
20-29 30-39 40-49 50-59 60-74 75+
women
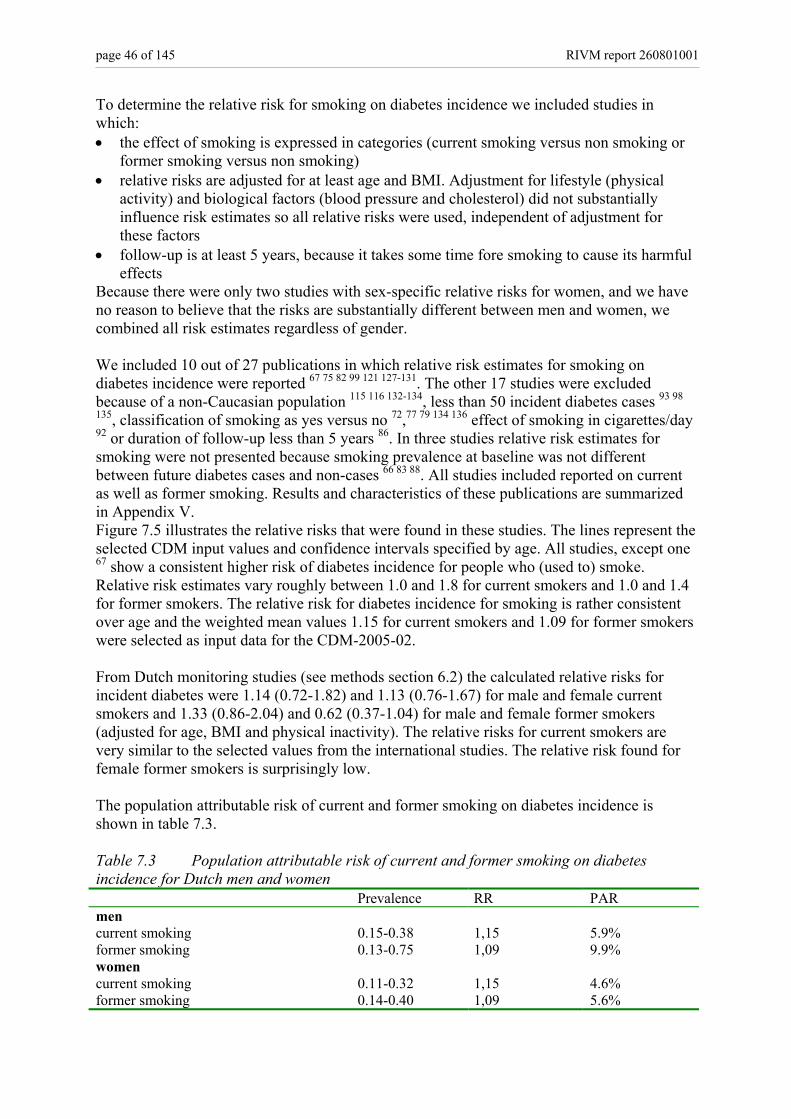
page 46 of 145 RIVM report 260801001
To determine the relative risk for smoking on diabetes incidence we included studies in which: • the effect of smoking is expressed in categories (current smoking versus non smoking or
former smoking versus non smoking) • relative risks are adjusted for at least age and BMI. Adjustment for lifestyle (physical
activity) and biological factors (blood pressure and cholesterol) did not substantially influence risk estimates so all relative risks were used, independent of adjustment for these factors
• follow-up is at least 5 years, because it takes some time fore smoking to cause its harmful effects
Because there were only two studies with sex-specific relative risks for women, and we have no reason to believe that the risks are substantially different between men and women, we combined all risk estimates regardless of gender. We included 10 out of 27 publications in which relative risk estimates for smoking on diabetes incidence were reported 67 75 82 99 121 127-131. The other 17 studies were excluded because of a non-Caucasian population 115 116 132-134, less than 50 incident diabetes cases 93 98
135, classification of smoking as yes versus no 72,77 79 134 136 effect of smoking in cigarettes/day 92 or duration of follow-up less than 5 years 86. In three studies relative risk estimates for smoking were not presented because smoking prevalence at baseline was not different between future diabetes cases and non-cases 66 83 88. All studies included reported on current as well as former smoking. Results and characteristics of these publications are summarized in Appendix V. Figure 7.5 illustrates the relative risks that were found in these studies. The lines represent the selected CDM input values and confidence intervals specified by age. All studies, except one 67 show a consistent higher risk of diabetes incidence for people who (used to) smoke. Relative risk estimates vary roughly between 1.0 and 1.8 for current smokers and 1.0 and 1.4 for former smokers. The relative risk for diabetes incidence for smoking is rather consistent over age and the weighted mean values 1.15 for current smokers and 1.09 for former smokers were selected as input data for the CDM-2005-02. From Dutch monitoring studies (see methods section 6.2) the calculated relative risks for incident diabetes were 1.14 (0.72-1.82) and 1.13 (0.76-1.67) for male and female current smokers and 1.33 (0.86-2.04) and 0.62 (0.37-1.04) for male and female former smokers (adjusted for age, BMI and physical inactivity). The relative risks for current smokers are very similar to the selected values from the international studies. The relative risk found for female former smokers is surprisingly low. The population attributable risk of current and former smoking on diabetes incidence is shown in table 7.3. Table 7.3 Population attributable risk of current and former smoking on diabetes incidence for Dutch men and women Prevalence RR PAR men current smoking 0.15-0.38 1,15 5.9% former smoking 0.13-0.75 1,09 9.9% women current smoking 0.11-0.32 1,15 4.6% former smoking 0.14-0.40 1,09 5.6%
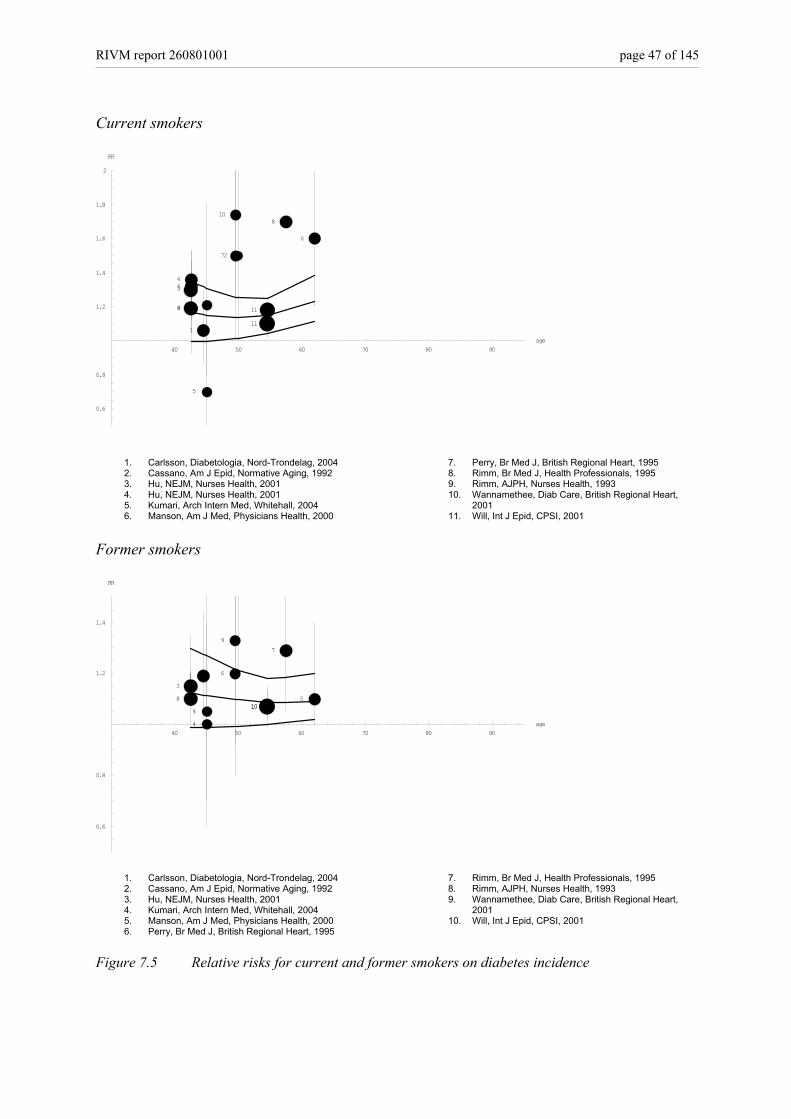
RIVM report 260801001 page 47 of 145
Current smokers
40 50 60 70 80 90age
0.6
0.8
1.2
1.4
1.6
1.8
2
RR
1
2
3
4
44
5
5
6
7
8
9
10
11
11
1. Carlsson, Diabetologia, Nord-Trondelag, 2004 2. Cassano, Am J Epid, Normative Aging, 1992 3. Hu, NEJM, Nurses Health, 2001 4. Hu, NEJM, Nurses Health, 2001 5. Kumari, Arch Intern Med, Whitehall, 2004 6. Manson, Am J Med, Physicians Health, 2000
7. Perry, Br Med J, British Regional Heart, 1995 8. Rimm, Br Med J, Health Professionals, 1995 9. Rimm, AJPH, Nurses Health, 1993 10. Wannamethee, Diab Care, British Regional Heart,
2001 11. Will, Int J Epid, CPSI, 2001
Former smokers
40 50 60 70 80 90age
0.6
0.8
1.2
1.4
RR
13
44
5
6
7
8
9
1010
1. Carlsson, Diabetologia, Nord-Trondelag, 2004 2. Cassano, Am J Epid, Normative Aging, 1992 3. Hu, NEJM, Nurses Health, 2001 4. Kumari, Arch Intern Med, Whitehall, 2004 5. Manson, Am J Med, Physicians Health, 2000 6. Perry, Br Med J, British Regional Heart, 1995
7. Rimm, Br Med J, Health Professionals, 1995 8. Rimm, AJPH, Nurses Health, 1993 9. Wannamethee, Diab Care, British Regional Heart,
2001 10. Will, Int J Epid, CPSI, 2001
Figure 7.5 Relative risks for current and former smokers on diabetes incidence
page 48 of 145 RIVM report 260801001
The percentage of new cases of diabetes (>20 years) that is attributable to smoking is 13%; 16% for men and 10% for women. Current smoking causes 5% of the cases and former smoking 8%. The impact of former smoking for men is relatively high because the percentage of former smokers among elderly men is very high. Based on the accumulating evidence for a relation between smoking and diabetes incidence we decided to include smoking as a risk factor for diabetes incidence. The new input data for smoking prevalence and transition rates are stored in input file “Smokinput160305.txt”, the relative risks for smoking on diabetes incidence are documented in input file “RRsmok160305.txt”.
7.4 Alcohol Alcohol is a potential modifiable risk factor for diabetes incidence. Moderate alcohol consumption protects against diabetes risk as compared to not drinking or excessive drinking 137. Results are inconsistent with respect to possible differential effects for different kinds of alcohol 138-141. Frequent drinking (of moderate amounts) appears to be better then binge drinking 138 140 142. In the CDM-2003, alcohol is modeled as a risk factor for all cause mortality, coronary heart disease, stroke and several forms of cancer. Alcohol is categorized in 4 categories for men (less than 1 drink per day, 1 to 4, 4 to 6, and more than 6 drinks per day) and 4 categories for women (less than 1 drink per day, 1 to 2, 2 to 4, and more than 4 drinks per day) based on the categorization used in the Australian recommendations on responsible drinking 32. Prevalence data were retrieved from Statistics Netherlands (2002). Prevalence of alcohol consumption for Dutch men and women according to age is illustrated in figure 7.6. In the Netherlands 57% of the 20+ population drink less than one glass of alcohol per day, 42% of the men and 71% of the women (standardized to the age distribution of the Dutch population in 2003). The prevalence of excessive drinking is highest in middle-aged men but does not exceed 4%. To determine the relative risk for alcohol on diabetes incidence we included studies in which: • the effect of alcohol was expressed in at least three categories, with a range that covered a
substantial part of the categories in the CDM. This means that studies were excluded if the highest category was >1 drink/day
• relative risks are adjusted for at least age and BMI (or weight / WHR / or waist-circumference)
• relative risks are sex-specific Non-drinkers and ex-drinkers (if treated separately) were taken together and represent the reference category.
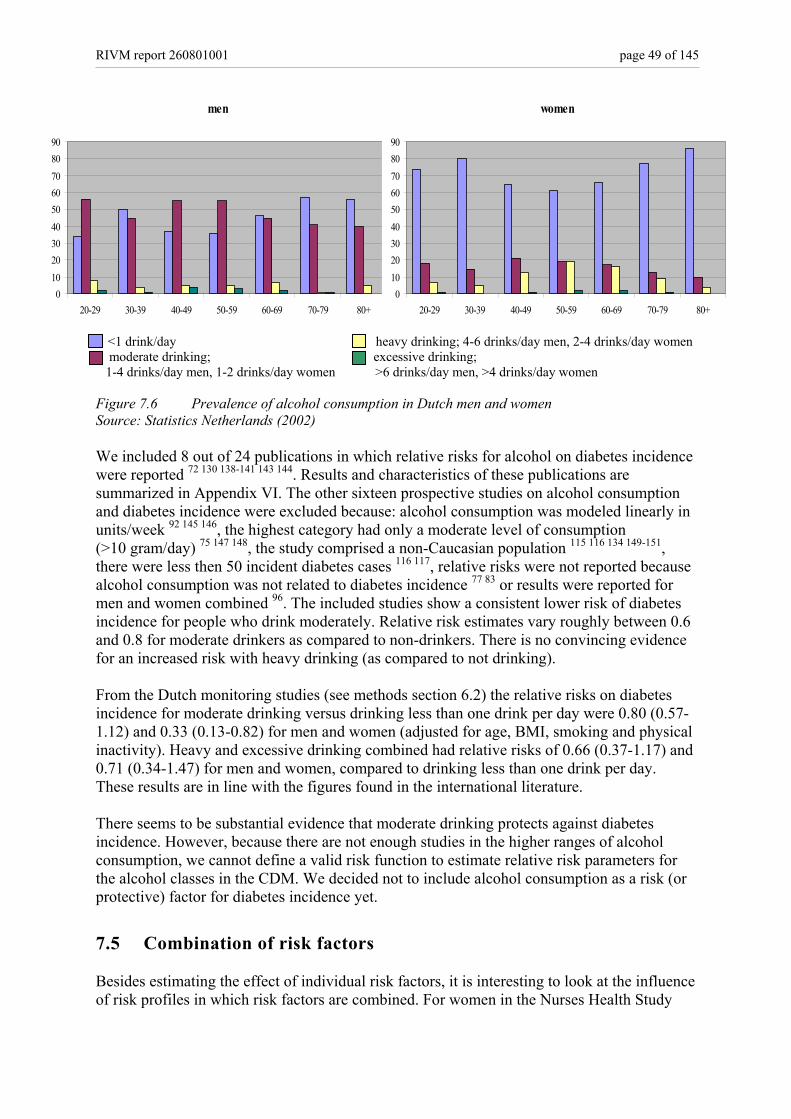
RIVM report 260801001 page 49 of 145
<1 drink/day heavy drinking; 4-6 drinks/day men, 2-4 drinks/day women moderate drinking; excessive drinking; 1-4 drinks/day men, 1-2 drinks/day women >6 drinks/day men, >4 drinks/day women Figure 7.6 Prevalence of alcohol consumption in Dutch men and women Source: Statistics Netherlands (2002) We included 8 out of 24 publications in which relative risks for alcohol on diabetes incidence were reported 72 130 138-141 143 144. Results and characteristics of these publications are summarized in Appendix VI. The other sixteen prospective studies on alcohol consumption and diabetes incidence were excluded because: alcohol consumption was modeled linearly in units/week 92 145 146, the highest category had only a moderate level of consumption (>10 gram/day) 75 147 148, the study comprised a non-Caucasian population 115 116 134 149-151, there were less then 50 incident diabetes cases 116 117, relative risks were not reported because alcohol consumption was not related to diabetes incidence 77 83 or results were reported for men and women combined 96. The included studies show a consistent lower risk of diabetes incidence for people who drink moderately. Relative risk estimates vary roughly between 0.6 and 0.8 for moderate drinkers as compared to non-drinkers. There is no convincing evidence for an increased risk with heavy drinking (as compared to not drinking). From the Dutch monitoring studies (see methods section 6.2) the relative risks on diabetes incidence for moderate drinking versus drinking less than one drink per day were 0.80 (0.57-1.12) and 0.33 (0.13-0.82) for men and women (adjusted for age, BMI, smoking and physical inactivity). Heavy and excessive drinking combined had relative risks of 0.66 (0.37-1.17) and 0.71 (0.34-1.47) for men and women, compared to drinking less than one drink per day. These results are in line with the figures found in the international literature. There seems to be substantial evidence that moderate drinking protects against diabetes incidence. However, because there are not enough studies in the higher ranges of alcohol consumption, we cannot define a valid risk function to estimate relative risk parameters for the alcohol classes in the CDM. We decided not to include alcohol consumption as a risk (or protective) factor for diabetes incidence yet.
7.5 Combination of risk factors Besides estimating the effect of individual risk factors, it is interesting to look at the influence of risk profiles in which risk factors are combined. For women in the Nurses Health Study
men
0102030405060708090
20-29 30-39 40-49 50-59 60-69 70-79 80+
women
0102030405060708090
20-29 30-39 40-49 50-59 60-69 70-79 80+
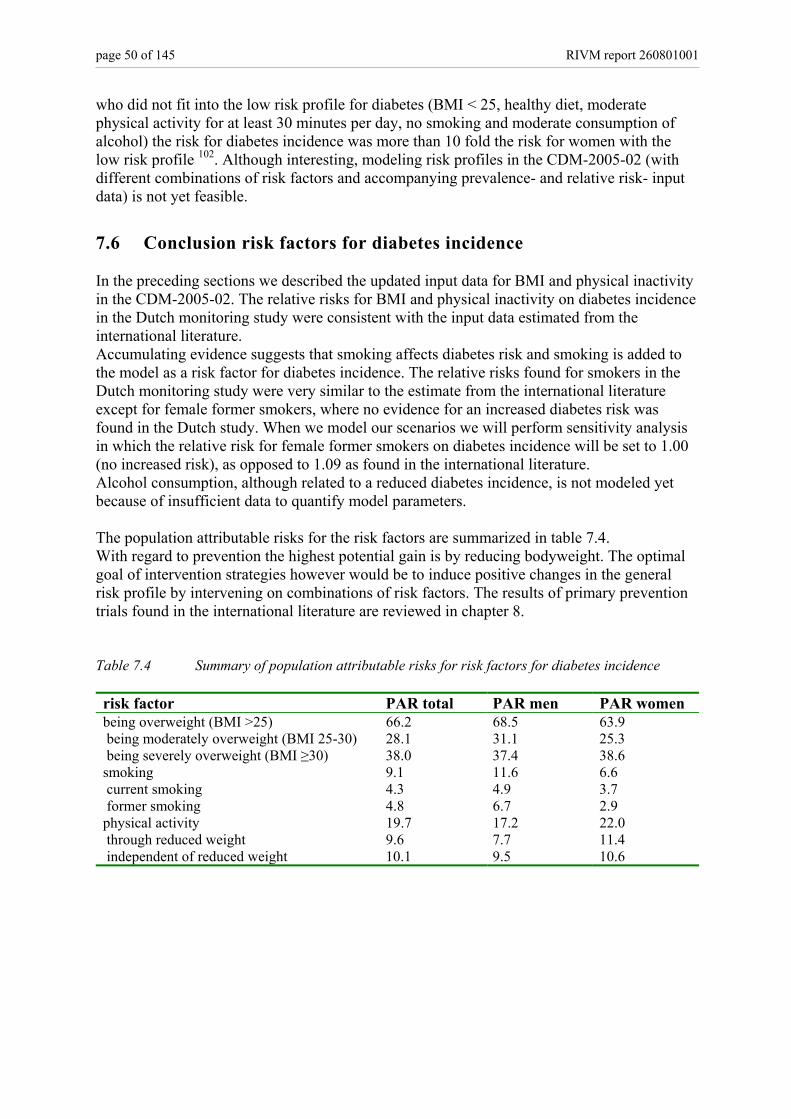
page 50 of 145 RIVM report 260801001
who did not fit into the low risk profile for diabetes (BMI < 25, healthy diet, moderate physical activity for at least 30 minutes per day, no smoking and moderate consumption of alcohol) the risk for diabetes incidence was more than 10 fold the risk for women with the low risk profile 102. Although interesting, modeling risk profiles in the CDM-2005-02 (with different combinations of risk factors and accompanying prevalence- and relative risk- input data) is not yet feasible.
7.6 Conclusion risk factors for diabetes incidence In the preceding sections we described the updated input data for BMI and physical inactivity in the CDM-2005-02. The relative risks for BMI and physical inactivity on diabetes incidence in the Dutch monitoring study were consistent with the input data estimated from the international literature. Accumulating evidence suggests that smoking affects diabetes risk and smoking is added to the model as a risk factor for diabetes incidence. The relative risks found for smokers in the Dutch monitoring study were very similar to the estimate from the international literature except for female former smokers, where no evidence for an increased diabetes risk was found in the Dutch study. When we model our scenarios we will perform sensitivity analysis in which the relative risk for female former smokers on diabetes incidence will be set to 1.00 (no increased risk), as opposed to 1.09 as found in the international literature. Alcohol consumption, although related to a reduced diabetes incidence, is not modeled yet because of insufficient data to quantify model parameters. The population attributable risks for the risk factors are summarized in table 7.4. With regard to prevention the highest potential gain is by reducing bodyweight. The optimal goal of intervention strategies however would be to induce positive changes in the general risk profile by intervening on combinations of risk factors. The results of primary prevention trials found in the international literature are reviewed in chapter 8. Table 7.4 Summary of population attributable risks for risk factors for diabetes incidence risk factor PAR total PAR men PAR women being overweight (BMI >25) 66.2 68.5 63.9 being moderately overweight (BMI 25-30) 28.1 31.1 25.3 being severely overweight (BMI ≥30) 38.0 37.4 38.6 smoking 9.1 11.6 6.6 current smoking 4.3 4.9 3.7 former smoking 4.8 6.7 2.9 physical activity 19.7 17.2 22.0 through reduced weight independent of reduced weight
9.6 10.1
7.7 9.5
11.4 10.6
RIVM report 260801001 page 51 of 145
8. Primary prevention MAM Jacobs-van der Bruggen, LCM Limburg Primary prevention strategies intend to prevent or delay the development of new cases of diabetes, by modifying risk factor exposure in a diabetes-free population. Besides evidence of effectiveness of interventions as described in this chapter, we should consider policy relevance of the interventions, feasibility and costs, and our ability to model the strategy with the CDM. Furthermore, trial outcomes need to be translated into realistic expectations, when implemented into the Dutch health care setting, before we can define definite scenarios in 2005. Primary prevention of diabetes entails trying to delay or prevent the development of diabetes by means of (lifestyle or pharmacological) interventions. In the international literature we found 13 studies that fulfilled our criteria for inclusion (see section 6.2). Four studies focused on lifestyle interventions (with diet and/or physical activity) 152,153 154 four on pharmacological interventions 155-158, two studies included both a lifestyle and a pharmacological intervention 159,160 161 and two studies used surgery as a means to loose weight for severely obese individuals 162 163. All studies were aimed at individuals at a high risk of diabetes, that is individuals with high bodyweight and/or high levels of blood glucose, or individuals at high risk of cardiovascular disease 156. The characteristics of the individuals selected in the intervention trials are important to consider when translating the results of these trials into prevention scenarios for the (general) Dutch population.
8.1 Lifestyle interventions The results of the lifestyle intervention studies are summarized in Appendix VIIa. Significant improvements in lifestyle were attained and these changes were accompanied by reduced bodyweight, improved blood glucose control and reduced diabetes incidence of about 50-60%% in three to six years 154 152 159. These programs may even have long term beneficial effects. In men with impaired glucose tolerance (IGT) who participated in the Malmo prevention trial, 12-year mortality was similar to that in normal glucose controls and significantly lower than that in the IGT routine treatment group 164. The intensity of a lifestyle program appears to be an important determinant of success 152 159. Intervention that comprised diet and physical activity appeared to be more effective than diet or physical activity alone 153. In the Netherlands a lifestyle program to improve glucose metabolism is conducted in Maastricht. The intervention comprises 3-monthly nutritional advise from a dietician and subjects are encouraged to increase physical activity. Participants are enabled and stimulated to participate in supervised activities for at least one hour per week, without costs. The Dutch study, the “Study on Lifestyle-intervention and Impaired glucose metabolism Maastricht” (SLIM), has a planned duration of 6 years. The intervention comprises 3-monthly nutritional advise from a dietician and subjects are encouraged to increase physical activity. Participants are enabled and stimulated to participate in supervised physical activities for at least one hour per week. The control group only received yearly general information on the importance of a healthy diet and physical activity. Preliminary results of SLIM showed significant improvements (for intervention versus control) in body weight, BMI and glucose tolerance at the two years follow-up 165. In the “fasting hyperglycemia study” 161 weight nor blood glucose were improved.
page 52 of 145 RIVM report 260801001
The feasibility of reducing bodyweight by lifestyle programs is moderate. The aim of the Finnish Diabetes Prevention Study (DPS) 152, reducing weight by at least 5%, was attained by 43% of the participants in 1 year. The aim of the US Diabetes Prevention Program (DPP) 159, reducing bodyweight by at least 7%, was attained by 50% in 2 years. Besides reducing bodyweight it is at least as important that these reductions in weight can be sustained 166. In general it appears that the largest reduction in bodyweight is achieved within the first year of treatment after which the mean bodyweight tends to increase slowly 154 159 161 167. The percentage of people in whom weight was still 7% lower than baseline weight one year after concluding the DPP was still 38%, whereas in the Malmo study 154, 71% of the participants were able to maintain an overall weight reduction for over 5 years. The results of the DPP indicated that about 7 people at high risk for diabetes should be treated for 3 years to prevent one case of diabetes 159.
8.2 Pharmacological interventions The results of the pharmacological intervention studies are summarized in Appendix VIIb. Treatment with metformin 159, orlistat 155 157 ramipril or acarbose were all found to be effective in preventing diabetes incidence, with risk reductions from 24% to 37% percent in the larger studies. Metformin is an oral medicine used to control blood glucose levels by increasing insulin sensitivity of the tissues. Metformin is frequently used in obese patients with type 2 diabetes because of its proven effectiveness 168 and because, as opposed to other oral diabetes medications, it does not cause weight gain 169. In the US DPP, treatment with metformin resulted in weight reduction and reduced levels of blood glucose compared to placebo, while diabetes incidence was reduced with 24%. However, with risk reductions of 51% and 24% respectively, intensive lifestyle intervention for two years in the same study was more effective in preventing diabetes than treatment with metformin 159. Orlistat is a medicine that inhibits dietary fat absorption, promotes weight loss and may reduce the risk of developing diabetes in obese individuals. In a large international study, obese individuals treated with orlistat had significant reductions in weight as compared to placebo treated controls. The risk of developing diabetes in 4 years was reduced with 37% 157. In another study, obese individuals treated with orlistat for 2 years (in addition to a low energy diet) lost more weight than individuals treated with diet and placebo 155. Significantly less participants with normal glucose tolerance at baseline progressed to impaired glucose tolerance (IGT) or diabetes in the orlistat group as compared to the placebo group (18/273 versus 30/249). Individuals with IGT at baseline who were treated with orlistat were less likely to develop diabetes as compared to placebo treated controls (2/67 versus 4/53). In addition glucose tolerance had improved to normal values in 72% of the orlistat treated IGT-patients as compared to 49% in controls. Ramipril is an ACE inhibitor and is generally used for the treatment of hypertension. ACE inhibitors also seem to have beneficial effects on glucose metabolism. In a large international study individuals (55+) with evidence of vascular disease who were treated with ramipril had a significant 34% reduced risk of developing diabetes in 4.5 years 156. Acarbose is an oral medication used in patients with type 2 diabetes. Acarbose slows down the action of enzymes that are active in digesting food, thereby slowing the appearance of sugar in the blood after a meal. In people with IGT, treatment with acarbose reduced the risk of developing diabetes with 25% in 3 years and significantly increased reversion from IGT to normal glucose tolerance. However, acarbose treatment was frequently accompanied with
RIVM report 260801001 page 53 of 145
side effects such as flatulence and diarrhea which made 31% of the acarbose participants discontinue treatment early 158. Treatment with sulfonylurea was accompanied by significant weight gain and showed no indication for reduced diabetes incidence 160. Bariatric surgery is effective in loosing weight and preventing diabetes cases. However this intervention option is of less interest from a public health (political) perspective.
8.3 Primary prevention conclusions Primary prevention of diabetes in individuals at high risk for diabetes appears to be feasible, the development of diabetes can be delayed or postponed. Lifestyle interventions seem to be more effective than pharmacological interventions with reductions in diabetes incidence of up to 60% in five years. However, these programs are intensive and costly, with (individually supervised) diet and exercise programs for several years. How the trial results, obtained in individuals at high risk for diabetes can be translated into realistic scenario outcomes, when implemented in Dutch health care settings, will be studied in 2005. One limitation to consider with respect to the CDM, when modeling a prevention scenario targeted at individuals with impaired glucose tolerance, is that glucose levels of individuals without diabetes are not included in the model.

page 54 of 145 RIVM report 260801001

RIVM report 260801001 page 55 of 145
Part IV Prevention of diabetes complications
9. Macrovascular complications of diabetes and tertiary prevention G Bos
9.1 Introduction In this part of the Technical Report we focus on factors concerning tertiary prevention. Tertiary interventions intend to prevent or delay the development of complications of people having diabetes, by modifying high exposure to cardiovascular risk factor(s) in diabetes patients. We focus on the risk factors overweight, physical activity, smoking, total cholesterol, and systolic blood pressure. These risk factors are involved in development of diabetes and cardiovascular complications, and are already included as risk factors for diabetes and other diseases in the primary prevention part of the CDM. HbA1c (a measure of blood glucose control in diabetes patients) is added to the model as a new factor. To calculate tertiary prevention scenarios, it is necessary to specify the distribution of risk factors for the diabetes population. The distribution of risk factors and complications in Dutch diabetes patients (prevalence), and the relation of risk factors with macrovascular complications (relative risks) are thus new input in the model. The purpose of this part of the report is to justify the new diabetes related input in the CDM, and to review international results of tertiary intervention trials.
9.2 Methods Prevalence of cardiovascular disease in diabetes The prevalence of cardiovascular disease in individuals with diabetes was obtained from estimates by the CDM. Based on the prevalence of AMI, CHD, CHF and stroke in the general population and the relation of these diseases with incidence of diabetes, the prevalence of cardiovascular disease was calculated in subjects with and without diabetes. The estimated prevalences from the model were validated by experimental data. Prevalence of cardiovascular risk factors The prevalence of cardiovascular risk factors for diabetes, i.e. overweight, smoking and physical inactivity in individuals with diabetes was obtained from estimates by the CDM. Based on the prevalence in the general population and the relation between risk factor and incidence of diabetes, the prevalence of risk factors was calculated in subjects with and without diabetes. The estimated prevalences from the model were validated by experimental data, because of internal consistence in the model. The prevalences for total cholesterol, blood pressure and HbA1c were based on empirical data, because these factors are not included as risk factors for incidence of diabetes in the CDM. Data on the distribution of risk factors in people with diabetes are scarce. First a literature search was performed to find data from Dutch studies, and to determine all diabetes populations in the Netherlands. A list of large studies and projects was composed (table 9.1). Based on this list, data were retrieved to be able to
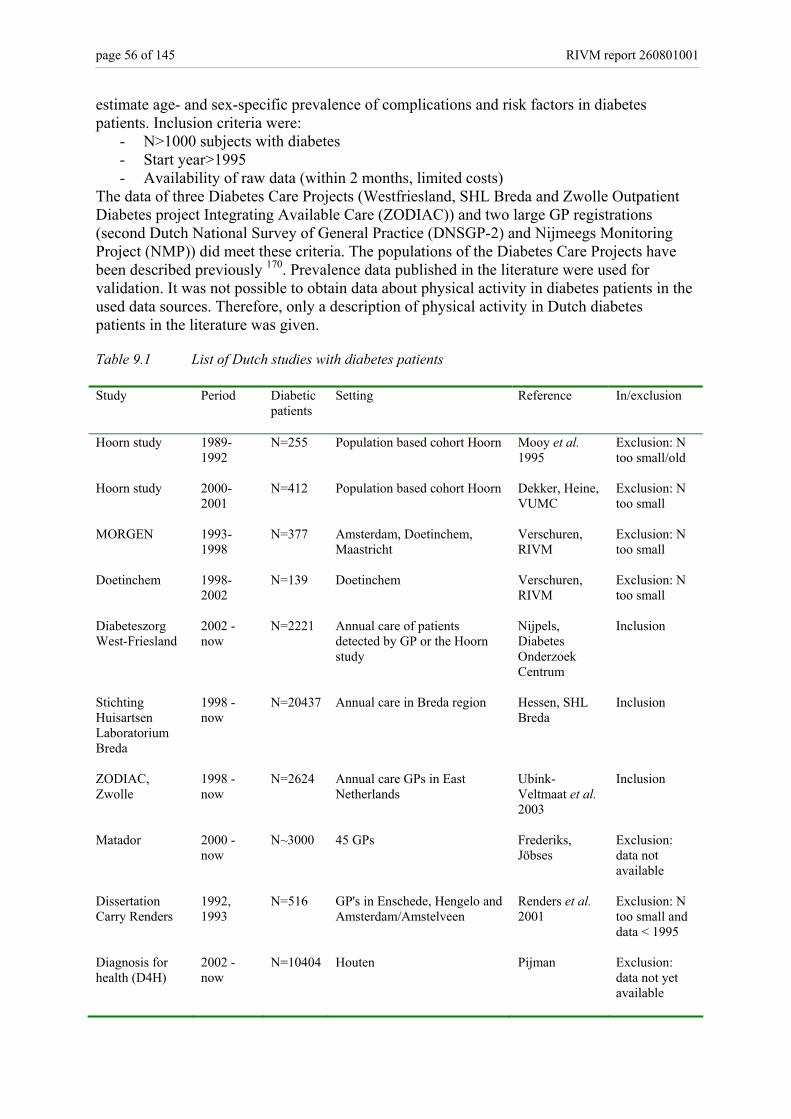
page 56 of 145 RIVM report 260801001
estimate age- and sex-specific prevalence of complications and risk factors in diabetes patients. Inclusion criteria were:
- N>1000 subjects with diabetes - Start year>1995 - Availability of raw data (within 2 months, limited costs)
The data of three Diabetes Care Projects (Westfriesland, SHL Breda and Zwolle Outpatient Diabetes project Integrating Available Care (ZODIAC)) and two large GP registrations (second Dutch National Survey of General Practice (DNSGP-2) and Nijmeegs Monitoring Project (NMP)) did meet these criteria. The populations of the Diabetes Care Projects have been described previously 170. Prevalence data published in the literature were used for validation. It was not possible to obtain data about physical activity in diabetes patients in the used data sources. Therefore, only a description of physical activity in Dutch diabetes patients in the literature was given. Table 9.1 List of Dutch studies with diabetes patients Study Period Diabetic
patients
Setting Reference In/exclusion
Hoorn study 1989-1992
N=255 Population based cohort Hoorn Mooy et al. 1995
Exclusion: N too small/old
Hoorn study 2000-2001
N=412 Population based cohort Hoorn Dekker, Heine, VUMC
Exclusion: N too small
MORGEN 1993-1998
N=377 Amsterdam, Doetinchem, Maastricht
Verschuren, RIVM
Exclusion: N too small
Doetinchem 1998-2002
N=139 Doetinchem Verschuren, RIVM
Exclusion: N too small
Diabeteszorg West-Friesland
2002 - now
N=2221 Annual care of patients detected by GP or the Hoorn study
Nijpels, Diabetes Onderzoek Centrum
Inclusion
Stichting Huisartsen Laboratorium Breda
1998 - now
N=20437 Annual care in Breda region Hessen, SHL Breda
Inclusion
ZODIAC, Zwolle
1998 - now
N=2624 Annual care GPs in East Netherlands
Ubink-Veltmaat et al. 2003
Inclusion
Matador 2000 - now
N~3000 45 GPs Frederiks, Jöbses
Exclusion: data not available
Dissertation Carry Renders
1992, 1993
N=516 GP's in Enschede, Hengelo and Amsterdam/Amstelveen
Renders et al. 2001
Exclusion: N too small and data < 1995
Diagnosis for health (D4H)
2002 - now
N=10404 Houten Pijman Exclusion: data not yet available
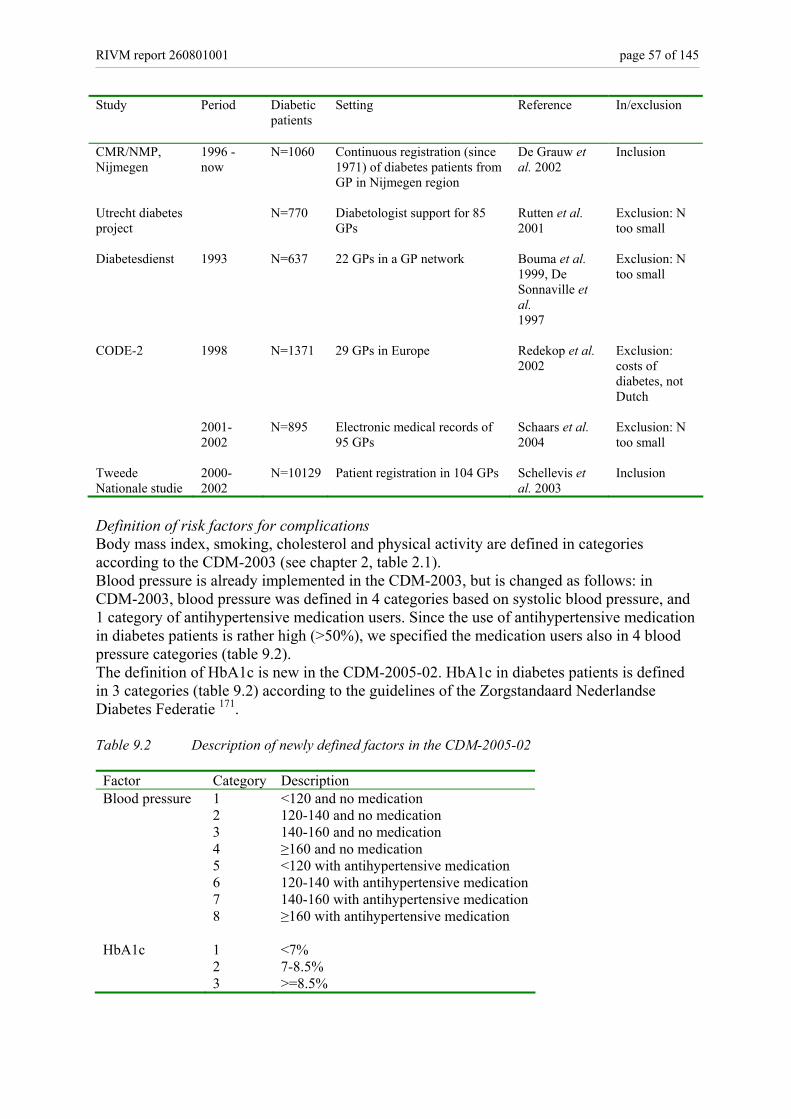
RIVM report 260801001 page 57 of 145
Study Period Diabetic patients
Setting Reference In/exclusion
CMR/NMP, Nijmegen
1996 - now
N=1060 Continuous registration (since 1971) of diabetes patients from GP in Nijmegen region
De Grauw et al. 2002
Inclusion
Utrecht diabetes project
N=770 Diabetologist support for 85 GPs
Rutten et al. 2001
Exclusion: N too small
Diabetesdienst 1993 N=637 22 GPs in a GP network Bouma et al. 1999, De Sonnaville et al. 1997
Exclusion: N too small
CODE-2 1998 N=1371 29 GPs in Europe Redekop et al. 2002
Exclusion: costs of diabetes, not Dutch
2001-2002
N=895 Electronic medical records of 95 GPs
Schaars et al. 2004
Exclusion: N too small
Tweede Nationale studie
2000-2002
N=10129 Patient registration in 104 GPs Schellevis et al. 2003
Inclusion
Definition of risk factors for complications Body mass index, smoking, cholesterol and physical activity are defined in categories according to the CDM-2003 (see chapter 2, table 2.1). Blood pressure is already implemented in the CDM-2003, but is changed as follows: in CDM-2003, blood pressure was defined in 4 categories based on systolic blood pressure, and 1 category of antihypertensive medication users. Since the use of antihypertensive medication in diabetes patients is rather high (>50%), we specified the medication users also in 4 blood pressure categories (table 9.2). The definition of HbA1c is new in the CDM-2005-02. HbA1c in diabetes patients is defined in 3 categories (table 9.2) according to the guidelines of the Zorgstandaard Nederlandse Diabetes Federatie 171. Table 9.2 Description of newly defined factors in the CDM-2005-02 Factor Category Description Blood pressure 1 <120 and no medication 2 120-140 and no medication 3 140-160 and no medication 4 ≥160 and no medication 5 <120 with antihypertensive medication 6 120-140 with antihypertensive medication 7 140-160 with antihypertensive medication 8 ≥160 with antihypertensive medication HbA1c 1 <7% 2 7-8.5% 3 >=8.5%
page 58 of 145 RIVM report 260801001
Relative risks of risk factors for complications in individuals with diabetes For the input in the CDM, we assumed that the relative risks of all risk factors for CVD in diabetes patients are the same as in subjects without diabetes, and that having diabetes has an multiplicative effect. The relative risk in diabetes patients is modeled as: RR (rf CVD in DM) = RR (DM CVD) * RR (rf CVD in general population) (9.1) RR= relative risk rf= risk factor CVD=complication (AMI, CHD, CHF, stroke) DM=diabetes Thus, the effect of having both diabetes and having a risk factor on CVD risk is expressed with no diabetes/no risk factor as reference group. In the next sections, we will discuss whether this assumption is reasonable for all risk factors. We will discuss the possible error made by this assumption, and which correction which should be made. For HbA1c, which will only be modeled in individuals with diabetes, new relative risks were estimated. Relative risks of overweight, smoking, physical activity, total cholesterol, systolic blood pressure and HbA1c for cardiovascular disease in diabetes patients were determined from the international literature. Relevant articles were retrieved from Pubmed searches, RIVM diabetes-experts and reference tracking of the articles and reviews retrieved. Publications were used to estimate the relative risk of the risk factor involved if the following criteria were met: • publication year 1990-2004 • prospective longitudinal cohort study in diabetes patients on incidence of complications • at least 50 incident cases (AMI, CHD, CHF, stroke) • Caucasian population • Relative risk in diabetes population reported • measurement of risk factor in units or categories • Sex-specific relative risks (if possible) • Multivariate estimate of relative risk Tertiary prevention A literature search was done searching for tertiary intervention studies. Studies were included if they met the following criteria: • published between 1995-2004 • study aim: prevention of macrovascular complications in patients with diabetes • at least 50 subjects in the intervention group • inclusion of a control group • relevant outcome data available (change in risk factor level or prevention of diabetes
complications) • follow-up at least 1 year • Caucasian population This review of the literature provides information on which tertiary intervention strategies in individuals with diabetes appear to be effective. Based on this information we can determine which strategies are potentially interesting to model with the CDM next year. However, relevant aspects such as feasibility of implementation in Dutch health care, costs of the intervention and translation of trial results into realistic scenarios need to be addressed.
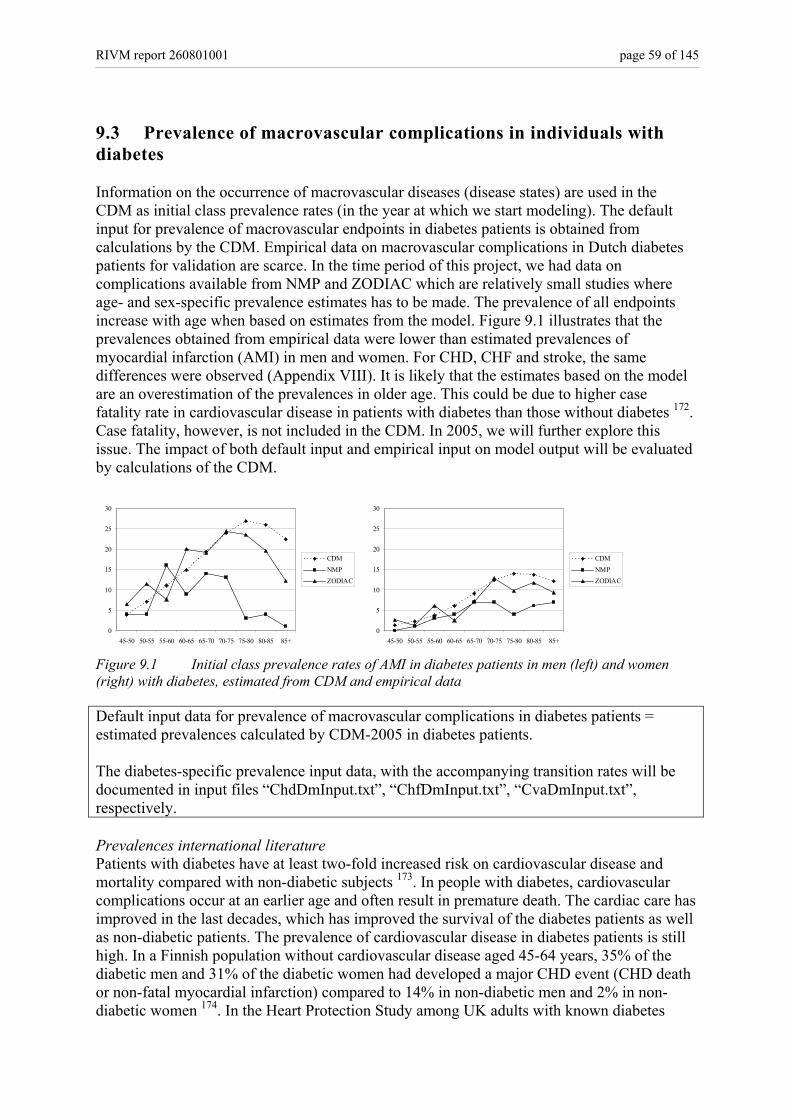
RIVM report 260801001 page 59 of 145
9.3 Prevalence of macrovascular complications in individuals with diabetes Information on the occurrence of macrovascular diseases (disease states) are used in the CDM as initial class prevalence rates (in the year at which we start modeling). The default input for prevalence of macrovascular endpoints in diabetes patients is obtained from calculations by the CDM. Empirical data on macrovascular complications in Dutch diabetes patients for validation are scarce. In the time period of this project, we had data on complications available from NMP and ZODIAC which are relatively small studies where age- and sex-specific prevalence estimates has to be made. The prevalence of all endpoints increase with age when based on estimates from the model. Figure 9.1 illustrates that the prevalences obtained from empirical data were lower than estimated prevalences of myocardial infarction (AMI) in men and women. For CHD, CHF and stroke, the same differences were observed (Appendix VIII). It is likely that the estimates based on the model are an overestimation of the prevalences in older age. This could be due to higher case fatality rate in cardiovascular disease in patients with diabetes than those without diabetes 172. Case fatality, however, is not included in the CDM. In 2005, we will further explore this issue. The impact of both default input and empirical input on model output will be evaluated by calculations of the CDM.
0
5
10
15
20
25
30
45-50 50-55 55-60 60-65 65-70 70-75 75-80 80-85 85+
CDMNMPZODIAC
0
5
10
15
20
25
30
45-50 50-55 55-60 60-65 65-70 70-75 75-80 80-85 85+
CDMNMPZODIAC
Figure 9.1 Initial class prevalence rates of AMI in diabetes patients in men (left) and women (right) with diabetes, estimated from CDM and empirical data Default input data for prevalence of macrovascular complications in diabetes patients = estimated prevalences calculated by CDM-2005 in diabetes patients. The diabetes-specific prevalence input data, with the accompanying transition rates will be documented in input files “ChdDmInput.txt”, “ChfDmInput.txt”, “CvaDmInput.txt”, respectively. Prevalences international literature Patients with diabetes have at least two-fold increased risk on cardiovascular disease and mortality compared with non-diabetic subjects 173. In people with diabetes, cardiovascular complications occur at an earlier age and often result in premature death. The cardiac care has improved in the last decades, which has improved the survival of the diabetes patients as well as non-diabetic patients. The prevalence of cardiovascular disease in diabetes patients is still high. In a Finnish population without cardiovascular disease aged 45-64 years, 35% of the diabetic men and 31% of the diabetic women had developed a major CHD event (CHD death or non-fatal myocardial infarction) compared to 14% in non-diabetic men and 2% in non-diabetic women 174. In the Heart Protection Study among UK adults with known diabetes
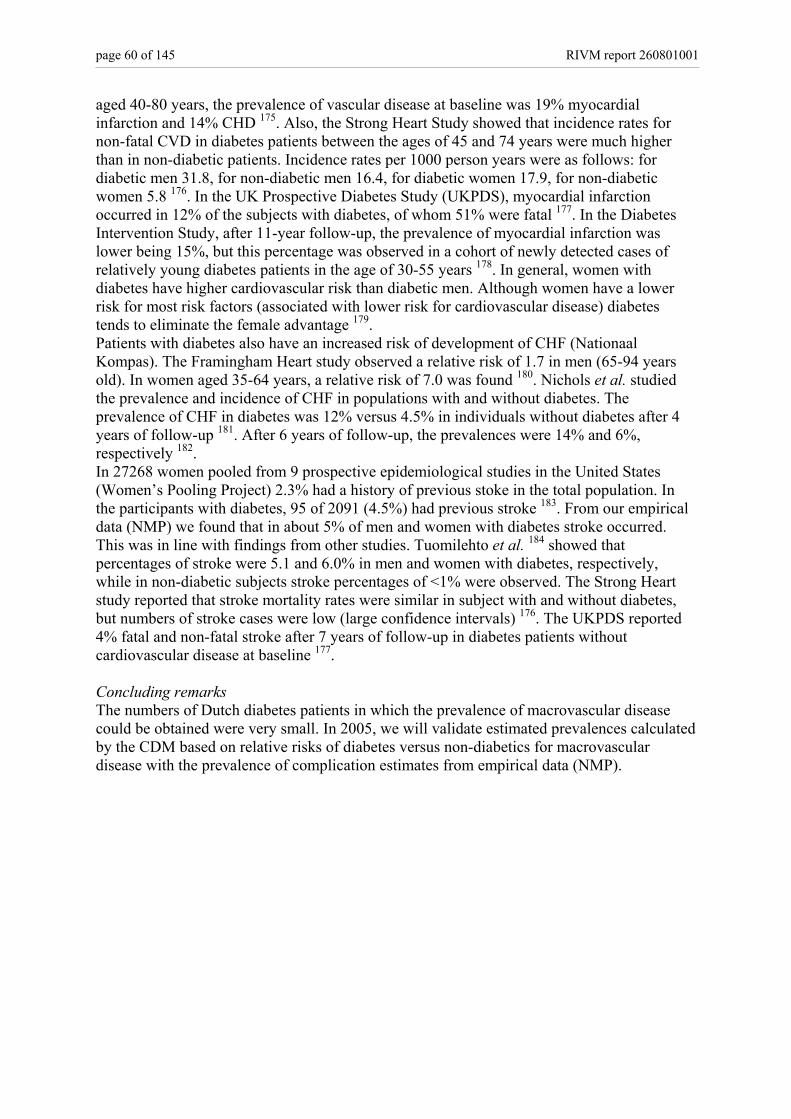
page 60 of 145 RIVM report 260801001
aged 40-80 years, the prevalence of vascular disease at baseline was 19% myocardial infarction and 14% CHD 175. Also, the Strong Heart Study showed that incidence rates for non-fatal CVD in diabetes patients between the ages of 45 and 74 years were much higher than in non-diabetic patients. Incidence rates per 1000 person years were as follows: for diabetic men 31.8, for non-diabetic men 16.4, for diabetic women 17.9, for non-diabetic women 5.8 176. In the UK Prospective Diabetes Study (UKPDS), myocardial infarction occurred in 12% of the subjects with diabetes, of whom 51% were fatal 177. In the Diabetes Intervention Study, after 11-year follow-up, the prevalence of myocardial infarction was lower being 15%, but this percentage was observed in a cohort of newly detected cases of relatively young diabetes patients in the age of 30-55 years 178. In general, women with diabetes have higher cardiovascular risk than diabetic men. Although women have a lower risk for most risk factors (associated with lower risk for cardiovascular disease) diabetes tends to eliminate the female advantage 179. Patients with diabetes also have an increased risk of development of CHF (Nationaal Kompas). The Framingham Heart study observed a relative risk of 1.7 in men (65-94 years old). In women aged 35-64 years, a relative risk of 7.0 was found 180. Nichols et al. studied the prevalence and incidence of CHF in populations with and without diabetes. The prevalence of CHF in diabetes was 12% versus 4.5% in individuals without diabetes after 4 years of follow-up 181. After 6 years of follow-up, the prevalences were 14% and 6%, respectively 182. In 27268 women pooled from 9 prospective epidemiological studies in the United States (Women’s Pooling Project) 2.3% had a history of previous stoke in the total population. In the participants with diabetes, 95 of 2091 (4.5%) had previous stroke 183. From our empirical data (NMP) we found that in about 5% of men and women with diabetes stroke occurred. This was in line with findings from other studies. Tuomilehto et al. 184 showed that percentages of stroke were 5.1 and 6.0% in men and women with diabetes, respectively, while in non-diabetic subjects stroke percentages of <1% were observed. The Strong Heart study reported that stroke mortality rates were similar in subject with and without diabetes, but numbers of stroke cases were low (large confidence intervals) 176. The UKPDS reported 4% fatal and non-fatal stroke after 7 years of follow-up in diabetes patients without cardiovascular disease at baseline 177. Concluding remarks The numbers of Dutch diabetes patients in which the prevalence of macrovascular disease could be obtained were very small. In 2005, we will validate estimated prevalences calculated by the CDM based on relative risks of diabetes versus non-diabetics for macrovascular disease with the prevalence of complication estimates from empirical data (NMP).

RIVM report 260801001 page 61 of 145
10. Risk factors for macrovascular complications in individuals with diabetes G Bos, RT Hoogenveen In this part, we will describe the prevalence of six risk factors for macrovascular disease (overweight, physical activity, smoking, total cholesterol, systolic blood pressure and HbA1c) in diabetes patients, and the association between the risk factors and macrovascular disease in subjects with diabetes. The relation between glucose concentrations and macrovascular events is less powerful than for microvascular complications; smoking, blood pressure, and cholesterol concentration are more important risk factors for macrovascular disease in patients with diabetes than glucose concentration.
10.1 Overweight Prevalence of overweight and obesity in diabetes patients Information on the prevalence (risk factor classes) of overweight, defined as body mass index (BMI) 25-30 kg/m2, and obesity (BMI ≥30 kg/m2) are used in the CDM as initial class prevalence rates (in the year at which we start modeling). The default input for prevalence of macrovascular endpoints in diabetes patients was obtained from calculations by the CDM. Pooled data from ZODIAC, Westfriesland and NMP were used to validate the input prevalence data for the model. In SHL Breda, BMI was not measured. The empirical prevalences corresponded very well in men and women in the three diabetic populations
0%
10%
20%
30%
40%
50%
60%
<25 25-30 >=30 <25 25-30 >=30
Men Women
WFZODIACCMR
Figure 10.1 Percentage overweight and obesity in three data sources (figure 10.1). Overweight and obesity are very common in diabetes patients. This was seen for prevalences based on estimates from the CDM as well as prevalences obtained from empirical data (figure 10.2). Figure 10.2 illustrates that empirical and estimated BMI prevalences in men corresponded very well except for younger ages. In women, the same
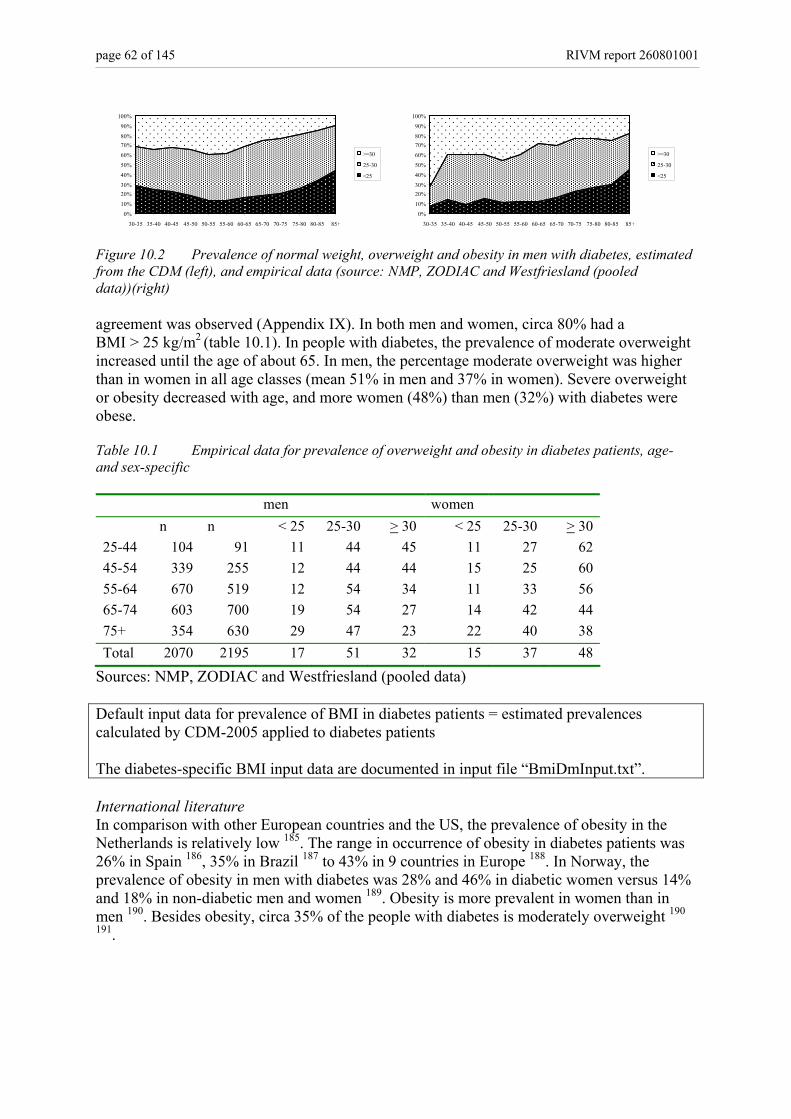
page 62 of 145 RIVM report 260801001
0%
10%
20%30%
40%
50%
60%
70%80%
90%
100%
30-35 35-40 40-45 45-50 50-55 55-60 60-65 65-70 70-75 75-80 80-85 85+
>=30
25-30
<25
0%
10%
20%30%
40%
50%
60%
70%80%
90%
100%
30-35 35-40 40-45 45-50 50-55 55-60 60-65 65-70 70-75 75-80 80-85 85+
>=30
25-30
<25
Figure 10.2 Prevalence of normal weight, overweight and obesity in men with diabetes, estimated from the CDM (left), and empirical data (source: NMP, ZODIAC and Westfriesland (pooled data))(right) agreement was observed (Appendix IX). In both men and women, circa 80% had a BMI > 25 kg/m2 (table 10.1). In people with diabetes, the prevalence of moderate overweight increased until the age of about 65. In men, the percentage moderate overweight was higher than in women in all age classes (mean 51% in men and 37% in women). Severe overweight or obesity decreased with age, and more women (48%) than men (32%) with diabetes were obese. Table 10.1 Empirical data for prevalence of overweight and obesity in diabetes patients, age- and sex-specific men women n n < 25 25-30 > 30 < 25 25-30 > 30 25-44 104 91 11 44 45 11 27 62 45-54 339 255 12 44 44 15 25 60 55-64 670 519 12 54 34 11 33 56 65-74 603 700 19 54 27 14 42 44 75+ 354 630 29 47 23 22 40 38 Total 2070 2195 17 51 32 15 37 48
Sources: NMP, ZODIAC and Westfriesland (pooled data) Default input data for prevalence of BMI in diabetes patients = estimated prevalences calculated by CDM-2005 applied to diabetes patients The diabetes-specific BMI input data are documented in input file “BmiDmInput.txt”. International literature In comparison with other European countries and the US, the prevalence of obesity in the Netherlands is relatively low 185. The range in occurrence of obesity in diabetes patients was 26% in Spain 186, 35% in Brazil 187 to 43% in 9 countries in Europe 188. In Norway, the prevalence of obesity in men with diabetes was 28% and 46% in diabetic women versus 14% and 18% in non-diabetic men and women 189. Obesity is more prevalent in women than in men 190. Besides obesity, circa 35% of the people with diabetes is moderately overweight 190
191.
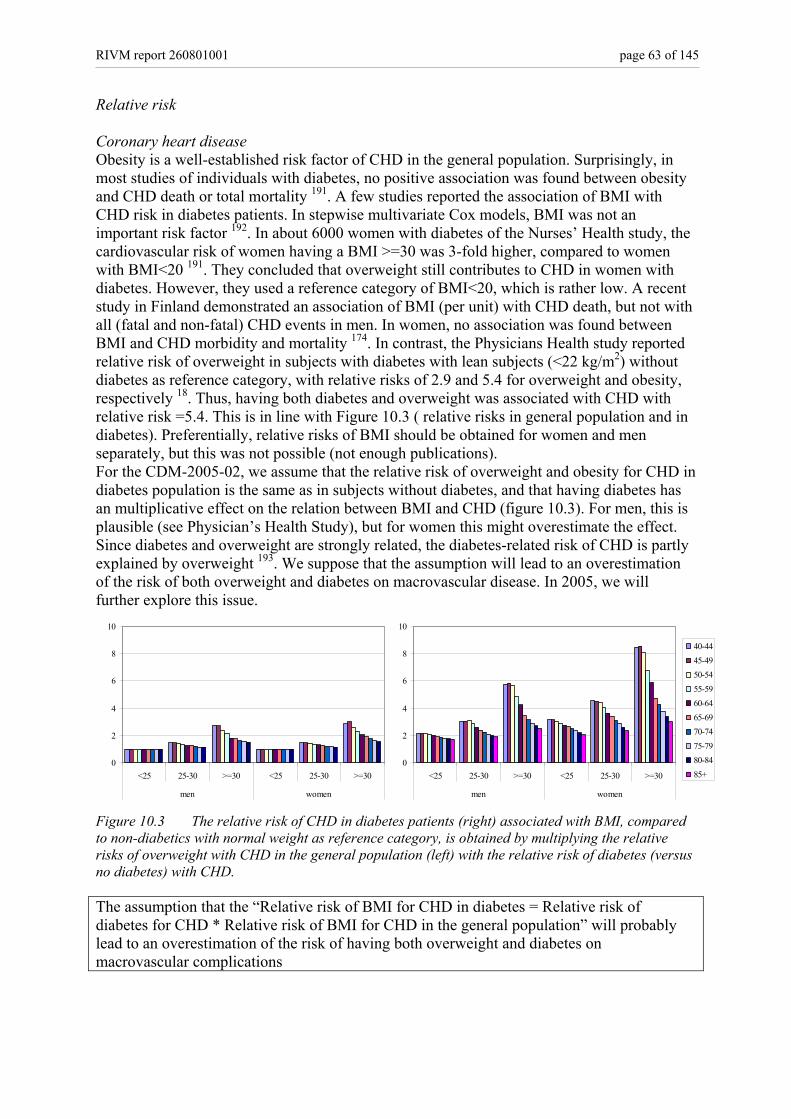
RIVM report 260801001 page 63 of 145
Relative risk Coronary heart disease Obesity is a well-established risk factor of CHD in the general population. Surprisingly, in most studies of individuals with diabetes, no positive association was found between obesity and CHD death or total mortality 191. A few studies reported the association of BMI with CHD risk in diabetes patients. In stepwise multivariate Cox models, BMI was not an important risk factor 192. In about 6000 women with diabetes of the Nurses’ Health study, the cardiovascular risk of women having a BMI >=30 was 3-fold higher, compared to women with BMI<20 191. They concluded that overweight still contributes to CHD in women with diabetes. However, they used a reference category of BMI<20, which is rather low. A recent study in Finland demonstrated an association of BMI (per unit) with CHD death, but not with all (fatal and non-fatal) CHD events in men. In women, no association was found between BMI and CHD morbidity and mortality 174. In contrast, the Physicians Health study reported relative risk of overweight in subjects with diabetes with lean subjects (<22 kg/m2) without diabetes as reference category, with relative risks of 2.9 and 5.4 for overweight and obesity, respectively 18. Thus, having both diabetes and overweight was associated with CHD with relative risk =5.4. This is in line with Figure 10.3 ( relative risks in general population and in diabetes). Preferentially, relative risks of BMI should be obtained for women and men separately, but this was not possible (not enough publications). For the CDM-2005-02, we assume that the relative risk of overweight and obesity for CHD in diabetes population is the same as in subjects without diabetes, and that having diabetes has an multiplicative effect on the relation between BMI and CHD (figure 10.3). For men, this is plausible (see Physician’s Health Study), but for women this might overestimate the effect. Since diabetes and overweight are strongly related, the diabetes-related risk of CHD is partly explained by overweight 193. We suppose that the assumption will lead to an overestimation of the risk of both overweight and diabetes on macrovascular disease. In 2005, we will further explore this issue.
0
2
4
6
8
10
<25 25-30 >=30 <25 25-30 >=30
men women
45-4950-5455-5960-6465-6970-7475-7980-8485+0
2
4
6
8
10
<25 25-30 >=30 <25 25-30 >=30
men women
40-4445-4950-5455-5960-6465-6970-7475-7980-8485+
Figure 10.3 The relative risk of CHD in diabetes patients (right) associated with BMI, compared to non-diabetics with normal weight as reference category, is obtained by multiplying the relative risks of overweight with CHD in the general population (left) with the relative risk of diabetes (versus no diabetes) with CHD. The assumption that the “Relative risk of BMI for CHD in diabetes = Relative risk of diabetes for CHD * Relative risk of BMI for CHD in the general population” will probably lead to an overestimation of the risk of having both overweight and diabetes on macrovascular complications
page 64 of 145 RIVM report 260801001
Heart failure We found only one study (two publications) in which risks of BMI for CHF was reported. After 6 years of follow-up, the risk associated with 2.5 unit change in BMI was 12% 182, that is 12% increased CHF risk for each 2.5 kg/m2 increment in BMI. Another publication of the same study after 2.5 years of follow-up 181 reported an association for change in weight, but not BMI, with risk of CHF. Both studies, however, were carried out in a population of both diabetic and non-diabetic individuals. We conclude that there is little evidence to support a strong association between BMI and CHF in diabetes patients. In 2005, sensitivity analysis will be performed to quantify the effect of using relative risk estimates in diabetes patients derived from the model versus relative risks of 1 (no effect) for the purpose of modeling BMI as a risk factor for CHF. The assumption that the “Relative risk of BMI for CHF in diabetes = Relative risk of diabetes for CHF * Relative risk of BMI for CHF in the general population” will probably lead to an overestimation of the risk of having both overweight and diabetes on macrovascular complications Stroke There were only two studies that reported the association of BMI with stroke risk in diabetes patients. Lehto and Tuomilehto did not observe an association between BMI and stroke in subjects with diabetes 184 194. We did not find clear evidence for an association between BMI and stroke in diabetes patients. In modeling BMI as a risk factor for stroke as a complication of diabetes, sensitivity analysis will be performed to quantify the effect of using relative risk estimates derived from the model versus relative risks of 1 (no effect). The assumption that the “Relative risk of BMI for stroke in diabetes = Relative risk of diabetes for stroke * Relative risk of BMI for stroke in the general population” will probably lead to an overestimation of the risk of having both overweight and diabetes on macrovascular complications Concluding remarks There is a considerable difference in the distribution of BMI in 3 categories between people with and without diabetes. For the CDM-2005-02, we assume equal transition rates between the BMI prevalences in diabetes patients compared to the general population. Because of lack of publications on relative risks of BMI for macrovascular disease in diabetes patients, we will validate the input in the CDM to external data.
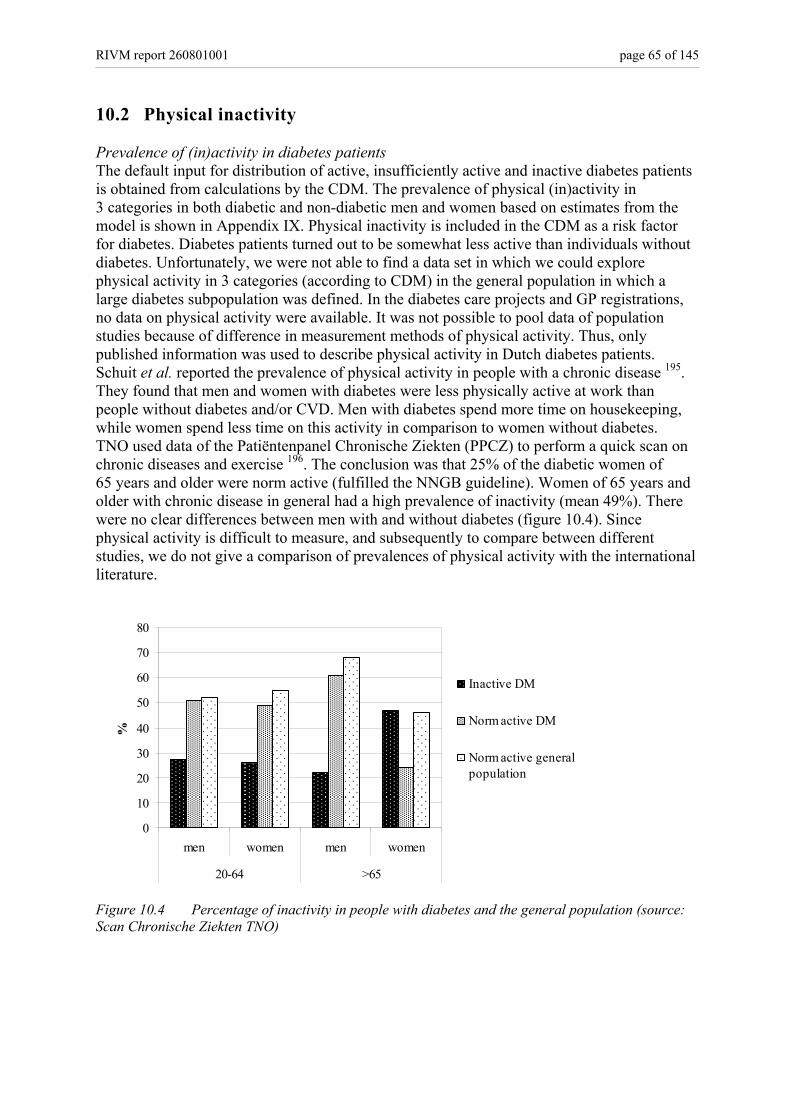
RIVM report 260801001 page 65 of 145
10.2 Physical inactivity Prevalence of (in)activity in diabetes patients The default input for distribution of active, insufficiently active and inactive diabetes patients is obtained from calculations by the CDM. The prevalence of physical (in)activity in 3 categories in both diabetic and non-diabetic men and women based on estimates from the model is shown in Appendix IX. Physical inactivity is included in the CDM as a risk factor for diabetes. Diabetes patients turned out to be somewhat less active than individuals without diabetes. Unfortunately, we were not able to find a data set in which we could explore physical activity in 3 categories (according to CDM) in the general population in which a large diabetes subpopulation was defined. In the diabetes care projects and GP registrations, no data on physical activity were available. It was not possible to pool data of population studies because of difference in measurement methods of physical activity. Thus, only published information was used to describe physical activity in Dutch diabetes patients. Schuit et al. reported the prevalence of physical activity in people with a chronic disease 195. They found that men and women with diabetes were less physically active at work than people without diabetes and/or CVD. Men with diabetes spend more time on housekeeping, while women spend less time on this activity in comparison to women without diabetes. TNO used data of the Patiëntenpanel Chronische Ziekten (PPCZ) to perform a quick scan on chronic diseases and exercise 196. The conclusion was that 25% of the diabetic women of 65 years and older were norm active (fulfilled the NNGB guideline). Women of 65 years and older with chronic disease in general had a high prevalence of inactivity (mean 49%). There were no clear differences between men with and without diabetes (figure 10.4). Since physical activity is difficult to measure, and subsequently to compare between different studies, we do not give a comparison of prevalences of physical activity with the international literature.
0
10
20
30
40
50
60
70
80
men women men women
20-64 >65
%
Inactive DM
Norm active DM
Norm active generalpopulation
Figure 10.4 Percentage of inactivity in people with diabetes and the general population (source: Scan Chronische Ziekten TNO)
page 66 of 145 RIVM report 260801001
Input data for prevalence of physical activity in diabetes patients = estimated prevalences calculated by CDM-2005 applied to diabetes patients The diabetes-specific physical activity input data are documented in input file “LichactDmInput.txt”. Relative risk The possible protective effect of physical activity on macrovascular complications in patients with diabetes is not clear. In US adults with diabetes, walking was associated with lower all cause mortality, but the association with CVD mortality was less clear 197. In a cross-sectional, case-control study, physical activity (moderate and vigorous) seemed to be associated with a lower prevalence of acute coronary events in the investigated group of diabetic subjects. Light physical activity did not have any significant association with the development of acute coronary events 198. In univariate analyses, physical activity was protective for AMI, but in stepwise multivariate Cox models, physical activity was not an important risk factor 199. The diabetic women in the Nurses Health demonstrated a 40% decreased CHD risk with 4 to 7 times moderate to vigorous activity per week 200. A 26% decrease in stroke was observed in active women, but this was not significant. No other studies reporting a relation between exercise and stroke in diabetes were found. In addition, several studies showed that cardio respiratory fitness was associated with lower cardiovascular risk, but fitness is not included in the CDM. Overall, there was a trend in increased cardiovascular risk with inactivity, but the majority of the associations between exercise and macrovascular endpoints did not reach significance. For the CDM-2005-02, we assume that the relative risk of physical activity for CHD and stroke in diabetes population is the same as in subjects without diabetes, and that having diabetes has an multiplicative effect on the relation between physical inactivity and CHD and stroke. This assumption will possibly lead to an overestimation of the risk on macrovascular disease, but we did not found evidence to reject the hypothesis that the relation between physical inactivity and macrovascular disease is the same in subjects with diabetes compared to subjects without diabetes. The assumption that the “Relative risks of physical (in)activity for CHD and stroke in diabetes = Relative risk of diabetes for CHD and stroke * Relative risks of physical (in)activity for CHD and stroke in the general population” will probably lead to an overestimation of the risk of both physical (in)activity on these macrovascular complications in a diabetic population Concluding remarks Due to lack of a Dutch (general) population study including sufficient diabetes patients, and a reliable measurement of physical activity, it was not possible to validate the estimated prevalence of physical activity in diabetes patients. When better data are available, we will confirm that the input in the CDM is reliable. In modeling physical inactivity as a risk factor for macrovascular complications, sensitivity analysis will be performed to quantify the effect of using relative risk estimates derived from the model versus relative risks of 1 (no association).

RIVM report 260801001 page 67 of 145
10.3 Smoking Prevalence of smoking The default input for distribution of smoking in diabetes patients is obtained from calculations by the CDM. Smoking is included in the CDM as a (weak) risk factor for incidence of diabetes. The prevalence of smoking in diabetes patients is almost equally to individuals without diabetes (Appendix IX). Empirical data about smoking in Dutch diabetes patients is scarce. Only ZODIAC and NMP provided data on smoking in diabetes patients, but information about former smoking was missing in NMP. We compared the estimated prevalences derived from the CDM with prevalences of current smoking in ZODIAC and NMP (figure 10.5). There were differences
Smoking men
0
10
20
30
40
50
60
30-39 40-49 50-59 60-74 75+
Estimate derived fromCDMZodiac
NMP
Smoking women
0
10
20
30
40
50
60
30-39 40-49 50-59 60-74 75+
Estimate derived fromCDMZodiac
NMP
Figure 10.5 Estimated prevalences of current smoking in diabetes patients (white bars) compared to prevalence of current smoking in ZODIAC and NMP between the estimated and empirical smoking values as well as between ZODIAC and NMP data in men and women. In men, ZODIAC prevalences of smoking were higher and NMP prevalences of current smoking were lower than the estimate derived from the model. This could be due to small numbers (n<50 in age groups <50 y) or to regional differences in smoking habits (Nationale Atlas Volksgezondheid, RIVM, Bilthoven). In table 10.2 the prevalences of former smoking are shown. In men, prevalence of former smoking in CDM increased more with age than in ZODIAC. There were less former smokers among women in ZODIAC than the model-derived prevalences of former smoking. More data on (former) smoking in both subjects with and without diabetes are needed to assess whether smoking habits in Dutch diabetes patients are different from the general population. We conclude that there is not enough evidence to reject the estimates from the model. Table 10.2 Estimated prevalences of former smoking in diabetes patients compared to prevalence of current smoking in ZODIAC Men Women Estimate derived from CDM Zodiac Estimate derived from CDM Zodiac 30-39 17 14 20 17 40-49 30 21 34 36 50-59 48 43 39 23 60-74 66 56 38 16 75+ 81 59 23 10
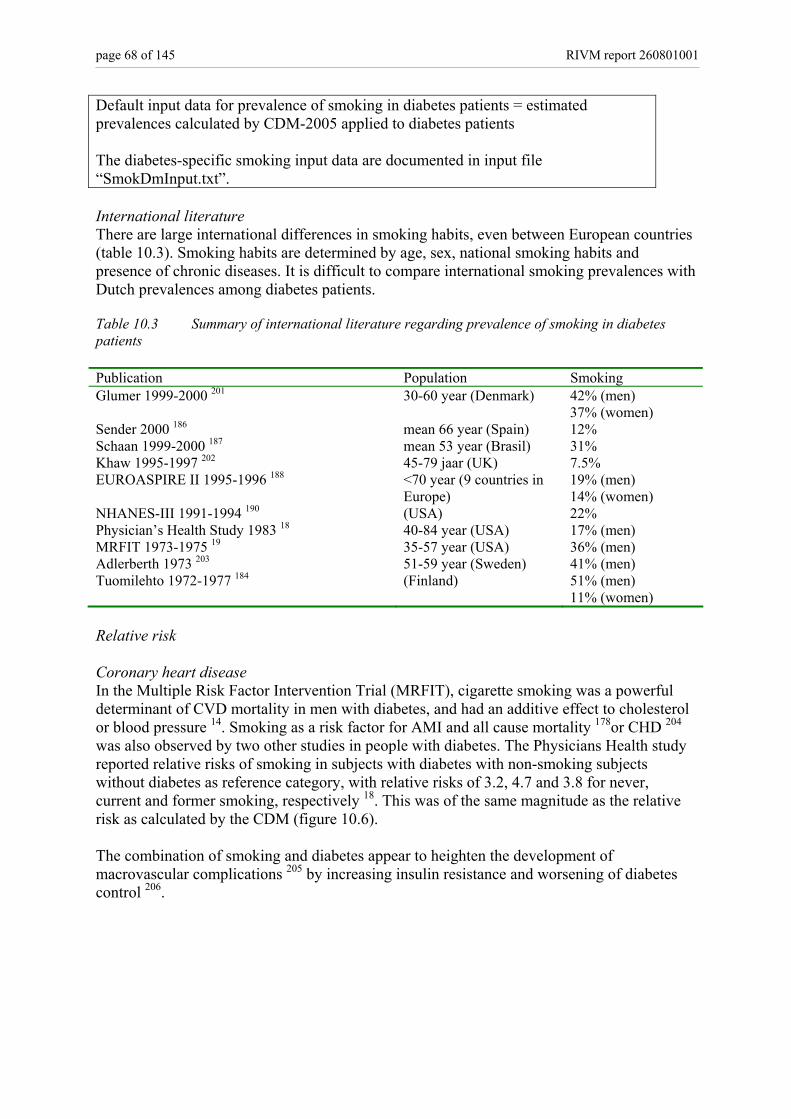
page 68 of 145 RIVM report 260801001
Default input data for prevalence of smoking in diabetes patients = estimated prevalences calculated by CDM-2005 applied to diabetes patients The diabetes-specific smoking input data are documented in input file “SmokDmInput.txt”. International literature There are large international differences in smoking habits, even between European countries (table 10.3). Smoking habits are determined by age, sex, national smoking habits and presence of chronic diseases. It is difficult to compare international smoking prevalences with Dutch prevalences among diabetes patients. Table 10.3 Summary of international literature regarding prevalence of smoking in diabetes patients Publication Population Smoking Glumer 1999-2000 201 30-60 year (Denmark) 42% (men)
37% (women) Sender 2000 186 mean 66 year (Spain) 12% Schaan 1999-2000 187 mean 53 year (Brasil) 31% Khaw 1995-1997 202 45-79 jaar (UK) 7.5% EUROASPIRE II 1995-1996 188 <70 year (9 countries in
Europe) 19% (men) 14% (women)
NHANES-III 1991-1994 190 (USA) 22% Physician’s Health Study 1983 18 40-84 year (USA) 17% (men) MRFIT 1973-1975 19 35-57 year (USA) 36% (men) Adlerberth 1973 203 51-59 year (Sweden) 41% (men) Tuomilehto 1972-1977 184 (Finland) 51% (men)
11% (women) Relative risk Coronary heart disease In the Multiple Risk Factor Intervention Trial (MRFIT), cigarette smoking was a powerful determinant of CVD mortality in men with diabetes, and had an additive effect to cholesterol or blood pressure 14. Smoking as a risk factor for AMI and all cause mortality 178or CHD 204 was also observed by two other studies in people with diabetes. The Physicians Health study reported relative risks of smoking in subjects with diabetes with non-smoking subjects without diabetes as reference category, with relative risks of 3.2, 4.7 and 3.8 for never, current and former smoking, respectively 18. This was of the same magnitude as the relative risk as calculated by the CDM (figure 10.6). The combination of smoking and diabetes appear to heighten the development of macrovascular complications 205 by increasing insulin resistance and worsening of diabetes control 206.

RIVM report 260801001 page 69 of 145
0
2
4
6
8
10
12
Never Current Former Never Current Former
Men Women
40-4445-4950-5455-5960-6465-6970-7475-7980-8485+
0
2
4
6
8
10
12
Never Current Former Never Current Former
Men Women
40-4445-4950-5455-5960-6465-6970-7475-7980-8485+
Figure 10.6 The relative risk of smoking for CHD in diabetes patients (right) with never smoking subjects without diabetes as reference category is obtained by multiplying the relative risks of smoking with CHD in the general population (left) with the relative risk of diabetes (versus no diabetes) with CHD. As input in the CDM, we assumed that the relative risk of current and former smoking as a cardiovascular risk factor is the same subjects with and without diabetes, and that having diabetes has an multiplicative effect. We conclude that there is evidence in the international literature for this assumption. The assumption that the “Relative risk of smoking for CHD in diabetes = Relative risk of diabetes for CHD * Relative risk of smoking for CHD in the general population” is reasonable for estimating the risk of smoking on macrovascular complications in a diabetic population Heart failure and stroke We did not find publications on the role of smoking in the development of CHF in diabetes patients. The publications about stroke were conflicting. The UKPDS showed that smoking is a risk factor for stroke 207. In contrast, in the London cohort of the prospective WHO Multinational Study of Vascular Disease in Diabetes, smoking was not associated with stroke 208. In summary, we did not find evidence to assume that the association between smoking with CHF and stroke in diabetes patients is different from the association in the general population. The assumption that the “Relative risks of smoking for CHF and stroke in diabetes = Relative risk of diabetes for CHF and stroke * Relative risks of smoking for CHF and stroke in the general population” seem to be reasonable for the risk of smoking on macrovascular complications in a diabetic population Concluding remarks In future modeling, a validation of smoking input will be performed to quantify the effect of using relative risk estimates the default smoking input derived from the model versus empirical data (ZODIAC). We recommend access to smoking data in a Dutch (general) population study with at least 1000 diabetes patients and measurement of current and former smoking to estimate the prevalence of smoking in both diabetes patients and the general population from the same population.
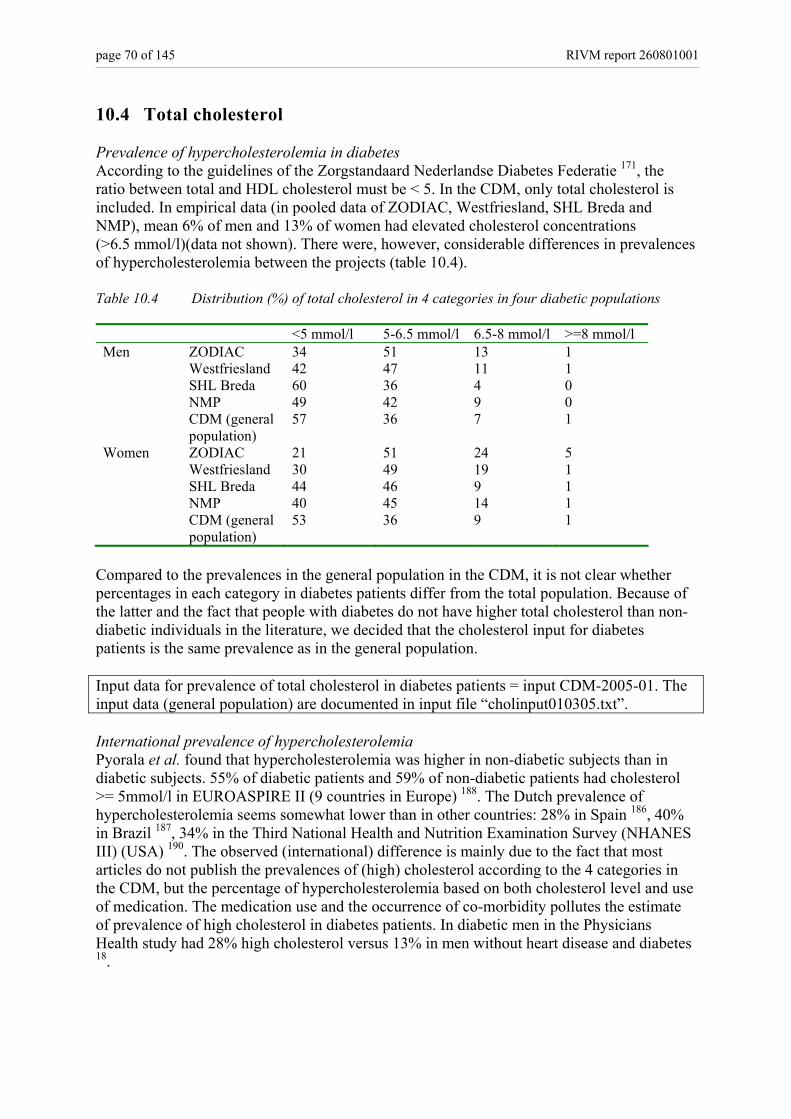
page 70 of 145 RIVM report 260801001
10.4 Total cholesterol Prevalence of hypercholesterolemia in diabetes According to the guidelines of the Zorgstandaard Nederlandse Diabetes Federatie 171, the ratio between total and HDL cholesterol must be < 5. In the CDM, only total cholesterol is included. In empirical data (in pooled data of ZODIAC, Westfriesland, SHL Breda and NMP), mean 6% of men and 13% of women had elevated cholesterol concentrations (>6.5 mmol/l)(data not shown). There were, however, considerable differences in prevalences of hypercholesterolemia between the projects (table 10.4). Table 10.4 Distribution (%) of total cholesterol in 4 categories in four diabetic populations <5 mmol/l 5-6.5 mmol/l 6.5-8 mmol/l >=8 mmol/l Men ZODIAC 34 51 13 1 Westfriesland 42 47 11 1 SHL Breda 60 36 4 0 NMP 49 42 9 0 CDM (general
population) 57 36 7 1
Women ZODIAC 21 51 24 5 Westfriesland 30 49 19 1 SHL Breda 44 46 9 1 NMP 40 45 14 1 CDM (general
population) 53 36 9 1
Compared to the prevalences in the general population in the CDM, it is not clear whether percentages in each category in diabetes patients differ from the total population. Because of the latter and the fact that people with diabetes do not have higher total cholesterol than non-diabetic individuals in the literature, we decided that the cholesterol input for diabetes patients is the same prevalence as in the general population. Input data for prevalence of total cholesterol in diabetes patients = input CDM-2005-01. The input data (general population) are documented in input file “cholinput010305.txt”. International prevalence of hypercholesterolemia Pyorala et al. found that hypercholesterolemia was higher in non-diabetic subjects than in diabetic subjects. 55% of diabetic patients and 59% of non-diabetic patients had cholesterol >= 5mmol/l in EUROASPIRE II (9 countries in Europe) 188. The Dutch prevalence of hypercholesterolemia seems somewhat lower than in other countries: 28% in Spain 186, 40% in Brazil 187, 34% in the Third National Health and Nutrition Examination Survey (NHANES III) (USA) 190. The observed (international) difference is mainly due to the fact that most articles do not publish the prevalences of (high) cholesterol according to the 4 categories in the CDM, but the percentage of hypercholesterolemia based on both cholesterol level and use of medication. The medication use and the occurrence of co-morbidity pollutes the estimate of prevalence of high cholesterol in diabetes patients. In diabetic men in the Physicians Health study had 28% high cholesterol versus 13% in men without heart disease and diabetes 18.
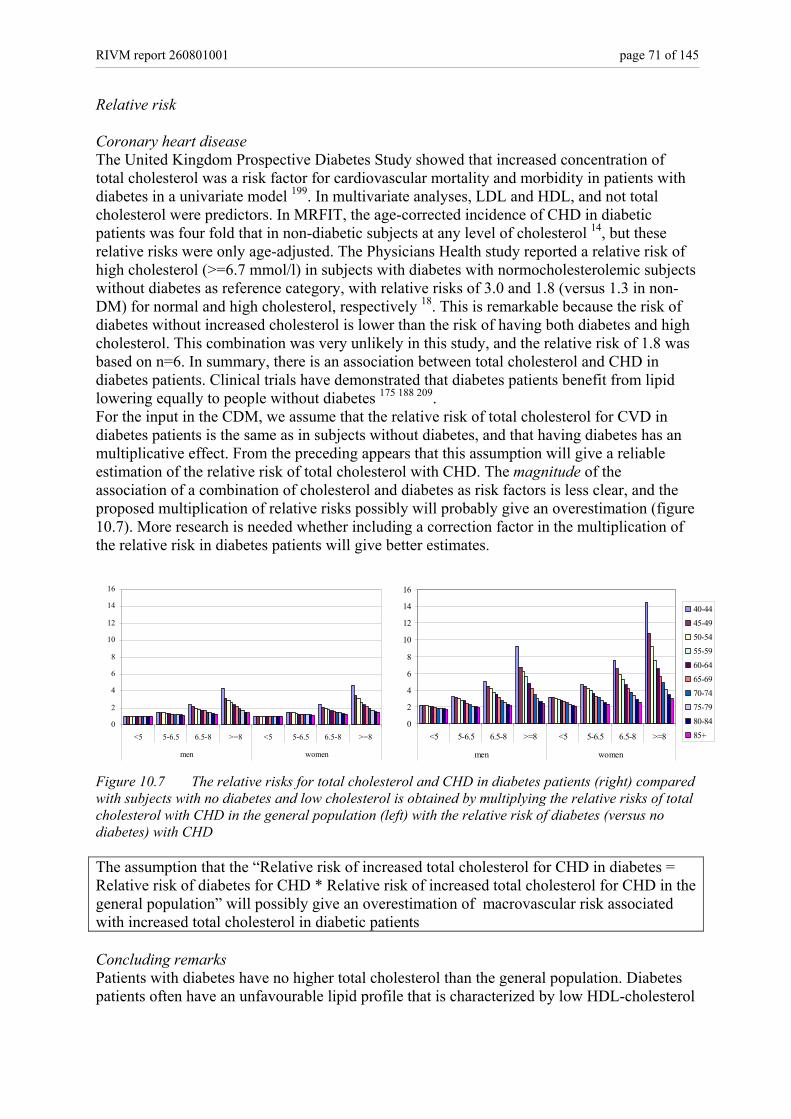
RIVM report 260801001 page 71 of 145
Relative risk Coronary heart disease The United Kingdom Prospective Diabetes Study showed that increased concentration of total cholesterol was a risk factor for cardiovascular mortality and morbidity in patients with diabetes in a univariate model 199. In multivariate analyses, LDL and HDL, and not total cholesterol were predictors. In MRFIT, the age-corrected incidence of CHD in diabetic patients was four fold that in non-diabetic subjects at any level of cholesterol 14, but these relative risks were only age-adjusted. The Physicians Health study reported a relative risk of high cholesterol (>=6.7 mmol/l) in subjects with diabetes with normocholesterolemic subjects without diabetes as reference category, with relative risks of 3.0 and 1.8 (versus 1.3 in non-DM) for normal and high cholesterol, respectively 18. This is remarkable because the risk of diabetes without increased cholesterol is lower than the risk of having both diabetes and high cholesterol. This combination was very unlikely in this study, and the relative risk of 1.8 was based on n=6. In summary, there is an association between total cholesterol and CHD in diabetes patients. Clinical trials have demonstrated that diabetes patients benefit from lipid lowering equally to people without diabetes 175 188 209. For the input in the CDM, we assume that the relative risk of total cholesterol for CVD in diabetes patients is the same as in subjects without diabetes, and that having diabetes has an multiplicative effect. From the preceding appears that this assumption will give a reliable estimation of the relative risk of total cholesterol with CHD. The magnitude of the association of a combination of cholesterol and diabetes as risk factors is less clear, and the proposed multiplication of relative risks possibly will probably give an overestimation (figure 10.7). More research is needed whether including a correction factor in the multiplication of the relative risk in diabetes patients will give better estimates.
0
2
4
6
8
10
12
14
16
<5 5-6.5 6.5-8 >=8 <5 5-6.5 6.5-8 >=8
men women
40-4445-4950-5455-5960-6465-6970-7475-7980-8485+
0
2
4
6
8
10
12
14
16
<5 5-6.5 6.5-8 >=8 <5 5-6.5 6.5-8 >=8
men women
Figure 10.7 The relative risks for total cholesterol and CHD in diabetes patients (right) compared with subjects with no diabetes and low cholesterol is obtained by multiplying the relative risks of total cholesterol with CHD in the general population (left) with the relative risk of diabetes (versus no diabetes) with CHD The assumption that the “Relative risk of increased total cholesterol for CHD in diabetes = Relative risk of diabetes for CHD * Relative risk of increased total cholesterol for CHD in the general population” will possibly give an overestimation of macrovascular risk associated with increased total cholesterol in diabetic patients Concluding remarks Patients with diabetes have no higher total cholesterol than the general population. Diabetes patients often have an unfavourable lipid profile that is characterized by low HDL-cholesterol
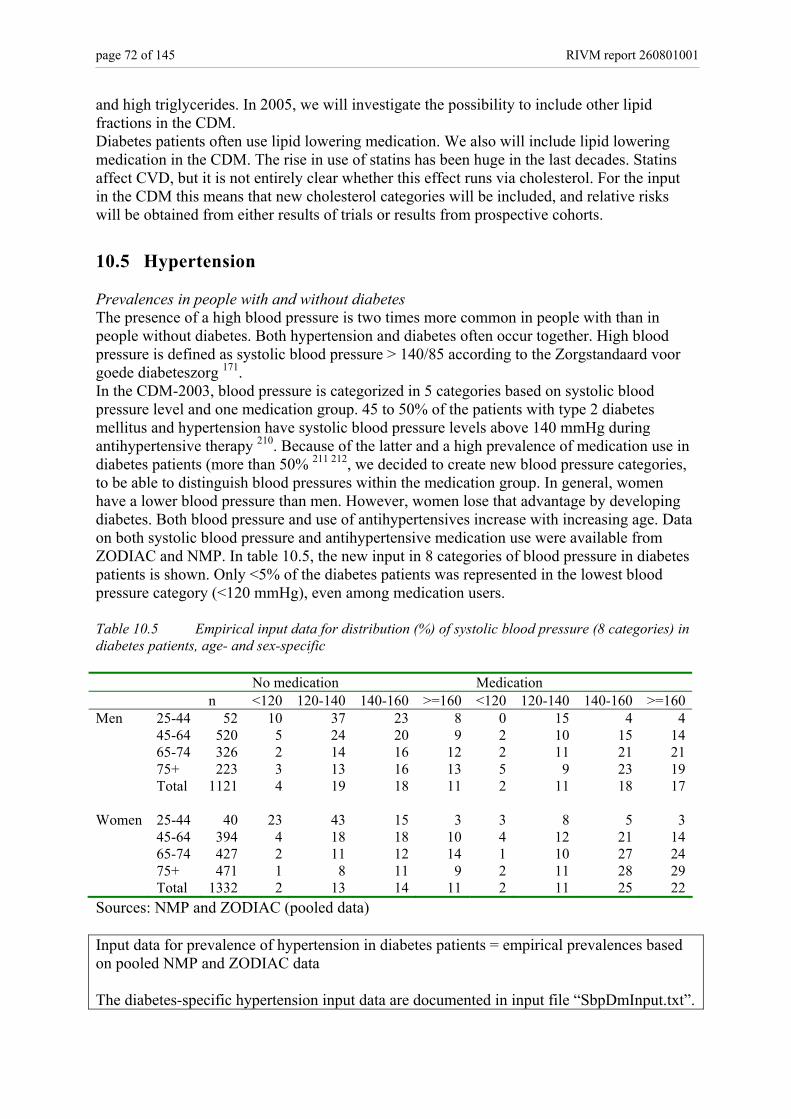
page 72 of 145 RIVM report 260801001
and high triglycerides. In 2005, we will investigate the possibility to include other lipid fractions in the CDM. Diabetes patients often use lipid lowering medication. We also will include lipid lowering medication in the CDM. The rise in use of statins has been huge in the last decades. Statins affect CVD, but it is not entirely clear whether this effect runs via cholesterol. For the input in the CDM this means that new cholesterol categories will be included, and relative risks will be obtained from either results of trials or results from prospective cohorts.
10.5 Hypertension Prevalences in people with and without diabetes The presence of a high blood pressure is two times more common in people with than in people without diabetes. Both hypertension and diabetes often occur together. High blood pressure is defined as systolic blood pressure > 140/85 according to the Zorgstandaard voor goede diabeteszorg 171. In the CDM-2003, blood pressure is categorized in 5 categories based on systolic blood pressure level and one medication group. 45 to 50% of the patients with type 2 diabetes mellitus and hypertension have systolic blood pressure levels above 140 mmHg during antihypertensive therapy 210. Because of the latter and a high prevalence of medication use in diabetes patients (more than 50% 211 212, we decided to create new blood pressure categories, to be able to distinguish blood pressures within the medication group. In general, women have a lower blood pressure than men. However, women lose that advantage by developing diabetes. Both blood pressure and use of antihypertensives increase with increasing age. Data on both systolic blood pressure and antihypertensive medication use were available from ZODIAC and NMP. In table 10.5, the new input in 8 categories of blood pressure in diabetes patients is shown. Only <5% of the diabetes patients was represented in the lowest blood pressure category (<120 mmHg), even among medication users. Table 10.5 Empirical input data for distribution (%) of systolic blood pressure (8 categories) in diabetes patients, age- and sex-specific No medication Medication n <120 120-140 140-160 >=160 <120 120-140 140-160 >=160Men 25-44 52 10 37 23 8 0 15 4 4 45-64 520 5 24 20 9 2 10 15 14 65-74 326 2 14 16 12 2 11 21 21 75+ 223 3 13 16 13 5 9 23 19 Total 1121 4 19 18 11 2 11 18 17 Women 25-44 40 23 43 15 3 3 8 5 3 45-64 394 4 18 18 10 4 12 21 14 65-74 427 2 11 12 14 1 10 27 24 75+ 471 1 8 11 9 2 11 28 29 Total 1332 2 13 14 11 2 11 25 22Sources: NMP and ZODIAC (pooled data) Input data for prevalence of hypertension in diabetes patients = empirical prevalences based on pooled NMP and ZODIAC data The diabetes-specific hypertension input data are documented in input file “SbpDmInput.txt”.
RIVM report 260801001 page 73 of 145
International literature It is well known that more than 50% of the patients with diabetes are hypertensive. The prevalences in the Dutch diabetes patients were in line with prevalences in the international literature. A mean of 57% hypertension was reported in a 9 countries study in Europe 188. In the UKPDS, prevalence of hypertension (systolic blood pressure >=160 or diastolic blood pressure >=90 or antihypertensive medication) was 33% in men and 45% in women, but diabetes patients with cardiovascular disease were excluded 213. Prevalence of hypertension of 63% was found in NHANES III (USA) 190. There were no differences between men and women with diabetes. Relative risk Coronary heart disease The role of hypertension as a risk factor of increased cardiovascular risk among diabetes has been extensively investigated. The association of hypertension with CVD in diabetes is strong: mortality is increased 4 to 7-fold in patients with diabetes and hypertension when compared with normotensive non-diabetic subjects 214. In the UKPDS, the incidence of macrovascular complications in diabetes patients was associated with systolic blood pressure. Each 10 mmHg increase in mean systolic blood pressure was associated with 11% higher risk of AMI 215 and 9% higher risk of CHD 76. Thus, hypertension is not only more frequent in diabetes patients, but has also a greater impact on CVD than in non-diabetic subjects 14 216. It is clear that high blood pressure accelerates the development of micro- and macrovascular complications of diabetes. Hypertension also appears to accelerate vascular and cardiac abnormalities in diabetes 217. A theory is that the hyperglycemic state makes the vessels more vulnerable, even with moderate low blood pressure. If this is true, even diabetes patients with lower blood pressure are at higher risk for CVD. This is supported by the results of the MRFIT study which reported that even at systolic levels <120 mmHg, patients with diabetes have higher risk of CVD mortality than do those without diabetes 14. Also, clinical trials have demonstrated that treatment of blood pressure in the normotensive range of diabetes is associated with a reduction in cardiovascular disease. Individuals with type 2 diabetes derived more benefit from aggressive blood pressure lowering than did those without diabetes 218-220. For the CDM, we assumed that the relative risk of hypertension for CVD in diabetes population is the same as in subjects without diabetes, and that having diabetes has an multiplicative effect. There is convincing evidence for this assumption in the literature. The assumption that the “Relative risk of increased systolic blood pressure for CHD in diabetes = Relative risk of diabetes for CHD * Relative risk of increased systolic blood pressure for CHD in the general population” is a reasonable estimate for the association of increased systolic blood pressure with increased macrovascular risk in diabetic patients Heart failure We did not find studies on systolic blood pressure and CHF in diabetes patients that met our criteria. At this moment, it is not possible to evaluate whether it is reasonable to assume that the relative risk of hypertension for CVD in diabetes population is the same as in subjects without diabetes.
page 74 of 145 RIVM report 260801001
The assumption that the “Relative risk of increased systolic blood pressure for CHF in diabetes = Relative risk of diabetes for CHF * Relative risk of increased systolic blood pressure for CHF in the general population” was not rejected as a reasonable estimate for the association of increased systolic blood pressure with increased macrovascular risk in diabetic patients Stroke Lewington et al. studied the association between 20 mmHg blood pressure lowering and stroke mortality in one million adults in 5 age-groups in a meta-analysis. The relative risk ranged from 0.33 in age 40-49 to 0.68 in age 80-89 in men, and from 0.41 to 0.65 in women 221. In younger age-groups were obtained stronger associations than in older age. In the UKPDS, increase of 10 mmHg in systolic blood pressure was associated with a relative risk of 1.19 (1.14-1.24) for (non)fatal stroke 215. In addition, antihypertensive treatment is effective in preventing stroke in diabetes patients 222. We found some evidence for the assumption that the relative risk of hypertension for CVD in diabetes population is the same as in subjects without diabetes, but the amount of studies was limited. The assumption that the “Relative risk of increased systolic blood pressure for stroke in diabetes = Relative risk of diabetes for stroke * Relative risk of increased systolic blood pressure for stroke in the general population” is reasonable according to some findings in the literature for the association of increased systolic blood pressure with increased macrovascular risk in diabetic patients Concluding remarks Following the new prevalence of systolic blood pressure in 8 categories in diabetes patients, the CDM needs adaptation of the prevalence of blood pressure in the total population in 8 categories also. This will be done in 2005. This also requires adaptations of the relative risks of blood pressure with cardiovascular disease. CHF is the least well described macrovascular endpoint. There is a clear relation between diabetes and CHF. The relation of blood pressure (and other risk factors) to CHF in diabetes patients needs more attention in future research.
10.6 HbA1c Glycated hemoglobin (HbA1c) is a measure of mean blood glucose concentrations over about 3 months. Long term increased blood glucose levels leads to micro- and macrovascular complications. In the general population, the risk of macrovascular disease is associated with HbA1c 202. In the CDM-2005-02, normal HbA1c in diabetes patients is defined as <7% and too high HbA1c as >=8.5% according to the guidelines of the Zorgstandaard Nederlandse Diabetes Federatie 171. Prevalence of HbA1c in people with diabetes In two of the three Diabetes care projects, ZODIAC and SHL Breda, 54% of men and 56% of women had elevated HbA1c (≥7%), of which 12 and 13% were badly controlled with an Hba1c >8.5%. In one other care project, in Westfriesland and in NMP the percentage of diabetes patients with an HbA1c below 7% was larger. There was a difference in amount of better controlled patients between populations. In the Dutch literature, the percentage of well controlled patients was even lower (~40%) 211 223 224, and 15 to 30% of the people with diabetes were in the highest category. The prevalence of high HbA1c differs between
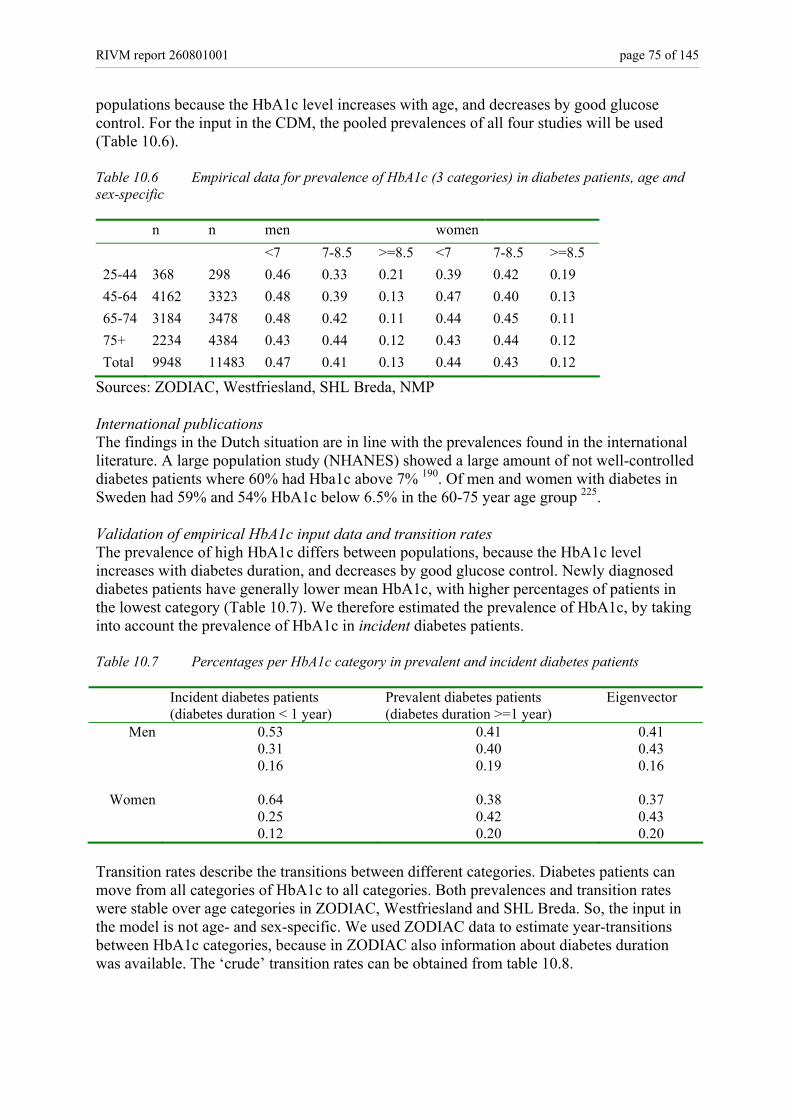
RIVM report 260801001 page 75 of 145
populations because the HbA1c level increases with age, and decreases by good glucose control. For the input in the CDM, the pooled prevalences of all four studies will be used (Table 10.6). Table 10.6 Empirical data for prevalence of HbA1c (3 categories) in diabetes patients, age and sex-specific n n men women <7 7-8.5 >=8.5 <7 7-8.5 >=8.5 25-44 368 298 0.46 0.33 0.21 0.39 0.42 0.19 45-64 4162 3323 0.48 0.39 0.13 0.47 0.40 0.13 65-74 3184 3478 0.48 0.42 0.11 0.44 0.45 0.11 75+ 2234 4384 0.43 0.44 0.12 0.43 0.44 0.12 Total 9948 11483 0.47 0.41 0.13 0.44 0.43 0.12
Sources: ZODIAC, Westfriesland, SHL Breda, NMP International publications The findings in the Dutch situation are in line with the prevalences found in the international literature. A large population study (NHANES) showed a large amount of not well-controlled diabetes patients where 60% had Hba1c above 7% 190. Of men and women with diabetes in Sweden had 59% and 54% HbA1c below 6.5% in the 60-75 year age group 225. Validation of empirical HbA1c input data and transition rates The prevalence of high HbA1c differs between populations, because the HbA1c level increases with diabetes duration, and decreases by good glucose control. Newly diagnosed diabetes patients have generally lower mean HbA1c, with higher percentages of patients in the lowest category (Table 10.7). We therefore estimated the prevalence of HbA1c, by taking into account the prevalence of HbA1c in incident diabetes patients. Table 10.7 Percentages per HbA1c category in prevalent and incident diabetes patients Incident diabetes patients
(diabetes duration < 1 year) Prevalent diabetes patients (diabetes duration >=1 year)
Eigenvector
Men 0.53 0.41 0.41 0.31 0.40 0.43 0.16 0.19 0.16
Women 0.64 0.38 0.37
0.25 0.42 0.43 0.12 0.20 0.20
Transition rates describe the transitions between different categories. Diabetes patients can move from all categories of HbA1c to all categories. Both prevalences and transition rates were stable over age categories in ZODIAC, Westfriesland and SHL Breda. So, the input in the model is not age- and sex-specific. We used ZODIAC data to estimate year-transitions between HbA1c categories, because in ZODIAC also information about diabetes duration was available. The ‘crude’ transition rates can be obtained from table 10.8.

page 76 of 145 RIVM report 260801001
Table 10.8 1-Year transitions between 3 categories of HbA1c HbA1c (Year x+1) <7% 7-8,5% >=8,5%Men HbA1c (Year x) <7% 63.2 30.5 6.3 7-8.5% 30.7 54.6 14.7 >=8.5% 12.0 44.0 44.0 Women HbA1c (Year x) <7% 61.7 31.0 7.3 7-8.5% 27.2 51.7 21.2 >=8.5% 12.4 46.9 40.7
Source: ZODIAC The prevalences of incident diabetes patients were used as initial class prevalence rates for a theoretical new cohort of diabetes patients. The change per year in the distribution over the HbA1c categories were calculated using the 1-year transition rates, relative risks of HbA1c for mortality and excess mortality in diabetes patients. After about 10 year, the percentage of diabetes patients in that HbA1c category stabilised, until the age of 90 (Figure 10.8). The obtained value can be interpretated as an ‘eigenvector’ of the mathematical state-transition model equations. The ‘eigenvectors’ matched well with the empirical prevalences obtained from ZODIAC and were now used as the new initial class prevalence rates for HbA1c.
Figure 10.8 HbA1c class prevalences based on the prevalence in a cohort of incident diabetes patients and transition rates and in 1st, 2nd and 3rd (left, middle, right) HbA1c category in men (above) and women (below). The constant ‘eigenvector’ is the start prevalence for HbA1c categories. Input data for prevalence of HbA1c in diabetes patients = empirical prevalences based on pooled ZODIAC, Westfriesland, SHL Breda and NMP data. Transition rates are based on year-transitions in ZODIAC. The diabetes-specific HbA1c input data, with the accompanying transition rates are documented in input file “Hba1cDmInput.txt”.
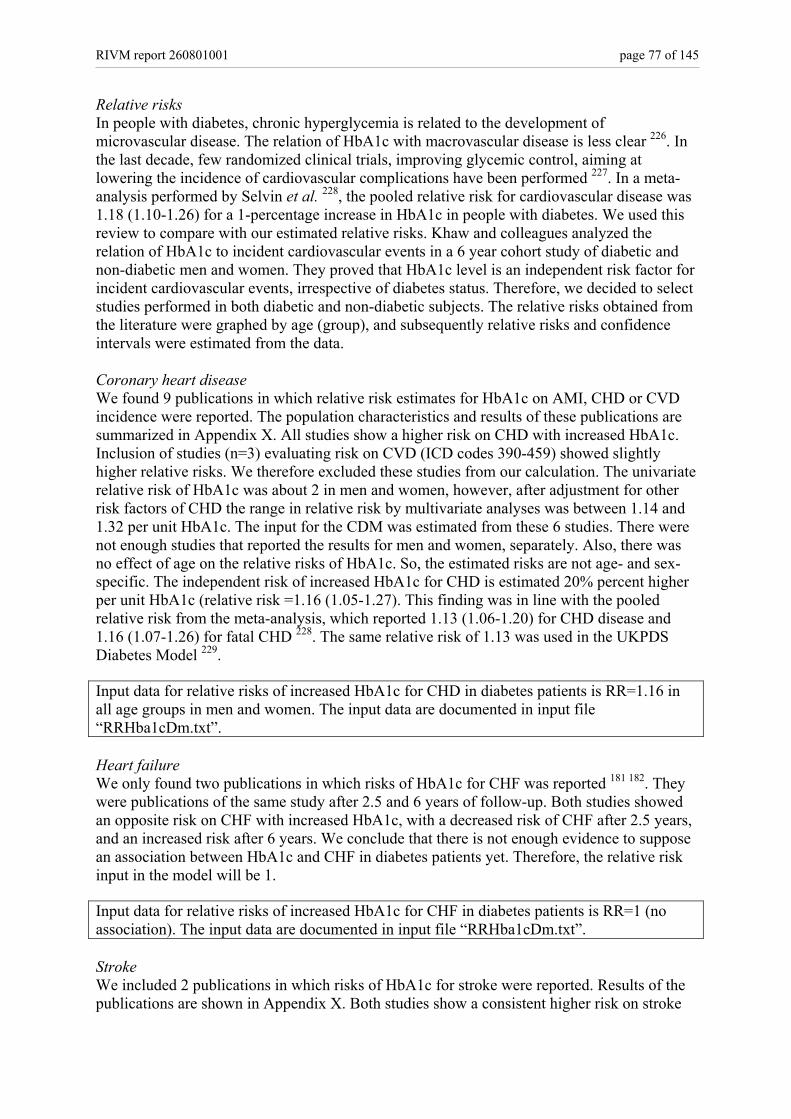
RIVM report 260801001 page 77 of 145
Relative risks In people with diabetes, chronic hyperglycemia is related to the development of microvascular disease. The relation of HbA1c with macrovascular disease is less clear 226. In the last decade, few randomized clinical trials, improving glycemic control, aiming at lowering the incidence of cardiovascular complications have been performed 227. In a meta-analysis performed by Selvin et al. 228, the pooled relative risk for cardiovascular disease was 1.18 (1.10-1.26) for a 1-percentage increase in HbA1c in people with diabetes. We used this review to compare with our estimated relative risks. Khaw and colleagues analyzed the relation of HbA1c to incident cardiovascular events in a 6 year cohort study of diabetic and non-diabetic men and women. They proved that HbA1c level is an independent risk factor for incident cardiovascular events, irrespective of diabetes status. Therefore, we decided to select studies performed in both diabetic and non-diabetic subjects. The relative risks obtained from the literature were graphed by age (group), and subsequently relative risks and confidence intervals were estimated from the data. Coronary heart disease We found 9 publications in which relative risk estimates for HbA1c on AMI, CHD or CVD incidence were reported. The population characteristics and results of these publications are summarized in Appendix X. All studies show a higher risk on CHD with increased HbA1c. Inclusion of studies (n=3) evaluating risk on CVD (ICD codes 390-459) showed slightly higher relative risks. We therefore excluded these studies from our calculation. The univariate relative risk of HbA1c was about 2 in men and women, however, after adjustment for other risk factors of CHD the range in relative risk by multivariate analyses was between 1.14 and 1.32 per unit HbA1c. The input for the CDM was estimated from these 6 studies. There were not enough studies that reported the results for men and women, separately. Also, there was no effect of age on the relative risks of HbA1c. So, the estimated risks are not age- and sex-specific. The independent risk of increased HbA1c for CHD is estimated 20% percent higher per unit HbA1c (relative risk =1.16 (1.05-1.27). This finding was in line with the pooled relative risk from the meta-analysis, which reported 1.13 (1.06-1.20) for CHD disease and 1.16 (1.07-1.26) for fatal CHD 228. The same relative risk of 1.13 was used in the UKPDS Diabetes Model 229. Input data for relative risks of increased HbA1c for CHD in diabetes patients is RR=1.16 in all age groups in men and women. The input data are documented in input file “RRHba1cDm.txt”. Heart failure We only found two publications in which risks of HbA1c for CHF was reported 181 182. They were publications of the same study after 2.5 and 6 years of follow-up. Both studies showed an opposite risk on CHF with increased HbA1c, with a decreased risk of CHF after 2.5 years, and an increased risk after 6 years. We conclude that there is not enough evidence to suppose an association between HbA1c and CHF in diabetes patients yet. Therefore, the relative risk input in the model will be 1. Input data for relative risks of increased HbA1c for CHF in diabetes patients is RR=1 (no association). The input data are documented in input file “RRHba1cDm.txt”. Stroke We included 2 publications in which risks of HbA1c for stroke were reported. Results of the publications are shown in Appendix X. Both studies show a consistent higher risk on stroke
page 78 of 145 RIVM report 260801001
with increased HbA1c. The relative risk varied between 1.12 and 1.4 per unit HbA1c (mean: 1.14 (1.02-1.27). The pooled relative risk obtained from 3 studies in the review was 1.17 (1.09-1.25) 228. A relative risk of 1.14 was used in the UKPDS diabetes model 229. Input data for relative risks of increased HbA1c for stroke in diabetes patients is RR=1.14 in all age groups in men and women. The input data are documented in input file “RRHba1cDm.txt”. Concluding remarks HbA1c is a new risk factor for macrovascular complications in patients with diabetes, to be included in the CDM. Hba1c is well measured in the several diabetes care projects. The mean HbA1c was in the range of 7.1 to 7.4%, and there were small differences in the distribution over the 3 categories of HbA1c such that the amount of diabetes patients in the lowest category was higher in Westfriesland and NMP. But in these studies still about half of the diabetes patients was represented in the categories > 7%. In the future, we will include HbA1c and/or 2h-glucose for the general population to be able to define individuals with impaired glucose tolerance (pre-diabetes).
RIVM report 260801001 page 79 of 145
11. Tertiary prevention MAM Jacobs-van der Bruggen
11.1 Interventions to reduce bodyweight The results of trials that focus on bodyweight reduction in patients with diabetes are summarized in Appendix XIa (lifestyle interventions) and Appendix XIb part D (pharmacological interventions, weight management). Weight loss interventions that are used in patients with diabetes include diet, behavioral therapy, exercise, pharmacological therapy and bariatric surgery 230. Diet is regarded as one of the cornerstones of therapy in (obese) patients with diabetes. Diets in (obese) diabetic patients may result in weight loss of up to 10% of baseline weight and is accompanied by improvements in metabolic control and lipid profile 57 231 232. However, a successful weight loss with diet is often difficult to achieve and even more difficult to maintain. Although weight is initially lost, most of this loss may be regained within 5 years 230. Intensive treatment with very low calorie diets (VLCD) may initially result in promising weight loss and improved metabolic control 57, but these effects are seldom maintained in the long term 230. Behavioral programs have been shown to be moderately effective in inducing weight loss 231
233. In a meta-analyses of 18 educational and behavioral intervention programs in diabetic patients, mean weight loss and mean decrease in HbA1c were not significantly different between intervention and usual care or minimal intervention groups 233. The degree of weight loss achieved and maintained may increase with the length of the program and additional components included in the program such as diet and (supervised) exercise 230 231. Exercise in (obese) diabetic individuals usually results in only modest weight loss 232 234. Although diet appears to be more effective in losing weight 232, exercise may have beneficial effects on glycaemic control (HbA1c -0,4 tot -1,8%) 234-236 independent of weight loss and is regarded as an important determinant of long-term maintenance of weight loss 230. There are however few studies examining the effects of (only) exercise in large groups of diabetic patients 236. Exercise programs are costly, difficult to implement and have shown variable results. Pharmacological treatment is effective in reducing bodyweight with about 3 to 5 kg as compared to placebo treatment, within 1 year 237. These reductions in weight are accompanied by improved glucose control with HbA1c reductions of 0.4-1.0%. However, use of medication is expensive and should be continued to maintain positive effects. Further research is needed to examine the long-term efficacy and safety of these medications. Current weight-control interventions have shown that short-term weight loss is achievable but no currently available intervention has shown consistent long-term maintenance of major weight loss. The efficacy of programs may improve with the duration and intensity of the program and may increase when several weight-loss strategies are combined 231. Several Cochrane reviews concerning long-term effects of weight loss strategies (behavior, exercise and/or diet) on risk factors and complications are expected in 2005. Studies evaluating the effect of weight loss on diabetes complications have not been found. One large trial the “LOOK AHEAD” trial in the US started in 2001 and examines the long-term effects of an intensive lifestyle program, focusing on weight reduction and maintenance, in 5000 overweight diabetic patients on macrovascular complications, quality of life, costs and care. Results are expected in 2012.
page 80 of 145 RIVM report 260801001
11.2 Strict control of blood glucose The results of trials that focused on strict control of blood glucose levels are summarized in Appendix XIb part A. The potential benefit of intensive blood glucose control on the prevention of diabetes complications was studied in one large study, the UKPDS 168 238 and two smaller studies, the Kumamoto-study 239 240 and the Veterans affairs cooperative study on glycemic control and complications in type II diabetes (VA-CSDM) studies 241 242. The effects of intensive blood glucose control on diabetes complications are also summarized in a recent review 243 and in a meta-analysis 244. It appears to be245 246 feasible to lower blood glucose levels significantly as compared to conventional treatment. HBA1c levels of approximately 7% were reached within 3-6 months and maintained for 2-8 years in the Kumamota and VA-CSDM studies. In the UKPDS, HbA1c levels in newly diagnosed patients dropped in the first year (from 7% to 6%) but increased thereafter up to almost 8% after 15 years. Most people needed multiple therapies to achieve and keep “near-normal blood glucose” 247. Intensive treatment caused more mild and moderate hypoglycemic events in all studies. Significant weight gain as a result of intensive therapy was only found in the UKPDS. Significant benefits of tight control of blood glucose on macrovascular complications were not found, except for patients who were overweight and were treated with metformin 168. For these newly diagnosed patients, diabetes related mortality was reduced with 42% after 11 years of follow-up. A newer class of agents for the treatment of type 2 diabetes, the thiazolidinediones (TZD) has shown promising results with improved blood glucose control, which is accompanied by reductions in markers of macrovascular complications such as blood pressure and improved lipid profiles 248-251. Several studies are currently conducted to provide additional support for the benefits of TZDs in minimizing cardiovascular complications 248 250. Recent research also emphasizes the role of postprandial glucose levels in the development of diabetes complications 252-254. It appears that peak glucose levels after a meal may be at least as import as mean levels of blood glucose in the development of complications and may be an important target for preventive strategies 252. Weight loss and exercise training in diabetic patients are accompanied by significant improvements in metabolic control with HbA1c reductions ranging from -0.4% to 1.8% 231 232
234-237 255. Patient education, behavioral interventions and self-management techniques can improve blood glucose regulation with HbA1c reductions of about 0.3-0.5% as compared to usual care 232 233 256 257. Whether these interventions are effective in reducing complications in the long term is unknown.
11.3 Blood pressure control The effects of antihypertensive therapy in diabetic patients on diabetes complications are summarized in several recent reviews and meta-analysis 258 (Appendix XIb, part B)243 244 259-
261. Mean blood pressure reductions that are attained when comparing intensive treatment with placebo treatment or usual care are -5 mmHg for systolic blood pressure (SBP) and -2 mm Hg for diastolic blood pressure (DBP) 244. However, depending on population characteristics and choice of medication decrements of -10 to -30 mmHg for SBP 219 262 and -8 to -24 mmHg for DBP 219 263 may be achieved. In the long term most patients will need several antihypertensive medications to attain treatment goals 264 265. Antihypertensive therapy in diabetic patients significantly reduces macrovascular complications with
RIVM report 260801001 page 81 of 145
approximately 20-40% 244 259 261. The optimal treatment goal is approximately 130/80. There appears to be no obvious superiority with regard to medication class 260 264 265, although ACE-inhibitors and ARBs may be particularly beneficial for renal protection 258 266,267 268 with protective effects for the renal system that seem to be independent of the blood-pressure lowering effect 269-271. ACE-inhibitors may protect renal function even in normotensive diabetic patients 272. Note that intensive lowering of diastolic blood pressure increases the risk of cardiovascular events in smokers and therefore intensive treatment in diabetic smokers should be accompanied with the greatest effort to induce smoking cessation 273.
11.4 Lipid control The results of pharmacological management of dyslipidemia in patients with diabetes are summarized in several recent reviews and a meta-analysis 243 244 274-276. The characteristics and results of the meta-analysis and several large trials are summarized in Appendix XIb, part C. Statins, aimed at reducing LDL-cholesterol, are the most widely used study-medication, but other agents like gemfibrozil, to reduce triglycerides, or fenofibrates, to increase HDL-cholesterol and to reduce triglycerides, are also used. Treatment with statins results in a consistent reduction of LDL-cholesterol of approximately 1.0 mmol/l as compared to placebo treatment 274 275. Lipid-lowering therapy results in a mean reduction in total cholesterol of about 0.6 mmol/l as compared to placebo treatment 244. Treatment with fenofibrate induces large reductions in triglyceride (-30%) and increments in HDL-levels of about 8%. With lipid lowering treatment, the risk for macrovascular complications in diabetic patients with or without cardiovascular disease can be significantly reduced with about 20-40% 244 274
275 277 278. This risk reduction seems to be independent of age, diabetes duration, glycaemic control or baseline levels of LDL-cholesterol of the patients 175 278. The greatest benefit of lipid lowering therapy can be achieved in diabetic patient at increased risk for macrovascular complications, with a mean absolute risk reduction for cardiovascular events of about 7% 274. Although combination therapy with different classes of lipid-lowering medication may provide maximal lipid profile modification 279 280, safety issues as well as patient tolerability and compliance should be considered 281-283. Four ongoing large studies, with 2,000 to 10,000 participants, will provide further evidence for the role of lipid management in patients with diabetes in preventing diabetes complications 276.
11.5 Conclusions tertiary prevention Although improvements in lifestyle are worth persuing in diabetes patients, there is no evidence for substantial reductions in cardiovascular disease, resulting from (only) lifestyle interventions. Strict pharmacological treatment of cardiovascular risk factors in diabetes patients, on the other hand, may significantly reduce the incidence of cardiovascular disease. Intensified treatment of blood pressure or serum cholesterol, may reduce cardiovascular disease with up to 25%, while intensified treatment of blood glucose reduces cardiovascular disease with about 10%. The highest potential benefit may be gained from multifactorial intervention (Appendix XI part E). In one study in which lifestyle changes and pharmacological treatment of cardiovascular risk factors was combined, the incidence of cardiovascular disease was reduced with approximately 50% 284. However this was only a small study conducted in a selected diabetes population at high risk of macrovascular

page 82 of 145 RIVM report 260801001
complications. A large trial in the US and Canada “The Action to Control Cardiovascular Risk in Diabetes” (ACCORD) in about 10,000 diabetes patients with cardiovascular disease is currently conducted and will examine the benefits of strict blood glucose control in combination with intensive treatment of blood pressure or cholesterol. Results of this study are expected in 2009 276.
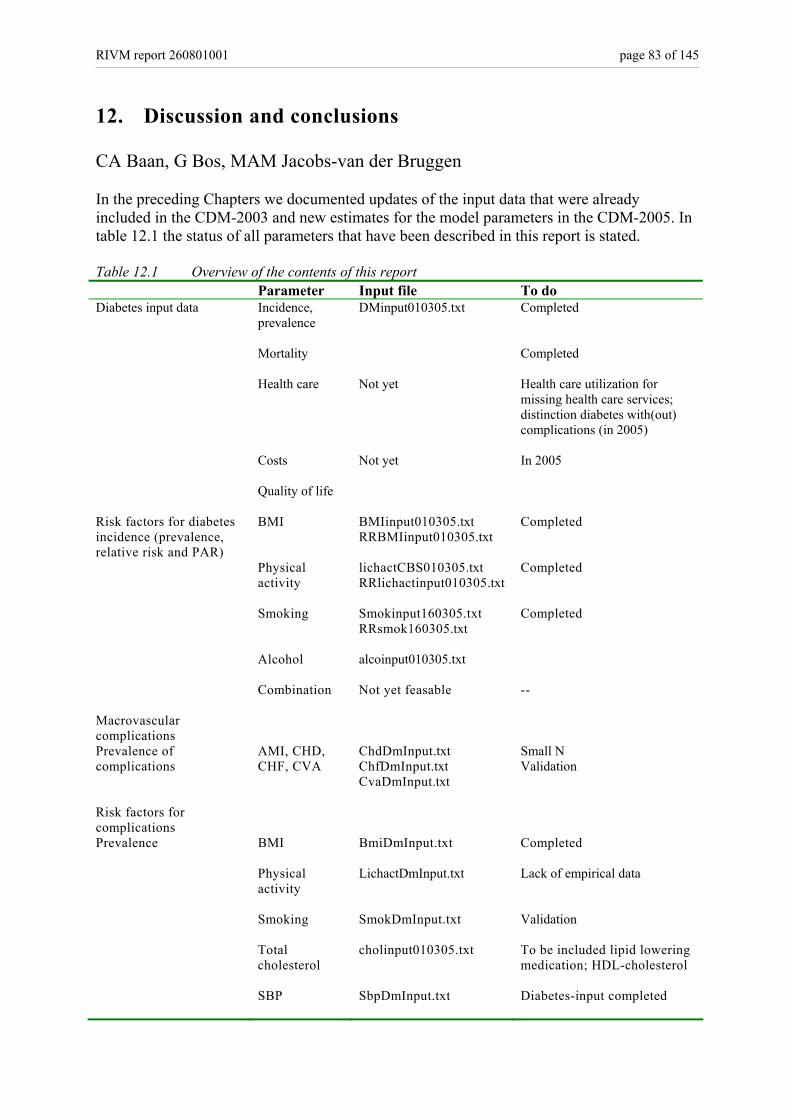
RIVM report 260801001 page 83 of 145
12. Discussion and conclusions CA Baan, G Bos, MAM Jacobs-van der Bruggen In the preceding Chapters we documented updates of the input data that were already included in the CDM-2003 and new estimates for the model parameters in the CDM-2005. In table 12.1 the status of all parameters that have been described in this report is stated. Table 12.1 Overview of the contents of this report Parameter Input file To do Diabetes input data Incidence,
prevalence
DMinput010305.txt Completed
Mortality Completed
Health care Not yet Health care utilization for missing health care services; distinction diabetes with(out) complications (in 2005)
Costs Not yet In 2005
Quality of life Risk factors for diabetes incidence (prevalence, relative risk and PAR)
BMI BMIinput010305.txt RRBMIinput010305.txt
Completed
Physical activity
lichactCBS010305.txt RRlichactinput010305.txt
Completed
Smoking Smokinput160305.txt RRsmok160305.txt
Completed
Alcohol alcoinput010305.txt
Combination Not yet feasable
--
Macrovascular complications
Prevalence of complications
AMI, CHD, CHF, CVA
ChdDmInput.txt ChfDmInput.txt CvaDmInput.txt
Small N Validation
Risk factors for complications
Prevalence BMI BmiDmInput.txt
Completed
Physical activity
LichactDmInput.txt
Lack of empirical data
Smoking SmokDmInput.txt
Validation
Total cholesterol
cholinput010305.txt
To be included lipid lowering medication; HDL-cholesterol
SBP SbpDmInput.txt
Diabetes-input completed
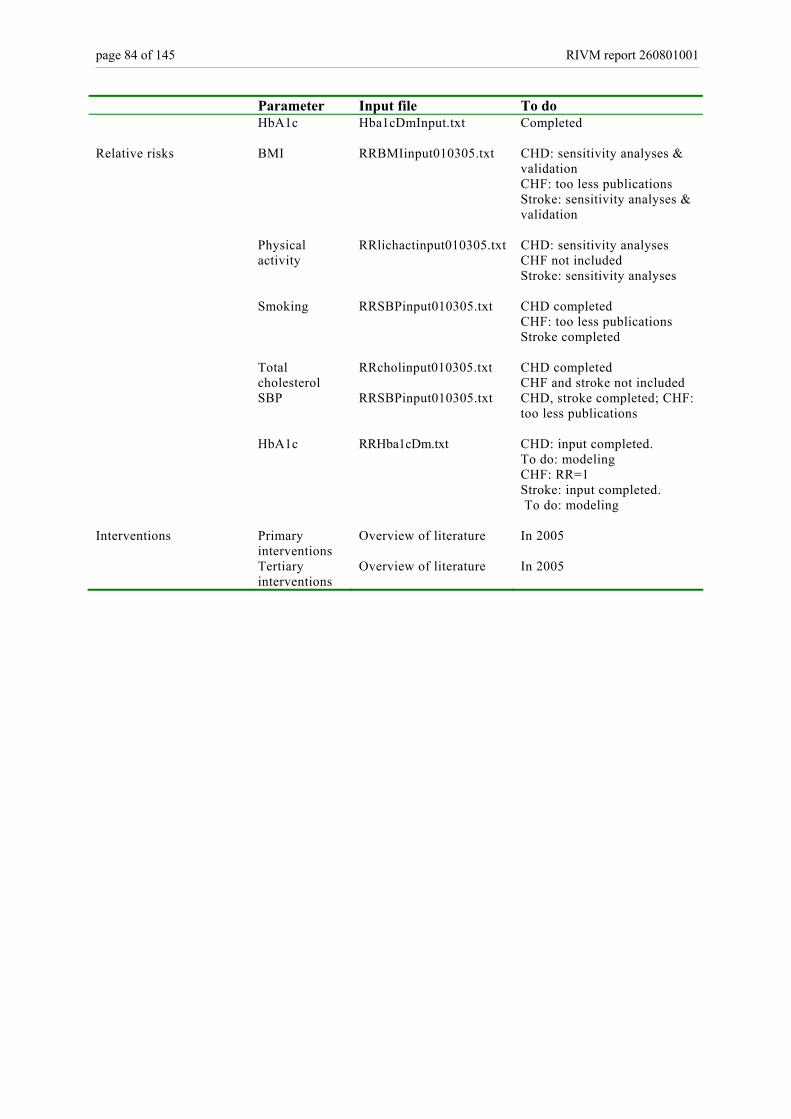
page 84 of 145 RIVM report 260801001
Parameter Input file To do HbA1c Hba1cDmInput.txt
Completed
Relative risks BMI RRBMIinput010305.txt CHD: sensitivity analyses & validation CHF: too less publications Stroke: sensitivity analyses & validation
Physical activity
RRlichactinput010305.txt CHD: sensitivity analyses CHF not included Stroke: sensitivity analyses
Smoking RRSBPinput010305.txt CHD completed CHF: too less publications Stroke completed
Total cholesterol
RRcholinput010305.txt CHD completed CHF and stroke not included
SBP RRSBPinput010305.txt
CHD, stroke completed; CHF: too less publications
HbA1c RRHba1cDm.txt CHD: input completed. To do: modeling CHF: RR=1 Stroke: input completed. To do: modeling
Interventions Primary interventions
Overview of literature In 2005
Tertiary interventions
Overview of literature In 2005

RIVM report 260801001 page 85 of 145
References
1. Hoogenveen RT , Feenstra TL, van Baal PHM, Baan CA. A conceptual framework for budget allocation
in the RIVM chronic disease model. A case study of diabetes mellitus. Bilthoven: RIVM, 2005; RIVM report 260706001.
2. Hoogenveen RT. Dutch Dismod. Constructing a set of consistent data for chronic disease modelling. Bilthoven: RIVM, 2000; RIVM report 260751001.
3. Barendregt JJ , Baan CA, Bonneux L. An indirect estimate of the incidence of non-insulin-dependent diabetes mellitus. Epidemiology 2000; 11(3):274-9.
4. Murray C, Lopez A. Global comparative assessments in the health sector. Disease burden, expenditures and intervention package. Geneva: WHO, 1994.
5. Gijsen, R, Baan, CA, Feskens, E. Hoe vaak komt diabetes mellitus voor en hoeveel mensen sterven eraan? In Nationaal Kompas Volksgezondheid. Bilthoven, RIVM [Web Page]. 2004; (Accessed August 2004).
6. Gijsen, R, Poos, M. Informatie over gebruikte bronnen. In Nationaal Kompas Volksgezondheid. Bilthoven, RIVM [Web Page]. 2004; (Accessed 2004).
7. Patten SB. Recall bias and major depression lifetime prevalence. Soc Psychiatry Psychiatr Epidemiol 2003; 38(6):290-6.
8. Baan CA, Nusselder WJ, Barendregt JJ, Ruwaard D, Bonneux L, Feskens EJM. The burden of mortality of diabetes mellitus in The Netherlands. Epidemiology 1999; 10(2):184-7.
9. Panzram G. Mortality and survival in type 2 (non-insulin-dependent) diabetes mellitus. Diabetologia 1987; 30:123-31.
10. Shenfield GM, Elton RA, Bhalla IP, Duncan LJP. Diabetic mortality in Edinburgh. Diab Metab 1979; 5:149-58.
11. Kessler II. Mortality experience of diabetic patients. A twenty-six year follow-up study. Am J Med 1971; 51:715-24.
12. Krolewski AS, Czyzyk A, Janesczko D, Kopczynski J. Mortality from cardiovascular diseases among diabetics. Diabetologia 1977; 13:345-50.
13. Fuller JH, Shipley MJ, Rose G, Jarrett JR, Keen H. Mortality from coronary heart disease and stroke in relation to degree of glycaemia: the Whitehall study. Br Med J 1983; 287:867-70.
14. Stamler J, Vaccaro O, Neaton JD, Wentworth D. Diabetes, other risk factors and 12-yr cardiovascular mortality for men screened in the Multiple Risk Factor Intervention Trial. Diabetes Care 1993; 16:434-44.
15. Murcia AM, Hennekens CH, Lamas GA et al. Impact of diabetes on mortality in patients with myocardial infarction and left ventricular dysfunction. Arch Intern Med 2004; 164(20):2273-9.
16. Rossing P, Hougaard P, Borch-Johnsen K, Parving H. Predictors of mortality in insulin dependent diabetes: 10 year observational follow up study. Br Med J 1996; 313:779-84.
17. Bertoni AG, Kirk JK, Goff DC Jr, Wagenknecht LE. Excess mortality related to diabetes mellitus in elderly Medicare beneficiaries. Ann Epidemiol 2004; 14(5):362-7.
18. Lotufo PA, Gaziano JM, Chae CU et al. Diabetes and all-cause and coronary heart disease mortality
page 86 of 145 RIVM report 260801001
among US male physicians. Arch Intern Med 2001; 161(2):242-7.
19. Vaccaro O, Eberly LE, Neaton JD, Yang L, Riccardi G, Stamler J. Impact of diabetes and previous myocardial infarction on long-term survival: 25-year mortality follow-up of primary screenees of the Multiple Risk Factor Intervention Trial. Arch Intern Med 2004; 164(13):1438-43.
20. Balkau B, Eschwege E, Ducimetiere P, Richard JL, Warnet JM. The high risk of death by alcohol related diseases in subjects diagnosed as diabetic and impaired glucose tolerant: the Paris Prospective Study after 15 years of follow-up. J Clin Epidemiol 1991; 44(6):465-74.
21. Knuiman MW, Welborn TA, Whittall DE. An analysis of excess mortality rates for persons with non-insulin-dependent diabetes mellitus in Western Australia using th Cox Proportional Hazards Regression Model. Am J Epidemiol 1992; 135:638-48.
22. Feskens EJM, Bowles CH, Kromhout D. Glucose tolerance and mortality from ischaemic heart disease in an elderly population. Impact of repeated glucose measurements. Ann Epidemiol 1993; 3(4):336-42.
23. Wong JS, Pearson DW, Murchison LE, Williams MJ, Narayan V. Mortality in diabetes mellitus: experience of a geographically defined population. Diabet Med 1991; 8(2):135-9.
24. Swerdlow AJ, Jones ME. Mortality during 25 years of follow-up of a cohort with diabetes. Int J Epidemiol 1996; 25(6):1250-61.
25. Croxson SCM, Price DE, Burden M, Jagger C, Burden AC. The mortality of elderly people with diabetes. Diabet Med 1994; 11(3):250-2.
26. Palumbo PJ, Elveback LR, Chu CP, Conolly DC, Kurland LT. Diabetes mellitus: incidence, prevalence, survivorship, and causes of death in Rochester, Minnesota, 1945-1970. Diabetes 1976; 25:566-73.
27. Dupree EA, Meyer MB. Role of risk factors in complications of diabetes mellitus. Am J Epidemiol 1980; 112:100-12.
28. Waugh NR, Dallas JH, Jung RT, Newton RW. Mortality in a cohort of diabetic patients. Causes and relative risks. Diabetologia 1989; 32:103-4.
29. Kleinman JC, Donahue RP, Harris MI, Finucane FF, Madans JH, Brock DB. Mortality among diabetics in a national sample. Am J Epidemiol 1988; 128(2):389-401.
30. Stengard JH, Tuomilehto J, Pekkanen J et al. Diabetes mellitus, impaired glucose tolerance and mortality among elderly men: the Finnish cohorts of the Seven Countries Study. Diabetologia 1992; 35(8):760-5.
31. Almdal T, Scharling H, Jensen JS, Vestergaard H. The independent effect of type 2 diabetes mellitus on ischemic heart disease, stroke, and death: a population-based study of 13,000 men and women with 20 years of follow-up. Arch Intern Med 2004; 164(13):1422-6.
32. Holman CD, English DR, Milne E, Winter MG. Meta-analysis of alcohol and all-cause mortality: a validation of NHMRC recommendations. Med J Aust 1996; 164(3):141-5.
33. Manuel DG, Schultz SE. Health-related quality of life and health-adjusted life expectancy of people with diabetes in Ontario, Canada, 1996-1997. Diabetes Care 2004; 27(2):407-14.
34. Westert GP, Schellevis FG, De Bakker DH, Groenewegen PP, Bensing JM, van der Zee J. Monitoring health inequalities through general practice: the second dutch national survey of general practice. European Journal of Public Health 2004; (in press).
35. Stichting Informatisering Gezondheidszorg (SIG). Basisgegevens LMR: verzameling en invoer. 1991 .
RIVM report 260801001 page 87 of 145
36. SIG Zorginformatie. Gebruikershandleiding Landelijke ambulante zorgregistratie, versie 3.0/PHD. 1999 .
37. Fakiri FE, Foets M, Rijken M. Health care use by diabetic patients in the Netherlands: patterns and predicting factors. Diabetes Res Clin Pract 2003; 61(3):199-209.
38. Struijs JN, Baan CA, Slobbe LCJ, Droomers M, Westert GP. Koppeling van geanonimiseerde huisartsgegevens aan ziekenhuisregistraties. 2004; RIVM report 282701006.
39. Donker GA, Fleming DM, Schellevis FG, Spreeuwenberg P. Differences in treatment regimes, consultation frequency and referral patterns of diabetes mellitus in general practice in five European countries. Fam Pract 2004; 21(4):364-9.
40. Marx P. Leven met diabetes in een verpleeghuis. Diabc : Maandelijks Voorlichtingsblad Van De Diabetes Vereniging Nederland, 2001; 55(7-8):24-8.
41. Carral F, Aguilar M, Olveira G, Mangas A, Domenech I, Torres I. Increased hospital expenditures in diabetic patients hospitalized for cardiovascular diseases. J Diabetes Complications 2003; 17(6):331-6.
42. Norlund A, Apelqvist J, Bitzen PO, Nyberg P, Schersten B. Cost of illness of adult diabetes mellitus underestimated if comorbidity is not considered. J Intern Med 2001; 250(1):57-65.
43. Simpson SH, Corabian P, Jacobs P, Johnson JA. The cost of major comorbidity in people with diabetes mellitus. CMAJ 2003; 168(13):1661-7.
44. Redekop WK, Koopmanschap MA, Rutten GE, Wolffenbuttel BH, Stolk RP, Niessen LW. Resource consumption and costs in Dutch patients with type 2 diabetes mellitus. Results from 29 general practices. Diabet Med 2002; 19(3):246-53.
45. Polder J. Costs of Illness study in the Netherlands 1994. 1997.
46. Polder J. Costs of illness study in the Netherlands 1999. 2002.
47. Institute of Medical Technology Assessment (iMTA). Effects and costs of the revised guidelines for diabetes. 1998.
48. American Diabetes Associaton. Economic consequences of diabetes mellitus in the US in 1997. Diabetes Care 1998; 21:296-309.
49. van Baal PHM , Feenstra TL, Hoogenveen RT, de Wit GA. Cost Effectiveness Analysis with the RIVM Chronic Disease Model. Bilthoven: RIVM, 2005; RIVM report 260706002.
50. Verschuren WMM, Leer van E.M., Blokstra A, Seidell JC, Smit HB, et al. Cardiovascular disease risk factors in the Netherlands. Netherlands Journal of Cardiology 1993; 6:205-10.
51. Smit HA, Verschuren WMM, Bueno de Mesquita HB, Seidell JC. Monitoring van Risicofactoren en Gezondheid in Nederland (MORGEN-project): Doelstellingen en werkwijze. Bilthoven: Rijksinstituut voor Volksgezondheid en Milieu, 1994; RIVM report 263200001.
52. Blokstra A, Smit HA, Bueno de Mesquito HB, Seidell J.C., Verschuren WMM. Monitoring van Risicofactoren en Gezondheid in Nederland (MORGEN-project), 1993-1997, Leefstijl- en risicofactoren: prevalenties en trends. Bilthoven: Rijksinstituut voor Volksgezondheid en Milieu, 2005; RIVM report 263200008.
53. Blokstra A, Verschuren WMM. Leefstijl- en risicofactoren voor chronische ziekten: De Doetichem Studie 1998-2002. Bilthoven: Rijksinstituut voor Volksgezondheid en Milieu, 2005; RIVM report 260401003.
page 88 of 145 RIVM report 260801001
54. Jacobs-van der Bruggen M, Baan C, Feskens E, Gijsen R . Factsheet: Diabetes: omvang en gevolgen. 2004; PZO 2004/01.
55. Field AE, Coakley EH, Must A et al. Impact of overweight on the risk of developing common chronic diseases during a 10-year period. Arch Intern Med 2001; 161(13):1581-6.
56. Folsom AR, Kushi LH, Anderson KE et al. Associations of general and abdominal obesity with multiple health outcomes in older women: the Iowa Women's Health Study. Arch Intern Med 2000; 160(14):2117-28.
57. Anderson JW, Kendall CW, Jenkins DJ. Importance of weight management in type 2 diabetes: review with meta-analysis of clinical studies. J Am Coll Nutr 2003; 22(5):331-9.
58. WHO Consultation on Obesity. Obesity: Preventing and managing the global epidemic. Geneva, Switserland : World Health Organization , 2000.
59. Carey VJ, Walters EE, Colditz GA et al. Body fat distribution and risk of non-insulin-dependent diabetes mellitus in women. The Nurses' Health Study. Am J Epidemiol 1997; 145(7):614-9.
60. Chan JM, Rimm EB, Colditz GA, Stampfer MJ, Willett WC. Obesity, fat distribution, and weight gain as risk factors for clinical diabetes in men. Diabetes Care 1994; 17(9):961-9.
61. Lindstrom J, Tuomilehto J. The Diabetes Risk Score: A practical tool to predict type 2 diabetes risk. Diabetes Care 2003; 26(3):725-31.
62. Wannamethee SG, Shaper AG. Weight change and duration of overweight and obesity in the incidence of type 2 diabetes. Diabetes Care 1999; 22(8):1266-72.
63. Koh-Banerjee P, Wang Y, Hu FB, Spiegelman D, Willett WC, Rimm EB. Changes in body weight and body fat distribution as risk factors for clinical diabetes in US men. Am J Epidemiol 2004; 159(12):1150-9.
64. Colditz GA, Willett WC, Rotnitzky A, Manson JE. Weight gain as a risk factor for clinical diabetes mellitus in women. Ann Intern Med 1995; 122(7):481-6.
65. Hoogenveen RT. Nieuwe BMI prevalentie en transitiekansen. RIVM, Bilthoven, interne notitie december 2004.
66. Dotevall A, Johansson S, Wilhelmsen L, Rosengren A. Increased levels of triglycerides, BMI and blood pressure and low physical activity increase the risk of diabetes in Swedish women. A prospective 18-year follow-up of the BEDA study. Diabet Med 2004; 21(6):615-22.
67. Kumari M, Head J, Marmot M. Prospective study of social and other risk factors for incidence of type 2 diabetes in the Whitehall II study . Arch Intern Med 2004; 164(17):1873-80.
68. Field AE, Manson JE, Laird N, Williamson DF, Willett WC, Colditz GA. Weight cycling and the risk of developing type 2 diabetes among adult women in the United States. Obes Res 2004; 12(2):267-74.
69. Koh-Banerjee P, Wang Y, Hu FB, Spiegelman D, Willett WC, Rimm EB. Changes in body weight and body fat distribution as risk factors for clinical diabetes in US men. Am J Epidemiol 2004; 159(12):1150-9.
70. Weinstein AR, Sesso HD, Lee IM et al. Relationship of physical activity vs body mass index with type 2 diabetes in women. JAMA 2004; 292(10):1188-94.
71. Snijder MB, Dekker JM, Visser M et al. Associations of hip and thigh circumferences independent of waist circumference with the incidence of type 2 diabetes: the Hoorn Study. Am J Clin Nutr 2003; 77(5):1192-7.
RIVM report 260801001 page 89 of 145
72. Meisinger C, Thorand B, Schneider A, Stieber J, Doring A, Lowel H. Sex differences in risk factors for incident type 2 diabetes mellitus: the MONICA Augsburg cohort study. Arch Intern Med 2002; 162(1):82-9.
73. Wilson PWF, D'Agostino RB, Sullivan L, Parise H, Kannel WB. Overweight and obesity as determinants of cardiovascular risk: the Framingham experience. Arch Intern Med 2002; 162(16):1867-72.
74. Freeman DJ, Norrie J, Caslake MJ et al. C-reactive protein is an independent predictor of risk for the development of diabetes in the West of Scotland Coronary Prevention Study. Diabetes 2002; 51(5):1596-600.
75. Hu FB, Manson JE, Stampfer MJ et al. Diet, lifestyle, and the risk of type 2 diabetes mellitus in women. N Engl J Med 2001; 345(11):790-7.
76. Stevens RJ, Kothari V, Adler AI, Stratton IM, United Kingdom Prospective Diabetes Study (UKPDS) Group. The UKPDS risk engine: a model for the risk of coronary heart disease in Type II diabetes (UKPDS 56). Clin Sci (Lond) 2001; 101(6):671-9 + 679 + 681-682 + 217-219.
77. Strandberg TE, Salomaa V. Factors related to the development of diabetes during a 20-year follow-up. A prospective study in a homogeneous group of middle-aged men. Nutr Metab Cardiovasc Dis 2000; 10(5):239-46.
78. von Eckardstein A, Schulte H, Assmann G. Risk for diabetes mellitus in middle-aged Caucasian male participants of the PROCAM study: implications for the definition of impaired fasting glucose by the American Diabetes Association. Prospective Cardiovascular Munster. J Clin Endocrinol Metab 2000; 85(9):3101-8.
79. Njolstad I, Arnesen E, Lund-Larsen PG. Sex differences in risk factors for clinical diabetes mellitus in a general population: a 12 year follow-up of the Finnmark Study. Am J Epidemiol 1998; 1998:49-58.
80. Shaper AG, Wannamethee SG, Walker M. Body weight: implications for the prevention of coronary heart disease, stroke, and diabetes mellitus in a cohort study of middle aged men. Br Med J 1997; 314:1311-7.
81. Carey VJ, Walters EE, Colditz GA et al. Body fat distribution and risk of non-insulin-dependent diabetes mellitus in women. The Nurses' Health Study. Am J Epidemiol 1997; 145(7):614-9.
82. Perry IJ, Wannamethee SG, Walker MK, Thomson AG, Whincup PH, Shaper AG. Prospective study of risk factors for development of non-insulin dependent diabetes in middle aged British men. BMJ 1995; 310(6979):560-4.
83. Lipton RB, Liao Y, Cao G, Cooper RS, McGee D. Determinants of incident non-insulin-dependent diabetes mellitus among blacks and whites in a national sample. The NHANES I epidemiologic follow-up study. Am J Epidemiol 1993; 138:826-39.
84. Manson HE, Nathan DM, Krolewski AS, Stampfer MJ, Willett WC, Hennekens CH. A prospective study of exercise and incidence of diabetes among US male physicians. JAMA 1992; 268:63-7.
85. Helmrich SP, Ragland DD, Leung RW, Paffenbarger RS. Physical activity and reduced occurrence of non-insulin-dependent diabetes mellitus. N Eng J Med 1991; 325:147-52.
86. Kaye SA, Folsom AR, Sprafka JM, Prineas RJ, Wallace RB. Increased incidence of diabetes mellitus in relation to abdominal adiposity in older women. J Clin Epidemiol 1991; 44:329-34.
87. Skarfors ET, Selinus KI, Lithell HO. Risk factors for developing non-insulin dependent diabetes: a 10 year follow up of men in Uppsala. BMJ 1991; 303(6805):755-60.
88. McPhillips JB, Barrett-Connor E, Wingard DL. Cardiovascular disease risk factors prior to the diagnosis of impaired glucose tolerance and non-insulin-dependent diabetes mellitus in a community of
page 90 of 145 RIVM report 260801001
older adults. Am J Epidemiol 1990; 131(3):443-53.
89. Colditz GA, Willett WC, Stampfer MJ et al. Weight as a risk factor for clinical diabetes in women. Am J Epidemiol 1990; 132(3):501-13.
90. Hu G, Lindstrom J, Valle TT et al. Physical activity, body mass index, and risk of type 2 diabetes in patients with normal or impaired glucose regulation. Arch Intern Med 2004; 164(8):892-6.
91. Burke JP, Williams K, Narayan KM, Leibson C, Haffner SM, Stern MP. A population perspective on diabetes prevention: whom should we target for preventing weight gain? Diabetes Care 2003; 26(7):1999-2004.
92. Bhargava A. A longitudinal analysis of the risk factors for diabetes and coronary heart disease in the Framingham Offspring Study. Popul Health Metr 2003; 1(3):1-16.
93. Jacobsen BK, Bonaa KH, Njolstad I. Cardiovascular risk factors, change in risk factors over 7 years, and the risk of clinical diabetes mellitus type 2. The Tromso study. J Clin Epidemiol 2002; 55(7):647-53.
94. Resnick HE, Valsania P, Halter JB, Lin X. Relation of weight gain and weight loss on subsequent diabetes risk in overweight adults. J Epidemiol Community Health 2000; 54(8):596-602.
95. Ford ES, Williamson DF, Simin L. Weight change and diabetes incidence: Findings from a national cohort of US adults. Am J Epidemiol 1997; 146:214-22.
96. Gurwitz JH, Field TS, Glynn JR et al. Risk factors for non-insulin-dependent Diabetes Mellitus Requiring Treatment in the Elderly. J AM Geriatr Soc 1994; 42:1235-40.
97. Han TS, Williams K, Sattar N, Hunt KJ, Lean ME, Haffner SM. Analysis of obesity and hyperinsulinemia in the development of metabolic syndrome: San Antonio Heart Study. Obes Res 2002; 10(9):923-31.
98. Salonen JT, Nyyssonen K, Tuomainen TP et al. Increased risk of non-insulin dependent diabetes mellitus at low plasma vitamin E concentrations: a four year follow up study in men. BMJ 1995; 311(7013):1124-7.
99. Cassano PA, Rosner B, Vokonas PS, Weiss ST. Obesity and body fat distribution in relation to the incidence of non-insulin-dependent diabetes mellitus. A prospective cohort study of men in the normative aging study. Am J Epidemiol 1992; 136(12):1474-86.
100. Hu FB, Li TY, Colditz GA, Willett WC, Manson JE. Television watching and other sedentary behaviors in relation to risk of obesity and type 2 diabetes mellitus in women. JAMA 2003; 289(14):1785-91.
101. Hu FB, Leitzmann MF, Stampfer MJ, Colditz GA, Willett WC, Rimm EB. Physical activity and television watching in relation to risk for type 2 diabetes mellitus in men. Arch Intern Med 2001; 161(12):1542-8.
102. Hu FB, Manson JE, Stampfer MJ et al. Diet, lifestyle, and the risk of type 2 diabetes mellitus in women. N Engl J Med 2001; 345(11):790-7.
103. Wannamethee SG, Shaper AG, Alberti KGMM. Physical activity, metabolic factors, and the incidence of coronary heart disease and type 2 diabetes. Arch Intern Med 2000; 160(14):2108-16.
104. Sawada SS, Lee IM, Muto T, Matuszaki K, Blair SN. Cardiorespiratory fitness and the incidence of type 2 diabetes: prospective study of Japanese men. Diabetes Care 2003; 26(10):2918-22.
105. Wei M, Gibbons LW, Mitchell TL, Kampert JB, Lee CD, Blair SN. The association between cardiorespiratory fitness and impaired fasting glucose and type 2 diabetes mellitus in men. Ann
RIVM report 260801001 page 91 of 145
Intern Med 1999; 130(2):89-96.
106. Hoogenveen R. Nieuwe prevalentiefracties lichamelijke activiteit, 2004. RIVM, interne notitie oktober 2004.
107. Kemper HCG, Ooijendijk WTM, Stiggelbout M. Consensus over de Nederlandse norm voor gezond bewegen. TSG 2000; 78(3):180-3.
108. Wendel-Vos GC, Schuit AJ, Feskens EJ et al. Physical activity and stroke. A meta-analysis of observational data. Int J Epidemiol 2004; 33(4):787-98.
109. Hu FB, Leitzmann MF, Stampfer MJ, Colditz GA, Willett WC, Rimm EB. Physical activity and television watching in relation to risk for type 2 diabetes mellitus in men. Arch Intern Med 2001; 161(12):1542-8.
110. Wannamethee SG, Shaper AG, Alberti KGMM. Physical activity, metabolic factors, and the incidence of coronary heart disease and type 2 diabetes. Arch Intern Med 2000; 160(14):2108-16.
111. Hu FB, Sigal RJ, Rich-Edwards JW et al. Walking compared with vigorous physical activity and risk of type 2 diabetes in women: a prospective study. JAMA 1999; 282(15):1433-9.
112. Hu G, Qiao Q, Silventoinen K et al. Occupational, commuting, and leisure-time physical activity in relation to risk for Type 2 diabetes in middle-aged Finnish men and women. Diabetologia 2003; 46(3):322-9.
113. Haapanen N, Miilunpalo S, Vouori I, Oja P, Pasanen M. Association of leisure time physical activity with the risk of coronary heart disease, hypertension and diabetes in middle-aged men and women. Int J Epidemiol 1997; 26:739-47.
114. Hu FB, Li TY, Colditz GA, Willett WC, Manson JE. Television watching and other sedentary behaviors in relation to risk of obesity and type 2 diabetes mellitus in women. JAMA 2003; 289(14):1785-91.
115. Sawada SS, Lee IM, Muto T, Matuszaki K, Blair SN. Cardiorespiratory fitness and the incidence of type 2 diabetes: prospective study of Japanese men. Diabetes Care 2003; 26(10):2918-22.
116. Kawakami N, Takatsuka N, Shimizu H, Ishibashi H. Effects of smoking on the incidence of non-insulin-dependent diabetes mellitus. Replication and extension in a japenese cohort of male employees. Am J Epidemiol 1997; 145:103-9.
117. Lynch J, Helmrich SP, Lakka TA et al. Moderately intense physical activities and high levels of cardiorespiratory fitness reduce the risk of non-insulin-dependent diabetes mellitus in middle-aged men. Arch Intern Med 1996; 156:1307-14.
118. Burchfiel CM, Sharp DS, Curb JD et al. Physical activity and incidence of diabetes: the Honolulu Heart Program. Am J Epidemiol 1995; 141(4):360-8.
119. Gurwitz JH, Field TS, Glynn JR et al. Risk factors for non-insulin-dependent Diabetes Mellitus Requiring Treatment in the Elderly. J AM Geriatr Soc 1994; 42:1235-40.
120. Manson JR, Rimm EB, Stampfer MJ, et al. Physical activity and incidence of non-insulin-dependent diabetes mellitus in women. Lancet 1991; 338:774-8.
121. Will JC, Galuska DA, Ford ES, Mokdad A, Calle EE. Cigarette smoking and diabetes mellitus: evidence of a positive association from a large prospective cohort study. Int J Epidemiol 2001; 30(3):540-6.
122. Manson JE, Ajani UA, Liu S, Nathan DM, Hennekens CH. A prospective study of cigarette smoking and the incidence of diabetes mellitus among US male physicians. Am J Med 2000; 109(7):538-42.
page 92 of 145 RIVM report 260801001
123. Uchimoto S, Tsumura K, Hayashi T et al. Impact of cigarette smoking on the incidence of Type 2 diabetes mellitus in middle-aged Japanese men: the Osaka Health Survey. Diabet Med 1999; 16(11):951-5.
124. Bhargava A. A longitudinal analysis of the risk factors for diabetes and coronary heart disease in the Framingham Offspring Study. Popul Health Metr 2003; 1(3):1-16.
125. Wannamethee SG, Shaper AG, Perry IJ. Smoking as a modifiable risk factor for type 2 diabetes in middle-aged men. Diabetes Care 2001; 24(9):1590-5.
126. Rimm EB, Chan J, Stampfer MJ, Colditz GA, Willett WC. Prospective study of cigarette smoking, alcohol use, and the risk of diabetes in men. BMJ 1995; 310(6979):555-9.
127. Carlsson S, Midthjell K, Grill V. Smoking is associated with an increased risk of type 2 diabetes but a decreased risk of autoimmune diabetes in adults: an 11-year follow-up of incidence of diabetes in the Nord-Trondelag study. Diabetologia 2004; 47(11):1953-6.
128. Wannamethee SG, Shaper AG, Perry IJ. Smoking as a modifiable risk factor for type 2 diabetes in middle-aged men. Diabetes Care 2001; 24(9):1590-5.
129. Manson JE, Ajani UA, Liu S, Nathan DM, Hennekens CH. A prospective study of cigarette smoking and the incidence of diabetes mellitus among US male physicians. Am J Med 2000; 109(7):538-42.
130. Rimm EB, Chan J, Stampfer MJ, Colditz GA, Willett WC. Prospective study of cigarette smoking, alcohol use, and the risk of diabetes in men. BMJ 1995; 310(6979):555-9.
131. Rimm EB, Manson JE, Stampfer MJ, et al. Cigarette smoking and the risk of diabetes in women. Am J Public Health 1993; 83:211-4.
132. Nakanishi N , Nakamura K, Matsuo Y, Suzuki K, Tatara K. Cigarette smoking and risk for impaired fasting glucose and type 2 diabetes in middle-aged Japanese men. Ann Intern Med 2000; 133(3):183-91.
133. Uchimoto S, Tsumura K, Hayashi T et al. Impact of cigarette smoking on the incidence of Type 2 diabetes mellitus in middle-aged Japanese men: the Osaka Health Survey. Diabet Med 1999; 16(11):951-5.
134. Sugimori H, Miyakawa M, Yoshida K et al. Health risk assessment for diabetes mellitus based on longitudinal analysis of MHTS database. J Med Syst 1998; 22(1):27-32.
135. Eliasson M, Asplund K, Nasic S, Rodu B. Influence of smoking and snus on the prevalence and incidence of type 2 diabetes amongst men: the northern Sweden MONICA study. J Intern Med 2004; 256(2):101-10.
136. Freeman DJ, Norrie J, Sattar N et al. Pravastatin and the development of diabetes mellitus: evidence for a protective treatment effect in the West of Scotland Coronary Prevention Study. Circulation 2001; 103(3):357-62.
137. Howard AA, Arnsten JH, Gourevitch MN. Effect of alcohol consumption on diabetes mellitus: a systematic review. Ann Intern Med 2004; 140(3):211-9.
138. Wannamethee SG, Camargo CA Jr, Manson JE, Willett WC, Rimm EB. Alcohol drinking patterns and risk of type 2 diabetes mellitus among younger women. Arch Intern Med 2003; 163(11):1329-36.
139. Carlsson S, Hammar N, Grill V, Kaprio J. Alcohol consumption and the incidence of type 2 diabetes: a 20-year follow-up of the Finnish twin cohort study. Diabetes Care 2003; 26(10):2785-90.
140. Conigrave KM, Hu BF, Camargo CA Jr, Stampfer MJ, Willett WC, Rimm EB. A prospective study of
RIVM report 260801001 page 93 of 145
drinking patterns in relation to risk of type 2 diabetes among men. Diabetes 2001; 50(10):2390-5.
141. Kao WHL, Puddey IB, Boland LL, Watson RL, Brancati FL. Alcohol consumption and the risk of type 2 diabetes mellitus: atherosclerosis risk in communities study. Am J Epidemiol 2001; 154(8):748-57.
142. Ajani UA, Hennekens CH, Spelsberg A, Manson JE. Alcohol consumption and risk of type 2 diabetes mellitus among US male physicians. Arch Intern Med 2000; 160( 7):1025-30.
143. Wannamethee SG, Shaper AG, Perry IJ, Alberti KGMM. Alcohol consumption and the incidence of type II diabetes. J Epidemiol Community Health 2002; 56(7):542-8.
144. Wei M, Gibbons LW, Mitchell TL, Kampert JB, Blair SN. Alcohol intake and incidence of type 2 diabetes in men. Diabetes Care 2000; 23(1):18-22.
145. Freeman DJ, Norrie J, Sattar N et al. Pravastatin and the development of diabetes mellitus: evidence for a protective treatment effect in the West of Scotland Coronary Prevention Study. Circulation 2001; 103(3):357-62.
146. Holbrook TL, Barrett-Connor E, Wingard DL. A prospective population-based study of alcohol use and non-insulin-dependent diabetes mellitus. Am J Epidemiol 1990; 132(5):902-9.
147. Vegt Fd, Dekker JM, Groeneveld WJA et al. Moderate alcohol consumption is associated with lower risk for incident diabetes and mortality: the Hoorn Study. Diabetes Res Clin Pract 2002; 57(1):53-60.
148. Ajani UA, Hennekens CH, Spelsberg A, Manson JE. Alcohol consumption and risk of type 2 diabetes mellitus among US male physicians. Arch Intern Med 2000; 160( 7):1025-30.
149. Nakanishi N , Suzuki K, Tatara K. Alcohol consumption and risk for development of impaired fasting glucose or type 2 diabetes in middle-aged Japanese men. Diabetes Care 2003; 26(1):48-54.
150. Watanabe M, Barzi F, Neal B et al. Alcohol consumption and the risk of diabetes by body mass index levels in a cohort of 5,636 Japanese. Diabetes Res Clin Pract 2002; 57(3):191-7.
151. Tsumura K, Hayashi T, Suematsu C, Endo G, Fujii S, Okada K. Daily alcohol consumption and the risk of type 2 diabetes in Japanese men: the Osaka Health Survey. Diabetes Care 1999; 22(9):1432-7.
152. Lindstrom J , Louheranta A, Mannelin M et al. The Finnish Diabetes Prevention Study (DPS): Lifestyle intervention and 3-year results on diet and physical activity. Diabetes Care 2003; 26(12):3230-6.
153. Torjesen P, Birkeland K, Anderssen S, Hjerman I, Holme I, Urdal P. Lifestyle chagnes may reverse development of the insulin resistance syndrome. Diabetes Care 1997; 20:26-31.
154. Eriksson KF, Lindgärde F. Prevention of type 2 (non-insulin-dependent) diabetes mellitus by diet and physical exercise. Diabetologia 1991; 34:891-8.
155. Heymsfield SB, Segal KR, Hauptman J et al. Effects of weight loss with orlistat on glucose tolerance and progression to type 2 diabetes in obese adults. Arch Intern Med 2000; 160(9):1321-6.
156. Yusuf S, Gerstein H, Hoogwerf B et al. Ramipril and the development of diabetes. JAMA 2001; 286(15):1882-5.
157. Torgerson JS, Hauptman J, Boldrin MN, Sjostrom L. XENical in the prevention of diabetes in obese subjects (XENDOS) study: a randomized study of orlistat as an adjunct to lifestyle changes for the prevention of type 2 diabetes in obese patients. Diabetes Care 2004; 27(1):155-61.
158. Chiasson JL, Josse RG, Gomis R, Hanefeld M, Karasik A, Laakso M. Acarbose for prevention of type 2 diabetes mellitus: the STOP-NIDDM randomised trial. Lancet 2002; 359(9323):2072-7.
page 94 of 145 RIVM report 260801001
159. Diabetes Prevention Program Research Group , Knowler WC, Barrett-Connor E et al. Reduction in the incidence of type 2 diabetes with lifestyle intervention or metformin. N Engl J Med 2002; 346(6):393-403.
160. Karunakaran S, Hammersley MS, Morris RJ, Turner RC, Holman RR. The Fasting Hyperglycaemia Study: III. Randomized controlled trial of sulfonylurea therapy in subjects with increased but not diabetic fasting plasma glucose. Metabolism 1997; 46(12 Suppl 1):56-60.
161. Dyson PA, Hammersley MS, Morris RJ, Holman RR, Turner RC, on behalf of the Fasting Hyperglycaemia Study Group. The Fasting Hyperglycaemia Study: II. Randomized controlled trial of reinforced healthy-living advice in subjects with increased but not diabetic fasting plasma glucose. Metabolism 1997; 46(12 Suppl 1):50-5.
162. Long SD, O'Brien K, MacDonald KG, et al. Weight loss in severly obese subjects prevents the progression of impaired glucose tolerance to type II diabetes. A longitudinal interventional study. Diabetes Care 1994; 17:372-5.
163. Torgerson JS, Sjostrom L. The Swedish Obese Subjects (SOS) study--rationale and results. Int J Obes Relat Metab Disord 2001; 25 Suppl 1:S2-4.
164. Eriksson KF, Lindgarde F. No excess 12-year mortality in men with impaired glucose tolerance who participated in the Malmo Preventive Trial with diet and exercise. Diabetologia 1998; 41(9):1010-6.
165. Mensink M, Blaak EE, Corpeleijn E, Saris WH, de Bruin TW, Feskens EJ. Lifestyle intervention according to general recommendations improves glucose tolerance. Obes Res 2003; 11(12):1588-96.
166. Moore LL, Visioni AJ, Wilson PW, D'Agostino RB, Finkle WD, Ellison RC. Can sustained weight loss in overweight individuals reduce the risk of diabetes mellitus? Epidemiology 2000; 11(3):269-73.
167. Swinburn BA , Metcalf PA, Ley SJ. Long-term (5-year) effects of a reduced-fat diet intervention in individuals with glucose intolerance. Diabetes Care 2001; 24( 4):619-24.
168. UK Prospective Diabetes Study (UKPDS) Group . Effect of intensive blood-glucose control with metformin on complications in overweight patients with type 2 diabetes (UKPDS 34). UK Prospective Diabetes Study (UKPDS) Group. Lancet 1998; 352(9131):854-65.
169. Albu J, Raja-Khan N. The management of the obese diabetic patient. Prim Care 2003; 30(2):465-91.
170. Struijs JN, Westert GP, Baan CA. Effectevaluatie van transmurale diabeteszorg in Nederland. 2004 260402001/2004.
171. Nederlandse Diabetes Federatie. Zorgstandaard voor goede diabeteszorg/ Een eerste voorwaarde voor een nieuw financieringsmodel. Amersfoort: Nederlandse Diabetes Federatie, 2003.
172. Stevens RJ, Coleman RL, Adler AI, Stratton IM, Matthews DR, Holman RR. Risk factors for myocardial infarction case fatality and stroke case fatality in type 2 diabetes: UKPDS 66. Diabetes Care 2004; 27( 1):201-7.
173. Laakso M. Hyperglycemia and cardiovascular disease in type 2 diabetes. Diabetes 1999; 48(5):937-42.
174. Juutilainen A, Kortelainen S, Lehto S, Ronnemaa T, Pyorala K, Laakso M. Gender difference in the impact of type 2 diabetes on coronary heart disease risk. Diabetes Care 2004; 27(12):2898-904.
175. Collins R, Armitage J, Parish S, Sleigh P, Peto R, Heart Protection Study Collaborative Group. MRC/BHF Heart Protection Study of cholesterol-lowering with simvastatin in 5963 people with diabetes: a randomised placebo-controlled trial. Lancet 2003; 361(9374):2005-16.
RIVM report 260801001 page 95 of 145
176. Howard BV, Robbins DC, Sievers ML et al. LDL cholesterol as a strong predictor of coronary heart disease in diabetic individuals with insulin resistance and low LDL: The Strong Heart Study. Arterioscler Thromb Vasc Biol 2000; 20(3):830-5.
177. Stevens RJ, Coleman RL, Adler AI, Stratton IM, Matthews DR, Holman RR. Risk factors for myocardial infarction case fatality and stroke case fatality in type 2 diabetes: UKPDS 66. Diabetes Care 2004; 27( 1):201-7.
178. Hanefeld M, Fisher S, Julius J et al. Risk factors for myocardial infarction and death in newly detected NIDDM: the diabetes intervention study, 11 year follow-up. Diabetologia 1996; 39:1577-83.
179. Kannel WB. Hazards, risks, and threats of heart disease from the early stages to symptomatic coronary heart disease and cardiac failure. Cardiovasc Drugs Ther 1997; 11 Suppl 1:199-212.
180. Kannel WB, Ho K, Thom T. Changing epidemiological features of cardiac failure. Br Heart J 1994; 72(2 Suppl):S3-9.
181. Nichols GA, Hillier TA, Erbey JR, Brown JB. Congestive heart failure in type 2 diabetes: prevalence, incidence, and risk factors. Diabetes Care 2001; 24(9):1614-9.
182. Nichols GA, Gullion CM, Koro CE, Ephross SA, Brown JB. The incidence of congestive heart failure in type 2 diabetes: an update. Diabetes Care 2004; 27(8):1879-84.
183. Ho JE, Paultre F, Mosca L. Is diabetes mellitus a cardiovascular disease risk equivalent for fatal stroke in women? Data from the Women's Pooling Project. Stroke 2003; 34(12):2812-6.
184. Tuomiletho J, Rastenyte D, Jousilahti P, Sarti C, Vartiainen E. Diabetes mellitus as a risk factor for death from stroke. Prospective study of the middle-aged Finnish population. Stroke 1996; 27:210-5.
185. Bemelmans WJE, Hoogenveen RT, Visscher TLS, Verschuren WMM, Schuit AJ. Toekomstige ontwikkelingen in matig overgewicht en obesitas - Inschatting effecten op de volksgezondheid. 2004; RIVM report 260301003.
186. Sender Palacios MJ, Vernet Vernet M, Larrosa Saez P, Tor Figueras E, Foz Sala M. [Socio-demographic and clinical characteristics of a patient population with diabetes mellitus]. Aten Primaria 2002; 29(8):474-80.
187. Schaan BD, Harzheim E, Gus I. [Cardiac risk profile in diabetes mellitus and impaired fasting glucose]. Rev Saude Publica 2004; 38(4):529-36.
188. Pyorala K, Lehto S, De Bacquer D et al. Risk factor management in diabetic and non-diabetic patients with coronary heart disease. Findings from the EUROASPIRE I AND II surveys. Diabetologia 2004; 47(7):1257-65.
189. Midthjell K, Kruger O, Holmen J et al. Rapid changes in the prevalence of obesity and known diabetes in an adult Norwegian population. The Nord-Trondelag Health Surveys: 1984-1986 and 1995-1997. Diabetes Care 1999; 22(11):1813-20.
190. Harris MI. Health care and health status and outcomes for patients with type 2 diabetes. Diabetes Care 2000; 23(6):754-8.
191. Cho E, Manson JE, Stampfer MJ et al. A prospective study of obesity and risk of coronary heart disease among diabetic women. Diabetes Care 2002; 25(7):1142-8.
192. Turner RC, Millns H, Neil HA et al. Risk factors for coronary artery disease in non-insulin dependent diabetes mellitus: United Kingdom Prospective Diabetes Study (UKPDS: 23). BMJ 1998; 316(7134):823-8.
193. Bos G, Dekker JM, Heine RJ. Non-HDL cholesterol contributes to the "hypertriglyceridemic waist" as a
page 96 of 145 RIVM report 260801001
cardiovascular risk factor: the Hoorn study. Diabetes Care 2004; 27(1):283-4.
194. Lehto S, Rönnemaa T, Pyörälä K, Laakso M. Predictors of stroke in middle-aged patients with non-insulin-dependent diabetes. Stroke 1996; 27:63-8.
195. Schuit AJ , van Leest LATM. Factsheet lichamelijke activiteit. Prevalentie en trend. Bilthoven, RIVM, 2003
196. Chorus AMJ, Hopman-Rock M. Chronisch zieken en bewegen: een quick scan. TNO-Rapport 2003.
197. Gregg EW, Gerzoff RB, Caspersen CJ, Williamson DF, Narayan KM. Relationship of walking to mortality among US adults with diabetes. Arch Intern Med 2003; 163(12):1440-7.
198. Makrilakis K, Panagiotakos DB, Pitsavos C et al. The association between physical activity and the development of acute coronary syndromes in diabetic subjects (the CARDIO2000 II study). Eur J Cardiovasc Prev Rehabil 2004; 11(4):298-303.
199. Turner RC, Millns H, Neil HA et al. Risk factors for coronary artery disease in non-insulin dependent diabetes mellitus: United Kingdom Prospective Diabetes Study (UKPDS: 23). BMJ 1998; 316(7134):823-8.
200. Hu FB, Stampfer MJ, Solomon CG et al. The impact of diabetes mellitus on mortality from all causes and coronary heart disease in women: 20 years of follow-up. Arch Intern Med 2001; 161(14):1717-23.
201. Glumer C, Jorgensen T, Borch-Johnsen K. Prevalences of diabetes and impaired glucose regulation in a Danish population: the Inter99 study. Diabetes Care 2003; 26(8):2335-40.
202. Khaw KT, Wareham N, Luben R et al. Glycated haemoglobin, diabetes, and mortality in men in Norfolk cohort of european prospective investigation of cancer and nutrition (EPIC-Norfolk). BMJ 2001; 322(7277):15-8.
203. Adlerberth AM, Rosengren A, Wilhelmsen L. Diabetes and long-term risk of mortality from coronary and other causes in middle-aged Swedish men. A general population study. Diabetes Care 1998; 21(4):539-45.
204. Fuller JH, Stevens LK, Wang SL, the WHO Multinational Study Group . Risk factors for cardiovascular mortality and morbidity: the WHO Mutinational Study of Vascular Disease in Diabetes. Diabetologia 2001; 44 Suppl 2:S54-S64.
205. Haire-Joshu D, Glasgow RE, Tibbs TL. Smoking and diabetes. Diabetes Care 1999; 22(11):1887-98.
206. Targher G, Alberiche M, Zenere MB, Bonadonna RC, Muggeo M, Bonora E. Cigarette smoking and insulin resistance in patients with noninsulin-dependent diabetes mellitus. J Clin Endocrinol Metab 1997; 82(11):3619-24.
207. Kothari V, Stevens RJ, Adler AI et al. UKPDS 60: risk of stroke in type 2 diabetes estimated by the UK Prospective Diabetes Study risk engine. Stroke 2002; 33(7):1776-81.
208. Chaturvedi N, Jarrett J, Shipley MJ, Fuller JH. Socioeconomic gradient in morbidity and mortality in people with diabetes: cohort study findings from the Whitehall Study and the WHO Multinational Study of Vascular Disease in Diabetes. BMJ 1998; 316(7125):100-5.
209. Keech A, Colquhoun D, Best J et al. Secondary prevention of cardiovascular events with long-term pravastatin in patients with diabetes or impaired fasting glucose: results from the LIPID trial. Diabetes Care 2003; 26(10):2713-21.
210. Nosadini R, Tonolo G. Relationship between blood glucose control, pathogenesis and progression of diabetic nephropathy. J Am Soc Nephrol 2004; 15 Suppl 1:S1-5.
RIVM report 260801001 page 97 of 145
211. Bouma M, Dekker JH, Eijk JTMv, Schellevis FG, Kriegsman DMW, Heine RJ. Metabolic control and morbidity of type 2 diabetic patients in a general practice network. Fam Pract 1999; 16(4):402-6.
212. Rutten GEHM, Boomsma LJ. Detection of type 2 diabetes mellitus in general practice: Do the patients' dossiers provide clues? Practical Diabetes International 2000; 17(5):152-4.
213. Davis TM, Millns H, Stratton IM, Holman RR, Turner RC. Risk factors for stroke in type 2 diabetes mellitus: United Kingdom Prospective Diabetes Study (UKPDS) 29. Arch Intern Med 1999; 159(10):1097-103.
214. Hypertension in Diabetes Study (HDS): II. Increased risk of cardiovascular complications in hypertensive type 2 diabetic patients. J Hypertens 1993; 11(3):319-25.
215. Adler AI, Stratton IM, Neil HAW et al. Association of systolic blood pressure with macrovascular and microvascular complications of type 2 diabetes (UKPDS 36): prospective observational study. BMJ 2000; 321(7258):412-9.
216. Goldberg RB . Cardiovascular disease in diabetic patients. Med Clin North Am 2000; 84(1):81-93, viii.
217. Jandeleit-Dahm K, Cooper ME. Hypertension and diabetes. Curr Opin Nephrol Hypertens 2002; 11(2):221-8.
218. Tuomilehto J, Rastenyte D, Birkenhager WH et al. Effects of calcium-channel blockade in older patients with diabetes and systolic hypertension. Systolic Hypertension in Europe Trial Investigators. N Engl J Med 1999; 340(9):677-84.
219. Hansson L, Zanchetti A, Carruthers SG et al. Effects of intensive blood-pressure lowering and low-dose aspirin in patients with hypertension: principal results of the Hypertension Optimal Treatment (HOT) randomised trial. HOT Study Group. Lancet 1998; 351(9118):1755-62.
220. Curb JD, Pressel SL, Cutler JA et al. Effect of diuretic-based antihypertensive treatment on cardiovascular disease risk in older diabetic patients with isolated systolic hypertension. Systolic Hypertension in the Elderly Program Cooperative Research Group. JAMA 1996; 276(23):1886-92.
221. Lewington S , Clarke R, Qizilbash N, Peto R, Collins R. Age-specific relevance of usual blood pressure to vascular mortality: a meta-analysis of individual data for one million adults in 61 prospective studies. Lancet 2002; 360(9349):1903-13.
222. King H, Aubert RE, Herman WH. Global burden of diabetes, 1995-2025. Diabetes Care 1998; 21:1414-31.
223. Schaars CF, Denig P, Kasje WN, Stewart RE, Wolffenbuttel BH, Haaijer-Ruskamp FM. Physician, organizational, and patient factors associated with suboptimal blood pressure management in type 2 diabetic patients in primary care. Diabetes Care 2004; 27(1):123-8.
224. Niessen LW, Dijkstra R, Hutubessy R, Rutten GEHM, Casparie AF. Lifetime health effects and costs of diabetes treatment. Neth J Med 2003; 61(11):19-28.
225. Nilsson PM, Theobald H, Journath G, Fritz T. Gender differences in risk factor control and treatment profile in diabetes: a study in 229 swedish primary health care centres. Scand J Prim Health Care 2004; 22(1):27-31.
226. Genuth S, Eastman R, Kahn R et al. Implications of the United kingdom prospective diabetes study. Diabetes Care 2003; 26 Suppl 1:S28-32.
227. Ceriello A. The possible role of postprandial hyperglycaemia in the pathogenesis of diabetic complications. Diabetologia 2003; 46 Suppl 1:M9-M16.
page 98 of 145 RIVM report 260801001
228. Selvin E, Marinopoulos S, Berkenblit G et al. Meta-analysis: glycosylated hemoglobin and cardiovascular disease in diabetes mellitus. Ann Intern Med 2004; 141(6):421-31.
229. Clarke PM, Gray AM, Briggs A et al. A model to estimate the lifetime health outcomes of patients with type 2 diabetes: the United Kingdom Prospective Diabetes Study (UKPDS) Outcomes Model (UKPDS no. 68). Diabetologia 2004; 47(10):1747-59.
230. Maggio CA, Pi-Sunyer FX. The prevention and treatment of obesity. Application to type 2 diabetes. Diabetes Care 1997; 20(11):1744-66.
231. Norris SL, Zhang X, Avenell A et al. Long-term effectiveness of lifestyle and behavioral weight loss interventions in adults with type 2 diabetes: a meta-analysis. Am J Med 2004; 117(10):762-74.
232. Brown SA, Upchurch S, Anding R, Winter M, Ramirez G. Promoting weight loss in type II diabetes. Diabetes Care 1996; 19:613-24.
233. Gary TL, Genkinger JM, Guallar E, Peyrot M, Brancati FL. Meta-analysis of randomized educational and behavioral interventions in type 2 diabetes. Diabetes Educ 2003; 29(3):488-501.
234. Boule NG, Haddad E, Kenny GP, Wells GA, Sigal RJ. Effects of exercise on glycemic control and body mass in type 2 diabetes mellitus: a meta-analysis of controlled clinical trials. JAMA 2001; 286(10):1218-27.
235. Miller YD, Dunstan DW. The effectiveness of physical activity interventions for the treatment of overweight and obesity and type 2 diabetes. J Sci Med Sport 2004; 7(1 Suppl):52-9.
236. Kelley DE, Goodpaster BH. Effects of exercise on glucose homeostasis in Type 2 diabetes mellitus. Med Sci Sports Exerc 2001; 33(6 Suppl):S495-501; discussion S528-S529=*13/09/04=Haskell, WL.
237. Norris SL, Zhang X, Avenell A et al. Efficacy of pharmacotherapy for weight loss in adults with type 2 diabetes mellitus: a meta-analysis. Arch Intern Med 2004; 164(13):1395-404.
238. UK Prospective Diabetes Study (UKPDS) Group. Intensive blood-glucose control with sulphonylureas or insulin compared with conventional treatment and risk of complications in patients with type 2 diabetes (UKPDS 33). UK Prospective Diabetes Study (UKPDS) Group. Lancet 1998; 352(9131):837-53.
239. Shichiri M, Kishikawa H, Ohkubo Y, Wake N. Long-term results of the Kumamoto Study on optimal diabetes control in type 2 diabetic patients. Diabetes Care 2000; 23 Suppl 2:B21-B29.
240. Wake N, Hisashige A, Katayama T et al. Cost-effectiveness of intensive insulin therapy for type 2 diabetes: a 10-year follow-up of the Kumamoto study. Diabetes Res Clin Pract 2000; 48(3):201-10.
241. Abraira C, Colwell J, Nuttall F et al. Cardiovascular events and correlates in the Veterans Affairs Diabetes Feasibility Trial. Veterans Affairs Cooperative Study on Glycemic Control and Complications in Type II Diabetes. Arch Intern Med 1997; 157(2):181-8.
242. Abraira C, Colwell JA, Nutall FQ et al. Veterans affairs cooperative study on glycemic control and complications in type II diabetes ( VA CSDM). Diab Care 1995; 18:1113-21.
243. Lteif AA, Mather KJ, Clark CM. Diabetes and heart disease an evidence-driven guide to risk factors management in diabetes. Cardiol Rev 2003; 11(5):262-74.
244. Huang ES, Meigs JB, Singer DE. The effect of interventions to prevent cardiovascular disease in patients with type 2 diabetes mellitus. Am J Med 2001; 111(8):633-42.
245. Azad N, Emanuele NV, Abraira C et al. The effects of intensive glycemic control on neuropathy in the VA cooperative study on type II diabetes mellitus (VA CSDM). J Diabetes Complications 1999;
RIVM report 260801001 page 99 of 145
13(5-6):307-13.
246. Emanuele N, Klein R, Abraira C et al. Evaluations of retinopathy in the VA Cooperative Study on Glycemic Control and Complications in Type II Diabetes (VA CSDM). A feasibility study. Diabetes Care 1996; 19(12):1375-81.
247. Turner RC, Cull CA, Frighi V, Holman RR, for the UK Prospective Diabetes Study (UKPDS) Group. Glycemic control with diet, sulfonylurea, metformin, or insulin in patients with type 2 diabetes mellitus: progressive requirement for multiple therapies (UKPDS 49). UK Prospective Diabetes Study (UKPDS) Group. JAMA 1999; 281(21):2005-12.
248. Meriden T. Progress with thiazolidinediones in the management of type 2 diabetes mellitus. Clin Ther 2004; 26(2):177-90.
249. van Wijk JP, de Koning EJ, Martens EP, Rabelink TJ. Thiazolidinediones and blood lipids in type 2 diabetes. Arterioscler Thromb Vasc Biol 2003; 23(10):1744-9.
250. Bakris G, Viberti G, Weston WM, Heise M, Porter LE, Freed MI. Rosiglitazone reduces urinary albumin excretion in type II diabetes. J Hum Hypertens 2003; 17(1):7-12.
251. Chiquette E, Ramirez G, Defronzo R. A meta-analysis comparing the effect of thiazolidinediones on cardiovascular risk factors. Arch Intern Med 2004; 164(19):2097-104.
252. Ceriello A, Hanefeld M, Leiter L et al. Postprandial glucose regulation and diabetic complications. Arch Intern Med 2004; 164(19):2090-5.
253. Ceriello A. The possible role of postprandial hyperglycaemia in the pathogenesis of diabetic complications. Diabetologia 2003; 46 Suppl 1:M9-M16.
254. Meigs JB. Epidemiology of cardiovascular complications in type 2 diabetes mellitus. Acta Diabetol 2003; 40 Suppl 2:S358-S361.
255. Boule NG, Kenny GP, Haddad E, Wells GA, Sigal RJ. Meta-analysis of the effect of structured exercise training on cardiorespiratory fitness in Type 2 diabetes mellitus. Diabetologia 2003; 46(8):1071-81.
256. Ellis SE, Speroff T, Dittus RS, Brown A, Pichert JW, Elasy TA. Diabetes patient education: a meta-analysis and meta-regression. Patient Educ Couns 2004; 52(1):97-105.
257. Norris SL, Nichols PJ, Caspersen CJ et al. The effectiveness of disease and case management for people with diabetes. A systematic review. Am J Prev Med 2002; 22(4 Suppl):15-38.
258. Sowers JR. Treatment of hypertension in patients with diabetes. Arch Intern Med 2004; 164(17):1850-7.
259. Vijan S, Hayward RA. Treatment of hypertension in type 2 diabetes mellitus: blood pressure goals, choice of agents, and setting priorities in diabetes care. Ann Intern Med 2003; 138(7):593-602.
260. Snow V, Weiss KB, Mottur-Pilson C, for the Clinical Efficacy Assessment Subcommittee of the American College of Physicians. The evidence base for tight blood pressure control in the management of type 2 diabetes mellitus. Ann Intern Med 2003; 138(7):587-92.
261. Gasowski J, Birkenhager WH, Staessen JA, Leeuw PWd. Benefit of antihypertensive treatment in the diabetic patients enrolled in the Systolic Hypertension in Europe (Syst-Eur) trial. Cardiovasc Drugs Ther 2000; 14(1):49-53.
262. UK Prospective Diabetes Study Group. Tight blood pressure control and risk of macrovascular and microvascular complications in type 2 diabetes: UKPDS 38. UK Prospective Diabetes Study Group. BMJ 1998; 317(7160):703-13.
page 100 of 145 RIVM report 260801001
263. Estacio RO, Jeffers BW, Gifford N, Schrier RW. Effect of blood pressure control on diabetic microvascular complications in patients with hypertension and type 2 diabetes. Diabetes Care 2000; 23 Suppl 2:B54-64.
264. Vijan S, Hayward RA. Treatment of hypertension in type 2 diabetes mellitus: blood pressure goals, choice of agents, and setting priorities in diabetes care. Ann Intern Med 2003; 138(7):593-602.
265. Bakris GL. The importance of blood pressure control in the patient with diabetes. Am J Med 2004; 116 Suppl 5A:30S-8S.
266. Hamilton RA , Kane MP, Demers J. Angiotensin-converting enzyme inhibitors and type 2 diabetic nephropathy: a meta-analysis. Pharmacotherapy 2003; 23(7):909-15.
267. Marshall SM . Inhibition of the renin-angiotensin system: added value in reducing cardiovascular and renal risk? Diabet Med 2004; 21(1):1-3.
268. Siebenhofer A, Plank J, Horvath K et al. Angiotensin receptor blockers as anti-hypertensive treatment for patients with diabetes mellitus: meta-analysis of controlled double-blind randomized trials. Diabet Med 2004; 21(1):18-25.
269. Ball SG. Benefits of blood pressure reduction in diabetic patients. J Hypertens 2003; 21 Suppl 6:S31-S36.
270. Brenner BM, Cooper ME, de Zeeuw D et al. Effects of losartan on renal and cardiovascular outcomes in patients with type 2 diabetes and nephropathy. N Engl J Med 2001; 345(12):861-9.
271. Lewis EJ, Hunsicker LG, Clarke WR et al. Renoprotective effect of the angiotensin-receptor antagonist irbesartan in patients with nephropathy due to type 2 diabetes. N Engl J Med 2001; 345(12):851-60.
272. Lovell HG. Angiotensin converting enzyme inhibitors in normotensive diabetic patients with microalbuminuria. Cochrane Database Syst Rev 2001; (1):CD002183.
273. Zanchetti A , Hansson L, Clement D et al. Benefits and risks of more intensive blood pressure lowering in hypertensive patients of the HOT study with different risk profiles: does a J-shaped curve exist in smokers? J Hypertens 2003; 21(4):797-804.
274. Vijan S, Hayward RA. Pharmacologic lipid-lowering therapy in type 2 diabetes mellitus: background paper for the American College of Physicians. Ann Intern Med 2004; 140(8):650-8.
275. Armitage J, Bowman L. Cardiovascular outcomes among participants with diabetes in the recent large statin trials. Curr Opin Lipidol 2004; 15(4):439-46.
276. Prisant LM. Clinical trials and lipid guidelines for type II diabetes. J Clin Pharmacol 2004; 44(4):423-30.
277. Sacks FM, Tonkin AM, Shepherd J et al. Effect of pravastatin on coronary disease events in subgroups defined by coronary risk factors: the Prospective Pravastatin Pooling Project. Circulation 2000; 102(16):1893-900.
278. Colhoun HM, Betteridge DJ, Durrington PN et al. Primary prevention of cardiovascular disease with atorvastatin in type 2 diabetes in the Collaborative Atorvastatin Diabetes Study (CARDS): multicentre randomised placebo-controlled trial. Lancet 2004; 364(9435):685-96.
279. Vega GL, Ma PT, Cater NB et al. Effects of adding fenofibrate (200 mg/day) to simvastatin (10 mg/day) in patients with combined hyperlipidemia and metabolic syndrome. Am J Cardiol 2003; 91(8):956-60.
280. Gavish D, Leibovitz E, Shapira I, Rubinstein A. Bezafibrate and simvastatin combination therapy for diabetic dyslipidaemia: efficacy and safety. J Intern Med 2000; 247(5):563-9.

RIVM report 260801001 page 101 of 145
281. Haffner SM. Statin therapy for the treatment of diabetic dyslipidemia. Diabetes Metab Res Rev 2003; 19(4):280-7.
282. Streja D. Combination therapy for the treatment of dyslipidemia. Curr Opin Investig Drugs 2004; 5(3):306-12.
283. Shek A, Ferrill MJ. Statin-fibrate combination therapy. Ann Pharmacother 2001; 35(7-8):908-17.
284. Gaede P, Vedel P, Larsen N, Jensen GVH, Parving HH, Pedersen O. Multifactorial intervention and cardiovascular disease in patients with type 2 diabetes. N Engl J Med 2003; 348(5):383-93.
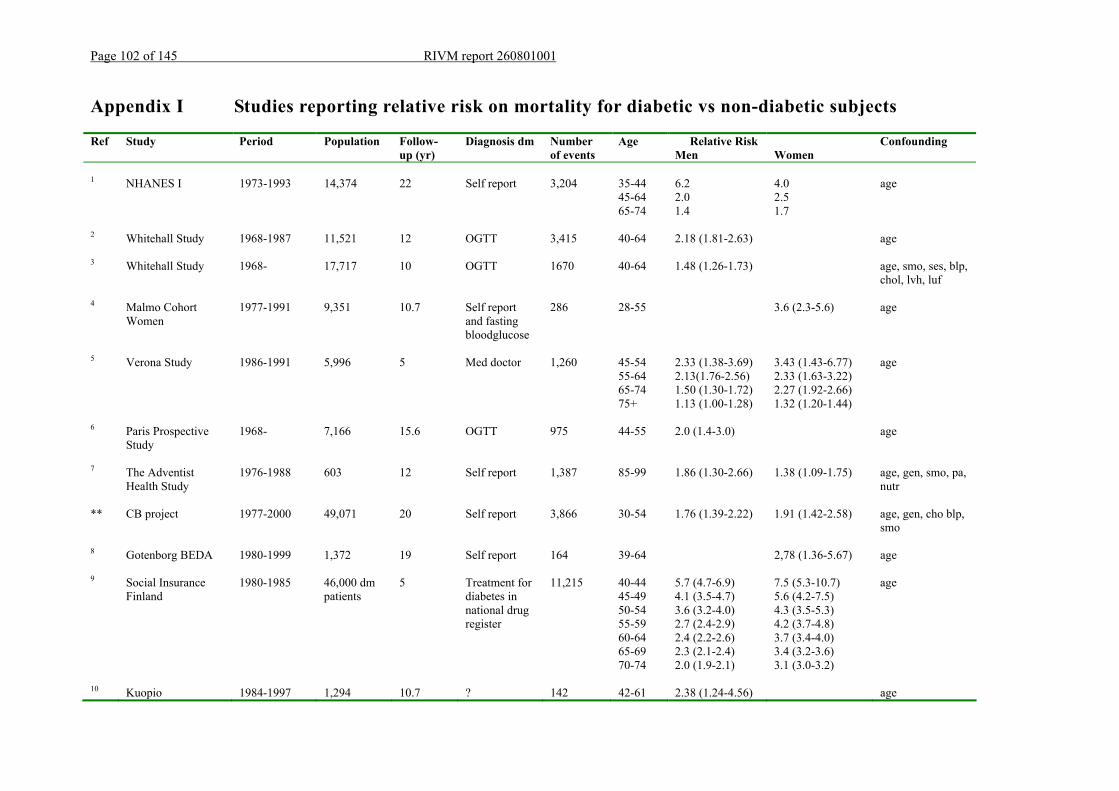
Page 102 of 145 RIVM report 260801001
Appendix I Studies reporting relative risk on mortality for diabetic vs non-diabetic subjects
Ref Study Period Population Follow-up (yr)
Diagnosis dm Number of events
Age Relative Risk Men
Women
Confounding
1 NHANES I 1973-1993 14,374 22 Self report 3,204 35-44 6.2 4.0 age 45-64 2.0 2.5 65-74 1.4
1.7
2 Whitehall Study 1968-1987 11,521 12 OGTT 3,415 40-64 2.18 (1.81-2.63)
age
3 Whitehall Study 1968- 17,717 10 OGTT 1670 40-64 1.48 (1.26-1.73) age, smo, ses, blp, chol, lvh, luf
4 Malmo Cohort Women
1977-1991 9,351 10.7 Self report and fasting bloodglucose
286 28-55 3.6 (2.3-5.6) age
5 Verona Study 1986-1991 5,996 5 Med doctor 1,260 45-54 2.33 (1.38-3.69) 3.43 (1.43-6.77) age 55-64 2.13(1.76-2.56) 2.33 (1.63-3.22) 65-74 1.50 (1.30-1.72) 2.27 (1.92-2.66) 75+ 1.13 (1.00-1.28) 1.32 (1.20-1.44)
6 Paris Prospective Study
1968- 7,166 15.6 OGTT 975 44-55 2.0 (1.4-3.0) age
7 The Adventist Health Study
1976-1988 603 12 Self report 1,387 85-99 1.86 (1.30-2.66) 1.38 (1.09-1.75) age, gen, smo, pa, nutr
** CB project 1977-2000 49,071 20 Self report 3,866 30-54 1.76 (1.39-2.22) 1.91 (1.42-2.58) age, gen, cho blp, smo
8 Gotenborg BEDA 1980-1999 1,372 19 Self report 164 39-64 2,78 (1.36-5.67) age
9 Social Insurance Finland
1980-1985 46,000 dm patients
5 Treatment for diabetes in national drug register
11,215 40-44 45-49 50-54 55-59 60-64 65-69 70-74
5.7 (4.7-6.9) 4.1 (3.5-4.7) 3.6 (3.2-4.0) 2.7 (2.4-2.9) 2.4 (2.2-2.6) 2.3 (2.1-2.4) 2.0 (1.9-2.1)
7.5 (5.3-10.7) 5.6 (4.2-7.5) 4.3 (3.5-5.3) 4.2 (3.7-4.8) 3.7 (3.4-4.0) 3.4 (3.2-3.6) 3.1 (3.0-3.2)
age
10 Kuopio 1984-1997 1,294 10.7 ? 142 42-61 2.38 (1.24-4.56) age
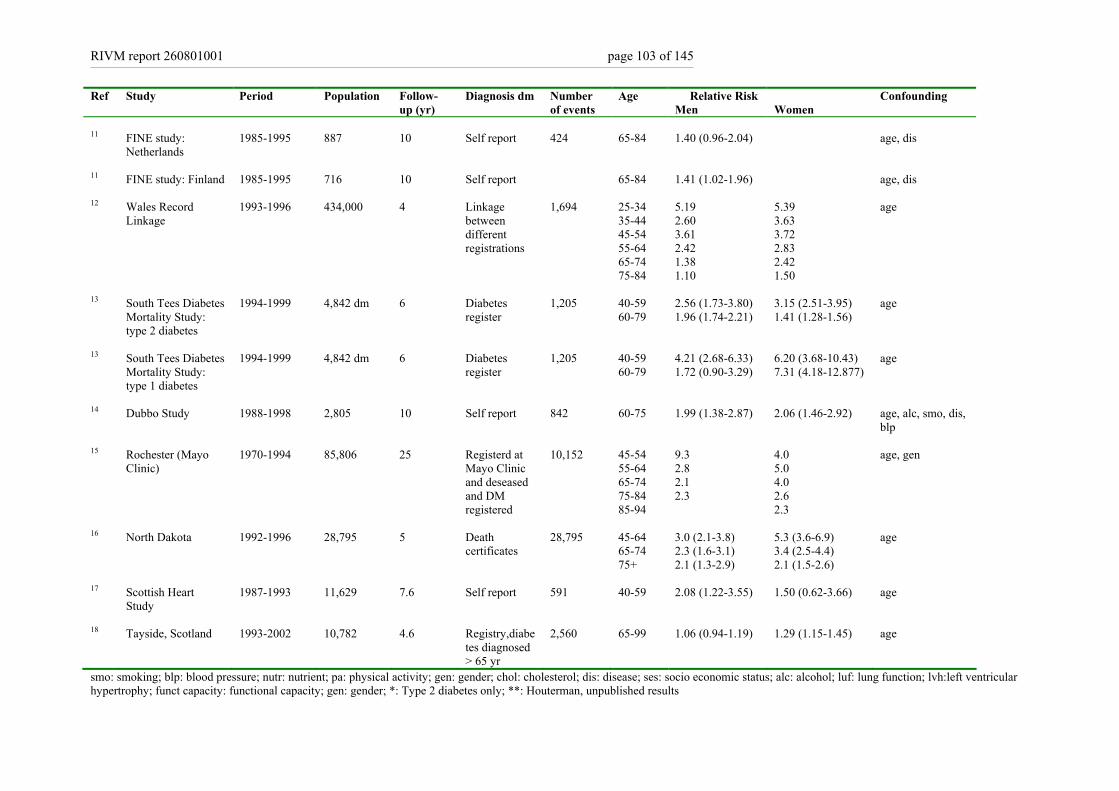
RIVM report 260801001 page 103 of 145
Ref Study Period Population Follow-up (yr)
Diagnosis dm Number of events
Age Relative Risk Men
Women
Confounding
11 FINE study:
Netherlands
1985-1995 887 10 Self report 424 65-84 1.40 (0.96-2.04) age, dis
11 FINE study: Finland 1985-1995 716 10 Self report 65-84 1.41 (1.02-1.96) age, dis
12 Wales Record Linkage
1993-1996 434,000 4 Linkage between different registrations
1,694 25-34 35-44 45-54 55-64 65-74 75-84
5.19 2.60 3.61 2.42 1.38 1.10
5.39 3.63 3.72 2.83 2.42 1.50
age
13 South Tees Diabetes Mortality Study: type 2 diabetes
1994-1999 4,842 dm 6 Diabetes register
1,205 40-59 60-79
2.56 (1.73-3.80) 1.96 (1.74-2.21)
3.15 (2.51-3.95) 1.41 (1.28-1.56)
age
13 South Tees Diabetes Mortality Study: type 1 diabetes
1994-1999 4,842 dm 6 Diabetes register
1,205 40-59 60-79
4.21 (2.68-6.33) 1.72 (0.90-3.29)
6.20 (3.68-10.43) 7.31 (4.18-12.877)
age
14 Dubbo Study 1988-1998 2,805 10 Self report 842 60-75 1.99 (1.38-2.87) 2.06 (1.46-2.92) age, alc, smo, dis, blp
15 Rochester (Mayo Clinic)
1970-1994 85,806 25 Registerd at Mayo Clinic and deseased and DM registered
10,152 45-54 55-64 65-74 75-84 85-94
9.3 2.8 2.1 2.3
4.0 5.0 4.0 2.6 2.3
age, gen
16 North Dakota 1992-1996 28,795 5 Death certificates
28,795 45-64 65-74 75+
3.0 (2.1-3.8) 2.3 (1.6-3.1) 2.1 (1.3-2.9)
5.3 (3.6-6.9) 3.4 (2.5-4.4) 2.1 (1.5-2.6)
age
17 Scottish Heart Study
1987-1993 11,629 7.6 Self report 591 40-59 2.08 (1.22-3.55) 1.50 (0.62-3.66) age
18 Tayside, Scotland 1993-2002 10,782 4.6 Registry,diabetes diagnosed > 65 yr
2,560 65-99 1.06 (0.94-1.19) 1.29 (1.15-1.45) age
smo: smoking; blp: blood pressure; nutr: nutrient; pa: physical activity; gen: gender; chol: cholesterol; dis: disease; ses: socio economic status; alc: alcohol; luf: lung function; lvh:left ventricular hypertrophy; funct capacity: functional capacity; gen: gender; *: Type 2 diabetes only; **: Houterman, unpublished results
page 104 of 145 RIVM report 260801001
Reference List
1. Gu K, Cowie CC, Harris MI. Mortality in adults with and without diabetes in a national cohort of the U.S. population, 1971-1993. Diabetes Care 1998;
21(7):1138-45. 2. Davey Smith G., Egger M., Shipley M.J., Marmot M.G. Post-challenge glucose concentration, impaired glucose tolerance, diabetes, and cancer mortality in
men. AJE 1992; 136(9):1110-4. 3. Ebi-Kryston KL. Respiratory symptoms and pulmonary function as predictors of 10-year mortality from respiratory disease, cardiovascular disease, and all
causes in the Whitehall Study. J Clin Epidemiol 1988; 41(3):251-60. 4. Engstrom G, Tyden P, Berglund G, Hansen O, Hedblad B, Janzon L. Incidence of myocardial infarction in women. A cohort study of risk factors and
modifiers of effect. J Epidemiol Community Health 2000; 54(2):104-7. 5. Muggeo M, Verlato G, Bonora E et al. The Verona diabetes study: a population-based survey on known diabetes mellitus prevalence and 5-year all-cause
mortality. Diabetologia 1995; 38(3):318-25. 6. Balkau B, Eschwege E, Papoz L et al. Risk factors for early death in non-insulin dependent diabetes and men with known glucose tolerance status. BMJ
1993; 307(6899):295-9. 7. Fraser GE, Shavlik DJ. Risk factors for all-cause and coronary heart disease mortality in the oldest-old. The Adventist Health Study. Arch Intern Med 1997;
157(19):2249-58. 8. Johansson S, Wilhelmsen L, Lappas G, Rosengren A. High lipid levels and coronary disease in women in Goteborg--outcome and secular trends: a
prospective 19 year follow-up in the BEDA*study. Eur Heart J 2003; 24(8):704-16. 9. Koskinen SV, Reunanen AR, Martelin TP, Valkonen T. Mortality in a large population-based cohort of patients with drug-treated diabetes mellitus. Am J
Public Health 1998; 88(5):765-70. 10. Laukkanen JA, Lakka TA, Rauramaa R et al. Cardiovascular fitness as a predictor of mortality in men. Arch Intern Med 2001; 161(6):825-31.
11. Menotti A, Mulder I, Nissinen A et al. Cardiovascular risk factors and 10-year all-cause mortality in elderly European male populations; the FINE study. Finland, Italy, Netherlands, Elderly. Eur Heart J 2001; 22(7):573-9.
12. Morgan CL, Currie CJ, Peters JR. Relationship between diabetes and mortality: a population study using record linkage. Diabetes Care 2000; 23(8):1103-7. 13. Roper NA, Bilous RW, Kelly WF, Unwin NC, Connolly VM. Cause-specific mortality in a population with diabetes: South Tees Diabetes Mortality Study.
Diabetes Care 2002; 25(1):43-8. 14. Simons LA, McCallum J, Friedlander Y, Ortiz M, Simons J. Moderate alcohol intake is associated with survival in the elderly: the Dubbo Study. Med J Aust
2000; 173(3):121-4. 15. Thomas J, Jones G, Scarinci I, Brantley P. A descriptive and comparative study of the prevalence of depressive and anxiety disorders in low-income adults
with type 2 diabetes and other chronic illnesses. Diabetes Care 2003; 26(8):2311-7. 16. Tierney EF, Geiss LS, Engelgau MM et al. Population-based estimates of mortality associated with diabetes: use of a death certificate check box in North
Dakota. Am J Public Health 2001; 91(1):84-92. 17. Tunstall-Pedoe H, Woodward M, Tavendale R, A'Brook R, McCluskey MK. Comparison of the prediction by 27 different factors of coronary heart disease
and death in men and women of the Scottish Heart Health Study: cohort study. BMJ 1997; 315(7110):722-9. 18. Tan HH, McAlpine RR, James P et al. Diagnosis of type 2 diabetes at an older age: effect on mortality in men and women. Diabetes Care 2004; 27(12):
2797-9.
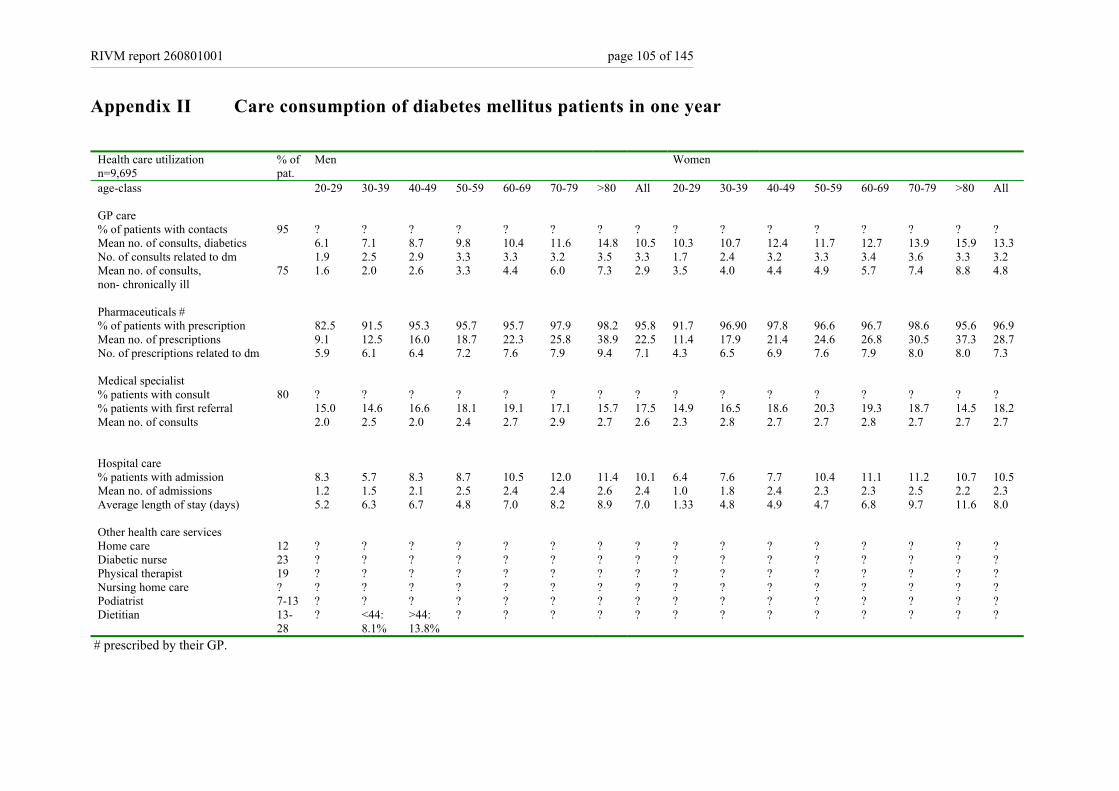
RIVM report 260801001 page 105 of 145
Appendix II Care consumption of diabetes mellitus patients in one year
Health care utilization n=9,695
% of pat.
Men Women
age-class 20-29 30-39 40-49 50-59 60-69 70-79 >80 All 20-29 30-39 40-49 50-59 60-69 70-79 >80 All GP care % of patients with contacts 95 ? ? ? ? ? ? ? ? ? ? ? ? ? ? ? ? Mean no. of consults, diabetics 6.1 7.1 8.7 9.8 10.4 11.6 14.8 10.5 10.3 10.7 12.4 11.7 12.7 13.9 15.9 13.3 No. of consults related to dm 1.9 2.5 2.9 3.3 3.3 3.2 3.5 3.3 1.7 2.4 3.2 3.3 3.4 3.6 3.3 3.2 Mean no. of consults, non- chronically ill
75 1.6 2.0 2.6 3.3 4.4 6.0 7.3 2.9 3.5 4.0 4.4 4.9 5.7 7.4 8.8 4.8
Pharmaceuticals # % of patients with prescription 82.5 91.5 95.3 95.7 95.7 97.9 98.2 95.8 91.7 96.90 97.8 96.6 96.7 98.6 95.6 96.9 Mean no. of prescriptions 9.1 12.5 16.0 18.7 22.3 25.8 38.9 22.5 11.4 17.9 21.4 24.6 26.8 30.5 37.3 28.7 No. of prescriptions related to dm 5.9 6.1 6.4 7.2 7.6 7.9 9.4 7.1 4.3 6.5 6.9 7.6 7.9 8.0 8.0 7.3 Medical specialist % patients with consult 80 ? ? ? ? ? ? ? ? ? ? ? ? ? ? ? ? % patients with first referral 15.0 14.6 16.6 18.1 19.1 17.1 15.7 17.5 14.9 16.5 18.6 20.3 19.3 18.7 14.5 18.2 Mean no. of consults 2.0 2.5 2.0 2.4 2.7 2.9 2.7 2.6 2.3 2.8 2.7 2.7 2.8 2.7 2.7 2.7 Hospital care % patients with admission 8.3 5.7 8.3 8.7 10.5 12.0 11.4 10.1 6.4 7.6 7.7 10.4 11.1 11.2 10.7 10.5 Mean no. of admissions 1.2 1.5 2.1 2.5 2.4 2.4 2.6 2.4 1.0 1.8 2.4 2.3 2.3 2.5 2.2 2.3 Average length of stay (days) 5.2 6.3 6.7 4.8 7.0 8.2 8.9 7.0 1.33 4.8 4.9 4.7 6.8 9.7 11.6 8.0 Other health care services Home care 12 ? ? ? ? ? ? ? ? ? ? ? ? ? ? ? ? Diabetic nurse 23 ? ? ? ? ? ? ? ? ? ? ? ? ? ? ? ? Physical therapist 19 ? ? ? ? ? ? ? ? ? ? ? ? ? ? ? ? Nursing home care ? ? ? ? ? ? ? ? ? ? ? ? ? ? ? ? ? Podiatrist 7-13 ? ? ? ? ? ? ? ? ? ? ? ? ? ? ? ? Dietitian 13-
28 ? <44:
8.1% >44: 13.8%
? ? ? ? ? ? ? ? ? ? ? ? ?
# prescribed by their GP.
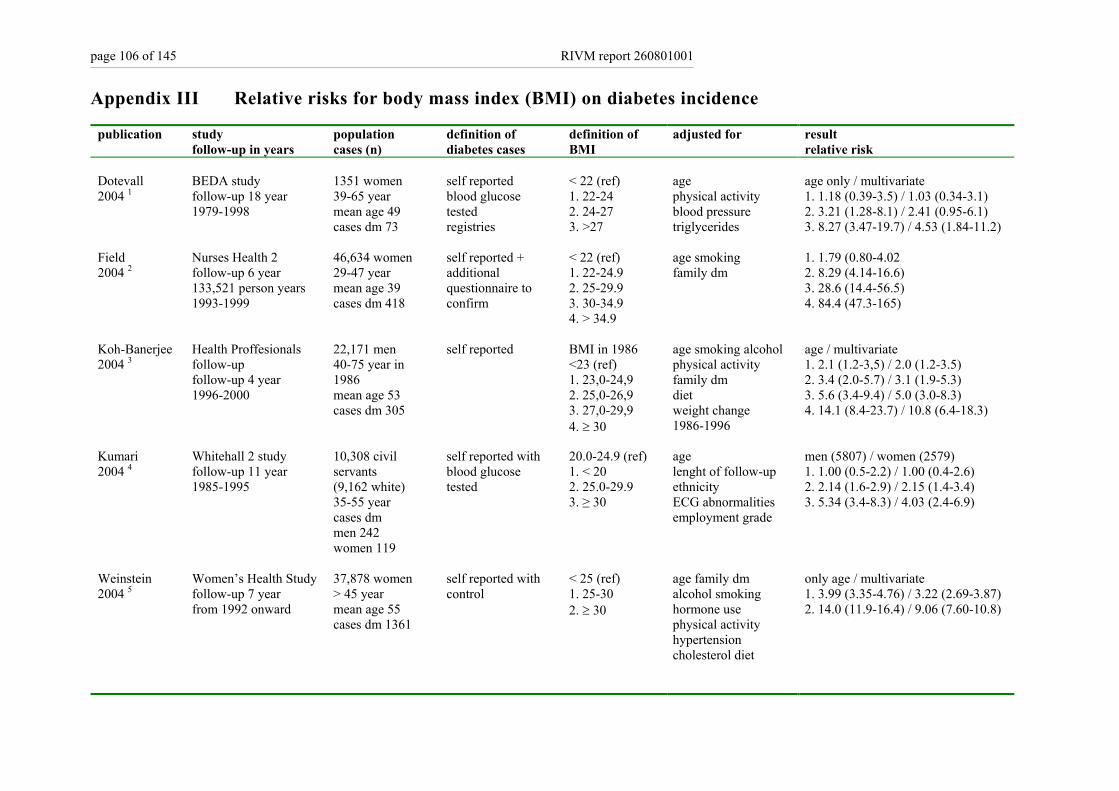
page 106 of 145 RIVM report 260801001
Appendix III Relative risks for body mass index (BMI) on diabetes incidence
publication study follow-up in years
population cases (n)
definition of diabetes cases
definition of BMI
adjusted for result relative risk
Dotevall 2004 1
BEDA study follow-up 18 year 1979-1998
1351 women 39-65 year mean age 49 cases dm 73
self reported blood glucose tested registries
< 22 (ref) 1. 22-24 2. 24-27 3. >27
age physical activity blood pressure triglycerides
age only / multivariate 1. 1.18 (0.39-3.5) / 1.03 (0.34-3.1) 2. 3.21 (1.28-8.1) / 2.41 (0.95-6.1) 3. 8.27 (3.47-19.7) / 4.53 (1.84-11.2)
Field 2004 2
Nurses Health 2 follow-up 6 year 133,521 person years 1993-1999
46,634 women 29-47 year mean age 39 cases dm 418
self reported + additional questionnaire to confirm
< 22 (ref) 1. 22-24.9 2. 25-29.9 3. 30-34.9 4. > 34.9
age smoking family dm
1. 1.79 (0.80-4.02 2. 8.29 (4.14-16.6) 3. 28.6 (14.4-56.5) 4. 84.4 (47.3-165)
Koh-Banerjee 2004 3
Health Proffesionals follow-up follow-up 4 year 1996-2000
22,171 men 40-75 year in 1986 mean age 53 cases dm 305
self reported BMI in 1986 <23 (ref) 1. 23,0-24,9 2. 25,0-26,9 3. 27,0-29,9 4. ≥ 30
age smoking alcohol physical activity family dm diet weight change 1986-1996
age / multivariate 1. 2.1 (1.2-3,5) / 2.0 (1.2-3.5) 2. 3.4 (2.0-5.7) / 3.1 (1.9-5.3) 3. 5.6 (3.4-9.4) / 5.0 (3.0-8.3) 4. 14.1 (8.4-23.7) / 10.8 (6.4-18.3)
Kumari 2004 4
Whitehall 2 study follow-up 11 year 1985-1995
10,308 civil servants (9,162 white) 35-55 year cases dm men 242 women 119
self reported with blood glucose tested
20.0-24.9 (ref) 1. < 20 2. 25.0-29.9 3. ≥ 30
age lenght of follow-up ethnicity ECG abnormalities employment grade
men (5807) / women (2579) 1. 1.00 (0.5-2.2) / 1.00 (0.4-2.6) 2. 2.14 (1.6-2.9) / 2.15 (1.4-3.4) 3. 5.34 (3.4-8.3) / 4.03 (2.4-6.9)
Weinstein 2004 5
Women’s Health Study follow-up 7 year from 1992 onward
37,878 women > 45 year mean age 55 cases dm 1361
self reported with control
< 25 (ref) 1. 25-30 2. ≥ 30
age family dm alcohol smoking hormone use physical activity hypertension cholesterol diet
only age / multivariate 1. 3.99 (3.35-4.76) / 3.22 (2.69-3.87) 2. 14.0 (11.9-16.4) / 9.06 (7.60-10.8)
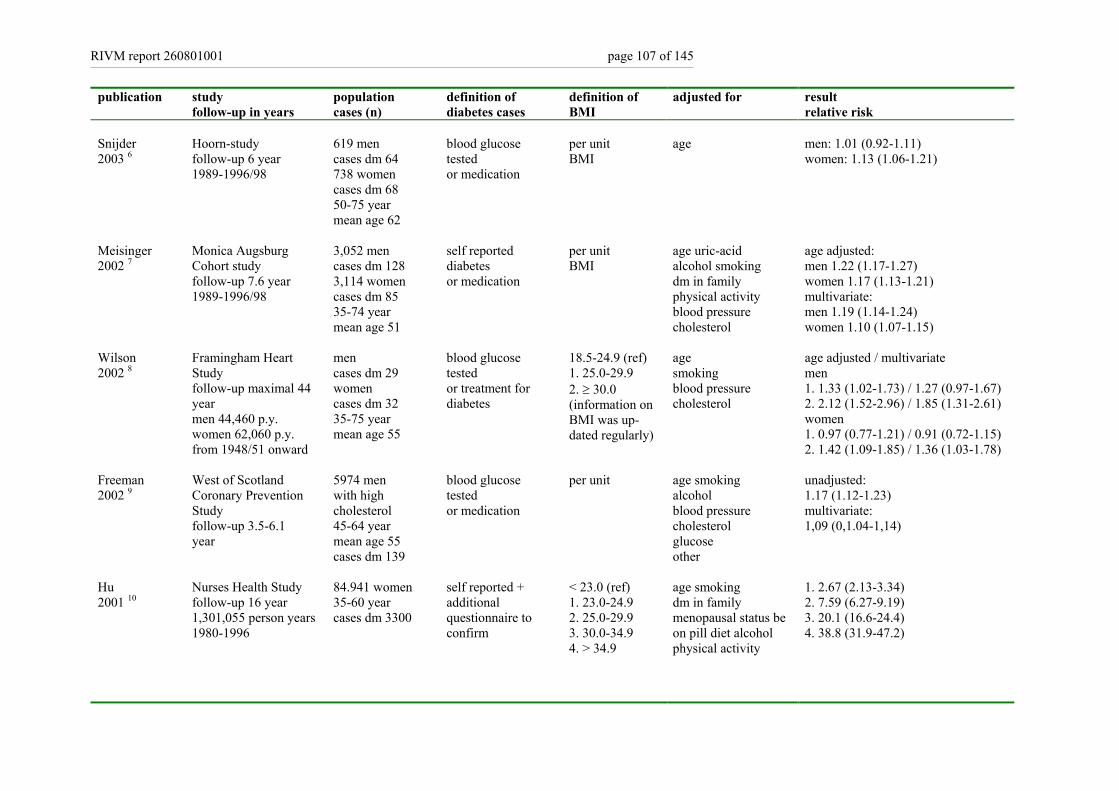
RIVM report 260801001 page 107 of 145
publication study follow-up in years
population cases (n)
definition of diabetes cases
definition of BMI
adjusted for result relative risk
Snijder 2003 6
Hoorn-study follow-up 6 year 1989-1996/98
619 men cases dm 64 738 women cases dm 68 50-75 year mean age 62
blood glucose tested or medication
per unit BMI
age
men: 1.01 (0.92-1.11) women: 1.13 (1.06-1.21)
Meisinger 2002 7
Monica Augsburg Cohort study follow-up 7.6 year 1989-1996/98
3,052 men cases dm 128 3,114 women cases dm 85 35-74 year mean age 51
self reported diabetes or medication
per unit BMI
age uric-acid alcohol smoking dm in family physical activity blood pressure cholesterol
age adjusted: men 1.22 (1.17-1.27) women 1.17 (1.13-1.21) multivariate: men 1.19 (1.14-1.24) women 1.10 (1.07-1.15)
Wilson 2002 8
Framingham Heart Study follow-up maximal 44 year men 44,460 p.y. women 62,060 p.y. from 1948/51 onward
men cases dm 29 women cases dm 32 35-75 year mean age 55
blood glucose tested or treatment for diabetes
18.5-24.9 (ref) 1. 25.0-29.9 2. ≥ 30.0 (information on BMI was up-dated regularly)
age smoking blood pressure cholesterol
age adjusted / multivariate men 1. 1.33 (1.02-1.73) / 1.27 (0.97-1.67) 2. 2.12 (1.52-2.96) / 1.85 (1.31-2.61) women 1. 0.97 (0.77-1.21) / 0.91 (0.72-1.15) 2. 1.42 (1.09-1.85) / 1.36 (1.03-1.78)
Freeman 2002 9
West of Scotland Coronary Prevention Study follow-up 3.5-6.1 year
5974 men with high cholesterol 45-64 year mean age 55 cases dm 139
blood glucose tested or medication
per unit age smoking alcohol blood pressure cholesterol glucose other
unadjusted: 1.17 (1.12-1.23) multivariate: 1,09 (0,1.04-1,14)
Hu 2001 10
Nurses Health Study follow-up 16 year 1,301,055 person years 1980-1996
84.941 women 35-60 year cases dm 3300
self reported + additional questionnaire to confirm
< 23.0 (ref) 1. 23.0-24.9 2. 25.0-29.9 3. 30.0-34.9 4. > 34.9
age smoking dm in family menopausal status be on pill diet alcohol physical activity
1. 2.67 (2.13-3.34) 2. 7.59 (6.27-9.19) 3. 20.1 (16.6-24.4) 4. 38.8 (31.9-47.2)
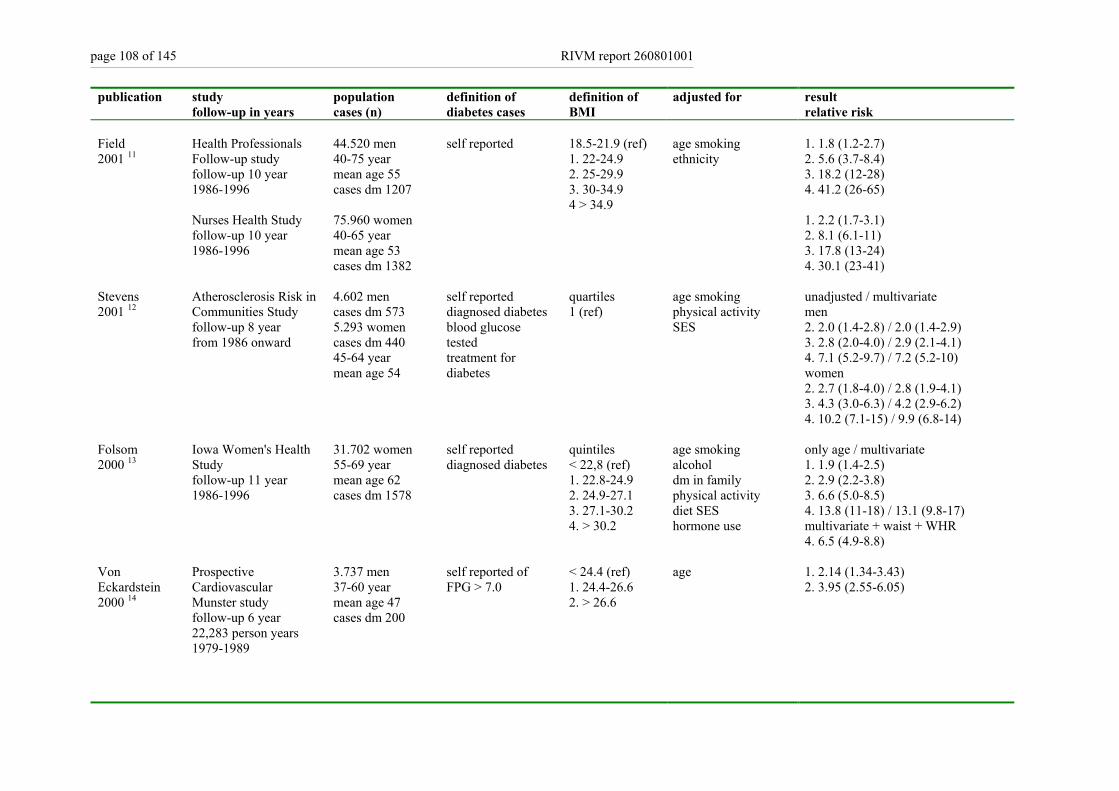
page 108 of 145 RIVM report 260801001
publication study follow-up in years
population cases (n)
definition of diabetes cases
definition of BMI
adjusted for result relative risk
Field 2001 11
Health Professionals Follow-up study follow-up 10 year 1986-1996 Nurses Health Study follow-up 10 year 1986-1996
44.520 men 40-75 year mean age 55 cases dm 1207 75.960 women 40-65 year mean age 53 cases dm 1382
self reported 18.5-21.9 (ref) 1. 22-24.9 2. 25-29.9 3. 30-34.9 4 > 34.9
age smoking ethnicity
1. 1.8 (1.2-2.7) 2. 5.6 (3.7-8.4) 3. 18.2 (12-28) 4. 41.2 (26-65) 1. 2.2 (1.7-3.1) 2. 8.1 (6.1-11) 3. 17.8 (13-24) 4. 30.1 (23-41)
Stevens 2001 12
Atherosclerosis Risk in Communities Study follow-up 8 year from 1986 onward
4.602 men cases dm 573 5.293 women cases dm 440 45-64 year mean age 54
self reported diagnosed diabetes blood glucose tested treatment for diabetes
quartiles 1 (ref)
age smoking physical activity SES
unadjusted / multivariate men 2. 2.0 (1.4-2.8) / 2.0 (1.4-2.9) 3. 2.8 (2.0-4.0) / 2.9 (2.1-4.1) 4. 7.1 (5.2-9.7) / 7.2 (5.2-10) women 2. 2.7 (1.8-4.0) / 2.8 (1.9-4.1) 3. 4.3 (3.0-6.3) / 4.2 (2.9-6.2) 4. 10.2 (7.1-15) / 9.9 (6.8-14)
Folsom 2000 13
Iowa Women's Health Study follow-up 11 year 1986-1996
31.702 women 55-69 year mean age 62 cases dm 1578
self reported diagnosed diabetes
quintiles < 22,8 (ref) 1. 22.8-24.9 2. 24.9-27.1 3. 27.1-30.2 4. > 30.2
age smoking alcohol dm in family physical activity diet SES hormone use
only age / multivariate 1. 1.9 (1.4-2.5) 2. 2.9 (2.2-3.8) 3. 6.6 (5.0-8.5) 4. 13.8 (11-18) / 13.1 (9.8-17) multivariate + waist + WHR 4. 6.5 (4.9-8.8)
Von Eckardstein 2000 14
Prospective Cardiovascular Munster study follow-up 6 year 22,283 person years 1979-1989
3.737 men 37-60 year mean age 47 cases dm 200
self reported of FPG > 7.0
< 24.4 (ref) 1. 24.4-26.6 2. > 26.6
age 1. 2.14 (1.34-3.43) 2. 3.95 (2.55-6.05)
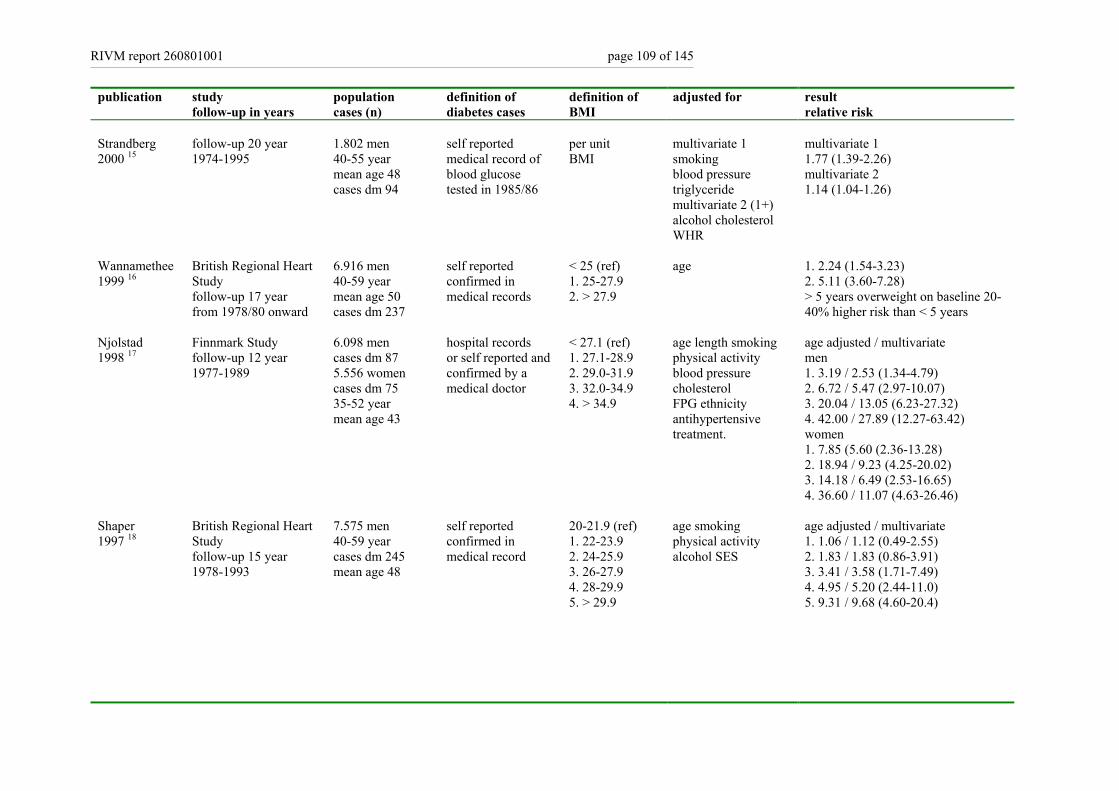
RIVM report 260801001 page 109 of 145
publication study follow-up in years
population cases (n)
definition of diabetes cases
definition of BMI
adjusted for result relative risk
Strandberg 2000 15
follow-up 20 year 1974-1995
1.802 men 40-55 year mean age 48 cases dm 94
self reported medical record of blood glucose tested in 1985/86
per unit BMI
multivariate 1 smoking blood pressure triglyceride multivariate 2 (1+) alcohol cholesterol WHR
multivariate 1 1.77 (1.39-2.26) multivariate 2 1.14 (1.04-1.26)
Wannamethee 1999 16
British Regional Heart Study follow-up 17 year from 1978/80 onward
6.916 men 40-59 year mean age 50 cases dm 237
self reported confirmed in medical records
< 25 (ref) 1. 25-27.9 2. > 27.9
age
1. 2.24 (1.54-3.23) 2. 5.11 (3.60-7.28) > 5 years overweight on baseline 20-40% higher risk than < 5 years
Njolstad 1998 17
Finnmark Study follow-up 12 year 1977-1989
6.098 men cases dm 87 5.556 women cases dm 75 35-52 year mean age 43
hospital records or self reported and confirmed by a medical doctor
< 27.1 (ref) 1. 27.1-28.9 2. 29.0-31.9 3. 32.0-34.9 4. > 34.9
age length smoking physical activity blood pressure cholesterol FPG ethnicity antihypertensive treatment.
age adjusted / multivariate men 1. 3.19 / 2.53 (1.34-4.79) 2. 6.72 / 5.47 (2.97-10.07) 3. 20.04 / 13.05 (6.23-27.32) 4. 42.00 / 27.89 (12.27-63.42) women 1. 7.85 (5.60 (2.36-13.28) 2. 18.94 / 9.23 (4.25-20.02) 3. 14.18 / 6.49 (2.53-16.65) 4. 36.60 / 11.07 (4.63-26.46)
Shaper 1997 18
British Regional Heart Study follow-up 15 year 1978-1993
7.575 men 40-59 year cases dm 245 mean age 48
self reported confirmed in medical record
20-21.9 (ref) 1. 22-23.9 2. 24-25.9 3. 26-27.9 4. 28-29.9 5. > 29.9
age smoking physical activity alcohol SES
age adjusted / multivariate 1. 1.06 / 1.12 (0.49-2.55) 2. 1.83 / 1.83 (0.86-3.91) 3. 3.41 / 3.58 (1.71-7.49) 4. 4.95 / 5.20 (2.44-11.0) 5. 9.31 / 9.68 (4.60-20.4)
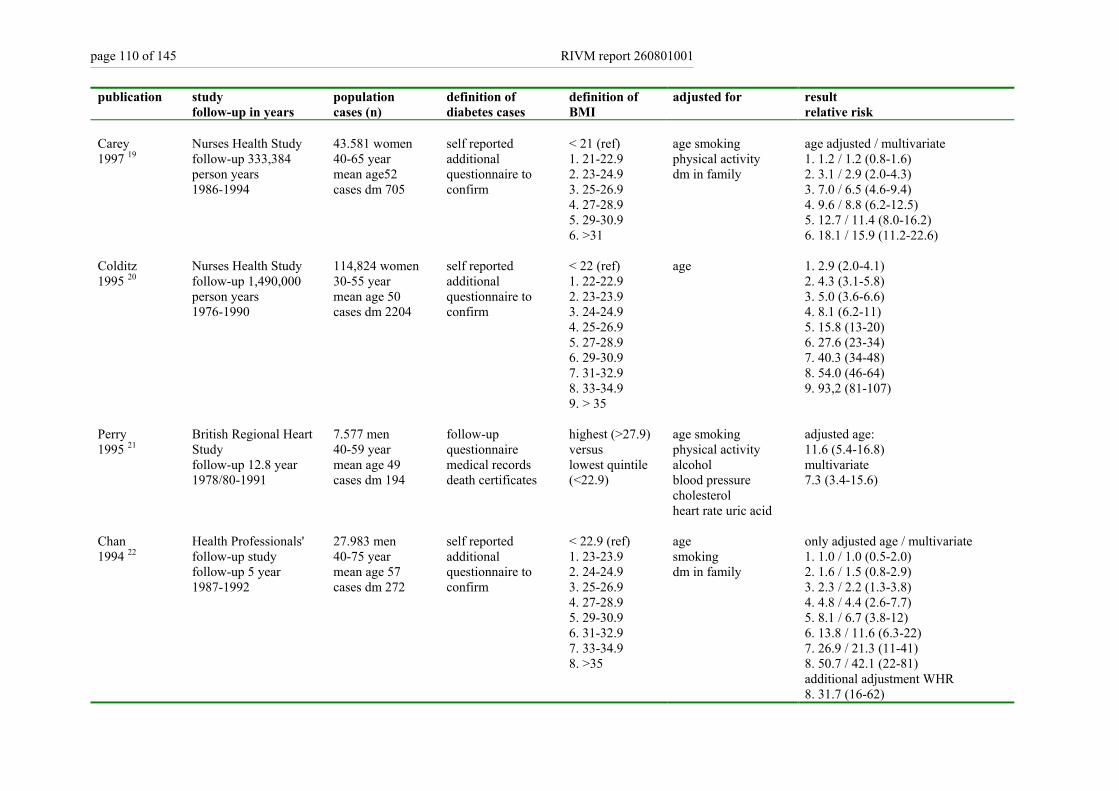
page 110 of 145 RIVM report 260801001
publication study follow-up in years
population cases (n)
definition of diabetes cases
definition of BMI
adjusted for result relative risk
Carey 1997 19
Nurses Health Study follow-up 333,384 person years 1986-1994
43.581 women 40-65 year mean age52 cases dm 705
self reported additional questionnaire to confirm
< 21 (ref) 1. 21-22.9 2. 23-24.9 3. 25-26.9 4. 27-28.9 5. 29-30.9 6. >31
age smoking physical activity dm in family
age adjusted / multivariate 1. 1.2 / 1.2 (0.8-1.6) 2. 3.1 / 2.9 (2.0-4.3) 3. 7.0 / 6.5 (4.6-9.4) 4. 9.6 / 8.8 (6.2-12.5) 5. 12.7 / 11.4 (8.0-16.2) 6. 18.1 / 15.9 (11.2-22.6)
Colditz 1995 20
Nurses Health Study follow-up 1,490,000 person years 1976-1990
114,824 women 30-55 year mean age 50 cases dm 2204
self reported additional questionnaire to confirm
< 22 (ref) 1. 22-22.9 2. 23-23.9 3. 24-24.9 4. 25-26.9 5. 27-28.9 6. 29-30.9 7. 31-32.9 8. 33-34.9 9. > 35
age 1. 2.9 (2.0-4.1) 2. 4.3 (3.1-5.8) 3. 5.0 (3.6-6.6) 4. 8.1 (6.2-11) 5. 15.8 (13-20) 6. 27.6 (23-34) 7. 40.3 (34-48) 8. 54.0 (46-64) 9. 93,2 (81-107)
Perry 1995 21
British Regional Heart Study follow-up 12.8 year 1978/80-1991
7.577 men 40-59 year mean age 49 cases dm 194
follow-up questionnaire medical records death certificates
highest (>27.9) versus lowest quintile (<22.9)
age smoking physical activity alcohol blood pressure cholesterol heart rate uric acid
adjusted age: 11.6 (5.4-16.8) multivariate 7.3 (3.4-15.6)
Chan 1994 22
Health Professionals' follow-up study follow-up 5 year 1987-1992
27.983 men 40-75 year mean age 57 cases dm 272
self reported additional questionnaire to confirm
< 22.9 (ref) 1. 23-23.9 2. 24-24.9 3. 25-26.9 4. 27-28.9 5. 29-30.9 6. 31-32.9 7. 33-34.9 8. >35
age smoking dm in family
only adjusted age / multivariate 1. 1.0 / 1.0 (0.5-2.0) 2. 1.6 / 1.5 (0.8-2.9) 3. 2.3 / 2.2 (1.3-3.8) 4. 4.8 / 4.4 (2.6-7.7) 5. 8.1 / 6.7 (3.8-12) 6. 13.8 / 11.6 (6.3-22) 7. 26.9 / 21.3 (11-41) 8. 50.7 / 42.1 (22-81) additional adjustment WHR 8. 31.7 (16-62)
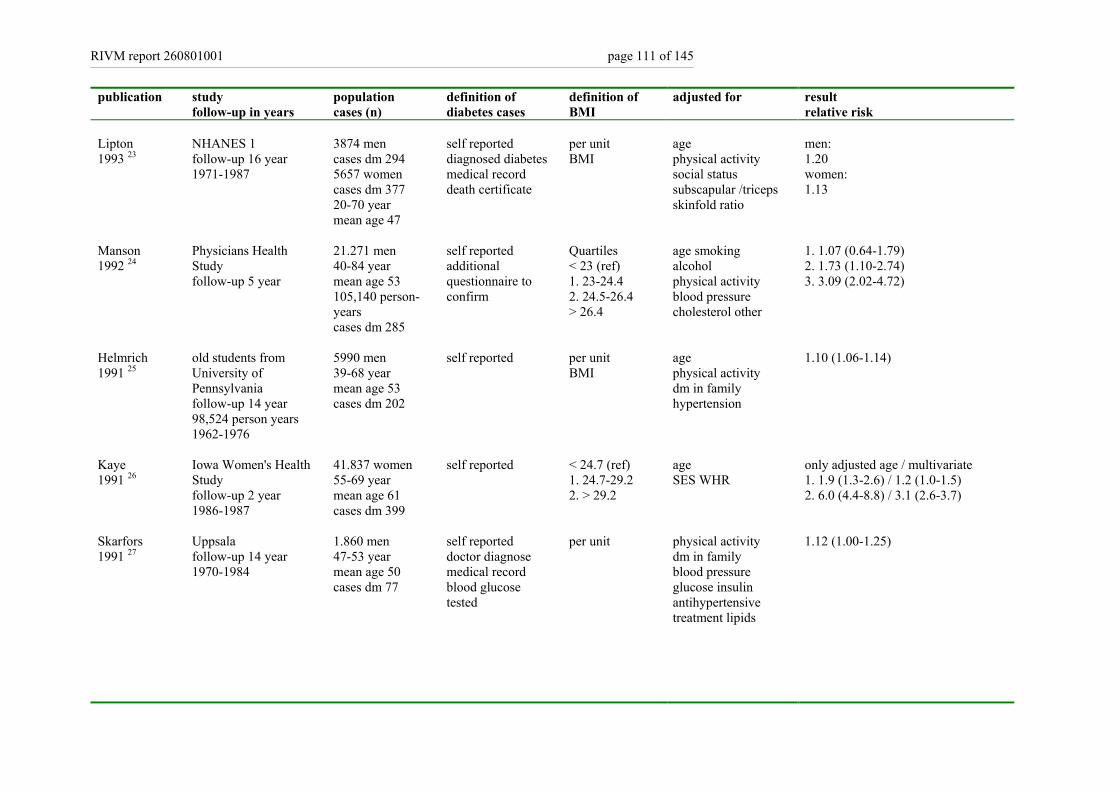
RIVM report 260801001 page 111 of 145
publication study follow-up in years
population cases (n)
definition of diabetes cases
definition of BMI
adjusted for result relative risk
Lipton 1993 23
NHANES 1 follow-up 16 year 1971-1987
3874 men cases dm 294 5657 women cases dm 377 20-70 year mean age 47
self reported diagnosed diabetes medical record death certificate
per unit BMI
age physical activity social status subscapular /triceps skinfold ratio
men: 1.20 women: 1.13
Manson 1992 24
Physicians Health Study follow-up 5 year
21.271 men 40-84 year mean age 53 105,140 person-years cases dm 285
self reported additional questionnaire to confirm
Quartiles < 23 (ref) 1. 23-24.4 2. 24.5-26.4 > 26.4
age smoking alcohol physical activity blood pressure cholesterol other
1. 1.07 (0.64-1.79) 2. 1.73 (1.10-2.74) 3. 3.09 (2.02-4.72)
Helmrich 1991 25
old students from University of Pennsylvania follow-up 14 year 98,524 person years 1962-1976
5990 men 39-68 year mean age 53 cases dm 202
self reported per unit BMI
age physical activity dm in family hypertension
1.10 (1.06-1.14)
Kaye 1991 26
Iowa Women's Health Study follow-up 2 year 1986-1987
41.837 women 55-69 year mean age 61 cases dm 399
self reported < 24.7 (ref) 1. 24.7-29.2 2. > 29.2
age SES WHR
only adjusted age / multivariate 1. 1.9 (1.3-2.6) / 1.2 (1.0-1.5) 2. 6.0 (4.4-8.8) / 3.1 (2.6-3.7)
Skarfors 1991 27
Uppsala follow-up 14 year 1970-1984
1.860 men 47-53 year mean age 50 cases dm 77
self reported doctor diagnose medical record blood glucose tested
per unit physical activity dm in family blood pressure glucose insulin antihypertensive treatment lipids
1.12 (1.00-1.25)
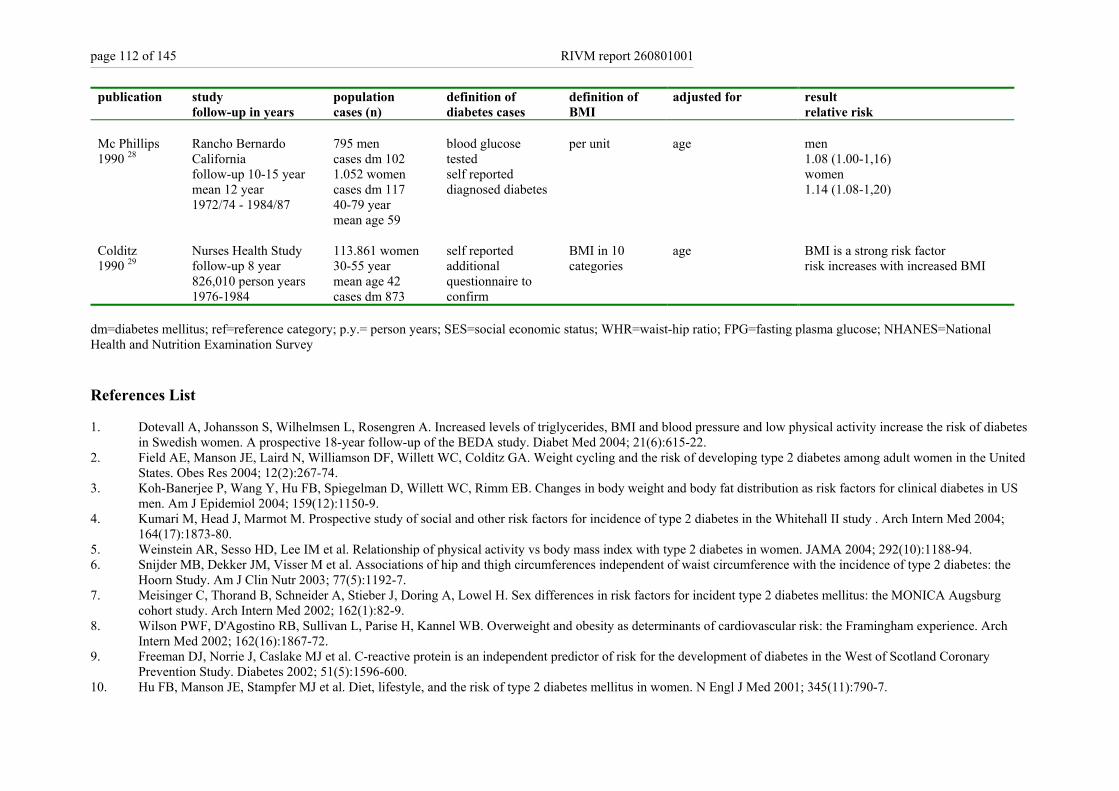
page 112 of 145 RIVM report 260801001
publication study follow-up in years
population cases (n)
definition of diabetes cases
definition of BMI
adjusted for result relative risk
Mc Phillips 1990 28
Rancho Bernardo California follow-up 10-15 year mean 12 year 1972/74 - 1984/87
795 men cases dm 102 1.052 women cases dm 117 40-79 year mean age 59
blood glucose tested self reported diagnosed diabetes
per unit age men 1.08 (1.00-1,16) women 1.14 (1.08-1,20)
Colditz 1990 29
Nurses Health Study follow-up 8 year 826,010 person years 1976-1984
113.861 women 30-55 year mean age 42 cases dm 873
self reported additional questionnaire to confirm
BMI in 10 categories
age
BMI is a strong risk factor risk increases with increased BMI
dm=diabetes mellitus; ref=reference category; p.y.= person years; SES=social economic status; WHR=waist-hip ratio; FPG=fasting plasma glucose; NHANES=National Health and Nutrition Examination Survey References List 1. Dotevall A, Johansson S, Wilhelmsen L, Rosengren A. Increased levels of triglycerides, BMI and blood pressure and low physical activity increase the risk of diabetes
in Swedish women. A prospective 18-year follow-up of the BEDA study. Diabet Med 2004; 21(6):615-22. 2. Field AE, Manson JE, Laird N, Williamson DF, Willett WC, Colditz GA. Weight cycling and the risk of developing type 2 diabetes among adult women in the United
States. Obes Res 2004; 12(2):267-74. 3. Koh-Banerjee P, Wang Y, Hu FB, Spiegelman D, Willett WC, Rimm EB. Changes in body weight and body fat distribution as risk factors for clinical diabetes in US
men. Am J Epidemiol 2004; 159(12):1150-9. 4. Kumari M, Head J, Marmot M. Prospective study of social and other risk factors for incidence of type 2 diabetes in the Whitehall II study . Arch Intern Med 2004;
164(17):1873-80. 5. Weinstein AR, Sesso HD, Lee IM et al. Relationship of physical activity vs body mass index with type 2 diabetes in women. JAMA 2004; 292(10):1188-94. 6. Snijder MB, Dekker JM, Visser M et al. Associations of hip and thigh circumferences independent of waist circumference with the incidence of type 2 diabetes: the
Hoorn Study. Am J Clin Nutr 2003; 77(5):1192-7. 7. Meisinger C, Thorand B, Schneider A, Stieber J, Doring A, Lowel H. Sex differences in risk factors for incident type 2 diabetes mellitus: the MONICA Augsburg
cohort study. Arch Intern Med 2002; 162(1):82-9. 8. Wilson PWF, D'Agostino RB, Sullivan L, Parise H, Kannel WB. Overweight and obesity as determinants of cardiovascular risk: the Framingham experience. Arch
Intern Med 2002; 162(16):1867-72. 9. Freeman DJ, Norrie J, Caslake MJ et al. C-reactive protein is an independent predictor of risk for the development of diabetes in the West of Scotland Coronary
Prevention Study. Diabetes 2002; 51(5):1596-600. 10. Hu FB, Manson JE, Stampfer MJ et al. Diet, lifestyle, and the risk of type 2 diabetes mellitus in women. N Engl J Med 2001; 345(11):790-7.

RIVM report 260801001 page 113 of 145
11. Field AE, Coakley EH, Must A et al. Impact of overweight on the risk of developing common chronic diseases during a 10-year period. Arch Intern Med 2001; 161(13):1581-6.
12. Stevens RJ, Kothari V, Adler AI, Stratton IM, United Kingdom Prospective Diabetes Study (UKPDS) Group. The UKPDS risk engine: a model for the risk of coronary heart disease in Type II diabetes (UKPDS 56). Clin Sci (Lond) 2001; 101(6):671-9 + 679 + 681-682 + 217-219.
13. Folsom AR, Kushi LH, Anderson KE et al. Associations of general and abdominal obesity with multiple health outcomes in older women: the Iowa Women's Health Study. Arch Intern Med 2000; 160(14):2117-28.
14. von Eckardstein A, Schulte H, Assmann G. Risk for diabetes mellitus in middle-aged Caucasian male participants of the PROCAM study: implications for the definition of impaired fasting glucose by the American Diabetes Association. Prospective Cardiovascular Munster. J Clin Endocrinol Metab 2000; 85(9):3101-8.
15. Strandberg TE, Salomaa V. Factors related to the development of diabetes during a 20-year follow-up. A prospective study in a homogeneous group of middle-aged men. Nutr Metab Cardiovasc Dis 2000; 10(5):239-46.
16. Wannamethee SG, Shaper AG. Weight change and duration of overweight and obesity in the incidence of type 2 diabetes. Diabetes Care 1999; 22(8):1266-72. 17. Njolstad I, Arnesen E, Lund-Larsen PG. Sex differences in risk factors for clinical diabetes mellitus in a general population: a 12 year follow-up of the Finnmark
Study. Am J Epidemiol 1998; 1998:49-58. 18. Shaper AG, Wannamethee SG, Walker M. Body weight: implications for the prevention of coronary heart disease, stroke, and diabetes mellitus in a cohort study of
middle aged men. Br Med J 1997; 314:1311-7. 19. Carey VJ, Walters EE, Colditz GA et al. Body fat distribution and risk of non-insulin-dependent diabetes mellitus in women. The Nurses' Health Study. Am J
Epidemiol 1997; 145(7):614-9. 20. Colditz GA, Willett WC, Rotnitzky A, Manson JE. Weight gain as a risk factor for clinical diabetes mellitus in women. Ann Intern Med 1995; 122(7):481-6. 21. Perry IJ, Wannamethee SG, Walker MK, Thomson AG, Whincup PH, Shaper AG. Prospective study of risk factors for development of non-insulin dependent diabetes
in middle aged British men. BMJ 1995; 310(6979):560-4. 22. Chan JM, Rimm EB, Colditz GA, Stampfer MJ, Willett WC. Obesity, fat distribution, and weight gain as risk factors for clinical diabetes in men. Diabetes Care 1994;
17(9):961-9. 23. Lipton RB, Liao Y, Cao G, Cooper RS, McGee D. Determinants of incident non-insulin-dependent diabetes mellitus among blacks and whites in a national sample.
The NHANES I epidemiologic follow-up study. Am J Epidemiol 1993; 138:826-39. 24. Manson HE, Nathan DM, Krolewski AS, Stampfer MJ, Willett WC, Hennekens CH. A prospective study of exercise and incidence of diabetes among US male
physicians. JAMA 1992; 268:63-7. 25. Helmrich SP, Ragland DD, Leung RW, Paffenbarger RS. Physical activity and reduced occurrence of non-insulin-dependent diabetes mellitus. N Eng J Med 1991;
325:147-52. 26. Kaye SA, Folsom AR, Sprafka JM, Prineas RJ, Wallace RB. Increased incidence of diabetes mellitus in relation to abdominal adiposity in older women. J Clin
Epidemiol 1991; 44:329-34. 27. Skarfors ET, Selinus KI, Lithell HO. Risk factors for developing non-insulin dependent diabetes: a 10 year follow up of men in Uppsala. BMJ 1991; 303(6805):755-
60. 28. McPhillips JB, Barrett-Connor E, Wingard DL. Cardiovascular disease risk factors prior to the diagnosis of impaired glucose tolerance and non-insulin-dependent
diabetes mellitus in a community of older adults. Am J Epidemiol 1990; 131(3):443-53. 29. Colditz GA, Willett WC, Stampfer MJ et al. Weight as a risk factor for clinical diabetes in women. Am J Epidemiol 1990; 132(3):501-13.
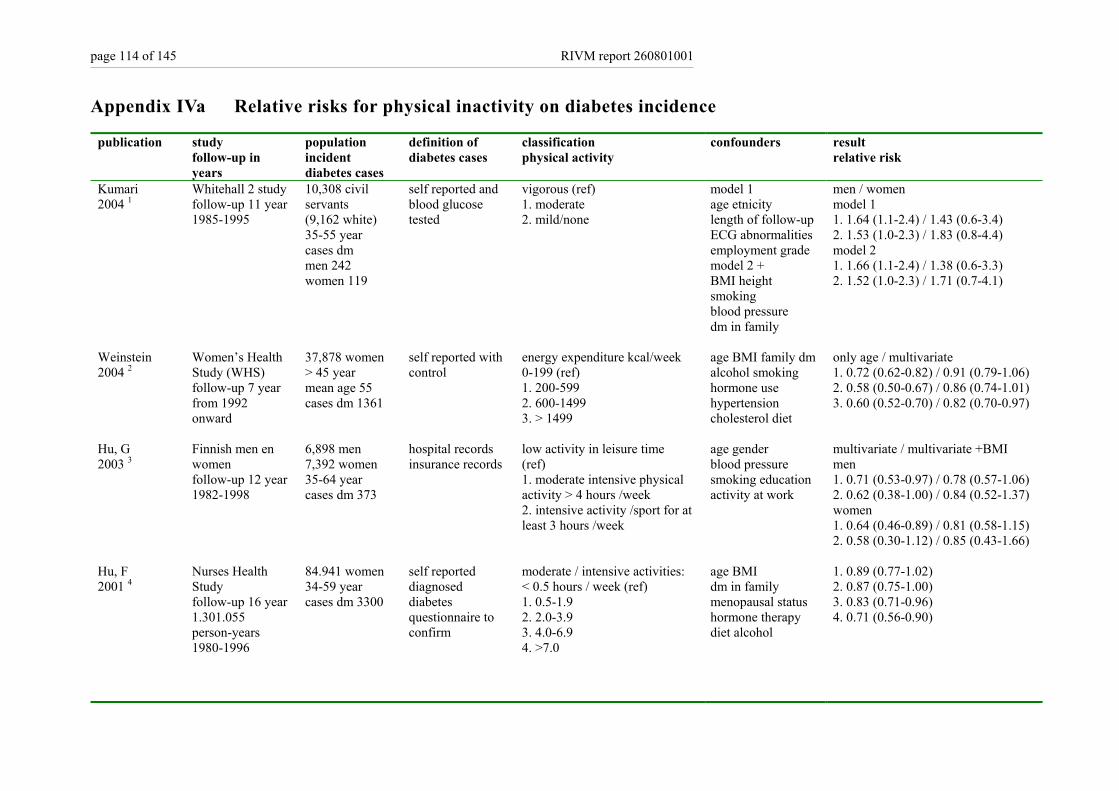
page 114 of 145 RIVM report 260801001
Appendix IVa Relative risks for physical inactivity on diabetes incidence
publication study follow-up in years
population incident diabetes cases
definition of diabetes cases
classification physical activity
confounders result relative risk
Kumari 2004 1
Whitehall 2 study follow-up 11 year 1985-1995
10,308 civil servants (9,162 white) 35-55 year cases dm men 242 women 119
self reported and blood glucose tested
vigorous (ref) 1. moderate 2. mild/none
model 1 age etnicity length of follow-up ECG abnormalities employment grade model 2 + BMI height smoking blood pressure dm in family
men / women model 1 1. 1.64 (1.1-2.4) / 1.43 (0.6-3.4) 2. 1.53 (1.0-2.3) / 1.83 (0.8-4.4) model 2 1. 1.66 (1.1-2.4) / 1.38 (0.6-3.3) 2. 1.52 (1.0-2.3) / 1.71 (0.7-4.1)
Weinstein 2004 2
Women’s Health Study (WHS) follow-up 7 year from 1992 onward
37,878 women > 45 year mean age 55 cases dm 1361
self reported with control
energy expenditure kcal/week 0-199 (ref) 1. 200-599 2. 600-1499 3. > 1499
age BMI family dm alcohol smoking hormone use hypertension cholesterol diet
only age / multivariate 1. 0.72 (0.62-0.82) / 0.91 (0.79-1.06) 2. 0.58 (0.50-0.67) / 0.86 (0.74-1.01) 3. 0.60 (0.52-0.70) / 0.82 (0.70-0.97)
Hu, G 2003 3
Finnish men en women follow-up 12 year 1982-1998
6,898 men 7,392 women 35-64 year cases dm 373
hospital records insurance records
low activity in leisure time (ref) 1. moderate intensive physical activity > 4 hours /week 2. intensive activity /sport for at least 3 hours /week
age gender blood pressure smoking education activity at work
multivariate / multivariate +BMI men 1. 0.71 (0.53-0.97) / 0.78 (0.57-1.06) 2. 0.62 (0.38-1.00) / 0.84 (0.52-1.37) women 1. 0.64 (0.46-0.89) / 0.81 (0.58-1.15) 2. 0.58 (0.30-1.12) / 0.85 (0.43-1.66)
Hu, F 2001 4
Nurses Health Study follow-up 16 year 1.301.055 person-years 1980-1996
84.941 women 34-59 year cases dm 3300
self reported diagnosed diabetes questionnaire to confirm
moderate / intensive activities: < 0.5 hours / week (ref) 1. 0.5-1.9 2. 2.0-3.9 3. 4.0-6.9 4. >7.0
age BMI dm in family menopausal status hormone therapy diet alcohol
1. 0.89 (0.77-1.02) 2. 0.87 (0.75-1.00) 3. 0.83 (0.71-0.96) 4. 0.71 (0.56-0.90)
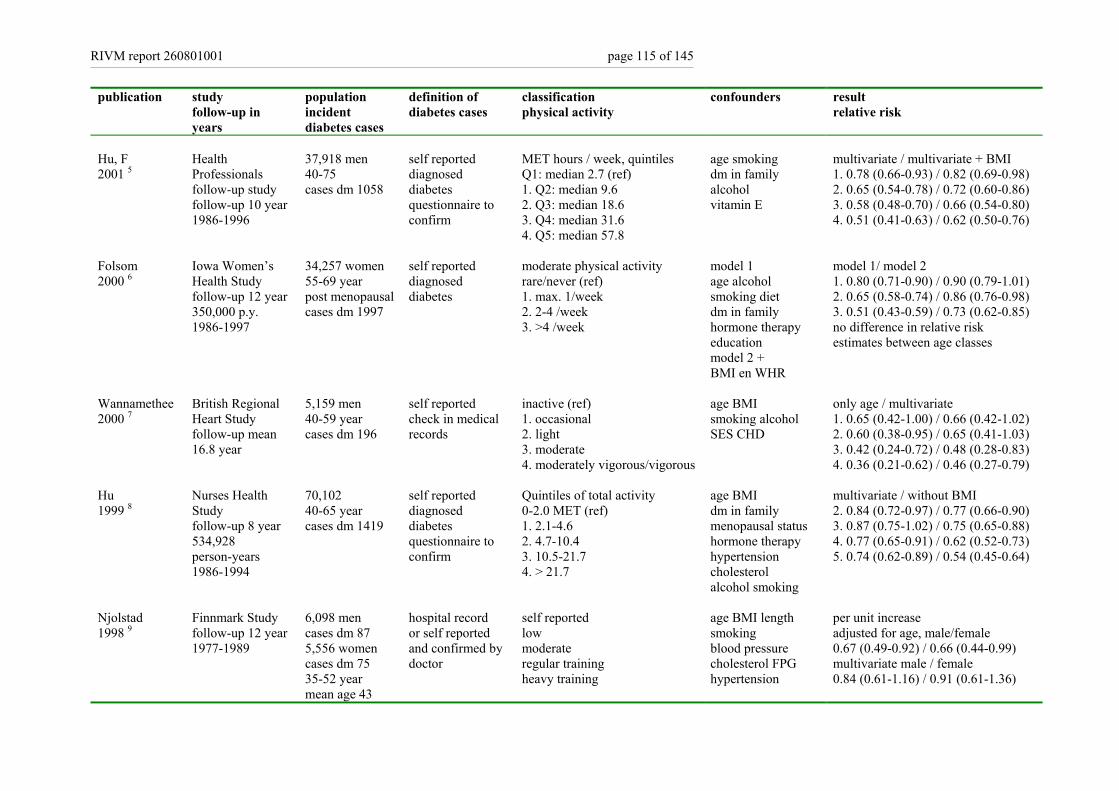
RIVM report 260801001 page 115 of 145
publication study follow-up in years
population incident diabetes cases
definition of diabetes cases
classification physical activity
confounders result relative risk
Hu, F 2001 5
Health Professionals follow-up study follow-up 10 year 1986-1996
37,918 men 40-75 cases dm 1058
self reported diagnosed diabetes questionnaire to confirm
MET hours / week, quintiles Q1: median 2.7 (ref) 1. Q2: median 9.6 2. Q3: median 18.6 3. Q4: median 31.6 4. Q5: median 57.8
age smoking dm in family alcohol vitamin E
multivariate / multivariate + BMI 1. 0.78 (0.66-0.93) / 0.82 (0.69-0.98) 2. 0.65 (0.54-0.78) / 0.72 (0.60-0.86) 3. 0.58 (0.48-0.70) / 0.66 (0.54-0.80) 4. 0.51 (0.41-0.63) / 0.62 (0.50-0.76)
Folsom 2000 6
Iowa Women’s Health Study follow-up 12 year 350,000 p.y. 1986-1997
34,257 women 55-69 year post menopausal cases dm 1997
self reported diagnosed diabetes
moderate physical activity rare/never (ref) 1. max. 1/week 2. 2-4 /week 3. >4 /week
model 1 age alcohol smoking diet dm in family hormone therapy education model 2 + BMI en WHR
model 1/ model 2 1. 0.80 (0.71-0.90) / 0.90 (0.79-1.01) 2. 0.65 (0.58-0.74) / 0.86 (0.76-0.98) 3. 0.51 (0.43-0.59) / 0.73 (0.62-0.85) no difference in relative risk estimates between age classes
Wannamethee 2000 7
British Regional Heart Study follow-up mean 16.8 year
5,159 men 40-59 year cases dm 196
self reported check in medical records
inactive (ref) 1. occasional 2. light 3. moderate 4. moderately vigorous/vigorous
age BMI smoking alcohol SES CHD
only age / multivariate 1. 0.65 (0.42-1.00) / 0.66 (0.42-1.02) 2. 0.60 (0.38-0.95) / 0.65 (0.41-1.03) 3. 0.42 (0.24-0.72) / 0.48 (0.28-0.83) 4. 0.36 (0.21-0.62) / 0.46 (0.27-0.79)
Hu 1999 8
Nurses Health Study follow-up 8 year 534,928 person-years 1986-1994
70,102 40-65 year cases dm 1419
self reported diagnosed diabetes questionnaire to confirm
Quintiles of total activity 0-2.0 MET (ref) 1. 2.1-4.6 2. 4.7-10.4 3. 10.5-21.7 4. > 21.7
age BMI dm in family menopausal status hormone therapy hypertension cholesterol alcohol smoking
multivariate / without BMI 2. 0.84 (0.72-0.97) / 0.77 (0.66-0.90) 3. 0.87 (0.75-1.02) / 0.75 (0.65-0.88) 4. 0.77 (0.65-0.91) / 0.62 (0.52-0.73) 5. 0.74 (0.62-0.89) / 0.54 (0.45-0.64)
Njolstad 1998 9
Finnmark Study follow-up 12 year 1977-1989
6,098 men cases dm 87 5,556 women cases dm 75 35-52 year mean age 43
hospital record or self reported and confirmed by doctor
self reported low moderate regular training heavy training
age BMI length smoking blood pressure cholesterol FPG hypertension
per unit increase adjusted for age, male/female 0.67 (0.49-0.92) / 0.66 (0.44-0.99) multivariate male / female 0.84 (0.61-1.16) / 0.91 (0.61-1.36)
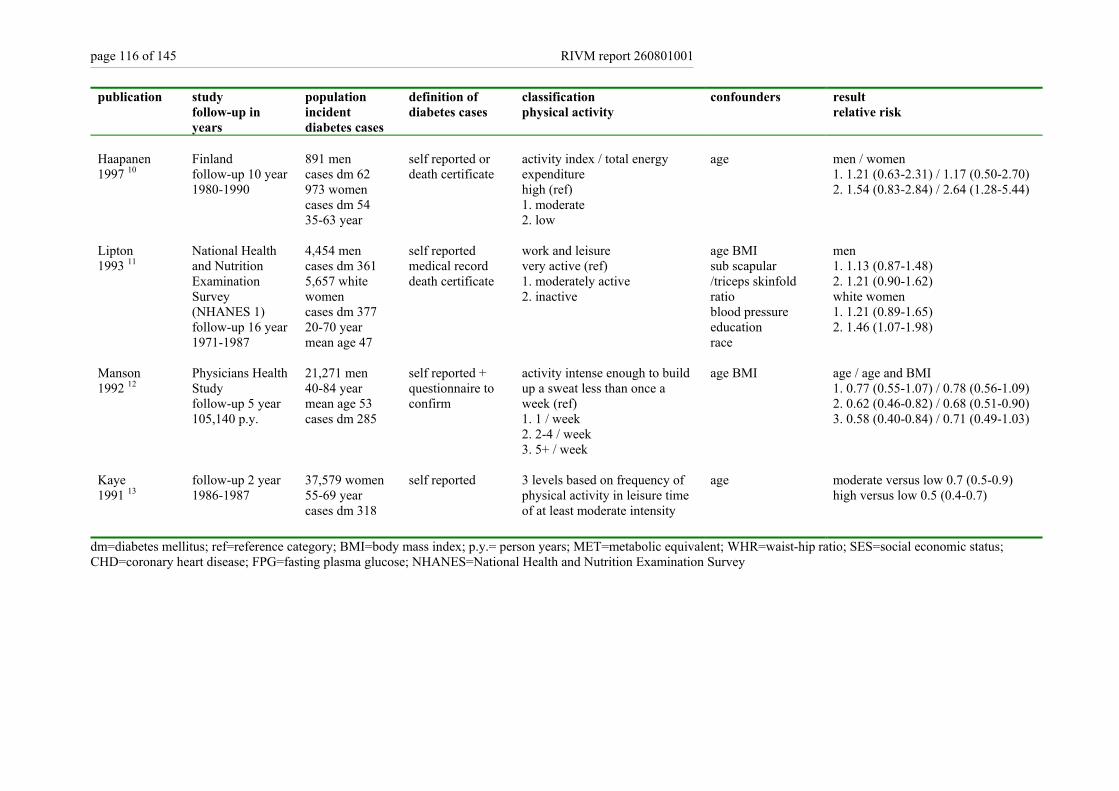
page 116 of 145 RIVM report 260801001
publication study follow-up in years
population incident diabetes cases
definition of diabetes cases
classification physical activity
confounders result relative risk
Haapanen 1997 10
Finland follow-up 10 year 1980-1990
891 men cases dm 62 973 women cases dm 54 35-63 year
self reported or death certificate
activity index / total energy expenditure high (ref) 1. moderate 2. low
age men / women 1. 1.21 (0.63-2.31) / 1.17 (0.50-2.70) 2. 1.54 (0.83-2.84) / 2.64 (1.28-5.44)
Lipton 1993 11
National Health and Nutrition Examination Survey (NHANES 1) follow-up 16 year 1971-1987
4,454 men cases dm 361 5,657 white women cases dm 377 20-70 year mean age 47
self reported medical record death certificate
work and leisure very active (ref) 1. moderately active 2. inactive
age BMI sub scapular /triceps skinfold ratio blood pressure education race
men 1. 1.13 (0.87-1.48) 2. 1.21 (0.90-1.62) white women 1. 1.21 (0.89-1.65) 2. 1.46 (1.07-1.98)
Manson 1992 12
Physicians Health Study follow-up 5 year 105,140 p.y.
21,271 men 40-84 year mean age 53 cases dm 285
self reported + questionnaire to confirm
activity intense enough to build up a sweat less than once a week (ref) 1. 1 / week 2. 2-4 / week 3. 5+ / week
age BMI
age / age and BMI 1. 0.77 (0.55-1.07) / 0.78 (0.56-1.09) 2. 0.62 (0.46-0.82) / 0.68 (0.51-0.90) 3. 0.58 (0.40-0.84) / 0.71 (0.49-1.03)
Kaye 1991 13
follow-up 2 year 1986-1987
37,579 women 55-69 year cases dm 318
self reported 3 levels based on frequency of physical activity in leisure time of at least moderate intensity
age moderate versus low 0.7 (0.5-0.9) high versus low 0.5 (0.4-0.7)
dm=diabetes mellitus; ref=reference category; BMI=body mass index; p.y.= person years; MET=metabolic equivalent; WHR=waist-hip ratio; SES=social economic status; CHD=coronary heart disease; FPG=fasting plasma glucose; NHANES=National Health and Nutrition Examination Survey
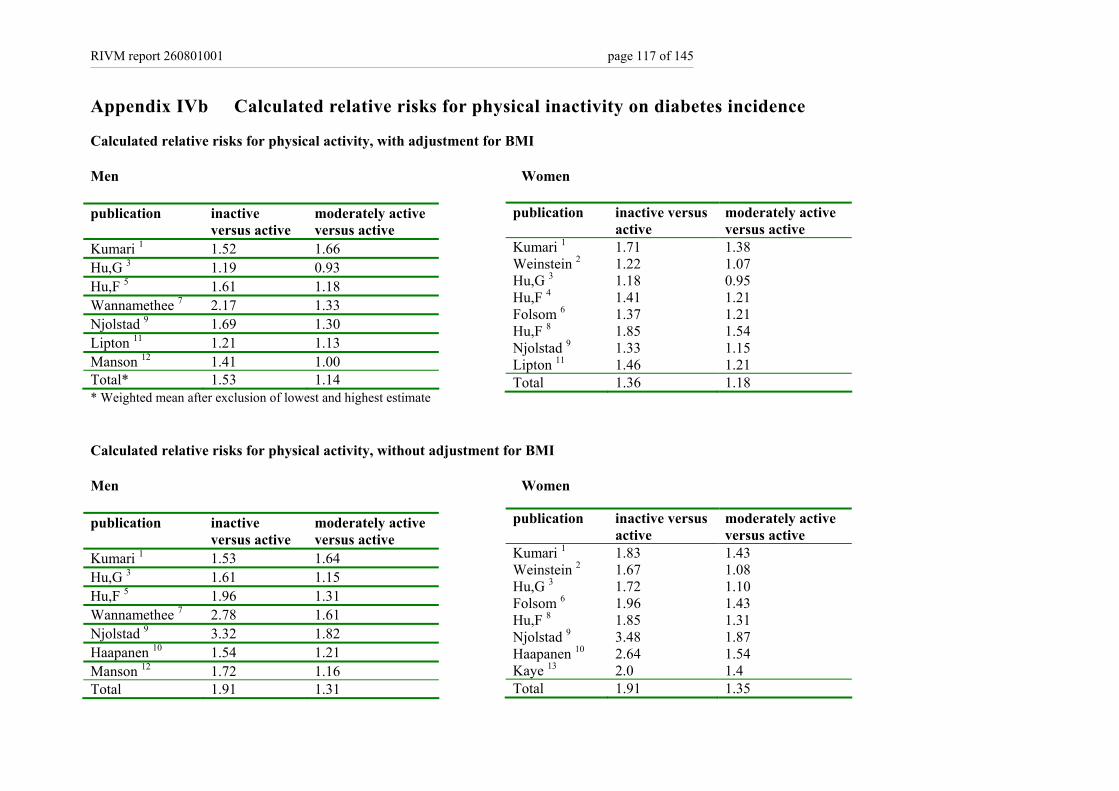
RIVM report 260801001 page 117 of 145
Appendix IVb Calculated relative risks for physical inactivity on diabetes incidence
Calculated relative risks for physical activity, with adjustment for BMI Men Women publication inactive
versus active moderately active versus active
Kumari 1 1.52 1.66 Hu,G 3 1.19 0.93 Hu,F 5 1.61 1.18 Wannamethee 7 2.17 1.33 Njolstad 9 1.69 1.30 Lipton 11 1.21 1.13 Manson 12 1.41 1.00 Total* 1.53 1.14 * Weighted mean after exclusion of lowest and highest estimate Calculated relative risks for physical activity, without adjustment for BMI Men Women publication inactive
versus active moderately active versus active
Kumari 1 1.53 1.64 Hu,G 3 1.61 1.15 Hu,F 5 1.96 1.31 Wannamethee 7 2.78 1.61 Njolstad 9 3.32 1.82 Haapanen 10 1.54 1.21 Manson 12 1.72 1.16 Total 1.91 1.31
publication inactive versus active
moderately active versus active
Kumari 1 1.71 1.38 Weinstein 2 1.22 1.07 Hu,G 3 1.18 0.95 Hu,F 4 1.41 1.21 Folsom 6 1.37 1.21 Hu,F 8 1.85 1.54 Njolstad 9 1.33 1.15 Lipton 11 1.46 1.21 Total 1.36 1.18
publication inactive versus active
moderately active versus active
Kumari 1 1.83 1.43 Weinstein 2 1.67 1.08 Hu,G 3 1.72 1.10 Folsom 6 1.96 1.43 Hu,F 8 1.85 1.31 Njolstad 9 3.48 1.87 Haapanen 10 2.64 1.54 Kaye 13 2.0 1.4 Total 1.91 1.35

page 118 of 145 RIVM report 260801001
References List 1. Kumari M, Head J, Marmot M. Prospective study of social and other risk factors for incidence of type 2 diabetes in the Whitehall II study . Arch Intern Med 2004;
164(17):1873-80. 2. Weinstein AR, Sesso HD, Lee IM et al. Relationship of physical activity vs body mass index with type 2 diabetes in women. JAMA 2004; 292(10):1188-94. 3. Hu G, Qiao Q, Silventoinen K et al. Occupational, commuting, and leisure-time physical activity in relation to risk for Type 2 diabetes in middle-aged Finnish men
and women. Diabetologia 2003; 46(3):322-9. 4. Hu FB, Manson JE, Stampfer MJ et al. Diet, lifestyle, and the risk of type 2 diabetes mellitus in women. N Engl J Med 2001; 345(11):790-7. 5. Hu FB, Leitzmann MF, Stampfer MJ, Colditz GA, Willett WC, Rimm EB. Physical activity and television watching in relation to risk for type 2 diabetes mellitus in
men. Arch Intern Med 2001; 161(12):1542-8. 6. Folsom AR, Kushi LH, Anderson KE et al. Associations of general and abdominal obesity with multiple health outcomes in older women: the Iowa Women's Health
Study. Arch Intern Med 2000; 160(14):2117-28. 7. Wannamethee SG, Shaper AG, Alberti KGMM. Physical activity, metabolic factors, and the incidence of coronary heart disease and type 2 diabetes. Arch Intern Med
2000; 160(14):2108-16. 8. Hu FB, Sigal RJ, Rich-Edwards JW et al. Walking compared with vigorous physical activity and risk of type 2 diabetes in women: a prospective study. JAMA 1999;
282(15):1433-9. 9. Njolstad I, Arnesen E, Lund-Larsen PG. Sex differences in risk factors for clinical diabetes mellitus in a general population: a 12 year follow-up of the Finnmark
Study. Am J Epidemiol 1998; 1998:49-58. 10. Haapanen N, Miilunpalo S, Vouori I, Oja P, Pasanen M. Association of leisure time physical activity with the risk of coronary heart disease, hypertension and diabetes
in middle-aged men and women. Int J Epidemiol 1997; 26:739-47. 11. Lipton RB, Liao Y, Cao G, Cooper RS, McGee D. Determinants of incident non-insulin-dependent diabetes mellitus among blacks and whites in a national sample.
The NHANES I epidemiologic follow-up study. Am J Epidemiol 1993; 138:826-39. 12. Manson HE, Nathan DM, Krolewski AS, Stampfer MJ, Willett WC, Hennekens CH. A prospective study of exercise and incidence of diabetes among US male
physicians. JAMA 1992; 268:63-7. 13. Kaye SA, Folsom AR, Sprafka JM, Prineas RJ, Wallace RB. Increased incidence of diabetes mellitus in relation to abdominal adiposity in older women. J Clin
Epidemiol 1991; 44:329-34.
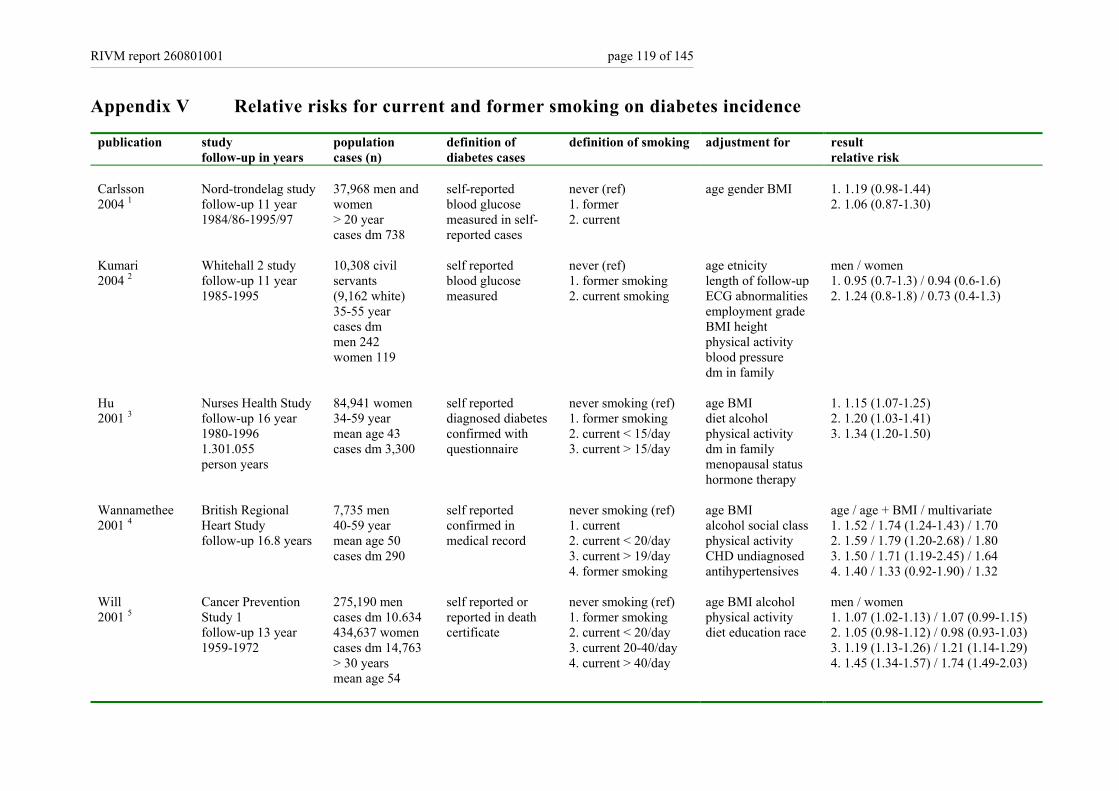
RIVM report 260801001 page 119 of 145
Appendix V Relative risks for current and former smoking on diabetes incidence
publication study follow-up in years
population cases (n)
definition of diabetes cases
definition of smoking adjustment for result relative risk
Carlsson 2004 1
Nord-trondelag study follow-up 11 year 1984/86-1995/97
37,968 men and women > 20 year cases dm 738
self-reported blood glucose measured in self-reported cases
never (ref) 1. former 2. current
age gender BMI 1. 1.19 (0.98-1.44) 2. 1.06 (0.87-1.30)
Kumari 2004 2
Whitehall 2 study follow-up 11 year 1985-1995
10,308 civil servants (9,162 white) 35-55 year cases dm men 242 women 119
self reported blood glucose measured
never (ref) 1. former smoking 2. current smoking
age etnicity length of follow-up ECG abnormalities employment grade BMI height physical activity blood pressure dm in family
men / women 1. 0.95 (0.7-1.3) / 0.94 (0.6-1.6) 2. 1.24 (0.8-1.8) / 0.73 (0.4-1.3)
Hu 2001 3
Nurses Health Study follow-up 16 year 1980-1996 1.301.055 person years
84,941 women 34-59 year mean age 43 cases dm 3,300
self reported diagnosed diabetes confirmed with questionnaire
never smoking (ref) 1. former smoking 2. current < 15/day 3. current > 15/day
age BMI diet alcohol physical activity dm in family menopausal status hormone therapy
1. 1.15 (1.07-1.25) 2. 1.20 (1.03-1.41) 3. 1.34 (1.20-1.50)
Wannamethee 2001 4
British Regional Heart Study follow-up 16.8 years
7,735 men 40-59 year mean age 50 cases dm 290
self reported confirmed in medical record
never smoking (ref) 1. current 2. current < 20/day 3. current > 19/day 4. former smoking
age BMI alcohol social class physical activity CHD undiagnosed antihypertensives
age / age + BMI / multivariate 1. 1.52 / 1.74 (1.24-1.43) / 1.70 2. 1.59 / 1.79 (1.20-2.68) / 1.80 3. 1.50 / 1.71 (1.19-2.45) / 1.64 4. 1.40 / 1.33 (0.92-1.90) / 1.32
Will 2001 5
Cancer Prevention Study 1 follow-up 13 year 1959-1972
275,190 men cases dm 10.634 434,637 women cases dm 14,763 > 30 years mean age 54
self reported or reported in death certificate
never smoking (ref) 1. former smoking 2. current < 20/day 3. current 20-40/day 4. current > 40/day
age BMI alcohol physical activity diet education race
men / women 1. 1.07 (1.02-1.13) / 1.07 (0.99-1.15) 2. 1.05 (0.98-1.12) / 0.98 (0.93-1.03) 3. 1.19 (1.13-1.26) / 1.21 (1.14-1.29) 4. 1.45 (1.34-1.57) / 1.74 (1.49-2.03)
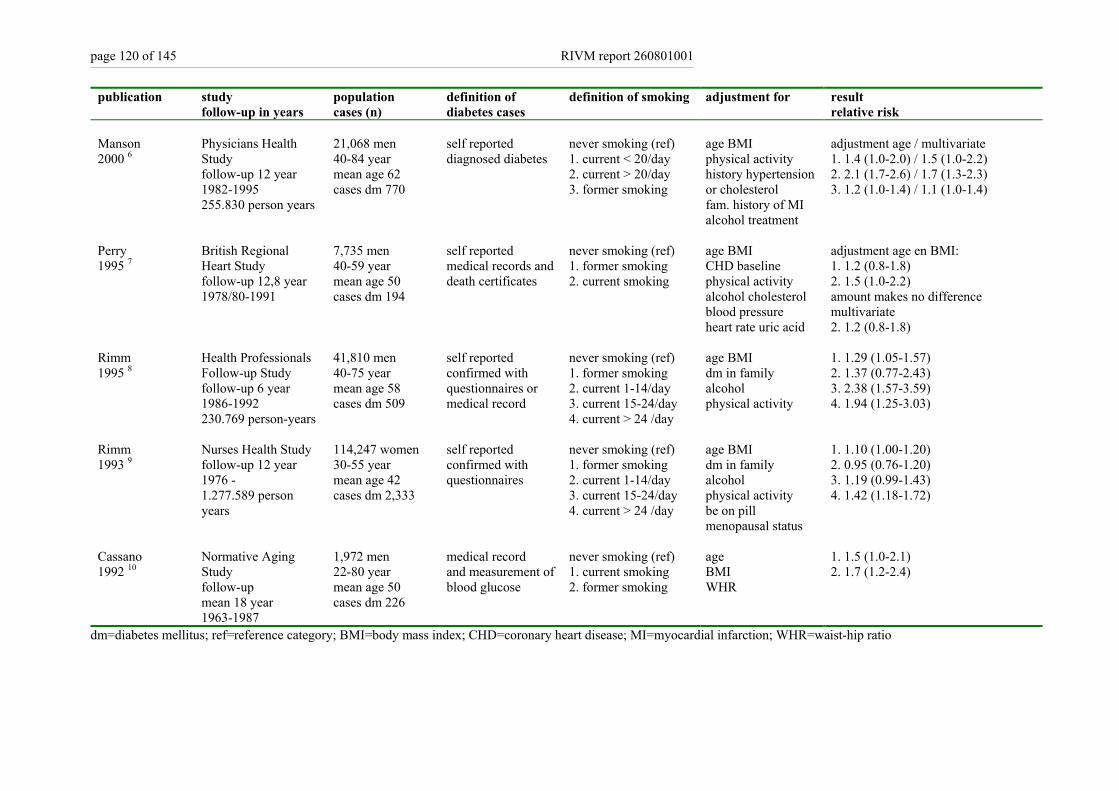
page 120 of 145 RIVM report 260801001
publication study follow-up in years
population cases (n)
definition of diabetes cases
definition of smoking adjustment for result relative risk
Manson 2000 6
Physicians Health Study follow-up 12 year 1982-1995 255.830 person years
21,068 men 40-84 year mean age 62 cases dm 770
self reported diagnosed diabetes
never smoking (ref) 1. current < 20/day 2. current > 20/day 3. former smoking
age BMI physical activity history hypertension or cholesterol fam. history of MI alcohol treatment
adjustment age / multivariate 1. 1.4 (1.0-2.0) / 1.5 (1.0-2.2) 2. 2.1 (1.7-2.6) / 1.7 (1.3-2.3) 3. 1.2 (1.0-1.4) / 1.1 (1.0-1.4)
Perry 1995 7
British Regional Heart Study follow-up 12,8 year 1978/80-1991
7,735 men 40-59 year mean age 50 cases dm 194
self reported medical records and death certificates
never smoking (ref) 1. former smoking 2. current smoking
age BMI CHD baseline physical activity alcohol cholesterol blood pressure heart rate uric acid
adjustment age en BMI: 1. 1.2 (0.8-1.8) 2. 1.5 (1.0-2.2) amount makes no difference multivariate 2. 1.2 (0.8-1.8)
Rimm 1995 8
Health Professionals Follow-up Study follow-up 6 year 1986-1992 230.769 person-years
41,810 men 40-75 year mean age 58 cases dm 509
self reported confirmed with questionnaires or medical record
never smoking (ref) 1. former smoking 2. current 1-14/day 3. current 15-24/day 4. current > 24 /day
age BMI dm in family alcohol physical activity
1. 1.29 (1.05-1.57) 2. 1.37 (0.77-2.43) 3. 2.38 (1.57-3.59) 4. 1.94 (1.25-3.03)
Rimm 1993 9
Nurses Health Study follow-up 12 year 1976 - 1.277.589 person years
114,247 women 30-55 year mean age 42 cases dm 2,333
self reported confirmed with questionnaires
never smoking (ref) 1. former smoking 2. current 1-14/day 3. current 15-24/day 4. current > 24 /day
age BMI dm in family alcohol physical activity be on pill menopausal status
1. 1.10 (1.00-1.20) 2. 0.95 (0.76-1.20) 3. 1.19 (0.99-1.43) 4. 1.42 (1.18-1.72)
Cassano 1992 10
Normative Aging Study follow-up mean 18 year 1963-1987
1,972 men 22-80 year mean age 50 cases dm 226
medical record and measurement of blood glucose
never smoking (ref) 1. current smoking 2. former smoking
age BMI WHR
1. 1.5 (1.0-2.1) 2. 1.7 (1.2-2.4)
dm=diabetes mellitus; ref=reference category; BMI=body mass index; CHD=coronary heart disease; MI=myocardial infarction; WHR=waist-hip ratio
RIVM report 260801001 page 121 of 145
References List 1. Carlsson S, Midthjell K, Grill V. Smoking is associated with an increased risk of type 2 diabetes but a decreased risk of autoimmune diabetes in adults: an 11-year
follow-up of incidence of diabetes in the Nord-Trondelag study. Diabetologia 2004; 47(11):1953-6. 2. Kumari M, Head J, Marmot M. Prospective study of social and other risk factors for incidence of type 2 diabetes in the Whitehall II study . Arch Intern Med 2004;
164(17):1873-80. 3. Hu FB, Manson JE, Stampfer MJ et al. Diet, lifestyle, and the risk of type 2 diabetes mellitus in women. N Engl J Med 2001; 345(11):790-7. 4. Wannamethee SG, Shaper AG, Perry IJ. Smoking as a modifiable risk factor for type 2 diabetes in middle-aged men. Diabetes Care 2001; 24(9):1590-5. 5. Will JC, Galuska DA, Ford ES, Mokdad A, Calle EE. Cigarette smoking and diabetes mellitus: evidence of a positive association from a large prospective cohort
study. Int J Epidemiol 2001; 30(3):540-6. 6. Manson JE, Ajani UA, Liu S, Nathan DM, Hennekens CH. A prospective study of cigarette smoking and the incidence of diabetes mellitus among US male
physicians. Am J Med 2000; 109(7):538-42. 7. Perry IJ, Wannamethee SG, Walker MK, Thomson AG, Whincup PH, Shaper AG. Prospective study of risk factors for development of non-insulin dependent diabetes
in middle aged British men. BMJ 1995; 310(6979):560-4. 8. Rimm EB, Chan J, Stampfer MJ, Colditz GA, Willett WC. Prospective study of cigarette smoking, alcohol use, and the risk of diabetes in men. BMJ 1995;
310(6979):555-9. 9. Rimm EB, Manson JE, Stampfer MJ, et al. Cigarette smoking and the risk of diabetes in women. Am J Public Health 1993; 83:211-4. 10. Cassano PA, Rosner B, Vokonas PS, Weiss ST. Obesity and body fat distribution in relation to the incidence of non-insulin-dependent diabetes mellitus. A prospective
cohort study of men in the normative aging study. Am J Epidemiol 1992; 136( 12):1474-86.

page 122 of 145 RIVM report 260801001
Appendix VI Relative risks for alcohol consumption on diabetes incidence
publication study follow-up in years
population definition of diabetes cases
classification of alcohol consumption
confounders result relative risks
Carlsson 2003 1
Finnish Twin Cohort Study follow-up 20 year 445,930 person-years 1975-1995
22,778 men and women >17 year mean age 34 cases dm 580
hospital record or prescribed medication
<5.0 gram/day (ref) 1. no alcohol men 2. no alcohol women 3: 5.0-29.9 men 4: 5.0-19.9 women 5: >29.9 men 6: >19.9 women
age BMI
1. 1.1 (0.7-1.5) 2. 1.1 (0.9-1.5) 3. 0.8 (0.6-1.1) 4. 0.7 (0.4-1.1) 5. 0.9 (0.6-1.4) 6. 1.6 (0.8-3.5)
Wannamethee 2003 2
Nurses Health study II follow-up 10 year 1989-1999
109,690 women 25-42 year cases dm 935
self reported confirmed with additional questionnaire
no alcohol (ref) 1. 0.1 - 4.9 gram/day 2. 5.0 - 14.9 gram/day 3. 15.0-29.9 gram/day 4. > 30.0 gram/day
age BMI smoking physical activity dm in family blood pressure cholesterol be on pill
1. 0.80 (0.66 - 0.96) 2. 0.67 (0.50 - 0.89) 3. 0.42 (0.20 - 0.90) 4. 0.78 (0.34 - 1.78)
Meisinger 2002 3
Monica Augsburg Cohort study follow-up 8 year 1984/1995-1998
3,052 men cases dm 128 3,114 women cases dm 85 35-74 year mean age 51
self reported diabetes or medication
gram/day men 0.1-39.9 (ref) women 0.1-19.9 (ref) 1. no alcohol men 2. no alcohol women 3. > 39.9 men 4. > 19.9 women
age BMI smoking uric acid physical activity dm in family blood pressure cholesterol
age en BMI 1. 1.59 (0.96-2.63) 2. 1.51 (0.92-2.47) 3. 2.06 (1.39-3.04) 4. 0.94 (0.46-1.91) multivariate 3: 1.95 (1.30-2.91) 4. not significant
Wannamethee 2002 4
British Regional Heart Study follow-up 17 year 1978/80-1995
5,221 men 40-59 year cases dm 198
self reported medical record death certificate
incidental (ref) 1. no alcohol 2. 1-15 drinks/week 3. 15-42 drinks/week 4. >42 drinks/week
age, BMI physical activity smoking SES CHD
age /multivariate: 1. 1.12 (0.62-2.03) /1.10 (0.61-2.00) 2. 0.75 (0.52-1.09) /0.81 (0.55-1.20) 3. 0.73 (0.49-1.08) /0.66 (0.44-0.99) 4. 1.27 (0.81-1.99) /0.96 (0.60-1.52)
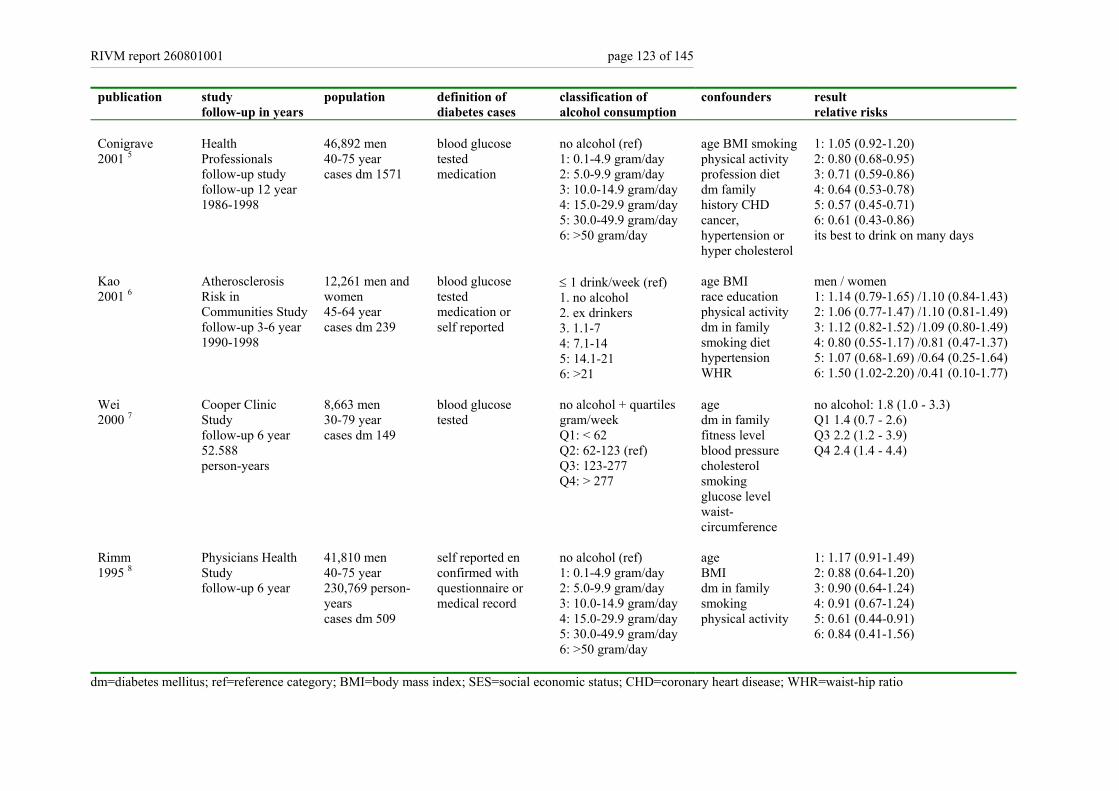
RIVM report 260801001 page 123 of 145
publication study follow-up in years
population definition of diabetes cases
classification of alcohol consumption
confounders result relative risks
Conigrave 2001 5
Health Professionals follow-up study follow-up 12 year 1986-1998
46,892 men 40-75 year cases dm 1571
blood glucose tested medication
no alcohol (ref) 1: 0.1-4.9 gram/day 2: 5.0-9.9 gram/day 3: 10.0-14.9 gram/day 4: 15.0-29.9 gram/day 5: 30.0-49.9 gram/day 6: >50 gram/day
age BMI smoking physical activity profession diet dm family history CHD cancer, hypertension or hyper cholesterol
1: 1.05 (0.92-1.20) 2: 0.80 (0.68-0.95) 3: 0.71 (0.59-0.86) 4: 0.64 (0.53-0.78) 5: 0.57 (0.45-0.71) 6: 0.61 (0.43-0.86) its best to drink on many days
Kao 2001 6
Atherosclerosis Risk in Communities Study follow-up 3-6 year 1990-1998
12,261 men and women 45-64 year cases dm 239
blood glucose tested medication or self reported
≤ 1 drink/week (ref) 1. no alcohol 2. ex drinkers 3. 1.1-7 4: 7.1-14 5: 14.1-21 6: >21
age BMI race education physical activity dm in family smoking diet hypertension WHR
men / women 1: 1.14 (0.79-1.65) /1.10 (0.84-1.43) 2: 1.06 (0.77-1.47) /1.10 (0.81-1.49) 3: 1.12 (0.82-1.52) /1.09 (0.80-1.49) 4: 0.80 (0.55-1.17) /0.81 (0.47-1.37) 5: 1.07 (0.68-1.69) /0.64 (0.25-1.64) 6: 1.50 (1.02-2.20) /0.41 (0.10-1.77)
Wei 2000 7
Cooper Clinic Study follow-up 6 year 52.588 person-years
8,663 men 30-79 year cases dm 149
blood glucose tested
no alcohol + quartiles gram/week Q1: < 62 Q2: 62-123 (ref) Q3: 123-277 Q4: > 277
age dm in family fitness level blood pressure cholesterol smoking glucose level waist- circumference
no alcohol: 1.8 (1.0 - 3.3) Q1 1.4 (0.7 - 2.6) Q3 2.2 (1.2 - 3.9) Q4 2.4 (1.4 - 4.4)
Rimm 1995 8
Physicians Health Study follow-up 6 year
41,810 men 40-75 year 230,769 person-years cases dm 509
self reported en confirmed with questionnaire or medical record
no alcohol (ref) 1: 0.1-4.9 gram/day 2: 5.0-9.9 gram/day 3: 10.0-14.9 gram/day 4: 15.0-29.9 gram/day 5: 30.0-49.9 gram/day 6: >50 gram/day
age BMI dm in family smoking physical activity
1: 1.17 (0.91-1.49) 2: 0.88 (0.64-1.20) 3: 0.90 (0.64-1.24) 4: 0.91 (0.67-1.24) 5: 0.61 (0.44-0.91) 6: 0.84 (0.41-1.56)
dm=diabetes mellitus; ref=reference category; BMI=body mass index; SES=social economic status; CHD=coronary heart disease; WHR=waist-hip ratio
page 124 of 145 RIVM report 260801001
References List
1. Carlsson S, Hammar N, Grill V, Kaprio J. Alcohol consumption and the incidence of type 2 diabetes: a 20-year follow-up of the Finnish twin cohort study. Diabetes Care 2003; 26(10):2785-90.
2. Wannamethee SG, Camargo CA Yr, Manson JE, Willett WC, Rimm EB. Alcohol drinking patterns and risk of type 2 diabetes mellitus among younger women. Arch Intern Med 2003; 163(11):1329-36.
3. Meisinger C, Thorand B, Schneider A, Stieber J, Doring A, Lowel H. Sex differences in risk factors for incident type 2 diabetes mellitus: the MONICA Augsburg cohort study. Arch Intern Med 2002; 162(1):82-9.
4. Wannamethee SG, Shaper AG, Perry IJ, Alberti KG. Alcohol consumption and the incidence of type II diabetes. J Epidemiol Community Health 2002; 56(7):542-8. 5. Conigrave KM, Hu BF, Camargo CA Yr, Stampfer MJ, Willett WC, Rimm EB. A prospective study of drinking patterns in relation to risk of type 2 diabetes among
men. Diabetes 2001; 50(10):2390-5. 6. Kao WH, Puddey IB, Boland LL, Watson RL, Brancati FL. Alcohol consumption and the risk of type 2 diabetes mellitus: atherosclerosis risk in communities study.
Am J Epidemiol 2001; 154(8):748-57. 7. Wei M, Gibbons LW, Mitchell TL, Kampert JB, Blair SN. Alcohol intake and incidence of type 2 diabetes in men. Diabetes Care 2000; 23(1):18-22.
8. Rimm EB, Chan J, Stampfer MJ, Colditz GA, Willett WC. Prospective study of cigarette smoking, alcohol use, and the risk of diabetes in men. BMJ 1995; 310(6979):555-9.

RIVM report 260801001 page 125 of 145
Appendix VIIa Lifestyle interventions and prevention of diabetes incidence
Study and year of publication Duration of follow-up
Inclusion criteria
Population characteristics at baseline
Intervention (number of participants)
Change in weight or BMI
Change in blood glucose
Incident diabetes
Risk reduction
SLIM 2003 1,2
Follow-up 2 year (planned follow-up 6 years)
> 40 year BMI >25 or dm in family IGT
64% ♂ mean age 57 mean BMI 29 kg/m2
Intensive lifestyle (51) Lifestyle (51)
BMI -0.8* BMI +0.0
HbA1c +0.0 HbA1c -0.1
-- --
Diabetes Prevention Program 2002 3 Follow-up 3 years
>25 year BMI>24 IGT
32% ♂ mean age 51 year mean BMI 34 kg/m2
Intensive lifestyle (1079) Lifestyle+metformin (1073) Lifestyle+placebo (1082)
-5.6 kg* -2.1 kg* -0.1 kg
HbA1c +0.1* HbA1c +0.05* HbA1c +0.2
4.8/100 py* 7.8/100 py* 11.0/100 py
58% (51%)*4 31% (24%)* ref
Diabetes Prevention Study 2001 4 Follow-up 3 years
40-65 year BMI>25 IGT
33% ♂ mean age 55 year mean BMI 31 kg/m2
Intensive lifestyle (265) Lifestyle (257)
BMI -1.3* BMI -0.3
HbA1c -0.2* HbA1c -0.0
3.2/100 py* 7.8/100 py
58%* ref
Oslo Diet and Exercise Study (ODES) 1997 5 Follow-up 1 year
40 year BMI>24
♂ + ♀ mean age 40 mean BMI 29
Diet+physical activity (65) Diet (52) Physical activity (49) Control (43)
BMI -3.7* BMI -1.3 BMI -0.3 BMI +0.4
FPG -0.3* FPG -0.2* FPG -0.1 FPG 0.0
-- -- -- --
Fasting hyperglycemia study 1997 6 Follow-up 1 year
IFG
41% ♂ dm 23% mean age 50 year mean BMI 29 kg/m2
Intensive lifestyle (111) Lifestyle (116)
-0.4 kg -0.2 kg
HbA1c –0.1 HbA1c -0.1
n=-1 n=0
Malmo feasibility study 1991 7 Follow-up 5 years
men 47-49 year IGT5
100% ♂ mean age 48 mean BMI 27 kg/m2
Intensive lifestyle (181) Regular care (161)
BMI -2.3* BMI +0.5
2h-PG -13%* 2h-PG +3%
10.6%* 28.6%
63%* ref
SLIM=Study on lifestyle-intervention and impaired glucose tolerance Maastricht; BMI=body mass index; dm=diabetes mellitus; IGT=impaired glucose tolerance; IFG=impaired fasting glucose; py=person years; ref=reference group * significant difference between groups
4 between parenthesis are results for white participants 5 results presented for subgroup with IGT at baseline (81%)
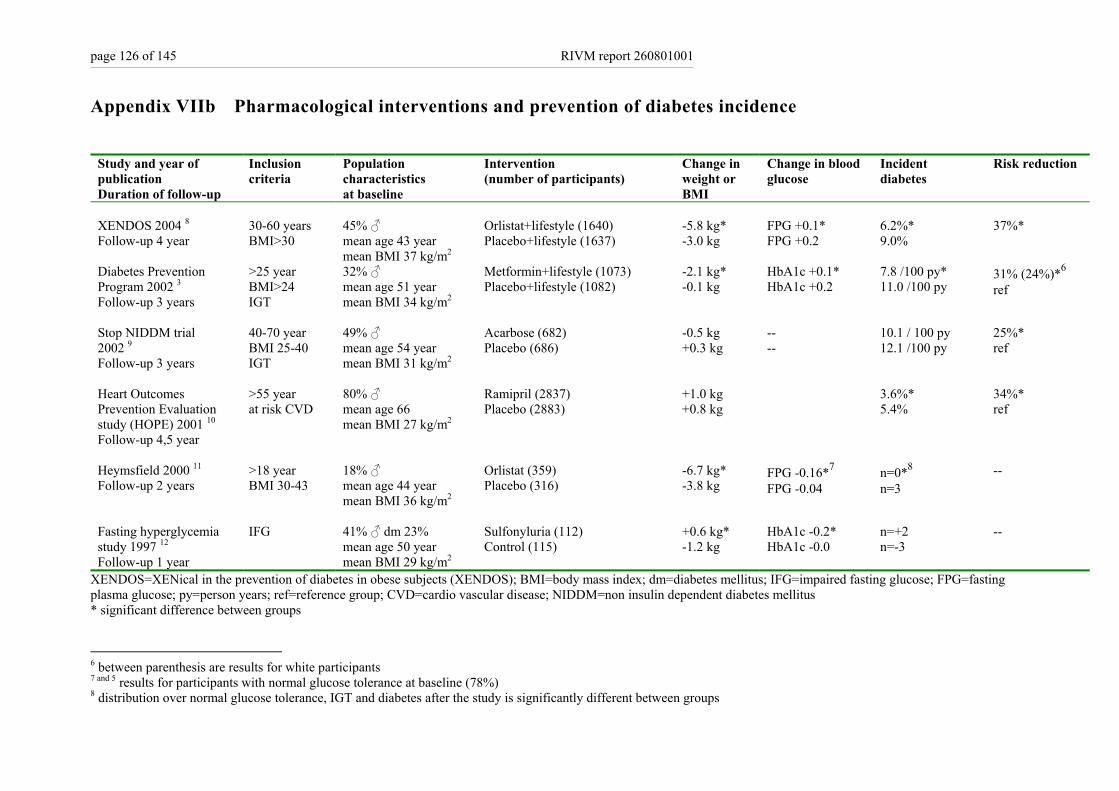
page 126 of 145 RIVM report 260801001
Appendix VIIb Pharmacological interventions and prevention of diabetes incidence
Study and year of publication Duration of follow-up
Inclusion criteria
Population characteristics at baseline
Intervention (number of participants)
Change in weight or BMI
Change in blood glucose
Incident diabetes
Risk reduction
XENDOS 2004 8 Follow-up 4 year
30-60 years BMI>30
45% ♂ mean age 43 year mean BMI 37 kg/m2
Orlistat+lifestyle (1640) Placebo+lifestyle (1637)
-5.8 kg* -3.0 kg
FPG +0.1* FPG +0.2
6.2%* 9.0%
37%*
Diabetes Prevention Program 2002 3 Follow-up 3 years
>25 year BMI>24 IGT
32% ♂ mean age 51 year mean BMI 34 kg/m2
Metformin+lifestyle (1073) Placebo+lifestyle (1082)
-2.1 kg* -0.1 kg
HbA1c +0.1* HbA1c +0.2
7.8 /100 py* 11.0 /100 py
31% (24%)*6 ref
Stop NIDDM trial 2002 9 Follow-up 3 years
40-70 year BMI 25-40 IGT
49% ♂ mean age 54 year mean BMI 31 kg/m2
Acarbose (682) Placebo (686)
-0.5 kg +0.3 kg
-- --
10.1 / 100 py 12.1 /100 py
25%* ref
Heart Outcomes Prevention Evaluation study (HOPE) 2001 10 Follow-up 4,5 year
>55 year at risk CVD
80% ♂ mean age 66 mean BMI 27 kg/m2
Ramipril (2837) Placebo (2883)
+1.0 kg +0.8 kg
3.6%* 5.4%
34%* ref
Heymsfield 2000 11 Follow-up 2 years
>18 year BMI 30-43
18% ♂ mean age 44 year mean BMI 36 kg/m2
Orlistat (359) Placebo (316)
-6.7 kg* -3.8 kg
FPG -0.16*7 FPG -0.04
n=0*8 n=3
--
Fasting hyperglycemia study 1997 12 Follow-up 1 year
IFG
41% ♂ dm 23% mean age 50 year mean BMI 29 kg/m2
Sulfonyluria (112) Control (115)
+0.6 kg* -1.2 kg
HbA1c -0.2* HbA1c -0.0
n=+2 n=-3
--
XENDOS=XENical in the prevention of diabetes in obese subjects (XENDOS); BMI=body mass index; dm=diabetes mellitus; IFG=impaired fasting glucose; FPG=fasting plasma glucose; py=person years; ref=reference group; CVD=cardio vascular disease; NIDDM=non insulin dependent diabetes mellitus * significant difference between groups
6 between parenthesis are results for white participants 7 and 5 results for participants with normal glucose tolerance at baseline (78%) 8 distribution over normal glucose tolerance, IGT and diabetes after the study is significantly different between groups
RIVM report 260801001 page 127 of 145
References List 1. Mensink M, Feskens EJ, Saris WH, De Bruin TW, Blaak EE. Study on Lifestyle Intervention and Impaired Glucose Tolerance Maastricht (SLIM): preliminary results
after one year. Int J Obes Relat Metab Disord 2003; 27(3):377-84. 2. Mensink M, Blaak EE, Corpeleijn E, Saris WH, de Bruin TW, Feskens EJ. Lifestyle intervention according to general recommendations improves glucose tolerance.
Obes Res 2003; 11(12):1588-96. 3. Diabetes Prevention Program Research Group , Knowler WC, Barrett-Connor E et al. Reduction in the incidence of type 2 diabetes with lifestyle intervention or
metformin. N Engl J Med 2002; 346(6):393-403. 4. Lindstrom J, Louheranta A, Mannelin M et al. The Finnish Diabetes Prevention Study (DPS): Lifestyle intervention and 3-year results on diet and physical activity.
Diabetes Care 2003; 26(12):3230-6. 5. Torjesen P, Birkeland K, Anderssen S, Hjerman I, Holme I, Urdal P. Lifestyle changes may reverse development of the insulin resistance syndrome. Diabetes Care
1997; 20:26-31. 6. Dyson PA, Hammersley MS, Morris RJ, Holman RR, Turner RC, on behalf of the Fasting Hyperglycaemia Study Group. The Fasting Hyperglycaemia Study: II.
Randomized controlled trial of reinforced healthy-living advice in subjects with increased but not diabetic fasting plasma glucose. Metabolism 1997; 46(12 Suppl 1):50-5.
7. Eriksson KF, Lindgärde F. Prevention of type 2 (non-insulin-dependent) diabetes mellitus by diet and physical exercise. Diabetologia 1991; 34:891-8. 8. Torgerson JS, Hauptman J, Boldrin MN, Sjostrom L. XENical in the prevention of diabetes in obese subjects (XENDOS) study: a randomized study of orlistat as an
adjunct to lifestyle changes for the prevention of type 2 diabetes in obese patients. Diabetes Care 2004; 27(1):155-61. 9. Chiasson JL, Josse RG, Gomis R, Hanefeld M, Karasik A, Laakso M. Acarbose for prevention of type 2 diabetes mellitus: the STOP-NIDDM randomised trial. Lancet
2002; 359(9323):2072-7. 10. Yusuf S, Gerstein H, Hoogwerf B et al. Ramipril and the development of diabetes. JAMA 2001; 286(15):1882-5. 11. Heymsfield SB, Segal KR, Hauptman J et al. Effects of weight loss with orlistat on glucose tolerance and progression to type 2 diabetes in obese adults. Arch Intern
Med 2000; 160(9):1321-6. 12. Karunakaran S, Hammersley MS, Morris RJ, Turner RC, Holman RR. The Fasting Hyperglycaemia Study: III. Randomized controlled trial of sulfonylurea therapy in
subjects with increased but not diabetic fasting plasma glucose. Metabolism 1997; 46(12 Suppl 1):56-60.
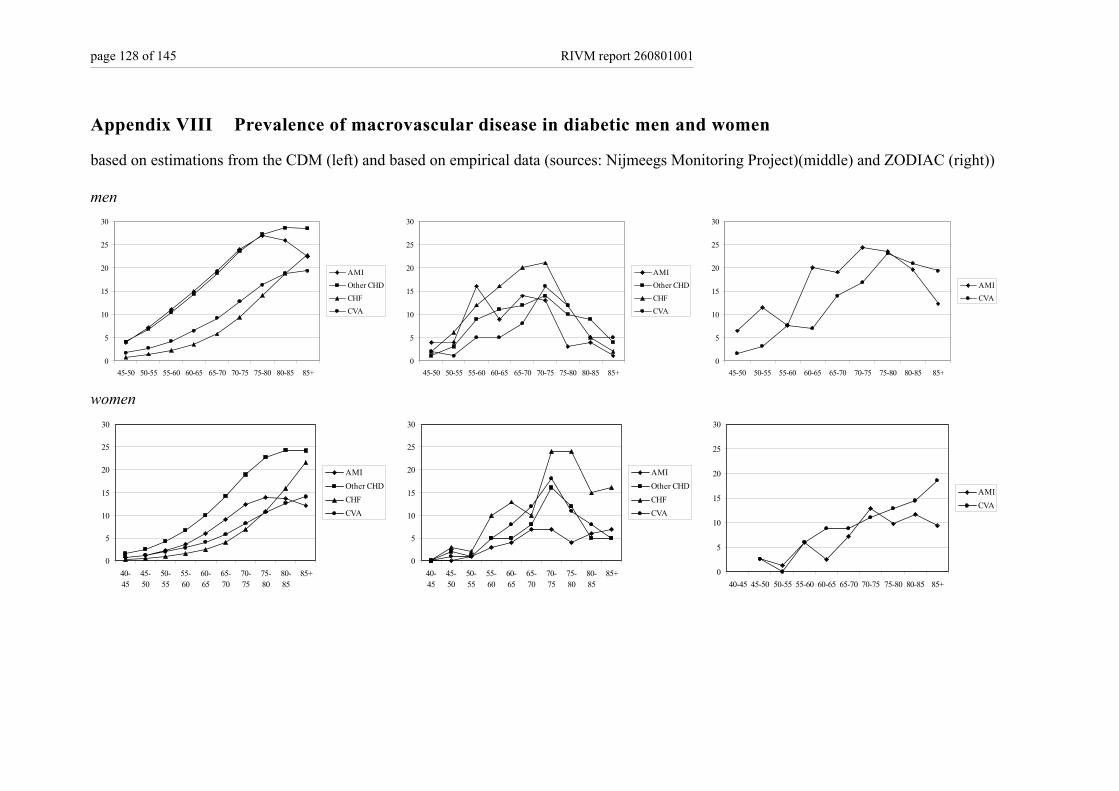
page 128 of 145 RIVM report 260801001
Appendix VIII Prevalence of macrovascular disease in diabetic men and women
based on estimations from the CDM (left) and based on empirical data (sources: Nijmeegs Monitoring Project)(middle) and ZODIAC (right)) men
0
5
10
15
20
25
30
45-50 50-55 55-60 60-65 65-70 70-75 75-80 80-85 85+
AMIOther CHDCHFCVA
0
5
10
15
20
25
30
45-50 50-55 55-60 60-65 65-70 70-75 75-80 80-85 85+
AMIOther CHDCHFCVA
0
5
10
15
20
25
30
45-50 50-55 55-60 60-65 65-70 70-75 75-80 80-85 85+
AMICVA
women
0
5
10
15
20
25
30
40-45
45-50
50-55
55-60
60-65
65-70
70-75
75-80
80-85
85+
AMIOther CHDCHFCVA
0
5
10
15
20
25
30
40-45
45-50
50-55
55-60
60-65
65-70
70-75
75-80
80-85
85+
AMIOther CHDCHFCVA
0
5
10
15
20
25
30
40-45 45-50 50-55 55-60 60-65 65-70 70-75 75-80 80-85 85+
AMICVA
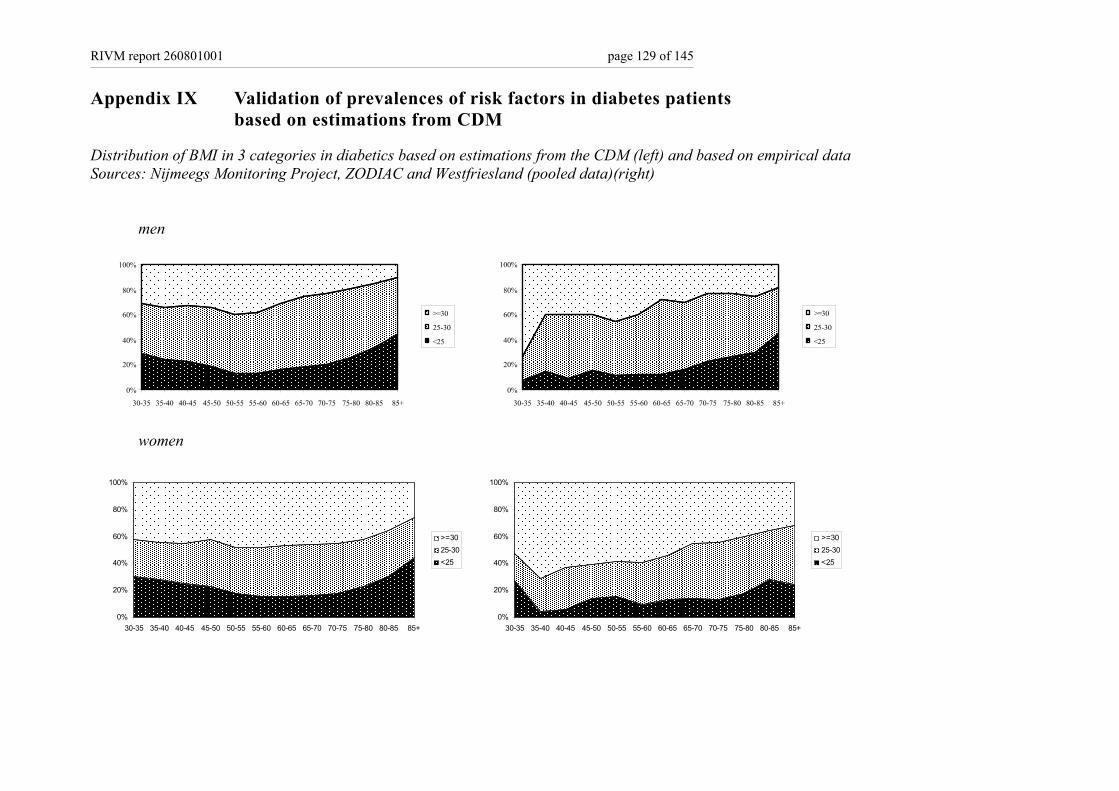
RIVM report 260801001 page 129 of 145
Appendix IX Validation of prevalences of risk factors in diabetes patients based on estimations from CDM
Distribution of BMI in 3 categories in diabetics based on estimations from the CDM (left) and based on empirical data Sources: Nijmeegs Monitoring Project, ZODIAC and Westfriesland (pooled data)(right)
men
0%
20%
40%
60%
80%
100%
30-35 35-40 40-45 45-50 50-55 55-60 60-65 65-70 70-75 75-80 80-85 85+
>=30
25-30
<25
0%
20%
40%
60%
80%
100%
30-35 35-40 40-45 45-50 50-55 55-60 60-65 65-70 70-75 75-80 80-85 85+
>=30
25-30
<25
women
0%
20%
40%
60%
80%
100%
30-35 35-40 40-45 45-50 50-55 55-60 60-65 65-70 70-75 75-80 80-85 85+
>=3025-30<25
0%
20%
40%
60%
80%
100%
30-35 35-40 40-45 45-50 50-55 55-60 60-65 65-70 70-75 75-80 80-85 85+
>=3025-30<25
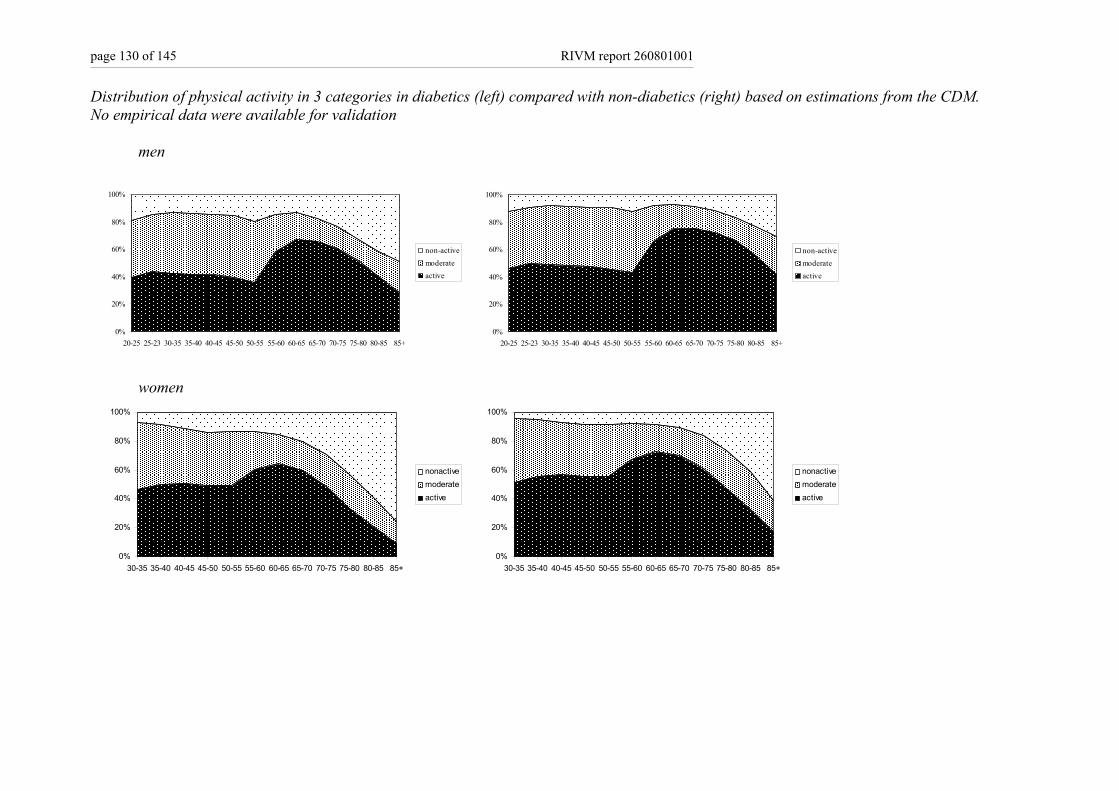
page 130 of 145 RIVM report 260801001
Distribution of physical activity in 3 categories in diabetics (left) compared with non-diabetics (right) based on estimations from the CDM. No empirical data were available for validation
men
0%
20%
40%
60%
80%
100%
20-25 25-23 30-35 35-40 40-45 45-50 50-55 55-60 60-65 65-70 70-75 75-80 80-85 85+
non-activemoderateactive
0%
20%
40%
60%
80%
100%
20-25 25-23 30-35 35-40 40-45 45-50 50-55 55-60 60-65 65-70 70-75 75-80 80-85 85+
non-activemoderateactive
women
0%
20%
40%
60%
80%
100%
30-35 35-40 40-45 45-50 50-55 55-60 60-65 65-70 70-75 75-80 80-85 85+
nonactivemoderateactive
0%
20%
40%
60%
80%
100%
30-35 35-40 40-45 45-50 50-55 55-60 60-65 65-70 70-75 75-80 80-85 85+
nonactivemoderateactive
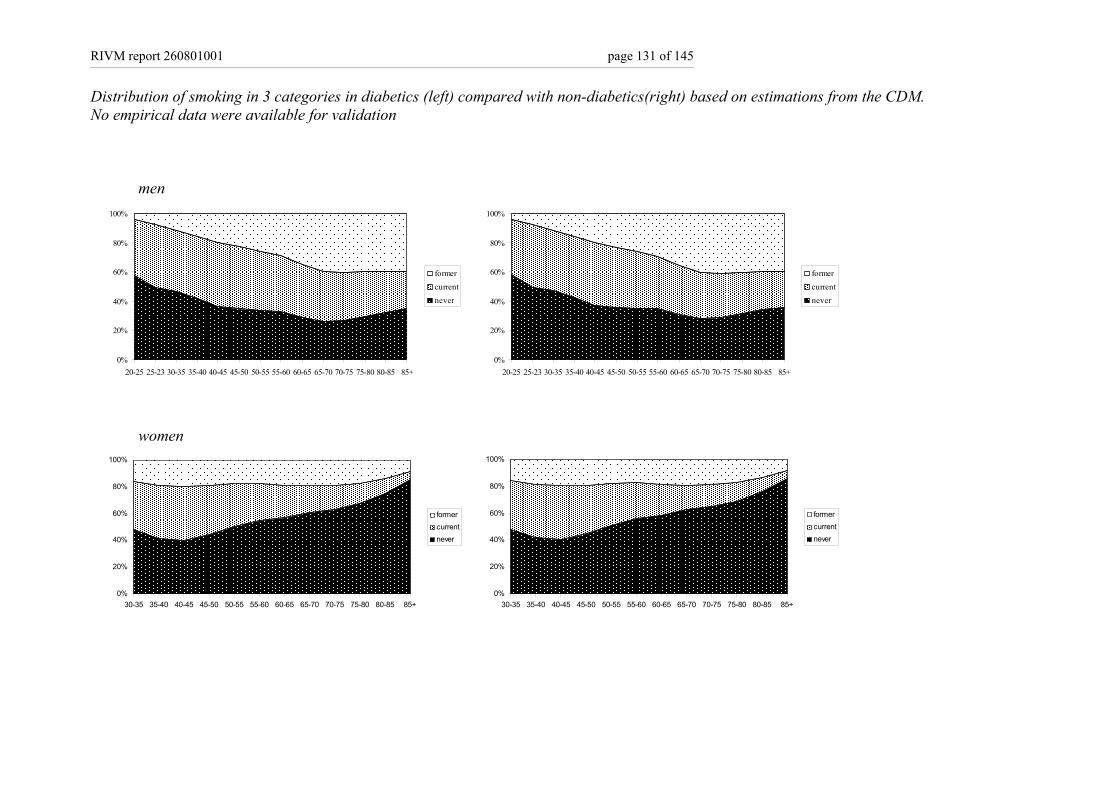
RIVM report 260801001 page 131 of 145
Distribution of smoking in 3 categories in diabetics (left) compared with non-diabetics(right) based on estimations from the CDM. No empirical data were available for validation
men
0%
20%
40%
60%
80%
100%
20-25 25-23 30-35 35-40 40-45 45-50 50-55 55-60 60-65 65-70 70-75 75-80 80-85 85+
formercurrentnever
0%
20%
40%
60%
80%
100%
20-25 25-23 30-35 35-40 40-45 45-50 50-55 55-60 60-65 65-70 70-75 75-80 80-85 85+
formercurrentnever
women
0%
20%
40%
60%
80%
100%
30-35 35-40 40-45 45-50 50-55 55-60 60-65 65-70 70-75 75-80 80-85 85+
formercurrentnever
0%
20%
40%
60%
80%
100%
30-35 35-40 40-45 45-50 50-55 55-60 60-65 65-70 70-75 75-80 80-85 85+
formercurrentnever
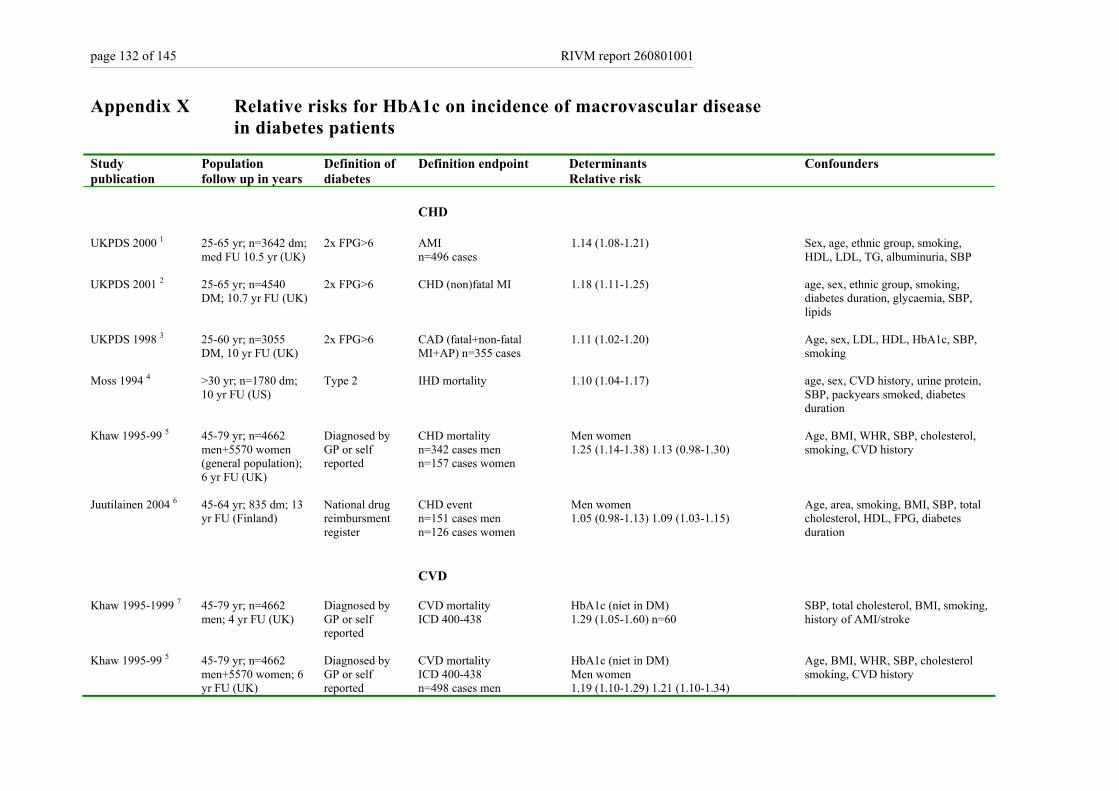
page 132 of 145 RIVM report 260801001
Appendix X Relative risks for HbA1c on incidence of macrovascular disease in diabetes patients
Study publication
Population follow up in years
Definition of diabetes
Definition endpoint Determinants Relative risk
Confounders
CHD
UKPDS 2000 1 25-65 yr; n=3642 dm; med FU 10.5 yr (UK)
2x FPG>6 AMI n=496 cases
1.14 (1.08-1.21) Sex, age, ethnic group, smoking, HDL, LDL, TG, albuminuria, SBP
UKPDS 2001 2 25-65 yr; n=4540 DM; 10.7 yr FU (UK)
2x FPG>6 CHD (non)fatal MI
1.18 (1.11-1.25) age, sex, ethnic group, smoking, diabetes duration, glycaemia, SBP, lipids
UKPDS 1998 3 25-60 yr; n=3055 DM, 10 yr FU (UK)
2x FPG>6 CAD (fatal+non-fatal MI+AP) n=355 cases
1.11 (1.02-1.20)
Age, sex, LDL, HDL, HbA1c, SBP, smoking
Moss 1994 4 >30 yr; n=1780 dm; 10 yr FU (US)
Type 2 IHD mortality 1.10 (1.04-1.17) age, sex, CVD history, urine protein, SBP, packyears smoked, diabetes duration
Khaw 1995-99 5 45-79 yr; n=4662 men+5570 women (general population); 6 yr FU (UK)
Diagnosed by GP or self reported
CHD mortality n=342 cases men n=157 cases women
Men women 1.25 (1.14-1.38) 1.13 (0.98-1.30)
Age, BMI, WHR, SBP, cholesterol, smoking, CVD history
Juutilainen 2004 6
45-64 yr; 835 dm; 13 yr FU (Finland)
National drug reimbursment register
CHD event n=151 cases men n=126 cases women
Men women 1.05 (0.98-1.13) 1.09 (1.03-1.15)
Age, area, smoking, BMI, SBP, total cholesterol, HDL, FPG, diabetes duration
CVD
Khaw 1995-1999 7 45-79 yr; n=4662 men; 4 yr FU (UK)
Diagnosed by GP or self reported
CVD mortality ICD 400-438
HbA1c (niet in DM) 1.29 (1.05-1.60) n=60
SBP, total cholesterol, BMI, smoking, history of AMI/stroke
Khaw 1995-99 5
45-79 yr; n=4662 men+5570 women; 6 yr FU (UK)
Diagnosed by GP or self reported
CVD mortality ICD 400-438 n=498 cases men
HbA1c (niet in DM) Men women 1.19 (1.10-1.29) 1.21 (1.10-1.34)
Age, BMI, WHR, SBP, cholesterol smoking, CVD history

RIVM report 260801001 page 133 of 145
Study publication
Population follow up in years
Definition of diabetes
Definition endpoint Determinants Relative risk
Confounders
n=273 cases women
Hoorn study 1999 8 50-75 yr; n=2363; 8 yr FU (NL)
OGTT known dm excluded
CVD mortality 390-459 n=98 cases
Hba1c in tertiles with highest tertile diveded in two subgroups by the cut off of 6.5% <5.2 (n=752) 1 n=16 5.2-5.5 (n=798) 1.30 (0.71-2.38) n=32 5.5-6.4 (n=730) 1.69 (0.93-3.06) n=39 >=6.5 (n=83) 1.79 (0.77-4.16) n=11
Age, sex, hypertension, WHR, TG, LDL, smoking Univariate: highest category and trend are significant
CVA
UKPDS 2000 1 25-65 yr; n=3642 dm; med FU 10.5 yr (UK)
2x FPG>6 (non)fatal CVA n=162 events
1.12 (1.01-1.21) Sex, age, ethnic group, smoking, HDL, LDL, TG, albuminuria, SBP
Moss 1994 4 >30 yr; n=1780 dm; 10 yr FU (US)
Type 2 Stroke mortality 1.17 (1.05-1.30) age, sex, CVD history, hypertension
dm=diabetes mellitus; FU=follow-up; BMI=body mass index; WHR=waist-hip ratio; SBP=systolic blood pressure; HDL=high-density lipoprotein; LDL=low-density lipoprotein; TG=triglycerides; dm=diabetes mellitus; OGTT=oral glucose tolerance test; IFG=impaired fasting glucose; FPG=fasting plasma glucose; py=person years; ref=reference group; CHD=coronary heart disease; AMI=acute myocardial infarctionI;CAD=coronary artery disease; AP=angina pectoris; IHD=ischaemic heart disease;CVD=cardio vascular disease; CVA=cerebro vascular event;
References List 1. Stratton IM, Adler AI, Neil HAW et al. Association of glycaemia with macrovascular and microvascular complications of type 2 diabetes (UKPDS 35): prospective
observational study. BMJ 2000; 321(7258):405-12. 2. Stevens RJ, Kothari V, Adler AI, Stratton IM, United Kingdom Prospective Diabetes Study (UKPDS) Group. The UKPDS risk engine: a model for the risk of
coronary heart disease in Type II diabetes (UKPDS 56). Clin Sci (Lond) 2001; 101(6):671-9 + 679 + 681-682 + 217-219. 3. Turner RC, Millns H, Neil HA et al. Risk factors for coronary artery disease in non-insulin dependent diabetes mellitus: United Kingdom Prospective Diabetes Study
(UKPDS: 23). BMJ 1998; 316(7134):823-8. 4. Moss SE, Klein R, Klein BE, Meuer SM. The association of glycemia and cause-specific mortality in a diabetic population. Arch Intern Med 1994; 154(21):2473-9.
5. Khaw KT, Wareham N, Bingham S, Luben R, Welch A, Day N. Association of hemoglobin A1c with cardiovascular disease and mortality in adults: the European prospective investigation into cancer in Norfolk. Ann Intern Med 2004; 141(6):413-20.
6. Juutilainen A , Kortelainen S, Lehto S, Ronnemaa T, Pyorala K, Laakso M. Gender difference in the impact of type 2 diabetes on coronary heart disease risk. Diabetes Care 2004; 27(12):2898-904.
7. Khaw KT, Wareham N, Luben R et al. Glycated haemoglobin, diabetes, and mortality in men in Norfolk cohort of european prospective investigation of cancer and nutrition (EPIC-Norfolk). BMJ 2001; 322(7277):15-8.
8. de Vegt F, Dekker JM, Ruhe HG et al. Hyperglycaemia is associated with all-cause and cardiovascular mortality in the Hoorn population: the Hoorn Study. Diabetologia 1999; 42(8):926-31.
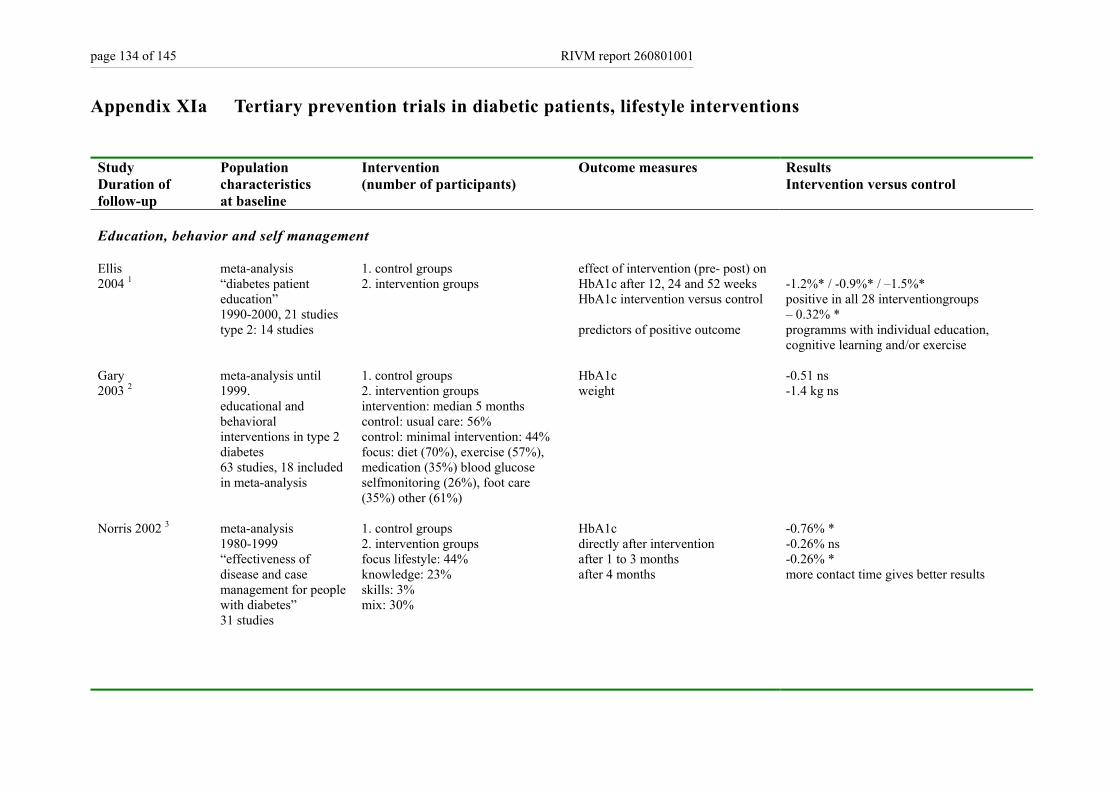
page 134 of 145 RIVM report 260801001
Appendix XIa Tertiary prevention trials in diabetic patients, lifestyle interventions
Study Duration of follow-up
Population characteristics at baseline
Intervention (number of participants)
Outcome measures Results Intervention versus control
Education, behavior and self management Ellis 2004 1
meta-analysis “diabetes patient education” 1990-2000, 21 studies type 2: 14 studies
1. control groups 2. intervention groups
effect of intervention (pre- post) on HbA1c after 12, 24 and 52 weeks HbA1c intervention versus control predictors of positive outcome
-1.2%* / -0.9%* / –1.5%* positive in all 28 interventiongroups – 0.32% * programms with individual education, cognitive learning and/or exercise
Gary 2003 2
meta-analysis until 1999. educational and behavioral interventions in type 2 diabetes 63 studies, 18 included in meta-analysis
1. control groups 2. intervention groups intervention: median 5 months control: usual care: 56% control: minimal intervention: 44% focus: diet (70%), exercise (57%), medication (35%) blood glucose selfmonitoring (26%), foot care (35%) other (61%)
HbA1c weight
-0.51 ns -1.4 kg ns
Norris 2002 3
meta-analysis 1980-1999 “effectiveness of disease and case management for people with diabetes” 31 studies
1. control groups 2. intervention groups focus lifestyle: 44% knowledge: 23% skills: 3% mix: 30%
HbA1c directly after intervention after 1 to 3 months after 4 months
-0.76% * -0.26% ns -0.26% * more contact time gives better results
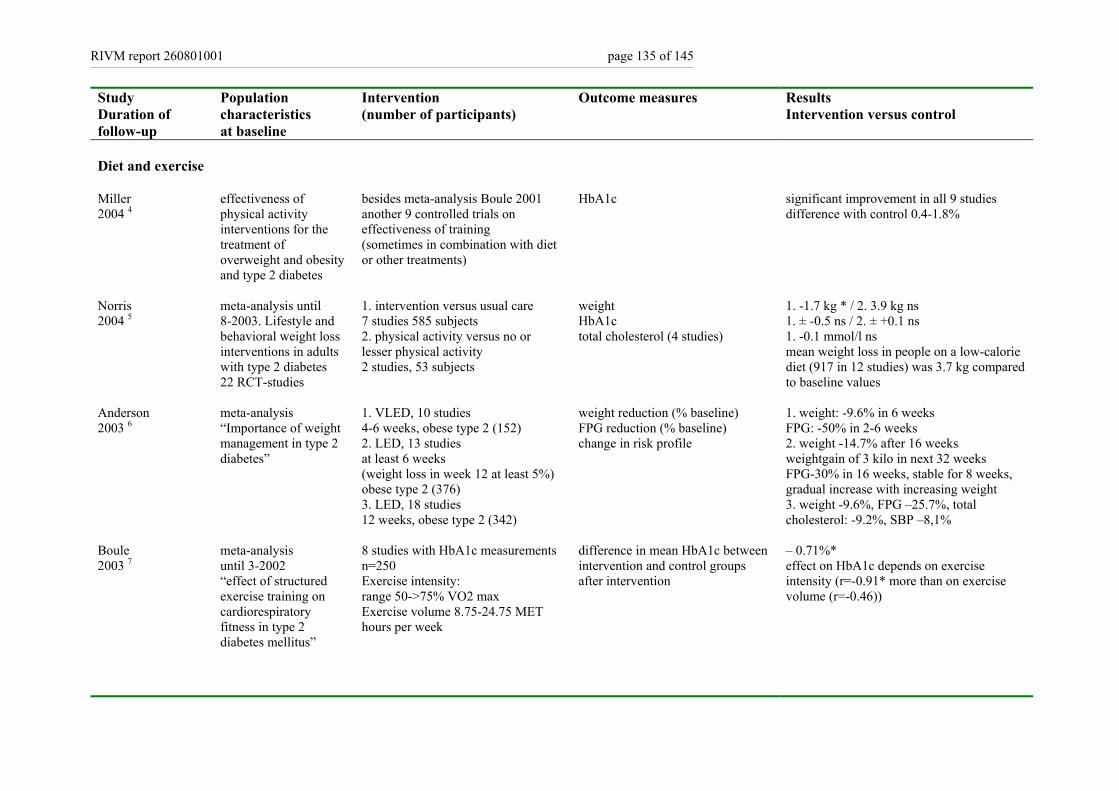
RIVM report 260801001 page 135 of 145
Study Duration of follow-up
Population characteristics at baseline
Intervention (number of participants)
Outcome measures Results Intervention versus control
Diet and exercise Miller 2004 4
effectiveness of physical activity interventions for the treatment of overweight and obesity and type 2 diabetes
besides meta-analysis Boule 2001 another 9 controlled trials on effectiveness of training (sometimes in combination with diet or other treatments)
HbA1c
significant improvement in all 9 studies difference with control 0.4-1.8%
Norris 2004 5
meta-analysis until 8-2003. Lifestyle and behavioral weight loss interventions in adults with type 2 diabetes 22 RCT-studies
1. intervention versus usual care 7 studies 585 subjects 2. physical activity versus no or lesser physical activity 2 studies, 53 subjects
weight HbA1c total cholesterol (4 studies)
1. -1.7 kg * / 2. 3.9 kg ns 1. ± -0.5 ns / 2. ± +0.1 ns 1. -0.1 mmol/l ns mean weight loss in people on a low-calorie diet (917 in 12 studies) was 3.7 kg compared to baseline values
Anderson 2003 6
meta-analysis “Importance of weight management in type 2 diabetes”
1. VLED, 10 studies 4-6 weeks, obese type 2 (152) 2. LED, 13 studies at least 6 weeks (weight loss in week 12 at least 5%) obese type 2 (376) 3. LED, 18 studies 12 weeks, obese type 2 (342)
weight reduction (% baseline) FPG reduction (% baseline) change in risk profile
1. weight: -9.6% in 6 weeks FPG: -50% in 2-6 weeks 2. weight -14.7% after 16 weeks weightgain of 3 kilo in next 32 weeks FPG-30% in 16 weeks, stable for 8 weeks, gradual increase with increasing weight 3. weight -9.6%, FPG –25.7%, total cholesterol: -9.2%, SBP –8,1%
Boule 2003 7
meta-analysis until 3-2002 “effect of structured exercise training on cardiorespiratory fitness in type 2 diabetes mellitus”
8 studies with HbA1c measurements n=250 Exercise intensity: range 50->75% VO2 max Exercise volume 8.75-24.75 MET hours per week
difference in mean HbA1c between intervention and control groups after intervention
– 0.71%* effect on HbA1c depends on exercise intensity (r=-0.91* more than on exercise volume (r=-0.46))
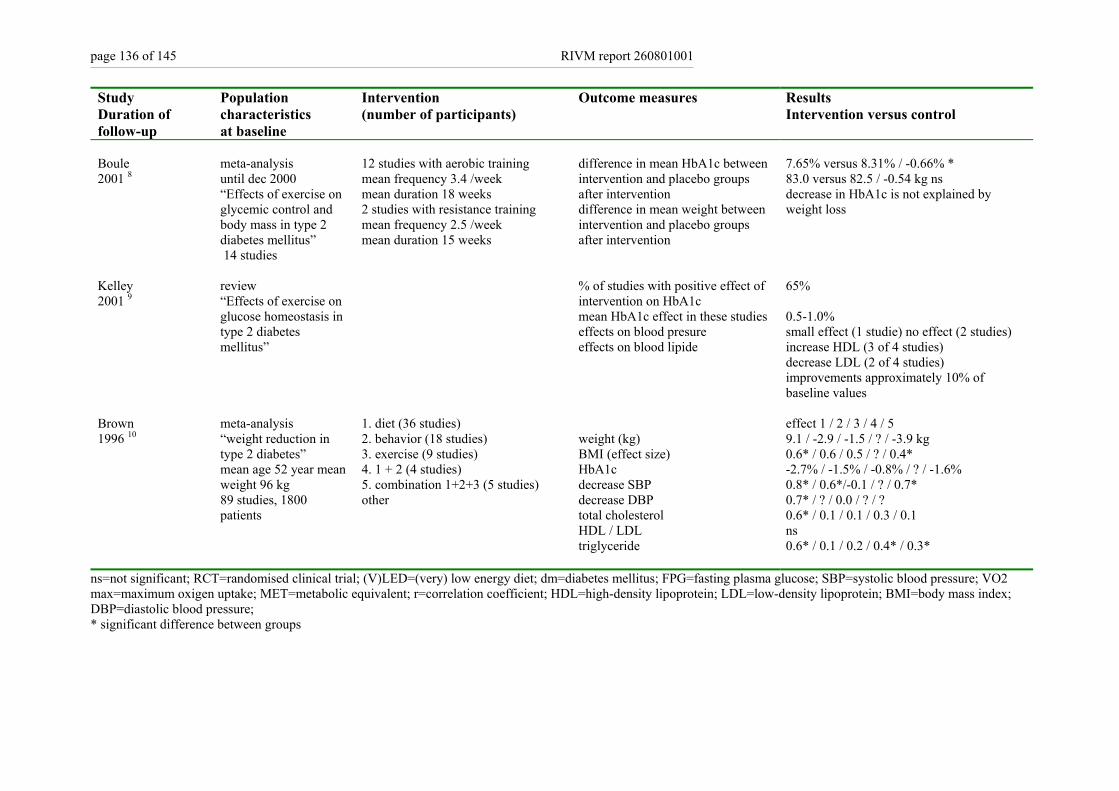
page 136 of 145 RIVM report 260801001
Study Duration of follow-up
Population characteristics at baseline
Intervention (number of participants)
Outcome measures Results Intervention versus control
Boule 2001 8
meta-analysis until dec 2000 “Effects of exercise on glycemic control and body mass in type 2 diabetes mellitus” 14 studies
12 studies with aerobic training mean frequency 3.4 /week mean duration 18 weeks 2 studies with resistance training mean frequency 2.5 /week mean duration 15 weeks
difference in mean HbA1c between intervention and placebo groups after intervention difference in mean weight between intervention and placebo groups after intervention
7.65% versus 8.31% / -0.66% * 83.0 versus 82.5 / -0.54 kg ns decrease in HbA1c is not explained by weight loss
Kelley 2001 9
review “Effects of exercise on glucose homeostasis in type 2 diabetes mellitus”
% of studies with positive effect of intervention on HbA1c mean HbA1c effect in these studies effects on blood presure effects on blood lipide
65% 0.5-1.0% small effect (1 studie) no effect (2 studies) increase HDL (3 of 4 studies) decrease LDL (2 of 4 studies) improvements approximately 10% of baseline values
Brown 1996 10
meta-analysis “weight reduction in type 2 diabetes” mean age 52 year mean weight 96 kg 89 studies, 1800 patients
1. diet (36 studies) 2. behavior (18 studies) 3. exercise (9 studies) 4. 1 + 2 (4 studies) 5. combination 1+2+3 (5 studies) other
weight (kg) BMI (effect size) HbA1c decrease SBP decrease DBP total cholesterol HDL / LDL triglyceride
effect 1 / 2 / 3 / 4 / 5 9.1 / -2.9 / -1.5 / ? / -3.9 kg 0.6* / 0.6 / 0.5 / ? / 0.4* -2.7% / -1.5% / -0.8% / ? / -1.6% 0.8* / 0.6*/-0.1 / ? / 0.7* 0.7* / ? / 0.0 / ? / ? 0.6* / 0.1 / 0.1 / 0.3 / 0.1 ns 0.6* / 0.1 / 0.2 / 0.4* / 0.3*
ns=not significant; RCT=randomised clinical trial; (V)LED=(very) low energy diet; dm=diabetes mellitus; FPG=fasting plasma glucose; SBP=systolic blood pressure; VO2 max=maximum oxigen uptake; MET=metabolic equivalent; r=correlation coefficient; HDL=high-density lipoprotein; LDL=low-density lipoprotein; BMI=body mass index; DBP=diastolic blood pressure; * significant difference between groups
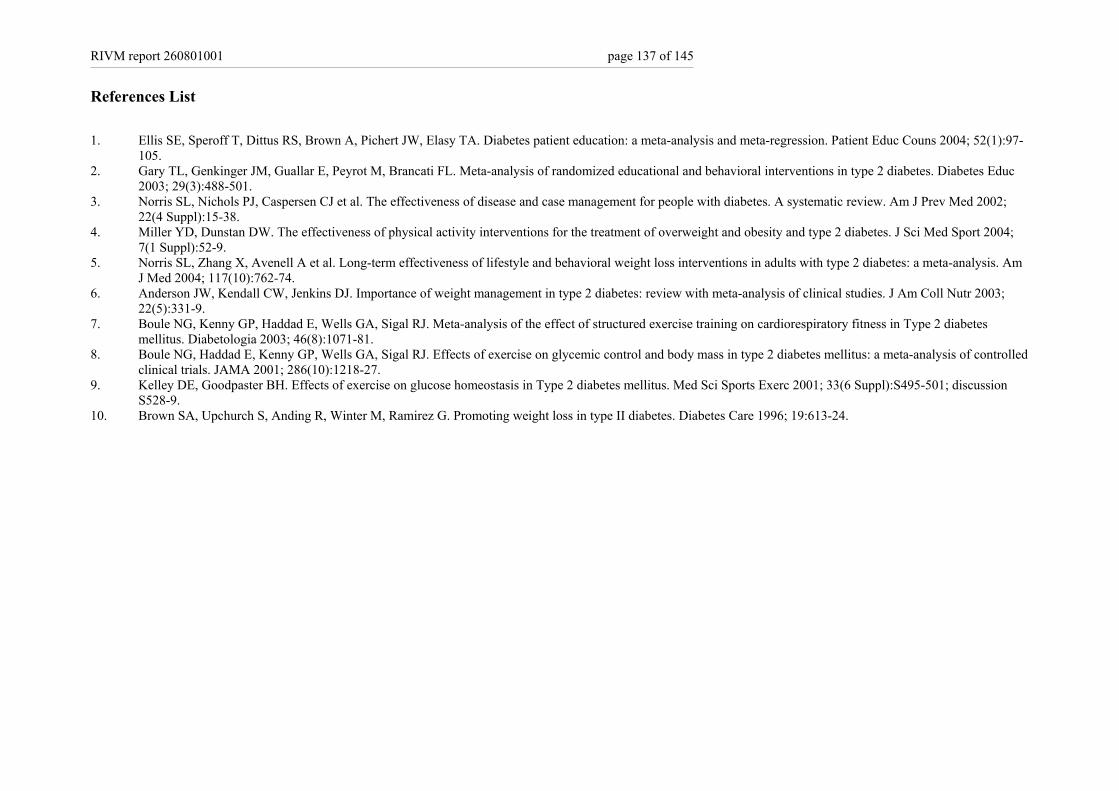
RIVM report 260801001 page 137 of 145
References List 1. Ellis SE, Speroff T, Dittus RS, Brown A, Pichert JW, Elasy TA. Diabetes patient education: a meta-analysis and meta-regression. Patient Educ Couns 2004; 52(1):97-
105. 2. Gary TL, Genkinger JM, Guallar E, Peyrot M, Brancati FL. Meta-analysis of randomized educational and behavioral interventions in type 2 diabetes. Diabetes Educ
2003; 29(3):488-501. 3. Norris SL, Nichols PJ, Caspersen CJ et al. The effectiveness of disease and case management for people with diabetes. A systematic review. Am J Prev Med 2002;
22(4 Suppl):15-38. 4. Miller YD, Dunstan DW. The effectiveness of physical activity interventions for the treatment of overweight and obesity and type 2 diabetes. J Sci Med Sport 2004;
7(1 Suppl):52-9. 5. Norris SL, Zhang X, Avenell A et al. Long-term effectiveness of lifestyle and behavioral weight loss interventions in adults with type 2 diabetes: a meta-analysis. Am
J Med 2004; 117(10):762-74. 6. Anderson JW, Kendall CW, Jenkins DJ. Importance of weight management in type 2 diabetes: review with meta-analysis of clinical studies. J Am Coll Nutr 2003;
22(5):331-9. 7. Boule NG, Kenny GP, Haddad E, Wells GA, Sigal RJ. Meta-analysis of the effect of structured exercise training on cardiorespiratory fitness in Type 2 diabetes
mellitus. Diabetologia 2003; 46(8):1071-81. 8. Boule NG, Haddad E, Kenny GP, Wells GA, Sigal RJ. Effects of exercise on glycemic control and body mass in type 2 diabetes mellitus: a meta-analysis of controlled
clinical trials. JAMA 2001; 286(10):1218-27. 9. Kelley DE, Goodpaster BH. Effects of exercise on glucose homeostasis in Type 2 diabetes mellitus. Med Sci Sports Exerc 2001; 33(6 Suppl):S495-501; discussion
S528-9. 10. Brown SA, Upchurch S, Anding R, Winter M, Ramirez G. Promoting weight loss in type II diabetes. Diabetes Care 1996; 19:613-24.
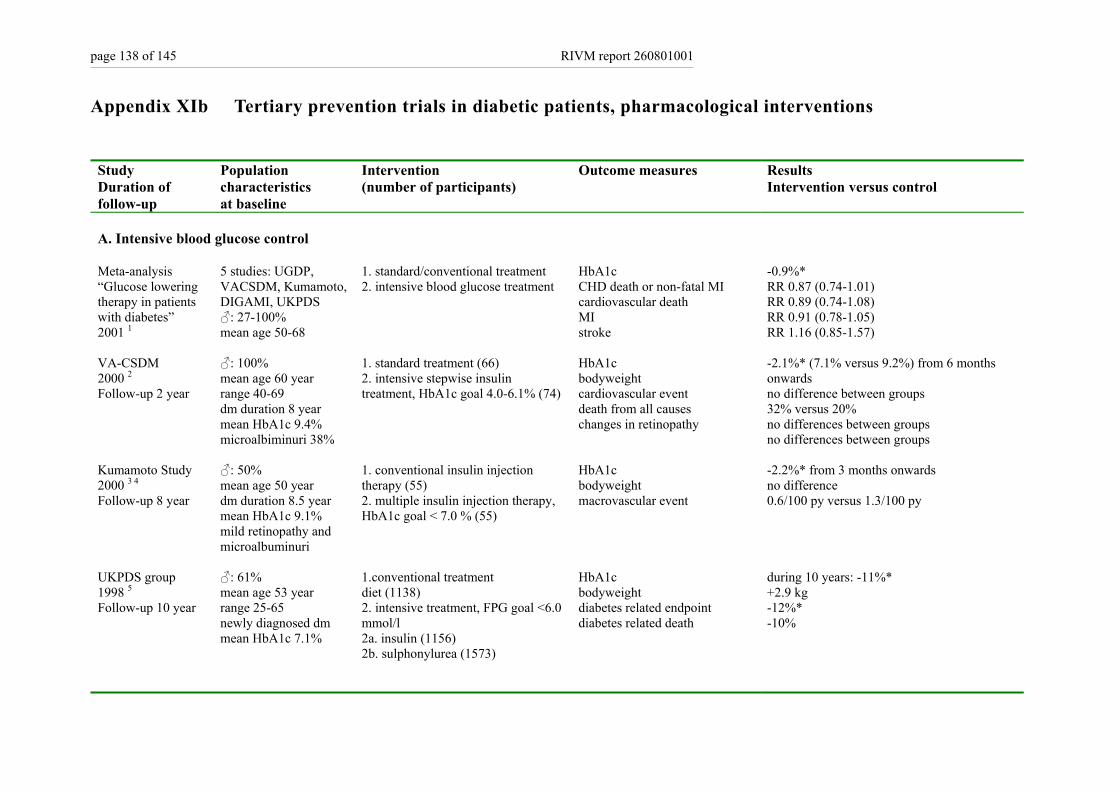
page 138 of 145 RIVM report 260801001
Appendix XIb Tertiary prevention trials in diabetic patients, pharmacological interventions
Study Duration of follow-up
Population characteristics at baseline
Intervention (number of participants)
Outcome measures Results Intervention versus control
A. Intensive blood glucose control Meta-analysis “Glucose lowering therapy in patients with diabetes” 2001 1
5 studies: UGDP, VACSDM, Kumamoto, DIGAMI, UKPDS ♂: 27-100% mean age 50-68
1. standard/conventional treatment 2. intensive blood glucose treatment
HbA1c CHD death or non-fatal MI cardiovascular death MI stroke
-0.9%* RR 0.87 (0.74-1.01) RR 0.89 (0.74-1.08) RR 0.91 (0.78-1.05) RR 1.16 (0.85-1.57)
VA-CSDM 2000 2 Follow-up 2 year
♂: 100% mean age 60 year range 40-69 dm duration 8 year mean HbA1c 9.4% microalbiminuri 38%
1. standard treatment (66) 2. intensive stepwise insulin treatment, HbA1c goal 4.0-6.1% (74)
HbA1c bodyweight cardiovascular event death from all causes changes in retinopathy
-2.1%* (7.1% versus 9.2%) from 6 months onwards no difference between groups 32% versus 20% no differences between groups no differences between groups
Kumamoto Study 2000 3 4 Follow-up 8 year
♂: 50% mean age 50 year dm duration 8.5 year mean HbA1c 9.1% mild retinopathy and microalbuminuri
1. conventional insulin injection therapy (55) 2. multiple insulin injection therapy, HbA1c goal < 7.0 % (55)
HbA1c bodyweight macrovascular event
-2.2%* from 3 months onwards no difference 0.6/100 py versus 1.3/100 py
UKPDS group 1998 5 Follow-up 10 year
♂: 61% mean age 53 year range 25-65 newly diagnosed dm mean HbA1c 7.1%
1.conventional treatment diet (1138) 2. intensive treatment, FPG goal <6.0 mmol/l 2a. insulin (1156) 2b. sulphonylurea (1573)
HbA1c bodyweight diabetes related endpoint diabetes related death
during 10 years: -11%* +2.9 kg -12%* -10%
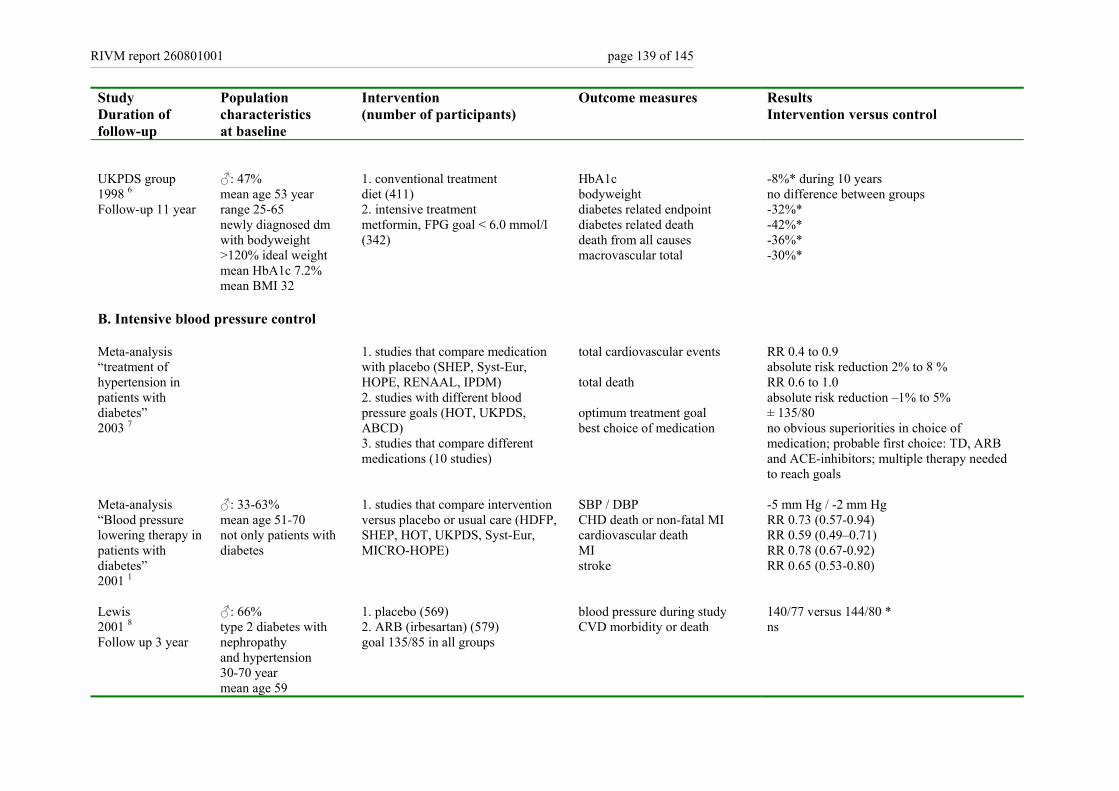
RIVM report 260801001 page 139 of 145
Study Duration of follow-up
Population characteristics at baseline
Intervention (number of participants)
Outcome measures Results Intervention versus control
UKPDS group 1998 6 Follow-up 11 year
♂: 47% mean age 53 year range 25-65 newly diagnosed dm with bodyweight >120% ideal weight mean HbA1c 7.2% mean BMI 32
1. conventional treatment diet (411) 2. intensive treatment metformin, FPG goal < 6.0 mmol/l (342)
HbA1c bodyweight diabetes related endpoint diabetes related death death from all causes macrovascular total
-8%* during 10 years no difference between groups -32%* -42%* -36%* -30%*
B. Intensive blood pressure control Meta-analysis “treatment of hypertension in patients with diabetes” 2003 7
1. studies that compare medication with placebo (SHEP, Syst-Eur, HOPE, RENAAL, IPDM) 2. studies with different blood pressure goals (HOT, UKPDS, ABCD) 3. studies that compare different medications (10 studies)
total cardiovascular events total death optimum treatment goal best choice of medication
RR 0.4 to 0.9 absolute risk reduction 2% to 8 % RR 0.6 to 1.0 absolute risk reduction –1% to 5% ± 135/80 no obvious superiorities in choice of medication; probable first choice: TD, ARB and ACE-inhibitors; multiple therapy needed to reach goals
Meta-analysis “Blood pressure lowering therapy in patients with diabetes” 2001 1
♂: 33-63% mean age 51-70 not only patients with diabetes
1. studies that compare intervention versus placebo or usual care (HDFP, SHEP, HOT, UKPDS, Syst-Eur, MICRO-HOPE)
SBP / DBP CHD death or non-fatal MI cardiovascular death MI stroke
-5 mm Hg / -2 mm Hg RR 0.73 (0.57-0.94) RR 0.59 (0.49–0.71) RR 0.78 (0.67-0.92) RR 0.65 (0.53-0.80)
Lewis 2001 8 Follow up 3 year
♂: 66% type 2 diabetes with nephropathy and hypertension 30-70 year mean age 59
1. placebo (569) 2. ARB (irbesartan) (579) goal 135/85 in all groups
blood pressure during study CVD morbidity or death
140/77 versus 144/80 * ns
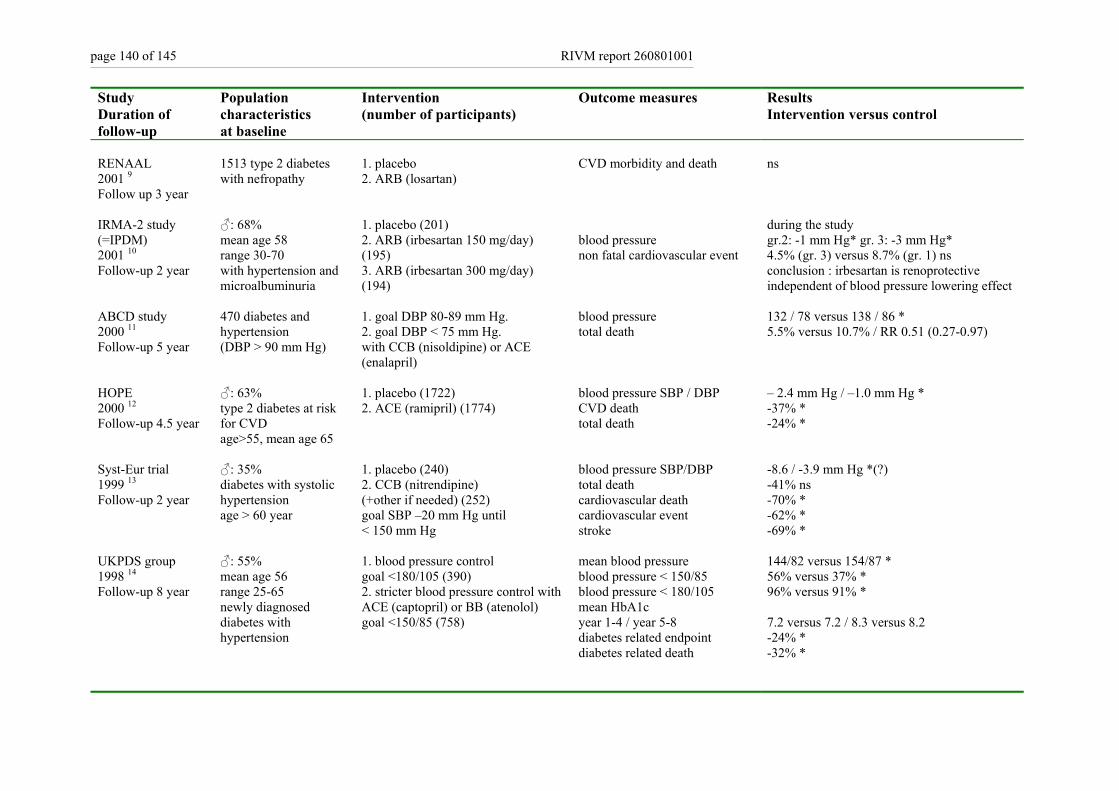
page 140 of 145 RIVM report 260801001
Study Duration of follow-up
Population characteristics at baseline
Intervention (number of participants)
Outcome measures Results Intervention versus control
RENAAL 2001 9 Follow up 3 year
1513 type 2 diabetes with nefropathy
1. placebo 2. ARB (losartan)
CVD morbidity and death
ns
IRMA-2 study (=IPDM) 2001 10 Follow-up 2 year
♂: 68% mean age 58 range 30-70 with hypertension and microalbuminuria
1. placebo (201) 2. ARB (irbesartan 150 mg/day) (195) 3. ARB (irbesartan 300 mg/day) (194)
blood pressure non fatal cardiovascular event
during the study gr.2: -1 mm Hg* gr. 3: -3 mm Hg* 4.5% (gr. 3) versus 8.7% (gr. 1) ns conclusion : irbesartan is renoprotective independent of blood pressure lowering effect
ABCD study 2000 11 Follow-up 5 year
470 diabetes and hypertension (DBP > 90 mm Hg)
1. goal DBP 80-89 mm Hg. 2. goal DBP < 75 mm Hg. with CCB (nisoldipine) or ACE (enalapril)
blood pressure total death
132 / 78 versus 138 / 86 * 5.5% versus 10.7% / RR 0.51 (0.27-0.97)
HOPE 2000 12 Follow-up 4.5 year
♂: 63% type 2 diabetes at risk for CVD age>55, mean age 65
1. placebo (1722) 2. ACE (ramipril) (1774)
blood pressure SBP / DBP CVD death total death
– 2.4 mm Hg / –1.0 mm Hg * -37% * -24% *
Syst-Eur trial 1999 13 Follow-up 2 year
♂: 35% diabetes with systolic hypertension age > 60 year
1. placebo (240) 2. CCB (nitrendipine) (+other if needed) (252) goal SBP –20 mm Hg until < 150 mm Hg
blood pressure SBP/DBP total death cardiovascular death cardiovascular event stroke
-8.6 / -3.9 mm Hg *(?) -41% ns -70% * -62% * -69% *
UKPDS group 1998 14 Follow-up 8 year
♂: 55% mean age 56 range 25-65 newly diagnosed diabetes with hypertension
1. blood pressure control goal <180/105 (390) 2. stricter blood pressure control with ACE (captopril) or BB (atenolol) goal <150/85 (758)
mean blood pressure blood pressure < 150/85 blood pressure < 180/105 mean HbA1c year 1-4 / year 5-8 diabetes related endpoint diabetes related death
144/82 versus 154/87 * 56% versus 37% * 96% versus 91% * 7.2 versus 7.2 / 8.3 versus 8.2 -24% * -32% *
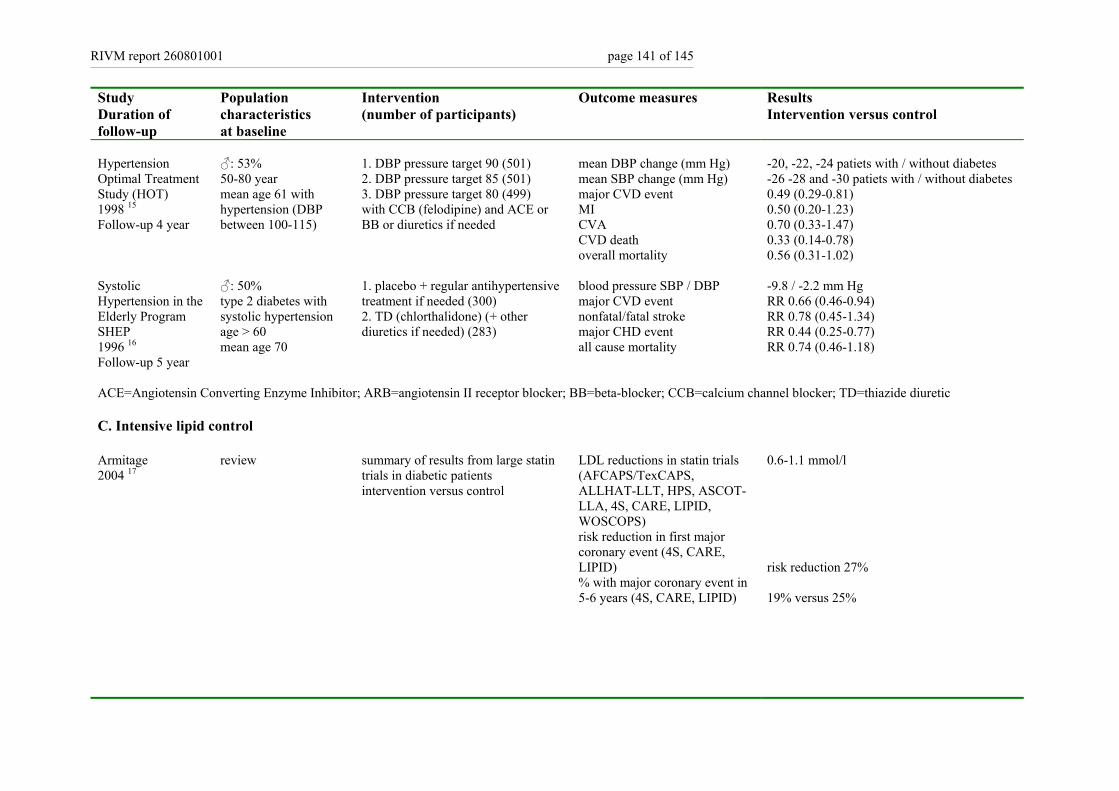
RIVM report 260801001 page 141 of 145
Study Duration of follow-up
Population characteristics at baseline
Intervention (number of participants)
Outcome measures Results Intervention versus control
Hypertension Optimal Treatment Study (HOT) 1998 15
Follow-up 4 year
♂: 53% 50-80 year mean age 61 with hypertension (DBP between 100-115)
1. DBP pressure target 90 (501) 2. DBP pressure target 85 (501) 3. DBP pressure target 80 (499) with CCB (felodipine) and ACE or BB or diuretics if needed
mean DBP change (mm Hg) mean SBP change (mm Hg) major CVD event MI CVA CVD death overall mortality
-20, -22, -24 patiets with / without diabetes -26 -28 and -30 patiets with / without diabetes 0.49 (0.29-0.81) 0.50 (0.20-1.23) 0.70 (0.33-1.47) 0.33 (0.14-0.78) 0.56 (0.31-1.02)
Systolic Hypertension in the Elderly Program SHEP 1996 16
Follow-up 5 year
♂: 50% type 2 diabetes with systolic hypertension age > 60 mean age 70
1. placebo + regular antihypertensive treatment if needed (300) 2. TD (chlorthalidone) (+ other diuretics if needed) (283)
blood pressure SBP / DBP major CVD event nonfatal/fatal stroke major CHD event all cause mortality
-9.8 / -2.2 mm Hg RR 0.66 (0.46-0.94) RR 0.78 (0.45-1.34) RR 0.44 (0.25-0.77) RR 0.74 (0.46-1.18)
ACE=Angiotensin Converting Enzyme Inhibitor; ARB=angiotensin II receptor blocker; BB=beta-blocker; CCB=calcium channel blocker; TD=thiazide diuretic C. Intensive lipid control Armitage 2004 17
review summary of results from large statin trials in diabetic patients intervention versus control
LDL reductions in statin trials (AFCAPS/TexCAPS, ALLHAT-LLT, HPS, ASCOT-LLA, 4S, CARE, LIPID, WOSCOPS) risk reduction in first major coronary event (4S, CARE, LIPID) % with major coronary event in 5-6 years (4S, CARE, LIPID)
0.6-1.1 mmol/l risk reduction 27% 19% versus 25%
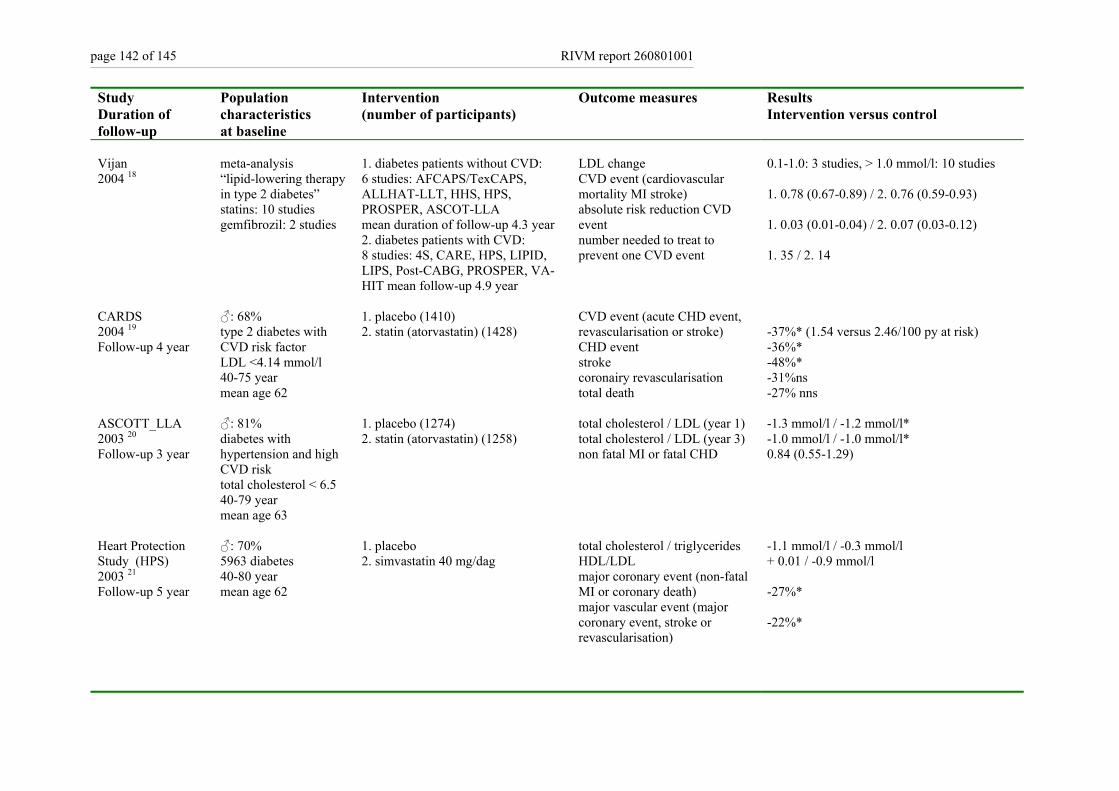
page 142 of 145 RIVM report 260801001
Study Duration of follow-up
Population characteristics at baseline
Intervention (number of participants)
Outcome measures Results Intervention versus control
Vijan 2004 18
meta-analysis “lipid-lowering therapy in type 2 diabetes” statins: 10 studies gemfibrozil: 2 studies
1. diabetes patients without CVD: 6 studies: AFCAPS/TexCAPS, ALLHAT-LLT, HHS, HPS, PROSPER, ASCOT-LLA mean duration of follow-up 4.3 year 2. diabetes patients with CVD: 8 studies: 4S, CARE, HPS, LIPID, LIPS, Post-CABG, PROSPER, VA-HIT mean follow-up 4.9 year
LDL change CVD event (cardiovascular mortality MI stroke) absolute risk reduction CVD event number needed to treat to prevent one CVD event
0.1-1.0: 3 studies, > 1.0 mmol/l: 10 studies 1. 0.78 (0.67-0.89) / 2. 0.76 (0.59-0.93) 1. 0.03 (0.01-0.04) / 2. 0.07 (0.03-0.12) 1. 35 / 2. 14
CARDS 2004 19
Follow-up 4 year
♂: 68% type 2 diabetes with CVD risk factor LDL <4.14 mmol/l 40-75 year mean age 62
1. placebo (1410) 2. statin (atorvastatin) (1428)
CVD event (acute CHD event, revascularisation or stroke) CHD event stroke coronairy revascularisation total death
-37%* (1.54 versus 2.46/100 py at risk) -36%* -48%* -31%ns -27% nns
ASCOTT_LLA 2003 20
Follow-up 3 year
♂: 81% diabetes with hypertension and high CVD risk total cholesterol < 6.5 40-79 year mean age 63
1. placebo (1274) 2. statin (atorvastatin) (1258)
total cholesterol / LDL (year 1) total cholesterol / LDL (year 3) non fatal MI or fatal CHD
-1.3 mmol/l / -1.2 mmol/l* -1.0 mmol/l / -1.0 mmol/l* 0.84 (0.55-1.29)
Heart Protection Study (HPS) 2003 21
Follow-up 5 year
♂: 70% 5963 diabetes 40-80 year mean age 62
1. placebo 2. simvastatin 40 mg/dag
total cholesterol / triglycerides HDL/LDL major coronary event (non-fatal MI or coronary death) major vascular event (major coronary event, stroke or revascularisation)
-1.1 mmol/l / -0.3 mmol/l + 0.01 / -0.9 mmol/l -27%* -22%*
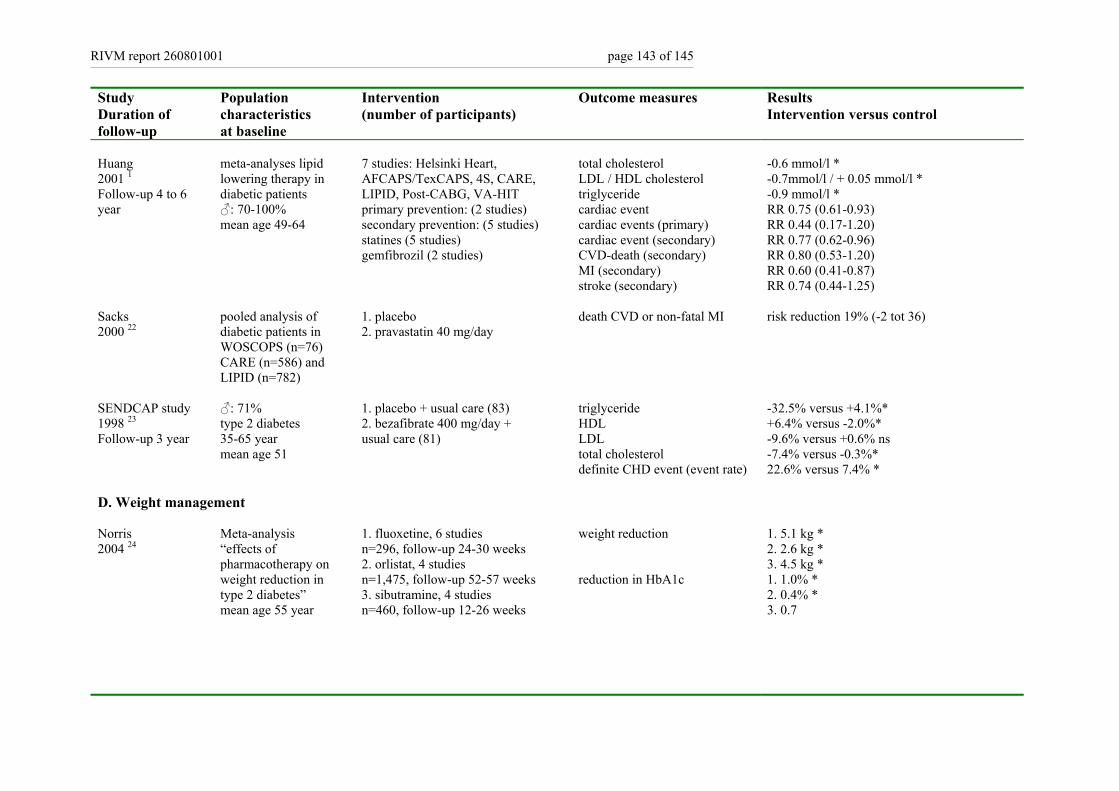
RIVM report 260801001 page 143 of 145
Study Duration of follow-up
Population characteristics at baseline
Intervention (number of participants)
Outcome measures Results Intervention versus control
Huang 2001 1 Follow-up 4 to 6 year
meta-analyses lipid lowering therapy in diabetic patients ♂: 70-100% mean age 49-64
7 studies: Helsinki Heart, AFCAPS/TexCAPS, 4S, CARE, LIPID, Post-CABG, VA-HIT primary prevention: (2 studies) secondary prevention: (5 studies) statines (5 studies) gemfibrozil (2 studies)
total cholesterol LDL / HDL cholesterol triglyceride cardiac event cardiac events (primary) cardiac event (secondary) CVD-death (secondary) MI (secondary) stroke (secondary)
-0.6 mmol/l * -0.7mmol/l / + 0.05 mmol/l * -0.9 mmol/l * RR 0.75 (0.61-0.93) RR 0.44 (0.17-1.20) RR 0.77 (0.62-0.96) RR 0.80 (0.53-1.20) RR 0.60 (0.41-0.87) RR 0.74 (0.44-1.25)
Sacks 2000 22
pooled analysis of diabetic patients in WOSCOPS (n=76) CARE (n=586) and LIPID (n=782)
1. placebo 2. pravastatin 40 mg/day
death CVD or non-fatal MI risk reduction 19% (-2 tot 36)
SENDCAP study 1998 23 Follow-up 3 year
♂: 71% type 2 diabetes 35-65 year mean age 51
1. placebo + usual care (83) 2. bezafibrate 400 mg/day + usual care (81)
triglyceride HDL LDL total cholesterol definite CHD event (event rate)
-32.5% versus +4.1%* +6.4% versus -2.0%* -9.6% versus +0.6% ns -7.4% versus -0.3%* 22.6% versus 7.4% *
D. Weight management Norris 2004 24
Meta-analysis “effects of pharmacotherapy on weight reduction in type 2 diabetes” mean age 55 year
1. fluoxetine, 6 studies n=296, follow-up 24-30 weeks 2. orlistat, 4 studies n=1,475, follow-up 52-57 weeks 3. sibutramine, 4 studies n=460, follow-up 12-26 weeks
weight reduction reduction in HbA1c
1. 5.1 kg * 2. 2.6 kg * 3. 4.5 kg * 1. 1.0% * 2. 0.4% * 3. 0.7
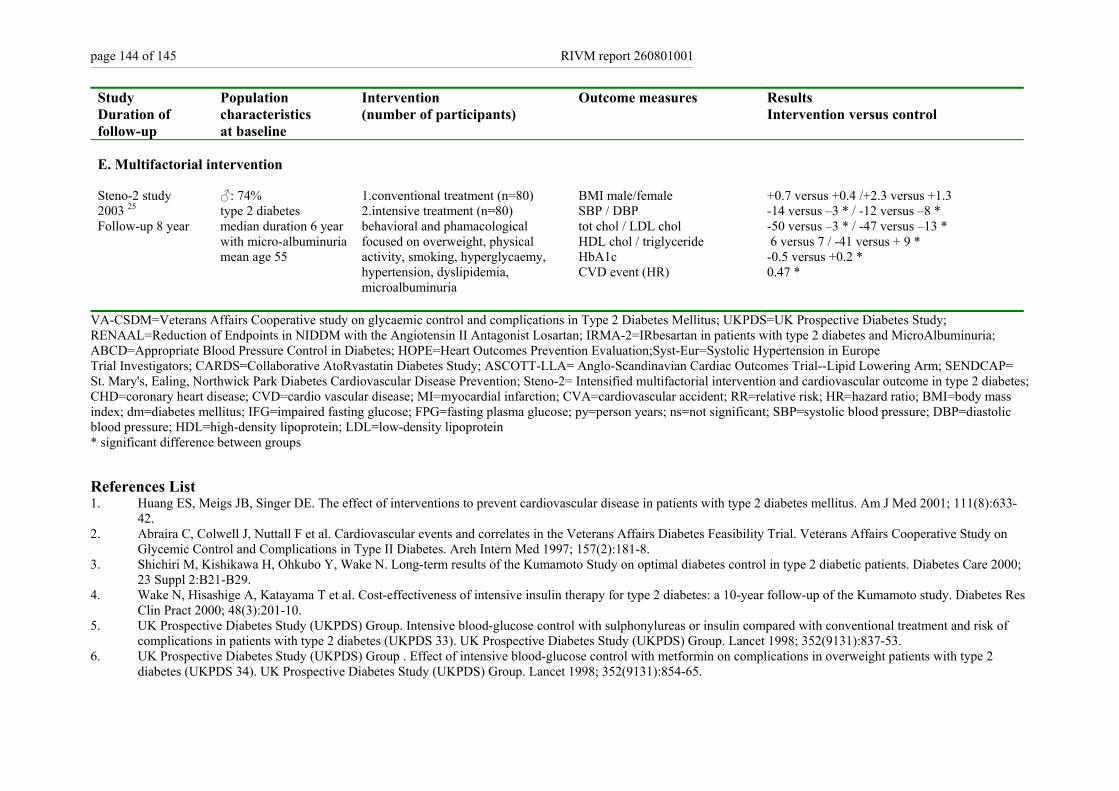
page 144 of 145 RIVM report 260801001
Study Duration of follow-up
Population characteristics at baseline
Intervention (number of participants)
Outcome measures Results Intervention versus control
E. Multifactorial intervention Steno-2 study 2003 25 Follow-up 8 year
♂: 74% type 2 diabetes median duration 6 year with micro-albuminuria mean age 55
1.conventional treatment (n=80) 2.intensive treatment (n=80) behavioral and phamacological focused on overweight, physical activity, smoking, hyperglycaemy, hypertension, dyslipidemia, microalbuminuria
BMI male/female SBP / DBP tot chol / LDL chol HDL chol / triglyceride HbA1c CVD event (HR)
+0.7 versus +0.4 /+2.3 versus +1.3 -14 versus –3 * / -12 versus –8 * -50 versus –3 * / -47 versus –13 * 6 versus 7 / -41 versus + 9 * -0.5 versus +0.2 * 0.47 *
VA-CSDM=Veterans Affairs Cooperative study on glycaemic control and complications in Type 2 Diabetes Mellitus; UKPDS=UK Prospective Diabetes Study; RENAAL=Reduction of Endpoints in NIDDM with the Angiotensin II Antagonist Losartan; IRMA-2=IRbesartan in patients with type 2 diabetes and MicroAlbuminuria; ABCD=Appropriate Blood Pressure Control in Diabetes; HOPE=Heart Outcomes Prevention Evaluation;Syst-Eur=Systolic Hypertension in Europe Trial Investigators; CARDS=Collaborative AtoRvastatin Diabetes Study; ASCOTT-LLA= Anglo-Scandinavian Cardiac Outcomes Trial--Lipid Lowering Arm; SENDCAP= St. Mary's, Ealing, Northwick Park Diabetes Cardiovascular Disease Prevention; Steno-2= Intensified multifactorial intervention and cardiovascular outcome in type 2 diabetes; CHD=coronary heart disease; CVD=cardio vascular disease; MI=myocardial infarction; CVA=cardiovascular accident; RR=relative risk; HR=hazard ratio; BMI=body mass index; dm=diabetes mellitus; IFG=impaired fasting glucose; FPG=fasting plasma glucose; py=person years; ns=not significant; SBP=systolic blood pressure; DBP=diastolic blood pressure; HDL=high-density lipoprotein; LDL=low-density lipoprotein * significant difference between groups
References List 1. Huang ES, Meigs JB, Singer DE. The effect of interventions to prevent cardiovascular disease in patients with type 2 diabetes mellitus. Am J Med 2001; 111(8):633-
42. 2. Abraira C, Colwell J, Nuttall F et al. Cardiovascular events and correlates in the Veterans Affairs Diabetes Feasibility Trial. Veterans Affairs Cooperative Study on
Glycemic Control and Complications in Type II Diabetes. Arch Intern Med 1997; 157(2):181-8. 3. Shichiri M, Kishikawa H, Ohkubo Y, Wake N. Long-term results of the Kumamoto Study on optimal diabetes control in type 2 diabetic patients. Diabetes Care 2000;
23 Suppl 2:B21-B29. 4. Wake N, Hisashige A, Katayama T et al. Cost-effectiveness of intensive insulin therapy for type 2 diabetes: a 10-year follow-up of the Kumamoto study. Diabetes Res
Clin Pract 2000; 48(3):201-10. 5. UK Prospective Diabetes Study (UKPDS) Group. Intensive blood-glucose control with sulphonylureas or insulin compared with conventional treatment and risk of
complications in patients with type 2 diabetes (UKPDS 33). UK Prospective Diabetes Study (UKPDS) Group. Lancet 1998; 352(9131):837-53. 6. UK Prospective Diabetes Study (UKPDS) Group . Effect of intensive blood-glucose control with metformin on complications in overweight patients with type 2
diabetes (UKPDS 34). UK Prospective Diabetes Study (UKPDS) Group. Lancet 1998; 352(9131):854-65.
RIVM report 260801001 page 145 of 145
7. Vijan S, Hayward RA. Treatment of hypertension in type 2 diabetes mellitus: blood pressure goals, choice of agents, and setting priorities in diabetes care. Ann Intern Med 2003; 138(7):593-602.
8. Lewis EJ, Hunsicker LG, Clarke WR et al. Renoprotective effect of the angiotensin-receptor antagonist irbesartan in patients with nephropathy due to type 2 diabetes. N Engl J Med 2001; 345(12):851-60.
9. Brenner BM, Cooper ME, de Zeeuw D et al. Effects of losartan on renal and cardiovascular outcomes in patients with type 2 diabetes and nephropathy. N Engl J Med 2001; 345(12):861-9.
10. Parving HH, Lehnert H, Brochner-Mortensen J, Gomis R, Andersen S, Arner P. [Effect of irbesartan on the development of diabetic nephropathy in patients with type 2 diabetes]. Ugeskr Laeger 2001; 163(40):5519-24.
11. Estacio RO, Jeffers BW, Gifford N, Schrier RW. Effect of blood pressure control on diabetic microvascular complications in patients with hypertension and type 2 diabetes. Diabetes Care 2000; 23 Suppl 2:B54-64.
12. Heart Outcomes Prevention Evaluation (HOPE) Study Investigators. Effects of ramipril on cardiovascular and microvascular outcomes in people with diabetes mellitus: results of the HOPE study and MICRO-HOPE substudy. Heart Outcomes Prevention Evaluation Study Investigators. Lancet 2000; 355(9200):253-9.
13. Tuomilehto J, Rastenyte D, Birkenhager WH et al. Effects of calcium-channel blockade in older patients with diabetes and systolic hypertension. Systolic Hypertension in Europe Trial Investigators. N Engl J Med 1999; 340(9):677-84.
14. UK Prospective Diabetes Study Group. Tight blood pressure control and risk of macrovascular and microvascular complications in type 2 diabetes: UKPDS 38. UK Prospective Diabetes Study Group. BMJ 1998; 317(7160):703-13.
15. Hansson L, Zanchetti A, Carruthers SG et al. Effects of intensive blood-pressure lowering and low-dose aspirin in patients with hypertension: principal results of the Hypertension Optimal Treatment (HOT) randomised trial. HOT Study Group. Lancet 1998; 351(9118):1755-62.
16. Curb JD, Pressel SL, Cutler JA et al. Effect of diuretic-based antihypertensive treatment on cardiovascular disease risk in older diabetic patients with isolated systolic hypertension. Systolic Hypertension in the Elderly Program Cooperative Research Group. JAMA 1996; 276(23):1886-92.
17. Armitage J, Bowman L. Cardiovascular outcomes among participants with diabetes in the recent large statin trials. Curr Opin Lipidol 2004; 15(4):439-46. 18. Vijan S, Hayward RA. Pharmacologic lipid-lowering therapy in type 2 diabetes mellitus: background paper for the American College of Physicians. Ann Intern Med
2004; 140(8):650-8. 19. Colhoun HM, Betteridge DJ, Durrington PN et al. Primary prevention of cardiovascular disease with atorvastatin in type 2 diabetes in the Collaborative Atorvastatin
Diabetes Study (CARDS): multicentre randomised placebo-controlled trial. Lancet 2004; 364(9435):685-96. 20. Sever PS, Dahlof B, Poulter NR et al. Prevention of coronary and stroke events with atorvastatin in hypertensive patients who have average or lower-than-average
cholesterol concentrations, in the Anglo-Scandinavian Cardiac Outcomes Trial--Lipid Lowering Arm (ASCOT-LLA): a multicentre randomised controlled trial. Lancet 2003; 361(9364):1149-58.
21. Collins R, Armitage J, Parish S, Sleigh P, Peto R, Heart Protection Study Collaborative Group. MRC/BHF Heart Protection Study of cholesterol-lowering with simvastatin in 5963 people with diabetes: a randomised placebo-controlled trial. Lancet 2003; 361(9374):2005-16.
22. Sacks FM, Tonkin AM, Shepherd J et al. Effect of pravastatin on coronary disease events in subgroups defined by coronary risk factors: the Prospective Pravastatin Pooling Project. Circulation 2000; 102(16):1893-900.
23. Elkeles RS, Diamond YR, Poulter C et al. Cardiovascular outcomes in type 2 diabetes. A double-blind placebo-controlled study of bezafibrate: the St. Mary's Ealing, Northwick Park Diabetes Cardiovascular Disease Prevention (SENDCAP) Study. Diabetes Care 1998; 21:641-8.
24. Norris SL, Zhang X, Avenell A et al. Efficacy of pharmacotherapy for weight loss in adults with type 2 diabetes mellitus: a meta-analysis. Arch Intern Med 2004; 164(13):1395-404.
25. Gaede P, Vedel P, Larsen N, Jensen GVH, Parving HH, Pedersen O. Multifactorial intervention and cardiovascular disease in patients with type 2 diabetes. N Engl J Med 2003; 348(5):383-93.