Modeling and Prediction of Ventilation Methane Emissions ... · Modeling and prediction of...
17
Modeling and prediction of ventilation methane emissions of U.S. longwall mines using supervised artificial neural networks C. Özgen Karacan National Institute for Occupational Safety and Health, Pittsburgh Research Laboratory, Pittsburgh, PA, 15236, United States Received 28 June 2007; received in revised form 8 September 2007; accepted 13 September 2007 Available online 22 October 2007 Abstract Methane emissions from a longwall ventilation system are an important indicator of how much methane a particular mine is producing and how much air should be provided to keep the methane levels under statutory limits. Knowing the amount of ventilation methane emission is also important for environmental considerations and for identifying opportunities to capture and utilize the methane for energy production. Prediction of methane emissions before mining is difficult since it depends on a number of geological, geographical, and operational factors. This study proposes a principle component analysis (PCA) and artificial neural network (ANN)-based approach to predict the ventilation methane emission rates of U.S. longwall mines. Ventilation emission data obtained from 63 longwall mines in 10 states for the years between 1985 and 2005 were combined with corresponding coalbed properties, geographical information, and longwall operation parameters. The compiled database resulted in 17 parameters that potentially impacted emissions. PCA was used to determine those variables that most influenced ventilation emissions and were considered for further predictive modeling using ANN. Different combinations of variables in the data set and network structures were used for network training and testing to achieve minimum mean square errors and high correlations between measurements and predictions. The resultant ANN model using nine main input variables was superior to multilinear and second-order non-linear models for predicting the new data. The ANN model predicted methane emissions with high accuracy. It is concluded that the model can be used as a predictive tool since it includes those factors that influence longwall ventilation emission rates. Published by Elsevier B.V. Keywords: Longwall mining; Ventilation; Methane emissions; Principle component analysis; Artificial neural networks 1. Introduction Longwall mining is an underground mining method that can maximize coal production in coalbeds that contain few geological discontinuities. In these opera- tions, a mechanical shearer progressively mines a large block of coal, called a panel, which is outlined with development entries or gate roads. This is a continuous process in an extensive area, where the roof is supported only temporarily during mining with hydraulic supports that protect the workers and the face equipment (Fig. 1). As the coal is extracted, the supports automatically advance and the roof strata are allowed to cave behind the supports (Karacan et al., 2007a). Methane emissions can adversely affect the safety of underground coal miners. During longwall mining, methane emissions can originate from three major sources. These sources are: 1) gas emissions from the E-mail address: [email protected]. 0166-5162/$ - see front matter. Published by Elsevier B.V. doi:10.1016/j.coal.2007.09.003
Transcript of Modeling and Prediction of Ventilation Methane Emissions ... · Modeling and prediction of...

Modeling and prediction of ventilation methane emissions of U.S.longwall mines using supervised artificial neural networks
C. Özgen Karacan
National Institute for Occupational Safety and Health, Pittsburgh Research Laboratory, Pittsburgh, PA, 15236, United States
Received 28 June 2007; received in revised form 8 September 2007; accepted 13 September 2007Available online 22 October 2007
Abstract
Methane emissions from a longwall ventilation system are an important indicator of how much methane a particular mine isproducing and how much air should be provided to keep the methane levels under statutory limits. Knowing the amount ofventilation methane emission is also important for environmental considerations and for identifying opportunities to capture andutilize the methane for energy production.
Prediction of methane emissions before mining is difficult since it depends on a number of geological, geographical, andoperational factors. This study proposes a principle component analysis (PCA) and artificial neural network (ANN)-based approachto predict the ventilation methane emission rates of U.S. longwall mines.
Ventilation emission data obtained from 63 longwall mines in 10 states for the years between 1985 and 2005 were combinedwith corresponding coalbed properties, geographical information, and longwall operation parameters. The compiled databaseresulted in 17 parameters that potentially impacted emissions. PCA was used to determine those variables that most influencedventilation emissions and were considered for further predictive modeling using ANN. Different combinations of variables in thedata set and network structures were used for network training and testing to achieve minimum mean square errors and highcorrelations between measurements and predictions. The resultant ANN model using nine main input variables was superior tomultilinear and second-order non-linear models for predicting the new data. The ANN model predicted methane emissions withhigh accuracy. It is concluded that the model can be used as a predictive tool since it includes those factors that influence longwallventilation emission rates.Published by Elsevier B.V.
Keywords: Longwall mining; Ventilation; Methane emissions; Principle component analysis; Artificial neural networks
1. Introduction
Longwall mining is an underground mining methodthat can maximize coal production in coalbeds thatcontain few geological discontinuities. In these opera-tions, a mechanical shearer progressively mines a largeblock of coal, called a panel, which is outlined withdevelopment entries or gate roads. This is a continuous
process in an extensive area, where the roof is supportedonly temporarily during mining with hydraulic supportsthat protect the workers and the face equipment (Fig. 1).As the coal is extracted, the supports automaticallyadvance and the roof strata are allowed to cave behindthe supports (Karacan et al., 2007a).
Methane emissions can adversely affect the safety ofunderground coal miners. During longwall mining,methane emissions can originate from three majorsources. These sources are: 1) gas emissions from theE-mail address: [email protected].
0166-5162/$ - see front matter. Published by Elsevier B.V.doi:10.1016/j.coal.2007.09.003

ribs surrounding the bleeder ventilation system, 2) gasemissions from the active longwall face and mined coalon the conveyor belts, and 3) gas emissions fromsubsided strata (Mucho et al., 2000).
The first gas source originates from the unminedcoalbed adjacent to the development entries of thebleeder system and from the solid coal ribs. Although thisemission tends to decrease over time, its total maybecome a significant contributor of gas to the bleederventilation system over time (Mucho et al., 2000). Thesecond source is the combination of the gas content fromthe mined coal itself, the methane being emitted from thefresh face on the longwall, and the methane emitted fromthe coal transported out of the mine by the conveyer belts.Methane emissions from the face, ribs, and conveyor beltare directly discharged into the mine ventilation air;therefore, the ventilation system must have sufficientcapacity to maintain methane levels within statutorylimits. The third source is the fractured and caved rock inthe subsided strata (gob) overlying the extracted panel asthe longwall face advances. The subsided strata aregenerally characterized as being made up of the cavedzone, fractured zone, and the bending zone. The cavedzone is characterized as a fragmented rock mass(completely caved) overlain by strata with extensivefractures (partially caved). The height of the caved zoneis about 3 to 6 times the thickness of the mined coalbed(Singh and Kendorski, 1981; Palchik, 2003). The stressrelief due to caving causes the overburden strata abovethe caved zone, including gas-bearing coalbeds, tofracture both vertically and horizontally. The thicknessof the fractured zone can vary up to 100 times the heightof the mined coalbed, depending on the size of the panel,the geology, and the geomechanical properties of thelayers (Palchik, 2003). The methane from this source isusually controlled by vertical boreholes drilled into thefractured zone to reduce the migration of methane fromthe fractured zone to the caved zone and finally to theventilation system.
Accurate prediction of longwall methane emissions isimportant so that adequate ventilation air is supplied todilute and render harmless high gas levels that threatenmine safety. It is also important to identify opportunitiesto utilize mine ventilation air for energy production.Underground coal mines worldwide liberate an estimat-ed 1–1.5×10¹² scf (29–41×109 m3) of methaneannually, of which less than 2.3×10⁹ m3 (81×109 scf)are used for fuel (Bibler et al., 1998). Thus, in order toprovide a safer mining environment to undergroundminers and to make investment decisions into methaneutilization technologies, ventilation emissions of thelongwall mines must be predicted accurately.
Accurate prediction of the rate ofmethane flow into theworking areas and eventually into the ventilation systemis complex due to the large number of variables involvedwith these potential emission sources. Some of thevariables reported by Lunarzewski (1998) are lithology-and stratigraphy-related and include coal and rockproperties in the floor and roof strata, depth of themined coalbed, reservoir properties of coalbed, gascontent of mined coal seams, coal rank, and strength ofthe overlying strata. Variables originating from theminingprocess include longwall face width, face advance rates,methane drainage, conveyor speeds, and thickness of themined seam, as well as time-dependent changes in theseparameters.
The complexity of the longwall mining process andits associated methane sources have been modeled byseveral researchers. Schatzel et al. (2006) and Krog et al.(2006) empirically determined the increase in emissionsfor wider longwall faces using a graphical method andby including the effects of various methane contributors,respectively. Also, by the premise that gas emissions inunderground mine environments can be linked todifferent stages in the life of a coal mine, the followingempirical model was suggested (Lunarzewski, 1998):
Q yð Þ ¼ gCA
Xyþ1
0
C
!m
þ1�Xy
0
C
� �m
þ1
!ð1Þ
where: Q(y) is the average methane emission in a year‘y’ of the mine's existence (m3), CA is the coalproduction in the most recent year only (tonnes), C isthe coal production for the life of the mine up to year ‘y’(tonnes), and g and m are the site-specific coefficientsdependent upon geological and mining conditions. Inother words, this approach summarizes methane emis-sions as a function of coal production only and lumpsother variables into empirical constants. A similar,lumped-parameter approach for estimating the instanta-neous volume of gas released from all potential sourcesis given by Lunarzewski (1998):
R ¼ affiffiffiffiffiffiCP
pþ b ð2Þ
In this equation, R is the total methane emission rate(liters per second), CP is the daily coal production rate(tonnes), and a and b are empirical constants related tocoal production levels and number of working days perweek.
Although simple to use, the above approaches aresite-specific and require a long period of data collectionbefore a correlation can be established for predic-tions. Also, they lump the variables into two empirical
372 C.Ö. Karacan / International Journal of Coal Geology 73 (2008) 371–387

constants which limits their applicability for other mineswith similar coal production levels but different miningor geological conditions.
Some of the limitations of empirical models can beaddressed by calibrating the models and realisticallyrepresenting additional variables. Lunarzewski (1998)used boundary element and sequential bed separation tomodel floor and roof strata relaxation and immediateroof bending separation. “Floorgas” and “Roofgas”simulation programs were developed to characterize thestrata relaxation zones, gas emission boundaries, andparameters for gas emission prediction. Tomita et al.(2003) developed a three-dimensional (3-D) finiteelement model (FEM) to predict the volume of methanegas emitted from surrounding coal and rock layers basedon stress distribution and permeability changes. Karacanet al. (2005, 2007b) developed a 3-D reservoir model ofa longwall mining district to simulate the effects ofincreasing longwall panel widths on methane emissions,the performances of gob gas ventholes, and degasifica-tion planning. This work predicted an increase inemissions due to increasing panel width and the optimalgob gas completion and placement strategies used toprevent the gas from entering the underground work-place. However, numerical models require expertise inusers and, in most cases, specialized and expensivesoftware packages. Also, it is not possible or feasible tonumerically represent every process that contributes tomine emissions with these models.
Artificial neural networks (ANNs), on the other hand,are adaptable systems that can determine relationshipsbetween different sets of data. ANNs have beendeveloped to solve problems where conventionalcomputer models are inefficient. These problems areeither the non-polynomial type, having no polynomialrelationship, or very complex problems that are difficultto describe mathematically. The key advantages ofneural networks are their abilities to learn, to recognizepatterns between input and output space, and togeneralize solutions. Statistical techniques such asmultiple regression analysis have been used widely forthese kinds of problems, but they often fail in accuracy ofprediction, especially in the face of highly non-linearrelationships.
ANNs, due to their flexibility, have found their wayinto many fields of application. Patel et al. (2007) usedartificial neural networks for estimation of grosscalorific values of coals. Bagherieh et al. (in press)used the technique to study the relationships betweenpetrography and grindability of Kentucky coals. Yılmazet al. (2002) used ANN and fractal geostatistics to solvethe optimum bit selection problem during drilling in a
carbonate field. Sousa et al. (2007) performed a study topredict atmospheric ozone concentrations using princi-ple component analysis and ANN. Karacan (in press)integrated reservoir simulations during developmentmining with ANN to predict methane emissions intoroadways and to optimize ventilation air requirements.Maier and Dandy (2000) provided an overview ofmodeling issues and application of ANN for forecastingwater resources.
The aim of this paper is to develop an ANN-basedmethodology to predict ventilation emissions fromlongwall mines for mine safety applications and toidentify opportunities for utilizing ventilation methane.Ventilation emission data obtained from different U.S.mining regions were combined with correspondingcoalbed properties, geographical information, longwalloperation parameters, and productivities. The databasewas analyzed using PCA to reduce complexity and todetermine the variables to be considered for ANNmodeling. The ANN model was built using a multilayerperceptron (MLP) approach and was trained and testedusing the database to achieve minimum mean squareerror and high correlations between measurements andpredictions.
2. Description and analysis of database
2.1. Sources of input data for ventilation emissionmodeling
In developing the database for modeling ventilationemissions, 63 longwall mines in 10 states operatingbetween 1985 and 2005 were analyzed. Available datasources were searched and evaluated carefully for thesemines to extract important parameters relevant toventilation emissions. These sources provided gascontents of the mined coalbeds, annual coal productionsand emissions, longwall operational parameters, andmine characteristics.
Gas contents of the mined coalbeds, based on theirgeographical location at the mining depths, werecompiled from a report published by Diamond et al.(1986). The publication contains approximately 1500coal samples taken during various drilling operationsfrom more than 250 coalbeds in 17 states. Thecomponents of total gas content (lost, desorbed, andresidual gas contents) were reported along with samplelocation (state and county), sample depth, coalbedname, coal rank, and ash content. The lost gas wasdetermined by a graphical method which estimated howmuch gas was lost during core recovery. Desorbed gaswas determined using the direct method determination
373C.Ö. Karacan / International Journal of Coal Geology 73 (2008) 371–387

of gas content (Diamond and Schatzel, 1998) andresidual gas was determined after crushing the coalsamples using a ball mill. The total gas content wasreported as the sum of all three components.
Annual coal production and ventilation emission dataof longwall mines included in this study were takenfrom the U.S. Environmental Protection Agency (EPA)reports (1994, 1997, 2005) published to identify coalmine methane production opportunities in U.S. coalmines. These reports list various general mine informa-tion including geographical data, availability of degasi-fication systems, sulphur content, and heating value ofmined coals along with annual coal productions andemissions from ventilation systems. The reports containinformation for both large room-and-pillar and longwalloperations. (However, in this study, only longwall mines
were considered for analysis.) In the EPA reports, mostof the profiled mines are large operations with coalproductions exceeding one million tons per year. Coalproduction data reported in EPA reports were primarilybased on the U.S. Energy Information Administration(EIA) database, which is supplemented with data fromcoal producing states and from the U.S. Mine Safety andHealth Administration (MSHA). The data for 2004 and2005 were taken directly from MSHA's data retrievalsystem (MSHA, 2007). Emissions data from theventilation systems were collected by MSHA personnel,who measured methane emission rates at each coal mineon a quarterly basis. Measurements were performedunderground at the same locations each time. Thereported ventilation emissions for a given year areaverages of the four quarterly tests.
Fig. 1. Schematic representations of a panel surrounded with a three-entry gateroad system (A). B is a vertical cross-section along the X–XI profile inA. C is a detailed view of shearer and cutting depth while mining coal.
374 C.Ö. Karacan / International Journal of Coal Geology 73 (2008) 371–387

Mining parameters andmine characteristics affect howmuch and how fast methane will be generated as a resultof coal production. These factors also affect how muchstrata gas will be released and how much of it will enterthe ventilation system as a result of caving and fracturingof the overlying strata. The annual data representing minecharacteristics and mining parameters were compiledfrom1985–2005 issues of Coal Age (MiningMedia Inc.),which publishes longwall census data annually. Thetabulated data for each operation in the correspondingyear includes seam height, cutting height, cutting depth,overburden thickness, longwall panel width, longwallpanel length, number of development entries, faceconveyer speed, and stage loader speed.
Table 1 shows the number of longwall operations ineach state. Table 2 lists variables and their units. Therewere some important considerations when preparing thefinal database. One of them was the need to form acomplete set of input data using each source for aparticular mine and year. For instance, if the productionand emission data were available for a particular mine and
year, but the census data were not, then that year's entrywas excluded from the database. Also, the operating statusand, sometimes, the names of the mines had changed overthe 20-year period. Some of the mines producing coal in1980s were abandoned, while new ones were started inlater years. After evaluation of all data, the database usedfor ANN modeling consisted of 538 data entries with 24variables spanning a 20-year period (Table 2).
2.2. Discussion of database parameters for theirpotential effects on ventilation emissions
This section summarizes the possible effects on ven-tilation emissions of the variables presented in Table 2.
Table 1The number of mines and the mine names in each state included in themethane emission database
State No. ofmines
Mine names
Alabama AL 8 Blue Creek No.3, Blue Creek No.4,Blue Creek No.5, Blue Creek No.7,North River, Mary Lee, Oak Grove,Shoal Creek
Colorado CO 4 Deserado, Dutch Creek, Golden Eagle,West Elk
Illinois IL 7 Galatia, Old Ben 24, Old Ben 25, OldBen 26, Orient No.6, Monterey No.1,Rend Lake
Kentucky KY 4 Wolf Creek No. 4, Wheatcroft No. 9,Camp No.11, Baker
Maryland MD 1 MettikiOhio OH 4 Meigs No. 2, Meigs No. 31, Powhatan
No.4, Powhatan No.6Pennsylvania PA 10 Bailey, Eighty Four, Enlow Fork,
Maple Creek, Cambria, Cumberland,Warwick, Homer City, Dilworth,Emerald
Utah UT 4 Aberdeen, Sunnyside No. 1, DugoutCanyon, West Ridge
Virginia VA 7 Buchanan, V. P. No.8, V. P. No.1, V. P.No.6, V. P. No.5, V. P. No.3, McClureNo. 1
WestVirginia
WV 14 Blacksville No.2, Federal No.2,Loveridge No. 22, McElroy, PinnacleNo. 50, Robinson Run No. 95, Ireland,Osage No. 3, Shoemaker, Windsor,Shawnee, Arkwright, Blacksville No.1,Humphrey No.7
Table 2The variables and their units in the database for each mine compiledfrom different sources
Variable Unit Minimum Maximum Mean Std. dev.
State –Basin –County –City –Degasification Yes/NoMined
coalbed–
Sulphuramount
%
Coal calorificvalue
BTU/lb
Lost+desorbedgas
scf/ton 6.4 542.1 176.5 144.0
Residual gas scf/ton 3.2 97.4 47.8 29.3Total gas scf/ton 9.6 585.9 224.3 135.7Rank –Ash content %Coal
production106 shortton/y
0.1 11.1 3.3 2.1
Seam height inch 39.0 276.0 80.2 34.3Cut height inch 43.0 156.0 77.7 18.7Panel width ft 400.0 1100.0 823.6 149.5Panel length ft 2200.0 13000.0 7679.3 2361.8Overburden ft 300.0 2700.0 994.3 509.0Number of
developmententries
– 2.0 5.0 3.5 0.6
Cut depth inch 27.0 44.0 34.7 4.4Face conveyor
speedft/min 187.0 450.0 278.1 41.5
Stage loaderspeed
ft/min 220.0 600.0 353.7 64.3
Year –
Variables in bold were excluded from further analysis. Table alsoshows the ranges of numeric input data included in the PCA analysis.Alphanumeric data were represented in the PCA analysis by assigningcodes. (SI conversions: 1 inch=0.0254 m, 1 ft = 0.3048 m,1 ft3=0.02832 m3).
375C.Ö. Karacan / International Journal of Coal Geology 73 (2008) 371–387

Fig. 1 provides schematic representation of some of thevariables discussed in the following sections. Fig. 1Ashows the graphical representation of a panel sur-rounded with a three-entry gateroad system, the gob andcaving behind the shields, and the face area, conveyors,and unmined section of the coal seam. Fig. 1B is avertical cross-section along the X–XI profile in Fig. 1A.This figure shows how overlying strata are supported byshields above the personnel and shearer, the caving andfracturing of the overlying strata after the longwallsupports advance, the coal seam, and mining heights.Fig. 1C is a detailed view of shearer and cutting depthwhile mining coal.
2.2.1. Parameters related to gas content of the coalseam
Gas content is among the key data included incoalbed methane resource estimations (Boyer andQingzhao, 1998). The gas content data, when combinedwith geologic and engineering data, can be used as abasis for an initial estimate of methane emissions andventilation requirements (Diamond et al., 1986; Noack,1998; Karacan and Diamond, 2006).
Gas content has three major components: lost gas,desorbed gas, and residual gas. The combination of allof these gives the total gas content of the coalbed.During mining, all three components potentially con-tribute to methane emissions into the mine atmosphere,and these emissions can increase as the gas content ofthe coal increases. Fig. 2 shows the change in ventilationemissions from the mines in the database versus lostplus desorbed and total gas contents of the mined coalseams. The figure shows that there is a general positivecorrelation and that emissions tend to increase withincreasing gas contents.
Rank represents the level of maturation reached in acoal seam and usually increases with increasing depth.Most longwalls, as well as most commercial coalbedmethane projects, operate in bituminous coalbeds. Thecoals of sub-bituminous to low-volatile bituminous rangeusually provide high gas content and natural permeability(Steidl, 1996). Mining coals of this rank, particularlymedium- to low-volatile bituminous coals, potentiallyliberates high amounts of gas into the ventilation system.
Depth of the mined coal seam, or its overburden(Fig. 1B), impacts methane emissions in two ways. First,for coals of the same rank, gas content generally increaseswith increasing depth (Kim, 1977). The second impact ofoverburden is on the disturbance created in the overlyingstrata. This effect can be relative to the width of theextracted panel. If panel width (Fig. 1A) is greater thanoverburden depth, the panel is referred as a “supercritical”panel (Mucho et al., 2000). This designation implies that,for the same type of roof material and stratigraphicsequence, the caving will be more complete after miningcompared to a situation where the panel width is less thatthe overburden depth. Besides its ground controlimplications, this situation may potentially affect themethane reservoir and permeability pathways in theoverlying strata and may impact the emissions into themine and into the ventilation system (Karacan et al., 2005,2007a). Fig. 3 shows ventilation emissions of the mines inthe database of this study versus overburden thickness ofthe mined coal seams. The plot shows that there is ageneral positive correlation between methane emissionsand overburden depth.
2.2.2. Panel size, coal productivity, and longwalloperational parameters
Panel dimensions influence ventilation emissionsby impacting the dimensions of the subsided strata
Fig. 2. Methane emissions from ventilation system of the mines from1985 to 2005 as a function of total and lost plus desorbed gas contents ofthe coalbeds they operated (1 ft3=0.02832 m3, 1 MMscf=28,320 m3).
Fig. 3. Methane emissions from ventilation system as a function ofoverburden thicknesses from 1985 to 2005 (1 ft =0.3048 m,1 MMscf=28,320 m3).
376 C.Ö. Karacan / International Journal of Coal Geology 73 (2008) 371–387

overlying the extracted panel and the emissions from thelongwall face. Current panels are typically 305 m(1000 ft) in width (with a continual trend towards evenwider panels) and usually over 3000 m (10,000 ft) inlength. The increasing size of longwall panels, whilehelping to increase coal production, may also increasemethane emissions due to the exposure of the miningenvironment to a larger area of fractured, gas-bearingstrata. If not captured effectively, additional gasemissions from bigger, fractured formations (Fig. 1B)enter the mining environment and increase ventilationemissions (Karacan et al., 2005). The increase in panelwidth (Fig. 1A) also increases face emission rates duringmining operations. This gas inevitably enters theventilation system (Schatzel et al., 2006; Krog et al.,2006).
Fig. 4 shows a plot of ventilation emissions of thelongwalls in the database as a function of their facewidths. The linear trendline passing through the datashows that there is a slight positive correlation betweenventilation emissions and longwall face widths. How-ever, since ventilation emission is affected by othermining and geological related factors too, this relation isfar from being a strong linear one.
Cut depth (Fig. 1C) is the slice of coalbed that ismined by the shearer during each pass. In general, thegreater the cutting depth, the more coal is produced perrotation and the greater the emissions. However,emissions may also be affected by the rotational speedof the cutting drum and the loading rate of the shearer. Ifthe drum is rotating fast compared to haulage speed,then a finer coal fraction is produced (Peng, 2006),which potentially increases emissions.
The face conveyer and stage loader (Fig. 1A) areparts of the coal transfer system. Their main roles are tocarry the cut coal from the face environment and to
transfer it to the belt conveyor, respectively. Theyshould have high capacity and should operate as fast asis practical to ensure continued coal production. Theirspeeds are important so that the coal is moved from theface area as quickly as possible to minimize emissionsfrom the broken coal on the conveyor.
Most of the operational parameters contributing togas emissions also impact coal production. Practicalexperience has shown that gas emissions are directlyrelated to coal production (Lunarzewski, 1998). Themore coal that is mined the higher the emission rates.Fig. 5 shows the relationship between coal productivityof the mines in the database and their methane emissionrates as measured in the ventilation system. The figureshows that emissions are positively correlated with coalproduction.
2.2.3. Seam and cut (mining) heightAlthough mining height is an operational parameter,
it is usually equal or related to the seam height. Usually,mining height is equal to the seam height. In some thinseam mines, the roof is also extracted, depending on therock material, to make room for equipment andpersonnel. Seam and mining height impact ventilationemissions because thick, permeable, and gassy coalbedspotentially generate more gas from the longwall facecompared to their thinner counterparts. In addition,caving height is proportional to mining height (Peng,2006). Thus, the greater the mining height, the higherthe caving will be and the greater the potential for moregas to flow into the gob from the overlying strata. If themining height is less than the coal seam height—forexample in thick seam mining by top coal caving (Ünverand Yasıtlı, 2006) or where the operator leaves top orbottom coal for ground control purposes—some of theunmined coal seam stays in the gob and may generateadditional gas.
Fig. 4. Methane emissions from ventilation system as a function oflongwall panel widths of the analyzed mines between 1985 and 2005(1 ft=0.3048 m, 1 MMscf=28,320 m3).
Fig. 5. Methane emissions from ventilation system as a function ofannual coal productions of the analyzed mines between 1985 and 2005(1 MMscf=28,320 m3).
377C.Ö. Karacan / International Journal of Coal Geology 73 (2008) 371–387

2.2.4. Parameters related to gas removalGateroads are an integral part of longwall mining.
They are mainly used for ventilation and transportationpathways in underground operations. In the U.S., someof the early mines used five-entry gateroads. Today,three-entries are preferred since they require lessdevelopment footage compared to four- or five-entrysystems. A four-entry system is used in coal seams oflow height and high gas content. These mines requiremore air and thus more entries to minimize resistances.Two-entry gateroads require a special variance and areused in deep mines with a thick layer of strong overlyingstrata, such as operations in Colorado and Utah (Peng,2006). Thus, the increased number of entries is both anindicator of the gassiness of the mine and a contributorto emissions since it creates additional surfaces fromwhich methane can flow into the ventilation system.
Degasification of the coal seam and the overlyingstrata prior to and during mining are effective ways ofcontrolling methane emissions during mining (Thakurand Puondstone, 1980; Diamond, 1994; Karacan et al.,2007b). An effective degasification process can reduceemissions into the ventilation system. Depending on thegassiness of the coal seam and the fractured strata,horizontal boreholes, vertical boreholes, or gob gasventholes can be used. The number of boreholes, theirlocations, and their degasification durations may changebased on site-specific factors (Diamond, 1994).
2.2.5. Geographical location (state and basin)A strong relationship exists between gas emission
rates and geological factors, such as stratigraphy and thegas contents and strengths of the overlying andunderlying strata. Pashin (1998) reported, based oninvestigations in the Black Warrior Basin and in the SanJuan Basin, that regional variations in sequencestratigraphy were useful for characterization of coalbedmethane reservoirs, in that they were affected byregional sedimentology and tectonics. Although geo-graphical location is not directly related to methaneemissions, it indirectly identifies the differences inunderground stratigraphy (schematically shown in Fig.1B) between different locations. This variable also maybe used to identify geological differences in the absenceof direct geological data.
The discussions in this section show that complexrelations exist between different factors and the resultantemission rates from longwall operations. In fact, theserelations are too complex to be explained by simplepolynomial relations or statistical methods, suggestingthat an ANN approach may be a good candidate formodeling ventilation emissions.
3. Model complexity reduction forANNdevelopment:Principle component analysis (PCA)
As in any other prediction models, in ANNmodeling, the number and selection of appropriateinput parameters are very important (Faraway andChatfield, 1998). Thus, the key issue is to determineand select the appropriate input parameters based onknowledge of the causal variables and a familiarity withthe modeled system.
Hybrid ANN models integrated with various statis-tical techniques partially address the need for reducingthe number of input parameters by internally determin-ing which model inputs are critical among all variablesfor a modeling study. One of the disadvantages of hybridmodels is that presenting a large number of inputs toANN models, while relying on the network to determinethe critical model inputs, usually increases network sizeand decreases processing speed (Maier and Dandy,2000). Although easier to implement especially whenthe modeled system is not well understood, thesemodels select variables automatically and thus eliminatethe knowledge and expertise of the user in selecting theinputs. Therefore, if the relationship to be modeled iswell understood, there are distinct advantages in usinganalytical techniques such as cross correlation analysisor principle component analysis (PCA) to determine theinputs for ANN models (Maier and Dandy, 2000).
In this study, PCA was used for selecting the mostappropriate input variables from all the variablespresented in Table 2. Identifying principle components(PCs) reduces the dimensionality of a data set, whileretaining as much of the variance in the data set aspossible. This reduction is achieved by transforming theoriginal variables into PCs, which are orthogonal andhighly uncorrelated to each other. Most of the variancein the data set is retained in the first components thatcontribute to variance to a greater degree. Elimination ofPCs that do not contribute to the variance of the datadecreases the dimension of the data set, while revealinginformation on correlations between variables and theirweights in corresponding PCs (Davis, 1986; Grima,2000; Grima et al., 2000).
3.1. Preliminary data evaluations and results of PCA
Before performing PCA using XLStat statisticalpackage (Addinsoft, 2007), all the variables in Table 2were evaluated. The variables of city, county, coalbedname, calorific value of the produced coals, ashcontents, and sulphur contents were eliminated. Thiswas done because these variables were more related to
378 C.Ö. Karacan / International Journal of Coal Geology 73 (2008) 371–387
combustion efficiency rather than their methane emis-sion potentials, or they were represented by otherparameters in the data set. The variable “year” iscategorical information and cannot be used as a variablefor future projects or for new operation conditions topredict emissions. Thus, this parameter was alsoeliminated from the data set. With elimination of theseseven variables, Table 2 was reduced to 17 variables toperform PCA. The variables represented by alphanu-meric information in this table were designated bynumeric information for PCA. The presence or absenceof any degasification system in a particular mine waslabeled either 1 or 0, respectively, in order to be includedin the PCA. Table 2 also gives the ranges and mean andstandard deviation information for the inputs repre-sented by numeric information.
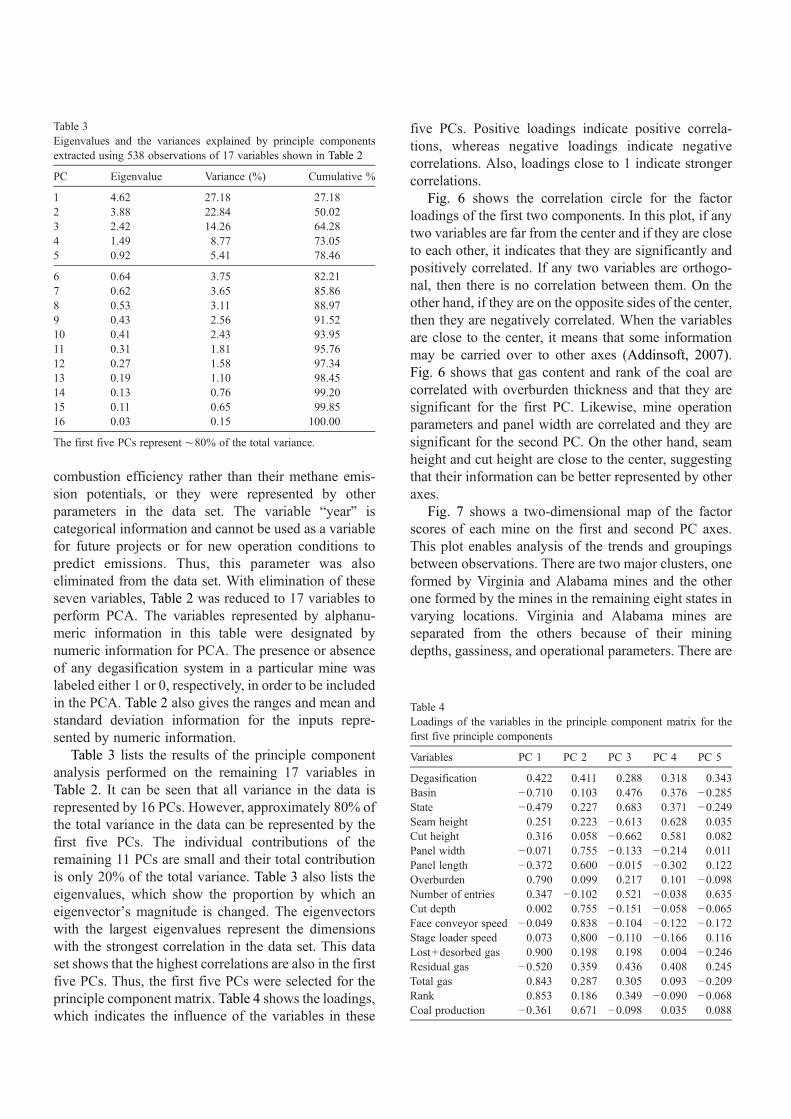
Table 3 lists the results of the principle componentanalysis performed on the remaining 17 variables inTable 2. It can be seen that all variance in the data isrepresented by 16 PCs. However, approximately 80% ofthe total variance in the data can be represented by thefirst five PCs. The individual contributions of theremaining 11 PCs are small and their total contributionis only 20% of the total variance. Table 3 also lists theeigenvalues, which show the proportion by which aneigenvector's magnitude is changed. The eigenvectorswith the largest eigenvalues represent the dimensionswith the strongest correlation in the data set. This dataset shows that the highest correlations are also in the firstfive PCs. Thus, the first five PCs were selected for theprinciple component matrix. Table 4 shows the loadings,which indicates the influence of the variables in these
five PCs. Positive loadings indicate positive correla-tions, whereas negative loadings indicate negativecorrelations. Also, loadings close to 1 indicate strongercorrelations.
Fig. 6 shows the correlation circle for the factorloadings of the first two components. In this plot, if anytwo variables are far from the center and if they are closeto each other, it indicates that they are significantly andpositively correlated. If any two variables are orthogo-nal, then there is no correlation between them. On theother hand, if they are on the opposite sides of the center,then they are negatively correlated. When the variablesare close to the center, it means that some informationmay be carried over to other axes (Addinsoft, 2007).Fig. 6 shows that gas content and rank of the coal arecorrelated with overburden thickness and that they aresignificant for the first PC. Likewise, mine operationparameters and panel width are correlated and they aresignificant for the second PC. On the other hand, seamheight and cut height are close to the center, suggestingthat their information can be better represented by otheraxes.
Fig. 7 shows a two-dimensional map of the factorscores of each mine on the first and second PC axes.This plot enables analysis of the trends and groupingsbetween observations. There are two major clusters, oneformed by Virginia and Alabama mines and the otherone formed by the mines in the remaining eight states invarying locations. Virginia and Alabama mines areseparated from the others because of their miningdepths, gassiness, and operational parameters. There are
Table 3Eigenvalues and the variances explained by principle componentsextracted using 538 observations of 17 variables shown in Table 2
PC Eigenvalue Variance (%) Cumulative %
1 4.62 27.18 27.182 3.88 22.84 50.023 2.42 14.26 64.284 1.49 8.77 73.055 0.92 5.41 78.46
6 0.64 3.75 82.217 0.62 3.65 85.868 0.53 3.11 88.979 0.43 2.56 91.5210 0.41 2.43 93.9511 0.31 1.81 95.7612 0.27 1.58 97.3413 0.19 1.10 98.4514 0.13 0.76 99.2015 0.11 0.65 99.8516 0.03 0.15 100.00
The first five PCs represent ∼80% of the total variance.
Table 4Loadings of the variables in the principle component matrix for thefirst five principle components
Variables PC 1 PC 2 PC 3 PC 4 PC 5
Degasification 0.422 0.411 0.288 0.318 0.343Basin −0.710 0.103 0.476 0.376 −0.285State −0.479 0.227 0.683 0.371 −0.249Seam height 0.251 0.223 −0.613 0.628 0.035Cut height 0.316 0.058 −0.662 0.581 0.082Panel width −0.071 0.755 −0.133 −0.214 0.011Panel length −0.372 0.600 −0.015 −0.302 0.122Overburden 0.790 0.099 0.217 0.101 −0.098Number of entries 0.347 −0.102 0.521 −0.038 0.635Cut depth 0.002 0.755 −0.151 −0.058 −0.065Face conveyor speed −0.049 0.838 −0.104 −0.122 −0.172Stage loader speed 0.073 0.800 −0.110 −0.166 0.116Lost+desorbed gas 0.900 0.198 0.198 0.004 −0.246Residual gas −0.520 0.359 0.436 0.408 0.245Total gas 0.843 0.287 0.305 0.093 −0.209Rank 0.853 0.186 0.349 −0.090 −0.068Coal production −0.361 0.671 −0.098 0.035 0.088
379C.Ö. Karacan / International Journal of Coal Geology 73 (2008) 371–387

also some scattered data points between these two mainclusters. These are due to operations having character-istics similar to those in either cluster. For instance, thedata points between the clusters located on the positiveside of the PC2 axis belong to Pinnacle No. 50 mine.Although this mine is geographically located in WestVirginia, it operates in the Pocahontas No. 3 coalbed,making it similar to the Virginia mines. Similarly, someof the data on the negative side of the second PC axisbelong to North River mine of Alabama. However, its
operating depth is shallower [152 m–183 m (500–600 ft)] and the gas content of this coalbed is lesscompared to the other Alabama mines. Thus, it isseparated from the group and approaches those opera-tions with which it shares similar characteristics.
3.2. Analysis of rotated principle component matrix
In order to improve interpretability, PCA wascontinued with a new component matrix that was createdby using Kaiser's varimax rotation method, in which PCaxes are rotated to a position in which the sum of thevariances of the loadings is a maximum (Grima, 2000;Grima et al., 2000). Table 5 shows the rotated matrix forthe five components given in Table 4 and the factorloadings for each variable after rotation. It can be seenthat the rotated table not only shows the loadings of eachvariable in new components (PCR), but also shows howthe variables are separated between columns accordingto their characteristics or to the properties that theyrepresent. The table shows that the first PCR is mostlyrelated to gas content of the mined coalbed with bothoverburden and rank positively correlated with total andlost plus desorbed gas contents. The highest loading isfrom total gas content (0.960), followed by lost plusdesorbed gas (0.954), rank (0.907), and overburdenthickness (0.808). The second PCR represents longwallpanel dimensions, coal productivity, and underground
Fig. 7. A two-dimensional distribution of factor scores of each mine( Table 1) on the first two principle components determined by PCAfor 1985–2005. The plot shows the groupings of mines of similarcharacteristics (based on 17 variables).
Fig. 6. A correlation circle showing the magnitude and directions of the variable loadings in the first two principle components.
380 C.Ö. Karacan / International Journal of Coal Geology 73 (2008) 371–387

coal transportation. In this group, face and stageconveyer speeds have the highest loadings (0.834 and0.811, respectively), followed by longwall panel width,cut depth, and panel length. The loading of coal pro-duction is less. However, coal production for a givenyear is a function of other parameters in this column,such as cut depth and panel dimensions. Therefore, it isincorrect to say that coal production has less importancein determining ventilation emissions.
The third PCR in Table 5 is related to the geo-graphical location of the mine determined by state andcoal basin. These variables have high loadings in thiscomponent, 0.951 and 0.917, respectively. They are theonly variables in the database that may be linked to theimpacts of underground geology, overlying strata, andreservoir properties of the coalbeds on ventilationemissions. However, since a single coal basin can bepresent in more than one state, and undergroundgeology may change based on geographical location,the state variable seems to be a better identifier to signifya local area. The fourth PCR represents the coalbed andmining height in the longwall environment. Theseparameters affect potential emissions from the thicknessof the fractured strata and the methane emissions fromface and ribs. Also, the difference between seam heightand cut height may indicate that the unmined portion ofthe seam is going to be left in the caved zone and that itsmethane emissions will contribute to the ventilationemissions. The fifth PCR represents the ventilationsystem components. The only parameters that represent
ventilation system components in the database are thenumber of gateroad entries and the presence or absenceof any degasification system. In most cases, if themethane content of the coalbed or strata is high, verticalgob gas ventholes and vertical and horizontal degasifi-cation boreholes are drilled to remove gas before itenters the ventilation system (Karacan et al., 2007b).
It should be noted that the groupings of the variablesdetermined by PCA are in accordance with the group-ings of the variables used in discussing their effects onemissions (Section 2.2). Since the relationships betweenmost of the parameters and the ventilation emissions arenon-linear, the results of PCA need to be evaluated withcare. However, it seems reasonable to include inputvariables from each of the five PCs into the ANN modeldevelopment in order to capture roughly 80% ofvariance in the data and to represent those aspectsimpacting ventilation emissions.
4. Development of ANN for predicting ventilationemissions from longwall mines
4.1. Basic considerations of building an ANN
A neural network simulates a highly interconnected,parallel computational structure of the brain with manyrelatively simple individual processing elements, calledneurons (Eberhart and Dobbins, 1990). The input–outputflow of a network is determined by the connections andthe operation of the neurons. The operation of a singleneuron is dependent on the weighted sum of the incomingsignals and a bias term, fed through an activation function,resulting in an output. This process can be shown as(Grima, 2000):
yi ¼ fXnr¼1
wirfXmj¼1
vrjuj þ br
!þ ci
!i ¼ 1; N ; l
ð3Þwhere u is the m×1 input vector, y the l×1 output vector,n the number of neurons in the hidden layer, v and w arethe weight factors, f (.) is the activation function, and brand ci are the bias values of the neurons in the hidden andoutput layers. Neurons are networked (topology) in anumber of ways depending on the problem type andcomplexity. One of the most widely used topologies is themultilayer perceptron (MLP) because it can be applied inalmost every kind of modeling, general classification, andregression. One of the critical issues in using MLPs is thechoice of the number of neurons, and thus weights, in thehidden layers (Hornik et al., 1989; Flood and Kartam,1994; Maier and Dandy, 2000).
Table 5Factor loadings of the variables after rotating the principle component(PCR) matrix using Kaiser's varimax rotation
Variables PCR1 PCR 2 PCR 3 PCR 4 PCR 5
Degasification 0.472 0.221 0.163 0.245 0.538Basin −0.287 −0.007 0.917 −0.136 −0.145State 0.002 0.049 0.951 −0.196 0.002Seam height 0.064 0.113 −0.093 0.925 −0.063Cut height 0.048 −0.027 −0.225 0.911 −0.043Panel width 0.036 0.798 −0.006 0.004 −0.029Panel length −0.248 0.701 0.093 −0.202 0.052Overburden 0.808 −0.075 −0.129 0.108 0.121Number of entries 0.271 −0.178 −0.045 −0.224 0.805Cut depth 0.125 0.745 0.056 0.142 −0.076Face conveyor speed 0.145 0.834 0.116 0.056 −0.167Stage loader speed 0.147 0.811 −0.048 0.070 0.105Lost+desorbed gas 0.954 0.024 −0.187 0.065 −0.011Residual gas −0.244 0.237 0.748 0.032 0.372Total gas 0.960 0.077 −0.036 0.076 0.068Rank 0.907 0.031 −0.174 −0.091 0.186Coal production −0.221 0.688 0.251 0.114 0.036
Bold entries show themost influential variables in each PCR ( Section 3.2).
381C.Ö. Karacan / International Journal of Coal Geology 73 (2008) 371–387

Within the hidden layer, the inputs are summed andprocessed by a non-linear function, called a transferfunction, or axon. While there are various transfer func-tions, the hyperbolic tangent is generally the preferredtransfer function. The non-linear nature of this functionplays an important role in the performance of a neuralnetwork.
The process of finding a suitable set of weights iscalled “training.” Training is one of the most importantsteps in the development of the neural network, since theweights and the network characteristics will be used laterin testing data sets and making subsequent predictions.The most common way of training the networks is via thesupervised training algorithms, which require repeatedshowings (epochs) of both input vectors and the expectedoutputs of the training set to the network to allow it tolearn the relations. The number of epochs needed to givean acceptable average error and the initial weights beforetraining are important considerations.
The neural network computes its output at eachepoch and compares it with the expected output (target)of each input vector in order to calculate the error. Anerror is defined for a given pattern (input–output) andsummed over all output neurons over the entire epoch.Then, the error is summed over all neurons giving agrand total for all neurons and all patterns. Finally, thegrand total is divided by the number of patterns to givean average mean squared error (MSE) (Eberhart andDobbins, 1990). Minimizing this error is the goal of thetraining process. The most widely used technique is topropagate the error back and adjust the weights in thenetwork, a process called back-propagation.
During error minimization, it is preferable to find theglobal optimum rather than local optima. This situationis helped by applying a momentum factor between 0 and1. Momentum increases the effective step size in shallowregions of error surface (Hassoun, 1995) and helps speedup the training process.
Once the training phase is complete, the performanceof the network needs to be validated on an independentdata set. Cross validation is a model evaluation methodthat gives an indication of how the ANN will performwhen it is confronted with data it has not yet seen. It isimportant that the validation data is not used as part oftraining (Maier and Dandy, 2000) since this willdeteriorate the results of the validation.
4.2. Preliminary models and the search for effectiveinput parameters
Development of an ANN uses parameter estimationand structure identification as fundamental steps. Using
PCA as described in the previous sections gives a goodidea as to which input parameters can potentially beincluded in a longwall ventilation emission model.However, it does not tell how many and exactly whichparameters should be included in the model to cope withthe complexity, non-linearity, and multivariable natureof the problem. PCA simply reduces the complexity andallows for a more targeted search.
This section presents the results of initial modelingattempts to find the appropriate input parameters for ANNmodeling using NeuroSolutions 5.0 (NeuroDimension,2006). This attempt was undertaken using a heuristicapproach. The strategy began with an ANN structurecommon to all models, where the input parameters weresubsequently changed to find the model yielding the bestresults. For this phase, 10 different models wereevaluated. In all models, the training and geometryoptions were the same. By keeping them so, all modelsand results had common properties which allowed forsuitable comparisons.
For the initial models, a two-hidden layer ANN wasconstructed with 50 and 30 processing elements for thefirst and second layers, respectively. A hyperbolictangent was selected as the transfer function for alllayers and a momentum factor of 0.7 was applied for1500 training epochs. The step size was 1 between theinput and first hidden layer and 0.01 between the secondhidden and output layer.
Table 6Different models tested in ANN for their efficiency in predictingventilation emissions and the variables included
Modelnumber
Input variables ⁎
1 OB, L+D gas, panel W, face C.S., coal P., state, seam H.2 OB, L+D gas, panel W, face C.S., coal P., state, seam
H., panel L.3 OB, L+D gas, panel W, stage L.S., coal P., state, seam
H.4 OB, total gas, panel W, face C.S., coal P., state, seam H.5 Total gas, panel W, face C.S., coal P., state, seam H.,
cut H.6 Total gas, panel W, face C.S., coal P., state, seam H.,
cut H., stage L.S.7 Total gas, panel W, face C.S., coal P., state, seam H.,
cut H., stage L.S., rank8 Total gas, panel W, face C.S., coal P., state, seam H.,
cut H., stage L.S., entries9 Total gas, panel W, face C.S., coal P., state, seam H.,
cut H., stage L.S., cut D.10 Total gas, face C.S., coal P., state, seam H., entries
⁎ OB: Overburden; L+D gas: lost+desorbed gas; panel w: panelwidth; face C.S.: face conveyor speed; stage L.S.: stage loader speed;panel L.: panel length; seam H.: seam height; cut H.: cut height; cut D.:cut depth; coal P.: coal production.
382 C.Ö. Karacan / International Journal of Coal Geology 73 (2008) 371–387

For pre-processing of the data, the whole dataset(exemplars) was first randomized and then separated intothree sections for use in the training, cross validation, andtesting phases. Randomization was used to prevent thebiases and to make different sections of the datasetrepresentative of the whole population. In separating thedataset, 403 out of 538 exemplars (75%) were saved astraining data, 54 exemplars (10%) were saved as a crossvalidation data set, and 81 exemplars (15%) were savedfor testing the trained network.
Table 6 summarizes the variables used in theprospective models. In order to evaluate the performanceof these models, minimum mean squared errors (MSE)were noted for training and cross validation phases. Thevalues of nominal mean squared error (NMSE),regression coefficient (R), and minimum and maximumabsolute errors, as well as MSE, were noted for testing.
Tables 7 and 8 show the performances of the models inthe training and cross validation phase and in the testingphase, respectively. The data show that almost all modelsproduce low training and cross validation errors. However,testing errors which can be evaluated by MSE, NMSE, R,and minimum and maximum absolute errors are lower for“model 8” than for the other models. In testing of “model8,” an MSE of 1.817 and an NMSE of 0.097 withregression coefficient to testing data of 0.95 are achieved.
Also, the leastmaximumabsolute error [95.8×10³ m3/day(3.383 MMscf/day)] is achieved with this model. Thus,total gas content, panel width, face conveyor speed, coalproduction, state, seam height, cut height, stage loaderspeed, and number of entries were selected as the inputvariables for the ventilation emission model.
4.3. Determination of final network parameters
After selecting the “model 8” input parameters, theoptimum network parameters were searched to improvethe predictive performance of the ventilation emissionmodel. For this purpose, various combinations of para-meters were tested. The number of hidden layers waschosen as two and the hyperbolic tangent transfer functionwas used as it was in the base model. The number ofprocessing elements in hidden layers and the value ofmomentumwere varied to improve themodel predictions.Values of minimum and final mean squared error (MSE)were noted for training and cross validation of the ANN.Also, values of nominal mean squared error (NMSE),regression coefficient, and absolute error were noted fortesting the ANN.
First, the numbers of processing elements in the firsthidden layer were varied between 44 and 62, whilekeeping the number of processing elements in thesecond layer at 30, keeping momentum at 0.7, andrunning the network for 1500 epochs. The resultsshowed that 56 processing elements in the first hidden
Table 9Testing performance of the final ANN model using the variables of“model 8” in Table 6 after optimizing network parameters
Performance parameter
MSE 1.613NMSE 0.086Min. error m3/day 84.96(MMscf/day) (0.003)Max. error m3/day (×103) 87.42(MMscf/day) (3.087)R 0.956
Table 8Performance of the tested models given in Table 6 with “testing” data set
Model number 1 2 3 4 5 6 7 8 9 10
MSE 2.528 2.682 2.582 2.523 1.821 1.968 1.924 1.817 1.971 2.275NMSE 0.135 0.143 0.137 0.134 0.097 0.105 0.102 0.097 0.105 0.121Min. error m3/day 623.04 339.84 453.12 509.76 56.64 84.96 113.28 368.16 28.32 877.92(MMscf/day) (0.022) (0.012) (0.016) (0.018) (0.002) (0.003) (0.004) (0.013) (0.001) (0.031)Max. error m3/day (×103) 119.31 150.49 129.08 136.50 113.39 100.79 108.81 95.81 131.55 141.66(MMscf/day) 4.213 5.314 4.558 4.820 4.004 3.559 3.842 3.383 4.645 5.002R 0.931 0.925 0.931 0.931 0.950 0.946 0.947 0.950 0.946 0.938
Table 7Training and cross validation mean squared errors (MSE) for eachtested model
Model number Training MSE Cross validation MSE
1 0.00652 0.007662 0.00562 0.008163 0.00721 0.008694 0.00651 0.007295 0.00701 0.006396 0.00533 0.008127 0.00621 0.007258 0.00670 0.008549 0.00529 0.0079910 0.00867 0.01284
383C.Ö. Karacan / International Journal of Coal Geology 73 (2008) 371–387

layer produced the best MSE values of 0.00456 and0.00823 for training and cross validation, respectively.
Next, the processing elements in the second hiddenlayer were varied between 26 and 40, while setting thenumber of processing elements in the first hidden layerto 56. The results showed that 38 processing elements inthe second hidden layer produced minimum MSEs of0.00460 and 0.00660 for training and cross validation,respectively.
Finally, the momentum value was varied between 0.5and 0.8 while setting the first and second hidden layerprocessing elements to 56 and 38, respectively. The bestMSE values of 0.00501 and 0.00719 were achieved fortraining and cross validation, respectively, using amomentum value of 0.6. Table 9 shows the performanceparameters of this network with the testing data set.Optimization of the number of processing elements in thehidden layers and the momentum value improved the
performance of the network in the face of new data.Table 9 shows that MSE and NMSE values improvedfrom1.817 to 1.613 and from0.097 to 0.086, respectively.The minimum and maximum absolute errors decreased to7.6×10−5 m3/day (0.003 MMscf/day) and to 87.4×10³ m3/day (3.087MMscf/day), respectively. Similarly, Rimproved from 0.95 to approximately 0.96. Fig. 8 showsthe topology and parameters of the final ANN networkproposed for predicting longwall ventilation emissions.
Fig. 9 compares the target emission rates in the testdata set with the predicted values using the model inFig. 8. The comparison of the target data with thepredicted values in Fig. 9 shows that the performance ofthe network in predicting emissions is reasonably gooddespite the large variations in the data. This comparisonalso indicates the flexibility and interpolation/extrapo-lation performance of the network.
Fig. 9. Comparison of target methane emission rates (measured valuesin the database) of the “testing” data set with the predicted rates fromthe proposed ANN shown in Fig. 8 (1 MMscf=28,320 m3).
Fig. 10. A scatter plot of measured methane emissions and ANNpredictions of the “testing” data set (1 MMscf=28,320 m3).
Fig. 8. The inputs, topology and the parameters of the proposed ANN model for predicting ventilation methane emissions from longwall mines.
384 C.Ö. Karacan / International Journal of Coal Geology 73 (2008) 371–387

5. Comparison of ANN predictions with statisticalmodels
In this section, the predictive capability of the ANNmodel shown in Fig. 9 is compared with multilinear andsecond-order non-linear statistical models. For thispurpose, two statistical models having the same inputvariables as the ANN model were developed. Thesemodels were developed using the training data used to“train” the ANN network. However, predictive capabil-ities of the statistical models were tested using the “test”data used to evaluate the performance of ANN. Thisapproach enabled all the models to be developed andcompared on the same basis. The linear and non-linearmodels are shown in Eqs. (4) and (5), respectively.
Emission ¼ a0 þ a1V1 þ a2V2 þ N þ a9V9 ð4Þ
Emission ¼ a0 þ a1V1 þ a2V2 þ N þ a9V9
þ b1V21 þ b2V
22 N þ b9V
29 ð5Þ
In these equations, Vn are the variables (n=1 to 9), anvalues are the coefficients of first degree variables, andbn values are the coefficients of second degree variables.
Figs. 10–12 show the plots of measured emissionsversus predicted values using the ANN, linear, and non-linear models, respectively. Fig. 10 shows that the ANNmodel is capable of predicting the test data reasonablywell (R2 =0.92). The linear model (Fig. 11) and evennon-linear model (Fig. 12), on the other hand, are lesssuccessful in predicting the new data using the samevariables. The R2 values in these cases are 0.54 and 0.61for linear and non-linear models, respectively. These
data show that the ANN model is superior when com-pared to the statistical models in predicting ventilationemissions from longwall mines. This is due to the highlynon-linear and variable nature of the data, for which theANN demonstrates more flexibility in capturing trendsand making generalizations compared to other models.
6. Summary and conclusions
Prediction of ventilation methane emissions fromlongwall mines is complex due to the various factorscontributing to these emissions. There are few mathe-matical models in the literature that can be used to predictmethane emissions from longwall mines. The objectiveof this work was to develop an artificial neural network(ANN)-based model for the prediction of ventilationmethane emissions from U.S. longwall operations.
Ventilation methane emission data obtained from 63U.S. longwall mines in 10 states were combined withcorresponding coalbed properties, geographical infor-mation, longwall operation parameters, and coal pro-ductions for the years 1985–2005. The variables in thedataset were analyzed with principle component anal-ysis (PCA) to determine their impacts on methaneemissions. A number of models were tested to find thebest combination of variables for the prediction ofventilation emissions using the ANN approach. Finally,the parameters of the ANN were optimized and thepredictive performance was compared with linear andnon-linear models.
The results of the above process showed that venti-lation emissions could be defined by a number ofvariables, each representing a particular emission con-tributor. In this study, PCA and preliminary test models
Fig. 11. A scatter plot of measured methane emissions and multilinearmodel Eq. (4) predictions of the “testing” data set (1 MMscf=28,320m3).
Fig. 12. A scatter plot of measured methane emissions and second-order non-linear model Eqn. (5) predictions of the “testing” data set(1 MMscf=28,320 m3).
385C.Ö. Karacan / International Journal of Coal Geology 73 (2008) 371–387

showed that state, total gas content of coalbed, seam andcut heights, panel width, face conveyor speed, stageloader speed, number of entries, and coal productionswere the most effective parameters to predict ventilationemissions. The ANN algorithm yielded good results forpredicting emissions. A two-hidden layer model with 56and 38 processing elements in each layer was found to besufficient. Also, 1500 epochs were enough to train thenetwork for satisfactory results.
Comparison of the ANN model with the linear andnon-linear statistical models showed that the ANN modelperformed better using the testing data due to its flexibilityand highly non-linear nature. A regression coefficient of0.92was obtained from the ANN as compared to 0.54 and0.61 for linear and non-linear models, respectively.
The presented approach using PCA and ANN is oneof the more accurate models to predict methaneemissions from longwall mines. By incorporating thecritical stratigraphic features in place of geographicalinformation, the approach and the model can be appliedto other mines.
Acknowledgements
Barbora Jemelkova of the U.S. EnvironmentalProtection Agency is thanked for her help in obtainingventilation methane emission data. W.P. Diamond isthanked for his help in obtaining gas content data.
References
Addinsoft, 2007. Xlstat-Pro user's manual. New York, NY.Bagherieh, A.H., Hower, J.C., Bagherieh, A.R., Jorjani, E., in press.
Studies of the relationship between petrography and grindabilityfor Kentucky coals using artificial neural network. InternationalJournal of Coal Geology.
Bibler, C., Marshall, J., Pilcher, R.C., 1998. Status of worldwide coalmine methane emissions and use. International Journal of CoalGeology 35, 283–310.
Boyer, C.M., Qingzhao, B., 1998. Methodology of coalbed methaneresource assessment. International Journal of Coal Geology 35,349–368.
Davis, J.C., 1986. Statistics and Data Analysis in Geology, 2nd edition.Wiley and Sons, New York.
Diamond,W.P., 1994.Methane control for underground coalmines. USBureau of Mines Information Circular No. 9395. Pittsburgh, PA.
Diamond, W.P., Schatzel, S.J., 1998. Measuring the gas content ofcoal: a review. International Journal of Coal Geology 35, 311–331.
Diamond, W.P., La Scola, J.C., Hyman, D.M., 1986. Results of direct-method determination of the gas content of the US coalbeds. USBureau of Mines Information Circular No. 9067. Pittsburgh, PA.
Eberhart, R.C., Dobbins, R.W., 1990. Neural Network PC Tools: APractical Guide. Academic Press Inc., San Diego, CA.
Faraway, J., Chatfield, C., 1998. Time series forecasting with neuralnetworks: a comparative study using airline data. Applied Statistics47, 231–250.
Flood, I., Kartam, N., 1994. Neural networks in civil engineering. I:principles and understanding. Journal of Computing in CivilEngineering 8, 131–148.
Grima, M.A., 2000. Neuro-fuzzy Modeling in Engineering Geology.A.A. Balkema, Rotterdam, The Netherlands. 244 pp.
Grima, M.A., Bruines, P.A., Verhoef, P.N.W., 2000. Modeling tunnelboring machine performance by neuron-fuzzy methods. Tunnel-ling and Underground Space Technology 15, 259–269.
Hassoun, M.H., 1995. Fundamentals of Artificial Neural Networks.MIT Press, Cambridge.
Hornik, K., Stinchcombe, M., White, H., 1989. Multilayer feedforwardnetworks are universal approximators. Neural Networks 2, 359–366.
Karacan, C.Ö., in press. Development and application of reservoirmodels and artificial neural networks for optimizing ventilation airrequirements in development mining of coal seams. InternationalJournal of Coal Geology.
Karacan, C.Ö., Diamond, W.P., 2006. Forecasting gas emissions forcoal mine safety applications. In: Kissell, F. (Ed.), Handbook forMethane Control in Mining. NIOSH, Information Circular No:9486, Pittsburgh, PA.
Karacan, C.Ö., Diamond, W.P., Esterhuizen, G.S., Schatzel, S.J., 2005.Numerical analysis of the impact of longwall panel width onmethane emissions and performance of gob gas ventholes.International Coalbed Methane Symposium, Paper 0505, Tusca-loosa, Alabama.
Karacan, C.Ö., Esterhuizen, G.S., Schatzel, S.J., Diamond, W.P.,2007a. Reservoir simulation-based modeling for characterizinglongwall methane emissions and gob gas venthole production.International Journal of Coal Geology 71, 225–245.
Karacan, C.Ö., Diamond, W.P., Schatzel, S.J., 2007b. Numericalanalysis of the influence of in-seam horizontal methane drainageboreholes on longwall face emission rates. International Journal ofCoal Geology 72, 15–32.
Kim, A.G., 1977. Estimating methane content of the bituminouscoalbeds from adsorption data. US Bureau of Mines Report ofInvestigations No. 8245. US Bureau of Mines, Pittsburgh, PA.
Krog, R.B., Schatzel, S.J., Garcia, F., Marshall, J.K., 2006. Predictingmethane emissions from wider longwall panels by analysis ofemission contributors. Proceedings of 11th U.S./North AmericanMine Ventilation Symposium, pp. 383–392.
Lunarzewski, L., 1998. Gas emission prediction and recovery inunderground coal mines. International Journal of Coal Geology 35,117–145.
Maier, H.R., Dandy, G.C., 2000. Neural networks for the prediction andforecasting of water resources variables: a review of modeling issuesand applications. EnvironmentalModeling and Software 15, 101–124.
MiningMedia Inc. CoalAge. http://www.mining-media.com/publications/coal_age.asp.
US Environmental Protection Agency, 1994. Identifying opportunitiesfor methane recovery at U.S. coal mines: draft profiles of selectedgassy underground coal mines. Report No: EPA 430-R-94-012.Washington, D.C.
US Environmental Protection Agency, 1997. Identifying opportunitiesfor methane recovery at U.S. coal mines: draft profiles of selectedgassy underground coal mines. Report No: EPA 430-R-93-012.Washington, D.C.
US Environmental Protection Agency, 2005. Identifying opportunitiesfor methane recovery at U.S. coal mines: profiles of selected gassyunderground coal mines 1999–2003. Report No: EPA 430-K-04-003. Washington, D.C.
US Mine Safety and Health Administration, 2007. http://www.msha.gov/drs/drshome.htm.
386 C.Ö. Karacan / International Journal of Coal Geology 73 (2008) 371–387

Mucho, T.P., Diamond, W.P., Garcia, F., Byars, J.D., Cario, S.L., 2000.Implications of recent NIOSH tracer gas studies on bleeder andgob gas ventilation design. Proc. Annual Meeting of Society forMining, Metallurgy and Exploration, Salt Lake City, UT.
NeuroDimension, 2006. NeuroSolutions 5.0. Gainesville, FL.Noack, K., 1998. Control of gas emissions in underground coal mines.
International Journal of Coal Geology 35, 57–82.Palchik, V., 2003. Formation of fractured zones in overburden due to
longwall mining. Environmental Geology 44, 28–38.Pashin, J., 1998. Stratigraphy and structure of coalbed methane
reservoirs in the United States: an overview. International Journalof Coal Geology 35, 209–240.
Patel, S.U., Kumar, B.J., Badhe, Y.P., Sharma, B.K., Sha, S., Biswas,S., Chaudhury, A., Tambe, S.S., Kulkarni, B.D., 2007. Estimationof gross calorific value of coals using artificial neural networks.Fuel 86, 334–344.
Peng, S.S., 2006. Longwall mining, Second edition. Morgantown,WV. 621 pp.
Schatzel, S.J., Krog, R.B., Garcia, F., Marshall, J.K., 2006. Predictionof longwall methane emissions and associated consequences ofincreasing longwall face lengths: a case study in the PittsburghCoalbed. Proceedings of 11th U.S./North American MineVentilation Symposium, pp. 375–382.
Singh, M.M., Kendorski, F.S., 1981. Strata disturbance prediction formining beneath surface water and waste impoundments Proc. 1stConference on Ground Control in Mining, Morgantown, WV.
Sousa, S.I.V., Martins, F.G., Alvim-Ferraz, M.C.M., Pereira, M.C.,2007. Multiple linear regression and artificial neural networksbased on principle components to predict ozone concentrations.Environmental Modeling and Software 22, 97–103.
Steidl, P., 1996. Chapter 2: coal as a reservoir. In: Saulsberry, J.L.,Scahfer, P.S., Schraufnagel, R.A. (Eds.), Coalbed MethaneReservoir Engineering. Gas Research Institute, Chicago, IL.
Thakur, P.C., Poundstone, W.N., 1980. Horizontal drilling technologyfor advance degasification. Mining Engineering 676–680 June.
Tomita, S., Deguchi, G., Matsuyama, S., Li, H., Kawahara, H., 2003.Development of a simulation program to predict gas emissionbased on 3D stress analysis. 30th International Conference ofSafety in Mines Research Institutes, South African Institute ofMining and Metallurgy, pp. 69–76.
Ünver, B., Yasıtlı, N.E., 2006. Modeling of strata movement withspecial reference to caving mechanism in thick coal seam mining.International Journal of Coal Geology 66, 227–252.
Yılmaz, S., Demircioğlu, C., Akın, S., 2002. Application of artificialneural networks to optimum bit selection. Computers & Geos-ciences 28, 261–269.
387C.Ö. Karacan / International Journal of Coal Geology 73 (2008) 371–387