Modeling and Optimization of Adsorption-writer2-new-final
27
Aquatic Science and Technology ISSN 2168-9148 2013, Vol. 1, No. 2 www.macrothink.org/ast 108 Modeling and Optimization of Adsorption of Heavy Metal Ions onto Local Activated Carbon Abbas Sabah Thajeel Chemical Engineering Department, College of Engineering, University of Basrah Basrah, Iraq E-mail: [email protected] Received: April 22, 2013 Accepted: June 1, 2013 Published: July1, 2013 doi:10.5296/ast.v1i2.3890 URL: http://dx.doi.org/10.5296/ast.v1i2.3890 Abstract In this study, a mathematical model was constructed according toCentral Composite Design method (CCD), which simulated the experimental work for adsorption of (Cu 2+ , Fe 3+ , Pb 2+ and Zn 2+ ) in batch adsorption processes, where this model was studied the different effects of operational conditions and their impact on the efficiency of adsorption by using activated carbon produced from rice husk as local raw material which is low cost and available in huge quantities,and find a final form simulates practical experiences. Finally a mathematical model has been used as a software program (minitab16). Keyword: Activated carbon, Adsorption, Modeling, Design of experiments, Heavy metal ions, Rice husk, Central composite design
Transcript of Modeling and Optimization of Adsorption-writer2-new-final

Aquatic Science and Technology ISSN 2168-9148
2013, Vol. 1, No. 2
www.macrothink.org/ast 108
Modeling and Optimization of Adsorption of Heavy Metal Ions onto Local Activated Carbon
Abbas Sabah Thajeel
Chemical Engineering Department, College of Engineering, University of Basrah
Basrah, Iraq
E-mail: [email protected]
Received: April 22, 2013 Accepted: June 1, 2013 Published: July1, 2013
doi:10.5296/ast.v1i2.3890 URL: http://dx.doi.org/10.5296/ast.v1i2.3890
Abstract
In this study, a mathematical model was constructed according toCentral Composite Design method (CCD), which simulated the experimental work for adsorption of (Cu2+, Fe3+, Pb2+ and Zn2+) in batch adsorption processes, where this model was studied the different effects of operational conditions and their impact on the efficiency of adsorption by using activated carbon produced from rice husk as local raw material which is low cost and available in huge quantities,and find a final form simulates practical experiences. Finally a mathematical model has been used as a software program (minitab16).
Keyword: Activated carbon, Adsorption, Modeling, Design of experiments, Heavy metal ions, Rice husk, Central composite design

Aquatic Science and Technology ISSN 2168-9148
2013, Vol. 1, No. 2
www.macrothink.org/ast 109
1. Introduction
Heavy metal ions such as copper, iron, nickel, lead, etc. in the environment are of major concern due to their toxicity to many life forms. Unlike organic pollutants, which are susceptible to biological degradation, metal ions do not degrade into any harmless end products (Mohammadiet al., 2010) and tend to accumulate causing several diseases and health disorders in humans, and other living organisms (Rosa et al., 2008). Several industrial activities are important sources ofenvironmental pollution due to their high content of several heavy metal ions(Dada et al., 2012). Wide range of various treatment techniques available for the removal of heavy metal ions from aqueous solutions such as ion exchange, biodegradation, oxidation, solvent extraction, chemical precipitation, flotation, biosorption, electrolytic recovery, membrane separation and adsorption have been reported to be used for removal of heavy metal ions from industrialeffluents (Al-tameemi et al., 2012; Deosarkar,2012). However, adsorption has been universally accepted as one of the most effective pollutant removal process, with low cost, ease in handling, low consumption of reagents, as well as scope for recovery of value added components through desorption and regeneration of adsorbent(Dada et al., 2012). Adsorption is collection of adsorbate on the surface of adsorbent due to force of attraction(Deosarkar,2012). The practical applications of adsorption can be at separation and purification of liquid and gas mixtures, bulk chemicals, drying gases and liquids before loading them into industrial systems, removal of impurities from liquid and gas media, recovery of chemicals from industrial and vent gases and water purification(Prabakaran&Arivoli,2012). Activated carbon is the most widely used adsorbent due to its excellent adsorption capability for heavy metals. However, the use of these methods is often limited due to the high cost, which makes them unfavorable for the needs of developing countries. Many reports have been investigatedthe low-cost adsorbents for Adsorption of heavy metals from aqueous solutions(Souag et al., 2009)such as date pits(Belhachemi et al., 2009) bamboo(Kannan&Veemaraj, 2009) oil palm fibre(Hameedet al., 2011;Nwabanne&Igbokwe, 2012), coconut shell(Satya et al., 1997), apricot stones (Philip&Girgis, 1996), sugar beet bagasse (Jaguaribe et al., 2000), waste tires(Teng et al., 2000;Juan et al., 2005;Mui et al., 2010), coconut husk, seed shell (Gueu et al.,2006), dates stones (Alhamed&Bamufleh, 2008), sun flower (Surchi, 2011), asphaltic carbon(Ambursa et al., 2011), Henna Leaves (Shanthi&Selvarajan, 2012).The intrinsic properties of activated carbon are dependent on the raw material source. The source of raw material was based on the need for developing low cost absorbent for pollution control as well as reducing the effect of environmental degradation poised by agricultural waste(Itodo H. &Itodo A., 2010).
In this study, a simulation of batch adsorption processes was investigated by mathematical model for adsorption of heavy metal ions such as (Fe3+, Zn2+, Cu2+and Pb2+) from the (oil-water)polluted which comes out from the oil industry in Basrah cityonto activated carbon produced from rice husk (RHAC) as local raw material which is low cost and available in huge quantities causing a pollutant problem.

Aquatic Science and Technology ISSN 2168-9148
2013, Vol. 1, No. 2
www.macrothink.org/ast 110
2.Experimental Section
2.1 Materials
Zinc chloride with purity (97%) and sodium hydroxide with purity (97.5%) were supplied from THOMAS BAKER (Chemicals) Company. Copper chloride anhydrous with purity (99%) was supplied from BDH(Chemicals) Company. Iron nitrate (ferric nitrate) with purity (99%) was supplied from MERCK Company. Hydrogen chloride with purity (37%) was supplied from Scharlab.S.L Company. Nitrogen gas with purity (90%)and carbon dioxide gases with purity (95 - 99 %)were supplied from Basrah Factory. Rice husks were collected from Almshgab City Al-najafALashraf, Iraq, which had been discarded as waste from rice cultivation.
2.2 Adsorbent
Activated carbon produced from rice husk (RHAC) by physical method was used as an adsorbent material in this study, the preparation method was described following:
Initially, the (RH) were well washed with distilled water and dried in electrical oven for 24 hours. The carbonization step was carried out in electrical furnace for 2hr at 500Ċ and heating rate of 30 ºC/min in absence air using nitrogen (N2) at flow rate is 200 L/min.
In the activation step, the product from carbonization step was activated by passing carbon dioxide (CO2) instead of nitrogen for 2hr at 700Ċ.
2.3Preparation of Standard Solutions
The stock solutions of 1000 mg/L (ppm) of Cu2+, Fe3+, Pb2+ and Zn2+ were prepared by dissolving 2.1368 g of CuCl2, 7.3073 g ofFe(NO3)3,1.3557 g ofPbCl2and2.1273g ofZnCl2 in 1000 ml volumetric flasks and fill up to the mark with distilled water.
The diluted concentrations were prepared from stock solutions for carrying out experiments.
A certain volume (10 ml) of oil has been added to all above solutions with efficient agitation for simulated waste oil water.
2.4Analyze a Sample of Heavy Metal Ions by Using Atomic Absorption Spectrophotometer (AAS)
The concentration of metal ions was measured by using atomic absorption spectrophotometer (BUCK Scientific, Model 210 VGP). In atomic absorption spectroscopy, metal atoms were vaporized into a flame, and the metal vapor absorbed radiation from the specific hollow cathode lamp in proportion to the number of atoms present. Beer's Law was followed in the part-per-million range (remember that ppm means mg of metal/liter of solution).
2.5Adsorption Studies
Batch experiments were carried out by a (125 ml) flask. A certain weight of adsorbent material and (100 ml) of the solution prepared previously were added to the flask, and installed in the water bath (MemmertGmbh Type WMB 22) at different temperature, see

Aquatic Science and Technology ISSN 2168-9148
2013, Vol. 1, No. 2
www.macrothink.org/ast 111
Figure1. The pH values were controlling by adding 0.1 N NaOH or 0.1 N HCl.A mixture with a different speed was mixed for 15 minutes using Variable-Speed Benchtop, model 5850, Eberbach. Finally, the mixtures were filtered through filter paper, and measurement of concentrations by Atomic Absorption.
Figure 1. Schematic diagram of the batch adsorber (Al-Jomaa, 2011)
The removal percentage (R.P.%) which described the efficiency of adsorbent to adsorbed a heavy metal ions is calculated by following equation (BADMUS et al., 2007; Itodo et al., 2010):
. . % 100 (1)
Where: are the initial and final concentration in (ppm), respectively.
3. Results and Discussion
3.1 Modeling of Heavy Metal Ions Adsorption
Design of experiments (DOE) methods all involve: (1) carefully planning sets of input combinations to test using a random run order; then, (2) tests are performed and output values are recorded; (3) an interpolation method such as “regression” is then used to interpolate the outputs; and (4) the resulting prediction model is then used to predict new outputs for new
Mechanical stirrer
Water bath
flask
Speed
Temperature
Impeller

Aquatic Science and Technology ISSN 2168-9148
2013, Vol. 1, No. 2
www.macrothink.org/ast 112
possible input combinations, DOE methods can be an important part of systemoptimization.These methods all involve the activities of experimental planning, conducting experiments, and fitting models to the outputs(Allen, 2006).
DOE methods are classified into several types, which included screening using fractional factorials, response surface methods (RSM), and robust design procedures.All of these DOE methods involve changing key input variable settings which are directly controllable (called factors) using carefully planned patterns, and then observing outputs (called responses) (Allen, 2006).
Response surface methodology is a collection of statistical and mathematical methods that are useful for the modeling and analyzing engineering problems. In this technique, the main objective is to optimize the response surface that is influenced by various process parameters. Response surface methodology also quantifies the relationship between the controllable input parameters and the obtained response surfaces (Tanet al., 2007; Aslan & Cebeci, 2007).
The particular value of the variable is called the level of the factor. The combination of factors used in a particular experiment is called a treatment (Al-Badran, 2003; Ghadeer, 2009).
RSM methods are based on three types of design of experiments (DOE) matrices. First, central composite designs (CCD) are matrices corresponding to (at most) five level experimental plans from Box and Wilson (1951). Second, Box Behnken designs (BBD) are matrices corresponding to three level experimental plans from Box, Behnken (1960). Third, Allen et al. (2003) proposed methods based on so-called expected integrated mean squared error optimal (EIMSE-optimal) designs (Allen, 2006).
In this study, the central composite design was used to determine a models which described therelationship between the variables and the response.
The response which is the product (Y), is assumed to be a random variable (Lazic, 2004).
Y= f (X1 , X2 , X3 )+ Error (2)
Asecond degree polynomial equation was used if there is a curvature in the system ,which given by Eq.(3) (Chen et al., 2011; Song et al., 2012; Daffalla et al., 2012):
Y β° ∑ β X ∑ β X ∑ ∑ β X X (3)
Where:
Y , X , ° , , , and , arethe predicted response, independent variables, model
constant,linear coefficients, the quadratic coefficients and cross product coefficients,the coded values of variables, respectively.
These second –order designs for k factors are composed of three sets of points (John, 1998):
(i)A 2K factorial design withX 1, these are called the cube points. There are nj of term.

Aquatic Science and Technology ISSN 2168-9148
2013, Vol. 1, No. 2
www.macrothink.org/ast 113
(ii) A set of axial points. There are n 2k. There coordinates are ,0,0, … , … ,0,,0, … and (…,0, 0,±α),where α is the distance of the axial point from center and makes the design rotatable(Tanet al., 2007).
(iii) n0 center points, which used to determine the experimental error and the reproducibility of the data.
The number of experiments (N) needed was calculated by thefollowing equation (Lazic, 2004; John, 1998):
N = nj + nα + n0= 2k + 2*k + n0 (4)
For five factors a second order polynomial mathematical model is describe by the following equation:
Y β° β X β X β X β X β X β X β X β X β Xβ X β X X β X X β X X β X X β X X β X X β X X
β X X β X X β X X (5)
The relationship between the coded levels and the corresponding actual variables is represented by the equation:
(6)
The low and height values of each variable in batch systemwere listed in Table 1:
Table 1. The low and height values of variables in batch system
Variable Simple Low Height PH 5 9 TemperatureĊ 22 50 Doseg 2 4 Concentration ppm 21 50 rpm 350 750
The relationship between the coded variable (X) and the corresponding real variable(x) as following :
, ,
..
, (7)
The central composite design can be made to be rotatable by choosing 2 / when a complete factorial is used.For five factors:
2 / 2.378 (8)

Aquatic Science and Technology ISSN 2168-9148
2013, Vol. 1, No. 2
www.macrothink.org/ast 114
Table 2. The coded & uncoded (actual)values of variables in batch system
No. X1 X2 X3 X4 X5 X1 PH X2Temp. X3dose X5CONC. X5 rpm 1 1 1 1 1 1 9 50 4 50 750 2 -1 1 1 1 1 5 50 4 50 750 3 1 -1 1 1 1 9 22 4 50 750 4 -1 -1 1 1 1 5 22 4 50 750 5 1 1 -1 1 1 9 50 2 50 750 6 -1 1 -1 1 1 5 50 2 50 750 7 1 -1 -1 1 1 9 22 2 50 750 8 -1 -1 -1 1 1 5 22 2 50 750 9 1 1 1 -1 1 9 50 4 21 750 10 -1 1 1 -1 1 5 50 4 21 750 11 1 -1 1 -1 1 9 22 4 21 750 12 -1 -1 1 -1 1 5 22 4 21 750 13 1 1 -1 -1 1 9 50 2 21 750 14 -1 1 -1 -1 1 5 50 2 21 750 15 1 -1 -1 -1 1 9 22 2 21 750 16 -1 -1 -1 -1 1 5 22 2 21 750 17 1 1 1 1 -1 9 50 4 50 350 18 -1 1 1 1 -1 5 50 4 50 350 19 1 -1 1 1 -1 9 22 4 50 350 20 -1 -1 1 1 -1 5 22 4 50 350 21 1 1 -1 1 -1 9 50 2 50 350 22 -1 1 -1 1 -1 5 50 2 50 350 23 1 -1 -1 1 -1 9 22 2 50 350 24 -1 -1 -1 1 -1 5 22 2 50 350 25 1 1 1 -1 -1 9 50 4 21 350 26 -1 1 1 -1 -1 5 50 4 21 350 27 1 -1 1 -1 -1 9 22 4 21 350 28 -1 -1 1 -1 -1 5 22 4 21 350 29 1 1 -1 -1 -1 9 50 2 21 350 30 -1 1 -1 -1 -1 5 50 2 21 350 31 1 -1 -1 -1 -1 9 22 2 21 350 32 -1 -1 -1 -1 -1 5 22 2 21 350 33 - 0 0 0 0 2.243 36 3 35.5 550 34 0 0 0 0 11.76 36 3 35.5 550 35 0 - 0 0 0 7 2.702 3 35.5 550 36 0 0 0 0 7 69.3 3 35.5 550 37 0 0 - 0 0 7 36 0.6216 35.5 550 38 0 0 0 0 7 36 5.3784 35.5 550 39 0 0 0 - 0 7 36 3 1.013 550 40 0 0 0 0 7 36 3 69.99 550 41 0 0 0 0 - 7 36 3 35.5 74.32 42 0 0 0 0 7 36 3 35.5 1026 43 0 0 0 0 0 7 36 3 35.5 550 44 0 0 0 0 0 7 36 3 35.5 550 45 0 0 0 0 0 7 36 3 35.5 550 46 0 0 0 0 0 7 36 3 35.5 550 47 0 0 0 0 0 7 36 3 35.5 550 48 0 0 0 0 0 7 36 3 35.5 550 49 0 0 0 0 0 7 36 3 35.5 550 50 0 0 0 0 0 7 36 3 35.5 550 51 0 0 0 0 0 7 36 3 35.5 550 52 0 0 0 0 0 7 36 3 35.5 550
Aquatic Science and Technology ISSN 2168-9148
2013, Vol. 1, No. 2
www.macrothink.org/ast 115
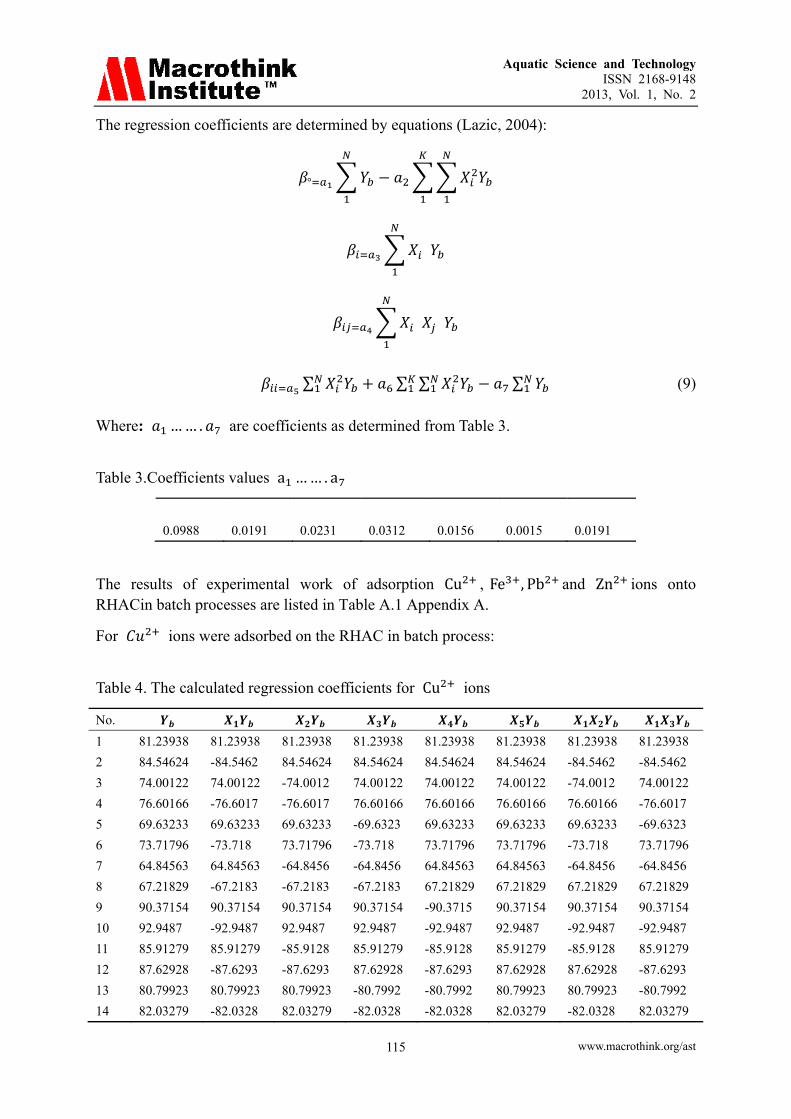
The regression coefficients are determined by equations (Lazic, 2004):
°
∑ ∑ ∑ ∑ (9)
Where: … … . are coefficients as determined from Table 3.
Table 3.Coefficients values a … … . a
0.0988 0.0191 0.0231 0.0312 0.0156 0.0015 0.0191
The results of experimental work of adsorption Cu , Fe , Pb and Zn ions onto RHACin batch processes are listed in Table A.1 Appendix A.
For ions were adsorbed on the RHAC in batch process:
Table 4. The calculated regression coefficients for Cu ions
No. 1 81.23938 81.23938 81.23938 81.23938 81.23938 81.23938 81.23938 81.23938 2 84.54624 -84.5462 84.54624 84.54624 84.54624 84.54624 -84.5462 -84.5462 3 74.00122 74.00122 -74.0012 74.00122 74.00122 74.00122 -74.0012 74.00122 4 76.60166 -76.6017 -76.6017 76.60166 76.60166 76.60166 76.60166 -76.6017 5 69.63233 69.63233 69.63233 -69.6323 69.63233 69.63233 69.63233 -69.6323 6 73.71796 -73.718 73.71796 -73.718 73.71796 73.71796 -73.718 73.71796 7 64.84563 64.84563 -64.8456 -64.8456 64.84563 64.84563 -64.8456 -64.8456 8 67.21829 -67.2183 -67.2183 -67.2183 67.21829 67.21829 67.21829 67.21829 9 90.37154 90.37154 90.37154 90.37154 -90.3715 90.37154 90.37154 90.37154 10 92.9487 -92.9487 92.9487 92.9487 -92.9487 92.9487 -92.9487 -92.9487 11 85.91279 85.91279 -85.9128 85.91279 -85.9128 85.91279 -85.9128 85.91279 12 87.62928 -87.6293 -87.6293 87.62928 -87.6293 87.62928 87.62928 -87.6293 13 80.79923 80.79923 80.79923 -80.7992 -80.7992 80.79923 80.79923 -80.7992 14 82.03279 -82.0328 82.03279 -82.0328 -82.0328 82.03279 -82.0328 82.03279

Aquatic Science and Technology ISSN 2168-9148
2013, Vol. 1, No. 2
www.macrothink.org/ast 116
15 78.91772 78.91772 -78.9177 -78.9177 -78.9177 78.91772 -78.9177 -78.9177 16 79.54887 -79.5489 -79.5489 -79.5489 -79.5489 79.54887 79.54887 79.54887 17 83.60205 83.60205 83.60205 83.60205 83.60205 -83.602 83.60205 83.60205 18 85.7452 -85.7452 85.7452 85.7452 85.7452 -85.7452 -85.7452 -85.7452 19 73.71796 73.71796 -73.718 73.71796 73.71796 -73.718 -73.718 73.71796 20 76.22091 -76.2209 -76.2209 76.22091 76.22091 -76.2209 76.22091 -76.2209 21 70.99306 70.99306 70.99306 -70.9931 70.99306 -70.9931 70.99306 -70.9931 22 74.11563 -74.1156 74.11563 -74.1156 74.11563 -74.1156 -74.1156 74.11563 23 65.5934 65.5934 -65.5934 -65.5934 65.5934 -65.5934 -65.5934 -65.5934 24 68.79341 -68.7934 -68.7934 -68.7934 68.79341 -68.7934 68.79341 68.79341 25 91.42334 91.42334 91.42334 91.42334 -91.4233 -91.4233 91.42334 91.42334 26 92.69899 -92.699 92.69899 92.69899 -92.699 -92.699 -92.699 -92.699 27 84.44523 84.44523 -84.4452 84.44523 -84.4452 -84.4452 -84.4452 84.44523 28 87.91037 -87.9104 -87.9104 87.91037 -87.9104 -87.9104 87.91037 -87.9104 29 81.41817 81.41817 81.41817 -81.4182 -81.4182 -81.4182 81.41817 -81.4182 30 81.72603 -81.726 81.72603 -81.726 -81.726 -81.726 -81.726 81.72603 31 77.64412 77.64412 -77.6441 -77.6441 -77.6441 -77.6441 -77.6441 -77.6441 32 79.86298 -79.863 -79.863 -79.863 -79.863 -79.863 79.86298 79.86298 33 65.16427 -154.987 0 0 0 0 0 0 34 47.34202 112.5987 0 0 0 0 0 0 35 84.75804 0 -201.589 0 0 0 0 0 36 93.10076 0 221.4318 0 0 0 0 0 37 51.82756 0 0 -123.267 0 0 0 0 38 97.12532 0 0 231.0038 0 0 0 0 39 100 0 0 0 -237.841 0 0 0 40 87.49923 0 0 0 208.109 0 0 0 41 78.67269 0 0 0 0 -187.116 0 0 42 93.75402 0 0 0 0 222.9855 0 0 43 96.60561 0 0 0 0 0 0 0 44 96.06727 0 0 0 0 0 0 0 45 97.94627 0 0 0 0 0 0 0 46 96.95424 0 0 0 0 0 0 0 47 97.46075 0 0 0 0 0 0 0 48 96.2487 0 0 0 0 0 0 0 49 97.21003 0 0 0 0 0 0 0 50 96.95424 0 0 0 0 0 0 0 51 95.32283 0 0 0 0 0 0 0 52 95.03638 0 0 0 0 0 0 0 Sum 4310.925 -79.1487 107.9892 259.8919 -194.438 29.92239 0.655258 -2.41555
Table 4.Continued
81.23938 81.23938 81.23938 81.23938 81.23938 81.23938 81.23938 81.23938 81.23938

Aquatic Science and Technology ISSN 2168-9148
2013, Vol. 1, No. 2
www.macrothink.org/ast 117
-84.5462 -84.5462 84.54624 84.54624 84.54624 84.54624 84.54624 84.54624 84.5462474.00122 74.00122 -74.0012 -74.0012 -74.0012 74.00122 74.00122 74.00122 74.00122-76.6017 -76.6017 -76.6017 -76.6017 -76.6017 76.60166 76.60166 76.60166 76.6016669.63233 69.63233 -69.6323 69.63233 69.63233 -69.6323 -69.6323 69.63233 69.63233-73.718 -73.718 -73.718 73.71796 73.71796 -73.718 -73.718 73.71796 73.7179664.84563 64.84563 64.84563 -64.8456 -64.8456 -64.8456 -64.8456 64.84563 64.84563-67.2183 -67.2183 67.21829 -67.2183 -67.2183 -67.2183 -67.2183 67.21829 67.21829-90.3715 90.37154 90.37154 -90.3715 90.37154 -90.3715 90.37154 -90.3715 90.3715492.9487 -92.9487 92.9487 -92.9487 92.9487 -92.9487 92.9487 -92.9487 92.9487 -85.9128 85.91279 -85.9128 85.91279 -85.9128 -85.9128 85.91279 -85.9128 85.9127987.62928 -87.6293 -87.6293 87.62928 -87.6293 -87.6293 87.62928 -87.6293 87.62928-80.7992 80.79923 -80.7992 -80.7992 80.79923 80.79923 -80.7992 -80.7992 80.7992382.03279 -82.0328 -82.0328 -82.0328 82.03279 82.03279 -82.0328 -82.0328 82.03279-78.9177 78.91772 78.91772 78.91772 -78.9177 78.91772 -78.9177 -78.9177 78.9177279.54887 -79.5489 79.54887 79.54887 -79.5489 79.54887 -79.5489 -79.5489 79.5488783.60205 -83.602 83.60205 83.60205 -83.602 83.60205 -83.602 -83.602 83.60205-85.7452 85.7452 85.7452 85.7452 -85.7452 85.7452 -85.7452 -85.7452 85.7452 73.71796 -73.718 -73.718 -73.718 73.71796 73.71796 -73.718 -73.718 73.71796-76.2209 76.22091 -76.2209 -76.2209 76.22091 76.22091 -76.2209 -76.2209 76.2209170.99306 -70.9931 -70.9931 70.99306 -70.9931 -70.9931 70.99306 -70.9931 70.99306-74.1156 74.11563 -74.1156 74.11563 -74.1156 -74.1156 74.11563 -74.1156 74.1156365.5934 -65.5934 65.5934 -65.5934 65.5934 -65.5934 65.5934 -65.5934 65.5934 -68.7934 68.79341 68.79341 -68.7934 68.79341 -68.7934 68.79341 -68.7934 68.79341-91.4233 -91.4233 91.42334 -91.4233 -91.4233 -91.4233 -91.4233 91.42334 91.4233492.69899 92.69899 92.69899 -92.699 -92.699 -92.699 -92.699 92.69899 92.69899-84.4452 -84.4452 -84.4452 84.44523 84.44523 -84.4452 -84.4452 84.44523 84.4452387.91037 87.91037 -87.9104 87.91037 87.91037 -87.9104 -87.9104 87.91037 87.91037-81.4182 -81.4182 -81.4182 -81.4182 -81.4182 81.41817 81.41817 81.41817 81.4181781.72603 81.72603 -81.726 -81.726 -81.726 81.72603 81.72603 81.72603 81.72603-77.6441 -77.6441 77.64412 77.64412 77.64412 77.64412 77.64412 77.64412 77.6441279.86298 79.86298 79.86298 79.86298 79.86298 79.86298 79.86298 79.86298 79.862980 0 0 0 0 0 0 0 368.62350 0 0 0 0 0 0 0 267.806 0 0 0 0 0 0 0 0 0 0 0 0 0 0 0 0 0 0 0 0 0 0 0 0 0 0 0 0 0 0 0 0 0 0 0 0 0 0 0 0 0 0 0 0 0 0 0 0 0 0 0 0 0 0 0 0 0 0 0 0 0 0 0 0 0 0 0 0 0 0 0 0 0 0 0 0 0 0 0 0 0 0 0 0 0 0 0 0 0 0

Aquatic Science and Technology ISSN 2168-9148
2013, Vol. 1, No. 2
www.macrothink.org/ast 118
0 0 0 0 0 0 0 0 0 0 0 0 0 0 0 0 0 0 0 0 0 0 0 0 0 0 0 0 0 0 0 0 0 0 0 0 0 0 0 0 0 0 0 0 0 0 0 0 0 0 0 0 0 0 0 0 0 0 0 0 0 0 0 0 0 0 0 0 0 0 0 0 -9.90841 -0.28775 24.12526 25.05191 -6.92138 9.374568 0.920755 -8.01056 3182.304
Table 4.Continued
81.23938 81.23938 81.23938 81.23938 87.11434 34.51512 84.54624 84.54624 84.54624 84.54624 91.51709 48.59274 74.00122 74.00122 74.00122 74.00122 79.44759 29.66286 76.60166 76.60166 76.60166 76.60166 83.93212 53.7356 69.63233 69.63233 69.63233 69.63233 73.11022 12.09568 73.71796 73.71796 73.71796 73.71796 77.21151 12.20492 64.84563 64.84563 64.84563 64.84563 68.4543 13.02248 67.21829 67.21829 67.21829 67.21829 72.63737 29.36644 90.37154 90.37154 90.37154 90.37154 95.0673 22.05009 92.9487 92.9487 92.9487 92.9487 98.23348 27.92887 85.91279 85.91279 85.91279 85.91279 90.52702 21.29116 87.62928 87.62928 87.62928 87.62928 93.77498 37.76972 80.79923 80.79923 80.79923 80.79923 82.23312 2.056057 82.03279 82.03279 82.03279 82.03279 85.09785 9.394581 78.91772 78.91772 78.91772 78.91772 80.70368 3.189654 79.54887 79.54887 79.54887 79.54887 83.65018 16.82076 83.60205 83.60205 83.60205 83.60205 86.62418 9.133279 85.7452 85.7452 85.7452 85.7452 90.99102 27.51868 73.71796 73.71796 73.71796 73.71796 78.09364 19.14658 76.22091 76.22091 76.22091 76.22091 82.54226 39.95944 70.99306 70.99306 70.99306 70.99306 72.73497 3.034249 74.11563 74.11563 74.11563 74.11563 76.80035 7.20774 65.5934 65.5934 65.5934 65.5934 67.21526 2.630444 68.79341 68.79341 68.79341 68.79341 71.36242 6.599787 91.42334 91.42334 91.42334 91.42334 93.57742 4.640028 92.69899 92.69899 92.69899 92.69899 96.70769 16.06966 84.44523 84.44523 84.44523 84.44523 88.17336 13.89892 87.91037 87.91037 87.91037 87.91037 91.38541 12.07587 81.41817 81.41817 81.41817 81.41817 80.85815 0.313622 81.72603 81.72603 81.72603 81.72603 83.68697 3.845272 77.64412 77.64412 77.64412 77.64412 78.46492 0.673716

Aquatic Science and Technology ISSN 2168-9148
2013, Vol. 1, No. 2
www.macrothink.org/ast 119
79.86298 79.86298 79.86298 79.86298 81.37551 2.287774 0 0 0 0 62.20889 8.734268 0 0 0 0 53.51183 38.0665 479.4622 0 0 0 84.55103 0.042851 526.6556 0 0 0 96.41716 10.99853 0 293.1799 0 0 61.77557 98.963 0 549.4218 0 0 90.33316 46.13347 0 0 565.6834 0 105.9792 35.75113 0 0 494.9686 0 84.61391 8.325074 0 0 0 445.0384 86.12845 55.5883 0 0 0 530.351 89.41639 18.81502 0 0 0 0 96.43361 0.029582 0 0 0 0 96.43361 0.134211 0 0 0 0 96.43361 2.288123 0 0 0 0 96.43361 0.27105 0 0 0 0 96.43361 1.055012 0 0 0 0 96.43361 0.034194 0 0 0 0 96.43361 0.602821 0 0 0 0 96.43361 0.27105 0 0 0 0 96.43361 1.233846 0 0 0 0 96.43361 1.952264 3551.992 3388.476 3606.526 3521.264 4442.577 872.0221
Table 4.Continued
0.02044 -0.075 -0.30 -0.0089 0.752 0.781 -0.215 0.292 0.028 -0.24 96.433
-1.828 2.494 6.003 -4.491 0.691 -6.818 -1.051 -3.602 -0.201 -1.5311
The adequately of regression model have been checked with Fisher’s (FR value and tabular value (FT) by following equations:
FRS DSY
(10)
For calculation of SAD, the expression:
SADSS SS
D
∑ Y Y Y° Y°N
N ° (11)
SYSYN
(12)
SY∑ Y° Y°
°
° (13)

Aquatic Science and Technology ISSN 2168-9148
2013, Vol. 1, No. 2
www.macrothink.org/ast 120
Knowledge of SAD and SYfacilitates determination of both calculating the value of Fisher’s
criterion and simultaneously of the tabular value by which we may compare and accept or reject the hypothesis of lack of fit of the regression model.
Where:
SSE is sum of squares of reproducibility variance.
SSR is residual sum of squares.
is outcome of each trial.
Ym is calculated response value from regression equation.
Y° is the outcome of one trial in null point.
Y° is average of replications in null point.
The rotatability conditions is defined by following relations:
fAD N λ n° 1 (14)
For second order regression models:
λ K (15)
The value degree of freedom fE is calculated by following equation:
fE N n 1 (16)
Table 5. (FR and (FT) values
° ° °
96.60561 0.0006239 96.06727 0.263544 97.94627 1.8649653 96.95424 0.1395831 97.46075 0.774613 96.2487 0.1101788 97.21003 0.3961424 96.95424 0.1395831 95.32283 1.5820683 95.03638 2.3847118 sum sum 965.8063 7.6560138

Aquatic Science and Technology ISSN 2168-9148
2013, Vol. 1, No. 2
www.macrothink.org/ast 121
° FR FT 96.58063 0.8506682 39.28937 44.23475 0.888201 22 468 2.31
A tabular value FT is obtained for fAD = 22 and fE =52(10-1) = 468 and 1-α =99%, from Table A.2 in Appendix A (Lazic, 2004).
The regression model is adequate with 99% confidence because FR<FT (Fisher’s value < tabular value).
A check of significance of regression coefficients is brought down to determining their confidence intervals and their comparison to absolute values of regression coefficients. The rule is (Lazic, 2004):
A regression coefficient is statistically significant if its absolute value is higher than the confidence interval.
When estimating the significance of regression coefficients, these equations are used:
S °A K
NSY (17)
S SYN °
(18)
S CN
SY (19)
S AC K KN
SY (20)
AK K
(21)
C NN °
(22)
Where:
S °, S , S and S are variance of regression coefficients which associated error mean
squares in determining regression coefficients β°, β , β and S .
In the case of second-order designs of regression coefficient significances, they are checked by using:

Aquatic Science and Technology ISSN 2168-9148
2013, Vol. 1, No. 2
www.macrothink.org/ast 122
Table 6. ∆β°, ∆β , ∆β and ∆β values
° 0.016359 ∆ ° ° 0.255805 0.0236297 ∆β 2S 0.307439 0.0265834 ∆β 2S 0.326088 0.0862951 ∆β 2S 0.587521
A check of statistical significance of regression coefficients indicates that regression
coefficients �, i, β23, β24, 11, 22, β33 and 55 are statistically significant, while the other
coefficients are insignificant.The final form of the second order regression model with 99% confidence may be given in the form:
Y 96.433 1.828X 2.494X 6.003X 4.491X 0.691X 6.818X
1.051X 3.602X 1.5311X 0.752X X 0.781X X (23)
The same above calculations method are used to determine the models ofFe , Pb and Zn in batch process. The regression coefficients and final model equations are show below.
For Fe ions were adsorbed on the RHAC in batch process:
Table 7. The calculated regression coefficients for Fe ions
1.544 3.275 6.2902 -4.071 0.458 -5.782 -0.689 -2.315 0.1423 -1.383
0.252 -0.50 0.021 0.175 -0.071 0.348 -0.155 2.007 0.073 0.064 93.962
° FR FT
94.06706 1.9549847 31.14317 101.6592 0.306349 22 468 2.31
A check of statistical significance of regression coefficients indicates that regression
coefficients �, i, β 13, β 34, 11, 33 and 55 are statistically significant, while the other
coefficients are insignificant. The final form of the second order regression model with 99% confidence may be given in the form:
Y 93.962 1.544X 3.275X 6.2902X 4.071X 0.458X 5.782X
2.315X 1.383X 0.752X X 0.781X X (24)

Aquatic Science and Technology ISSN 2168-9148
2013, Vol. 1, No. 2
www.macrothink.org/ast 123
For Pb ions were adsorbed on the RHAC in batch process:
Table 8. The calculated regression coefficients for Pb ions
-1.564 1.609 5.722 -4.82 0.827 -1.175 0.361 -3.078 0.9606 -0.6859
0.1344 -0.26 0.454 -0.074 0.187 0.148 0.05385 1.579 0.115 0.021 88.92243
° FR FT
88.79165 4.0477878 44.59781 210.485 0.211881 22 468 2.31
A check of statistical significance of regression coefficients indicates that regression
coefficients �, i, β11, 33 and β34 are statistically significant, while the other coefficients are
insignificant. The final form of the second order regression model with 99% confidence may be given in the form:
Y 88.922 1.564X 1.609X 5.722X 4.82X 0.827X 1.175X
3.078X 1.579X X (25)
For Zn ions were adsorbed on the RHAC in batch process:
Table 9. The calculated regression coefficients for Zn ions
5.467 2.961 7.053 -8.78 0.424 -5.396 -0.35678 -2.539 1.1253 -1.882
0.3605 -0.28 1.583 -0.336 0.166 0.817 0.0218 -1.14 0.194 0.277 73.368
° FR FT
73.89135 2.9076597 57.52014 151.1983 0.380428 22 468 2.31
A check of statistical significance of regression coefficients indicates that regression
coefficients �, i, β14 , β24, β34, 11, 33, β44 and β55 are statistically significant, while the
other coefficients are insignificant. The final form of the second order regression model with 99% confidence may be given in the form:

Aquatic Science and Technology ISSN 2168-9148
2013, Vol. 1, No. 2
www.macrothink.org/ast 124
Y 73.368 5.467X 2.961X 7.053X 8.78X 0.424X 5.396X
2.539X 1.1253X 1.882X 1.583X X 0.817X X 1.14X X (26)
3.2Modeling Using Minitab Software
Minitab is a statistical software, it was developed by Minitab Inc. (USA).Minitab16.1.0, was used in this study to determine the models of adsorption of heavy metal ions on RHAC.
The calculations and results of models which were determined by this program are listed in Appendix (B), clarification and explanation of the tables and calculations are shown below.
The coefficients table is listed the estimated coefficients for the variables.
Regression examines the relationship between a response and variables. In order to determine whether or not the observed relationship between the response and variables is statistically significant, need to:
Identify the coefficient p-values: the coefficient value for P (p-value) tells whether or not the association between the response and variables is statistically significant. Compare the coefficient p-values to α-level: if the p-value is smaller than the α -level, the association is statistically significantly.
P regression was used to test the hypothesis that all the coefficients in the model are zero. A smaller p-value than a pre-selected selected α-level implies that at least one coefficient in the model is not zero.
P lack of fit was used to test whether the model fits the data well. A smaller p-value than α-level indicates that might need to consider higher order terms of existing predictors, or additional predictors, to get a better fit of the data.
A list of the standard errors for the estimated constant and the estimated coefficient. A standard error for an estimated coefficient measures the precision of the estimate. The smaller the standard error, the more precise the estimate.
S is measured in the units of the response variable and represents the standard distance data values fall from the regression line. For a given study, the betterequation that predicts the response, the lower S is.
Minitab displays the coefficients in uncoded units in addition to coded units. For each term in the model, there is a coefficient. Use these coefficients to construct an equation representing the relationship between the response and the factors.
To use this equation, put in the uncoded (actual) factor values and calculate the variables response. Because these coefficients are estimated using uncoded units, putting coded factor values into this equation would produce incorrect predictions about yield.
Note: the above clarification and explanationwere quoted from the help of program.
The final model equations were calculated by this program are shown below:
Aquatic Science and Technology ISSN 2168-9148
2013, Vol. 1, No. 2
www.macrothink.org/ast 125
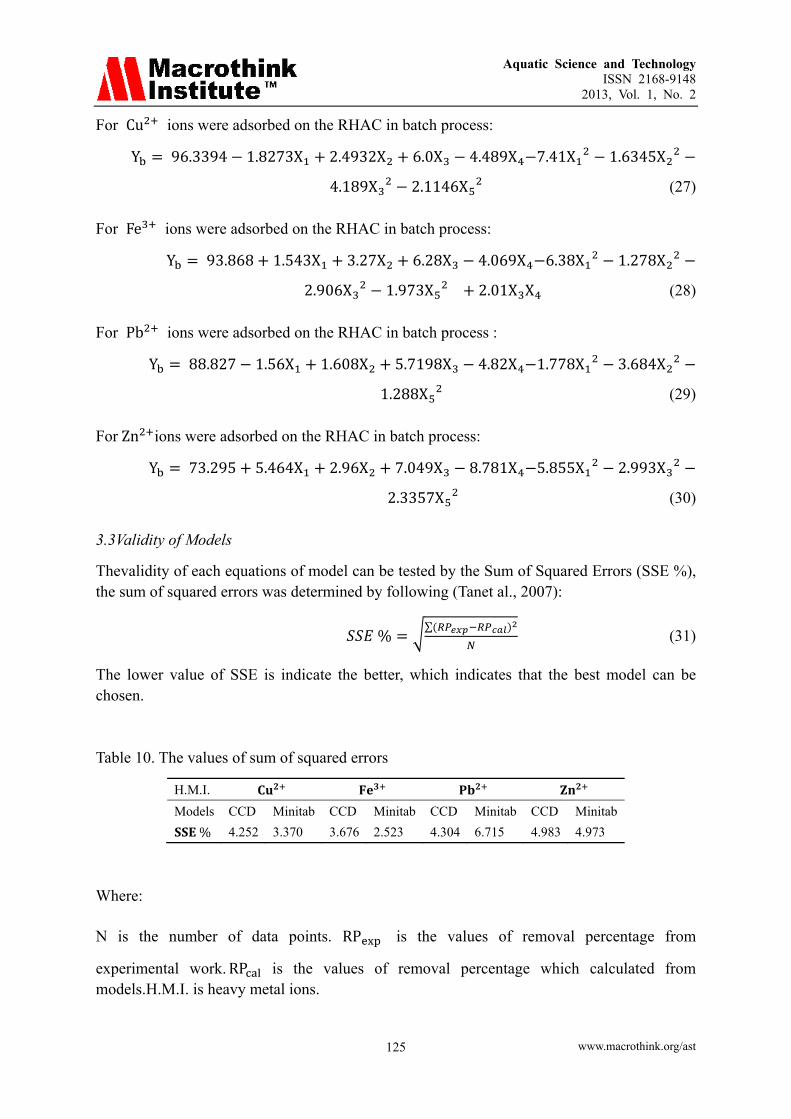
For Cu ions were adsorbed on the RHAC in batch process:
Y 96.3394 1.8273X 2.4932X 6.0X 4.489X 7.41X 1.6345X
4.189X 2.1146X (27)
For Fe ions were adsorbed on the RHAC in batch process:
Y 93.868 1.543X 3.27X 6.28X 4.069X 6.38X 1.278X
2.906X 1.973X 2.01X X (28)
For Pb ions were adsorbed on the RHAC in batch process :
Y 88.827 1.56X 1.608X 5.7198X 4.82X 1.778X 3.684X
1.288X (29)
For Zn ions were adsorbed on the RHAC in batch process:
Y 73.295 5.464X 2.96X 7.049X 8.781X 5.855X 2.993X
2.3357X (30)
3.3Validity of Models
Thevalidity of each equations of model can be tested by the Sum of Squared Errors (SSE %), the sum of squared errors was determined by following (Tanet al., 2007):
%∑
(31)
The lower value of SSE is indicate the better, which indicates that the best model can be chosen.
Table 10. The values of sum of squared errors
H.M.I. Models CCD Minitab CCD Minitab CCD Minitab CCD Minitab
% 4.252 3.370 3.676 2.523 4.304 6.715 4.983 4.973
Where:
N is the number of data points. RP is the values of removal percentage from
experimental work. RP is the values of removal percentage which calculated from models.H.M.I. is heavy metal ions.

Aquatic Science and Technology ISSN 2168-9148
2013, Vol. 1, No. 2
www.macrothink.org/ast 126
4. Conclusion
A mathematical model wasconstructedaccording to Central Composite Design method (CCD) and a software program (minitab16). These models were simulated experimental work for adsorption of ( , , and ) in batch adsorption processes using activated carbon produced from rice husk as local raw material which is low cost and available in huge quantities causing a pollutant problem. Final modeling equations were well simulated experimental work with very little deviation by Fisher's testing (1%), as well as the results of equations derived using (minitab16).
References
Al-Badran, F. (2003). Chlorinated polyethylene Wax from Industrial Waste: Production, Characterization, Modeling and Kinetic Study. (M.Sc. Thesis). Chemical Engineering Department, College of Engineering, Basrah University.
Alhamed, Y. A., & Bamufleh, H. S. (2008). Sulfur Removal From Model Diesel Fuel Using Granular Activated Carbon From Dates’ Stones Activated by ZnCl2. Journal of Fuel, 88, 87-94. http://dx.doi.org/10.1016/j.fuel.2008.07.019
Al-Jomaa, S. F. (2011). A new local adsorbent for the treatment of an industrial wastewater from toxic metals. (M. Sc. Thesis). Chemical Engineering Department, College of Engineering, Basrah University.
Allen, T. T. (2006). Introduction to Engineering Statistics and Six Sigma. Springer-Verlag London Limited.
Al-tameemi, I. A., Nasser, T., & Thuraya, M. A. (2012). Removal of pb (II), cd (II) Ions onto dried Conocarpus erectus leaves using batch adsorption and study the adsorption thermodynamics. Journal of Chem. Pharm. Res., 12, 4961-4968.
Ambursa, M. M., Faruk, U. Z., Uba, A., Sahabi, D. M., Atiku, F. A., & Koko, R. A. (2011). Comparative efficiency of base activated carbon and acid activated carbon for sorption of heavy metals from waste water. Journal of Chem. Pharm. Res., 3(6), 732-741.
Aslan, N., & Cebeci, Y. (2007). Application of Box–Behnken design and response surface methodology for modeling of some Turkish coals. Journal of Fuel, 86, 90-97. http://dx.doi.org/10.1016/j.fuel.2006.06.010
Badmus, M. A. O., Audu, T. O. K., & Anyata, B. U. (2007). Removal of Lead Ion from Industrial Wastewaters by Activated Carbon Prepared from Periwinkle Shells. Turkish, Journal Eng. Env. Sci., 31, 251-263.
Belhachemi, M., Rios, R., Addoun, F., Albero, J. S., Escribano, A. S., & Reinoso, F. R. (2009). Preparation of activated carbon from date pits: Effect of the activation agent and liquid phase oxidation. Journal of Analytical and Applied Pyrolysis, 86, 168-172. http://dx.doi.org/10.1016/j.jaap.2009.05.004
Chen, Y., Zhu, Y., Wang, Z., Li, Y., Wang, L., Lili, Ding, X. G., Ma, Y., & Guo, Y. (2011).

Aquatic Science and Technology ISSN 2168-9148
2013, Vol. 1, No. 2
www.macrothink.org/ast 127
Application studies of activated carbon derived from rice husks produced by chemical-thermal process. Advances in Colloid and Interface Science, 163, 39-52. http://dx.doi.org/10.1016/j.cis.2011.01.006
Dada, A. O., Olalekan, A. P., Olatunya, A. M., & Dada, O. (2012). Langmuir, Freundlich, Temkin and Dubinin–Radushkevich Isotherms Studies of Equilibrium Sorption of Zn2+ Unto Phosphoric Acid Modified Rice Husk. IOSR Journal of Applied Chemistry (IOSR-JAC), 3(1), 38-45.
Daffalla, S. B., Mukhtar, H., & Shaharun, M. S. (2012). Effect of Organic and Inorganic Acid Pretreatment on Structural Properties of Rice Husk and Adsorption Mechanism of Phenol. International Journal of Chemical and Environmental Engineering, 3(3), 192-200.
Deosarkar, S. D. (2012). Cu(II) Adsorption from Aqueous Solution by Punicagranatum L. Husk. Journal of Chem. Pharm. Res, 4(6), 3319-3323.
Ghadeer, J. (2009). Study the Kinetic Characterizations of New Photo-Stabilizer(4-Stearoylresorcinol) Production Using Batch Reactor. (M. Sc. Thesis), Chemical Engineering Department, Basrah University.
Gueu, S., Yao, B., Adouby, K., & Ado, G. (2006). Heavy Metals Removal in Aqueous Solution by Activated Carbons Prepared from Coconut Shell and Seed Shell of the Plam Tree. Journal of Applied Sciences, 6(13), 2789-2793. http://dx.doi.org/10.3923/jas.2006.2789.2793
Hameed, B. H., Ahmad, A. A., & Aziz, N. (2011). Adsorption of Reactive Dye on Palm-Oil Industry Waste: Equilibrium, Kinetic and Thermodynamic Studies. Journal of Desalination, 247, 551-560. http://dx.doi.org/10.1016/j.desal.2008.08.005
Itodo, A. U., Abdulrahman, F. W., Hassan, L. G., Maigandi, S. A., & Itodo, H. U. (2010). Intraparticle Diffusion and Intraparticulate Diffusivities of Herbicide on Derived Activated Carbon. Researcher, 2(2), 74-86.
Itodo, H. U., & Itodo, A. U. (2010). Surface Coverage and Adsorption Study of Dye Uptake by Derived Acid and Base Treated Mango Seed Shells. Journal Chem. Pharm. Res., 2(3), 673-683.
Jaguaribe, E. F., Medeiros, L. L., Barreto, M. C. S., & Araujo, L. P. (2000). The Performance of Activated Carbons From Sugarcane Bagasse, Babassu, and Coconut Shells in Removing Residual Chlorine. Brazilian Journal of Chemical Engineering, 22(1), 41-47. http://dx.doi.org/10.1590/S0104-66322005000100005
John, W. M. P. (1998). Statistical Design and Analysis of Experiments. Society for Industrial and Applied Mathematics. http://dx.doi.org/10.1137/1.9781611971149
Juan, F. G., Encinar, J. M., Carmen, M., Sabio, E., Ramiro, A., Canito, J., & Ganan, J. (2005). Preparation of activated carbons from used tyres by gasification with steam and carbon dioxide.. Applied Surface Science, 252, 5999-6004. http://dx.doi.org/10.1016/j.apsusc.2005.11.029

Aquatic Science and Technology ISSN 2168-9148
2013, Vol. 1, No. 2
www.macrothink.org/ast 128
Kannan, & Veemaraj. (2009). Removal of Lead (II) Ions by Adsorption onto Bamboo Dust and Commercial Activated Carbons-A Comparative Study. Journal of Chemistry, 6(2), 247-256.
Lazic, Z. R. (2004). Design of Experiments in Chemical Engineering. Wiley-VCH, Germany. http://dx.doi.org/10.1002/3527604162
Mohammadi, S. Z., Karimi, M. A., Afzali, D., & Mansouri, F. (2010). Removal of Pb(II) from aqueous solutions using activated carbon from Sea-buckthorn stones by chemical activation. Journal of Desalination, 262, 86-93. http://dx.doi.org/10.1016/j.desal.2010.05.048
Mui, E. L. K., Cheung, W. H., Valix, M., & McKay, G. (2010). Mesoporous activated carbon from waste tyre rubber for dye removal from effluents. journal of Microporous and Mesoporous Materials, 130, 287-294. http://dx.doi.org/10.1016/j.micromeso.2009.11.022
Nwabanne, J. T., & Igbokwe, P. K. (2012). Adsorption Performance of Packed Bed Column for the removal of Lead (II) using oil Palm Fibre. International Journal of Applied Science and Technology, 2(5), 106-115.
Philip, C. A., & Girgis, B. S. (1996). Adsorption Characteristics of Microporous Carbons from Apricot Stones Activated by Phosphoric Acid. Journal of Chemical Technology and Biotechnology, 67(3), 248-254. http://dx.doi.org/10.1002/(SICI)1097-4660(199611)67:3<248::AID-JCTB557>3.0.CO;2-1
Prabakaran, R., & Arivoli, S. (2012). Equilibrium Isotherm, Kinetic and Thermodynamic studies of Rhodamine B Adsorption using Thespesiapopulnea Bark. Journal of Chem. Pharm. Res., 4(10), 4550-4557.
Rosa, G. D., Reynel-Avila, H. E., Bonilla-Petriciolet, A., Cano-Rodriguez, I., Velasco-Santos, C., & Martinez-Hernandez, A. L. (2008). Recycling Poultry Feathers for Pb Removal from Wastewater: Kinetic and Equilibrium Studies. World Academy of Science, Engineering and Technology, 47, 394-402.
Satya, S. P. M., Ahmed, J., & Krishnaiah, K. (1997). Production of Activated Carbon from Coconut Shell Char in a Fluidized Bed Reactor. Industrial and Engineering Chemistry Research Journal, 36(9), 3625-3630. http://dx.doi.org/10.1021/ie970190v
Shanthi, T., & Selvarajan, V. M. (2012). Removal of Cu (II) Ions from Aqueous Solution by Carbon Prepared from Henna Leaves, Pungam Bark and CAC. Journal Chem. Pharm. Res., 4(9), 4296-4306.
Song, X., Zhang, Y., Yan, C., Jiang, W., & Chang, C. (2012). The Langmuir monolayer adsorption model of organic matter into effective pores in activated carbon. Journal of Colloid and Interface Science, 389, 213-219. http://dx.doi.org/10.1016/j.jcis.2012.08.060
Souag, R., Touaibia, D., Benayada, B., & Boucenna, A. (2009). Adsorption of Heavy Metals (Cd, Zn and Pb) from Water UsingKeratin Powder Prepared from Algerien Sheep Hoofs. European Journal of Scientific Research, 35(3), 416-425.
Aquatic Science and Technology ISSN 2168-9148
2013, Vol. 1, No. 2
www.macrothink.org/ast 129
Surchi, K. M. S. (2011). Agricultural Wastes as Low Cost Adsorbents for Pb Removal: Kinetics, Equilibrium and Thermodynamics. International Journal of Chemistry, 3(3), 103-112. http://dx.doi.org/10.5539/ijc.v3n3p103
Tan, I. A. W., Ahmad, A. L., & Hameed, B. H. (2007). Adsorption of basic dye using activated carbon prepared from oil palm shell: batch and fixed bed studies. Journal of Desalination, 225, 13-28. http://dx.doi.org/10.1016/j.desal.2007.07.005
Tan, I. A. W., Ahmad, A. L., & Hameed, B. H. (2007). Preparation of activated carbon from coconut husk: Optimization study on removal of 2,4,6-trichlorophenol using response surface methodology. Journal of Hazardous Materials, 153, 709-717. http://dx.doi.org/10.1016/j.jhazmat.2007.09.014
Teng, H., Lin, Y., & Hsu, L. (2000). Production of Activated Carbons from Pyrolysis of Waste Tires Impregnated with Potassium Hydroxide. Journal of the Air & Waste Management Association, 50, 1940-1946. http://dx.doi.org/10.1080/10473289.2000.10464221
Appendix
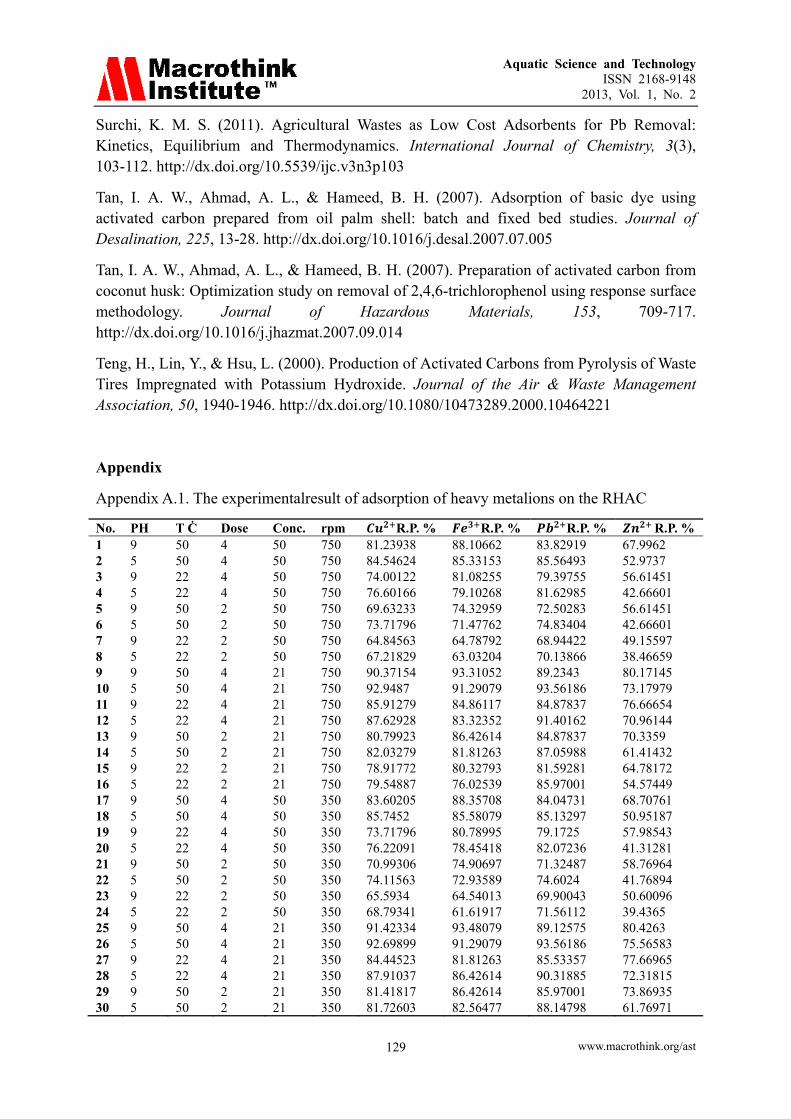
Appendix A.1. The experimentalresult of adsorption of heavy metalions on the RHAC
No. PH T Ċ Dose Conc. rpm R.P. % R.P. % R.P. % R.P. %1 9 50 4 50 750 81.23938 88.10662 83.82919 67.9962 2 5 50 4 50 750 84.54624 85.33153 85.56493 52.9737 3 9 22 4 50 750 74.00122 81.08255 79.39755 56.61451 4 5 22 4 50 750 76.60166 79.10268 81.62985 42.66601 5 9 50 2 50 750 69.63233 74.32959 72.50283 56.61451 6 5 50 2 50 750 73.71796 71.47762 74.83404 42.66601 7 9 22 2 50 750 64.84563 64.78792 68.94422 49.15597 8 5 22 2 50 750 67.21829 63.03204 70.13866 38.46659 9 9 50 4 21 750 90.37154 93.31052 89.2343 80.17145 10 5 50 4 21 750 92.9487 91.29079 93.56186 73.17979 11 9 22 4 21 750 85.91279 84.86117 84.87837 76.66654 12 5 22 4 21 750 87.62928 83.32352 91.40162 70.96144 13 9 50 2 21 750 80.79923 86.42614 84.87837 70.3359 14 5 50 2 21 750 82.03279 81.81263 87.05988 61.41432 15 9 22 2 21 750 78.91772 80.32793 81.59281 64.78172 16 5 22 2 21 750 79.54887 76.02539 85.97001 54.57449 17 9 50 4 50 350 83.60205 88.35708 84.04731 68.70761 18 5 50 4 50 350 85.7452 85.58079 85.13297 50.95187 19 9 22 4 50 350 73.71796 80.78995 79.1725 57.98543 20 5 22 4 50 350 76.22091 78.45418 82.07236 41.31281 21 9 50 2 50 350 70.99306 74.90697 71.32487 58.76964 22 5 50 2 50 350 74.11563 72.93589 74.6024 41.76894 23 9 22 2 50 350 65.5934 64.54013 69.90043 50.60096 24 5 22 2 50 350 68.79341 61.61917 71.56112 39.4365 25 9 50 4 21 350 91.42334 93.48079 89.12575 80.4263 26 5 50 4 21 350 92.69899 91.29079 93.56186 75.56583 27 9 22 4 21 350 84.44523 81.81263 85.53357 77.66965 28 5 22 4 21 350 87.91037 86.42614 90.31885 72.31815 29 9 50 2 21 350 81.41817 86.42614 85.97001 73.86935 30 5 50 2 21 350 81.72603 82.56477 88.14798 61.76971

Aquatic Science and Technology ISSN 2168-9148
2013, Vol. 1, No. 2
www.macrothink.org/ast 130
31 9 22 2 21 350 77.64412 81.06704 82.68977 66.5229 32 5 22 2 21 350 79.86298 76.30535 84.87837 55.21746 33 2.243 36 3 35.5 550 65.16427 53.23355 82.7634 33.13241 34 11.76 36 3 35.5 550 47.34202 65.34776 74.23148 56.28086 35 7 2.702 3 35.5 550 84.75804 84.42365 83.76516 67.8024 36 7 69.3 3 35.5 550 93.10076 91.87511 90.64515 78.72574 37 7 36 0.6216 35.5 550 51.82756 58.27698 41.58728 30.38296 38 7 36 5.3784 35.5 550 97.12532 99.60192 93.83991 91.40932 39 7 36 3 1.013 550 100 100 100 98.8141 40 7 36 3 69.99 550 87.49923 85.7259 81.19688 64.50927 41 7 36 3 35.5 74.32 78.67269 79.63733 73.18559 57.88295 42 7 36 3 35.5 1026 93.75402 88.79539 89.35254 71.35046 43 7 36 3 35.5 550 96.60561 95.66103 89.35254 73.14867 44 7 36 3 35.5 550 96.06727 95.66103 90.96699 74.06098 45 7 36 3 35.5 550 97.94627 93.81068 89.9999 70.46211 46 7 36 3 35.5 550 96.95424 95.98851 88.05152 73.14867 47 7 36 3 35.5 550 97.46075 91.87511 91.28831 75.91122 48 7 36 3 35.5 550 96.2487 92.67749 88.05152 75.91122 49 7 36 3 35.5 550 97.21003 93.52026 84.43038 74.98215 50 7 36 3 35.5 550 96.95424 94.71204 89.9999 72.24541 51 7 36 3 35.5 550 95.32283 92.95377 87.39786 74.98215 52 7 36 3 35.5 550 95.03638 93.81068 88.37756 74.06098
AppendixA.2. FT Values

Aquatic Science and Technology ISSN 2168-9148
2013, Vol. 1, No. 2
www.macrothink.org/ast 131
AppendixB. The calculation and results of models were determined by Minitab program

Aquatic Science and Technology ISSN 2168-9148
2013, Vol. 1, No. 2
www.macrothink.org/ast 132
Adsorption of in batch presses Adsorption of in batch presses

Aquatic Science and Technology ISSN 2168-9148
2013, Vol. 1, No. 2
www.macrothink.org/ast 133
Adsorption of in batch presses
Adsorption of in batch presses

Aquatic Science and Technology ISSN 2168-9148
2013, Vol. 1, No. 2
www.macrothink.org/ast 134
Copyright Disclaimer
Copyright reserved by the author(s).
This article is an open-access article distributed under the terms and conditions of the Creative Commons Attribution license (http://creativecommons.org/licenses/by/3.0/).