Modeling and measuring sediment transport for river ...
29
Modeling and measuring sediment transport for river restoration and dam removal Timothy C. Granata 1,2 , Fang Cheng 1 , Ulrike Zika 1 , Daniel Gillenwater 1 , and Christopher Tomsic 1 1. Ohio State University 2. Granata Ecological Engineering Published in: Sediment Dynamics Upon Dam Removal. 2008 ASCE Task Committee Monograph ASCE/EWRI, Watershed Management Conference 2005
Transcript of Modeling and measuring sediment transport for river ...

Modeling and measuring sediment transport for river restoration and
dam removal Timothy C. Granata1,2, Fang Cheng1, Ulrike Zika1,
Daniel Gillenwater1, and Christopher Tomsic1
1. Ohio State University2. Granata Ecological Engineering
Published in: Sediment Dynamics Upon Dam Removal.
2008 ASCE Task Committee Monograph
ASCE/EWRI, Watershed Management Conference 2005

Fremont
Tiffin
Ballville Dam
SanduskyBay
Loss of Habitat
Sandusky River Watershed(Northern Ohio)
St. John Dam
Inaccessible Habitat
Bucyrus
UpperSandusky
Lake Erie
16 km
10 miles
Flow
N

St. John Ballville
Dam Type 2.2 m, Class IV 10 m, Class II
Channel Slope
Shallow 0.0001 m/m Steep 0.001 m/m
Use None Water Supply
Spawning Habitat (gravel)
Up- & Downstream Upstream
Backwater 13 km 5 km
Fate Removed 2003 Still Standing
Two dams on Sandusky River

St. John’s Dam, Sandusky River, Seneca Co.
2 m40 m

Sandusky River
Wolf Creek
Honey Creek
Upstream Boundaries
Downstream Boundary
St John Dam
Mike11 SimulationSt. John Dam Removal
• 60 km river network• 51 cross sections• Q(t) & Q-H BCs• dam (weir) timed
breach & removal• Acker-White
total load• active bed layer, 5m• d35 = 0.5 mm
USGS Gage:0498000
USGS Gages : 0496800 + 0419500
SanduskyRiver

St. John Dam Breached Spring 2003
Measured Data• 200 m downstream• fixed YSI 6600 sonde• calibrated H(t) & SS(t)• upstream gage-control• downstream gage

HD Calibration
modeledwater level
vs.H(t)
during breach.
tuned with Manning’s n

St. John Dam Removed Fall 2003

Simulation of water level
vs.H(t)
duringremoval

A B C D
Post-damPre-dam
MeasuredData
Bed levelsurveys
• DGPS• ADP• Total
Station
Total load• Pit traps• SS(t)
bed level

SedimentDistributions
• Contact points
• DGPS• Every 10 ft
ODNR Geologic Survey
Dam
Dam
July 2003 July 2004

A B C D
7-30-2004 simulated
Water level 2004
Water level 1998
measuredmeasured
Longitudinal profile- modeled vs. measured bed level
Deposition ErosionErosion No scour
moving average

A B C D

Simulation of Transport
l
Erosion
Deposition
No scour
Qtotal= 2 kg/sQSS = 0.5 kg/s

Surface sediment distributions
upstream downstream
d50≈ 7 mm d50: 8 to 3 mm d50: 7 to 3.5 mmd50: 7 to 4 mm d50≈ 7 mm
Post Post Post

Accuracy of Transport
Particle diameter = 0.5mm Particle diameter = 1mmMeasurement(kg) Simulation
(kg)Simulation/measurement
Simulation(kg)
Simulation/measurement
7/30/04 7.51 2322.70 309 1040.93 1398/13/04 2.87 1858.42 65 841.20 299/5/04 10.51 5950.04 566 2799.00 2669/13/04 2.37 1606.46 679 734.83 310
Table 2, Sensitivity analysis of time integrated sediment load on grain size in thereservoir deposits.

Conclusions of St. John simulation
• Water levels and routing very accurate
• General agreement for bed level adjustment
• Wave of sediment downstream captured
A-W ST model sensitive to- initial distribution of sediment- size of sediment

10 m
120 m
Ballville Dam, Sandusky River, Sandusky Co.

N
Sand
Limestone Bedrock
Gravel/PebbleBoulder/Cobble
Silt/Clay
River Mile 35
River Mile 36
Riverine SubstrateMapping
Potential HabitatUpstream of Ballville Dam

SimulationBallville Dam Removal
• 62 km river network• 39 cross sections• Q(t) & H(t) BCs• dam (weir) timed
removal• Acker-White total load
• active bed layer, 5 m• d35 = 1 mm
BoundaryUpstream
BoundaryDownstream
USGS Gage:0498000
Lake levelNAVD
SanduskyRiver
WolfCreek
SpicerCreek

0200400600800
10/1
/197
8
10/1
/198
0
10/1
/198
2
10/1
/198
4
10/1
/198
6
10/1
/198
8
10/1
/199
0
10/1
/199
2
Q (m
3/s)
172172.5
173173.5
174174.5
175175.5
176W
ater
Lev
el (m
)
High Flow Low Flow
Lake levelvs.
Discharge
0.0 5000.0 10000.0 15000.0 20000.0 25000.0 30000.0 35000.0 40000.0 45000.0 50000.0 55000.0 60000.0[m]
170.0
180.0
190.0
200.0
210.0
220.0
230.0
[m] Water Level - 15-6-1984 19:00 FAIL0681RHD.res11
SANDUSKY 0 - 7825
030 201
451
679
908
1137
1441
1819
2252
2612 2
920
3343
3733
4032
4191
4413
4474
5373
5873
7373
7825
SANDUSKY 7825 - 27453
8873
1037
3
1187
312
873
1487
315
373
1587
3
1987
320
373
2237
3
2737
327
453
SANDUSKY 27453 - 62378
3037
3
3370
133
901
3429
234
890 34
964
3497
034
984
3537
3 3553
435
679
3603
336
226
3711
137
337
3741
737
514
3761
037
900
3807
738
334
3867
238
785
3893
039
155
3934
8 4025
041
344
4193
942
470
4300
144
353
4668
7
4834
548
892
5122
5
5745
3
6237
8
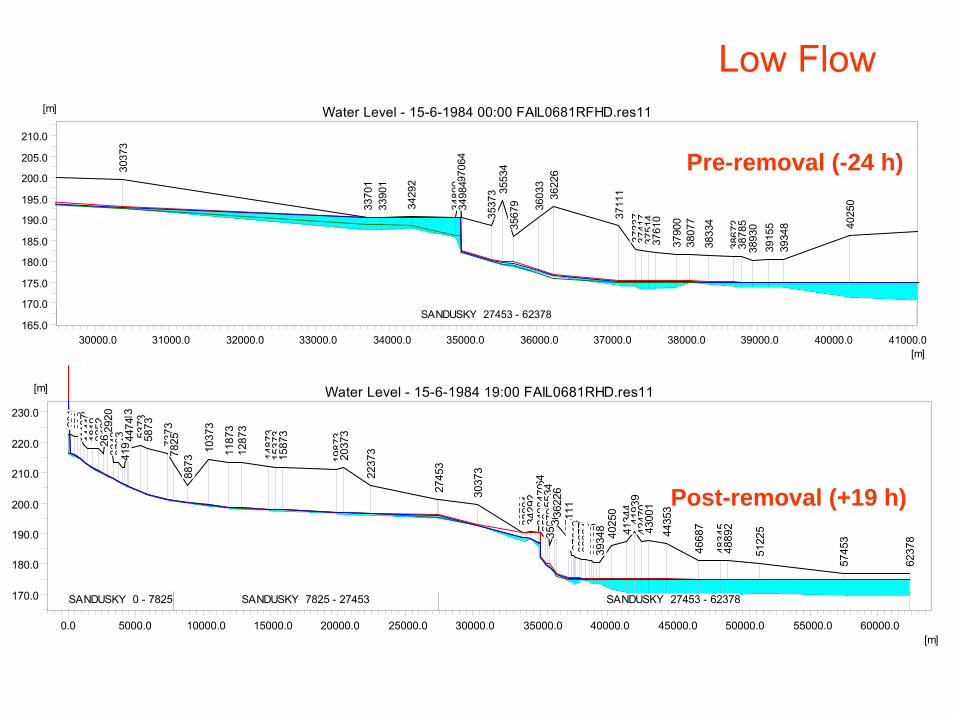
Post-removal (+19 h)
Pre-removal (-24 h)
Low Flow
30000.0 31000.0 32000.0 33000.0 34000.0 35000.0 36000.0 37000.0 38000.0 39000.0 40000.0 41000.0[m]
165.0
170.0
175.0
180.0
185.0
190.0
195.0
200.0
205.0
210.0
[m] Water Level - 15-6-1984 00:00 FAIL0681RFHD.res11
SANDUSKY 27453 - 62378
3037
3
3370
133
901
3429
2
3489
0 3496
434
970
3498
4
3537
3 3553
435
679 36
033
3622
6
3711
137
337
3741
737
514
3761
0
3790
038
077
3833
4
3867
238
785
3893
039
155
3934
8 4025
0

0.0 5000.0 10000.0 15000.0 20000.0 25000.0 30000.0 35000.0 40000.0 45000.0 50000.0 55000.0 60000.0[m]
170.0
180.0
190.0
200.0
210.0
220.0
230.0
[m] Water Level - 14-6-1981 15:00 FAIL0681REHD.res11
SANDUSKY 0 - 7825
030 201
451
679
908
1137
1441
1819
2252
2612 2
920
3343
3733
4032
4191
4413
4474
5373
5873
7373
7825
SANDUSKY 7825 - 27453
8873
1037
3
1187
312
873
1487
315
373
1587
3
1987
320
373
2237
3
2737
327
453
SANDUSKY 27453 - 62378
3037
3
3370
133
901
3429
234
890 34
964
3497
034
984
3537
3 3553
435
679
3603
336
226
3711
137
337
3741
737
514
3761
037
900
3807
738
334
3867
238
785
3893
039
155
3934
8 4025
041
344
4193
942
470
4300
144
353
4668
7
4834
548
892
5122
5
5745
3
6237
8
Post removal (+15 h)
High Flow
30000.0 31000.0 32000.0 33000.0 34000.0 35000.0 36000.0 37000.0 38000.0 39000.0 40000.0[m]
175.0
180.0
185.0
190.0
195.0
200.0
205.0
[m] Water Level - 14-6-1981 00:00 FAIL0681REHD.res11
SANDUSKY 27453 - 62378
3037
3
3370
133
901
3429
2
3489
034
964
3497
034
984
3537
335
534
3567
9 3603
336
226
3711
137
337
3741
737
514
3761
0
3790
038
077
3833
4
3867
238
785
3893
039
155
3934
8
4025
0
Pre-removal (-24 h)

0.0 5000.0 10000.0 15000.0 20000.0 25000.0 30000.0 35000.0 40000.0 45000.0 50000.0 55000.0[m]
170.0
180.0
190.0
200.0
210.0
220.0
[m] Bed Level - 1-5-1979 00:00 JUNE25ST.res11
SA NDUSKY 7825 - 27453
7825
8873 10
373
1187
312
873
1487
315
373
1587
3
1987
320
373
2237
3
2737
327
453
SA NDUSKY 27453 - 6237830
373
3370
133
901
3429
234
890
3496
434
984
3537
335
534
3567
936
033
3622
637
111
3733
737
417
3751
437
610
3790
038
077
3833
438
672
3878
538
930
3915
539
348
4025
041
344
4193
942
470
4300
1
4435
3
4668
7
4834
548
892
5122
5
5745
3
6237
8
A
0.0 10000.0 20000.0 30000.0 40000.0 50000.0 60000.0[m]
180.0
200.0
220.0
240.0
[m] Bed Level - 1-5-1979 00:00 JUNE20ST.res11
SA NDUSKY
0 30 201
451
679
908
1137
1441
1819
2252
2612
2920
3343
3733
4032
4191 4
413
4474
5373
5873
7373
7825
SA NDUSKY 7825 - 27453
8873 10
373
1187
312
873
1487
315
373
1587
3
1987
320
373
2237
3
2737
327
453
SA NDUSKY 27453 - 62378
3037
3
3370
133
901
3429
234
890
3496
434
984
3537
335
534
3567
936
033
3622
637
111
3733
737
417
3751
437
610
3790
038
077
3833
438
672
3878
538
930
3915
539
348
4025
041
344
4193
942
470
4300
144
353
4668
7
4834
548
892
5122
5
5745
3
6237
8
B
C
0.0 5000.0 10000.0 15000.0 20000.0 25000.0 30000.0 35000.0 40000.0 45000.0 50000.0 55000.0 60000.0[m]
170.0
180.0
190.0
200.0
210.0
220.0
230.0
[m] Bed Level - 22-1-1984 06:00 ST4_30.res11
SANDUSKY
0 30 201
451
679
908
1137
1441
1819
2252
2612
2920
3343
3733
4032
4191
4413
4474
5373
5873
7373
7825
SANDUSKY 7825 - 27453
8873
1037
3
1187
312
873
1487
315
373
1587
3
1987
320
373
2237
3
2737
327
453
SANDUSKY 27453 - 62378
3037
3
3370
133
901
3429
234
890 3
4964
3498
435
373 35
534
3567
9 3603
336
226
3711
137
337
3741
737
514
3761
037
900
3807
738
334
3867
238
785
3893
039
155
3934
8 4025
041
344
4193
942
470
4300
144
353
4668
7
4834
548
892
5122
5
5745
3
6237
8
Bed Level & Sediment Transport
CatastrophicFailure
NoRemoval
ControlledRemoval
0.0 5000.0 10000.0 15000.0 20000.0 25000.0 30000.0 35000.0 40000.0 45000.0 50000.0 55000.0 60000.0[m]
170.0
180.0
190.0
200.0
210.0
220.0
230.0
[m] Bed Level - 22-1-1984 06:00 ST4_30.res11
SANDUSKY
0 30 201
451
679
908
1137
1441
1819
2252
2612
2920
3343
3733
4032
4191
4413
4474
5373
5873
7373
7825
SANDUSKY 7825 - 27453
8873
1037
3
1187
312
873
1487
315
373
1587
3
1987
320
373
2237
3
2737
327
453
SANDUSKY 27453 - 62378
3037
3
3370
133
901
3429
234
890 3
4964
3498
435
373 35
534
3567
9 3603
336
226
3711
137
337
3741
737
514
3761
037
900
3807
738
334
3867
238
785
3893
039
155
3934
8 4025
041
344
4193
942
470
4300
144
353
4668
7
4834
548
892
5122
5
5745
3
6237
8

Conclusions• Optimum removal - low flow & lake level
• Timed draw-down - no flooding or sediment loading more than bankfull event
• Model is useful for breach scenarios & restoration schemes
• Model output (water level & velocity) coupled to ecological model for habitat scenarios

Acknowledgements
• GLPF and ODOT for funding projects• Bob Vargo & Bob Gable (ODNR Scenic Rivers)• Ryan Murphy & Connie Livchak (ODNR-GS)• My Group
Ulrike Zika, Fang Cheng, Matthew Nechvatal, Daniel Gillenwater, Christopher Tomsic, Ralph Greco

Mike 11 Fully Dynamic ModelSaint Venant Equation
bQ
thb
xQ
=−∂∂
∂∂
∂Q∂t
+∂
αQA
⎛ ⎝
⎞ ⎠
∂x+ gA
∂h∂x
+gQQC2AR
Continuity
Momentum
h Q
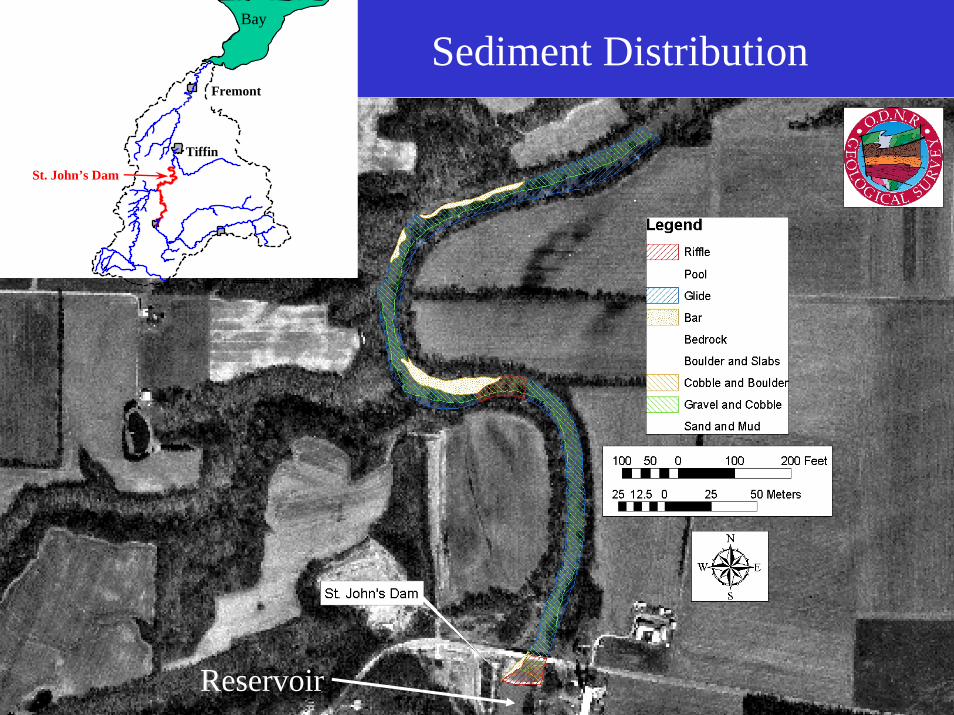
Sediment Distribution
Reservoir
Fremont
Tiffin
St. John’s Dam
Bay

Remaining WalleyeSpawning Area
Ballville Reservoir
Flow
Water Treatment Plant
Flow
0
Sandusky River Fremont, Ohio
Ballville Dam
The Ballville Dam is located 18 miles upstream of Sandusky Bay. The dam serves as the only water supply for the City of Fremont (population 32,645). The dam was constructed in 1911.
Sandusky River with dam and habitat locations (Ohio Dept. Natural Resources-ODNR GS).
Sandusky
End of Reservoir(3 miles in Length)
LeviesPotential Habitat
Fremont
Tiffin
Ballville Dam
Bay
Sandusky Co.
Seneca Co.
Wyndot Co. Crawfort Co.
1 km