Modal testing using impact excitation and a scanning...
11
91 Modal testing using impact excitation and a scanning LDV 1 A.B. Stanbridge ∗ , A.Z. Khan and D.J. Ewins Imperial College, London, UK Received 2 June 1999 Revised 12 October 1999 If a laser Doppler vibrometer is used in a continuously- scanning mode to measure the response of a vibrating struc- ture, its output spectrum contains side-bands from which the response mode shape, as defined along the scan line, may be obtained. With impact excitation, the response is the sum- mation of a set of exponentially-decaying sinusoids which, in the frequency domain, has peaks at the natural frequen- cies and at ‘sideband’ pseudo-natural frequencies, spaced at multiples of the scan frequency. Techniques are described for deriving natural mode shapes from these, using standard modal analysis procedures. Some limitations as to the types of mode which can be analysed are described. The process is simple and speedy, even when compared with a normal point-by-point impact test survey. Information may also be derived, using a circular scan, on the direction of vibration, and angular vibration, at individual points. Keywords: Modal testing, hammer, impact tests, spatial- scanning, LDV 1. Introduction The Laser Doppler Vibrometer (LDV) is extensively used as a vibration measurement transducer, in a wide range of applications [1–4,9], chiefly because the struc- 1 An earlier form of this paper was presented at the 3rd Interna- tional Conference on Vibration Measurements by Laser Techniques, Ancona, Italy, October i.e. 1998. The conference was organized by the Italian Association of Laser Velocimetry. The articles were se- lected, edited, and reviewed by a committee chaired by: Profes- sor Enrico Primo Tomasini, Department of Mechanics, Faculty of Engineering, University of Ancona, Italy. ∗ Corresponding author: Mr.A.B. Stanbridge, Mechanical En- gineering Department, Exhibition Road, London SW7 2BX, UK. Tel.: +44 171 5895111 ex 57079; Fax: +44 171 5841560; E-mail: [email protected]. ture is not loaded by attachment of transducers, and be- cause the measurement point is so easily varied. With what is often termed a ‘scanning LDV’, the measure- ment is moved successively to a series of points, and the mode-shape derived, often, by a curve-fitting process. An LDV may, however, be used in a continuously- moving scanning mode, and can produce data on a structure’s response mode shape [5,8] as defined along the scan line, in one measurement. The direction of vi- bration [6] and angular vibration at a point [7] can also be measured. These techniques have previously been described [6–8] for sinusoidal excitation,where the out- put spectrum of a continuously-scanning laser Doppler vibrometer (CSLDV) consists of a component at the ex- citation frequency, together with sideband components separated by multiples of the scan frequency. This paper explores the use of a CSLDV in combi- nation with impact testing, which is often preferred to sine testing because of its speed and convenience. A method of testing, using narrow-band random ex- citation with a CSLDV has been described [7,8] but, unfortunately, the force input spectrum tended to dis- appear at and around the natural frequencies, leading to poor coherence and distortion in the frequency re- sponse functions (FRFs). With impact excitation the input spectrum does not, in general, suffer from such ‘drop-outs’ near the natural frequencies so that this problem should be avoided. If an impact is applied to a structure being scanned by a CSLDV, the scanning produces modulation of the transient response (additional to that produced by the natural decay), and there are corresponding additional sideband response spectrum peaks, again spaced by the CSLDV scan frequency. For meaningful results it is obviously necessary that at least one scan be completed before the transient response ends, which means that there are constraints on the modes which can be dealt with. However, impact tests are widely used: they are quick to set up and easy to carry out, and there is no re- sponse distortion due to uncancelled shaker (and push- rod) effects. This extension in technique could there- fore prove to be a very useful addition to the vibration engineer’s tool-kit. Shock and Vibration 7 (2000) 91–100 ISSN 1070-9622 / $8.00 2000, IOS Press. All rights reserved
-
Upload
nguyenkiet -
Category
Documents
-
view
228 -
download
0
Transcript of Modal testing using impact excitation and a scanning...
91
Modal testing using impact excitation and ascanning LDV1
A.B. Stanbridge∗, A.Z. Khan and D.J. EwinsImperial College, London, UK
Received 2 June 1999
Revised 12 October 1999
If a laser Doppler vibrometer is used in a continuously-scanning mode to measure the response of a vibrating struc-ture, its output spectrum contains side-bands from which theresponse mode shape, as defined along the scan line, may beobtained. With impact excitation, the response is the sum-mation of a set of exponentially-decaying sinusoids which,in the frequency domain, has peaks at the natural frequen-cies and at ‘sideband’ pseudo-natural frequencies, spaced atmultiples of the scan frequency. Techniques are describedfor deriving natural mode shapes from these, using standardmodal analysis procedures. Some limitations as to the typesof mode which can be analysed are described. The processis simple and speedy, even when compared with a normalpoint-by-point impact test survey. Information may also bederived, using a circular scan, on the direction of vibration,and angular vibration, at individual points.
Keywords: Modal testing, hammer, impact tests, spatial-scanning, LDV
1. Introduction
The Laser Doppler Vibrometer (LDV) is extensivelyused as a vibration measurement transducer, in a widerange of applications [1–4,9], chiefly because the struc-
1An earlier form of this paper was presented at the 3rd Interna-tional Conference on Vibration Measurements by Laser Techniques,Ancona, Italy, October i.e. 1998. The conference was organized bythe Italian Association of Laser Velocimetry. The articles were se-lected, edited, and reviewed by a committee chaired by: Profes-sor Enrico Primo Tomasini, Department of Mechanics, Faculty ofEngineering, University of Ancona, Italy.
∗Corresponding author: Mr.A.B. Stanbridge, Mechanical En-gineering Department, Exhibition Road, London SW7 2BX, UK.Tel.: +44 171 5895111 ex 57079; Fax: +44 171 5841560; E-mail:[email protected].
ture is not loaded by attachment of transducers, and be-cause the measurement point is so easily varied. Withwhat is often termed a ‘scanning LDV’, the measure-ment is moved successively to a series of points, and themode-shape derived, often, by a curve-fitting process.An LDV may, however, be used in a continuously-moving scanning mode, and can produce data on astructure’s response mode shape [5,8] as defined alongthe scan line, in one measurement. The direction of vi-bration [6] and angular vibration at a point [7] can alsobe measured. These techniques have previously beendescribed [6–8] for sinusoidal excitation,where the out-put spectrum of a continuously-scanning laser Dopplervibrometer (CSLDV) consists of a component at the ex-citation frequency, together with sideband componentsseparated by multiples of the scan frequency.
This paper explores the use of a CSLDV in combi-nation with impact testing, which is often preferred tosine testing because of its speed and convenience.
A method of testing, using narrow-band random ex-citation with a CSLDV has been described [7,8] but,unfortunately, the force input spectrum tended to dis-appear at and around the natural frequencies, leadingto poor coherence and distortion in the frequency re-sponse functions (FRFs). With impact excitation theinput spectrum does not, in general, suffer from such‘drop-outs’ near the natural frequencies so that thisproblem should be avoided.
If an impact is applied to a structure being scannedby a CSLDV, the scanning produces modulation of thetransient response (additional to that produced by thenatural decay), and there are corresponding additionalsideband response spectrum peaks, again spaced by theCSLDV scan frequency. For meaningful results it isobviously necessary that at least one scan be completedbefore the transient response ends, which means thatthere are constraints on the modes which can be dealtwith. However, impact tests are widely used: they arequick to set up and easy to carry out, and there is no re-sponse distortion due to uncancelled shaker (and push-rod) effects. This extension in technique could there-fore prove to be a very useful addition to the vibrationengineer’s tool-kit.
Shock and Vibration 7 (2000) 91–100ISSN 1070-9622 / $8.00 2000, IOS Press. All rights reserved
92 A.B. Stanbridge et al. / Modal testing using impact excitation and a scanning LDV
2. The continuous-scan laser doppler vibrometer
A laser Doppler vibrometer works, essentially, bydetecting the Doppler-shifted wavelengths of light scat-tered from a point on a vibrating structure, using aninterferometer. A coherent laser light beam (usuallyClass I or II He-Ne) is focused onto a point on a vi-brating surface. The Doppler-shifted wavelength of thereturned light is a measure of the structure’s vibrationvelocity in the direction of the incident light and, aftersuitable processing, a voltage signal is produced whichis a direct analogue of the vibration. Commercial in-struments have been available for some years, embody-ing this principle. In the applications described here,the point of aim is continuously varied using beam-directing mirrors inside the instrument.
2.1. The CSLDV with sinusoidal excitation
If the point addressed is moved to and fro, si-nusoidally at frequency Ω, by virtue of a suitably-oscillating beam-directing mirror, along a straight lineover the surface of a vibrating structure, the CSLDVoutput is modulated because of the variation in vibra-tion amplitude along the scan line – the response mode-shape. We first assume the (linear) structure is respond-ing to sinusoidal forcing at frequency ω. As a con-sequence, the LDV’s output spectrum has sidebandsdefining the mode shape, as explained below.
It is convenient to assume the scan has a frequencyΩ and amplitude ±1, being zero at the scan mid-point,so that the point addressed is:
x(t) = cos(Ωt + β) (1)
Assume a spatial polynomial series for the mode-shapedefined along the line, so that the vibration νz at theinstantaneous scan point is:
νz(t) =p∑
n=0
Vnxn cos(ωt + αn) (2)
Vn cosαn and Vn sin αN being coefficients for powerseries respectively for in-phase (real) and quadrature(imaginary) components of the so-called Operating De-flection Shape (ODS) – the response mode shape – andthe series terminates at the xp term.
Substituting for x(t) from equation (1) gives:
νz(t) =p∑
n=0
Vn cos(ωt + αn)
(3)× cosn(Ωt + β)
When this is expanded out, multiple terms arise at fre-quencies (ω ± nΩ), upper and lower side-bands mag-nitudes for each n being identical, i.e. S−n = Sn andα−n = αn.
νz(t) =+p∑
n=−p
Sn cos[(ω + nΩ)t
(4)+αn + nβ]
The phase angles associated with each sideband pairare (αn +nβ) and (αN +Nβ), their average giving αn
directly. If the mode-shape is real, the αn values areidentical (or differ by 180); if, additionally, the phasereference is the response at a point on the structure,they are all zero (or 180).
After some manipulation, the S (sideband) coeffi-cients in equation (4) can be shown [8] to be related tothe polynomial coefficients in equation (2) by a simplematrix transform
V = [T ][S] (5)
Equation (5) can be applied to a vector S of (signed)side-band magnitudes to give a vector V of polyno-mial coefficients for a real mode. Otherwise it can beapplied separately to the in-phase and quadrature side-band components, to give complex mode polynomialcoefficients.
For up to 10 sideband pairs,
[T] =
1 0 −2 0 2 0 −2 0 2 0 −20 2 0 −6 0 10 0 −14 0 18 00 0 4 0 −16 0 36 0 −64 0 1000 0 0 8 0 −40 0 112 0 −240 00 0 0 0 16 0 −96 0 320 0 8000 0 0 0 0 32 0 −224 0 864 00 0 0 0 0 0 64 0 −512 0 22400 0 0 0 0 0 0 128 0 −1152 00 0 0 0 0 0 0 0 256 0 −25600 0 0 0 0 0 0 0 0 512 00 0 0 0 0 0 0 0 0 0 1024
(6)
2.2. The CSLDV with impact excitation
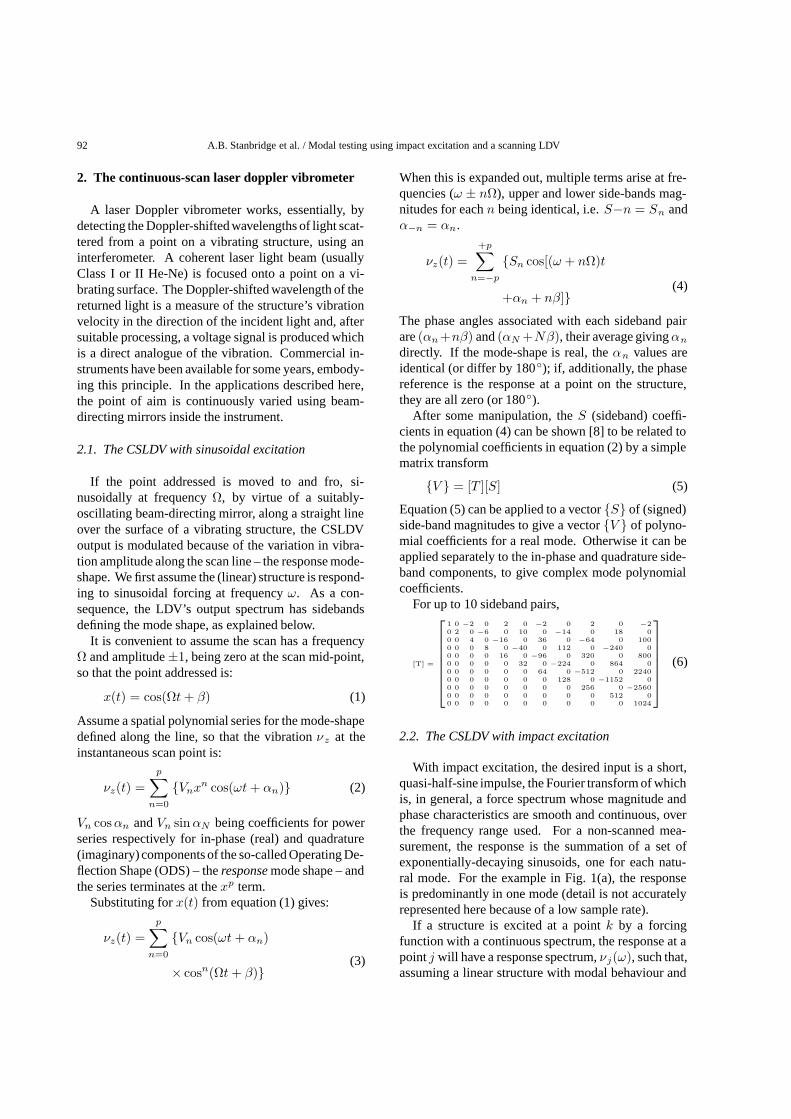
With impact excitation, the desired input is a short,quasi-half-sine impulse, the Fourier transform of whichis, in general, a force spectrum whose magnitude andphase characteristics are smooth and continuous, overthe frequency range used. For a non-scanned mea-surement, the response is the summation of a set ofexponentially-decaying sinusoids, one for each natu-ral mode. For the example in Fig. 1(a), the responseis predominantly in one mode (detail is not accuratelyrepresented here because of a low sample rate).
If a structure is excited at a point k by a forcingfunction with a continuous spectrum, the response at apoint j will have a response spectrum, νj(ω), such that,assuming a linear structure with modal behaviour and
A.B. Stanbridge et al. / Modal testing using impact excitation and a scanning LDV 93
Fig. 1. Vibration response of a structure (in one mode of vibration) to an impact, Measured (a) at a fixed point, (b) using a scanning laser Dopplervibrometer.
hysteretic damping.
νj(ω) = fk(ω)m∑
r=1
rAjkω
ω2r − ω2 + iηrω2
r
(7)
νj being the response component at frequency ω, fk
the forcing at this frequency, ωr and ηr the naturalfrequency and (hysteretic) damping for mode r, andrAjk a modal constant.
With a CSLDV, the response amplitude is fur-ther modulated by the deflection shape as the scanpasses to and fro over the surface, introducing multi-ple exponentially-decaying components which beat to-gether to give a modulated transient, as illustrated byFig. 1(b). As described above for sinusoidal excitation,each component input forcing frequency, ω, producesadditional responses at frequencies (ω + nΩ). Withan input having a continuous spectrum, and a continu-ous repetitive scan, therefore, the side-band responsesrepeat the curve given by one term of equation (7) atdifferent scales, and shifted by nΩ, as illustrated byFig. 2.
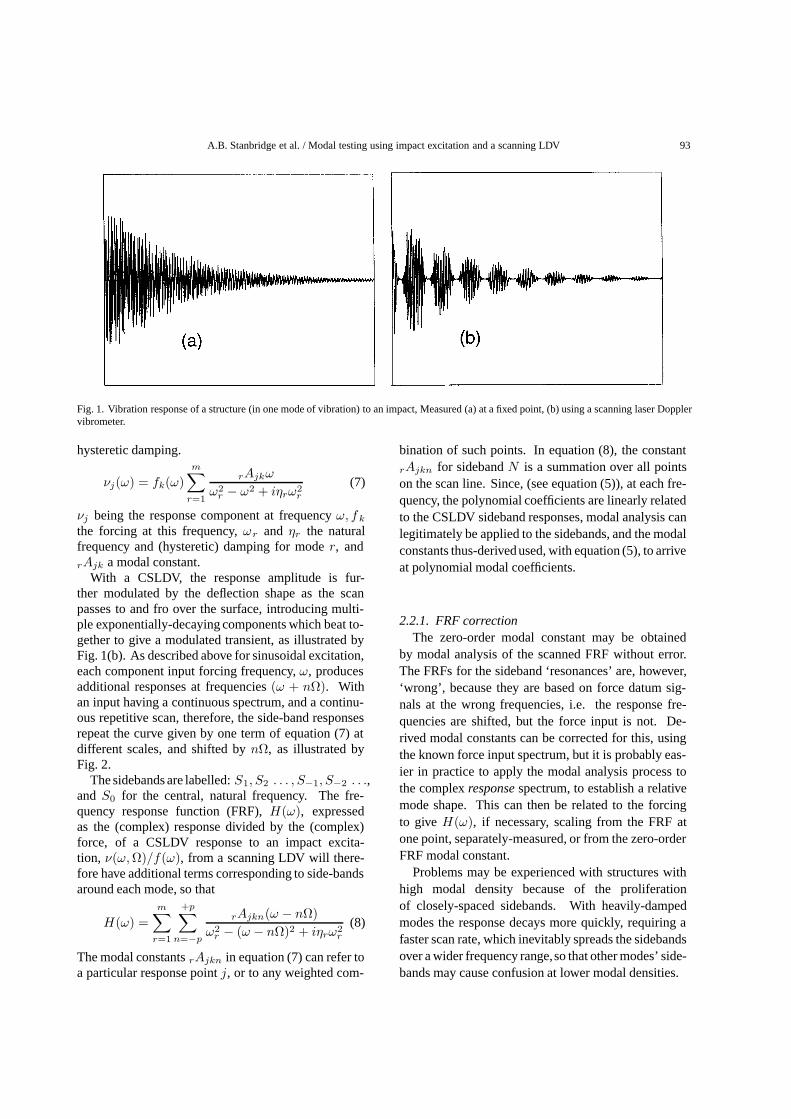
The sidebands are labelled: S1, S2 . . . , S−1, S−2 . . .,and S0 for the central, natural frequency. The fre-quency response function (FRF), H(ω), expressedas the (complex) response divided by the (complex)force, of a CSLDV response to an impact excita-tion, ν(ω, Ω)/f(ω), from a scanning LDV will there-fore have additional terms corresponding to side-bandsaround each mode, so that
H(ω) =m∑
r=1
+p∑n=−p
rAjkn(ω − nΩ)ω2
r − (ω − nΩ)2 + iηrω2r
(8)
The modal constants rAjkn in equation (7) can refer toa particular response point j, or to any weighted com-
bination of such points. In equation (8), the constant
rAjkn for sideband N is a summation over all pointson the scan line. Since, (see equation (5)), at each fre-quency, the polynomial coefficients are linearly relatedto the CSLDV sideband responses, modal analysis canlegitimately be applied to the sidebands, and the modalconstants thus-derived used, with equation (5), to arriveat polynomial modal coefficients.
2.2.1. FRF correctionThe zero-order modal constant may be obtained
by modal analysis of the scanned FRF without error.The FRFs for the sideband ‘resonances’ are, however,‘wrong’, because they are based on force datum sig-nals at the wrong frequencies, i.e. the response fre-quencies are shifted, but the force input is not. De-rived modal constants can be corrected for this, usingthe known force input spectrum, but it is probably eas-ier in practice to apply the modal analysis process tothe complex response spectrum, to establish a relativemode shape. This can then be related to the forcingto give H(ω), if necessary, scaling from the FRF atone point, separately-measured, or from the zero-orderFRF modal constant.
Problems may be experienced with structures withhigh modal density because of the proliferationof closely-spaced sidebands. With heavily-dampedmodes the response decays more quickly, requiring afaster scan rate, which inevitably spreads the sidebandsover a wider frequency range,so that other modes’ side-bands may cause confusion at lower modal densities.
94 A.B. Stanbridge et al. / Modal testing using impact excitation and a scanning LDV
Fig. 2. Apparent Frequency Response Function of a structure with impact excitation and a CSLDV for response measurement.
2.2.2. Modal analysis correctionResponse FRFs may be distorted if the force input is
not uniform over the small frequency range associatedwith a single, lightly-damped resonance peak. How-ever, if the force spectrum magnitude and phase varia-tions are nearly linear over this range, the result is, ingeneral, that the response FRF, plotted in the Nyquistplane, is rotated but not seriously distorted: a singlemode, for example, retaining its circular form. FRFsare usually processed by an analysis that, for a partic-ular mode, requires data only in this narrow frequencyrange. As a consequence, modal analysis of CSLDVhammer test data is usually achieved quite satisfacto-rily.
Sideband modal analysis is based on frequency seriesthat are shifted by nΩ where Ω is the scan frequency andn the sideband order (noting that n may be a positive ornegative integer). The resulting ‘natural’ frequencieswill therefore be shifted by the same amount. Takinga simple view of modal analysis, the modal damping isgiven by ∆ω/ωr where ∆ω is the frequency differencecorresponding to response levels 3dB below the max-imum. When applied to sidebands, the derived modaldamping will be in error by (ωr + nΩ)/ωr because ofthe frequency shift of ωr (see Fig. 2). In a similarlysimplistic way, the modal constant is merely the diam-eter of the resonance ‘circle’ in the Nyquist plane, mul-tiplied by the modal damping. Hence, again, the modalconstants derived from sidebands have to be multipliedby
(ωr + nΩ)/ωr (9)
For the example given in Table 1, this correction is quiteinsignificant compared with experimental uncertainty.
2.2.3. Setting scan ratesThe above analysis assumes implicitly that the tran-
sient response is noise-free and linear, with lineardamping, so that the modal contributions diminish ex-ponentially. If the response measurement had infiniteresolution, it could be measured accurately no matterhow much it was attenuated – but this can never be truein practice. The CSLDV, in particular, is subject to‘speckle’ noise which gives irregular short-term noisespikes, which equate, in the frequency domain, to arandom noise floor typically at 1% of full scale. It isnecessary that the vibration response transient persists,above the noise, at a measurable level, for at least onecomplete scan cycle before it is excessively affectedby noise. The scan rate which can be used thereforedepends on the amount of damping in the mode be-ing studied. Several scan cycles can be counted in theexample in Fig. 1(b).
In impact testing there another criterion which has tobe applied: namely that the response transient must de-cay to an insignificant level before the end of the (time)sample acquired for FFT analysis. Two stratagems arecommonly employed to achieve this: either an expo-nential window is applied to the response data so as toincrease its attenuation rate (and artificially increase theapparent damping in the system), or a zoom FFT trans-form is used, reducing the analysed frequency rangebut increasing the sample time length.
A.B. Stanbridge et al. / Modal testing using impact excitation and a scanning LDV 95
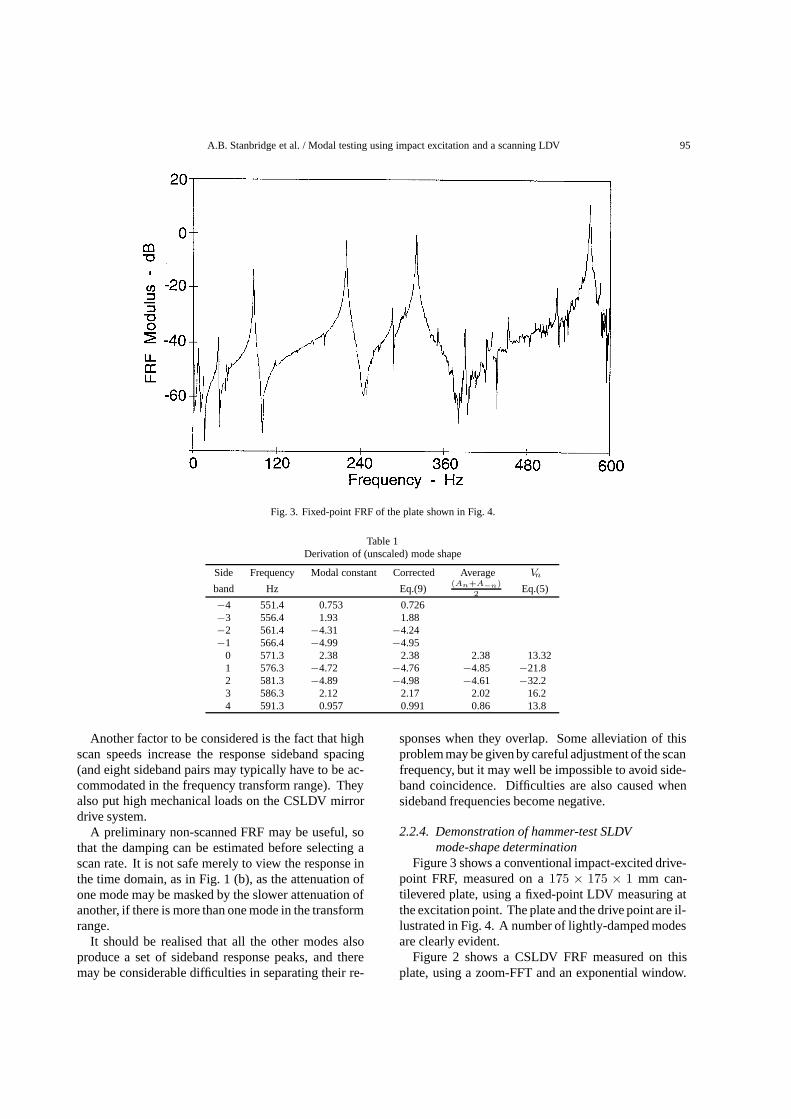
Fig. 3. Fixed-point FRF of the plate shown in Fig. 4.
Table 1Derivation of (unscaled) mode shape
Side Frequency Modal constant Corrected Average Vn
band Hz Eq.(9)(An+A−n)
2Eq.(5)
−4 551.4 0.753 0.726−3 556.4 1.93 1.88−2 561.4 −4.31 −4.24−1 566.4 −4.99 −4.95
0 571.3 2.38 2.38 2.38 13.321 576.3 −4.72 −4.76 −4.85 −21.82 581.3 −4.89 −4.98 −4.61 −32.23 586.3 2.12 2.17 2.02 16.24 591.3 0.957 0.991 0.86 13.8
Another factor to be considered is the fact that highscan speeds increase the response sideband spacing(and eight sideband pairs may typically have to be ac-commodated in the frequency transform range). Theyalso put high mechanical loads on the CSLDV mirrordrive system.
A preliminary non-scanned FRF may be useful, sothat the damping can be estimated before selecting ascan rate. It is not safe merely to view the response inthe time domain, as in Fig. 1 (b), as the attenuation ofone mode may be masked by the slower attenuation ofanother, if there is more than one mode in the transformrange.
It should be realised that all the other modes alsoproduce a set of sideband response peaks, and theremay be considerable difficulties in separating their re-
sponses when they overlap. Some alleviation of thisproblem may be given by careful adjustment of the scanfrequency, but it may well be impossible to avoid side-band coincidence. Difficulties are also caused whensideband frequencies become negative.
2.2.4. Demonstration of hammer-test SLDVmode-shape determination
Figure 3 shows a conventional impact-excited drive-point FRF, measured on a 175 × 175 × 1 mm can-tilevered plate, using a fixed-point LDV measuring atthe excitation point. The plate and the drive point are il-lustrated in Fig. 4. A number of lightly-damped modesare clearly evident.
Figure 2 shows a CSLDV FRF measured on thisplate, using a zoom-FFT and an exponential window.
96 A.B. Stanbridge et al. / Modal testing using impact excitation and a scanning LDV
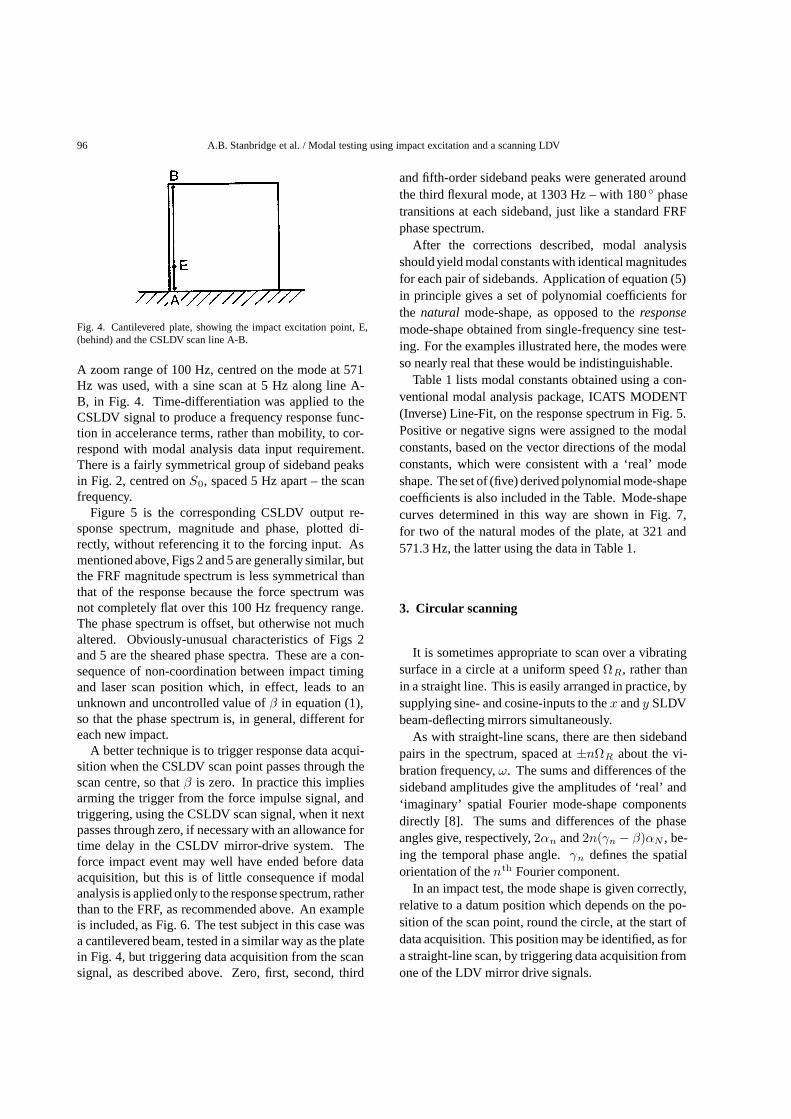
Fig. 4. Cantilevered plate, showing the impact excitation point, E,(behind) and the CSLDV scan line A-B.
A zoom range of 100 Hz, centred on the mode at 571Hz was used, with a sine scan at 5 Hz along line A-B, in Fig. 4. Time-differentiation was applied to theCSLDV signal to produce a frequency response func-tion in accelerance terms, rather than mobility, to cor-respond with modal analysis data input requirement.There is a fairly symmetrical group of sideband peaksin Fig. 2, centred on S0, spaced 5 Hz apart – the scanfrequency.
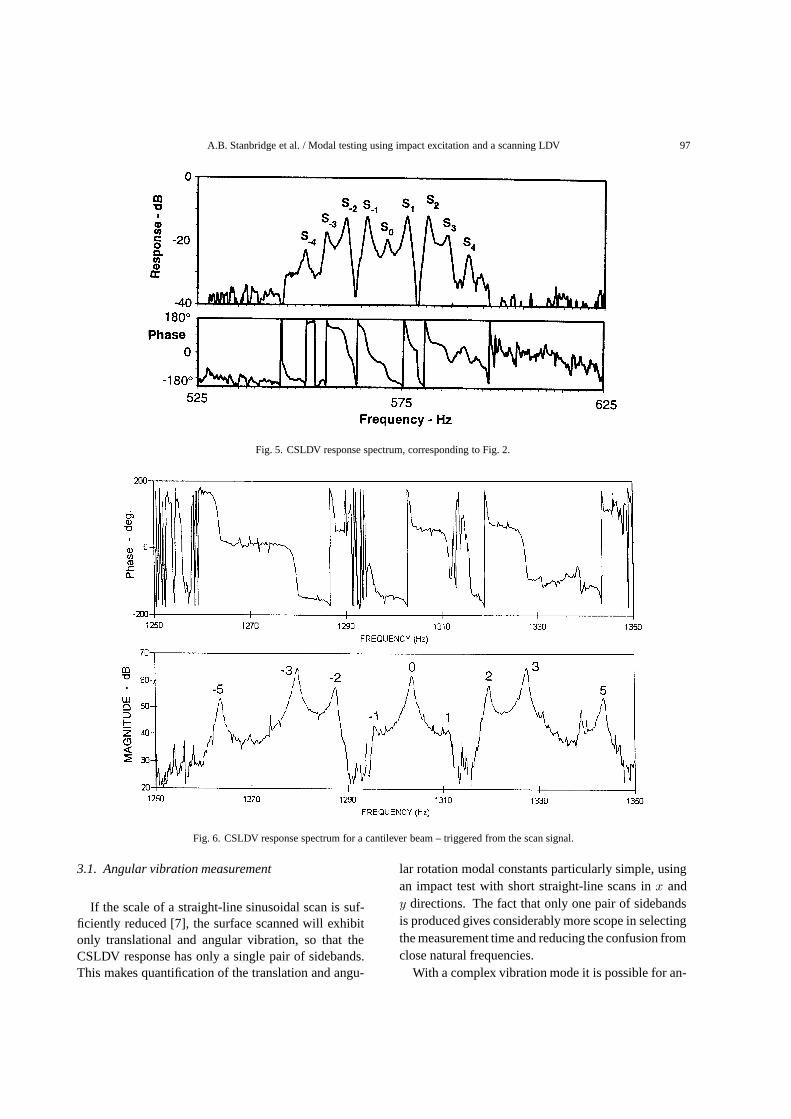
Figure 5 is the corresponding CSLDV output re-sponse spectrum, magnitude and phase, plotted di-rectly, without referencing it to the forcing input. Asmentioned above, Figs 2 and 5 are generally similar, butthe FRF magnitude spectrum is less symmetrical thanthat of the response because the force spectrum wasnot completely flat over this 100 Hz frequency range.The phase spectrum is offset, but otherwise not muchaltered. Obviously-unusual characteristics of Figs 2and 5 are the sheared phase spectra. These are a con-sequence of non-coordination between impact timingand laser scan position which, in effect, leads to anunknown and uncontrolled value of β in equation (1),so that the phase spectrum is, in general, different foreach new impact.
A better technique is to trigger response data acqui-sition when the CSLDV scan point passes through thescan centre, so that β is zero. In practice this impliesarming the trigger from the force impulse signal, andtriggering, using the CSLDV scan signal, when it nextpasses through zero, if necessary with an allowance fortime delay in the CSLDV mirror-drive system. Theforce impact event may well have ended before dataacquisition, but this is of little consequence if modalanalysis is applied only to the response spectrum, ratherthan to the FRF, as recommended above. An exampleis included, as Fig. 6. The test subject in this case wasa cantilevered beam, tested in a similar way as the platein Fig. 4, but triggering data acquisition from the scansignal, as described above. Zero, first, second, third
and fifth-order sideband peaks were generated aroundthe third flexural mode, at 1303 Hz – with 180 phasetransitions at each sideband, just like a standard FRFphase spectrum.
After the corrections described, modal analysisshould yield modal constants with identical magnitudesfor each pair of sidebands. Application of equation (5)in principle gives a set of polynomial coefficients forthe natural mode-shape, as opposed to the responsemode-shape obtained from single-frequency sine test-ing. For the examples illustrated here, the modes wereso nearly real that these would be indistinguishable.
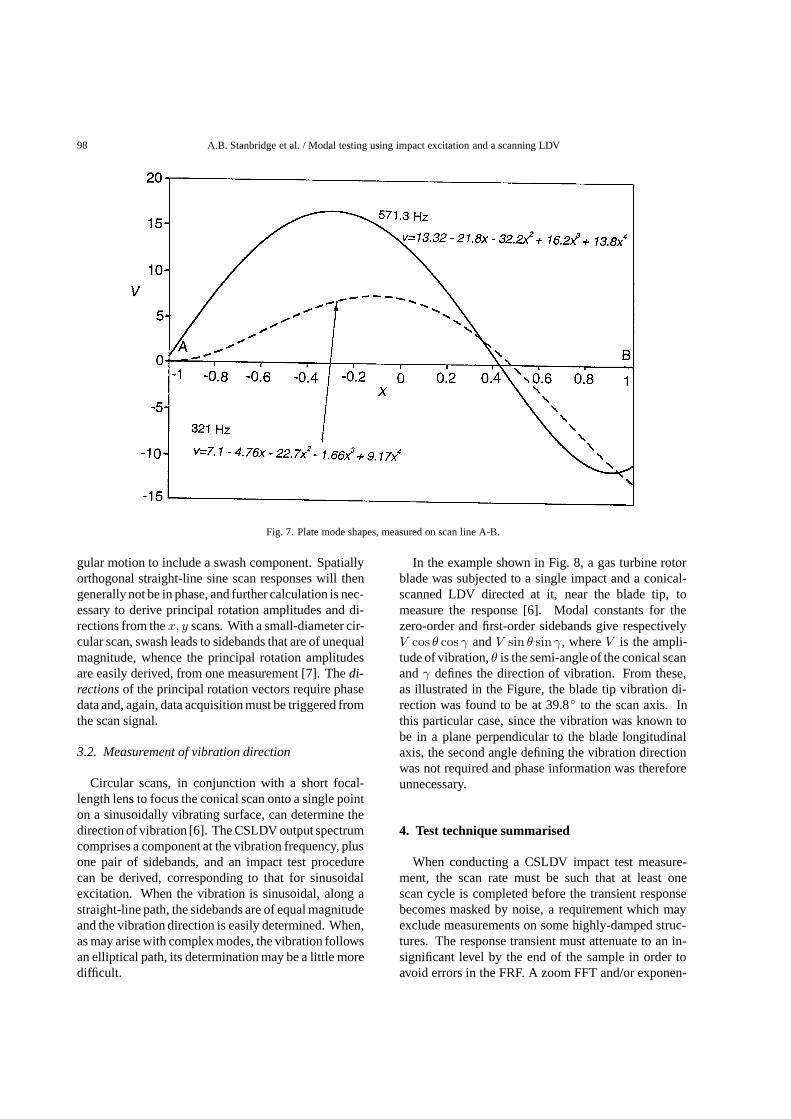
Table 1 lists modal constants obtained using a con-ventional modal analysis package, ICATS MODENT(Inverse) Line-Fit, on the response spectrum in Fig. 5.Positive or negative signs were assigned to the modalconstants, based on the vector directions of the modalconstants, which were consistent with a ‘real’ modeshape. The set of (five) derived polynomial mode-shapecoefficients is also included in the Table. Mode-shapecurves determined in this way are shown in Fig. 7,for two of the natural modes of the plate, at 321 and571.3 Hz, the latter using the data in Table 1.
3. Circular scanning
It is sometimes appropriate to scan over a vibratingsurface in a circle at a uniform speed ΩR, rather thanin a straight line. This is easily arranged in practice, bysupplying sine- and cosine-inputs to the x and y SLDVbeam-deflecting mirrors simultaneously.
As with straight-line scans, there are then sidebandpairs in the spectrum, spaced at ±nΩR about the vi-bration frequency, ω. The sums and differences of thesideband amplitudes give the amplitudes of ‘real’ and‘imaginary’ spatial Fourier mode-shape componentsdirectly [8]. The sums and differences of the phaseangles give, respectively, 2αn and 2n(γn − β)αN , be-ing the temporal phase angle. γn defines the spatialorientation of the nth Fourier component.
In an impact test, the mode shape is given correctly,relative to a datum position which depends on the po-sition of the scan point, round the circle, at the start ofdata acquisition. This position may be identified, as fora straight-line scan, by triggering data acquisition fromone of the LDV mirror drive signals.
A.B. Stanbridge et al. / Modal testing using impact excitation and a scanning LDV 97
Fig. 5. CSLDV response spectrum, corresponding to Fig. 2.
Fig. 6. CSLDV response spectrum for a cantilever beam – triggered from the scan signal.
3.1. Angular vibration measurement
If the scale of a straight-line sinusoidal scan is suf-ficiently reduced [7], the surface scanned will exhibitonly translational and angular vibration, so that theCSLDV response has only a single pair of sidebands.This makes quantification of the translation and angu-
lar rotation modal constants particularly simple, usingan impact test with short straight-line scans in x andy directions. The fact that only one pair of sidebandsis produced gives considerably more scope in selectingthe measurement time and reducing the confusion fromclose natural frequencies.
With a complex vibration mode it is possible for an-
98 A.B. Stanbridge et al. / Modal testing using impact excitation and a scanning LDV
Fig. 7. Plate mode shapes, measured on scan line A-B.
gular motion to include a swash component. Spatiallyorthogonal straight-line sine scan responses will thengenerally not be in phase, and further calculation is nec-essary to derive principal rotation amplitudes and di-rections from the x, y scans. With a small-diameter cir-cular scan, swash leads to sidebands that are of unequalmagnitude, whence the principal rotation amplitudesare easily derived, from one measurement [7]. The di-rections of the principal rotation vectors require phasedata and, again, data acquisition must be triggered fromthe scan signal.
3.2. Measurement of vibration direction
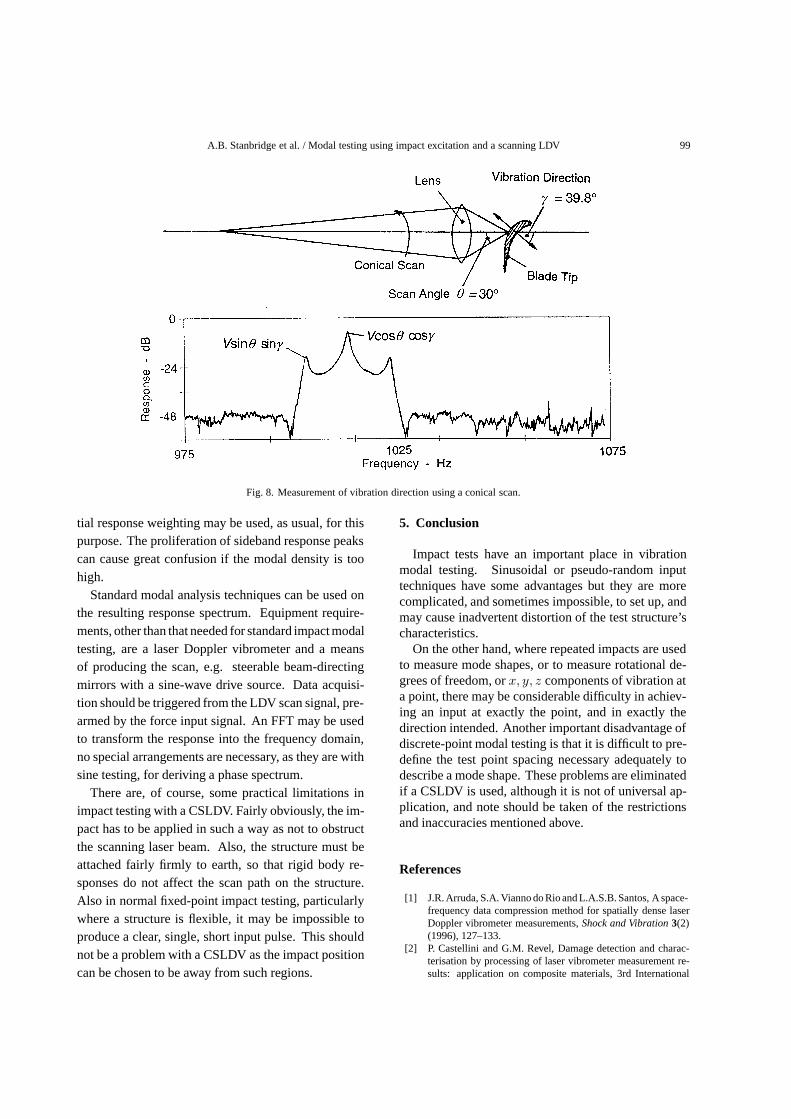
Circular scans, in conjunction with a short focal-length lens to focus the conical scan onto a single pointon a sinusoidally vibrating surface, can determine thedirection of vibration [6]. The CSLDV output spectrumcomprises a component at the vibration frequency, plusone pair of sidebands, and an impact test procedurecan be derived, corresponding to that for sinusoidalexcitation. When the vibration is sinusoidal, along astraight-line path, the sidebands are of equal magnitudeand the vibration direction is easily determined. When,as may arise with complex modes, the vibration followsan elliptical path, its determination may be a little moredifficult.
In the example shown in Fig. 8, a gas turbine rotorblade was subjected to a single impact and a conical-scanned LDV directed at it, near the blade tip, tomeasure the response [6]. Modal constants for thezero-order and first-order sidebands give respectivelyV cos θ cos γ and V sin θ sin γ, where V is the ampli-tude of vibration, θ is the semi-angle of the conical scanand γ defines the direction of vibration. From these,as illustrated in the Figure, the blade tip vibration di-rection was found to be at 39.8 to the scan axis. Inthis particular case, since the vibration was known tobe in a plane perpendicular to the blade longitudinalaxis, the second angle defining the vibration directionwas not required and phase information was thereforeunnecessary.
4. Test technique summarised
When conducting a CSLDV impact test measure-ment, the scan rate must be such that at least onescan cycle is completed before the transient responsebecomes masked by noise, a requirement which mayexclude measurements on some highly-damped struc-tures. The response transient must attenuate to an in-significant level by the end of the sample in order toavoid errors in the FRF. A zoom FFT and/or exponen-
A.B. Stanbridge et al. / Modal testing using impact excitation and a scanning LDV 99
Fig. 8. Measurement of vibration direction using a conical scan.
tial response weighting may be used, as usual, for thispurpose. The proliferation of sideband response peakscan cause great confusion if the modal density is toohigh.
Standard modal analysis techniques can be used onthe resulting response spectrum. Equipment require-ments, other than that needed for standard impact modaltesting, are a laser Doppler vibrometer and a meansof producing the scan, e.g. steerable beam-directingmirrors with a sine-wave drive source. Data acquisi-tion should be triggered from the LDV scan signal, pre-armed by the force input signal. An FFT may be usedto transform the response into the frequency domain,no special arrangements are necessary, as they are withsine testing, for deriving a phase spectrum.
There are, of course, some practical limitations inimpact testing with a CSLDV. Fairly obviously, the im-pact has to be applied in such a way as not to obstructthe scanning laser beam. Also, the structure must beattached fairly firmly to earth, so that rigid body re-sponses do not affect the scan path on the structure.Also in normal fixed-point impact testing, particularlywhere a structure is flexible, it may be impossible toproduce a clear, single, short input pulse. This shouldnot be a problem with a CSLDV as the impact positioncan be chosen to be away from such regions.
5. Conclusion
Impact tests have an important place in vibrationmodal testing. Sinusoidal or pseudo-random inputtechniques have some advantages but they are morecomplicated, and sometimes impossible, to set up, andmay cause inadvertent distortion of the test structure’scharacteristics.
On the other hand, where repeated impacts are usedto measure mode shapes, or to measure rotational de-grees of freedom, or x, y, z components of vibration ata point, there may be considerable difficulty in achiev-ing an input at exactly the point, and in exactly thedirection intended. Another important disadvantage ofdiscrete-point modal testing is that it is difficult to pre-define the test point spacing necessary adequately todescribe a mode shape. These problems are eliminatedif a CSLDV is used, although it is not of universal ap-plication, and note should be taken of the restrictionsand inaccuracies mentioned above.
References
[1] J.R. Arruda, S.A. Vianno do Rio and L.A.S.B. Santos, A space-frequency data compression method for spatially dense laserDoppler vibrometer measurements, Shock and Vibration 3(2)(1996), 127–133.
[2] P. Castellini and G.M. Revel, Damage detection and charac-terisation by processing of laser vibrometer measurement re-sults: application on composite materials, 3rd International

100 A.B. Stanbridge et al. / Modal testing using impact excitation and a scanning LDV
Conference on Vibration Measurement by Laser Techniques,Proc. SPIE, 3411, Ancona, 1998, pp. 528–536.
[3] W.X. Li, L.D. Mitchell, M-F. Lu and M.L. Neumann, Mappingnon-square and unevenly spaced 2-D SLDV data of an aircraftfuselage by using spatial DFT-IDFT techniques, Shock andVibration 3(2) (1996), 135–140.
[4] G. Pardoen and D.Y. Zang, Detection of earthquake damage inconcrete structures using a laser vibrometer, 3rd InternationalConference on Vibration Measurement by Laser Techniques,Proc. SPIE, 3411, Ancona, 1998, pp. 528–536.
[5] P. Sriram, S. Hanagud, J. Craig and N.M. Komerath, Modeshape measurement using a scanning laser Doppler vibrome-ter, Journal of Analytical and Experimental Modal Analysis 7(1992), 169–178.
[6] A.B. Stanbridge and D.J. Ewins, Measurement of total vibra-
tion at a point using a conical-scanning LDV, 2nd InternationalConference on Vibration Measurement by Laser Techniques,Proc. SPIE, 2868, Ancona, 1996, pp. 126–136.
[7] A.B. Stanbridge and D.J. Ewins, Measurement of translationaland angular vibration using a scanning laser Doppler vibrom-eter, Shock and Vibration 3(2) (1996), 141–152.
[8] A.B. Stanbridge and D.J. Ewins, Using a Continuously-Scanning Laser Doppler Vibrometer for Modal Testing, Proc.IMAC 14, Dearborn, 1996, pp. 816–822.
[9] J. Vignola, B.H. Houston and D.Y. Zang, A three-dimensionalvelocity measurement of a periodically ribbed panel surfaceby optical vibrometry, 3rd International Conference on Vi-bration Measurement by Laser Techniques, Proc. SPIE, 3411,Ancona, 1998, pp. 458–468.

International Journal of
AerospaceEngineeringHindawi Publishing Corporationhttp://www.hindawi.com Volume 2010
RoboticsJournal of
Hindawi Publishing Corporationhttp://www.hindawi.com Volume 2014
Hindawi Publishing Corporationhttp://www.hindawi.com Volume 2014
Active and Passive Electronic Components
Control Scienceand Engineering
Journal of
Hindawi Publishing Corporationhttp://www.hindawi.com Volume 2014
International Journal of
RotatingMachinery
Hindawi Publishing Corporationhttp://www.hindawi.com Volume 2014
Hindawi Publishing Corporation http://www.hindawi.com
Journal ofEngineeringVolume 2014
Submit your manuscripts athttp://www.hindawi.com
VLSI Design
Hindawi Publishing Corporationhttp://www.hindawi.com Volume 2014
Hindawi Publishing Corporationhttp://www.hindawi.com Volume 2014
Shock and Vibration
Hindawi Publishing Corporationhttp://www.hindawi.com Volume 2014
Civil EngineeringAdvances in
Acoustics and VibrationAdvances in
Hindawi Publishing Corporationhttp://www.hindawi.com Volume 2014
Hindawi Publishing Corporationhttp://www.hindawi.com Volume 2014
Electrical and Computer Engineering
Journal of
Advances inOptoElectronics
Hindawi Publishing Corporation http://www.hindawi.com
Volume 2014
The Scientific World JournalHindawi Publishing Corporation http://www.hindawi.com Volume 2014
SensorsJournal of
Hindawi Publishing Corporationhttp://www.hindawi.com Volume 2014
Modelling & Simulation in EngineeringHindawi Publishing Corporation http://www.hindawi.com Volume 2014
Hindawi Publishing Corporationhttp://www.hindawi.com Volume 2014
Chemical EngineeringInternational Journal of Antennas and
Propagation
International Journal of
Hindawi Publishing Corporationhttp://www.hindawi.com Volume 2014
Hindawi Publishing Corporationhttp://www.hindawi.com Volume 2014
Navigation and Observation
International Journal of
Hindawi Publishing Corporationhttp://www.hindawi.com Volume 2014
DistributedSensor Networks
International Journal of