Efficient Bulk Transport and Mobility Control in Wireless Sensor Networks

Mobility in Wireless Sensor Networks
Ankur Mukesh Mehta
Electrical Engineering and Computer SciencesUniversity of California at Berkeley
Technical Report No. UCB/EECS-2012-270
http://www.eecs.berkeley.edu/Pubs/TechRpts/2012/EECS-2012-270.html
December 20, 2012

Copyright © 2012, by the author(s).All rights reserved.
Permission to make digital or hard copies of all or part of this work forpersonal or classroom use is granted without fee provided that copies arenot made or distributed for profit or commercial advantage and that copiesbear this notice and the full citation on the first page. To copy otherwise, torepublish, to post on servers or to redistribute to lists, requires prior specificpermission.
Acknowledgement
All yall.

Mobility in Wireless Sensor Networks
by
Ankur Mukesh Mehta
A dissertation submitted in partial satisfaction of the
requirements for the degree of
Doctor of Philosophy
in
Electrical Engineering and Computer Sciences
in the
Graduate Division
of the
University of California, Berkeley
Committee in charge:
Professor Kristofer S. J. Pister, ChairProfessor Michel MaharbizProfessor Alexandre Bayen
Fall 2012

Mobility in Wireless Sensor Networks
Copyright 2012by
Ankur Mukesh Mehta

1
Abstract
Mobility in Wireless Sensor Networks
by
Ankur Mukesh Mehta
Doctor of Philosophy in Electrical Engineering and Computer Sciences
University of California, Berkeley
Professor Kristofer S. J. Pister, Chair
The combination of mobility with wireless networks greatly expands the application spaceof both robots and distributed sensor networks; such a pervasive system can enable seamlessintegration between the digital and physical worlds. However, there are a number of issuesin both robotic and wireless sensor network (WSN) fields that demand research, and theirintegration generates further challenges.
A fundamental open problem in robotic systems is the issue of self-contained localization.Especially difficult when considering small scale flying robots, the ability to determine one’sposition using only on-board sensing is necessary for autonomous robots. GINA, a smallwireless inertial measurement unit weighing only 1.6 g was designed to calculate the 6 degreeof freedom position of a rigid body. Together with necessary software and hardware, theresulting WARPWING platform served as a highly capable and versatile flight controllerfor micro air vehicles (MAVs). As an open source hardware project, WARPWING furtherenabled other unrelated research projects by abstracting away the electronic system design.
As designed, the WARPWING platform was used to control small flying robots. Rocketsystems can be used to deliver microelectronic sensor nodes into low earth orbit (LEO) astiny satellites; analysis of the mechanical parameters demonstrates the feasibility of usinga small scale multistage solid fuel guided chemical rocket to deliver a small payload intoan orbital trajectory given a suitable controller. Helicopters, similar to rockets, employattitude control to effect stability and guidance, and so share similar control requirements.Off the shelf toy helicopters can be used as a mechanical airframe; replacing the controlelectronics with the GINA board enables the design of autonomous MAVs. Purely inertialoperation of the GINA board provided stability control, but accumulated drift inhibitedguidance control. To calculate position, the state estimator was augmented with additionalvision-based sensors such as the VICON motion capture system or an on-board smart cameraaimed at an infrared beacon.
The GINA board, containing a wireless enabled processor, was also a platform for WSNresearch. The key design parameter in WSN systems is power consumption; minimizingenergy requirements extends node and system lifetime or lowers required battery mass. A

2
time synchronized, channel hopping (TSCH) medium access control (MAC) protocol, stan-dardized as the IEEE 802.15.4e specification, combines time division multiple access withfrequency diversity to ensure reliable, robust low power communication across environmentalconditions. This TSCH protocol can be augmented with a variable data rate coding schemeat the physical (PHY) layer to further improve power saving and scalability. The envi-ronmental conditions that enable higher data rates also allow wireless communication withimprecise frequency references. A modified PHY layer with frequency offset compensationcan be used to implement crystal-free radios with on-board LC oscillators.
Enabling multi-hop networking to mobile MAVs required combining the previous tworesearch thrusts. A helicopter augmented with a payload bay could deploy GINA nodesas wireless repeaters along a flight path, and communicate along them to a base stationacting as its controller. The base station can be further connected to the internet; a mobilephone application was used to interface to a remote helicopter over a hybrid multi-hop path,passing downstream control commands and receiving upstream video images. To maintainthe performance and reliability benefits of TSCH mesh networks in the presence of such MAVelements, the protocols designed for stationary networks were redesigned with extensionsoptimized for mobile nodes.
This work on an integrated system as well as the separate subsystems paves the path to-wards networked robots. Future work can focus on system-level solutions to fully implementthe vision of smart pervasive mobile swarms.

i
For you
Me
And everyone else

ii
Contents
Contents ii
List of Figures iv
List of Tables ix
1 Introduction 1
1.1 Wireless sensor networks . . . . . . . . . . . . . . . . . . . . . . . . . . . . . 11.2 Mobility . . . . . . . . . . . . . . . . . . . . . . . . . . . . . . . . . . . . . . 21.3 Potential applications . . . . . . . . . . . . . . . . . . . . . . . . . . . . . . . 21.4 Organization . . . . . . . . . . . . . . . . . . . . . . . . . . . . . . . . . . . 3
2 WARPWING and the GINA Mote 4
2.1 GINA history . . . . . . . . . . . . . . . . . . . . . . . . . . . . . . . . . . . 52.2 WARPWING architecture . . . . . . . . . . . . . . . . . . . . . . . . . . . . 72.3 Modification and Sharing . . . . . . . . . . . . . . . . . . . . . . . . . . . . . 152.4 Summary . . . . . . . . . . . . . . . . . . . . . . . . . . . . . . . . . . . . . 20
3 Micro Air Vehicles 21
3.1 Small scale rocketry . . . . . . . . . . . . . . . . . . . . . . . . . . . . . . . . 213.2 Autonomous helicopters . . . . . . . . . . . . . . . . . . . . . . . . . . . . . 303.3 Summary . . . . . . . . . . . . . . . . . . . . . . . . . . . . . . . . . . . . . 40
4 Wireless Protocol Modifications 41
4.1 Background . . . . . . . . . . . . . . . . . . . . . . . . . . . . . . . . . . . . 414.2 Variable data rate adaptation and control . . . . . . . . . . . . . . . . . . . 424.3 Crystal-free communication . . . . . . . . . . . . . . . . . . . . . . . . . . . 524.4 Summary . . . . . . . . . . . . . . . . . . . . . . . . . . . . . . . . . . . . . 57
5 Mobile Networking 58
5.1 MAV-deployed networks . . . . . . . . . . . . . . . . . . . . . . . . . . . . . 595.2 Implementation limitations and design considerations . . . . . . . . . . . . . 615.3 Mobile nodes in a TSCH mesh . . . . . . . . . . . . . . . . . . . . . . . . . . 62

iii
5.4 System analysis . . . . . . . . . . . . . . . . . . . . . . . . . . . . . . . . . . 655.5 Summary . . . . . . . . . . . . . . . . . . . . . . . . . . . . . . . . . . . . . 69
6 Conclusions and Future Work 70
A GINA 3 72
A.1 Bill of materials . . . . . . . . . . . . . . . . . . . . . . . . . . . . . . . . . . 73A.2 Fabrication . . . . . . . . . . . . . . . . . . . . . . . . . . . . . . . . . . . . 74A.3 Assembly . . . . . . . . . . . . . . . . . . . . . . . . . . . . . . . . . . . . . 74
Bibliography 75

iv
List of Figures
1.1 A possible home of the future contains a distributed wireless network with per-vasive sensing, immersive actuation, and integrated mobile elements. . . . . . . 3
2.1 GINA provides inertial sensing, processing, control, and wireless communicationon a board smaller and lighter than a US quarter. . . . . . . . . . . . . . . . . . 5
2.2 GINA 0 on the left and GINA 1 on the right were created to guide small scalerockets and designed to be the smallest and lightest inertial flight controllers. . . 6
2.3 GINA 2.0, the first design in the current GINA 2.x series, has undergone severalrevisions to yield the current version GINA 2.2c shown in figure 2.1 . . . . . . . 6
2.4 The variation of the gyro zero-bias for a single board across 150 runs over 5 daysis shown in the graph on the left for each of the three axes. The graph on theright shows the zero-rate gyro outputs over 2000 measurements during a singlerun. The bias offsets are clearly visible in the right graph, as well as a notabledifference in performance between the two devices. . . . . . . . . . . . . . . . . 8
2.5 A break-out daughter board, with additional expansion headers and a USB inter-face, allows the GINA mote to be connected to a standard breadboard or scopeprobes for quick prototyping. . . . . . . . . . . . . . . . . . . . . . . . . . . . . 9
2.6 A daughter board for the GINA mote brings PWMs out to connectors for servos,uses other PWMs for brushed motor controllers, and includes additional sensorssuch as a battery fuel gauge, GPS receiver, and vision processors. . . . . . . . . 10
2.7 GINA 4.0 is the newest development in the hardware series, employing the latestintegrated hardware solutions to significantly miniaturize the system. . . . . . . 11
2.8 The Microstrain 3DM-GX2, a commonly used commercial IMU, can be used tocalibrate and validate the performance of the GINA board . . . . . . . . . . . . 12
2.9 A comparison of the GINA and 3DM-GX2 angular rate measurement. . . . . . . 132.10 A comparison of the GINA and 3DM-GX2 acceleration measurement. . . . . . . 132.11 Roll angle estimate comparison. GINA and 3DM-GX2 agree closely in their state
estimates. . . . . . . . . . . . . . . . . . . . . . . . . . . . . . . . . . . . . . . . 142.12 Pitch angle estimate comparison. The noisier GINA estimate also allows a much
shorter settling time than the 3DM-GX2. . . . . . . . . . . . . . . . . . . . . . . 142.13 Inertial data collected from GINA motes mounted on mammals is used to calcu-
late sedentary breathing rates. Data courtesy Subramaniam Venkatraman [50]. . 15

v
2.14 Inertial data collected from a GINA mote mounted on a coiled spring, demonstrat-ing both oscillatory rotation and translation. Data courtesy Thomas Watteyne[54]. . . . . . . . . . . . . . . . . . . . . . . . . . . . . . . . . . . . . . . . . . . 16
2.15 The hopping rotochute developed at GATech uses WARPWING as its flight con-troller. The software interface was rewritten to fit in to the existing MATLABframework, while the rest of the WARPWING system remained unchanged. Thisallowed for quick development of the mini rotochute, shown at right. . . . . . . 16
2.16 The RinGINA device contains a GINA mote on a custom manufactured ring.The WARPWING platform was used to quickly develop an unobtrusive wirelessbody-mounted sensor. . . . . . . . . . . . . . . . . . . . . . . . . . . . . . . . . 17
2.17 The WARPWING code can gather inertial data from the RinGINA, measuring6DOF state and dynamic motion. Custom software can be written to translatethe data into virtual keypresses, potentially replacing a physical keyboard with abody-mounted IMU. . . . . . . . . . . . . . . . . . . . . . . . . . . . . . . . . . 17
2.18 The mini quadrotor developed by Daedalus Flight Systems and UMD uses theGINA hardware, but modifies the firmware to include an on-board attitude sta-bility loop to control its four brushless DC motors. . . . . . . . . . . . . . . . . 18
2.19 DASH, a small, lightweight crawling robot developed at UC Berkeley, uses theWARPWING system to measure inertial rates and motor back EMF for dynamicanalysis and control. . . . . . . . . . . . . . . . . . . . . . . . . . . . . . . . . . 18
2.20 This small lightweight footstep detector is designed from the schematic level onup using the WARPWING system as a base, but replacing the accelerometer withone far more sensitive. . . . . . . . . . . . . . . . . . . . . . . . . . . . . . . . . 18
3.1 In the absence of aerodynamic forces, a bare solid rocket engine spins out ofcontrol. A stabilizing controller is therefore necessary on a minirocket LV. . . . 26
3.2 A feedback control system can be used to stabilize flight and follow a trajectory.The 6DOF state is sensed by a 6 axis IMU and input to a microprocessor. Thecurrent heading and trajectory error is calculated, and a control signal is outputto an actuator. The actuator positions a mass or aims the nozzle to induce theappropriate torque on the rocket. . . . . . . . . . . . . . . . . . . . . . . . . . . 27
3.3 The original rocket containing GINA sensors and a video camera . . . . . . . . . 283.4 Gyroscope data from a flight shows many characteristics of rocket operation. This
data can be integrated to yield an attitude state estimate for flight control. . . . 283.5 Inertial sensor data postprocessed from a rocket launch show the state estimate
evolving along with the actual body motion, captured by an on-board camera. . 293.6 GINA sensor data transmitted wirelessly to a laptop base station is integrated
in real time to give a 6DOF state estimate. The estimated attitude is projectedalongside the physical system demonstrating excellent agreement a posteriori. . 29
3.7 An updated rocket designed and built by Florian Kehl contained a GINA motefor full 6 axis inertial sensing, along with 3 axis attitude control with 4 channelflywheel and gimbaled nozzle actuation. . . . . . . . . . . . . . . . . . . . . . . 30

vi
3.8 The Walkera helicopters selected as the platforms for this project are small, cheap,and commercially available 4 channel electric helicopters. . . . . . . . . . . . . . 31
3.9 The off-the-shelf Walkera airframes are controlled by a GINA board runningWARPWING code to investigate autonomous operation. . . . . . . . . . . . . . 31
3.10 An extended Kalman filter can be used to estimate the state of a general noisynonlinear system. . . . . . . . . . . . . . . . . . . . . . . . . . . . . . . . . . . . 32
3.11 The yaw rate sensor output of GINA mounted on a helicopter driven to hover,before and after application of a low pass filter. The large scale yaw motion isrecoverable from the filtered output, so can be used to stabilize helicopter heading. 34
3.12 The linear acceleration measurement with application of a weak and strong lowpass filter. With a weak LPF, the overall body motion is still swamped by therotor signal, while a strong LPF introduces so much lag as to be useless for control. 34
3.13 The roll angle output of the Kalman filter shows considerably lower impact ofrotor motion, and can be filtered to provide a smooth signal. . . . . . . . . . . . 35
3.14 A trace of the roll angle during a controlled flight displays a time-varying attitudesetpoint over the course of a hover. Comparison to the controller input reveals adependence on additional states. . . . . . . . . . . . . . . . . . . . . . . . . . . 36
3.15 The Walkera 5G6 coaxial helicopter is shown using the WARPWING systemwith VICON position feedback to autonomously hover. The silver balls are thereflectors used by the vision based motion capture system. On the right, a sampleflight path from [60] is plotted in space using the VICON data. . . . . . . . . . 38
3.16 The commercially available WiiMote contains a 300 mg “smart camera,” whichcontains image processing hardware to return the coordinates of IR blobs in itsfield of view. . . . . . . . . . . . . . . . . . . . . . . . . . . . . . . . . . . . . . . 38
3.17 An infrared beacon consisting of three emitters with a known geometry can beused as a localization target. At right, the output of the WiiMote camera can beused to extract the camera pose. . . . . . . . . . . . . . . . . . . . . . . . . . . 39
3.18 A downward pointing WiiMote camera is wired into a serial port on the GINAcontroller to enable the helicopter to hover over the IR beacon. . . . . . . . . . . 39
3.19 Calculated geometry from the WiiMote camera can be used as a position sensorto estimate the helicopter pose relative to the IR beacon. . . . . . . . . . . . . . 40
4.1 In the IEEE 802.15.4 standard, 4 data bits get encoded to a 32 chip long codeword,which is modulated using OQPSK-HSS onto an ISM band carrier. . . . . . . . . 42
4.2 The number of links at a given RSSI and LQI is shown in this logarhythmicdensity plot. Red points indicate numbers on the order of 104 while dark bluepoints indicate numbers on the order of 100. . . . . . . . . . . . . . . . . . . . . 45
4.3 Simulation results returning LQI across SNR can be inverted to predict SNRgiven LQI, as shown in this plot. At high SNR, the integer-level granularity ofLQI results in lower SNR resolution. . . . . . . . . . . . . . . . . . . . . . . . . 46

vii
4.4 A histogram of links across SNR at constant RSSI = -62 dBm shows bimodalityderived from interference. The spacing towards high SNR is an artifact of thereduced resolution at high LQI. . . . . . . . . . . . . . . . . . . . . . . . . . . . 46
4.5 The complimentary CDF shows the fraction of links in the network having SNRgreater than indicated. The vertical dashed lines show the minimum SNRs re-quired for standards-compliant performance at various data rates. . . . . . . . . 47
4.6 The CDF of average PER across path-channels in the network following an errorfree time interval. In 90% of the path-channels observed, an error free intervalwas followed by another interval in which the PER was below that required bythe standard. . . . . . . . . . . . . . . . . . . . . . . . . . . . . . . . . . . . . . 47
4.7 A plot of each node’s usage versus its energy savings show that in general, themore a node is used, the greater potential energy it can save from variable bit rate. 52
4.8 The frequency of an on-chip relaxation oscillator drifts mostly between ±600ppm. Image and data courtesy Mark Lemkin, used with permission [29]. . . . . 53
4.9 The effect of increasing the filter bandwidth is to increase the out-of-band noisepower admitted to the receiver, increasing the required in-band SNR to maintainperformance. . . . . . . . . . . . . . . . . . . . . . . . . . . . . . . . . . . . . . 54
4.10 Before increasing the filter bandwidth, the input signal is completely filtered out,leading to no output signal regardless of the SNR. . . . . . . . . . . . . . . . . . 55
4.11 The noise performance of an 802.15.4 compatible receiver at varying clock offsets. 554.12 The DC bias of the demodulator output (in arbitrary units) is directly propor-
tional to the frequency offset between the receiver LO and the transmitter’s carrierfrequency. By applying a feedback loop on this bias value to the LO generator,the receiver clock can be driven to match the transmitter clock. . . . . . . . . . 56
4.13 A block diagram depicting how the additional frequency offset estimate demod-ulator output can be used to adjust the LO frequency until it matches the RFcarrier frequency . . . . . . . . . . . . . . . . . . . . . . . . . . . . . . . . . . . 57
5.1 This schematic shows a sample MAV application. The laptop represents a basestation and acts as a network manager, coordinating communications while serv-ing as a sink for data generated by the MAV and deployed sensor nodes. Datagenerated by the MAV must be sent through the relays, while the base stationcan employ existing communications infrastructure to interact with the world. . 59
5.2 A MAV can carry additional wireless repeater nodes as deployable payload. Thesenodes can be dropped off over the course of a flight to extend communication range. 60
5.3 An experimental realization of figure 5.1 above passes downstream communicationand upstream sensor data along a multi-modal multi-hop network path consistingof 3G, wifi, and 802.15.4 links. . . . . . . . . . . . . . . . . . . . . . . . . . . . . 61
5.4 If the MAV has a small amount of data to send, it can request a number ofslots to communicate to its nearest neighbor in the mesh. These slots can bepredetermined by the manager or stationary nodes. That data then gets routedover the mesh as would any other data generated in the mesh. . . . . . . . . . . 64

viii
5.5 In burst mode, the nodes along the direct path from the MAV to the base stationremove themselves from the TSCH network and communicate in a separate highthroughput, low latency mode. . . . . . . . . . . . . . . . . . . . . . . . . . . . 65
5.6 Given the expected maximum network distance (number of hops) from the MAVto the base station, a number of channels can be allocated to the MAV burstmode. As long as the number of channels is at least half the number of hops, theMAV will be able to communicate at the maximum supported throughput of thenetwork given one unique path to the base station. . . . . . . . . . . . . . . . . 67
5.7 A simulated environment has stationary network nodes through which a MAVmay travel. Network connectivity is indicated by dotted lines. Note that due tothe nature of RF communication, connectivity is not geographical. Similarly, asthe MAV travels around the network, the node to which it can communicate maychange. . . . . . . . . . . . . . . . . . . . . . . . . . . . . . . . . . . . . . . . . 68
5.8 Regardless of the density of the underlying mesh network, the MAV successfullyhears a fraction of the advertisement packets, and so can communicate duringapproximately 35% of the available slot frames. . . . . . . . . . . . . . . . . . . 69
A.1 The GINA 3 board was dismantled soon after fabrication; development has sinceprogressed to version 4. . . . . . . . . . . . . . . . . . . . . . . . . . . . . . . . . 72

ix
List of Tables
2.1 Noise in the GINA inertial sense axes . . . . . . . . . . . . . . . . . . . . . . . . 7
3.1 Physical parameters of a proposed solid fuel minirocket system . . . . . . . . . . 253.2 Single stage to orbit (SSTO) rocket designs . . . . . . . . . . . . . . . . . . . . 253.3 Two stage rocket designs for LEO insertion . . . . . . . . . . . . . . . . . . . . 26
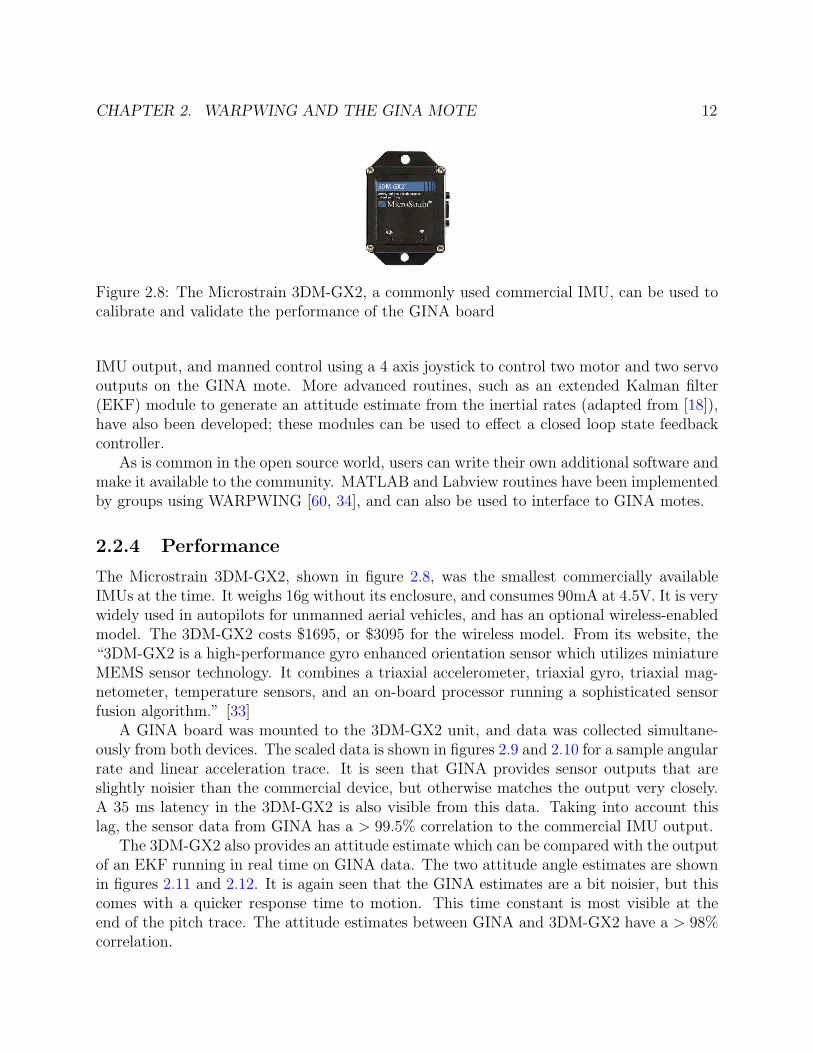
4.1 Energy savings comparison between PA scaling and variable data rate . . . . . . 434.2 Feasibility of higher data rate communication in an empirical WSN installation . 494.3 Mote subsystem power consumption and activity on-time . . . . . . . . . . . . . 504.4 System-wide energy savings by backoff scheme . . . . . . . . . . . . . . . . . . . 51
5.1 Differences in design parameters between stationary and mobile nodes in a hybridsensor network . . . . . . . . . . . . . . . . . . . . . . . . . . . . . . . . . . . . 62

x
Acknowledgments
I now sit putting the finishing touches on a document that is meant to summarize thepast quarter of my time on earth, savoring my last little length of student life, and gettingready to enter a wide open future. The path I’ve taken has been an amazing adventure,awash with countless wonderful people. Looking back on all those years, it’s clear that Icouldn’t have made it here today without the love, support, and sometimes selfless serviceof all those close to me. There have been just too many people to totally thank them eachindividually, so I apologize for any omissions.
This lengthy list leads off with none other than my advisor, Prof. Kris Pister. Through-out my entire extended existence in grad school, Kris has provided much needed guidance,inspiration, and enthusiasm. The other members of my committee, Profs. Abbeel, Bayen,and Maharbiz also deserve mention – it’s thanks to them that this work came to be. Thetopics this thesis touches on were conceived, developed, and refined with the indispensablehelp of my fellow past and present (in a manner of speaking) 471 researchers. From myfirst days in the group, my interactions with senior grad students Matt, Sarah, and Steven;postdocs Anita, Thomas; colleagues Subbu, Richard, Florian, and Branko; and the “newkids” Travis, Fabien, Mike, and Kevin have been extremely enjoyable, enlightening, andproductive. Furthermore, our undergrad researchers really rounded out my graduate career.Amanda, Leo, and Chris have all been spectacular students, supplying research assistancewhile providing me the opportunity to mentor and teach.
Though not directly related to my PhD process, people outside my academic circle alsodeserve recognition. I couldn’t possibly hope to name all my friends – those I’ve knownfrom my undergrad life as well as those I met in Berkeley – who’ve helped me remainremarkably rational, sane, and undoubtedly happy over the past years. Through activitiessuch as ultimate frisbee and board game nights, swing and salsa dancing, puzzling, classesand DeCals, and many other irregular interactions, I’ve had so many people touch my life indifferent meaningful ways. And I must mention my roommates in particular. The denizensof the original Top of the Danger Stars and its sequel, along with my earlier establishments(even extending back to my undergrad hallmates), always made where I was home.
Finally and most significantly, I must thank my premier patrons – people who have beenthe closest to me all my life. My family has always actively aided me in all my endeavors, bothin school and out. My parents, Mukesh and Rekha, and my sister, Amee, have generouslygiven guidance, encouragement, and comfort whenever I needed. Even excluding expressentreaties, they often provided what I didn’t know I needed. I can sincerely say, simplyeverything I’ve accomplished is built upon their influence.

1
Chapter 1
Introduction
Everyday life is getting ever more intertwined with the Internet; the densely connected setof nodes on the global network, along with the data contained therein, is often referred toas “the cloud”. With the extensive proliferation of laptops, cell phones, tablets, and similarelectronic devices, humans can now easily access the cloud at a moment’s notice. But thatinteraction is still largely directed and one-dimensional – the only behavior is for digital datato be transmitted at the command of a user.
The next major revolution will be to augment the cloud with more immersive agents –pervasive sensors will autonomously gather and process data from their environment, whiledistributed actuators can directly interface with the physical world. These devices will formthe “swarm at the edge of the cloud” [40]. Many science fiction stories have been built onthe foundation of swarms independently acting cyber-physical systems [46, 13]; the goal ofthis research is to pave the path forward to that very technology.
1.1 Wireless sensor networks
One of the great visions of wireless sensor network (WSN) research is the idea of a ubiquitousand seamless interface between the physical and online worlds. Described by such phrases as“Smart Dust” and “the Internet of Things,” WSN research aims to saturate our environmentwith small, cheap, multi-functional nodes that can sense, process, and communicate. WSNsare already employed in several commercial applications; custom networks are used to mon-itor industrial machinery, household power consumption, and urban congestion. However,WSN research is still an emerging field – part of the design process still includes determiningthe appropriate application space that WSNs can potentially fill.
At its most basic, a WSN system need not include sensors at all, merely providinga communications infrastructure to existing sensors or standalone electronics. Allowingdisparate devices and appliances to communicate with each other or a centralized controlleralready enhances the nature of interaction with electronics. Adding dedicated sensing to thenodes in a wireless network then significantly expands on the abilities delivered by a WSN.
CHAPTER 1. INTRODUCTION 2
1.2 Mobility
The utility and functionality of a sensor network can be greatly enhanced by introducingmobility to some or all of the nodes. There are many ways such actuation can benefit thesystem.
At a system level, mobile elements can simply be used to deploy a conventional stationarynetwork, potentially reducing installation costs and thus increasing the scope of appropriateapplications. Then, if some of the nodes themselves can move, they could rearrange them-selves after deployment to increase wireless connectivity, forming a robust network that canrespond dynamically to changing environmental conditions.
Mobile sensor nodes can also be used to optimize utilization in resource-constrainedsystems. A small number of expensive or otherwise scarce sensors can be placed on mobilerobots, moving throughout the environment to maintain full coverage in a time-multiplexedmanner. Alternately, a homogeneous system can use mobile nodes to concentrate sensingaround areas of interest, gaining dynamic range where necessary while still maintainingoptimal usage of individual nodes.
Sometimes, mobility itself is a component of the application goal, for instance in explo-ration, deployment, or retrieval missions. In these cases, there are still synergies betweensensor networks and mobile robots. Distributed networks can be used as a communica-tions infrastructure, allowing for robust two-way data transfer over ranges far longer than asingle-hop line-of-sight link. Additionally, a network of distributed nodes can gather neces-sary environmental data for use by the mobile robots, including for example data about therobots themselves to assist in guidance and navigation control.
1.3 Potential applications
Such systems of networked mobile swarms have uses throughout the consumer, industrial,and military sectors.
Autonomous robots could be of great use in search and rescue missions. For instance,every year natural and manmade disasters result in people trapped in the rubble of a collapsedbuilding or cave. A squad of small mobile search robots can locate such survivors deep in anobstacle–filled environment, and relate their positions over a deployed multi-hop network tofocus human rescue efforts. Similarly, such autonomous systems can be used in surveillanceand security roles to protect human operators.
Robots are already used in warehouses and distribution centers; adding pervasive net-working capabilities increases autonomy and expands the application space of such systems.Similarly, WSNs are being installed in plants and factories for dense monitoring and controlof industrial machinery; incorporating autonomous deployment and maintenance promotesadoption of such systems.
A final motivating example is diagrammed in figure 1.1. A ubiquitous distributed net-work in a representative home can be used to measure the state of its occupants. This

CHAPTER 1. INTRODUCTION 3
Figure 1.1: A possible home of the future contains a distributed wireless network withpervasive sensing, immersive actuation, and integrated mobile elements.
measured data can be processed to control embedded actuators to autonomously effect heat-ing, lighting, or other physical preferences. Ground and aerial robots, e.g. for cleaning orretrieval purposes, can be also be integrated into the network to interface intelligently withthe physical world.
1.4 Organization
This thesis begins in chapter 2 with a description of GINA and WARPWING, the wire-less inertial sensing hardware and software platform upon which much of this research wasbuilt. Specific small-scale robot systems built using the WARPWING platform are dis-cussed in chapter 3, including rocket designs to investigate potential launch vehicles for thedeployment of small motes into orbit and helicopters to investigate localization schemes forautonomous micro air vehicles (MAVs). Chapter 4 delves into communication protocols andenhancements to improve the functionality and performance of low power WSNs. This isespecially relevant to networks deployed by and supporting MAV operations; such hybridsystems are demonstrated and investigated in chapter 5. Finally, chapter 6 contains a sum-mary of this work, along with a discussion of how it can lead to swarms of autonomousnetworked robots.

4
Chapter 2
WARPWING and the GINA Mote
From sensors and devices through autonomous robots to swarm behaviors, there are a numberof infrastructure requirements necessary to test and develop various robotic and networksystem designs. In particular, processing and wireless communication are necessary forany such endeavors. Typically, an inertial measurement unit (IMU) is also necessary forlocalization of mobile nodes.
Many research groups independently design their own hardware solutions or adapt ahandful of fixed commercial subsystems to their custom application. However, these ap-proaches are often time-consuming and inefficient, causing valuable research effort to bespent re-creating solutions, often by those inexperienced in hardware design.
TheWireless Autonomous Robot Platform with Inertial Navigation and Guidance, WARP-WING, was designed to streamline robot development by collecting all the electronics re-quirements for robot control in one open source project, from hardware selection to boarddesign to firmware and software programming. By providing a full solution in an open sourceformat, researchers can focus solely on their areas of research, while still maintaining a co-hesive environment in which to develop and test a complete system. As users adapt partsof WARPWING to their varied custom applications, their changes are also shared with thecommunity, obviating the need for redundant independent development.
The idea of open source hardware is not unique. The Telos mote [39] was an open sourceplatform designed for wireless sensor network (WSN) research, and has spawned severalacademic and commercial revisions. The Arduino platform [4] is an incredibly popularembedded microcontroller development kit which has gained much traction in the hardwarehacking and hobbyist robotics community. In fact, the recently developed ArduPilot project[5] was based on the Arduino platform and provides an open source flight control platformsimilar to WARPWING, though bigger and heavier.
WARPWING is centered around the Guidance and Inertial Navigation Assistant, GINA,shown in figure 2.1. This is a low mass wireless IMU designed for use as a general purposerobot controller, especially for micro air vehicles (MAVs). It comprises inertial sensors forangular rate and linear acceleration along with a general purpose feature-laden microproces-sor. It can interface to additional sensors or drive a number of actuators via an expansion

CHAPTER 2. WARPWING AND THE GINA MOTE 5
Figure 2.1: GINA provides inertial sensing, processing, control, and wireless communicationon a board smaller and lighter than a US quarter.
header, and provides built-in communication over a 2.4GHz wireless link.TheWARPWING project consists of hardware components – a device database, schematic
design, and board layout – and software components – firmware for the on-board micropro-cessor and applications and modules for a base station computer – along with relevantdocumentation. This entire project is made available on Sourceforge, a popular open sourcecommunity site, at http://warpwing.sourceforge.net.
Section 2.1 describes the history of GINA development in the WARPWING project. Thespecific designs are presented in section 2.2, detailing the current GINA hardware along withthe firmware and software needed to use the GINA board. Section 2.3 expounds on the opensource nature of the WARPWING project, giving examples of modifications made to thedefault project by other research groups in their robotic applications. Finally, section 2.4examines the case studies from the previous section to draw some conclusions about opensource hardware for robot development, and presents a vision for how this project can evolvein the future.
2.1 GINA history
Initially created as a flight control system for a small inertially guided rocket (see section 3.1),GINA was designed to be the smallest, lightest, and lowest power stability and guidancecontrol solution with off-the-shelf components. It was then also used on miniature remote-controlled helicopter airframes for use as an autonomous MAV, as in section 3.2. The earliestversions of the board are shown in figure 2.2.
As development on both those projects continued in parallel, it became clear that therequirements for both, and indeed a number of other autonomous air vehicle and small robotresearch projects in general, were highly similar. A significant redesign of the board, with

CHAPTER 2. WARPWING AND THE GINA MOTE 6
Figure 2.2: GINA 0 on the left and GINA 1 on the right were created to guide small scalerockets and designed to be the smallest and lightest inertial flight controllers.
Figure 2.3: GINA 2.0, the first design in the current GINA 2.x series, has undergone severalrevisions to yield the current version GINA 2.2c shown in figure 2.1
an eye towards reuse and adaptability, resulted in the new GINA 2.x series of boards, startingwith the GINA 2.0 shown in figure 2.3.
The current 6 cm2 GINA 2.2c board weighs 1.6 grams and runs off of a single 3.7V lithiumpolymer cell. It consumes a maximum of 30mA at 3V when fully powered; intelligent dutycycling can make use of low power modes to lower average power and increase batterylifetime. The system uses entirely commercial off-the-shelf components aside from a customprinted circuit board (PCB) and can be made in its entirety in one-off quantities for lessthan $150.

CHAPTER 2. WARPWING AND THE GINA MOTE 7
Table 2.1: Noise in the GINA inertial sense axes
Axis Bandwidth Measurement noise σ Zero-bias error σbias
ax 500 Hz .57 m/s2 N/A
ay 500 Hz .46 m/s2 N/A
az 500 Hz .61 m/s2 N/A
ωp 140 Hz 0.42 ◦/s 0.07 ◦/s
ωq 140 Hz 0.26 ◦/s 0.06 ◦/s
ωr 140 Hz 1.04 ◦/s 0.04 ◦/s
2.2 WARPWING architecture
The primary specification driving the design of the GINA board was to minimize weight. Ingeneral, the physical dimensions of a robotic system scales up with the weight it needs tocarry, so reducing the mass of the controller enables smaller robots. Power was also a designconsideration: reducing energy consumption reduces the size of the battery necessary, thuslowering system mass.
2.2.1 Hardware design
Inertial sensors
The WARPWING project began with the GINA 2.0 board, which had 6-axis inertial sensing,composed of 3 MEMS sensors.
Angular yaw rate was measured by an Analog Devices ADXRS610 single axis analoggyro. The pitch and roll angular rates were measured by an Invensense IDG650 dual axisanalog gyro. These gyros measure rates up to ±300◦/s, and were digitized by an analog todigital converter (ADC) on the processor. Both of these devices have on-chip temperaturesensors for use in calibrating temperature coefficients.
There were two components to the noise in the gyro outputs. First, after subtracting alinear temperature-dependent offset, the zero-bias of the gyros varied across runs. Second,in a single run, the output of the gyro displayed additive white Gaussian noise in eachmeasurement. These noise terms are shown in figure 2.4 and summarized in table 2.1.
Linear motion was detected using a Kionix KXSD9-1026 3 axis digital accelerometer,measuring a configurable full-scale range of ±2g, ±4g, ±6g, or ±8g with a 12 bit ADC at400 Hz. It has a much lower temperature sensitivity and zero-bias noise than the gyros, socan be assumed to have a single zero-mean additive white Gaussian noise term added toeach measurement across all runs. These values are summarized in table 2.1.
It is important to note that these components were chosen when GINA 2.0 was designed.Though this sensor suite is comparable to (or better than) commercially available mini

CHAPTER 2. WARPWING AND THE GINA MOTE 8
−0.2 −0.1 0 0.1 0.20
5
10
15
20
Angular rate (deg/s)
Fra
ctio
n of
val
ues
(%)
Gyro zero−bias distribution
Roll (IDG)Pitch (IDG)Yaw (ADI)
−6 −4 −2 0 2 4 60
10
20
30
40
50
60
Angular rate (deg/s)
Fra
ctio
n of
val
ues
(%)
Gyro noise distribution
Roll (IDG)Pitch (IDG)Yaw (ADI)
Figure 2.4: The variation of the gyro zero-bias for a single board across 150 runs over 5 daysis shown in the graph on the left for each of the three axes. The graph on the right showsthe zero-rate gyro outputs over 2000 measurements during a single run. The bias offsets areclearly visible in the right graph, as well as a notable difference in performance between thetwo devices.
IMU options, it can be even better. As more advanced (e.g. lighter, lower noise, more tightlyintegrated) sensors have entered the market, the board has evolved. The latest revision GINA2.2c includes 9 axis sensing with the addition of a magnetometer, with significantly improvednoise performance of the 6 axis inertial sensors. Because the schematics are open source,it is a straightforward task to replace the sensors with even newer versions as they becomeavailable; once done, it will become available to anyone else who would like to use it.
Wireless communication
Communication to the board is handled by an Atmel AT86RF231 wireless radio. This is anIEEE 802.15.4 compliant 2.4 GHz RF transceiver capable of half-duplex communication at250 kbps. It is fully interoperable with off the shelf 802.15.4 devices, so commercial devicescan be used to communicate with a GINA mote. It also has enhanced non-standard modescapable of communicating at higher data rates up to 2 Mbps; section 4.2 discusses the usesof these modes further.
GINA has both an on-board chip antenna as well as a micro-coax connector for an ex-ternal antenna. The appropriate antenna can either be manually selected, or automaticallychosen by the radio based on received signal strength. This allows for generally reliablecommunication within a room-sized area, although care may need to be taken to mitigateinterference and multipath effects (see [55] for a possible solution). For long range communi-cation, directional high-gain antennas can be used at the base station and/or on the GINAmote itself; a +14 dBi antenna at the base station and a +8 dBi antenna on the mote allowed
CHAPTER 2. WARPWING AND THE GINA MOTE 9
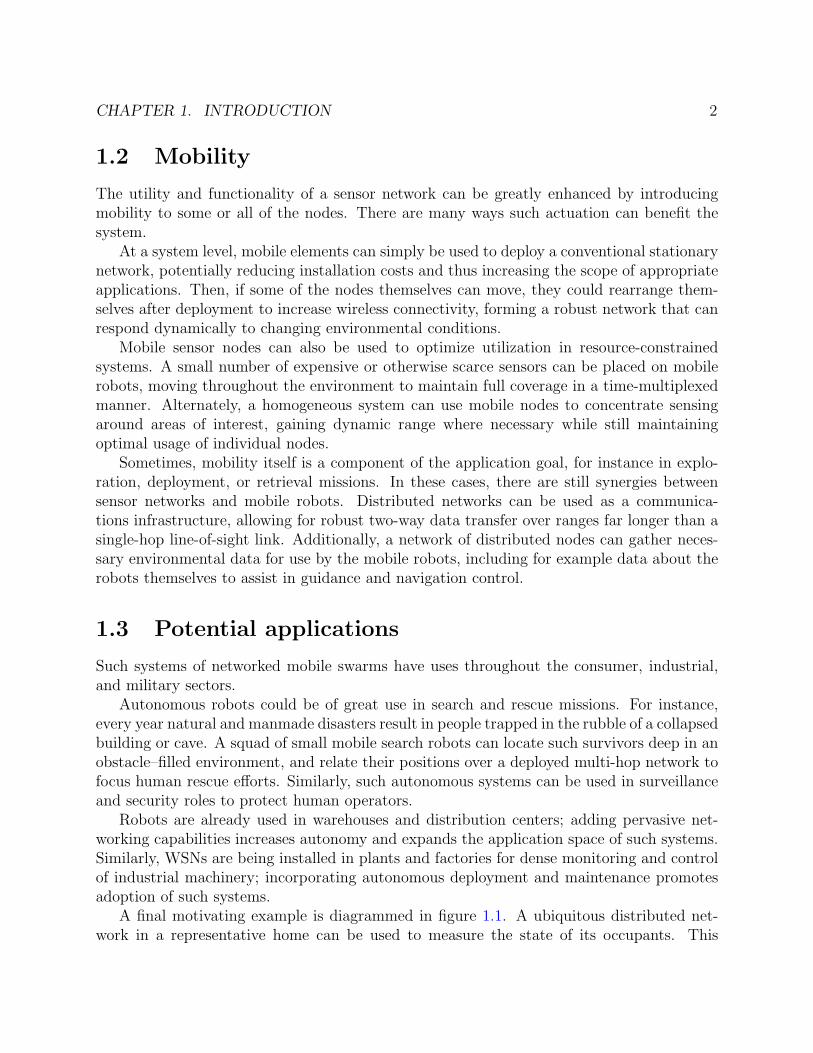
Figure 2.5: A break-out daughter board, with additional expansion headers and a USBinterface, allows the GINA mote to be connected to a standard breadboard or scope probesfor quick prototyping.
reliable communication over a 1 km line-of-sight link.
Processing
The on-board processing is handled by a Texas Instruments MSP430F2618. This is a highlycapable 16 MHz 16 bit microprocessor. It has on-board analog to digital converters (ADCs)and an I2C serial interface to read the sensors, and an SPI module to interface to the radio. Ahardware multiplier allows for 16 bit integer or fixed point single cycle multiplies. Additionalon-chip functionality includes direct memory access (DMA), timers, and a well developedinterrupt stack.
The processor also has a number of peripherals, accessible via expansion headers on theGINA board. In particular, in addition to general purpose input-output (GPIO) pins, thereare two additional serial ports to read from and write to digital sensors and actuators, aswell as a handful of pulse-width modulation (PWM) outputs to drive conventional robotactuators such as servos and motors.
Daughter boards
The expansion headers are intended to connect to application-specific daughter boards.A generic break-out board, as shown in figure 2.5, was designed to allow easy breadboard
prototyping; a USB-serial connector was also included to allow for enhanced debuggingcommunication to and from the GINA. The expansion headers were passed through theboard to allow for debugging of other daughter boards as well.
A second daughter board was designed for robot controllers, routing commonly used sig-nals to further electronics and connectors, as shown in figure 2.6. Two independent sets of

CHAPTER 2. WARPWING AND THE GINA MOTE 10
Figure 2.6: A daughter board for the GINA mote brings PWMs out to connectors for servos,uses other PWMs for brushed motor controllers, and includes additional sensors such as abattery fuel gauge, GPS receiver, and vision processors.
PWM outputs from the processor can be used to control up to 3 servos (or brushless motorcontrollers) and 2 motor drivers consisting of a MOSFET and flyback diode. Additionalsensors were also included for evaluation purposes on this daughter board. A GPS receiverwith an on-board chip antenna is connected to one of the serial ports, while an integratedbattery monitor/fuel gauge is connected to another. Connectors were also included to inter-face to Wiimote cameras, which provide IR blob detection for an off-the-shelf vision-basedlocalization system described in section 3.2.5.
The designs for these daughter boards, including schematics, layout, and pinouts, areprovided as a part of the WARPWING project.
Recent updates
The WARPWING platform has been constantly evolving to take advantage of newer andbetter hardware. In particular, as the MEMS sensor suppliers release ever more powerfulsensors, sensing fidelity can continue to improve. After GINA 3, detailed in Appendix A,work has begun on GINA 4.0, a smaller, lighter, more functional mote shown in figure 2.7.This board comprises a single integrated 9 axis IMU sensor along with an integrated processor/ radio that can communicate directly over Bluetooth 4.0 to a number of mobile devices.
2.2.2 GINA microprocessor firmware
The MSP430 microprocessor on the GINA board was programmed using embedded C andcompiled in the IAR integrated design environment (IDE). The basic firmware was designedto be broadly applicable for most requirements. The processor starts up in a holding loop,listening for commands both over the 802.15.4 radio (for wireless operation) as well as the

CHAPTER 2. WARPWING AND THE GINA MOTE 11
Figure 2.7: GINA 4.0 is the newest development in the hardware series, employing the latestintegrated hardware solutions to significantly miniaturize the system.
serial port (for use with a USB-serial connection to a computer). A number of commandsand operating modes are available, and are described in the API documentation availablewith the source code on Sourceforge.
The most relevant mode is the control loop. A hardware timer is used to run this loopevery 3 ms. Every iteration, the inertial sensors are polled and the data is placed into apacket sent out over the 802.15.4 radio. Then the processor handles received commands, inparticular setting the PWM duty cycles for actuators. This enables an off-board feedbackcontroller operating on a base station computer to receive and process data to generateactuator control signals, and pass that back to be implemented on the GINA with less than6ms latency.
This loop provides a sensor update rate of 333 Hz, with about 48k instruction cyclesavailable per loop. With the processor only handling interfacing with the sensors and radio,most of these cycles are spent idle; an autonomous system can use these to implementapplication specific feedback control directly on-board.
2.2.3 Base station software
The default behavior of the GINA firmware offloads the responsibility of actual robot controlto a base station computer, allowing for much easier design and development of robot control.A hardware device is required to allow the computer to speak to the GINA using the 802.15.4wireless standard; any such transceiver will work, but slightly specialized firmware has beenwritten for the Atmel RZ USBStick to simplify the base station software.
Application software must interface to the RZ USBStick, appearing as a serial port tothe computer; again, the full API is documented with the source code available on Source-forge. A collection of utilities was written in Python, forming an easy to read and modifycross platform skeleton upon which to build application-specific software. Default programsthat are included in the WARPWING package allow data logging, real-time visualization of
CHAPTER 2. WARPWING AND THE GINA MOTE 12
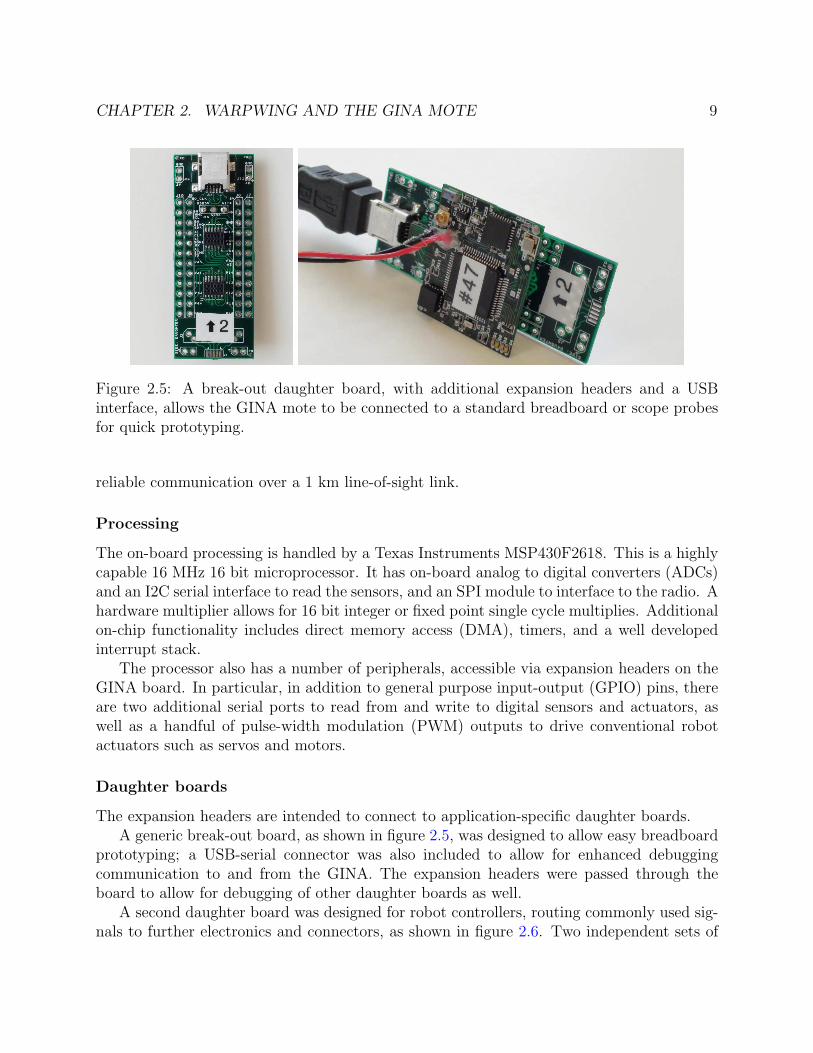
Figure 2.8: The Microstrain 3DM-GX2, a commonly used commercial IMU, can be used tocalibrate and validate the performance of the GINA board
IMU output, and manned control using a 4 axis joystick to control two motor and two servooutputs on the GINA mote. More advanced routines, such as an extended Kalman filter(EKF) module to generate an attitude estimate from the inertial rates (adapted from [18]),have also been developed; these modules can be used to effect a closed loop state feedbackcontroller.
As is common in the open source world, users can write their own additional software andmake it available to the community. MATLAB and Labview routines have been implementedby groups using WARPWING [60, 34], and can also be used to interface to GINA motes.
2.2.4 Performance
The Microstrain 3DM-GX2, shown in figure 2.8, was the smallest commercially availableIMUs at the time. It weighs 16g without its enclosure, and consumes 90mA at 4.5V. It is verywidely used in autopilots for unmanned aerial vehicles, and has an optional wireless-enabledmodel. The 3DM-GX2 costs $1695, or $3095 for the wireless model. From its website, the“3DM-GX2 is a high-performance gyro enhanced orientation sensor which utilizes miniatureMEMS sensor technology. It combines a triaxial accelerometer, triaxial gyro, triaxial mag-netometer, temperature sensors, and an on-board processor running a sophisticated sensorfusion algorithm.” [33]
A GINA board was mounted to the 3DM-GX2 unit, and data was collected simultane-ously from both devices. The scaled data is shown in figures 2.9 and 2.10 for a sample angularrate and linear acceleration trace. It is seen that GINA provides sensor outputs that areslightly noisier than the commercial device, but otherwise matches the output very closely.A 35 ms latency in the 3DM-GX2 is also visible from this data. Taking into account thislag, the sensor data from GINA has a > 99.5% correlation to the commercial IMU output.
The 3DM-GX2 also provides an attitude estimate which can be compared with the outputof an EKF running in real time on GINA data. The two attitude angle estimates are shownin figures 2.11 and 2.12. It is again seen that the GINA estimates are a bit noisier, but thiscomes with a quicker response time to motion. This time constant is most visible at theend of the pitch trace. The attitude estimates between GINA and 3DM-GX2 have a > 98%correlation.

CHAPTER 2. WARPWING AND THE GINA MOTE 13
0 10 20 30 40 50 60 70 80−4
−3
−2
−1
0
1
2
3
4
Time (s)
Rol
l rat
e (r
ad/s
)
GINA3DM−GX2
32.5 33 33.5 34 34.5−0.5
0
0.5
1
1.5
Time (s)
Rol
l rat
e (r
ad/s
)
GINA3DM−GX2
Figure 2.9: A comparison of the GINA and 3DM-GX2 angular rate measurement.
0 10 20 30 40 50 60 70 80−1.5
−1
−0.5
0
0.5
1
1.5
Time (s)
Y A
ccel
erat
ion
(g)
GINA3DM−GX2
36 36.5 37 37.5 38 38.5 39−0.2
−0.1
0
0.1
0.2
0.3
0.4
Time (s)
Y A
ccel
erat
ion
(g)
GINA3DM−GX2
Figure 2.10: A comparison of the GINA and 3DM-GX2 acceleration measurement.

CHAPTER 2. WARPWING AND THE GINA MOTE 14
0 20 40 60 80 100 120−4
−3
−2
−1
0
1
2
3
4
Time (s)
Rol
l ang
le (
rad)
GINA3DM−GX2
65 70 75
−1
−0.5
0
0.5
1
1.5
Time (s)R
oll a
ngle
(ra
d)
GINA3DM−GX2
Figure 2.11: Roll angle estimate comparison. GINA and 3DM-GX2 agree closely in theirstate estimates.
0 20 40 60 80 100 120−1
−0.5
0
0.5
1
1.5
Time (s)
Pitc
h an
gle
(rad
)
GINA3DM−GX2
95 100 105 110 115 120−0.1
−0.05
0
0.05
0.1
0.15
0.2
0.25
0.3
0.35
0.4
Time (s)
Pitc
h an
gle
(rad
)
GINA3DM−GX2
Figure 2.12: Pitch angle estimate comparison. The noisier GINA estimate also allows amuch shorter settling time than the 3DM-GX2.

CHAPTER 2. WARPWING AND THE GINA MOTE 15
2.3 Modification and Sharing
The ultimate goal of the WARPWING project use the designed ultra-small full-featuredwireless IMU and robot controller to use that to advance robotic research. Any aspect ofWARPWING can be modified to fit the specific needs of a design. Thus, even with little tono electronics ability, researchers can quickly design a platform on which to implement aninertial robot controller.
The default WARPWING distribution as described above allows researchers to mountthe wireless GINA mote onto a dynamic system and log its inertial rates on a base stationcomputer directly out of the box. The system was distributed to over a dozen researchgroups around the world, and all were able to collect data within days. Some examples areshown in figures 2.13 and 2.14.
Figure 2.13: Inertial data collected from GINA motes mounted on mammals is used tocalculate sedentary breathing rates. Data courtesy Subramaniam Venkatraman [50].
When used for more than simply measuring inertial rates, however, the default WARP-WING configuration is likely insufficient for controlling an arbitrary robot. But because thesystem is very general, typically only a few specifics need to be modified to build the desiredcontroller. Because of the nature of the open source community, these changes are shared,simplifying similar changes in the future.
There are already projects using WARPWING that have modified some or all of thecomponents of the entire system. A select few are summarized below as case studies for theways WARPWING can be adapted to simplify robot development.
2.3.1 Software
In order to use WARPWING to control a specific robot, at minimum the software will needto be rewritten. For a large portion of robots, however, that will be the only componentthat needs to be modified.

CHAPTER 2. WARPWING AND THE GINA MOTE 16
Figure 2.14: Inertial data collected from a GINA mote mounted on a coiled spring, demon-strating both oscillatory rotation and translation. Data courtesy Thomas Watteyne [54].
Figure 2.15: The hopping rotochute developed at GATech uses WARPWING as its flightcontroller. The software interface was rewritten to fit in to the existing MATLAB framework,while the rest of the WARPWING system remained unchanged. This allowed for quickdevelopment of the mini rotochute, shown at right.
The Costello Research Group at the Georgia Institute of Technology have developed ahybrid air/ground vehicle called the hopping rotochute as shown in figure 2.15 that usesrotors to generate lift, causing the robot to hop along trajectories and over obstacles [7, 8].
The default hardware and firmware configuration for the GINA mote is sufficient tocontrol the actuators, and so with the control hardware taken care of by WARPWING,research effort can be dedicated to mechanical vehicle design and control algorithms. Thesoftware only needed to be modified insofar as to interface the existing controller written inMATLAB to the WARPWING base station transceiver.

CHAPTER 2. WARPWING AND THE GINA MOTE 17
The WARPWING setup can also be used for non-robotic applications. The small size andweight of the GINA board makes it particularly suitable for body sensor network applications.In particular, inertial sensing can be used to estimate the pose of body joints and extremities.Figure 2.16 shows a plastic ring holding a GINA board – the default code can be used togather data on the behavior of the wearer, as shown in figure 2.17. Custom software canbe written to interpret this data, for instance by combining estimated pose and measureddynamics to estimate letters typed on a virtual keyboard.
Figure 2.16: The RinGINA device contains a GINA mote on a custom manufactured ring.The WARPWING platform was used to quickly develop an unobtrusive wireless body-mounted sensor.
Figure 2.17: The WARPWING code can gather inertial data from the RinGINA, measuring6DOF state and dynamic motion. Custom software can be written to translate the data intovirtual keypresses, potentially replacing a physical keyboard with a body-mounted IMU.

CHAPTER 2. WARPWING AND THE GINA MOTE 18
Figure 2.18: The mini quadrotor developed by Daedalus Flight Systems and UMD uses theGINA hardware, but modifies the firmware to include an on-board attitude stability loop tocontrol its four brushless DC motors.
Figure 2.19: DASH, a small, lightweight crawling robot developed at UC Berkeley, uses theWARPWING system to measure inertial rates and motor back EMF for dynamic analysisand control.
Figure 2.20: This small lightweight footstep detector is designed from the schematic level onup using the WARPWING system as a base, but replacing the accelerometer with one farmore sensitive.

CHAPTER 2. WARPWING AND THE GINA MOTE 19
2.3.2 Firmware
For more complicated robots, with more advanced on-board behavior, the firmware on theGINA mote may also need to be modified. A mini quadrotor, shown in figure 2.18 has beendeveloped by Daedalus Flight Systems and the University of Maryland. It uses four brushlessDC motors for its actuation and requires an on-board attitude stability loop [34].
The WARPWING platform satisfied the majority of the requirements for a flight controlinfrastructure, and the only elements that needed to be added in firmware were specific tothe feedback control loop. Routines were written to derive setpoint values for the inertialrates, mix them with joystick inputs sent via radio, and wrap a loop around the measuredrates to drive the PWM outputs controlling the motors. For this project, the software wasalso ported to Labview for convenience of the researchers.
Because the hardware and the bulk of the firmware was already implemented in WARP-WING, the group was able to focus on mechanical system design and development andcontrol system tuning.
The firmware on the GINA was also completely rewritten for the OpenWSN project [53],a non-robotic application of the hardware. In that project, the board was used as a node ina distributed wireless sensor network; completely new firmware was written for a standardscompliant implementation of the IEEE 802.15.4e network stack.
2.3.3 Layout
The Biomimetic Millisystems Lab at the University of California, Berkeley have developed ahexapedal crawling robot called DASH [9]. In order to study the dynamics of DASH towardsa future adaptive controller, the researchers needed to incorporate an IMU onto the robot.The WARPWING platform provided a lightweight, low power, and easy to use single boardsolution that interfaced to the existing motor driver to control the robot.
One additional requirement for the system was to measure and report an analog signalfrom the robot: the back EMF of the motor. In the default GINA layout, there was anunused ADC input to the processor, but it wasn’t exposed in the expansion header. It ispossible then to adjust the layout of the GINA board to rewire an ADC input to an expansionpin rather than a GPIO, allowing it to be used for the additional analog sensor. In this case,the firmware was also modified slightly to read that ADC channel and send it back over theradio, and the software was amended to handle that data appropriately.
This change was incorporated into the WARPWING trunk, and the current design ofGINA 2.2 includes configurable analog inputs via the expansion header.
2.3.4 Schematic
Another project at UC Berkeley considered the use of networked sensors (shown in figure2.20) distributed across a floor to determine the location of footsteps using the time differenceof arrival of vibrations between sensors [31]. These sensors could potentially be strewn

CHAPTER 2. WARPWING AND THE GINA MOTE 20
about by larger autonomous robots, and so minimizing size and weight is an importantdesign consideration.
The WARPWING system can provide most of the needed functionality from measuringsensor readings to forming a time-synchronized mesh network, but the accelerometer wasselected for robotic systems requiring higher dynamic range at the expense of sensitivity.A new GINA design was forked from the main version to replace the accelerometer witha much more sensitive analog sensor. This required the change to propagate through thelayout, firmware and software, but still much of the system remained unchanged, greatlyspeeding development time.
Ultimately, designs including this new sensor were merged back into the trunk, becomingas a permanent addition on the current version of the board.
2.4 Summary
The open source model for software development has begun to make inroads into the hard-ware community, and the WARPWING project fully embraced that approach. Startingfrom GINA, an extremely small and lightweight but powerful wireless IMU and processor,the WARPWING project provided a very broad base from which to design robot controllersand more generally sensor motes for which size and weight are at a premium. The examplespresented above showed that any of the system can be changed, whether it be a sensor com-posing GINA, the layout of the board, the firmware running on the GINA processor, or thesoftware running at the base station. The rest of the system could still be used as is, thusobviating the need for redundant development effort and greatly increasing the efficiency ofrobotic research and design.
As is the nature with open source projects, developments made by users in the commu-nity can be fed back into the project to be spread throughout the system. As more userscontribute to WARPWING, it becomes more versatile and less new development is neededfor new applications. In much the same way as standard fabrication processes for IC andMEMS devices have pushed research farther into device design, the current WARPWINGplatform similarly simplifies robot controller development, and drives research to more effi-ciently consider higher level designs.

21
Chapter 3
Micro Air Vehicles
The GINA board of the previous chapter was borne out of the need for a small, lightweightrobot controller; it was then employed in a number of research robots.
A robot is defined by its mobility; there are a number of actuation options for mobilerobots. Ground based systems can employ wheels or legs, while aerial vehicles can use fixedor rotary wings. Though specific applications usually admit a particular optimal mobilitysubsystem, general or multipurpose robots often must consider tradeoffs between the var-ious options. Flight is typically the most versatile, allowing maneuverability in all threedimensions; however, it is correspondingly the most difficult to implement well.
Localization, that is, deriving the system state, is vital to autonomous behaviors. With-out external infrastructure, the robot must be able to calculate for itself an estimate ofits position within its environment. In practice, localization turns out to be the biggestchallenge in implementing autonomous micro air vehicles (MAVs). The WARPWING plat-form described in the previous chapter, with its on-board inertial sensing, processing, andcommunication capabilities, can be used to design MAV flight controllers.
3.1 Small scale rocketry
As technology has advanced, electronic components and systems have become smaller andmore powerful. A similar trend holds for space systems. Satellites are effectively wirelesssensor nodes, and so advances in microelectronic technology and wireless sensor network(WSN) research can be applied to orbital communication networks.
Distributed sensing has many academic and industrial applications around the world, inboth urban settings and natural environments [42]. WSNs themselves are also the subjectof study, both in developing further applications as well as investigating and improvingfunctionality. Further theoretical research thrusts can include communication theory ordistributed algorithms.
However, WSNs have mostly been limited to earth-bound applications. Though therehas recently been some research considering potential WSN deployments in space (cf. [22,

CHAPTER 3. MICRO AIR VEHICLES 22
51]), most orbital systems are still composed of individual large multi-functional spacecraft.Space-based WSNs could provide robust atmospheric or astronomical sensing, while at thesame time providing an opportunity to study fundamental wireless communications researchin an environment without interferers or obstacles. Such a distributed solution can exploit theadvances in consumer electronic technology to employ smaller and cheaper hardware. Whileprevious small satellite research has focused on systems on the order of kilograms, sensornodes have shrunk to where significant functionality can be packed into a 10 g system.
The deployment of small-scale satellites for these orbital systems requires a launch vehicle(LV) of comparable scale and cost to the payload mote being deployed. Designing such avehicle requires analysis of the limits on miniaturizing a ground-to-orbit system, and inparticular, conditions on and designs for the orbital insertion of sub-kilogram payloads.There are two main requirements on a LV to put a mote into low earth orbit (LEO): thesystem must deliver enough energy to attain an orbital trajectory, and it must be controlledto follow the insertion path.
3.1.1 Energy to LEO
Energy considerations drive the mechanical rocket design, constrained by physical propertiesof available materials.
General rocket equations
A common metric quantifying the energy required to implement an orbital maneuver is thescalar ∆v or delta-vee. This energy must be provided by the propulsion system. In the caseof a LV moving from rest on the surface of the Earth to LEO, the required ∆vleo can bedecomposed as follows [44]:
∆vleo = vo +∆vd +∆vg +∆vc +∆vatm − vrot, (3.1)
where
• vo is the orbital velocity,
• ∆vd represents the energy lost to drag,
• ∆vg represents the additional gravitational potential energy,
• ∆vc represents energy needed to effect trajectory control,
• ∆vatm represents the energy lost due to engine inefficiency in atmosphere,
• vrot is the velocity of the launch platform due to earth’s rotation.

CHAPTER 3. MICRO AIR VEHICLES 23
The orbital velocity vo is the speed required to maintain the orbital trajectory. For acircular orbit,
vo =
√
G ·Me
(Re + h), (3.2)
with gravitational constant G, earth’s mass Me and radius Re, and orbital altitude h. For asatellite in LEO at an altitude of 200 km, this gives vo = 7.8 km/s. The other ∆v losses inequation 3.1 total 1.5 - 2 km/s, yielding a total ∆vleo of 9.5 - 10 km/s for a ground launchedLV to reach LEO [44].
The total ∆v generated by a propulsion system over the duration of a maneuver can becalculated from the time history of its instantaneous thrust (|F |) and LV total mass (m):
∆v =∫
t
|F |
mdt. (3.3)
Evaluating this integral for a basic combustion chamber rocket design yields the ideal rocketequation
∆v = ve · ln
(
mi
mf
)
, (3.4)
where the exhaust velocity ve is a property of the specific fuel/rocket system.For a given ve, then, the ∆v of a rocket stage can simply be calculated from that stage’s
mass ratio mi/mf . In practice, the final mass mf after burnout consists of the structuralmass of the rocket along with the payload (which includes higher stages), while the initialmass mi also includes the mass of the fuel. The total ∆v of a multi-stage rocket is the sumof of the ∆v’s of each stage calculated independently.
Adaptation for minirockets
The drag force Fd experienced by a rocket moving through the atmosphere is given by:
Fd =1
2ρCdv
2A, (3.5)
where ρ is the density of the surrounding air, Cd is the drag coefficient, v is the velocity ofthe rocket relative to the air, and A is the rocket’s cross sectional area. This results in apenalty:
∆vd =∫ Fd
mdt, (3.6)
that scales inversely with length.As a result, small scale rockets must provide a higher total ∆v. Given the ideal rocket
equation (3.4), this means that it is especially important to minimize the mass of the LV,including the electronic flight controller. Thus, the primary specification for the rocketsystem design becomes the weight metric.

CHAPTER 3. MICRO AIR VEHICLES 24
The rocket system itself need not deliver the total ∆v required for orbit. Though aminirocket must still be used to deliver the payload to the specific desired orbital trajectory,some portion of the path can be achieved by bootstrapping on existing aircraft launches.A conventional rocket LV or ultra high altitude balloon (UHAB) can be used to deploy asystem at altitude in the upper atmosphere.
There is precedent for such piggyback style systems. The CubeSat program [48] usesspare payload capacity between stages of large scale commercial rocket launches to deployacademic 1 L, 1.33 kg “nano-satellites” into orbit. A UHAB system has been demonstratedto lift a 690 kg payload to a peak altitude of 49.4 km [41], and J.A. Van Allen had usedballoons to launch rockets into the upper atmosphere extensively during the 1950s [49].
There are a number of energy advantages for high-altitude launches:
• The gravitational potential energy ∆vg need not be supplied by the rocket anymore.
• The control effort ∆vc is reduced for a shorter trajectory. Not needing to compensatefor the wind gusts present at lower altitudes further reduces ∆vc.
• The air drag losses ∆vd experienced by a LV launched above 98.5% of the atmosphereare less than 3% that of a similar system launched from the ground [20].
• The engine operates at peak performance when exhausting into near vacuum, reducingthe ∆vatm loss caused by to a lower ratio between combustion chamber and ambientpressures [36].
Minirocket design
The mechanical design of a complete miniature rocket LEO LV requires a complicated in-terplay of materials science, aerodynamics, and mechanical engineering – it is a significantundertaking, and beyond the scope of this work. Nonetheless, first order analysis of such asystem is necessary to establish the feasibility of such a system.
To keep costs, complexity and structural mass at a minimum, a solid propellant seemsto be favorable for a small-scale LV. The need for pipes, valves, tanks, and insulation inliquid propellant engines would contribute to a high overall structural mass. The main dis-advantages of solid-fuel propellant are the lower specific impulse Isp and the lack of activethrottling, though the latter could potentially be overcome by a combination of intelligentpropellant grain design and control system tuning, allowing specific thrust-time characteris-tics.
A solid fuel rocket is little more than a open-ended cylinder packed with fuel formingthe combustion chamber with a nozzle for exhaust emission, upon which the control systemand actuators are mounted. To minimize structural weight, high tensile strength carbonfiber can be used to form the combustion chamber. A standard solid rocket fuel consists ofan ammonium perchlorate oxidizer in a hydroxy-terminated poly-butadiene (HTPB) binder.The physical characteristics of such a system are summarized in table 3.1.

CHAPTER 3. MICRO AIR VEHICLES 25
Table 3.1: Physical parameters of a proposed solid fuel minirocket system
Parameter Subsystem Value Units
Fuel exhaust velocity Fuel 2.6 km/s
Fuel density Fuel 1.763 g/cc
Chamber pressure Rocket body 100 atm
Carbon fiber tensile strength Rocket body 3 GPa
Carbon fiber density Rocket body 1.75 g/cc
Payload mass Payload 10 g
Control system mass Controls 10 g
Table 3.2: Single stage to orbit (SSTO) rocket designs
∆v Diameter Length Wall thickness Mass
(km/s) (cm) (cm) (µm) (kg)
10 3.1 101 51 1.3
12.5 6.6 218 110 13.3
15 n/a n/a n/a n/a
With these parameters, and some optimistic but not unreasonable design assumptionson structural integrity (e.g. ignoring the possibility of chamber wall ablation or buckling),a design optimization can be carried out on the geometry of such a rocket. The minimum(total system) mass cylindrical rocket can be calculated by imposing constraints of structuralstability (the carbon fiber rocket body must be able to withstand the pressure of combustion)and mass fraction (derived from the necessary total ∆v from equation 3.1 along with therocket equation in equation 3.4).
For a single stage to orbit (SSTO) rocket, then, the resulting geometry is shown in ta-ble 3.2. Though ∆vleo = 10 km/s is easily attainable, adding a 50% safety margin provesimpossible. Instead, a multi-stage rocket would be necessary. The generated geometriesfor a two stage rocket are shown in table 3.3. A 50% margin of error is still quite achiev-able, yielding a rocket system under 10 kg in mass and 2 m long. A 100% safety margin,though unwieldy, is also achievable. For such higher total ∆v, even more stages would berecommended. Nonetheless, this shows the feasibility of a backyard-scale minirocket thatcan deliver a 10 g payload into LEO.

CHAPTER 3. MICRO AIR VEHICLES 26
Table 3.3: Two stage rocket designs for LEO insertion
∆v Diameter First stage Second stage Wall thickness Mass
(km/s) (cm) length (cm) length (cm) (µm) (kg)
10 2.0 156 39 33 1.1
12.5 4.0 112 13 66 3.0
15 5.7 178 14 95 8.8
20 9.2 900 13 154 108
Figure 3.1: In the absence of aerodynamic forces, a bare solid rocket engine spins out ofcontrol. A stabilizing controller is therefore necessary on a minirocket LV.
3.1.2 Guidance control system
System design
A rocket LV requires active control for both stability and guidance in order to reach LEO.A typical solid rocket motor is often dynamically unstable, as shown in figure 3.1. Aboveatmosphere, passive aerodynamic surfaces cannot provide restoring moments, and so theflight controller must enforce stability. Furthermore, there is no ballistic path to LEO (“whatgoes up must come down”), so active control is necessary to guide the LV along a specifiedtrajectory to reach LEO. Though the lower stages of a multi-stage rocket can be replaced byan alternate carrier such as a balloon or larger scale rocket as described above, the uppermoststage of the minirocket will still need to perform the final orbital trajectory insertion.
A schematic of a rocket flight control system is diagrammed in figure 3.2. In order toimplement feedback control, the system must first calculate the state of the LV. In principle,an inertial measurement unit (IMU) can measure body-referenced inertial rates, which can beintegrated to provide a six degree of freedom (6DOF) state identifying the earth-referencedposition and orientation. In practice, additional sensors must also be filtered in to give an

CHAPTER 3. MICRO AIR VEHICLES 27
Figure 3.2: A feedback control system can be used to stabilize flight and follow a trajectory.The 6DOF state is sensed by a 6 axis IMU and input to a microprocessor. The currentheading and trajectory error is calculated, and a control signal is output to an actuator. Theactuator positions a mass or aims the nozzle to induce the appropriate torque on the rocket.
accurate state estimate.Given the state estimate, then, the controller can calculate the deviation from a desired
trajectory and command actuators to generate the appropriate corrections. With the finalorbital insertion needing to happen above earth’s atmosphere, aerodynamic control surfacessuch as fins cannot be used. Instead, actuators must direct the body-referenced rocket thrust.These could take the form of a gimbaled nozzle, vanes in the exhaust stream, or an offsetmass to generate the required torques for attitude control.
State estimation
Implementation of the rocket controller began with an evaluation of the sensing subsystem.A board containing the GINA gyro sensors was attached to a CC2430 evaluation board forwireless data offloading; a receiver was attached to a laptop to log the sensor data over theduration of a rocket flight. This sensing package was mounted in the nose cone of a rocketalongside a video recorder aimed at the ground. This system is displayed in figure 3.3.

CHAPTER 3. MICRO AIR VEHICLES 28
Figure 3.3: The original rocket containing GINA sensors and a video camera
Figure 3.4: Gyroscope data from a flight shows many characteristics of rocket operation.This data can be integrated to yield an attitude state estimate for flight control.
The measured gyroscope data during a flight of this test rocket was collected by a laptopbase station, as annotated in figure 3.4. An integration routine was run on the data togenerate a 3DOF rocket attitude estimate. A computer generated model displaying thisattitude estimate was superimposed on the video recording of the flight to give a indicatorof the estimate fidelity. Screenshots of this comparison are displayed in figure 3.5; visualinspection determined that the estimate matched the actual state to a relatively high degree.
3.1.3 Subsequent work
Following the feasibility study and validation of the mechanical and sensing subsystems ofa small scale guided rocket, the project was handed off to Florian Kehl, and is describedin greater detail in his thesis [26]. With new hardware giving higher quality sensing, thestate estimator of the previous section became far more accurate, as shown in figure 3.6.Ultimately a feedback controlled rocket with flywheels and a gimbaled motor mount for 3axis attitude control (as seen in figure 3.7) was flown to demonstrate controlled flight.

CHAPTER 3. MICRO AIR VEHICLES 29
Figure 3.5: Inertial sensor data postprocessed from a rocket launch show the state estimateevolving along with the actual body motion, captured by an on-board camera.
Figure 3.6: GINA sensor data transmitted wirelessly to a laptop base station is integratedin real time to give a 6DOF state estimate. The estimated attitude is projected alongsidethe physical system demonstrating excellent agreement a posteriori.

CHAPTER 3. MICRO AIR VEHICLES 30
Figure 3.7: An updated rocket designed and built by Florian Kehl contained a GINA motefor full 6 axis inertial sensing, along with 3 axis attitude control with 4 channel flywheel andgimbaled nozzle actuation.
3.2 Autonomous helicopters
A rocket must control its body attitude in order to effect a specified navigation profile; asimilar correspondence holds for helicopters. As such, the GINA controller and WARPWINGplatform were also adapted for use on helicopter airframes.
3.2.1 Design goals
Autonomous helicopters are of particular use in indoor environments: in practice, indoorMAVs must be controllable and agile. When operating in general environments, the MAVmust be able to maneuver despite unknown air gusts or in tightly confined spaces. Further-more, by definition the system is required to be small. In practice, the size of the systemis dictated by the weight it needs to carry, so this constraint requires minimizing the totalmass of the system. Lowering power draw is also beneficial, as it reduces the size of thebattery necessary.
Ultimately, the end goal is to use these MAVs in clusters or swarms. To this end, thesystem should be cheap and reproducible. In particular, the system was designed with asmany low cost off-the-shelf components as possible, with minimal custom design or complexassembly.
3.2.2 Helicopter platforms
There is a large market for commercial helicopter hardware in the toy industry – a num-ber of companies design and sell remote controlled helicopters. Many of these devices usestandardized actuators with a simple wireless interface: a handheld remote generates con-trol signals which are then mixed to drive the motors and servos responsible for helicoptermotion. These form a very robust platform on which to conduct MAV research; by abstract-ing mechanical and aerodynamic system design to companies, effort can be focused on coreautonomy research.
One vehicle selected as the platform on which to design the MAV system was the Walkera4#3 remote controlled single main rotor - tail rotor (SMRTR) helicopter. It is a four channel

CHAPTER 3. MICRO AIR VEHICLES 31
Figure 3.8: The Walkera helicopters selected as the platforms for this project are small,cheap, and commercially available 4 channel electric helicopters.
Figure 3.9: The off-the-shelf Walkera airframes are controlled by a GINA board runningWARPWING code to investigate autonomous operation.
electric helicopter with main and tail rotor throttle and elevator and aileron cyclic controls.It was selected based on the considerations above: it was the smallest available off the shelffully controllable helicopter. It has a 180 mm diameter main rotor, and is driven by a400 mAh lithium polymer (LiPo) battery. In its default configuration, it weighs a total of45 g including the 10 g battery. A newer product by the same company is the Walkera 5G6coaxial helicopter. It is slightly smaller with a 175 mm rotor diameter, but it too weighs45 g and runs off the same battery. These two helicopters are shown in figure 3.8.
In order to investigate MAV autonomy on such systems, the electronics of the helicopterswere removed and replaced with the GINA board. The WARPWING code could then beconfigured in a variety of operating modes, allowing measurement of the inertial rates andcontrol of the actuators. The helicopters outfitted with the custom electronics are displayedin figure 3.9 in preparation for flight.

CHAPTER 3. MICRO AIR VEHICLES 32
f(x, u) 1/s h(x)
w
u
xz
v
Figure 3.10: An extended Kalman filter can be used to estimate the state of a general noisynonlinear system.
3.2.3 Extended Kalman Filter attitude state estimator
Stability and guidance control on MAVs requires state feedback; the state of interest is the6DOF linear and angular position. As such, the first element in a flight controller is a stateestimator that can generate 6DOF pose information from a suite of sensors.
The state evolution of the helicopter attitude, that is, its pitch and roll angles, is anonlinear function of the angles and angular rates. The gravity vector, measured by theaccelerometer, gives a direct measurement of attitude state. For these reasons, an extendedKalman filter (EKF) as adapted from [18] was used to integrate the rates and use the stateknowledge from the accelerometer in the presence of sensor noise to return the helicopterattitude.
A block diagram for a nonlinear system is shown in figure 3.10. A general system hasvariables:
• State x
• Input u
• Observation z
• Gaussian state feedback noise w ∼ N(0,W)
• Gaussian measurement noise v ∼ N(0,V),
with governing system equations:
x = f(x,u) +w
z = h(x) + v.
In particular, for the state evolution of the attitude roll angle φ and pitch angle θ of aMAV:
x = < φ, θ >
u = < p, q, r >
z = < ax, ay, az >

CHAPTER 3. MICRO AIR VEHICLES 33
f(x,u) =
[
p+ q sinφ tan θ + r cosφ tan θq cosφ + r cosφ
]
h(x) =
sin θ− cos θ sinφ− cos θ cosφ
The noise covariance matrices W,V are estimated from sensor data taken while thehelicopter is stationary.
The state update is a continuous time process, so a continuous form of the EKF is usedto update the a priori state estimate and state covariance matrix:
˙x = f(x,u)
A =∂f
∂x
∣
∣
∣
∣
∣
x=x
P = AP+PAT +W
This method is also robust to dropped packets introducing variable time intervals betweensamples. The a posteriori update is then performed using
z = h(x)
C =∂h
∂x
∣
∣
∣
∣
∣
x=x
L = PCT(CPCT +V)−1
P = (I− LC)P
x = x+ L(z− z)
3.2.4 Flight control attempts
To begin analyzing the dynamical system, the WARPWING software was configured to flythe Walkera SMRTR helicopter under manual control, and an expert pilot flew the systemin a hover for over a minute. The sensor readings and control signals were logged over thecourse of the flight. Also recorded were the state estimate from the EKF running in realtime on the sensor data received at the base station and the output of various low-pass filters(LPFs). Sensor data for the roll / sideways motion is shown in figures 3.11 and 3.12, andan EKF estimate of the roll angle is shown in figure 3.13. The motion of the main rotorfeeding through to the helicopter body is clearly visible as a high amplitude oscillation inboth plots, as well as beats in that oscillation due to mechanical resonances. Nonetheless,the output of the EKF was considerably less noisy, especially after application of a LPF.
With the yaw rate shown in figure 3.11, a single pole low-pass filter decreased the ampli-tude of the rotor feedthrough such that the true yaw rate of the body was apparent without

CHAPTER 3. MICRO AIR VEHICLES 34
0 20 40 60 80 100 120−250
−200
−150
−100
−50
0
50
100
150
200
250
Time (s)
Yaw
rat
e (d
eg/s
)
RawFiltered
32.5 32.6 32.7 32.8 32.9 33−150
−100
−50
0
50
100
Time (s)Y
aw r
ate
(deg
/s)
RawFiltered
Figure 3.11: The yaw rate sensor output of GINA mounted on a helicopter driven to hover,before and after application of a low pass filter. The large scale yaw motion is recoverablefrom the filtered output, so can be used to stabilize helicopter heading.
0 20 40 60 80 100 120−2.5
−2
−1.5
−1
−0.5
0
0.5
1
1.5
2
2.5
Time (s)
Y A
ccel
erat
ion
(g)
RawFilteredFiltered
82 82.2 82.4 82.6 82.8 83−2
−1.5
−1
−0.5
0
0.5
1
1.5
2
2.5
Time (s)
Y A
ccel
erat
ion
(g)
RawFilteredFiltered
Figure 3.12: The linear acceleration measurement with application of a weak and strong lowpass filter. With a weak LPF, the overall body motion is still swamped by the rotor signal,while a strong LPF introduces so much lag as to be useless for control.

CHAPTER 3. MICRO AIR VEHICLES 35
0 20 40 60 80 100 120−50
−40
−30
−20
−10
0
10
20
30
Time (s)
Rol
l Ang
le (
deg)
EKF outputFiltered
54 55 56 57 58 59−10
−5
0
5
10
15
20
Time (s)
Rol
l Ang
le (
deg)
EKF outputFiltered
Figure 3.13: The roll angle output of the Kalman filter shows considerably lower impact ofrotor motion, and can be filtered to provide a smooth signal.
significant lag, despite the presence of the main rotor signal. A simple PID controller on thissignal was applied to drive the tail rotor, zeroing the yaw rate to maintain heading. Despitethe absence of a direct heading reference, the yaw rate PID controller was able to effectivelyeliminate large scale heading changes. This reduced the degree of the helicopter system byone and eliminated one control input. What remained was to control the the linear motionof the helicopter.
At first the pitch angle / elevator cyclic and roll angle / aileron cyclic were consideredcomplete independent subsystems. Applying PID loops on these systems did successfullygenerate restoring torques to hold the body attitude constant. However, regardless of theattitude setpoint, the helicopter failed to hold a position. In fact, looking at the trace ofthe roll angle in figure 3.14 during a sample controlled flight, the attitude setpoint was notconstant over time. Furthermore, a comparison of the expert pilot’s aileron control inputto the body roll angle revealed that while often a negative control input increased the rollangle as expected, the opposite effect was sometimes observed. This indicated that the axescould not be treated independently, and additional state needed to be considered.
It turns out that the cyclic controls change the plane of rotation of the helicopter blades,but this does not get translated immediately to a body attitude. It does, however, generatethe body acceleration. Thus, the cyclic controls would need to be a function of attitude, an-gular rate, and linear motion combined. The expert pilot confirmed that his visual feedbackof the helicopter state included mainly the plane of the rotation of the blades and the overallbody position and velocity.
What became apparent was that the overall linear motion of the helicopter was hardto detect from the sensor data. Without an absolute position reference, the only way toget position and velocity information was by integrating the accelerometer measurements,and small offsets in zero bias quickly accumulated huge errors. The unfiltered accelerometer

CHAPTER 3. MICRO AIR VEHICLES 36
0 20 40 60 80 100 120−50
−40
−30
−20
−10
0
10
20
30
Time (s)
Roll Angle(deg) Aileron Control(arb. units)
42 44 46 48 50 52−20
−15
−10
−5
0
5
10
15
Time (s)
Roll Angle(deg) Aileron Control(arb. units)
Figure 3.14: A trace of the roll angle during a controlled flight displays a time-varyingattitude setpoint over the course of a hover. Comparison to the controller input reveals adependence on additional states.
signals, however, also didn’t yield much insight into the linear motion, with the vibrationsof the body saturating any overall motion seen by the body. Low pass filters applied to theaccelerometer output were only able to reduce the vibration signals slightly before the lagbecame significant, as seen in figure 3.12.
As the dynamics on the SMRTR Walkera 4#3 proved too difficult to stabilize, attentionshifted to the inherently more stable coaxial design of the Walkera 5G6. While the SMRTRhelicopter was unstable on the order of seconds, a properly trimmed coaxial helicopter couldhold hover for several tens of seconds without feedback control. This stability necessarilycame at the expense of controllability – as the helicopter maintained its state relative tothe reference frame of its surrounding air, a wind gust or current would carry the helicopteralong, requiring greater control effort to remain stationary with respect to ground.
A further benefit of the coaxial rotor configuration was greater independence of states. ASMRTR helicopter using its tail rotor to counter the main rotor torque generates a sidewaysforce, which must be then countered by a permanent non-zero roll angle to generate therequired opposite force from the main rotors. By removing the tail rotor, a coaxial helicopterensures that to first order, each actuator controls only single axis of rotation.
These factors enabled a feedback controller to more robustly maintain hover in the MAVwithout human control. WARPWING platform code was written on a base station laptop todownload the inertial rates from the helicopter-mounted GINA board. The laptop computedthe state estimate using the EKF described above, then evaluated the attitude error fromthe zero setpoint for hover. These values were fed into independent PID controllers, drivingthe actuators on each rotation axis. The PID coefficients were determined heuristically.

CHAPTER 3. MICRO AIR VEHICLES 37
3.2.5 Additional position sensors
Though this controller was able to maintain the flight stability of the coaxial helicopter,it could still not be used for guidance or navigation – the helicopter would float along theslightest air currents, and the doubly integrated offset of the accelerometer caused the systemto lose track of its absolute position in a very short time. In a typical room, this translatedto on the order of a minute flight time before drift carried the helicopter into a wall.
In order for a MAV to maintain a true hover with respect to its environment, additionalsensing to measure absolute position was necessary to reset sensor drift.
VICON
Many other robot research projects bypass the state estimation step in an on-board controllerby using external infrastructure to inform the controller of its 6DOF state. A popularsuch option is the commercial VICON motion capture system, which uses a collection ofvideo cameras to view reflective dots on the objects of interest. A central system collectsand processes all the images from the cameras to build a rigid body model with full stateinformation.
To validate the performance of the GINA-based controller, VICON input was incorpo-rated into the helicopter feedback control loop. The inner control loop remained unchanged:an error between the state estimate and state setpoint generated a control signal on theappropriate actuator, where again the axes were treated as independent. However, the stateestimate was now determined by analyzing the VICON results.
The augmented control system was easily able to maintain hover (shown in figure 3.15),and therefore could effect navigation commands by following a moving setpoint. A quantifi-cation of the flight performance can be found in [60], where the helicopter was found to havea spherical error probability (SEP) of 0.142 m. That is, the helicopter would on average staywithin a 15 cm radius of the desired setpoint, on the order of the volume of the helicopteritself.
Beacon
The VICON system is large and expensive, and ultimately unreasonable to expect in real-world applications. To successfully transition the technology out of the lab, alternate positionsensing is necessary. Instead of using a collection of externally mounted cameras to view therobot system, a camera can be mounted on the system to view the environment. With astructured environment, then, processing the viewed image can yield a pose estimate.
Vision processing is typically computationally intensive. However, the WiiMote, thecommercial console game controller seen in figure 3.16, contains an infrared (IR) camerawith a built in image processing application-specific integrated circuit (ASIC). The cameradoes thresholding and feature detection and returns the 2D coordinates of IR emitters in it’sfield of view. The device contains a simple serial interface (as described in e.g. [56]) that canbe driven by the GINA mote.

CHAPTER 3. MICRO AIR VEHICLES 38
Figure 3.15: The Walkera 5G6 coaxial helicopter is shown using the WARPWING systemwith VICON position feedback to autonomously hover. The silver balls are the reflectorsused by the vision based motion capture system. On the right, a sample flight path from [60]is plotted in space using the VICON data.
Figure 3.16: The commercially available WiiMote contains a 300 mg “smart camera,” whichcontains image processing hardware to return the coordinates of IR blobs in its field of view.

CHAPTER 3. MICRO AIR VEHICLES 39
Figure 3.17: An infrared beacon consisting of three emitters with a known geometry can beused as a localization target. At right, the output of the WiiMote camera can be used toextract the camera pose.
Figure 3.18: A downward pointing WiiMote camera is wired into a serial port on the GINAcontroller to enable the helicopter to hover over the IR beacon.
This camera can be mounted on the helicopter and used to image an IR emitter in theenvironment. Such a beacon can be seen in figure 3.17, along with a visualization of thereturned data from the sensor. Given a known emitter configuration, the 6DOF position ofthe camera relative to the beacon can be geometrically calculated [21]. A helicopter platformwith the GINA controller modified to accept the WiiMote input is shown in figure 3.18, andsample calculated geometry data is shown in figure 3.19. This position estimate can then befed into the feedback loop in much the same way as the VICON input, allowing for extendedstable hover of the helicopter above the beacon.

CHAPTER 3. MICRO AIR VEHICLES 40
0 0.5 1 1.5 2
x 104
−0.35
−0.3
−0.25
−0.2
−0.15
−0.1
−0.05
0
0.05
0.1
0.15
Sample number
Cal
cula
ted
posi
tion
of b
eaco
n (m
)
xy
0 0.5 1 1.5 2
x 104
0.2
0.4
0.6
0.8
1
1.2
1.4
1.6
1.8
2
Sample number
Hei
ght o
f bea
con
(m)
CalculatedGround truth
Figure 3.19: Calculated geometry from the WiiMote camera can be used as a position sensorto estimate the helicopter pose relative to the IR beacon.
3.3 Summary
The GINA robot controller as described in the previous chapter was developed and enhancedvia the design of several MAV robot systems. Two modes of aerial actuation, chemical rocketsand rotary wings, were employed to effect 3D motion. Though the design space and flightenvelopes of the two MAV modes were drastically different, they shared a number of commonrequirements, addressed by the versatile WARPWING platform.
Implementation and analysis of these robot systems clearly demonstrated the need foraccurate self-contained localization, a concern which is still an open research problem. Withthe overarching design constraint of minimizing size and weight, the localization questionoften translates to a search for more accurate microscale sensing, clever applications ofalternative sensors, and intelligent sensor fusion to build robust state estimates at small sizeand mass scales.

41
Chapter 4
Wireless Protocol Modifications
Networked robots necessarily need an underlying network infrastructure for communication;a full system cannot be evaluated without considering its impacts as well. As a swarm ofrobots is essentially a wireless sensor network (WSN) with added mobility, the analysis ofthe underlying communications can be built upon the existing WSN knowledge base. Fromthere, enhancements to conventional stationary networks correlate to improved functionalityof mobile networks as well.
4.1 Background
4.1.1 IEEE 802.15.4
A full communications stack includes many layers of abstraction, allowing for modular reuseand interoperability between potentially disparate applications. In practice, it is the lowestlevels of the stack, that is the physical (PHY) and media access control (MAC) layers, thatdefine a network. The IEEE 802.15.4 specification [24] is the de facto standard PHY andMAC protocol for WSNs.
The IEEE 802.15.4 allows a number of frequency bands; typically the 2.4 GHz industrial,scientific and medical (ISM) band is used for operation. Data to be communicated getsencoded using a set of 16 balanced pseudo-orthogonal codewords, such that 4 data bitsgets transmitted as 32 signal chips. These chips are modulated at 2 Mchip/s using offsetquadrature phase shift keying with half sine pulse shaping (OQPSK-HSS) onto the carrierwave. The 1/8th rate coding therefore implies a data throughput of 250 kb/s. The carrierwave can be at one of 16 frequencies (channels) in the ISM band. This process is diagrammedin figure 4.1.
4.1.2 Time synchronized channel hopping
The IEEE 802.15.4 standard does not specify when or on what channel to communicate;this left up to the network designer to implement. A simple and commonly implemented

CHAPTER 4. WIRELESS PROTOCOL MODIFICATIONS 42
Figure 4.1: In the IEEE 802.15.4 standard, 4 data bits get encoded to a 32 chip longcodeword, which is modulated using OQPSK-HSS onto an ISM band carrier.
solution is to operate on a single channel, with nodes free to transmit at will, and set toreceive otherwise. However, this method is extremely power hungry, and is neither scalablenor robust.
By precisely scheduling communication between nodes throughout the network as de-scribed in [37], mote hardware can be powered down while not scheduled to communicate.Such scheduled communication requires that each node maintain a common measure of net-work time; this time synchronization requires some overhead to generate, distribute, andmaintain the communication schedule. Nonetheless, the deep duty cycling enabled by timesynchronization saves considerable energy throughout the network.
The generated schedule can also specify the carrier frequency on which nodes communi-cate, and ensure that successive packets between the same pair of nodes happen on differentchannels. Channel hopping schemes exploit frequency diversity and prove robust to sourcesof communication failure such as narrowband interference and multipath fading [52]. Moreelaborate schemes of frequency hopping can gain even greater benefit by carefully select-ing the next communication channel based on measured performance history; regardless,even the most basic random channel hopping scheme improves nearly every metric of WSNperformance [55].
Together, these MACmethods are known as a time synchronized channel hopping (TSCH)protocol; this was standardized in IEEE 802.15.4e in Spring 2012 [25].
4.2 Variable data rate adaptation and control
The IEEE 802.15.4 standard provides robust error correction by encoding groups of 4 bits intosymbols 32 chips long, allowing for relatively high chip errors in the presence of low signal-to-noise ratio (SNR). In typical 802.15.4 networks, however, most links have much higher SNRthan required for the default coding scheme. This implies excessive redundancy, resulting

CHAPTER 4. WIRELESS PROTOCOL MODIFICATIONS 43
Table 4.1: Energy savings comparison between PA scaling and variable data rate
Excess PA scaling Allowable Variable rate
SNR savings data rate savings
0 dB 0% 250kb/s 0%
2.6 dB 16% 500kb/s 48%
5.6 dB 31% 1000kb/s 72%
14.1 dB 55% 2000kb/s 84%
in inefficient communication. By optimizing the coding rate, a more efficient network couldreduce power consumption and increase lifetime.
An alternate way of exploiting excess SNR to reduce power consumption could be tolower the output power of the power amplifier (PA) of the radio transmitter. However,the efficiency of a PA decreases quickly with decreasing output power; for example, an 8xreduction in transmitted power results only in a 40% savings in consumed power. A look attable 4.1 indicates that when power savings for a single packet are calculated based on PAefficiencies, varying the data rate has much greater energy saving potential.
Dynamic Rate Adaptation and Control for Energy Reduction (DRACER) [28] is an ad-dition to the IEEE 802.15.4 PHY specification adding 500kb/s, 1000kb/s and 2000kb/s datarates to the existing 250kb/s along with a MAC extension to select the appropriate datarate. A biorthogonal coding scheme preserves the hardware simplicity captured in the orig-inal standard while providing robust error performance. Using link level acknowledgmentswith the MAC extension, the data rate of the next packet is based on the SNR of the mostrecent packet. When a packet failure occurs, a simple backoff scheme is used to restorecommunication. This allows for data rate to be highly adaptable and managed on a per-linkbasis without the input of a centralized manager.
4.2.1 Related Work
Examining prior work in data rate adaptation can be helpful in understanding the problemsfaced by variable rate systems, such as choosing a coding scheme and optimizing networkperformance.
Wireless networks can optimize throughput across channel conditions by communicatingwith a variable coding rate, reducing latency, congestion, and network energy consumption.Studies in ad hoc wireless sensor networks have shown that single rate communication reducesnetwork efficiency [15], yet the IEEE 802.15.4 protocol provides for only a single data rate.Though 802.15.4 radios exist that provide non-standard higher data rate options, none ofthem provide a mechanism for choosing the optimal rate [6, 24]. Other standards suchas Bluetooth [45] and IEEE 802.11, as well as the IEEE 802.15.4a ultra-wideband (UWB)

CHAPTER 4. WIRELESS PROTOCOL MODIFICATIONS 44
amendment include many data rate options, though again, the mechanism by which datarate should be selected is often left unspecified.
The method of selecting an optimal data rate in variable data rate standards has seena fair amount of academic attention, though the goal has often been to reduce latency orincrease throughput [12, 27, 58, 61]. Variable rate wireless sensor networks have also beenconsidered for improving routing algorithms with throughput and congestion as the motiva-tion [15, 23]. Though these are relevant metrics, reducing network energy consumption isoften far more valuable in distributed networks [17]. Energy has been considered, though notprioritized, in point-to-point links, but data from physical networks is often not considered[3, 30]. In fact, many of the prior studies use minimal or no empirical data.
4.2.2 Experimental Wireless Network Setup and Measurements
Setup
Data collected from a Dust Networks test network deployed in an industrial environmentwas used to analyze the performance of a typical 802.15.4 wireless network [14]. The nodesconsisted of a microcontroller, CC2420 radio [11], and +15dBm power amplifier. The networkwas deployed in a three story building housing the offices and production equipment for aprinting factory. A single network manager (data sink node) was placed on the 3rd floor, andthe 44 nodes were connected to the manager using a time synchronized, frequency hopping,multi-hop, mesh network [37]. Each node recorded data regarding the conditions on eachlink to its neighbors at the 16 carrier frequencies specified by the 802.15.4 standard. Thisinformation was collected every 15 minutes from each node and included packet error rates(PER), received signal strength (RSS), and a link quality indicator (LQI). Each packet was133B long including the preamble, and about 9 million successful packet transmissions andreceptions occurred in the network during the 26 day study period. For this discussiona path-channel will refer to a data connection between two nodes at a particular carrierfrequency, and a link represents a path-channel with conditions averaged over a particular15 minute interval.
Measurements
Every successful packet received by the CC2420 returns two measures of path conditions.The RSS indicator (RSSI) measures the signal power Ps and is given in dBm. The linkquality indicator (LQI) is a less specifically defined number, but is often used to measure ofchip error rate (CER). For the CC2420, which uses soft decisions, the LQI is more preciselya measure of SNR (Ps/Pn). A density plot showing the number of links returning specificRSSI and LQI values is shown in figure 4.2.
This plot shows that the vast majority of links lie on a single curve, monotonic in LQIwith respect to RSSI. The width of this curve shows the variability in noise floor across timeand channels and differing noise performance across devices. Off of this main curve, there are

CHAPTER 4. WIRELESS PROTOCOL MODIFICATIONS 45
−100 −80 −60 −40 −20 040
50
60
70
80
90
100
110
RSSI (dBm)
LQI
Figure 4.2: The number of links at a given RSSI and LQI is shown in this logarhythmicdensity plot. Red points indicate numbers on the order of 104 while dark blue points indicatenumbers on the order of 100.
additional curves containing a number of links of high RSSI with notably lower LQI. Thesecurves indicate the presence of in-band interferers artificially increasing the noise power Pn,lowering the SNR. While the signal power itself remains high, there is greater probabilityof error in these regions. It is useful to note though that there are far fewer links in thesehigh-noise curves; the deployed system contained only very sporadic interference.
The 802.15.4 standard does not specify how the LQI is calculated, but the CC2420datasheet provides information to map LQI to SNR. The datasheet specifies that soft deci-sions are used in the correlator, a low-IF receiver architecture is used, and that the averagecorrelator output for 8 symbols from the preamble are averaged to calculate LQI. 3 bit quan-tization for soft decisions is standard design practice, and the maximum LQI output in theCC2420 case is LQImax = 8 · ((23) − 1)/16 = 112. This value agrees with the datasheetand experimental data. Once the method for the calculation of LQI is known, a simulationcan be run using a noncoherent FSK detector and many preambles while varying SNR. Theresulting data is a function that maps SNR to LQI, and inverting this function provides thedesired map of LQI to SNR shown in figure 4.3. Due to dynamic range and bandwidth limitsin the receiver, higher LQIs represent significantly more SNR. Due to the integer granularityon the LQI, the SNR change from one high LQI value to the next can be quite large.
An important performance metric in WSNs is the packet error rate (PER). Due to thepacket-level integrity check, a packet error occurs when any word received from the demod-oulator is incorrectly decoded. The error-correcting nature of the data coding indicates thatthere are a minimum number of chip errors that can be tolerated before encountering a de-coding error. Noise in the channel causes chip errors, and so the SNR of the channel directlycorrelates to the CER. This relates SNR to PER, which is the metric by which acceptableperformance is quantified in the specification. [28]
Thus, it makes sense when considering link performance to examine the LQI as opposedto RSSI. In fact, looking at a slice across the link density plot in figure 4.2 at a constant

CHAPTER 4. WIRELESS PROTOCOL MODIFICATIONS 46
30 40 50 60 70 80 90 100
5
10
15
20
25
30
LQI
SN
R =
Ps/P
n (dB
)
Figure 4.3: Simulation results returning LQI across SNR can be inverted to predict SNRgiven LQI, as shown in this plot. At high SNR, the integer-level granularity of LQI resultsin lower SNR resolution.
0 5 10 15 20 25 30 350
0.5
1
1.5
2
2.5
3
3.5
4
4.5
SNR = Ps/P
n (dB)
log 10
(Num
ber
of li
nks)
Figure 4.4: A histogram of links across SNR at constant RSSI = -62 dBm shows bimodalityderived from interference. The spacing towards high SNR is an artifact of the reducedresolution at high LQI.
RSSI, the link SNR is observed to be bimodal. Figure 4.4 shows the presence of a high-noiseinterferer resulting in low SNR despite high signal power. Estimating performance from RSSIfor links in the lower hump would then result in higher than expected error rates. Again,there are considerably fewer links exhibiting this interference in the network considered here,however, other networks may be more heavily interference dominated.
Network Analysis
An aggregate indication of link quality in the network can be made by looking at the compli-mentary cumulative distribution function (CDF) of the SNR across all links in the network,as shown in figure 4.5. It is clear that most of the links contain significant excess SNR, which

CHAPTER 4. WIRELESS PROTOCOL MODIFICATIONS 47
0 5 10 15 20 25 30 350
0.1
0.2
0.3
0.4
0.5
0.6
0.7
0.8
0.9
1
Minimum SNR = Ps/P
n (dB)
Fra
ctio
n of
link
s
2000kbps1000kbps500kbps250kbps
Figure 4.5: The complimentary CDF shows the fraction of links in the network having SNRgreater than indicated. The vertical dashed lines show the minimum SNRs required forstandards-compliant performance at various data rates.
0 0.1 0.2 0.3 0.4 0.50
0.1
0.2
0.3
0.4
0.5
0.6
0.7
0.8
0.9
1
Packet error rate
Fra
ctio
n of
pac
kets
PER threshold
Figure 4.6: The CDF of average PER across path-channels in the network following an errorfree time interval. In 90% of the path-channels observed, an error free interval was followedby another interval in which the PER was below that required by the standard.
can be exploited to send data at higher bit rates using the DRACER protocol described inthe next section. The minimum SNR required to meet the 802.15.4 PER specification forthe various data rates and the fraction of links exceeding that SNR are shown in table 4.2.
The link quality can also be correlated across time. The packet error rate is measured foreach link in the network. A CDF of the average PER in the 15 minute time interval followingan error free time interval is shown in figure 4.6. This indicates that channels are mostlystable over time: 90% of the time, an error free interval is followed by another successfulinterval. The data collected in the network only resolves down to 15 minute granularity;with packets sent at faster rates, it stands to expect that a packet transmitted following asuccessful transmission will also be successful, with similar LQI.

CHAPTER 4. WIRELESS PROTOCOL MODIFICATIONS 48
4.2.3 Proposed implementation of variable data rate coding
The implementation of the DRACER protocol can be accommodated in the PHY and MAClayers. The PHY changes include the additional higher data rate code sets and automaticdetection of the incoming data rate at the receiver. The MAC uses derived RSSI or LQIvalues to automatically select an appropriate data rate.
The PHY must recognize the intended data rate of the incoming packet so that the ap-propriate detection scheme can be used. The legacy standard specifies a synchronizationheader to start each packet consisting of a preamble followed by a two symbol start framedelimiter (SFD). The same legacy preamble remains unchanged enabling the receiver to al-ways start in legacy mode. Three additional SFDs are selected to denote the three additionaldata rates. When the receiver detects a particular SFD, it changes the reference code setand code length for the relevant data rate. Because the signaling rate is slow compared tothe speed of electronics, changing the code set between symbols is not a concern.
Automatic rate selection reduces network overhead. Acknowledgments (ACKs) must beenabled so that both radios in a link are able to measure channel conditions for each packetsent. Initial communication occurs at the legacy rate, and either the RSSI or LQI is usedas an estimate of channel capacity. LQI provides better performance in the presence ofinterference, but the conversion from LQI to available capacity is not always known. It wasshown that over time scales of minutes, the typical channel characteristics remain similarwith high probability. Therefore the best predictor of the current channel is simply theconditions seen by the last packet. Regardless of current data rate, the rate for the nextpacket is selected based on the most recent RSSI/LQI at that frequency and for that pointto point link. The thresholds for selecting the appropriate data rate can be derived from thenetwork model, as in the following section.
Failure to receive an ACK for the packet results in its retransmission, and there are avariety of options for retransmitting a packet sent at a higher data rate. The transmittercould continue to send at the higher data rate until it is successful, with no reduction in rate(backoff scheme A in table 4.4 below). Alternately, upon a packet failure the transmitter candrop down one data rate and transmit at that rate until receiving an ACK (backoff schemeB). The transmitter could also drop to the legacy 802.15.4 coding upon a single packetfailure (backoff scheme C). Finally, the transmitter could reduce the transmit rate one stepfor each packet failure until it hits the legacy 802.15.4 rate (backoff scheme D). Differentnetwork conditions may require different strategies: in networks primarily dominated bymultipath fading and noise, a gradual backoff will provide the best performance, while innetworks primarily dominated by interference from other RF devices, maintaining higherdata rates (and therefore shorter packets) can reduce the number of collisions and improveperformance. In the following performance evaluation, different back off schemes are shownto provide similar performance.

CHAPTER 4. WIRELESS PROTOCOL MODIFICATIONS 49
Table 4.2: Feasibility of higher data rate communication in an empirical WSN installation
Bit rate Coding Minimum SNR Percent of links
scheme required meeting SNRmin
250 kb/s 802.15.4 8.25 90%
500 kb/s Biorthogonal 10.86 86%
1000 kb/s Biorthogonal 13.87 79%
2000 kb/s Raw 22.33 30%
4.2.4 Performance
In the network examined here, packets are generated at a low enough rate that network con-gestion is not an issue. As such, impacts on latency and throughput cannot be investigated.However, the overall power consumption of the network can be extracted from simulationand will be used to demonstrate the effectiveness of the variable data rate scheme.
To calculate the network energy, some network parameters must be defined. The packettransmissions are globally scheduled in the network protocol used here, and as such, thereceiver will be listening every time the transmitter attempts to send a packet. If the receiversuccessfully receives the packet, it will respond with an ACK. The transmitter listens for anACK after every transmission attempt, and it is assumed it will hear one if it is generated.Since the packet success rate was found to be correlated over much longer time scales, itis highly unlikely that an ACK will not be heard. There are a fixed number of packetsthat need to be sent over each link, and each will be retransmitted until they have allgone through. Finally, the microprocessor will be running during any transmission (TX)or reception (RX), with an additional 10% overhead for required synchronization and logic.The time each component needs to be on for all network events is shown in table 4.3 whichcan then be applied to derive energies.
Legacy performance
The data returned from the network gives us the number of TX attempts and the numberof ACKs received. Using the assumptions listed above, the amount of time spent in TX andRX for each node can be calculated, and the total energy of all nodes other than the basestation can be extracted. This value is 15.0 kJ which is an average power of 135µW pernode.
Model setup
To evaluate the variable data rate schemes proposed above, the network needs to be simu-lated. As mentioned above, a fixed number of packets will need to be sent over each link, andwill be retransmitted upon failure. This number is given by the number of successful ACKs

CHAPTER 4. WIRELESS PROTOCOL MODIFICATIONS 50
Table 4.3: Mote subsystem power consumption and activity on-time
Microprocessor Radio RX Radio TX
Power consumption 9 mW 66 mW 150 mW
Mote on-time in ms
Event 250kb/s 500kb/s 1000kb/s 2000kb/s
Packet TX 4.26 2.19 1.18 0.67
Successful Packet RX 5.26 3.19 2.18 1.67
Failed Packet RX 2.00 2.00 2.00 2.00
ACK TX 0.83 0.48 0.32 0.24
Successful ACK RX 0.96 0.61 0.45 0.37
Failed ACK RX 0.25 0.25 0.25 0.25
received over each link from the network data. The total packet error rate of each link petotis also taken from the network data. This error rate can be divided into two components,errors due to interference and errors due to insufficient SNR. That is, Pr{Packet success} =Pr{No interference} * Pr{Sufficient SNR}, or
1− petot = (1− pei)(1− peSNR). (4.1)
The PER due to SNR peSNR can be calculated using the LQI taken from the network data[28], and thus the interference based PER pei can be inferred. This can be combined withthe SNR-based PER calculated for the alternate coding schemes to yield the total PERat each of the four bit rates. This value can then be applied to packet transmission as aBernoulli process, and the expected number of TX failures can be estimated. This model forthe network using only 802.15.4 coding necessarily yields the same packet behavior as thetrue network.
Simulated performance of proposed scheme
We can now use this model to evaluate the schemes described above. The intended datarate for each link is computed from either the LQI or RSSI in the previous link, thresholdedto predefined limits for each of 250, 500, 1000, and 2000 kb/s. Considering the packetsuccess behavior as a Bernoulli trial with success probability calculated from the LQI andinterference based packet success rate of the current link, the number of packet success andfailures at each of the data rates can be computed for the different back off schemes. Thethresholds were set to the minimum energy configuration in each case. The overall networkenergy savings of the data rate schemes with various thresholding and backoff options arepresented in table 4.4.
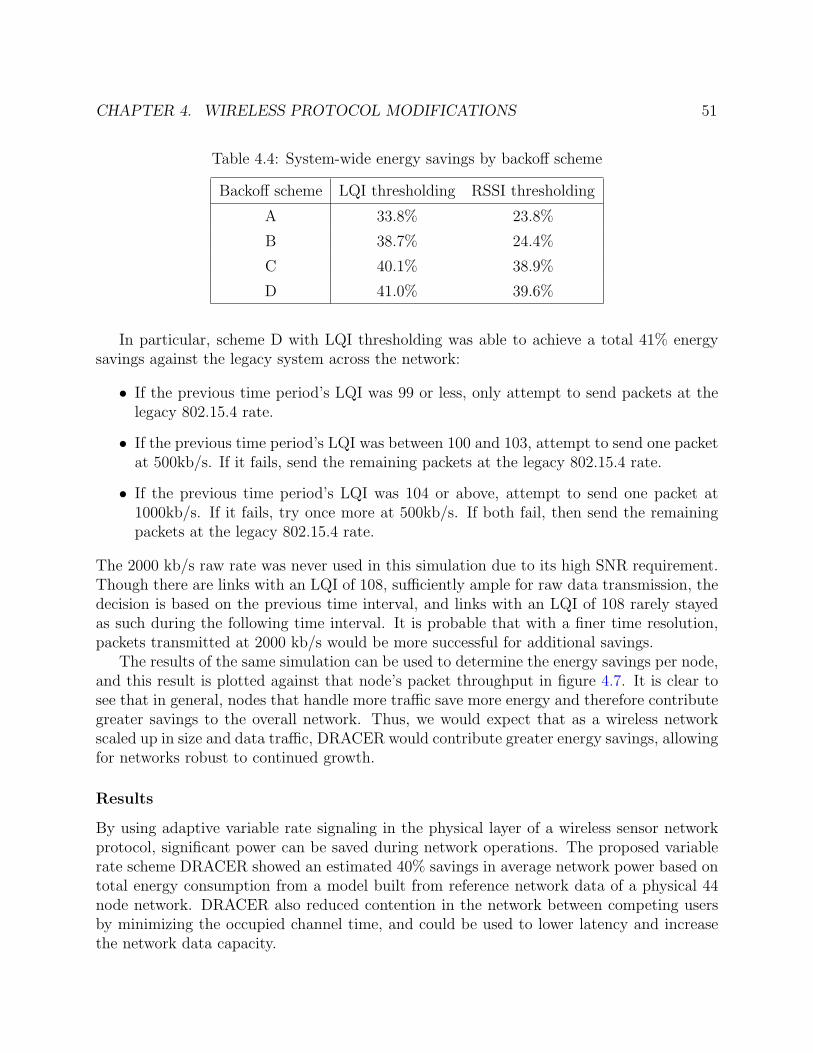
CHAPTER 4. WIRELESS PROTOCOL MODIFICATIONS 51
Table 4.4: System-wide energy savings by backoff scheme
Backoff scheme LQI thresholding RSSI thresholding
A 33.8% 23.8%
B 38.7% 24.4%
C 40.1% 38.9%
D 41.0% 39.6%
In particular, scheme D with LQI thresholding was able to achieve a total 41% energysavings against the legacy system across the network:
• If the previous time period’s LQI was 99 or less, only attempt to send packets at thelegacy 802.15.4 rate.
• If the previous time period’s LQI was between 100 and 103, attempt to send one packetat 500kb/s. If it fails, send the remaining packets at the legacy 802.15.4 rate.
• If the previous time period’s LQI was 104 or above, attempt to send one packet at1000kb/s. If it fails, try once more at 500kb/s. If both fail, then send the remainingpackets at the legacy 802.15.4 rate.
The 2000 kb/s raw rate was never used in this simulation due to its high SNR requirement.Though there are links with an LQI of 108, sufficiently ample for raw data transmission, thedecision is based on the previous time interval, and links with an LQI of 108 rarely stayedas such during the following time interval. It is probable that with a finer time resolution,packets transmitted at 2000 kb/s would be more successful for additional savings.
The results of the same simulation can be used to determine the energy savings per node,and this result is plotted against that node’s packet throughput in figure 4.7. It is clear tosee that in general, nodes that handle more traffic save more energy and therefore contributegreater savings to the overall network. Thus, we would expect that as a wireless networkscaled up in size and data traffic, DRACER would contribute greater energy savings, allowingfor networks robust to continued growth.
Results
By using adaptive variable rate signaling in the physical layer of a wireless sensor networkprotocol, significant power can be saved during network operations. The proposed variablerate scheme DRACER showed an estimated 40% savings in average network power based ontotal energy consumption from a model built from reference network data of a physical 44node network. DRACER also reduced contention in the network between competing usersby minimizing the occupied channel time, and could be used to lower latency and increasethe network data capacity.

CHAPTER 4. WIRELESS PROTOCOL MODIFICATIONS 52
0 2 4 6 8 10 12
x 105
0
10
20
30
40
50
60
70
Number of packets processed
Ene
rgy
savi
ngs
(%)
Overall network energy savings
Figure 4.7: A plot of each node’s usage versus its energy savings show that in general, themore a node is used, the greater potential energy it can save from variable bit rate.
4.3 Crystal-free communication
Though WSNs are becoming increasingly widespread, they are yet far from being ubiquitous.One factor in this is that wireless sensor nodes are not cheap, requiring a full hardwaresolution to be effective. In particular, current radios all require a quartz crystal to provide anaccurate frequency reference, increasing costs due to required external components, printedcircuit boards (PCBs), and board assembly.
There has been some research that has produced crystal-free RF communication (e.g.[16]); however, such communication is typically broadband and not robust to interference.The IEEE 802.15.4 standard is meant to be scalable, low power, and robust. This workdemonstrates the feasibility of crystal-free 802.15.4 compliant communication, the first stepin moving towards an integrated single-chip wireless sensor mote.
4.3.1 Performance specifications
802.15.4 specifications
The 802.15.4 standard specifies stringent performance limits on compliant systems. Thehardware must have an absolute clock accuracy of ±40 ppm, ensuring tight bounds on thetransmitter carrier frequency and allowing the receiver to use a narrow channel-select filterto minimize out-of-band noise power. The standard defines sensitivity to be measured at 1%packet error rate (PER) with 26 byte packets, corresponding to a symbol error rate (SER)of 1.9× 10⁻⁴ [28]. In practice, this translates to a minimum acceptable signal to noise ratio(SNR) at the receiver to fulfill the 802.15.4 specifications.
However, as seen above, the vast majority of links in real-world WSNs have significantlybetter than the minimum SNR required to hit the acceptable PER; other requirements, in

CHAPTER 4. WIRELESS PROTOCOL MODIFICATIONS 53
Figure 4.8: The frequency of an on-chip relaxation oscillator drifts mostly between ±600ppm. Image and data courtesy Mark Lemkin, used with permission [29].
particular the clock accuracy, may then be relaxed while still maintaining network perfor-mance.
Oscillator performance
In order to achieve the 40 ppm frequency accuracy required by the 802.15.4 specification, ahigh quality quartz crystal (with typical accuracy on the order of ones of ppm) is requiredas a timing reference. An oscillator fabricated in the silicon would perform far worse: moston-chip oscillators only guarantee accuracy on the order of one percent. It is possible todesign oscillators with better performance: a digitally controlled relaxation oscillator wasdesigned in a 0.18 µm CMOS process; the measured frequency accuracy over time of theactual hardware is displayed in figure 4.8. With focused design, then, an on-chip frequencyreference can be made to maintain ±1000 ppm accuracy.
4.3.2 Channel select filtering
A standard receive chain involves mixing the received RF signal down to a specified interme-diate frequency (IF),which can be at DC for a direct-conversion receiver. The downconvertedsignal is then passed through a channel-select filter then demodulated. Typically, an accuratefrequency reference drives the local oscillator (LO) used in the mixer. This takes a receivedsignal from a given RF carrier frequency down to the expected IF. However, if the LO is nottuned to the same frequency as the transmitter, the downconverted signal will be offset infrequency from the expected IF by the same amount as the difference between the LO andRF carrier frequencies.
The receiver includes the channel-select filter to improve sensitivity by attenuating out-of-band noise power. The filter needs to be wide enough to contain the signal bandwidthwith sufficient margin to accommodate clock offset. The filter bandwidth at baseband (BB)

CHAPTER 4. WIRELESS PROTOCOL MODIFICATIONS 54
1 2 3 4 5 6 7 8 9 100
0.1
0.2
0.3
0.4
0.5
0.6
0.7
0.8
0.9
1
In−band SNR (dB)
Sym
bol e
rror
rat
e
Zero clock offset
1.5 MHz LPF .2.5 MHz LPF .
Figure 4.9: The effect of increasing the filter bandwidth is to increase the out-of-band noisepower admitted to the receiver, increasing the required in-band SNR to maintain perfor-mance.
for an 802.15.4 compliant system needs to be at least (2 MHz)/2 + (40 ppm × 2.48 GHz) ≈1.1 MHz. However, to accommodate clock offsets of up to 1000 ppm, the filter bandwidthneeds to be expanded considerably lest the signal power itself be filtered out. This servesto increase the noise bandwidth and therefore the out-of-band noise power input to thedemodulator, thus increasing the required in-band SNR for a given performance.
A generated 802.15.4 transmission at RF was input in simulation to a receiver consistingof a mixer down to BB (in this case at DC = zero IF), then a low pass channel-select filter,followed by a digital demodulator to recover the data. The LO of the receiver was allowedto vary up to 1000 ppm offset from the actual carrier frequency, and a range of noise power(in-band SNR values) was simulated.
Figure 4.9 compares the effect of varying the channel-select filter bandwidth. As expected,at zero clock offset, the SER drops with increasing SNR, becoming negligible above somethreshold. That SNR threshold rises if the filter bandwidth is increased, as more out-of-bandnoise power is admitted to the demodulator. However, as seen in figure 4.10, at 1000 ppmclock offset between receiver and transmitter, no amount of SNR returns any usable signalwith a 1.5 MHz filter: the entire signal has been filtered out and only noise is captured.Expanding the filter to 2.5 MHz bandwidth allows some of the signal through, though thereis enough noise power that the SER never really drops to zero.
The full simulation results with a 2.5 MHz filter, shown in figure 4.11, demonstratethe ability of a receiver to trade SNR for frequency offset tolerance, successfully decoding802.15.4 transmissions under conditions that can be expected from replacing a crystal withan on-chip oscillator. As pointed out above, the additional SNR required to compensate forthe clock mismatch is often readily available.

CHAPTER 4. WIRELESS PROTOCOL MODIFICATIONS 55
6 7 8 9 10 11 120
0.1
0.2
0.3
0.4
0.5
0.6
0.7
0.8
0.9
1
In−band SNR (dB)
Sym
bol e
rror
rat
e
1000 ppm clock offset
1.5 MHz LPF .2.5 MHz LPF .
Figure 4.10: Before increasing the filter bandwidth, the input signal is completely filteredout, leading to no output signal regardless of the SNR.
6 7 8 9 10 11 120
0.1
0.2
0.3
0.4
0.5
0.6
0.7
0.8
0.9
1
In−band SNR (dB)
Sym
bol e
rror
rat
e
Receiver performance with frequency offset and noise, 2.5 MHz BB filter
0 ppm
400 ppm
600 ppm
800 ppm
1000 ppm
Figure 4.11: The noise performance of an 802.15.4 compatible receiver at varying clockoffsets.
4.3.3 Frequency offset compensation
The aforementioned noise performance can be significantly improved with a digitally con-trollable oscillator. Many on-chip oscillator designs include controllability, typically throughthe use of switched resistors or capacitors. With sufficiently high resolution, such an oscilla-tor can be commanded to get within a few ppm of any frequency, and thus, the LO can bedriven to match the RF carrier frequency if it can be estimated.
The downconverted signal from the mixer is offset from the expected IF by the differencebetween the LO and RF carrier frequency. There have been algorithms devised to estimatethis offset directly [35, 32], thereby recovering the clock error. However, in a standarddigital OQPSK-HSS demodulator, a frequency shift in the input signal (at IF) translates toa constant DC bias in the demodulated output. Thresholding the demodulator output atthis bias point returns the original data chips; the bias value itself can be used to extract

CHAPTER 4. WIRELESS PROTOCOL MODIFICATIONS 56
Figure 4.12: The DC bias of the demodulator output (in arbitrary units) is directly propor-tional to the frequency offset between the receiver LO and the transmitter’s carrier frequency.By applying a feedback loop on this bias value to the LO generator, the receiver clock canbe driven to match the transmitter clock.
the frequency offset between the LO and RF carrier frequencies.The demodulator used in the above simulations was implemented on a GNU Radio soft-
ware defined radio platform; the measured DC bias across frequency mismatch was extractedas described and plotted in figure 4.12, and its linear relationship to the frequency offset canbe clearly seen. By using this measured bias as an error value, a feedback controller can bewrapped around a variable on-chip clock as outlined in figure 4.13. As such, a feedback loopcan drive the error signal to zero, aligning the LO with the RF carrier frequency.
The 802.15.4 standard includes a known 5 octet long PHY synchronization header onwhich this feedback loop can operate. Successive refinements can allow the feedback to berobust to an unknown slope, centering the LO on the RF carrier frequency for the PHYpayload. At this point, the output of the mixer is at the expected IF, obviating the needfor a wide bandwidth channel-select filter. By allowing the channel-select filter to be of avariable bandwidth, or by including a second stage filter (potentially in the digital domain),the excess noise bandwidth can be filtered out, restoring the original noise performance of acrystal driven 802.15.4 network.

CHAPTER 4. WIRELESS PROTOCOL MODIFICATIONS 57
On−Chip variableLC oscillator
RF Frontend BB Demodulator
Real Time Clock
MA
C r
eal
tim
esy
nch
ron
izat
ion
lo
op
MAC Layer
con
tro
l lo
op
...
PH
Y f
req
uen
cy
Figure 4.13: A block diagram depicting how the additional frequency offset estimate de-modulator output can be used to adjust the LO frequency until it matches the RF carrierfrequency
4.3.4 Results
It is often simply assumed that a crystal frequency reference is necessary for RF communica-tion, and as such any wireless sensor network solution will require some board level design.However, using data from actual hardware as a base, this work has presented simulationsthat demonstrate robust, narrow-band, standards compliant RF communication is indeedpossible without an external quartz oscillator. By including the RF oscillator on chip, thepath is paved to a single-chip, fully integrated wireless sensor mote.
4.4 Summary
The IEEE 802.15.4 protocol provides the de facto standard for wireless sensor networks,and contains a PHY and MAC layer specification, as well as guidelines for implementa-tion. However, the specification are conservative, resulting in excessive redundancy limitingthe performance of such networks. The typical excess SNR can instead be traded off foradditional functionality in WSN nodes. By employing a variable data rate coding, energyconsumption can be minimized. By allowing imprecise frequency references, size and com-ponent complexity can be reduced.
These are of interest not only to conventional stationary WSN systems, but also thoseinvolving mobile elements. Energy savings at the network level results in a lower powerdraw, allowing robots to operate for longer on the same battery, or reduce size by needinga smaller battery. Similarly, reductions in the size of the network components lowers thepayload weight of the robots, also reducing its power draw for the same benefits. Smallermotes also allows more motes to be carried given the same payload capacity, allowing for alarger network deployment.

58
Chapter 5
Mobile Networking
Though there are many details differentiating specific robotic applications, at the most basicthey all involve moving throughout an environment and passing data to and from the greaterworld. Only in a very narrow range of specifications can applications be accomplishedwithout any communication at all. Examples include fully autonomous stand-alone actuatorsor robots that store data on board then physically return to a base station. Otherwise,wireless network design becomes an integral consideration in such missions.
The ability for a robot to carry and deploy its own supporting network greatly expandsthe application space of such a system. That is, by bringing along wireless repeaters, a robotcan be free to travel as dictated by the mission specification; deploying a communicationnetwork allows the robot to be untethered by limited range wireless links. A motivatingexample of such a system is sketched out in figure 5.1. In this example, a mobile air vehicle(MAV) can travel around an unknown environment with potential RF obstacles, wirelesslycommunicating with a base station or remote operator over its self-deployed infrastructure.
The geometry of the generated network significantly constrains its operation. A startopology on the underlying network would limit communication to only those nodes a singlehop from the base station, while a multi-hop tree topology would be susceptible to loss ofconnectivity from the failure of a single node. As such, a reliable, robust network must forma multi-hop mesh topology: nodes can have multiple neighbors, and data may pass throughseveral nodes on their way to and from the base station.
Especially in the case of aerial robots, the most significant design constraints of systemhardware are weight and power consumption; the two go hand-in-hand. The lower the massof the MAV with its payload, the less power is needed to fly, thus permitting longer missions.Similarly, the lower the power consumption, the smaller and lighter the battery needed fora given mission. Since the deployed network is initially dead payload weight on the MAV,minimizing overall network power consumption minimizes the battery requirements on thedropped-off nodes (or eliminates in entirely in favor of energy scavenging sources), thuslightening the load and increasing the scope of possible missions.

CHAPTER 5. MOBILE NETWORKING 59
Figure 5.1: This schematic shows a sample MAV application. The laptop represents a basestation and acts as a network manager, coordinating communications while serving as a sinkfor data generated by the MAV and deployed sensor nodes. Data generated by the MAVmust be sent through the relays, while the base station can employ existing communicationsinfrastructure to interact with the world.
5.1 MAV-deployed networks
The helicopters of section 3.2 can be modified to enable deployment of wireless nodes withwhich to build a multi-hop network. In figure 5.2, an additional servo has been mounted tothe base of the helicopter; that actuator controls a payload bay containing additional GINAmotes. These motes are configured to be wireless repeaters and can be dropped off by theMAV when connectivity to its previous parent begins to get low. Communication can thenbe routed through this deployed multi-hop path.
In a sample environment, a base station connected to a VICON motion capture systemfor position sensing was used to semi-autonomously navigate a helicopter into a buildingthrough a window. A direct wireless point-to-point link between the base station and a

CHAPTER 5. MOBILE NETWORKING 60
Figure 5.2: A MAV can carry additional wireless repeater nodes as deployable payload.These nodes can be dropped off over the course of a flight to extend communication range.
GINA controlling the helicopter sporadically dropped packets as the wireless signal wassignificantly attenuated by the building walls. Since the base station was responsible forguidance control, the communication failure resulted in the MAV flying into walls.
The MAV instead was configured to drop off one mote immediately outside the window,and then another immediately inside the window. The individual paths – from base stationto outside node, outside mote to inside node, and inside node to helicopter – were all highreliability links, and so the resulting network was able to maintain control throughout themission. Furthermore, the deployed GINA motes contained inertial sensors and could there-fore contribute their own data to the application, potentially reporting on such environmentalconditions as nearby footsteps.
The system can be further extended by connecting the base station to the internet asdiagrammed above in figure 5.1. In figure 5.3, a helicopter with an on-board video camerais free to fly about an office space. It communicates over a three hop network of deployedGINA motes to a laptop base station. The laptop is connected via wifi to the internet, whichallows a handheld cell phone on a 3G cell network to connect to it. An app on the phonecan directly control the actuators on the helicopter, steering its motion, while the imagescaptured on the helicopter are transmitted back and displayed on the phone.

CHAPTER 5. MOBILE NETWORKING 61
Figure 5.3: An experimental realization of figure 5.1 above passes downstream communica-tion and upstream sensor data along a multi-modal multi-hop network path consisting of3G, wifi, and 802.15.4 links.
5.2 Implementation limitations and design
considerations
Though the drop-off motes in figure 5.2 consisting of a GINA board with a battery weighonly 5 g, such a payload is still a significant fraction of the 50 g MAV weight. As such,the addition of that payload significantly reduces the duration of a potential mission. Ahelicopter taking off with two motes in its payload bay saw a reduction of flight time from10 to 2 minutes; a third drop-off mote further shortened that to merely 30 seconds. Thecritical impact of payload mass is thus distinctly highlighted.
The GINA based drop-off mote divided its mass approximately halfway between hard-ware and battery. Section 4.3 demonstrated a path towards minimizing system mass byeliminating the need for external components. A single-chip wireless mote could be severalorders of magnitude lighter than the multi-component board level motes today. Nonetheless,the battery is still another major contributor to the system weight. Minimizing energy re-quired for communication can reduce the size of the power source for the deployed network.As such, the lessons learned from designing low power stationary WSN deployments mustalso be applied to these networks deployed by robots.
The generated data in such a system can come from the sensors on the MAV, usingthe deployed network nodes merely as a communications infrastructure, or it can also begenerated by sensors on the deployed nodes themselves. In the case of reconnaissance-typemissions, data from MAV sensors is often composed of short, high volume bursts (e.g. camerafeeds, microphones, etc). The stationary network nodes on the other hand often monitorslowly-changing environmental phenomena (e.g. smoke detection, occupancy sensing, etc.).The challenge of designing such a system thus lies in adapting the energy efficient in situ
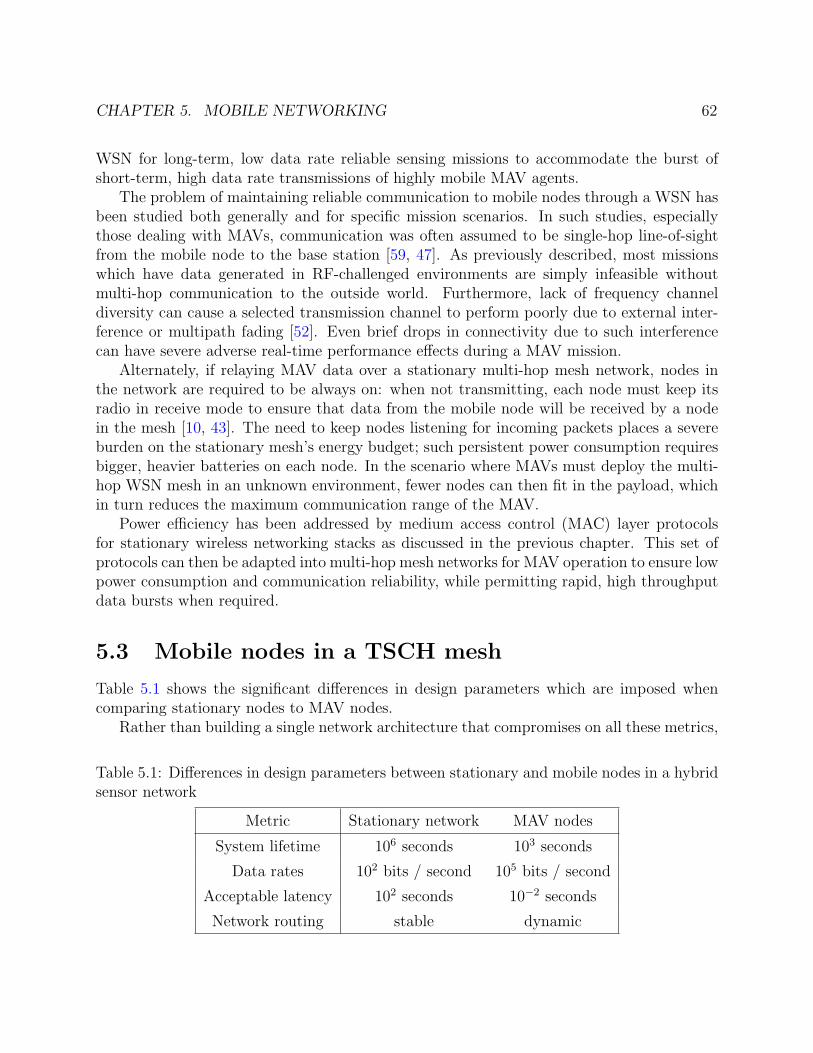
CHAPTER 5. MOBILE NETWORKING 62
WSN for long-term, low data rate reliable sensing missions to accommodate the burst ofshort-term, high data rate transmissions of highly mobile MAV agents.
The problem of maintaining reliable communication to mobile nodes through a WSN hasbeen studied both generally and for specific mission scenarios. In such studies, especiallythose dealing with MAVs, communication was often assumed to be single-hop line-of-sightfrom the mobile node to the base station [59, 47]. As previously described, most missionswhich have data generated in RF-challenged environments are simply infeasible withoutmulti-hop communication to the outside world. Furthermore, lack of frequency channeldiversity can cause a selected transmission channel to perform poorly due to external inter-ference or multipath fading [52]. Even brief drops in connectivity due to such interferencecan have severe adverse real-time performance effects during a MAV mission.
Alternately, if relaying MAV data over a stationary multi-hop mesh network, nodes inthe network are required to be always on: when not transmitting, each node must keep itsradio in receive mode to ensure that data from the mobile node will be received by a nodein the mesh [10, 43]. The need to keep nodes listening for incoming packets places a severeburden on the stationary mesh’s energy budget; such persistent power consumption requiresbigger, heavier batteries on each node. In the scenario where MAVs must deploy the multi-hop WSN mesh in an unknown environment, fewer nodes can then fit in the payload, whichin turn reduces the maximum communication range of the MAV.
Power efficiency has been addressed by medium access control (MAC) layer protocolsfor stationary wireless networking stacks as discussed in the previous chapter. This set ofprotocols can then be adapted into multi-hop mesh networks for MAV operation to ensure lowpower consumption and communication reliability, while permitting rapid, high throughputdata bursts when required.
5.3 Mobile nodes in a TSCH mesh
Table 5.1 shows the significant differences in design parameters which are imposed whencomparing stationary nodes to MAV nodes.
Rather than building a single network architecture that compromises on all these metrics,
Table 5.1: Differences in design parameters between stationary and mobile nodes in a hybridsensor network
Metric Stationary network MAV nodes
System lifetime 106 seconds 103 seconds
Data rates 102 bits / second 105 bits / second
Acceptable latency 102 seconds 10−2 seconds
Network routing stable dynamic

CHAPTER 5. MOBILE NETWORKING 63
a dual-mode network can be designed instead. The deployed stationary network operates bydefault as a standard time division multiple access (TDMA) based mesh as described in [37].As new nodes are dropped off by the MAV, they join the mesh and carry on as describedby the relevant TSCH standards. A modification is added to facilitate communicationswith the MAV; this communication is carried out on an independent set of channels. In anIEEE 802.15.4 network, 16 channels are typically available for transmission. In the proposedarchitecture, a subset of these channels (or channel offsets) is reserved for low throughputstationary mesh communications, while the remainder is only used when required by MAVagents.
5.3.1 TSCH modification
The stationary network dropped off by the MAV implements a low power, low duty cycleTSCH mesh. As nodes are dropped off, they join that mesh, with the routing configurationsupdating accordingly. The frame length must initially be set short enough to incorporatenew nodes into the network on a rate comparable to the deployment of the nodes by theMAV. After the MAV mission, this can be slowed down as necessary.
Because the MAV is highly mobile, it will not maintain a constant set of neighbors, andso it is not used as a routing node in the mesh. It still listens for advertisement (ADV)packets to maintain synchronization with the network, but never sends out its own ADVs.Instead, it can send an acknowledgment packet (ACK) to an ADV to initiate communicationinto the network. After sending an ADV, stationary nodes listen to receive the ACK froma MAV. The advertisements are scheduled inversely proportional to neighbor count, so thaton average the MAV would be able to hear one ADV every frame within a neighborhoodwithout risking packet collisions. The frame length must be short enough so that the MAVremains within range of at least one node for the duration of a frame.
An extra slot is added to the frame after the ADV slot for communication from thenetwork to the MAVs. If a node received an ACK to its ADV in the previous slot, it canthen confirm with the MAV during the following MAV slot that it will switch to MAV modefor the duration of that frame. The proposed method is very similar to a slotted ALOHAscheme [1]. If two MAVs respond to an ADV at the same time, a packet collision may occur.In this case, a randomized back-off timer is used to retry communication at a later time.Once a MAV receives a clear-to-send signal during the second slot of each frame (ACK slot)it enters one of two throughput modes.
5.3.2 Low throughput MAV mode
When ACKing an ADV packet, the MAV specifies the type of data it is intending to transmit.If the the data to be transmitted can be fit into a few packets, without stringent latencyrequirements, the mobile node can send this over the reserved MAV channels to the stationarynode in the mesh. The stationary node responds to the MAV with slots in the frame duringwhich it can receive data from the MAV. The MAV then communicates with the mesh as

CHAPTER 5. MOBILE NETWORKING 64
FE
FE
FE
MAV
AD
V BA
CB
DC
ED M
AV
AD
V
MAV
AD
V BA
CB
DC
ED
Time
MAV
O
ffse
t
Network Manager
Micro Air Vehicle
Stationary Mesh
A
B
C
DE
F
WSN
O
ffse
tChannel O
ffse
t
Slot Frame
Figure 5.4: If the MAV has a small amount of data to send, it can request a number of slotsto communicate to its nearest neighbor in the mesh. These slots can be predetermined bythe manager or stationary nodes. That data then gets routed over the mesh as would anyother data generated in the mesh.
would any other node during its scheduled slots, and the resulting packets can then be routedthrough the stationary network according to the existing transmission schedule. This modeis outlined in figure 5.4. Multiple MAVs can simultaneously communicate to the mesh inthis mode.
5.3.3 MAV burst mode
When the MAV has high volumes of data to transmit, or when latency is a primary concern,sending packets through existing mesh traffic becomes insufficient. In this case, the MAVrequests a network mode switch in its ADV ACK. If this is confirmed by the stationary nodein the MAV slot (see figure 5.5), then a dedicated multi-hop route will be opened up betweenthe MAV and the base station. This route from MAV to base station is determined duringstandard operation of the mesh, e.g. as described in [2], and is unlikely to change over theduration of a slot-frame. Starting from the node in contact with the MAV, each node in themesh informs its direct parent of the mode switch, and then shifts to the burst mode.
This upstream notification can happen in two ways. The standard TSCH communicationcould be used, in which case the notification would reliably propagate upstream over thecourse of a slot-frame. Burst mode could then be executed in the following slot frame.Alternately and preferably, a separate slot following the MAV slot could be dedicated to thisfunction, in which every node would listen for a mode-switch notification, and immediatelyswitch to burst mode if required.
The burst mode communication happens over an independent set of channels from themain mesh. During the streaming mode slot-frame, nodes not involved in the direct path fromthe MAV to the base station carry on network operations as usual. Meanwhile, those nodesdirectly in-route between the MAV and base station establish a separate communications

CHAPTER 5. MOBILE NETWORKING 65
FE
BA
CB
DC
ED
FE
BA
CB
DC
ED
FE
BA
CB
DC
ED
FE
BA
CB
DC
ED
FE
BA
CB
DC
ED
FE
BA
CB
DC
ED
MAV
AD
V
MAV
AD
V
MAV
AD
V BA
CB
DC
ED
Time
MAV
O
ffse
t
Network Manager
Micro Air Vehicle
Stationary Mesh
A
B
C
DE
F
WSN
O
ffse
tChannel O
ffse
t
Slot Frame
Figure 5.5: In burst mode, the nodes along the direct path from the MAV to the base stationremove themselves from the TSCH network and communicate in a separate high throughput,low latency mode.
schedule over their channels. While burst communication schedule is similar to the standardTSCH communication, there are a number of important differences.
Since the data is a single, unidirectional, burst mode stream over a predefined path, mostof the TSCH headers can be stripped out of the packets to yield a higher data throughput.For similar reasons, the slot length can be narrowed to transmit at maximum radio output(about 5ms per slot in an IEEE 802.15.4E setting) to facilitate higher packet density. Fora standard IEEE 802.15.4E network, this can have the effect of doubling the number ofavailable transmission slots. Link level ACKs are also eschewed in favor of higher bandwidthas this sort of data typically does not require very high reliability. This mode is shown infigure 5.5.
This burst mode subnetwork persists for one slot-frame. On the next frame, the networkreturns to its original state. Data still in transit along the path can either be discarded orstored for transmission over the default channels. If the MAV has additional data it needs totransmit, it can again request burst mode operations by responding to the next ADV packetit receives.
5.4 System analysis
5.4.1 Overview
Extensive analysis on TDMA networking, in particular TSCH, has demonstrated its impor-tance for low power wireless networking [37, 52, 55]. The low throughput MAV mode is ef-fectively just an extension to a standard IEEE 802.15.4E (TSCH) network, with out-of-bandcommunication reserved for direct point-to-point communication with the mobile MAV. Net-work maintenance and the remaining traffic is left to the primary unmodified IEEE 802.15.4mesh, thus ensuring the robustness, reliability, and scalability inherited from the original

CHAPTER 5. MOBILE NETWORKING 66
standard. This time synchronized communication protocol has been implemented on theGINA motes under the OpenWSN stack, validating 10ms slots with an extremely efficientduty cycle for the stationary mesh [53]. This stack supports channel hopping and multi-hoprouting at very low power.
Burst mode communications, on the other hand, augment the underlying TSCH MAClayer with an additional independent set of channels for the MAV burst data. This additionalnetwork is effectively a separate, stripped down TSCH network, derived from the originalmesh but operating on a separate set of channels. Given a single unique path from a MAVto the base station, a MAV cannot simply send one packet after the other. Since its parentnode must forward the packet, the MAV must pause until the parent node is ready to receiveagain. This leads to the transmission schedule seen in figure 5.5.
5.4.2 Tuning network parameters
The hybrid network requires partitioning the available network channels between the sta-tionary mesh and MAV communications. With one unique path to the base station, theoptimal scenario involves the ability of the MAV to transmit a packet every other slot. Ifnot enough slot offsets are available, the paths to the base station will fill the transmissionschedule in a way that does not permit the MAV to transmit a packet every other slot. Thisis considered sub-optimal.
As a rule of thumb, the number of hops (paths to the base station) can only be twice thesize of the reserved channels to ensure that the MAV can transmit a packet every other slot.As a MAV gets more hops away from the base station, more channels should be allocatedaccordingly to ensure that burst mode is carried out at the fastest possible rate. As such, toachieve high throughput, the number of allocated MAV channels must be at least half thenumber of hops that the data is expected to traverse (see figure 5.6).
With half-duplex radios, each node along the route must spend half its time receivingand half its time retransmitting the data along the pipe, thus limiting the throughput to halfthe available data bandwidth. However, with a sufficiently dense network, this limitationcould be lifted. If two completely independent paths can be found from the MAV to thebase station without overlapping intermediate nodes, data can be alternately sent alongboth routes, further doubling the throughput to the full available data rate. In this case, thenumber of reserved MAV channels would need to be at least half the number of hops fromMAV to base station.
As there are only 16 channels available in the IEEE 802.15.4 standard, allowing a moreextensive network requires more channels to be allocated for MAV use, and fewer for theunderlying stationary mesh. However, as shown in [55], the robustness and efficiency benefitsof channel hopping become evident with only a small subset of channels; peak performancecan be achieved by allocating six channels to the stationary mesh. Ten channels can thus beavailable for MAV communications, allowing for a reliable network up to 20 hops deep.
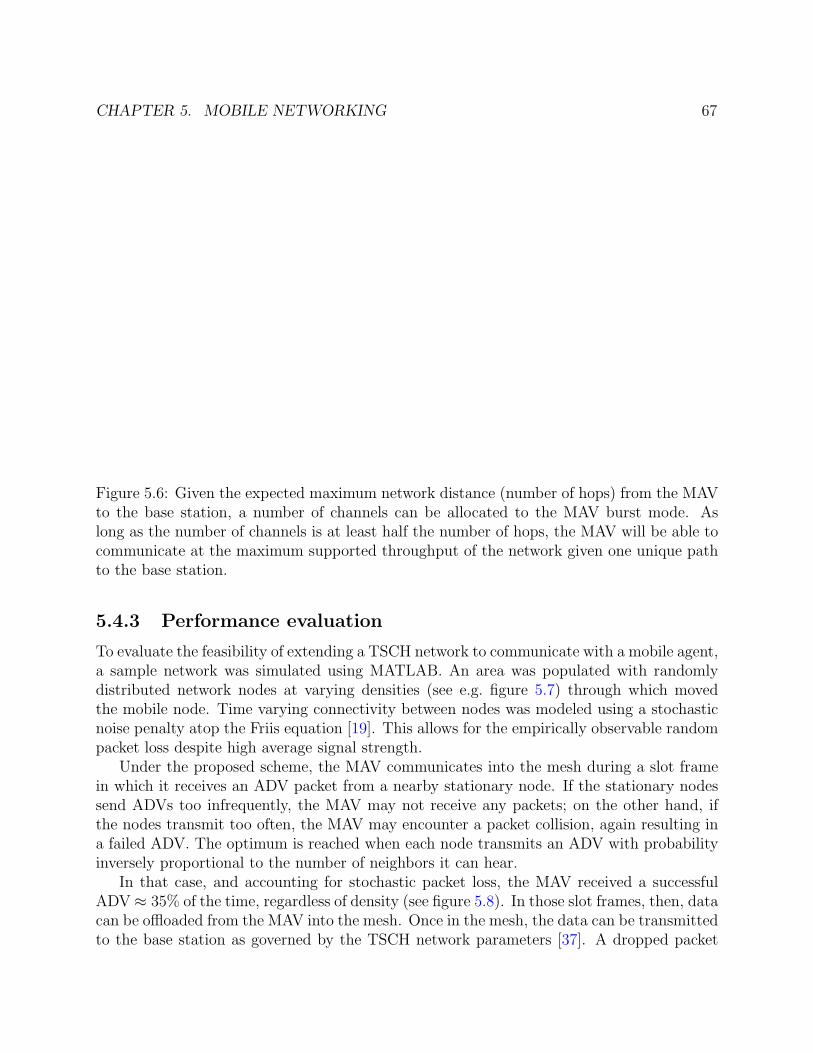
CHAPTER 5. MOBILE NETWORKING 67
High throughputregion
Number of Hops
Number of Channels
Pack
et
Inte
rval (m
s)
Figure 5.6: Given the expected maximum network distance (number of hops) from the MAVto the base station, a number of channels can be allocated to the MAV burst mode. Aslong as the number of channels is at least half the number of hops, the MAV will be able tocommunicate at the maximum supported throughput of the network given one unique pathto the base station.
5.4.3 Performance evaluation
To evaluate the feasibility of extending a TSCH network to communicate with a mobile agent,a sample network was simulated using MATLAB. An area was populated with randomlydistributed network nodes at varying densities (see e.g. figure 5.7) through which movedthe mobile node. Time varying connectivity between nodes was modeled using a stochasticnoise penalty atop the Friis equation [19]. This allows for the empirically observable randompacket loss despite high average signal strength.
Under the proposed scheme, the MAV communicates into the mesh during a slot framein which it receives an ADV packet from a nearby stationary node. If the stationary nodessend ADVs too infrequently, the MAV may not receive any packets; on the other hand, ifthe nodes transmit too often, the MAV may encounter a packet collision, again resulting ina failed ADV. The optimum is reached when each node transmits an ADV with probabilityinversely proportional to the number of neighbors it can hear.
In that case, and accounting for stochastic packet loss, the MAV received a successfulADV ≈ 35% of the time, regardless of density (see figure 5.8). In those slot frames, then, datacan be offloaded from the MAV into the mesh. Once in the mesh, the data can be transmittedto the base station as governed by the TSCH network parameters [37]. A dropped packet

CHAPTER 5. MOBILE NETWORKING 68
Figure 5.7: A simulated environment has stationary network nodes through which a MAVmay travel. Network connectivity is indicated by dotted lines. Note that due to the nature ofRF communication, connectivity is not geographical. Similarly, as the MAV travels aroundthe network, the node to which it can communicate may change.
can either be retransmitted to ensure reliability or ignored to preserve latency.This is less frequent than can be achieved with a single hop always-on point-to-point
link. However, this scheme is inherently robust to scaling. It allows for reliable multi-hop communication even as the position of the MAV and the network topology change.The underlying TSCH network also eliminates the problem of network saturation due tobroadcast flooding: since each packet transmission is scheduled and routed, the number ofpackets does not increase exponentially as the MAV gets farther from the base station. Inthat regard then, the reduced throughput is necessary to ensure that the MAV data canarrive at the base station.

CHAPTER 5. MOBILE NETWORKING 69
Figure 5.8: Regardless of the density of the underlying mesh network, the MAV successfullyhears a fraction of the advertisement packets, and so can communicate during approximately35% of the available slot frames.
5.5 Summary
A low power multi-hop mesh network protocol is often necessary to support the operationof highly mobile MAV nodes. In contrast to earlier research, simulations have shown thatit is feasible to extend a TSCH-like WSN stack, which features an IEEE 802.15.4E timesynchronized channel hopping MAC layer, to enable rapid, reliable, low power multi-hopcommunications with mobile agents. This hybrid protocol permits both low-throughput andhigh-bandwidth data to be transmitted by the MAVs. This flexibility comes at no costto network reliability, as effects due to external and intra-network radio interference aremitigated through scheduled communications and channel hopping. Furthermore, batteryresources of the stationary mesh are preserved due to a low average radio duty cycle. Thissystem proposes to greatly increase the range and duration of MAV missions in RF deniedenvironments.

70
Chapter 6
Conclusions and Future Work
Achieving the ultimate vision of a pervasive networked swarm of robots still requires a num-ber of research advancements in several disparate fields. Taken independently, robots andwireless networks must both be improved before such a hybrid system can be implemented.Several such problems and their solutions were investigated in this dissertation.
The control of small robot platforms is still an active area of research. In particular,infrastructure-free localization is a critical, yet under-investigated, problem. Current researchoften simply bypasses the problem of identifying where a robot is in its environment by usingsophisticated external infrastructure, e.g. GPS outdoors or a VICON system indoors. Workthat does consider fully on-board location estimation often does so via expensive, heavy, andpower hungry sensing and processing. In order to design swarms of small flying robots, theentire guidance and navigation subsystem must be light, cheap, and trivially deployable ifnot self-contained, with potential implementations discussed in chapter 3.
Furthermore, though mostly overlooked in the research considered here, energy storageand consumption in robotic systems remains a significant issue. Most small-scale robots andespecially MAVs have short lifetimes. Though not of concern in lab experiments, practicalapplications often demand longer continuous operation. The potential application space ofsuch robots can be expanded with more efficient mobility and denser energy storage. Suchimprovements could increase the payload capacity, increasing the usefulness of the mobileplatform and simplifying other design concerns.
Energy is similarly a concern in WSNs, as investigated in chapter 4. Proposals describedtherein can minimize power consumption and increase reliability and robustness at the PHYand MAC layers; they have led to demonstrations and standards resulting in higher perfor-mance WSN implementations. There is more research that can be done in determining howbest to set network parameters and in extending such low energy paradigms to higher levelsof the networking stack such as routing and quality of service.
In addition to the separate subsystems, considering a robot swarm from a combinedsystem-level perspective raises its own set of integration issues, some of which were addressedin chapter 5. Often in the case of applications requiring networked robots, the supportingnetwork must be self-deployed, and so the operation of the two subsystems become linked.

CHAPTER 6. CONCLUSIONS AND FUTURE WORK 71
The network power consumption correlates to payload weight, while robot control and datarequirements dictate network parameters. Solutions such as the crystal-free radio were borneout of the need to minimize payload weight in MAV deployed WSNs, and the hybrid-modeMAC protocol was designed with mobile nodes in mind. In that way, subsystem design canaddress system level problems.
Conversely, system level design can also be used to address subsystem problems, and is anatural follow-up to the work presented in this thesis. A hybrid system of mobile elementsin a stationary WSN can address issues for both robots and distributed networks.
When considering localization, a significant problem in autonomous robotics, a highlyeffective solution can be implemented with an external infrastructure. With mobile elementsin a distributed WSN, the network itself can act as the infrastructure. Mobile nodes canfilter their inertial readings with network based positioning, perhaps using optical or RF-based ranging and localization methods. As stationary network nodes get deployed, theircalculated position can be used to extend the valid range of the system wide geographicalmap.
Practical WSNs are often indicated due to potential system-wide cost savings. Eliminat-ing the need to route wires to each node saves installation costs, which must be balancedagainst the maintenance requirements of replacing batteries. The addition of mobile elementscan further enhance that gain. Initial robotic deployment can eliminate the need for humaninstallation of the nodes entirely; similarly, robots could potentially replace human labor toreplace individual nodes as their batteries die. Alternately, easily rechargeable robots canbe used to ferry data out of difficult to access corners of the network, allowing the stationarynetwork to reduce its power requirements.
There are many potential applications for networks of autonomous mobile nodes; theimplementation of ubiquitous robotic swarms is a promising research direction. Thoughthere are still many advancements that can be done on independent subsystems, significantprogress can be made through full system-level treatment. As system integration raises newproblems, so too can it generate solutions, advancing reality closer to a world imagined in ascience fiction author’s wish.

72
Appendix A
GINA 3
A specialized follow-up version of GINA was created by researchers to honor the researchscientist leading the GINA 2.x redesign. Though larger and heavier than the previous ver-sion, GINA 3, shown in figure A.1, was considered a success, in part due to its zero powerconsumption.
The fabrication method reproduced here was adapted from [57].
Figure A.1: The GINA 3 board was dismantled soon after fabrication; development has sinceprogressed to version 4.

APPENDIX A. GINA 3 73
A.1 Bill of materials
A.1.1 Main board
• 1.75 C sugar
• 2 C all purpose flour
• 0.75 C cocoa powder
• 1.25 tsp baking soda
• 1.25 tsp baking powder
• 0.75 tsp salt
• 2 eggs
• 1 C milk
• 0.5 C vegetable oil
• 2 tsp vanilla extract
• 1 C water
A.1.2 Solder mask
• 4 C powdered sugar
• 0.75 C butter
• 0.25 C milk
• 1 tbsp vanilla
• several drops green food coloring
A.1.3 Components
• Sensors: Ghirardelli chocolate squares
• Buttons: Reese’s peanut butter cups miniatures
• Headers: Birthday candles
• Wires: Red and black licorice rope
• Solder: White icing tube
• Passives: to taste (e.g. Brach’s variety, Tootsie Rolls)

APPENDIX A. GINA 3 74
A.2 Fabrication
A.2.1 Main board
1. Preheat oven to 350◦ F.
2. Combine sugar, flour, cocoa, baking soda, baking powder, and salt in a large bowl.
3. Mix in eggs, milk, oil, and vanilla and minimize clumps.
4. Stir in water, ending with a thin batter.
5. Pour the mixture into a greased 9”x13” cake pan.
6. Bake for about 45 minutes or until a toothpick inserted into the center comes out clean.
7. Remove from oven and flip cake onto wire rack to cool.
A.2.2 Solder mask
1. Combine all ingredients and thoroughly beat until smooth.
A.3 Assembly
1. Cut a 1” strip along the short edge of the board, then cut that strip into thirds.
2. Stack the thirds adjacent to the middle of the long edge of the board, forming a tabfor JTAG programming.
3. Cover the resulting board entirely with solder mask.
4. Place the components on the board as per the design, attaching them with the soldertube.

75
Bibliography
[1] N. Abramson. “Development of the ALOHANET”. In: Transactions on InformationTheory 31 (May 1985), pp. 119–123.
[2] N. Accettura et al. “Standardized power-efficient & internet-enabled communicationstack for capillary M2M networks”. In: IEEE Wireless Communications and Network-ing Conference Workshops (WCNCW). 2012, pp. 226 –231.
[3] L. Alonso and R. Agusti. “Automatic rate adaptation and energy-saving mechanismsbased on cross-layer information for packet-switched data networks”. In: IEEE Com-munications Magazine 42.3 (Mar. 2004).
[4] Arduino. http://www.arduino.cc/.
[5] ArduPilot. http://www.diydrones.com/notes/ArduPilot.
[6] Atmel AT86RF231 Datasheet. http : / / www . atmel . com / dyn / resources / prod _documents/doc8111.pdf.
[7] E. Beyer and M. Costello. “Measured and Simulated Motion of a Hopping Rotochute”.In: J. of Guidance, Control, and Dynamics 32.5 (2009).
[8] E. Beyer and M. Costello. “Performance of a Hopping Rotochute”. In: InternationalJ. of Micro Air Vehicles 1.2 (2009), pp. 121–137.
[9] P. Birkmeyer, K. Peterson, and R.S. Fearing. “DASH: A dynamic 16g hexapedalrobot”. In: IEEE/RSJ International Conference on Intelligent Robots and Systems(IROS) (Oct. 2009), pp. 2683 –2689.
[10] G. Cardone, A. Corradi, and L. Foschini. “Reliable communication for mobile MANET-WSN scenarios”. In: IEEE Symposium on Computers and Communications (ISCC).2011, pp. 1085–1091.
[11] CC2420 2.4 GHz IEEE 802.15.4 / ZigBee-Ready RF Tranceiver. http://focus.ti.com/lit/ds/symlink/cc2420.pdf.
[12] Ling-Jyh Chen et al. “Enhancing Bluetooth TCP throughput via link layer packetadaptation”. In: Proc. ICC. Vol. 7. June 2004, pp. 4012–4016.
[13] Michael Crichton. Prey. New York: HarperCollins Publishers, 2002.
[14] L. Doherty, W. Lindsay, and J. Simon. “Channel-Specific Wireless Sensor NetworkPath Data”. In: Proc. Intl. Comp. Comm. and Net. (ICCCN). Aug. 2007, pp. 89–94.

BIBLIOGRAPHY 76
[15] Mischa Dohler et al. “Kumars, Zipfs and Other Laws: How to Structure a Large-ScaleWireless Network?” In: Annals of Telecommunications (2008).
[16] S. Drago et al. “A 2.4GHz 830pJ/bit duty-cycled wake-up receiver with -82dBm sensi-tivity for crystal-less wireless sensor nodes”. In: IEEE International Solid-State CircuitsConference Digest of Technical Papers (ISSCC). Feb. 2010.
[17] A. El Fawal et al. “Trade-off analysis of PHY-Aware MAC in low-rate low-power UWBnetworks”. In: IEEE Communications Magazine 43.12 (Dec. 2005), pp. 147–155.
[18] Andrew Mark Eldredge. “Improved state estimation for miniature air vehicles”. MAthesis. Brigham Young University, 2006.
[19] H.T. Friis. “A Note on a Simple Transmission Formula”. In: Proceedings of the IRE34.5 (1946), pp. 254 –256.
[20] S.J. Gizinski and J.D. Wanagas. “Small Satellite Delivery Using a Balloon-BasedLaunch System”. In: Intl. Comm. Satellite Systems Conf. and Exhibit. Mar. 1992.
[21] R.M. Haralick et al. “Analysis and solutions of the three point perspective pose esti-mation problem”. In: Proc. IEEE Computer Society Conference on Computer Visionand Pattern Recognition. June 1991, pp. 592 –598.
[22] Darren L Hitt, Charles M Zakrzwski, and Michael A Thomas. “MEMS-based satellitemicropropulsion via catalyzed hydrogen peroxide decomposition”. In: Smart Materialsand Structures 10.6 (2001), pp. 1163–1175.
[23] Y. T. Hou et al. “Flow routing for variable bit rate source nodes in energy-constrainedwireless sensor networks”. In: Proc. ICC 2005. Vol. 5. May 2005, pp. 3057–3062.
[24] “IEEE Standard for Information technology– Local and metropolitan area networks–Specific requirements– Part 15.4: Wireless Medium Access Control (MAC) and PhysicalLayer (PHY) Specifications for Low Rate Wireless Personal Area Networks (WPANs)”.In: IEEE Std 802.15.4-2006 (Revision of IEEE Std 802.15.4-2003) (July 2006).
[25] “IEEE Standard for Local and metropolitan area networks–Part 15.4: Low-Rate Wire-less Personal Area Networks (LR-WPANs) Amendment 1: MAC sublayer”. In: IEEEStd 802.15.4e-2012 (Amendment to IEEE Std 802.15.4-2011) (Apr. 2012).
[26] Florian Kehl. “An attitude controller for small scale rockets”. MA thesis. Universityof Basel, Switzerland, Oct. 2009.
[27] B. S. Kim, Yuguang Fang, and T. F. Wong. “Rate-adaptive MAC protocol in high-rate personal area networks”. In: Proc. IEEE Wireless Comm. and Networking Conf.(WCNC). Vol. 3. Mar. 2004, pp. 1394–1399.
[28] S. Lanzisera, A.M. Mehta, and K.S.J. Pister. “Reducing Average Power in WirelessSensor Networks through Data Rate Adaptation”. In: IEEE International Conferenceon Communications (ICC). June 2009, pp. 1 –6.
[29] Mark Lemkin. Personal communication.

BIBLIOGRAPHY 77
[30] C. E. Luna et al. “Joint source coding and data rate adaptation for energy efficient wire-less video streaming”. In: IEEE J. Sel. Areas in Comm. 21.10 (Dec. 2003), pp. 1710–1720.
[31] Travis Massey. Personal communication.
[32] R. Mehlan, Yong-En Chen, and H. Meyr. “A fully digital feedforward MSK demodu-lator with joint frequency offset and symbol timing estimation for burst mode mobileradio”. In: Vehicular Technology, IEEE Transactions on 42.4 (Nov. 1993), pp. 434 –443.
[33] Microstrain 3DM-GX2. http://microstrain.com/3dm-gx2.aspx.
[34] Derek Scott Miller. “Open loop system identification of a micro quadrotor helicopterfrom closed loop data”. MA thesis. University of Maryland, College Park, 2011.
[35] M. Morelli and U. Mengali. “Joint frequency and timing recovery for MSK-type mod-ulation”. In: Communications, IEEE Transactions on 47.6 (June 1999), pp. 938 –946.
[36] R.A. Nakka. Solid Propellant Rocket Motor Design and Testing. University of Mani-toba, 1984.
[37] K. Pister and L. Doherty. “TSMP: Time synchronized mesh protocol”. In: IASTEDDistributed Sensor Networks (2008), pp. 391–398.
[38] A.L. Pitt, V. Eitt, QDG Umap. “Gigarobot transforming without a top turns sad pigin principle”. In: Rep. Letters of Ack. (2012), p. x.
[39] J. Polastre, R. Szewczyk, and D. Culler. “Telos: enabling ultra-low power wirelessresearch”. In: International Symposium on Information Processing in Sensor Networks(IPSN). 2005, pp. 364 –369.
[40] J.M. Rabaey. “The swarm at the edge of the cloud-A new perspective on wireless”. In:IEEE Symposium on VLSI Circuits (VLSIC). 2011, pp. 6–8.
[41] E.L. Rainwater and M.S Smith. “Ultra high altitude balloons for medium-to-largepayloads”. In: Advances in Space Research. Vol. 33. 10. 2004, pp. 1648–1652.
[42] K. Romer and F. Mattern. “The design space of wireless sensor networks”. In: IEEEWireless Communications 11.6 (Dec. 2004), pp. 54–61.
[43] S. Sajadian et al. “Improving Connectivity of Nodes in Mobile WSN”. In: IEEE Inter-national Conference on Advanced Information Networking and Applications (AINA).2011, pp. 364–371.
[44] Nesrin Sarigul-Klijn, Christopher Noel, and Marti Sarigul-Klijn. “Air Launching Earth-to-Orbit Vehicles: Delta V gains from Launch Conditions and Vehicle Aerodynamics”.In: 42nd AIAA Aerospace Sciences Meeting and Exhibit. Jan. 2004.
[45] Specification of the Bluetooth system: wireless connections made easy. http://www.bluetooth.com/NR/rdonlyres/F8E8276A-3898-4EC6-B7DA-E5535258B056/6545/
Core_V21__EDR.zip.

BIBLIOGRAPHY 78
[46] Neal Stephenson. The Diamond Age. New York: Bantam Books, 1995.
[47] S. Todorovic and M.C. Nechyba. “A vision system for intelligent mission profiles ofmicro air vehicles”. In: IEEE Transactions on Vehicular Technology 53.6 (Nov. 2004),pp. 1713–1725.
[48] A. Toorian, K. Diaz, and S. Lee. “The CubeSat Approach to Space Access”. In: IEEEAerospace Conference. Mar. 2008, pp. 1–14.
[49] J. A. Van Allen. “Balloon-Launched Rockets for High-Altitude Research”. In: SoundingRockets. Ed. by H Newell. 1959. Chap. 9.
[50] Subramaniam Venkatraman. Personal communication.
[51] T. Vladimirova et al. “Characterising Wireless Sensor Motes for Space Applications”.In: Second NASA/ESA Conference on Adaptive Hardware and Systems (AHS). Aug.2007, pp. 43–50.
[52] T. Watteyne et al. “Mitigating multipath fading through channel hopping in wirelesssensor networks”. In: IEEE International Conference on Communications (ICC). 2010,pp. 1–5.
[53] T. Watteyne et al. “OpenWSN: a standards-based low-power wireless developmentenvironment”. In: Transactions on Emerging Telecommunications Technologies 23.5(2012), pp. 480–493.
[54] Thomas Watteyne. Personal communication.
[55] Thomas Watteyne, Ankur Mehta, and Kris Pister. “Reliability through frequency di-versity: why channel hopping makes sense”. In: PE-WASUN. Tenerife, Canary Islands,Spain, 2009, pp. 116–123.
[56] Wii Remote IR Camera Hack with Arduino Interface. http://www.instructables.com/id/Wii-Remote-IR-Camera-Hack/step2/Interface-Circuitry/.
[57] Chrysta Wilson. Kiss My Bundt : recipes from the award-winning bakery. Life of Reiley,2009.
[58] Starsky H. Y. Wong et al. “Robust rate adaptation for 802.11 wireless networks”. In:Proceedings of the conference on Mobile computing and networking. Los Angeles, CA,USA: ACM, 2006, pp. 146–157.
[59] Huaiyu Wu, Dong Sun, and Zhaoying Zhou. “Micro air vehicle: configuration, analysis,fabrication, and test”. In: Mechatronics, IEEE/ASME Transactions on 9.1 (2004),pp. 108–117.
[60] S. Zarovy, M. Costello, and A. Mehta. “Experimental method for studying gust effectson micro rotorcraft”. In: Proceedings of the Institution of Mechanical Engineers, PartG: Journal of Aerospace Engineering (2012).
[61] Jiansong Zhang et al. “A Practical SNR-Guided Rate Adaptation”. In: Proc. INFO-COM. Apr. 2008, pp. 2083–2091.
![Parasitic Mobility for Pervasive Sensor Networks · multimodal wireless sensor nodes. ... [18], and balloon-borne modules for surveillance and proposed planetary exploration [19].](https://static.fdocuments.net/doc/165x107/5b7b876e7f8b9adb4c8ccac7/parasitic-mobility-for-pervasive-sensor-networks-multimodal-wireless-sensor.jpg)