1 Project part-financed by the European Union INVENTING THE URBAN TRANSPORT SYSTEMS OF THE FUTURE.

Mobility andTransport
Transport in the European UnionCurrent Trends and Issues
April 2018
MOBILITY AND TRANSPORT
BACKGROUND INFORMATION
‘Transport in the European Union – current trends and issues’ is produced by the Directorate-General for Mobility and Transport (DG MOVE) of the European Commission for information puroposes and cannot be interpreted as an official position of the European Commission.
Any questions or suggestions relating to the analysis should be addressed to:
Rolf Diemer, Head of the Unit ‘Economic analysis and Better regulation’Florian Dittrich, European Semester coordinator in DG MOVE
European Commission, Directorate-General Mobility and Transport, B-1049 Brussels
Email: [email protected]
This report is published in English only.

Foreword | 1
Foreword Transport is a cornerstone of European integration and is firmly linked to the establishment of the Single Market, which promotes jobs and economic growth. As one of the first common policy areas of today’s European Union (EU), it was seen as vital for fulfilling three of the four freedoms of a common market as established in the Treaty of Rome in 1957: the free movement of individuals, services and goods.
Without smooth transport connections and networks, there would be no such movement. This is why EU transport policy has always focused on overcoming obstacles between Member States and creating a single European transport area with fair competition conditions for and between the different forms of transport: road, rail, air and waterborne.
The transport sector itself is not only a precondition for the functioning of the Single Market, it also constitutes a crucial sector of the economy on its own: in 2015, it represented some 9 % of the total Gross Value Added of the EU economy and 9 % of the total EU employment.
The sector is also important for the EU's international trade: in 2016, 17.2 % of the EU's total exports of services were transport related.
However, transport also generates negative societal effects such as accidents, greenhouse gas emissions, air pollution, noise and environmental effects. Overall, external costs due to transport have been evaluated to be approximately 4 % of GDP in 2011.
The EU transport policy of the 21st century has to address the challenges the sector is facing. It has to propose solutions that minimise negative effects, while unlocking the potential for transport to further enhance its contribution to growth and jobs in the EU.
The Commission has recently taken several policy initiatives which aim at helping the EU transport sector to become future-proof, more sustainable, innovative and remain competitive in a changing global environment.
Transport concerns us all as it affects the everyday lives of all EU citizens and companies. It also has a strong territorial dimension and is key to cohesion between regions of the EU.
Thus, transport policy has to address a broad range of economic, social and environmental aspects, which may vary between both countries and regions.
I am very pleased to present the first edition of this report. Its objective is to provide an overview of the main challenges transport is facing both at EU level and at the level of individual Member States. It sets out the key trends and issues for the single European transport area, the development of transport infrastructure network across EU countries and external costs of transport.
The fiches dedicated to each country reflect selected issues identified by the Directorate-General for Mobility and Transport as showcases for the first iteration of this exercise. They do not provide a complete inventory of all relevant transport issues in each Member State and are intended to be completed over time. Feedback and comments are therefore most welcome.
A key message that this report conveys is that the EU transport sector is at a crossroads. We need to roll out a performant infrastructure that provides sufficient capacity to our economy to fulfil its potential for creating jobs and growth, but also need to make sure that the sector remains competitive, provides innovative cost efficient transport solutions to its users and integrates different modes of transport.
Transport in the EU needs to follow a path of sustainable development that internalises external costs and the negative effects of transport without curbing mobility.
Henrik Hololei Director General DG Mobility and Transport
2 | Transport in the EU: Current Trends and Issues
Table of Contents
FOREWORD ....................................................................................................................................................................................... 1 TABLE OF CONTENTS ................................................................................................................................................................... 2 1. INTRODUCTION .......................................................................................................................................................................... 3 2. POLICY CHALLENGES: OVERVIEW OF PERFORMANCE IN THE EU COUNTRIES ............................................ 4
2.1. Sub-optimal market functioning ........................................................................................................................ 5
2.2. Infrastructure deficiencies ................................................................................................................................. 10
2.3. Low-emission mobility and negative externalities ................................................................................ 13
3. IDENTIFICATION OF POLICY LEVERS TO ADDRESS THE CHALLENGES ......................................................... 16 4. EXAMINATION OF POLICY STATE OF PLAY................................................................................................................. 19
4.1. Market access policies ......................................................................................................................................... 19
4.2. Investment in transport infrastructure ......................................................................................................... 20
4.3. Promoting a shift to low-emission mobility and addressing negative externalities .............. 20
5. OVERVIEW OF THE TRANSPORT SECTORS IN THE EU COUNTRIES ................................................................ 23
Belgium ................................................................................................................................................................................ 23
Bulgaria ................................................................................................................................................................................ 27
Czech Republic .................................................................................................................................................................. 31
Denmark .............................................................................................................................................................................. 35
Germany .............................................................................................................................................................................. 39
Estonia .................................................................................................................................................................................. 43
Ireland ................................................................................................................................................................................... 47
Greece ................................................................................................................................................................................... 51
Spain ................................................................................................................................................................................... 55
France ................................................................................................................................................................................... 59
Croatia .................................................................................................................................................................................. 63
Italy ................................................................................................................................................................................... 67
Cyprus ................................................................................................................................................................................... 72
Latvia ................................................................................................................................................................................... 76
Lithuania .............................................................................................................................................................................. 80
Luxembourg ....................................................................................................................................................................... 84
Hungary ................................................................................................................................................................................ 88
Malta ................................................................................................................................................................................... 92
Netherlands ........................................................................................................................................................................ 96
Austria................................................................................................................................................................................ 100
Poland ................................................................................................................................................................................ 104
Portugal ............................................................................................................................................................................. 108
Romania ............................................................................................................................................................................ 112
Slovenia ............................................................................................................................................................................ 116
Slovakia............................................................................................................................................................................. 120
Finland ............................................................................................................................................................................... 124
Sweden.............................................................................................................................................................................. 128
United Kingdom............................................................................................................................................................. 132
STATISTICAL ANNEX ............................................................................................................................................................... 136

Introduction | 3
1. Introduction Transport is a fundamental sector for and of the economy. It embraces a complex network of around 1.2 million private and public companies in the EU, employing around 10.5 million people1 and providing goods and services to citizens and businesses in the EU and its trading partners. Transport also provides mobility for Europeans, thus contributing significantly to the free movement of persons within the internal market.
Efficient transport services and infrastructure are vital to exploiting the economic strengths of all regions of the European Union, to supporting the internal market and growth, and enabling economic and social cohesion. They also influence trade competitiveness, as the availability, price, and quality of transport services have strong implications on production processes and the choice of trading partners. With such a central role, transport is by definition also inter-related with various policy areas, such as environmental and social policies.
The main challenges for the transport sector in the EU include creating a well-functioning Single European Transport Area, connecting Europe with modern, multi-modal and safe transport infrastructure networks, and shifting towards low-emission mobility, which also involves reducing other negative externalities of transport. From a social perspective, affordability, reliability and accessibility of transport are key. However, this has not been achieved across the board. Addressing these challenges will help pursue sustainable growth in the EU.
Recently, the Commission has taken several initiatives to foster the development of the Single European transport area, a policy that it has been pursuing for decades now. Progress towards this goal has been made, e.g. with:
the 4th Railway Package;
the Blue Belt initiatives for maritime transport;
the proposed Single European Sky II+ package
for aviation transport (still pending);
1 ‘EU transport in figures’ – DG MOVE statistical pocketbook 2017.
the NAIADES Programme to promote inland
waterways.
The Commission seeks to address shortcomings, particularly in the market integration of road transport, through a set of initiatives for a socially fair transition towards clean, competitive and connected mobility presented in its Low-emissions Mobility Strategy (adopted in July 2016) and subsequently in its Communication "Europe on the Move"2 of 31 May 2017. This Communication accompanies a series of legislative proposals (so-called "mobility package") the revision of the rules on access to the road haulage market, improved social legislation for road transport and a revision of the road charging rules.
On 8 November 2017, the Commission adopted a second set of proposals ("second wave of the mobility package"). They respond to the challenge of making mobility clean, competitive and connected through a combination of demand- and supply-side measures on low-emission mobility. These combine an enabling regulatory framework with actions to mobilise financial means, where needed, while ensuring consumer acceptance and safeguarding the social protection and employment dimensions.
In concrete terms, the proposals encompass a number of measures with the aim to enable a transition towards low and zero emission mobility, such as a reform of the Clean Vehicles Directive or a follow-up to the Action Plan related to the Alternative Fuels Directive.3
The shift towards low-emission mobility was already an objective in the Transport White Paper of 2011 and was supported by various initiatives. The 2016 Communication "A European Strategy for Low-Emission Mobility" highlights the areas on which Commission initiatives will focus:
digital mobility solutions;
fair and efficient pricing in transport (which
should better reflect negative externalities of
transport);
promotion of multi-modality;
2 COM(2017) 283. 3 COM(2017) 675.

4 | Transport in the EU: Current Trends and Issues
an effective framework for low emission
alternative energy;
roll-out infrastructure for alternative fuels;
interoperability and standardisation for electro-
mobility;
improvements in vehicle testing;
a post-2020 strategy for all means of road
transport, supported by research efforts and
investment.4
Additionally, in 2018 a "Multi-modal Year" will bring together relevant initiatives and events, including a 'European Single window' in maritime transport. As part of the second wave of the mobility package, the Commission is proposing a revision of the Combined Transport Directive5.
More details on the state of play of transport policies can be found in the 2016 White Paper implementation report6, in the staff working document accompanying the Communication "Europe on the Move"7 and in the Implementation report of the EU maritime transport strategy 2009-20188.
To help EU countries develop the trans-European transport network (TEN-T network), the EU adopted a Regulation in 2013 providing Union guidelines for transport investment (TEN-T guidelines). The Regulation establishes a legally binding obligation for the EU countries to develop the so-called "core" and "comprehensive" TEN-T networks.
In addition, the Regulation identifies projects of common interest and specifies the requirements to be complied with in the implementation of such projects. The Connecting Europe Facility (CEF) Regulation9, adopted in 2013, allocated a seven-year budget (2014-2020) of EUR 30.4 billion, of which EUR 24 billion are for the transport sector.
4 COM(2016) 501. 5 COM(2017) 648. 6 SWD(2016) 226. 7 SWD(2017) 177. 8 SWD(2016) 326. 9 Regulation (EU) No 1316/2013 of the European Parliament and of the Council of 11 December 2013 establishing the Connecting Europe Facility, OJ L 348, 20.12.2013, amended by Regulation 2015/1017 on the European Fund for Strategic Investments, the European Investment Advisory Hub and the European Investment project Portal, OJ L169, 25.6.2015.
These examples demonstrate the considerable opportunities provided by the European transport sector, but also the challenges it faces, notably in terms of digitalisation, innovation, global leadership and societal benefits. This is particularly true in the current situation of disruptive changes in technology (e.g. e-mobility) and mobility patterns (e.g. the sharing economy) which highlights both the challenges and the opportunities discussed in this note.
This note is structured as follows. Section 2 reviews the performance of EU countries in transport market functioning, in infrastructure quality and in the environmental impact of transport. Section 3 identifies the policies to address the challenges and reviews the approach taken at EU level. Section 4 examines the state of play of existing policies and takes stock of where EU countries stand in implementing these policies.
2. Policy challenges: overview of performance in the EU countries In the EU, the transport and storage sector employs around 11 million persons, accounting for more than 5% of total employment10 and almost 5% of GDP.11
However, the share of women employed in the transport sector is low. According to the Eurostat Labour Force Survey, in most EU countries, women represent around 20 % of the labour force in the transport sector (2016).
10 Eurostat Labour Force Survey, 2016 data, for NACE H: "Transportation and Storage". 11 Eurostat National Accounts, 2015 data, for NACE H: "Transportation and Storage".

Policy challenges: overview of performance in the EU countries | 5
Figure 1: Share and growth of employment of women in the EU-2812 transport sector (2008-2016)
Source: Eurostat Labour Force Survey. Some of the reasons, given by social partners, why women are underrepresented in the transport sector include:
a lack of appropriate work-life balance in shift
work;
workplace and equipment not being adapted
(e.g. lack of sanitary facilities for women, safety
clothing not available in female sizes);
insufficient targeted recruiting of women in a
sector that has the reputation of being
dominated by men;
a lack of training and life-long learning
opportunities.
The European transport sector provides ample growth opportunities, but significant challenges remain to fully exploiting these opportunities. Given that transport and logistics represent a sizeable share of company costs and of households’ expenditure, the provision of more efficient transport services and better logistics can affect citizens and businesses tangibly. For households in the EU it is estimated that transport accounts for roughly 13% of their total final consumption.
12 The countries covered by data in this factsheet are the EU-28, unless otherwise specified.
Improved infrastructure and optimised performance of multimodal logistic chains can help to reduce logistics costs.
For high-value added products and services produced in Europe, transport costs may not be a very significant proportion of total costs. However, the reliability of logistics is critical to the functioning of increasingly complex value chains. In order to seize transport-related growth opportunities and reduce costs related to transportation, a number of horizontal challenges need to be addressed. These can be grouped under three headings: market functioning, infrastructure and negative externalities.
2.1. Sub-optimal market functioning
The transport policies in the EU are characterised by divergent national priorities. Fragmentation of the transport market will continue to limit the quality of transport services in Europe and will leave growth potential untapped, unless European policy initiatives towards a Single Market for transport, such as the ones quoted above, are thoroughly implemented at national level.
In addition, gaps in the social legislation related to transport and divergent national practices have led to deteriorating social conditions for transport workers and may also worsen the quality of transport services. Market opening and social cohesion are thus intrinsically linked.
Rail transport in particular has been struggling to achieve its potential. This is despite its comparative advantages (notably speed and comfort for passengers and economies of scale for freight) over medium to long distances and the significant contribution it can make to both the decarbonisation of transport and socially inclusive mobility.
Rail freight services suffer from low quality and reliability. This is due to the lack of coordination in cross-border capacity offer, traffic management and planning of infrastructure works.
The creation of a Single European Rail Area requires major efforts to achieve technical interoperability and to ensure that rolling stock is able to run across national borders. In addition, standardisation of systems and equipment in its broader sense is
6 | Transport in the EU: Current Trends and Issues
crucial to gain efficiency and reduce costs. Specific EU legislation, such as the Technical Pillar of the 4th Railway Package, aims at promoting interoperability. The rules are implemented with the assistance of the European Union Agency for Railways (ERA).
The lack of effective competition may explain why in many EU countries rail transport has not developed customer-oriented services, innovative business models and costs/price reductions that can be witnessed after market opening in other transport modes. The degree of competition in the railway sector, measured as the total market share of all but the biggest railway companies, is low (see Figure 2). Although a low number of competitors may reflect the small size of a market, various barriers to entry still hamper the development of competition in rail.
The rail freight market has been fully open to competition since 2007. Between 2010 and 2015, the market shares of competitors continued to increase in most EU countries, most significantly in Belgium, Bulgaria, the Czech Republic, Germany and Hungary. Exceptions to this growth trend were Estonia and France.
In the rail passenger market, the market shares of competitors are lower and less diverse, and also depend on the degree of liberalisation, which varies across countries. In most countries incumbent rail companies have control over 80% of the market, except for Poland (48%), Sweden (67%), Italy (77%) and the United Kingdom (where there is no incumbent). In 10 countries there were still no alternative operators in 2015.
The 4th Railway Package is set to complete the market opening process by dismantling the remaining legal monopolies in domestic passenger
markets. It introduces the principle of competitive tendering for public service contracts (PSCs) and improves the way infrastructure is governed to create a non-discriminatory environment. However, until the package is fully implemented, important challenges remain to be addressed on the ground.
Rail passenger market opening has been pursued by several EU countries in advance of the legal deadlines imposed by EU law, to different degrees and with varying results. New commercial (open access) services have been introduced in the Czech Republic, Germany, Italy, Austria, Sweden and the United Kingdom. While the reasons for success or failure in operating a new rail business are diverse, a common trait is that, in the absence of safeguards against unfair practices, new entrants face serious obstacles.
In particular, new commercial operators still face discrimination in obtaining access to rail infrastructure and essential service facilities, such as stations and maintenance workshops, which are often owned and operated by incumbents. Incumbents may also engage in anti-competitive behaviour or rely on cross-subsidies to keep competitors out of the market.
In 2015, two thirds of all EU passenger rail services were provided under PSCs, particularly for regional and suburban traffic. This average hides significant differences across countries. In Denmark, Ireland, Greece, Croatia and Luxembourg, all passenger services are covered by PSCs. The use of competitive tenders for the award of these contracts is a key indicator of the degree of market opening. In the EU, the majority of PSCs are still awarded directly to incumbents. While the 4th Railway Package has introduced the principle of competitive tendering, it will take time (up to 2023) before the use of tenders is widespread.

Policy challenges: overview of performance in the EU countries | 7
Figure 2: Market share of all but the principal railway undertakings (2015)
Source: DG MOVE, Rail Market Monitoring Survey 2015, IRG Rail Annual Reports. Greece, Ireland, Lithuania, Luxembourg and Finland score 0 in both indicators. Passenger data: due to a methodological change in reporting, 2015 values are mostly estimated by DG MOVE. Not applicable to Cyprus and Malta.
In the road transport sector, the market for international (intra-EU) freight and passenger services has been entirely opened to competition, but domestic transport remains largely protected. On the freight side, "cabotage", i.e. domestic transport performed by foreign hauliers, is subject to restrictions. As a consequence, operators face difficulties in optimising their operations and one in two vehicles operating domestic transport outside of its country of registration runs empty.13
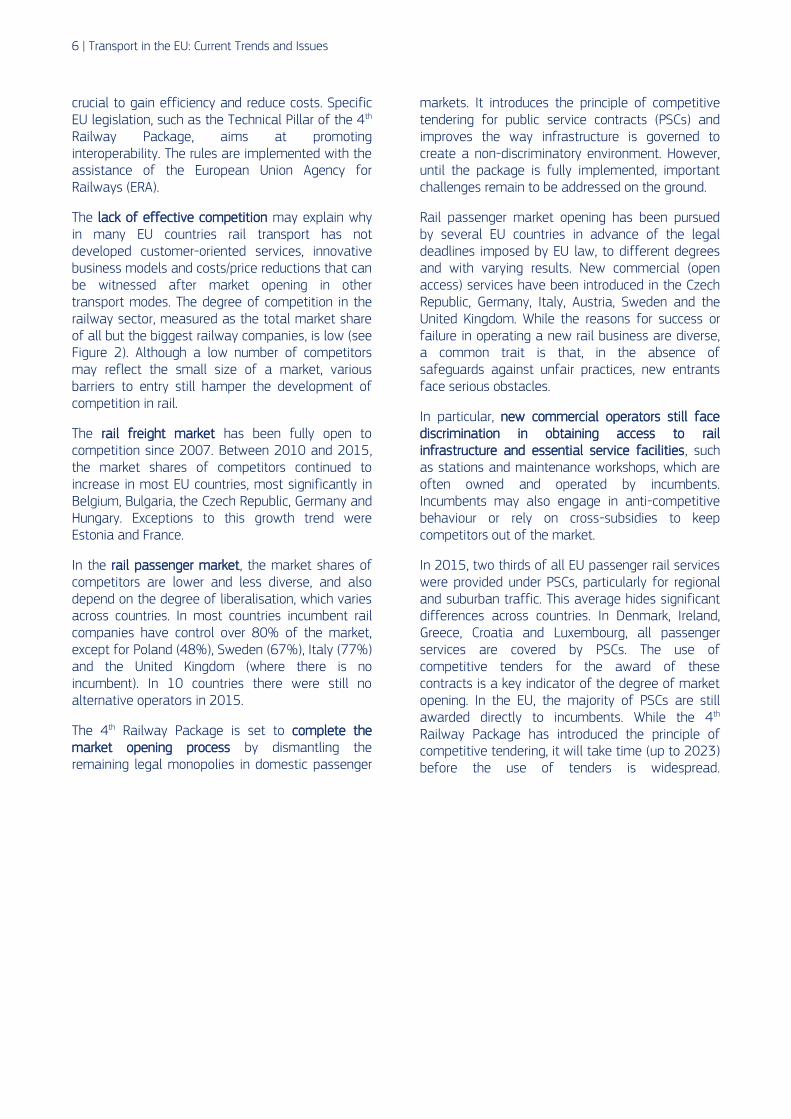
The performance of national hauliers can to some extent be compared by looking at the shares of home-based vehicles in exports and imports from other EU countries. Under certain conditions a similar distribution of the transport activities between hauliers from the importing and hauliers from the exporting country might be expected. In reality, however, this is rarely the case in the EU.
Hauliers from some of the new EU countries, e.g. Poland, Bulgaria, Croatia and Romania are largely dominating the transport operations in the external trade of their respective countries. This reflects low labour costs.
13 European Commission (2014), Report from the Commission to the European Parliament and the Council on the State of the Union Road Transport Market {COM(2014) 222}.
The relative competitiveness of hauliers from the new EU countries also shows in their share in cross-trade (transport between two countries neither of which is the country of registration of the haulier): they account for 80% of all cross-trade in the EU. At the other end of the spectrum, hauliers from countries such as Sweden, France, Italy, Belgium and Denmark appear to be less competitive and have a relatively low market share when it comes to carrying the exports and imports of their own economies. With a combined share of less than 2% in total activity, these countries are more or less absent from the cross-trade market.
8 | Transport in the EU: Current Trends and Issues
Figure 3: Share of home-based vehicles in tonne-km generated in exports to and imports from other EU-28 countries (%, 2016)
Source: Eurostat. Data for CY and MT are either not available or not reliable.
On the passenger side, access to the domestic market continues to be heavily restricted in several EU countries. They shield incumbent monopolists from competition. However, liberalisation of long-distance coach services has been progressing in various EU countries: Sweden in 2012, Germany in 2013, Italy in 2014 and France in 2015.
As part of the initiatives of the second wave of the mobility package, the Commission proposes a Directive on Access to Passenger and Coach Services. The main objective is to enhance the accessibility and competitiveness of inter-urban regular services and to further open this market.14
The liberalisation of the European aviation market, that celebrated its 25th anniversary in 2017, already benefited the aviation sector, as well as air passengers. One of the main problems affecting its performance is the fragmented EU airspace that leads to high operating costs for airlines, as it limits the optimisation of flight paths or duplicating costly functions. As a consequence, in 2014 the unit costs for providing air navigation services were around 35 % lower in the US than in Europe.15 Full
14 Regulation (EC) No 1073/2009 of the European Parliament and of the Council of 21 October 2009 on common rules for access to the international market for coach and bus services, and amending Regulation (EC) No 561/2006, OJ L 300, 14.11.2009. 15 Eurocontrol, US-Europe continental comparison of ANS cost-efficiency trends, 2014.
implementation of the Single European Sky (SES) is a constant challenge given the resistance from many EU countries, often driven by social concerns.
In addition, major European airports are likely to face a capacity crunch in the near future. It has been estimated that by 2035 there will be a surplus annual demand of some two million flights which European airports will be unable to accommodate due to capacity shortages. The Benelux countries, Germany and the United Kingdom risk having the highest unaccommodated demand in 2035.16 These two issues are seriously impeding the European aviation sector's ability to grow sustainably and compete internationally. The inability to grow and compete is causing congestion, delays and rising costs.
Challenges also include creating better market access and investment opportunities with non-EU countries and maintaining high EU safety, security and environmental standards. All of which are pre-requisites for a competitive aviation sector.
Maritime transport needs to overcome bottlenecks and act on administrative simplification, port capacity and efficiency, connection to the hinterland and access to financing. The lack of high-quality infrastructure or low-performing port services can
16 European Observatory on Airport Capacity & Quality, Learning from national, regional and local strategies on airport capacity, Final Report of TASK FORCE, May 2015.

Policy challenges: overview of performance in the EU countries | 9
result in significant extra costs for shippers, transport operators and consumers. For EU companies, port and terminal costs can represent up to 25% of the total door-to-door logistic cost. The "Ports Regulation" of 201717 introduces rules on transparent public funding to improve market access and make port investments and operations more efficient.
Inland water transport stands to lose its comparative advantage as an efficient, low external costs transport mode, unless long-term structural changes are made to improve the quality of its operating conditions. Suitable means include: investment in better infrastructure, skills, digitalisation and integration into the logistics chain. This requires both the definition of common standards at EU level and cross-border cooperation between EU countries, e.g. in the framework of the Danube Strategy.
Another common challenge of market functioning is to create conditions of fair competition between the various transport operators in a market that is not distorted by illegal state aid or by abuses related to the control over infrastructure.
State funding of regional airports is often needed to ensure territorial cohesion. However, undue distortion of competition in subsidising economically unviable airports must be avoided. Sustainable growth of airports and airlines requires full compliance with state aid rules. EU and non-EU air carriers benefit from equal access opportunities to the EU market. However, this is not always the case in non-EU countries.
As for maritime transport, the "Ports Regulation" requires that financial relations between public authorities and the port managing body, or any other entity that provides port services or dredging and receives public funds, must be reflected transparently in the accounting system. Thus, the risk of undue cross-subsidisation is reduced.
In rail, cases of (restructuring) aid and overcompensation of public service obligations are frequent. In addition, failure to separate infrastructure managers and service operators is
17 Regulation (EU) 2017/352 of the European Parliament and of the Council of 15 February 2017 establishing a framework for the provision of port services and common rules on the financial transparency of ports, OJ L 57, 3.3.2017.
not conducive to fair competition or efficient exploitation of the infrastructure.
The Commission monitors the functioning of transport services for consumers in the Consumer Markets Scoreboard, which ranks over 40 consumer markets. Results of the 2015 survey18 show that train services continue to be perceived by the EU's consumers as one of the poorest performing service sectors (24th out of the 29 services markets surveyed in 2015), with the fourth highest incidence of problems.
The heterogeneity of EU countries' scores19 is almost twice as high as observed for all services on average. Bulgaria, Croatia, Romania and Italy are at the bottom of the ranking.
18 Market Monitoring Survey 2015 published in the 2016 Consumer Markets Scoreboard. 19 As measured by the standard deviation of the Market Performance Indicator (MPI).

10 | Transport in the EU: Current Trends and Issues
Figure 4: Market Performance Index for three transport markets (2015)
Source: Market Monitoring Survey 2015. The MPI indicates to what extent a given market brings the desired outcome to consumers. It is a composite index incorporating five key components: consumers' trust in retailers/providers, ease of comparing different offers, the extent of problems and detriment, expectations and choice. Each component is weighted according to the importance it was given by the respondent and the maximum total score is 100.
While airline services are evaluated relatively well overall (4th place in the service markets ranking), a fifth of all cross-border complaints received by the network of European Consumer Centres relate to passenger or luggage transport by air20. A Eurobarometer survey21 on passenger rights in all modes of transport shows that the level of public awareness (31%) has remained stable since previous surveys in 2005 and 2009 (on air passenger rights only).
On passengers with disabilities or with reduced mobility, 81 % of those who requested assistance when travelling were satisfied with the assistance provided. The market for tram, local bus and metro services performs close to the service sector average (15th place).
On the social dimension, an ex-post evaluation of social legislation in road transport and its enforcement, carried out in 2015-201722, concluded that the current rules do not effectively and efficiently address the risks of deterioration in working conditions and distortions of competition. This is due to shortcomings in the legal framework. Certain rules are unclear, unsuitable or difficult to
20 The European Consumer Centres Network 2013 Annual Report.
http://ec.europa.eu/consumers/ecc/docs/report_ecc-net_2013_en.pdf. 21 Special Eurobarometer 420, December 2014. 22https://ec.europa.eu/transport/sites/transport/files/facts-fundings/evaluations/doc/2016-ex-post-eval-road-transport-social-legislation-final-report.pdf
enforce. This results in differences in implementation between EU countries of the common rules and creates a risk of fragmentation of the internal market. As part of the "Mobility Package", the rules are currently being clarified and revised. This should clarify minimum standards for social protection and pay of posted workers in the (road) transport sector.
In the maritime sector, there has been progress since the entry into force of the Directive incorporating the 2006 International Labour Organization Maritime Convention in EU law.23 In aviation, the situation of highly mobile workers deserves attention. Whereas the 'home base' concept has been introduced into the Regulation on the coordination of social security systems in 201224, shortcomings remain as to clarifying rules on the applicable labour law for highly mobile workers and on the competent court in charge of disputes.
2.2. Infrastructure deficiencies
Since the global economic crisis, the EU has been suffering from low levels of investment in transport infrastructure. This has held back modernisation of
23 Council Directive 2009/13/EC of 16 February 2009 implementing the Agreement concluded by the European Community Ship owners' Associations (ECSA) and the European Transport Workers’ Federation (ETF) on the Maritime Labour Convention, 2006, OJ L 124, 20.5.2009. 24 Regulation (EU) No 465/2012 of the European Parliament and of the Council of 22 May 2012, OJ L 149, 8.6.2012.

Policy challenges: overview of performance in the EU countries | 11
the EU's transport system. Collective and coordinated efforts at European level, recently boosted by the Investment Plan for Europe, need to reverse this downward trend.
In particular the trans-European transport network (TEN-T) requires investment in new infrastructure, refurbishment and modernisation of the existing network. Better coordination is needed between EU countries on cross-border infrastructure projects.
While for some EU countries the main issue is to upgrade and maintain existing infrastructure, others need to develop or expand their transport network. The availability and quality of transport infrastructure is particularly low in the Eastern part of the EU. Renovation and upgrading of an otherwise extensive railway network is also a fairly common challenge there. In the last two decades efforts have concentrated on completing the network of motorways.
Building missing links at borders between EU countries and along key European routes, removing bottlenecks or interconnecting transport modes in terminals is vital for the Single Market and for connecting Europe with external markets and trade partners. The smooth functioning of the European network requires integration and interconnection of all modes of transport, including equipment for traffic management and innovative technologies.
Road and rail infrastructure across the EU has been degrading because of too little road maintenance. Maintenance budgets have often experienced severe cuts and have not evolved in line with the increasing length of infrastructure and the ageing of crucial links. This has led to a worsening of the state of roads in many EU countries and has generated higher risks of accidents, congestion, increased noise and a reduced service to society.
The adaptation of infrastructure to new mobility patterns and the deployment of infrastructure for clean, alternative fuels, pose additional challenges that require new investments and a different approach to the design of networks and business models.
To address infrastructure bottlenecks on routes of key interest for the EU, suitable planning has to be put in place. Conditions have to be created to ensure full absorption of funds earmarked in the Connecting Europe Facility for rail projects in EU countries that are eligible for the Cohesion Fund. For instance, in the cases of the Baltic States and
Poland, the Commission announced on 26 June 2017 almost half a billion euro for two projects on the global Rail Baltica project (EUR 110 million for the joint project by the consortium RB Rail, between Estonia, Latvia and Lithuania and EUR 338 million for the Białystok – Ełk line).
In Greece, Spain, France, Italy and Portugal, further improvement of port services and port hinterland connections by rail (and/or inland waterways) is crucial. Rail investments to implement rail corridors and revitalise rail freight transport is a priority for Spain and Portugal.
The upgrading and modernisation of infrastructures is needed in the inland waterway network of Belgium, Germany, France the Netherlands and Austria. Investments in the navigability of the Bulgarian, Hungarian and Romanian inland waterways, in particular the Danube, could remove significant bottlenecks in the EU transport network.25
25 Cf. EU Rhine-Danube Corridor Work Plan, Danube Ministerial Declaration of June 2016.
12 | Transport in the EU: Current Trends and Issues
Figure 5: Satisfaction with infrastructure quality (2016-2017)
Source: World Economic Forum, The Global Competitiveness Report database 2016-2017. Scale from 1 [extremely underdeveloped] to 7 [extensive and efficient by international standards]. The countries were ranked on their overall performance on transport infrastructure.
In the light of a wave of technological innovation and disruptive business models (such as ride sharing), both the possibilities and demand for making transport safer, more efficient and sustainable have increased. Digital technologies help reduce human error. They can also create a truly multimodal transport system and spur social innovation. The market potential of cooperative, connected and automated driving is expected to lead to the creation of many new jobs.
Cooperative intelligent transport systems (C-ITS) allow road users and traffic managers to share information and use it to coordinate their actions. C-ITS are based on technologies which allow vehicles to "talk" to each other and to the transport infrastructure. In addition to what drivers can immediately see around them, all parts of the transport system are able to share information.
Communication between vehicles, infrastructure and other road users is also crucial to increase the safety of future automated vehicles and their full integration in the overall transport system.
Despite European initiatives, such as intelligent transport systems for road, the air traffic management system (SESAR) and the European Rail Traffic Management System (ERTMS), challenges emanate mainly from the fragmented
deployment of C-ITS across EU countries. This creates barriers within the Single Market and can hamper the interoperability between different electronic systems and technological standards.
The deployment of intelligent transport systems for road and its interface with other modes varies across Europe. Yet, there are a number of common priorities and initiatives for collaboration among EU countries. Further commitment of all EU countries to the deployment of continuous and interoperable intelligent transport systems will be vital for fully exploiting the benefits that it can bring to the Single Market and the common transport area including economic and environmental benefits.
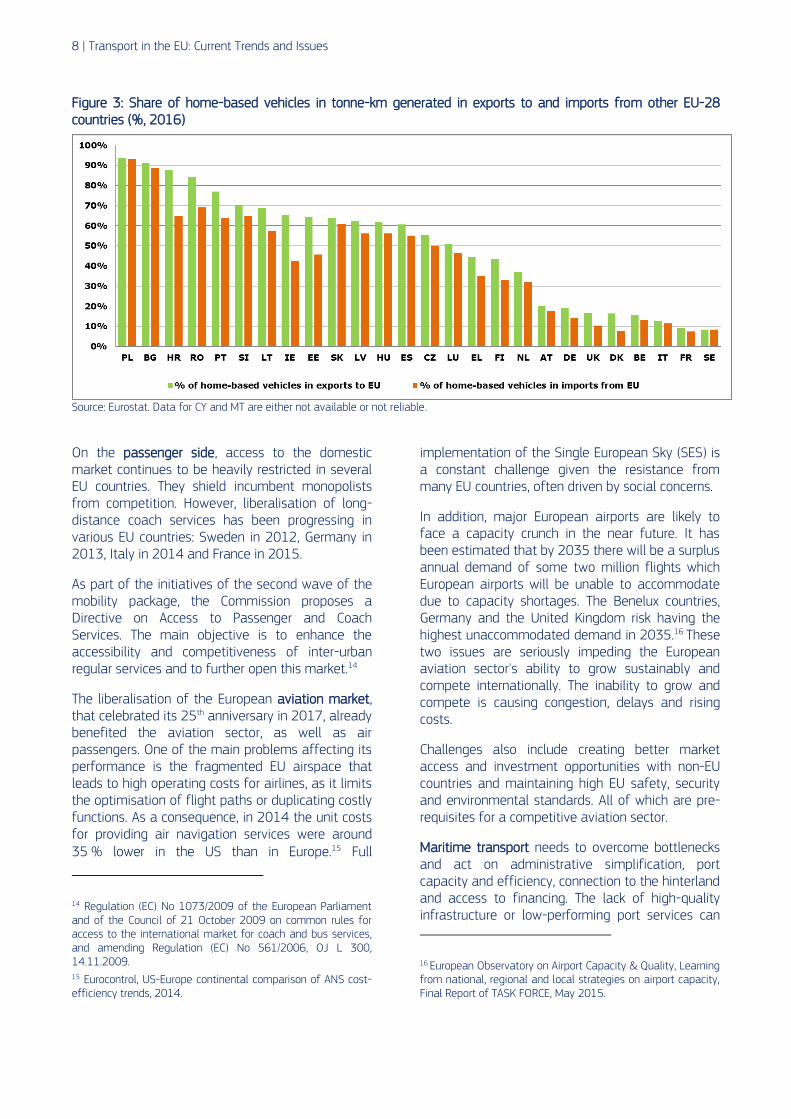
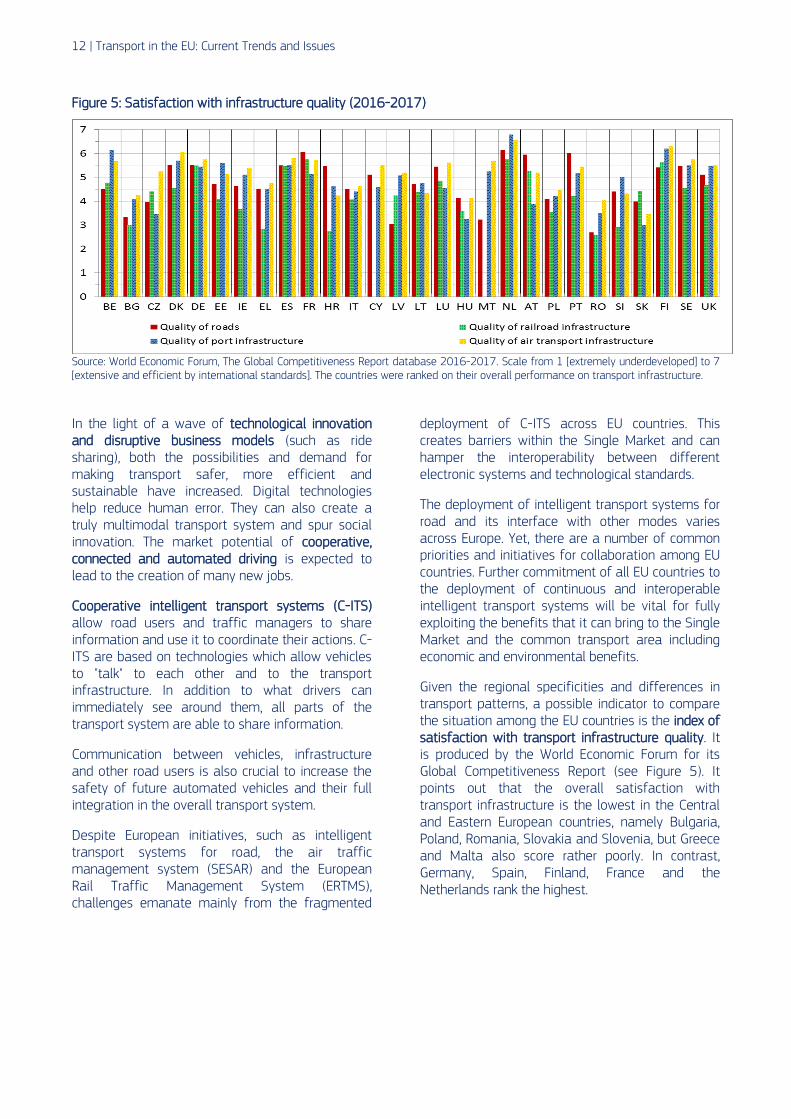
Given the regional specificities and differences in transport patterns, a possible indicator to compare the situation among the EU countries is the index of satisfaction with transport infrastructure quality. It is produced by the World Economic Forum for its Global Competitiveness Report (see Figure 5). It points out that the overall satisfaction with transport infrastructure is the lowest in the Central and Eastern European countries, namely Bulgaria, Poland, Romania, Slovakia and Slovenia, but Greece and Malta also score rather poorly. In contrast, Germany, Spain, Finland, France and the Netherlands rank the highest.
Policy challenges: overview of performance in the EU countries | 13
Figure 6: Infrastructure quality under Logistics Performance Indicator (2016)
Source: World Bank Logistic Performance Index. The scores demonstrate comparative performance (lowest score to highest score) from 1 to 5.
Analysis of the World Bank logistics performance index26 (see Figure 6) shows a slightly different ranking, but the overall picture is similar. One of the components of this composite index is the quality of trade and transport-related infrastructure (e.g. ports, railroads, roads, information technology). The index is again the lowest for Bulgaria and Romania. Croatia, Cyprus and Malta do not score much better. The best performing European countries are Germany, the Netherlands and Sweden.
It is worth adding that concerning the global logistics performance index, 23 EU countries are ranked in the top 50 out of the 160 countries compared by the World Bank, with Germany, Luxembourg, the Netherlands and Sweden occupying the first four places.
2.3. Low-emission mobility and negative externalities
The main external costs of transport are those linked to greenhouse gas emissions, local air pollution, congestion, capacity bottlenecks,
26 The logistics performance index (LPI) is the weighted average of the country scores on the six key dimensions: efficiency of the clearance process, quality of trade and transport related infrastructure, ease of arranging competitively priced shipments, competence and quality of logistics services, ability to track and trace consignments, timeliness of shipments in reaching their destination within the scheduled or expected delivery time. The LPI consists of both qualitative and quantitative measures.
accidents and noise. In particular, the significant impact of transport on energy use and climate change has to be addressed. In 2015, at least 33% of the final energy consumption and 24% of greenhouse gas emissions (23% more greenhouse gas emissions than in 1990) in the EU stemmed from transport.27
Final energy consumption in transport28 decreased between 2005 and 2015 due to both the improvements in the energy efficiency of passenger cars and to the economic crisis. The latter led to a stabilisation of passenger traffic and a decrease in freight traffic.
Under the adopted policies, the declining trend in emissions (since 2005) from transport is expected to continue until 2030 (-12% for 2005-2030)29. The main drivers are fuel efficiency gains. They are encouraged by CO2 standards for light duty vehicles, increasing fossil fuel prices over time, and the use of less CO2-intensive fuels. However, greater efforts will be needed after 2020 if the global targets to reduce greenhouse gas emissions are to be met. It is expected that the cost of air pollution from road transport will remain high, due to congestion and an expected growing demand for transport. Thus, the current transport system might not be sustainable.
27 Source: European Commission, EU Transport in Figures, Statistical Pocketbook 2017. 28 Excluding pipeline transport. 29 EU Reference scenario 2016, based on the PRIMES-TREMOVE transport model developed by E3M-Lab (ICCS/NTUA).

14 | Transport in the EU: Current Trends and Issues
CO2 emissions and air pollution from transport are the major environmental concerns related to transport activity. The levels of CO2 emissions are difficult to attribute to specific countries. They are calculated on the basis of fuels sold and do not correspond to the transport activity performed within the countries’ borders. This leads to biased values especially for transit countries. In the case of maritime or air transport there are additional issues with attributing territoriality for emissions for the parts of the journeys taking place over a given territory.
Unlike other sectors, aviation emissions are forecast to increase dramatically as air traffic increases worldwide. CO2 emissions have increased by about 80 % between 1990 and 2014, and are forecast to grow by a further 44 % between 2014 and 2035.30
The aviation industry, through research and innovation, and more efficient operations and air traffic management, has made some progress in addressing the sector's impact on the environment. However, such measures are not sufficient to keep pace with the growth of traffic.
Substantial societal and economic costs of transport are related to unsatisfactory safety in road transport. Despite a positive trend in the past years, in 2016, 25 500 people lost their lives on EU roads and a further 135 000 people were seriously injured.31 Until 2013, the overall trend was close to the reference scenario of halving the number of fatalities in 2020 compared to 2010, but data on the last four years indicates stagnation or little improvement.
The societal cost of road accidents is very high, especially taking into consideration that apart from road deaths, accidents also cause thousands of slight and serious injuries every year. For every death on Europe's roads there are an estimated 4 permanently disabling injuries, such as damage to the brain or spinal cord, 8 serious injuries and 50 minor injuries. The external costs of road accidents were estimated at 1.7% of GDP for 200832.
30 EEA, EASA and Eurocontrol (2016), European Aviation Environmental Report 2016. 31 CARE (EU road accidents database) or national publications. 32 CE Delft, Infras, Fraunhofer ISI, External Costs of Transport in Europe - Update Study for 2008, Delft, CE Delft, September 2011.
Congestion has to be dealt with urgently, considering the expected growth in transport demand. The indicator produced by the Joint Research Centre to evaluate the congestion level, measures hours spent by cars in road congestion every year. The countries with the highest congestion levels are Malta, the United Kingdom, Greece, Belgium and Italy (see figure 7).
Bearing in mind that current budgetary limitations do not allow for substantial investments, there is still scope for improvement in the way the existing infrastructure is actually used. A tool for fostering a more efficient use of roads is time-differentiated congestion charging. However, its application on EU roads today is marginal. Only five cities impose a congestion charge for accessing the city centres. On interurban roads, time-differentiated charges are applied to all vehicles only on a handful of short stretches of motorways in France and Spain, as well as on one motorway stretch in the United Kingdom. The Czech Republic also charges a higher toll on Friday evenings, but it applies only to heavy goods vehicles. While these schemes have proven to be effective in limiting peak-hour congestion, their coverage is insufficient to reduce the overall burden of congestion in the EU.

Policy challenges: overview of performance in the EU countries | 15
Figure 7: Average annual hours spent in congestion per vehicle (2015)
Data source: European Commission, Joint Research Centre, based on TomTom data. No data available for Cyprus. For methodological reasons, the data for Malta are of limited comparability with the ones for the other countries studied.
The shift to alternative fuels vehicles varies substantially across EU countries, although there is a general positive trend. The share of plug-in electric vehicles (PEV) in new passenger car registrations indicates the progress in deployment of electric cars. In 2016, according to the European Alternative Fuels Observatory, the Netherlands was leading, mainly owing to a large number of newly registered plug-in hybrid vehicles (PHEV) that
represented almost 5% of the new registrations of passenger vehicles. The Netherlands was followed by Sweden and Belgium. France and Austria have the highest share of battery electric vehicles (BEV) in new registrations. The lowest shares are held by Greece, Bulgaria, Malta and Slovakia with 0.1% share of PEVs in new registrations of passenger cars.
Figure 8: PEV market share in new passenger cars (M1) registrations (2016)
Source: European Alternative Fuels Observatory.
0%
1%
2%
3%
4%
5%
6%
NL SE BE UK FR AT FI PT DE LU DK IE SI LT CY ES LV HU EE RO IT HR PL CZ EL BG MT SK
Battery electric vehicles Other plug-in electric vehicles

16 | Transport in the EU: Current Trends and Issues
Figure 9: Sector regulation - air passenger, rail and road freight transport (2013)
Data source: OECD (2013), Product Market Regulation Database. www.oecd.org/economy/pmr The regulatory and market conditions are broken down into various categories with equal weights (entry regulation and price controls for road freight; entry regulation and public ownership for air passenger transport; entry regulation, public ownership, vertical integration and market structure for rail). Low values indicate light regulatory burden (index scale of 0 - 6 from least to most restrictive). Bulgaria, Germany, Greece, Spain, Italy, Hungary, Austria, Slovakia and the United Kingdom score 0 for air passenger transport. The countries were ranked on their average performance for the three sectors.
3. Identification of policy levers to address the challenges Addressing the gaps in the Single European transport area is expected to improve transport services in Europe. As such it constitutes a prime policy lever for addressing the identified challenges. Studies suggest that for rail transport it primarily means:
completing market opening;
introducing the principle of competition for
public service contracts;
ensuring non-discriminatory access to
infrastructure;
reducing technical and regulatory barriers for
market entry;
implementing the single signalling system;
introducing common passenger rights with fewer
national exemptions;
harmonising of technical standards across
Europe;
and fair working conditions33.
33 EPRS (2014) The Cost of Non- Europe in the Single Market in Transport and Tourism. I - Road transport and railways.
The 4th Railway Package of 2016 aims to open up the market for rail passenger transport services. It establishes open access rights for railway companies in the EU from 2020 and lays down the principle of competitive awards for public service contracts. The policy focus will now have to be on effective enforcement of market opening and competition generation based on sectorial legislations and competition policy instruments.
For road transport, measures could include:
completing market opening;
better enforcing existing rules;
setting common vehicle standards;
addressing road charging systems and
technologies;
making greater efforts for road safety;
and addressing environmental sustainability and
passenger rights issues34.
On social issues, the Commission is launching initiatives to improve working conditions in road transport through the "Europe on the Move" package. This includes a proposal35 to clarify the application of EU rules on the posting of workers to the road transport sector.
34 Ibid. 35 COM(2017) 278.

Identification of policy levers to address the challenges | 17
Following the successful liberalisation of air transport that has benefited EU consumers and businesses36, action should now focus on:
completing the Single European Sky;
ensuring the highest levels of safety and
security;
supporting the creation of high quality jobs in
aviation;
protecting passenger rights;
making the best use of innovation and digital
technologies;
addressing the risk of capacity shortage;
and ensuring aviation's contribution to a resilient
Energy Union and climate change mitigation.
According to the International Transport Forum, maritime transport would benefit from:
tackling direct state aid to terminal managers
and maritime companies;
liberalisation and transparency of port services;
involvement of non-European ports in
Motorways of the Seas;
and proper emission taxation37.
The establishment of a European Maritime Single Window environment, endorsed by EU countries in the "Valletta Declaration" in 2017, is central to simplifying and harmonising reporting formalities, reducing administrative and custom costs, and taking full advantage of digital means to optimise logistic chains.
Inland waterway transport requires policies addressing administrative and regulatory barriers, unused capacity and environmental externalities.38
The quality and capacity of transport infrastructure will have to be improved to handle the expected growth in passenger and goods mobility. Given the likelihood that public funds will be limited, increased
36 International Transport Forum Discussion Paper (2015/04), EU Air Transport Liberalisation Process, Impacts and Future Considerations. 37 Ibid. 38 Ibid.
investment from the private sector in strategic transport infrastructure will be essential.39
Investment levels in infrastructure have been low since the financial crisis of 2008. The cost of developing transport infrastructure in the EU is estimated at over EUR 1.5 trillion for 2010-2030. Completion of the TEN-T core network alone will require about EUR 500 billion until 2030. This compares with total investment of EUR 859 billion in transport infrastructure from 2000 to 2006.40 It is estimated that the completion of the TEN-T core network could spur the economy. It would create 1.8 % additional GDP in 2030 compared to 2015 and 10 million jobs.41
In 2017, the Commission agreed to invest EUR 2.7 billion in 152 key transport projects42 that support competitive, clean and connected mobility in Europe. Through this investment, the Commission is delivering on its Investment Plan for Europe and on Europe's connectivity, including the agenda set out in the Communication "Europe on the Move".
Selected projects are mostly concentrated on the strategic sections of Europe's transport network (the TEN-T core network) to ensure the highest EU added-value and impact. The largest part of the funding will be devoted to:
developing the European rail network (EUR 1.8
billion);
decarbonising and upgrading road transport and
developing intelligent transport systems
(EUR 359.2 million);
deploying air traffic management (ATM) systems
(EUR 311.3 million).
39 OECD (2011), Strategic Transport Infrastructure Needs to 2030, Main Findings. 40 Report from the Commission to the European Parliament and the Council, on financial instruments supported by general budget according to Art 140.8 of the Financial Regulation as of 31 December 2015. 41 Fraunhofer ISI (2015), Cost of non-completion of the TEN-T. http://ec.europa.eu/transport/themes/infrastructure/studies/doc/2015-06-fraunhofer-cost-of-non-completion-of-the-ten-t.pdf 42 European Commission - Fact Sheet Connecting Europe Facility – Results of the 2016 Transport calls for proposals.
http://europa.eu/rapid/press-release_MEMO-17-1731_en.htm
18 | Transport in the EU: Current Trends and Issues
This investment is made under the Connecting Europe Facility (CEF), the EU's financial mechanism supporting infrastructure networks. Over the period 2014-2020, it will unlock EUR 41.6 billion of public and private financing. The Commission is allocating EUR 11.3 billion from the CEF budget of the Cohesion Fund for the eligible 15 EU countries to further improve their infrastructure and to reduce differences between countries. For 2014-2020, these 15 eligible EU countries are: Bulgaria, the Czech Republic, Estonia, Greece, Croatia, Hungary, Cyprus, Latvia, Lithuania, Malta, Poland, Portugal, Romania, Slovakia and Slovenia.
Policies should take into account the fact that EU countries have different infrastructure needs. Increased investment in this field should consider the investment patterns before and after the recent financial crisis. Policies that promote spending in transport infrastructure encourage growth, provided they do not create excess capacity. Providing too much infrastructure has been shown to create inefficiencies by diverting resources away from more productive investments.43 However, EU countries in which the stock of infrastructure is low, or that have suffered from underinvestment, could certainly benefit from higher infrastructure investment. Efforts also have to be made to complete the multi-modal core network, which is the central part of the trans-European transport network policy.44
There should be more focus in all EU countries on developing and deploying innovative infrastructure technologies and elements. This will improve both a demand-based and sustainable provision of transport services and individual mobility. Based on the Commission's intelligent transport systems (ITS) action plan of 2008, a dedicated legal framework was established with the entry into force of the ITS Directive in 201045. This framework supports the harmonised deployment in the EU of ITS solutions in road transport.
43 European Commission (2014), Infrastructure in the EU: Developments and Impact on Growth, Occasional Papers 203. 44 Fraunhofer ISI (2015), Cost of non-completion of the TEN-T. 45 Directive 2010/40/EU of the European Parliament and of the Council of 7 July 2010 on the framework for the deployment of Intelligent Transport Systems in the field of road transport and for interfaces with other modes of transport, OJ L 207, 6.8.2010.
In 2016, the Commission presented a European strategy for the coordinated deployment of cooperative intelligent transport systems (C-ITS)46 to avoid a fragmented Single Market for cooperative transport and connected and automated driving. The strategy recommends actions to create synergies between different initiatives and improve interoperability. It also addresses the most critical issues, including cyber-security and data protection. More recently, the "Europe on the Move" Communication (2017) highlighted the role of C-ITS in enabling cooperative, connected and automated mobility.
Under the Horizon 2020 work programme 2016-2017, a dedicated call was launched for project proposals on automated road transport.
Furthermore, policies applying the "user pays" and "polluter pays" principles and monetary incentives to users, consumers and businesses, could help to reduce the environmental impact and internalise the external costs of transport.47
Infrastructure charging and taxes combined with innovative mechanisms to promote the financing of infrastructure for sustainable transport48 can address the budgetary constraints for infrastructure maintenance and shape the mobility patterns and freight flows.49 Notably in road transport, a greater application of efficiently organised distance-based charges for road usage would create regular revenue streams for sustainable and efficient long-term maintenance and development of the network.
Greater use of the possibility to charge for external costs would help to apply the "polluter pays" principle. However, the current infrastructure charging and transport taxation schemes differ substantially among EU countries, possibly creating market distortions and inefficiencies. The systems in place also treat some modes and fuels in a preferential way, leading to unsustainable mobility choices.
46 COM(2016) 766 of 30.11.2016. 47 CE Delft (2008), Road infrastructure cost and revenue in Europe. 48 E.g. mark-ups applied on road charges. 49 OECD (2007), Transport Infrastructure Charges and Capacity Choice. Self-Financing Road Maintenance and Construction, Round Table 135.

Examination of policy state of play | 19
Since the highest share of CO2 emissions in transport comes from the road sector, it is also the area where EU countries have made the most effort to mitigate this impact. However, they often apply different approaches. There is a need to provide consistent incentives to users to promote the most energy efficient lorries. An effective way would be to differentiate tolls according to the CO2 performance of lorries. Other measures besides taxation that can address negative externalities consist in:
deploying clean fuels for transport;
deploying intelligent transport systems;
setting efficiency standards for vehicles;
sharing best practices (including eco-driving);
and encouraging the use of more energy
efficient transport modes, in particular collective
transport.
These measures have been reiterated in the Communications "A European Strategy for Low-Emission Mobility"50 and "Europe on the Move".
As part of the second wave of proposals of the mobility package, as mentioned in the introduction, the Commission proposes new CO2 standards for cars and vans after 202051 which will help Member States to achieve their 2030 climate and energy targets. The package also includes a revision of the Clean Vehicles Directive52 which will help to stimulate additional public demand for these vehicles in the EU. Finally, the package contains an Action Plan to boost investment in alternative fuel infrastructure53 and develop a network of fast and interoperable recharging and fuelling stations across the Union.
In the maritime sector, environmentally differentiated port charges can stimulate investments in greener vessels.
50 COM(2016) 501. 51 COM(2017) 676. 52 COM(2017) 653. 53 COM(2017) 652.
4. Examination of policy state of play
4.1. Market access policies
The Single European transport area, as envisaged by the Commission, addresses the market functioning issues by opening the transport sector to harmonious competition. This does not exclude the need for action at national level. The EU economy would benefit from a lowering of market entry barriers and a reduction of the regulatory burden in transport markets.
Despite some progress, legal barriers to market entry persist in transport sectors in most EU countries. The latest OECD product market regulation data (see Figure 9) which estimates the restrictiveness of market regulations shows that the situation has improved in air passenger transport in almost all countries for which data are available. It remained broadly unchanged for road freight54 compared to 2008. Rail transport remains the sector with the most restrictive regulations: administrative, technical and regulatory burdens are still present in most EU countries.55
A good example of the positive impacts of deregulation can be found on the long-distance coach market, where various countries have opened their markets (Sweden in 2012, Germany in 2013, Italy in 2014 and France in 2015). Positive developments are already visible, especially in Germany, where coach travellers doubled to 16 million a year after the market opening (all but 4 million on domestic routes) and accounted for 11 % of the public-transport market. Cross-border travel has also surged as a result.
Despite some progress, the implementation of the functional airspace blocks is still not satisfactory in most of the EU countries. There are still infringement procedures against 21 Member States participating in six of the nine functional airspace blocks. The procedures concern lack of optimal
54 The OECD data do not indicate any improvement of the situation in the road freight sector following the adoption of Regulation (EC) No 1072/2009 on common rules for access to the international road haulage market, OJ L 300, 14.11.2009. 55 OECD (2013), Product Market Regulation Database.

20 | Transport in the EU: Current Trends and Issues
provision of navigation services and the use of airspace (Bulgaria, Denmark, Estonia, Latvia, Romania, Finland and Sweden excluded).
4.2. Investment in transport infrastructure
The level of investment in transport infrastructure and maintenance is difficult to compare between EU countries due to non-harmonised and incomplete reporting. Besides, it has to be matched with the actual investment needs. The latest OECD data (2015) indicate that investment levels in most countries remain low. Most EU countries have a share of total transport infrastructure investment below 1% of GDP56. It is a safe assumption that this does not cover the investment needs (also due to the maintenance requirements) in most countries.
The Connecting Europe Facility, the European Fund for Strategic Investments and cohesion policy (through the Cohesion Fund and the European Regional Development Fund) intend to address these budgetary deficiencies. They help in constructing the TEN-T core transport network and support infrastructure projects of high economic importance and relevance for the internal market. However, EU countries will still need to develop infrastructure for the last leg of the network which is critical for the incorporation of large infrastructure projects in the local transport systems.
The length of the trans-European core road network, completed at the end of every year, compared to the total road network, including planned sections and sections to be upgraded, can give a rough indication of progress in trans-European transport network policies in EU countries. While for some countries the investments have already been completed (Spain, Portugal, Slovenia, the United Kingdom), others still have a lot to do. This concerns mainly Central and Eastern European countries, and in particular Estonia, Lithuania, Poland, Slovakia and Romania57.
56 OECD 2017. https://stats.oecd.org/Index.aspx?DataSetCode=ITF_INV-MTN_DATA. 57 TENtec 2013. http://ec.europa.eu/transport/infrastructure/tentec/tentec-portal/site/index_en.htm.
The analysis of the 2014 national reports on the implementation of the Intelligent Transport Systems Directive58 demonstrates the strong and constant involvement of most EU countries in intelligent traffic management and information systems. These allow for a better use of the infrastructure, in particular through better use of road, traffic and travel data and the development of new intelligent transport services for traffic and freight management. In addition, new open data strategies for transport (e.g. in the United Kingdom) or the use of crowd-sourcing (e.g. travel-time information in Finland) have led to significant changes and the development of new services.
The national reports also highlight a growing trend towards more cooperative intelligent transport systems and driverless piloting activities in EU countries (e.g. France, Germany, the Netherlands, Austria, Finland, Sweden and the United Kingdom).
Although significant investments have been made into intelligent road transport systems, monitoring and evaluating their impact in the EU countries continues to be fragmented. Pan-European consolidation is insufficient.
4.3. Promoting a shift to low-emission mobility and addressing negative externalities
EU countries offer various incentives to promote the deployment of electric vehicles, such as purchase subsidies, registration tax benefits, ownership tax benefits, company tax benefits, VAT and other financial benefits, local incentives and infrastructure incentives. In most countries there is a clear relationship between the incentives offered and an increase in the number of plug-in electric vehicles. Unsurprisingly, in countries where there are no incentives available i.e. Bulgaria, Estonia, Poland and Slovakia, there is a low propensity to buy electric cars59.
58http://ec.europa.eu/transport/themes/its/road/action_plan/its_national_reports_en.htm. 59European Alternative Fuels Observatory 2017.
http://www.eafo.eu/eu#eu_incentives_over_table_anchor.

Examination of policy state of play | 21
The introduction of schemes to internalise the external cost of transport, implying a broader application of the "polluter pays" principle, needs to be promoted and encouraged in all EU countries. The Commission has launched a comprehensive study "Sustainable transport infrastructure charging and internalisation of transport externalities", which will assess infrastructure charges, other internalisation measures and infrastructure-related expenditure. In addition, EU countries should be encouraged to use the possibility offered by Directive 2011/76/EU60 to collect external-cost charges from heavy goods vehicles on top of the infrastructure charges.
With the exception of a few front running countries, the uptake of alternative fuels for all transport modes needs to be improved, in a harmonised and synchronised way. The aim is to avoid technological islands, push for economies of scale and ensure cross-border mobility. An ambitious implementation of Directive 2014/94/EU61 would be a way to deploy an alternative fuels infrastructure with common standards.
Road charging on European roads is not systematically or effectively applied. 14 EU countries apply distance-based charges (tolls) to heavy goods vehicles and 8 to private cars on (some) motorways.62 Other EU countries still use time-based vignettes. 10 EU countries have vignettes for heavy goods vehicles and 7 for cars, for the latter essentially applied on motorways only. In addition, the systems vary in terms of network coverage, charge levels and other conditions. This provides unclear and uncoordinated incentives to users. With very few exceptions tolls are levied electronically, yet the systems are not mutually interoperable. All these differences create administrative burden and unnecessary costs for hauliers and tourists.
60 Directive 2011/76/EU of the European Parliament and of the Council of 27 September 2011 amending Directive 1999/62/EC on the charging of heavy goods vehicles for the use of certain infrastructures, OJ L 269, 14.10.2011. 61 Directive 2014/94/EU of the European Parliament and of the Council of 22 October 2014 on the deployment of alternative fuels infrastructure, OJ L 307, 28.10.2014. 62 Most EU countries have at least one or two pieces of special infrastructure, such as bridges or tunnels, which are tolled.
Systems do not necessarily take account of the environmental impact of vehicles. Tolling schemes which apply to heavy goods vehicles differentiate charges according to the air pollutant emissions of the vehicles, but the same is not true for road charges applying to passenger cars.
EU countries could and should make better use of the possibility to support the shift of freight transport from road to more sustainable transport modes, as offered by the Combined Transport Directive63. Considering its fragmented and uneven implementation in EU countries, the Commission proposed an amendment to the Directive on 8 November 2017.
Despite the comparatively good provision of infrastructure in the Benelux countries, Germany, Malta and the United Kingdom, these countries suffer from a high level of road congestion. They must deal with high and increasing costs for the maintenance of their extensive transport infrastructure. This calls for a more balanced exploitation of all transport modes. This can be achieved through better and more flexible technologies and service solutions (especially the deployment of intelligent transport systems) and appropriate pricing for the use of infrastructure.
All EU countries need to continue their efforts to improve road safety. The poor safety record in Bulgaria, Latvia, Lithuania, Poland and Romania calls for more effective measures to be urgently implemented.
Transport fuel taxes can encourage fuel efficiency and a more sustainable use of cars, including the use of more sustainable fuels. The structure of such duties needs to reflect both the carbon and energy content of fuels. Currently, substantial differences in tax rates on fuels can be observed across EU countries. There is a general preferential treatment of diesel. Diesel is taxed less than petrol in almost all EU countries.
Transport taxation may have a significant effect on consumers’ preferences when purchasing a car. This includes registration tax (levied on the purchase of
63 Council Directive 92/106/EEC of 7 December 1992 on the establishment of common rules for certain types of combined transport of goods between Member States, OJ L 368, 17.12.1992.
22 | Transport in the EU: Current Trends and Issues
a car) and vehicle road tax (levied annually on car ownership). Registration of a car is subject to a tax in 20 EU countries, and 22 apply vehicle road taxes64.
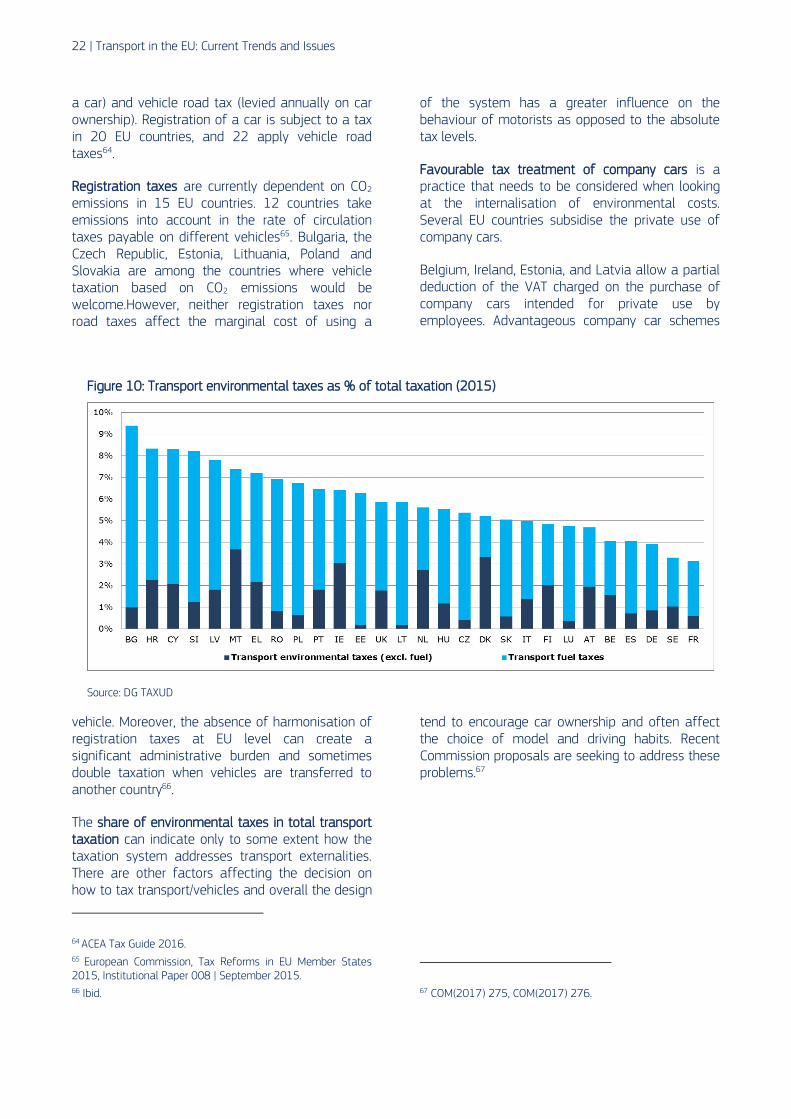
Registration taxes are currently dependent on CO2 emissions in 15 EU countries. 12 countries take emissions into account in the rate of circulation taxes payable on different vehicles65. Bulgaria, the Czech Republic, Estonia, Lithuania, Poland and Slovakia are among the countries where vehicle taxation based on CO2 emissions would be welcome.However, neither registration taxes nor road taxes affect the marginal cost of using a
vehicle. Moreover, the absence of harmonisation of registration taxes at EU level can create a significant administrative burden and sometimes double taxation when vehicles are transferred to another country66.
The share of environmental taxes in total transport taxation can indicate only to some extent how the taxation system addresses transport externalities. There are other factors affecting the decision on how to tax transport/vehicles and overall the design
64 ACEA Tax Guide 2016. 65 European Commission, Tax Reforms in EU Member States 2015, Institutional Paper 008 | September 2015. 66 Ibid.
of the system has a greater influence on the behaviour of motorists as opposed to the absolute tax levels.
Favourable tax treatment of company cars is a practice that needs to be considered when looking at the internalisation of environmental costs. Several EU countries subsidise the private use of company cars.
Belgium, Ireland, Estonia, and Latvia allow a partial deduction of the VAT charged on the purchase of company cars intended for private use by employees. Advantageous company car schemes
tend to encourage car ownership and often affect the choice of model and driving habits. Recent Commission proposals are seeking to address these problems.67
67 COM(2017) 275, COM(2017) 276.
Figure 10: Transport environmental taxes as % of total taxation (2015)
Source: DG TAXUD
Overview of the Transport Sectors in the EU countries | 23
5. Overview of the Transport Sectors in the EU countries
Belgium
Main current issues in Belgium
Issue 1 - Road congestion and environmental performance of transport
Belgium is among Europe's most congested countries in terms of hours wasted. Moreover, Belgium is expected
to fall short of its 2020 greenhouse gas emission reduction target and suffers from serious air pollution
problems, which is to some extent a consequence of the large share of diesel passenger cars and tax subsidies
in the form of favourable tax treatment of company cars and fuel cards.
More efficient public service, including the speeding up of the Brussels RER, could encourage a transfer of traffic
from road towards more environmentally-friendly modes of transport. Company car and fuel taxation are not
fully aligned to transport sustainability goals. Part of the solution for the congestion problem could come from
road pricing and congestion charges, bearing in mind the "polluter pays" principle.
Issue 2 – Investment in transport infrastructure network
The transport network represents the most pressing investment gap. According to the recommendations of the
OECD68, an integrated long-term infrastructure plan supported by regions and the federal government covering
all types of transport will be needed to ensure efficient development and growth. Cost-efficient planning and
project selection should be promoted by subjecting all new projects to cost-benefit analyses with common
parameters. Given the high concentration of economic activity around the capital and the ports, the most urgent
challenges are upgrading basic rail and road transport infrastructure and eliminating missing links between the
main economic hubs. However, attention should be paid to the often observed effect that additional capacity
increases congestion.
68 OECD Economic survey Belgium (2013): Better use of infrastructures to reduce environmental and congestions costs.

24 | Transport in the EU: Current Trends and Issues
Key facts and figures on Transport in Belgium
Modal split
The modal split for passenger transport in Belgium
corresponds roughly to the EU average. It is to be
noted though, that the use of trams and metro is
below the European average.
Freight transport also seems to rely predominantly
on road, rather than railways. However, in Belgium
inland waterways account for an important share of
the modal split for freight transport.
Modal split for passenger and freight transport in
2015
Source: EU Transport in figures, Statistical Pocketbook 2017.
Performance of the logistics sector
Belgium’s international ranking in the World Bank
Logistics performance indicator has slightly dropped
between 2014 and 2016. Yet, the overall
performance of the logistics sector remains at a high
level in international comparison.
The absolute values of the indicator have even
increased, although to a very small extent, for all
aspects considered, except for infrastructure and
logistics competence.
World Bank Logistics performance indicator
Source: World Bank.
Passenger
cars
Buses &
Coaches Railw ays
Tram &
Metro
Belgium 80.0% 11.3% 7.7% 0.9%
EU-28 81.3% 9.4% 7.6% 1.8%
Modal split for passenger transport
(shares based on passenger-kilometres)
Road Railw ays
Inland
Waterw ays Pipeline
Belgium 71.2% 10.9% 15.6% 2.4%
EU-28 71.7% 17.4% 6.1% 4.8%
Modal split for freight transport
(shares based on tonne-kilometres)
2014 2016
LPI Rank 3 6
Score 4.04 4.11
Customs 11 13
Score 3.80 3.83
Infrastructure 8 14
Score 4.1 4.05
International shipments 2 3
Score 3.8 4.05
Logistics competence 4 6
Score 4.11 4.07
Tracking & tracing 4 4
Score 4.11 4.22
Timeliness 2 4
Score 4.39 4.43
Logistics performance indicator (LPI)
(World Bank)

Overview of the Transport Sectors in the EU countries | 25
Road safety
Belgium has a higher road fatality rate than the EU
average and its own neighbouring countries.
Fatal accidents on motorways are unusually high
compared to the EU average. Furthermore, the
share of cyclist fatalities is slowly increasing.
Belgium also has a rather low reported seat belt
use: in the front seat 80% and for the rear seat only
68%.
Source: DG MOVE - CARE data.
Alternative fuels in road transport
The use of alternative fuels in new passenger cars
sold in Belgium has been increasing very
dynamically over the past few years.
The different Belgian regions each apply their own
set of support measures, potentially leading to
market fragmentation, but all put emphasis on
encouraging the uptake of electric vehicles. The
Federal Government grants a tax credit of 30 % on
the purchase of an electric vehicle.
SOURCE: EUROPEAN ALTERNATIVE FUELS OBSERVATORY (BEV
= battery electric vehicle; PHEV = plug-in hybrid electric vehicle;
CNG = compressed natural gas).
Market opening in the railway sector
The market opening of the railway sector is making
progress, although at a much slower speed for
passenger transport than for freight transport.
Since a reform in 2014, the infrastructure manager
Infrabel is separated from the 99% state-owned
SNCB/NMBS.
Source:
DG MOVE Rail Market Monitoring (includes domestic and
international transport).
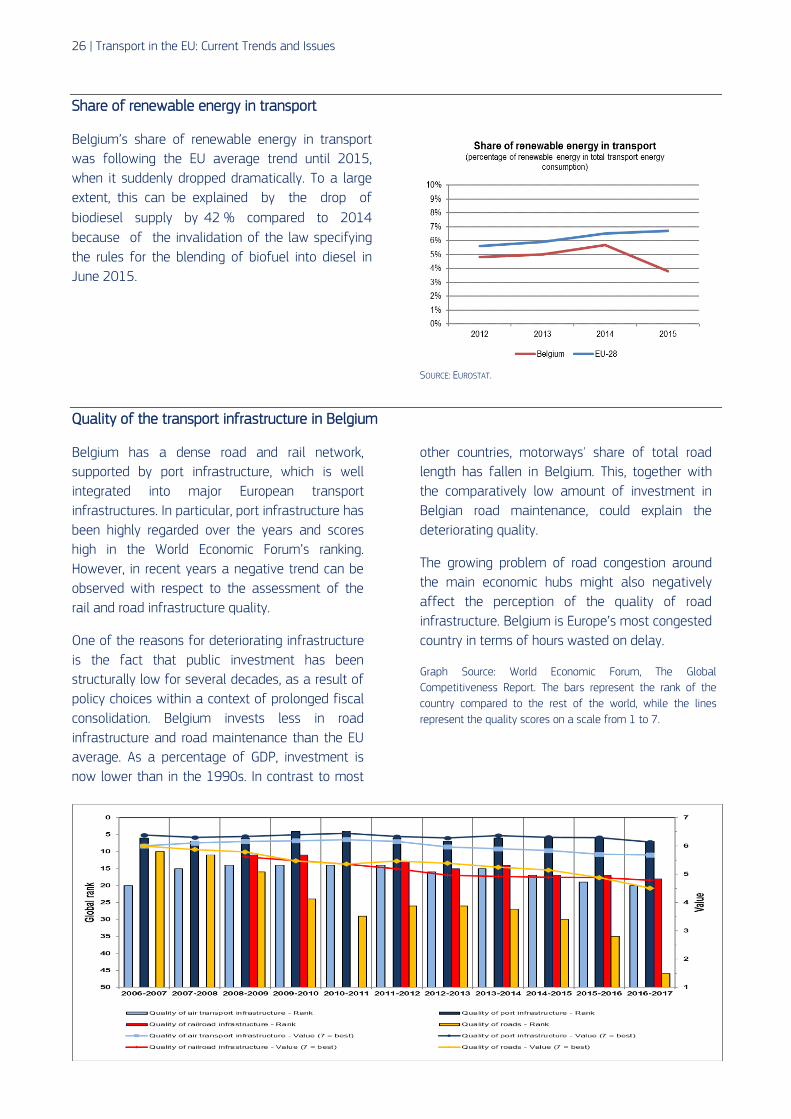
26 | Transport in the EU: Current Trends and Issues
Share of renewable energy in transport
Belgium’s share of renewable energy in transport
was following the EU average trend until 2015,
when it suddenly dropped dramatically. To a large
extent, this can be explained by the drop of
biodiesel supply by 42 % compared to 2014
because of the invalidation of the law specifying
the rules for the blending of biofuel into diesel in
June 2015.
SOURCE: EUROSTAT.
Quality of the transport infrastructure in Belgium
Belgium has a dense road and rail network,
supported by port infrastructure, which is well
integrated into major European transport
infrastructures. In particular, port infrastructure has
been highly regarded over the years and scores
high in the World Economic Forum’s ranking.
However, in recent years a negative trend can be
observed with respect to the assessment of the
rail and road infrastructure quality.
One of the reasons for deteriorating infrastructure
is the fact that public investment has been
structurally low for several decades, as a result of
policy choices within a context of prolonged fiscal
consolidation. Belgium invests less in road
infrastructure and road maintenance than the EU
average. As a percentage of GDP, investment is
now lower than in the 1990s. In contrast to most
other countries, motorways' share of total road
length has fallen in Belgium. This, together with
the comparatively low amount of investment in
Belgian road maintenance, could explain the
deteriorating quality.
The growing problem of road congestion around
the main economic hubs might also negatively
affect the perception of the quality of road
infrastructure. Belgium is Europe’s most congested
country in terms of hours wasted on delay.
Graph Source: World Economic Forum, The Global
Competitiveness Report. The bars represent the rank of the
country compared to the rest of the world, while the lines
represent the quality scores on a scale from 1 to 7.

Overview of the Transport Sectors in the EU countries | 27
Bulgaria
Main current issues in Bulgaria
Issue 1 - High road fatality rates
The poor road safety record in Bulgaria with 99 deaths per million inhabitants in 2015 (EU average was 50)
calls for more effective measures to be urgently implemented. There are substantial societal and economic
transport costs related to the unsatisfactory safety in road transport. Bulgaria's poor performance can be
explained among others by a very old vehicle fleet and an under-developed road network. Improvements are
expected from the on-going construction of a modern motorway network connecting all the larger cities. Over
the last decade, the best improvement rates have concerned pedestrians and cyclists, where fatality rates have
been significantly cut since 2001. The fatality risk for motorcyclists is still unusually high when compared to the
share of motorcycles in the vehicle fleet. The majority of fatal accident victims are car occupants.
Issue 2 - Modernisation and investment in transport infrastructure have been slow
In the presence of financial and structural challenges, modernisation of the transport infrastructure has been
slow. The effectiveness and performance of the transport sector have been hindered by insufficient revenue. The
profitability of the railway operator BDZ, net of one-off effects, has been negative since 2002. According to the
Bulgarian Ministry of finance, its debt-to-assets ratio stood at 94% % in 2016. Efforts to restructure BDZ started
with a reform of its governance in 2010, including the disposal of a non-core, loss-making business, but progress
has been marginal. The national government intends to use the proceeds from retendering the 35-year
concession for Sofia airport to restructure BDZ. The privatisation of the rail freight services company has failed
despite the intentions of several governments.
Issue 3 – Rail passenger market suffers from a lack of effective competition
The rail passenger market has been suffering from a lack of effective competition. Results of the 2015 survey
on the functioning of transport services for consumers show that train services continue to be perceived by the
consumers as one of the poorest performing service sectors (out of 40 consumer markets compared). Increased
use of competitive tendering for public service contracts would encourage the entry of new private operators. In
addition a fully independent and adequately staffed regulatory body and separation of accounts between the
management of rail infrastructure and the provision of transport services are guarantees for a level playing field
that encourages new entrants.

28 | Transport in the EU: Current Trends and Issues
Key facts and figures on transport in Bulgaria
Modal split
Bulgaria records a high usage of passenger cars and
in 2015 car trips represented almost 80% of the
passenger-kilometres travelled, which is just below
the EU-28 average. Bulgaria records a much higher
than the EU-28 average usage of buses and
coaches – 17.5% vs 9.4%. On the other hand,
Bulgaria records a much lower use of rail (2.2% vs
7.6%). For land freight transport, road transport
holds the largest share for freight transport activity
with about 53 % of all tonne-kilometres driven. In
addition, Bulgaria has almost the same share of rail
transport as the EU-28 average. Over time, the road
freight sector's market share in Bulgaria has grown
in relation to rail freight transport.
Modal split for passenger and freight transport in
2015
Source: EU Transport in figures, Statistical Pocketbook 2017.
Performance of the logistics sector
According to the World Bank, the logistics sector in
Bulgaria has not been performing well since 2010. In
2010, the sector ranked 63 in the Logistics
Performance Indicator (LPI) and dropped to 72 in
2016. This was mostly because of the poor logistics
infrastructure quality and efficiency in terms of
timeliness and problems with customs.
World Bank Logistics performance indicator
Source: World Bank.
Passenger
cars
Buses &
Coaches Railw ays
Tram &
Metro
Bulgaria 79.3% 17.5% 2.2% 1.0%
EU-28 81.3% 9.4% 7.6% 1.8%
Modal split for passenger transport
(shares based on passenger-kilometres)
Road Railw ays
Inland
Waterw ays Pipeline
Bulgaria 53.0% 17.3% 26.6% 3.1%
EU-28 71.7% 17.4% 6.1% 4.8%
Modal split for freight transport
(shares based on tonne-kilometres)
2014 2016
LPI Rank 47 72
Score 3.16 2.81
Customs 64 97
Score 2.75 2.40
Infrastructure 53 101
Score 2.94 2.35
International shipments 37 67
Score 3.31 2.93
Logistics competence 55 52
Score 3 3.06
Tracking & tracing 76 80
Score 2.88 2.72
Timeliness 24 72
Score 4.04 3.31
Logistics performance indicator (LPI)
(World Bank)

Overview of the Transport Sectors in the EU countries | 29
Road safety
Bulgaria is the Member State who registered the
highest road fatality rates in 2015, with 99 deaths
per million inhabitants.
Bulgaria's poor performance can be explained by a
very old vehicle fleet and an under-developed road
network. Improvements are expected from the on-
going construction of a modern motorway network
connecting all the larger cities. Over the last decade,
the best improvement rates have concerned
pedestrians and young drivers, where fatality rates
have been significantly cut since 2001. Source: DG MOVE - CARE data.
Alternative fuels in road transport
The number of electric charging points in Bulgaria is
the second lowest in EU-28 with only 1.7 charging
points per 100 000 inhabitants in (peri-)urban areas
in 2017. This is equivalent to only 22 publicly
accessible charging points in Bulgaria.
The number of alternatively-fuelled cars is also one
of the lowest in the EU, representing only 0.04% %
market share.
Source: European Alternative Fuels Observatory (BEV = battery
electric vehicle; PHEV = plug-in hybrid electric vehicle; CNG =
compressed natural gas).
Market opening in the railway sector
The rail passenger market has been suffering from
a lack of effective competition – due to a lack of
competitive tendering for public service contracts
and the absence of safeguards against unfair
practices. New commercial operators face
discrimination in obtaining fair access to rail
infrastructure and essential service facilities.
Bulgaria does not seem to have implemented
regulatory measures which are key for ensuring a
competitive level playing field. Such measures
would include: a truly independent and adequately
staffed regulatory body and an effective separation
of accounts between the management of rail
infrastructure and the provision of transport
services.
SOURCE: DG MOVE RAIL MARKET MONITORING (INCLUDES
DOMESTIC AND INTERNATIONAL TRANSPORT).

30 | Transport in the EU: Current Trends and Issues
With respect to rail freight transport, the market is
more open to competition. Nonetheless, there is a
need to address the significant maintenance
backlog of the rail network and to provide the
regulatory body RAEA with more resources. Doing so
would allow Bulgaria to benefit from its central
location as a transit country on the future Alpine-
West Balkans rail freight corridor.
Renewable energy in transport
The share of renewable energy in the energy
consumption of Bulgaria’s transport section has
been very low in the past, but has increased
considerably over the last years. In 2015, it almost
met the EU-average level.
In Bulgaria, the main support scheme for renewable
energy sources used in transport is a quota system.
This scheme obliges companies importing or
producing petrol or diesel to ensure that biofuels
make up a defined percentage of their annual fuel
sales. Furthermore, biofuels are supported through
a fiscal regulation mechanism.
Source: Eurostat.
Quality of the transport infrastructure in Bulgaria
Bulgaria is among the Member States with the
lowest perceived quality of transport infrastructure.
While the quality of road infrastructure is increasing
slightly, following significant investments supported
by the European Structural and Investment Funds,
the satisfaction with the rail infrastructure is
stagnant. As a result of the insufficient quality,
declining traffic intensity for both freight and
passenger rail transport is observed.
Graph Source: World Economic Forum, The Global
Competitiveness Report. The bars represent the rank of the
country compared to the rest of the world, while the lines
represent the quality scores in a scale from 1 to 7.

Overview of the Transport Sectors in the EU countries | 31
Czech Republic
Main current issues in Czech Republic
Issue 1- Competition in the railway passenger market
More competition in the open-access passenger rail market would be beneficial for consumers in the Czech
Republic, in particular if Czech authorities removed outstanding obstacles for potential market entrants, for
example through increasing their access to rolling stock. Another possible measure would be to gradually
introduce the public tendering of public service contracts in passenger rail. A strong rail regulator with sufficient
resources available to carry out its task can ensure a level playing field in both passenger and freight operations.
Issue 2- Investment in transport infrastructure
Despite an increase in investment in transport infrastructure, the development of new infrastructure projects and
maintenance of the existing infrastructure remain low. An investment backlog has accumulated and the prices of
new infrastructure projects are high. New forms of public-private partnership financing of transport
infrastructure could be part of the solution. The legal framework bears potential for simplification, with a view to
easing the administrative burden linked to development of the projects, in particular as regards building
permissions.
While the development and maintenance of the whole infrastructure network is important, particular emphasis
from an EU perspective is on completing the Core Network by 2030 - in particular the Core Network Corridors -
and on upgrading the entire TEN-T network according to the infrastructure requirements laid down in the TEN-T
Guidelines (Art. 39, Regulation (EU) No 1315/2013). Further efforts will be required to improve efficiency and
effectiveness of investment in transport infrastructure related to the three Core Network Corridors crossing
through the Czech Republic.

32 | Transport in the EU: Current Trends and Issues
Key facts and figures on transport in Czech Republic
Modal split
The Czech Republic records a relatively low use of
passenger cars. In 2015, car trips represented more
than 67% of the passenger-kilometres travelled
which is 14.2% below the EU average. On the other
hand, the Czech Republic records a much higher use
of buses and coaches than the EU average.
Regarding rail passenger transport, this mode of
transport is slightly higher than the EU average. Use
of urban transport is very high at 9.5% in
comparison with 1.8% on average in the EU.
For land freight transport, the road transport holds
the largest share of freight transport activity - about
70 % of all tonne-kilometres driven. In addition, the
Czech Republic has a higher share of rail transport
than the EU average. Usage of inland waterways is
minimal.
Modal split for passenger and freight transport in
2015
Source: EU Transport in figures, Statistical Pocketbook 2017
Performance of the logistics sector
According to the World Bank, the logistics sector in
the Czech Republic is ranked 26th globally. The
ranking indicates deficiencies in infrastructure and
timeliness. On the other hand, the Czech Republic
scores rather well in international shipment and
customs procedures, globally ranking 18th and 19th
respectively.
World Bank Logistics performance indicator
Source: World Bank.
Passenger
cars
Buses &
Coaches Railw ays
Tram &
Metro
Czech Republic 67.1% 15.6% 7.8% 9.5%
EU-28 81.3% 9.4% 7.6% 1.8%
Modal split for passenger transport
(shares based on passenger-kilometres)
Road Railw ays
Inland
Waterw ays Pipeline
Czech Republic 70.9% 25.6% 0.1% 3.4%
EU-28 71.7% 17.4% 6.1% 4.8%
Modal split for freight transport
(shares based on tonne-kilometres)
2014 2016
LPI Rank 32 26
Score 3.49 3.67
Customs 33 19
Score 3.24 3.58
Infrastructure 36 35
Score 3.29 3.36
International shipments 13 18
Score 3.59 3.65
Logistics competence 29 26
Score 3.51 3.65
Tracking & tracing 25 21
Score 3.56 3.84
Timeliness 39 28
Score 3.73 3.94
Logistics performance indicator (LPI)
(World Bank)
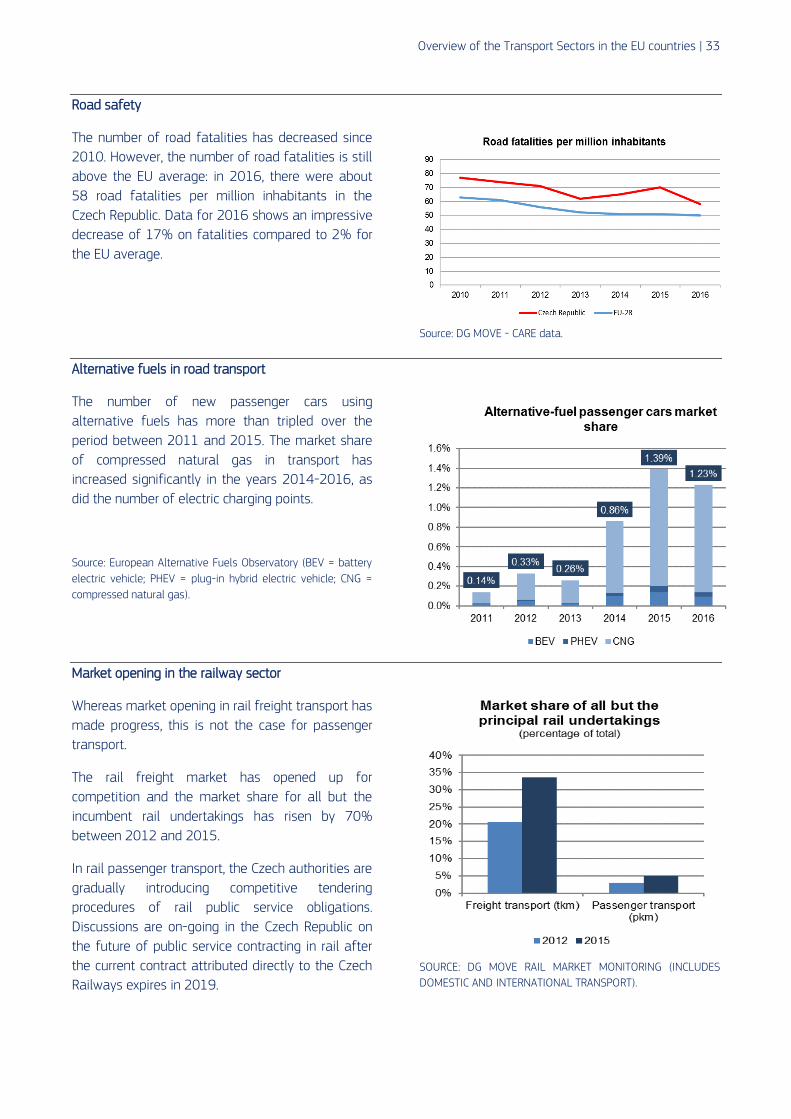
Overview of the Transport Sectors in the EU countries | 33
Road safety
The number of road fatalities has decreased since
2010. However, the number of road fatalities is still
above the EU average: in 2016, there were about
58 road fatalities per million inhabitants in the
Czech Republic. Data for 2016 shows an impressive
decrease of 17% on fatalities compared to 2% for
the EU average.
Source: DG MOVE - CARE data.
Alternative fuels in road transport
The number of new passenger cars using
alternative fuels has more than tripled over the
period between 2011 and 2015. The market share
of compressed natural gas in transport has
increased significantly in the years 2014-2016, as
did the number of electric charging points.
Source: European Alternative Fuels Observatory (BEV = battery
electric vehicle; PHEV = plug-in hybrid electric vehicle; CNG =
compressed natural gas).
Market opening in the railway sector
Whereas market opening in rail freight transport has
made progress, this is not the case for passenger
transport.
The rail freight market has opened up for
competition and the market share for all but the
incumbent rail undertakings has risen by 70%
between 2012 and 2015.
In rail passenger transport, the Czech authorities are
gradually introducing competitive tendering
procedures of rail public service obligations.
Discussions are on-going in the Czech Republic on
the future of public service contracting in rail after
the current contract attributed directly to the Czech
Railways expires in 2019.
SOURCE: DG MOVE RAIL MARKET MONITORING (INCLUDES
DOMESTIC AND INTERNATIONAL TRANSPORT).

34 | Transport in the EU: Current Trends and Issues
Renewable energy in transport
The share of renewable energy in transport had
been slightly above EU average, but declined again
after 2014, despite the increasing share of
alternative fuels in transport.
Source: Eurostat.
Quality of the transport infrastructure in Czech Republic
The motorway network density of 9.8 km per 1 000
km2 in 2015 compared to an EU average of 16.8
km. This together with significant underinvestment
in transport infrastructure during the period 2010-
2013 is reflected in a rather low user satisfaction
with the road network. Nevertheless, there has been
some improvement over the last years, probably
thanks to a significant increase in both total
investment and road maintenance expenditure in
2014 and 2015.
The density of the rail network is very high (120 km
per 1 000 km2 compared with 49 km in the EU in
2015) but the network requires substantial
modernisation, with just 34% of lines electrified in
2015, compared with 52% in the EU overall. There
is also a lack of high-speed railway connections,
and cross-border connections are poor.
Graph Source: World Economic Forum, The Global
Competitiveness Report. The bars represent the rank of the
country compared to the rest of the world, while the lines
represent the quality scores in a scale from 1 to 7.

Overview of the Transport Sectors in the EU countries | 35
Denmark
Main current issues in Denmark
Issue 1 – Share of alternative fuels in transport
According to the declared objective of the Danish Government, Denmark is committed to achieve the goal of
becoming a low-emission society, independent of fossil fuels by 2050. The Danish Government seeks to
promote a market-driven (i.e. determined by market players) development of infrastructure deployment and to
limit public financial aid, so that greater pressure on public finances can be avoided.
For electricity in transport, the Danish policy strategy is fundamentally based on current rather than planned
measures. Denmark estimates that the electric vehicle share (of all vehicles on the road) will remain below 1 %
until 2020. The prospects of shore-side electricity supply in Danish maritime ports are not good. The only policy
measure appears to be a tax relief for electricity. However, this incentive was not sufficient to make the
investment in shore-side electricity supply attractive in the context of the Nordhavn expansion of the Port of
Copenhagen. At the opposite extreme lies the status of electricity supply for stationary airplanes. Denmark
considers itself a leader in this matter.
In railways, the share of electrified lines was 24.3 % in 2015 compared an EU average 53.2 %. As a
consequence, the large majority of Danish locomotives are diesel driven, which is adversely affecting the
environment.
Issue 2 – Competition in the transport service sector
Competition for taxis and public transport services is restricted. The rail passenger market is dominated by a
state-owned rail undertaking and largely closed to competition. Yet, licensed operators are providing services on
a small share of the network. Commercial hire transport is carried out almost exclusively by taxis. Basically, there
is no other category of commercial passenger transport except for limousine service, for which few licences have
been issued. The development of professional hire transport is impeded by the lack of clear regulation and by
complex quality requirements.

36 | Transport in the EU: Current Trends and Issues
Key facts and figures on transport in Denmark
Modal split
The modal split for passenger transport is close to
the EU average, although the share of rail passenger
transport is slightly above EU average.
Freight transport in Denmark relies to a larger extent
on road transport than the EU average.
Correspondingly, the share of railways is lower.
Inland waterways do not play any role for freight
transport in Denmark.
Modal split for passenger and freight transport in
2015
Source: EU Transport in figures, Statistical Pocketbook 2017.
Performance of the logistics sector
The World Bank Logistics performance indicator
shows that the Danish logistics sector is highly
competitive in international comparison. Yet, the
timeliness of deliveries, formerly a particular
strength of the Danish logistics sector has
considerably weakened in score and rank between
2014 and 2016.
World Bank Logistics performance indicator
Source: World Bank.
Passenger
cars
Buses &
Coaches Railw ays
Tram &
Metro
Denmark 80.5% 9.8% 9.3% 0.4%
EU-28 81.3% 9.4% 7.6% 1.8%
Modal split for passenger transport
(shares based on passenger-kilometres)
Road Railw ays
Inland
Waterw ays Pipeline
Denmark 79.5% 9.4% 0.0% 11.0%
EU-28 71.7% 17.4% 6.1% 4.8%
Modal split for freight transport
(shares based on tonne-kilometres)
2014 2016
LPI Rank 17 17
Score 3.78 3.82
Customs 13 14
Score 3.79 3.82
Infrastructure 17 24
Score 3.82 3.75
International shipments 9 15
Score 3.65 3.66
Logistics competence 18 9
Score 3.74 4.01
Tracking & tracing 36 25
Score 3.36 3.74
Timeliness 3 30
Score 4.39 3.92
Logistics performance indicator (LPI)
(World Bank)
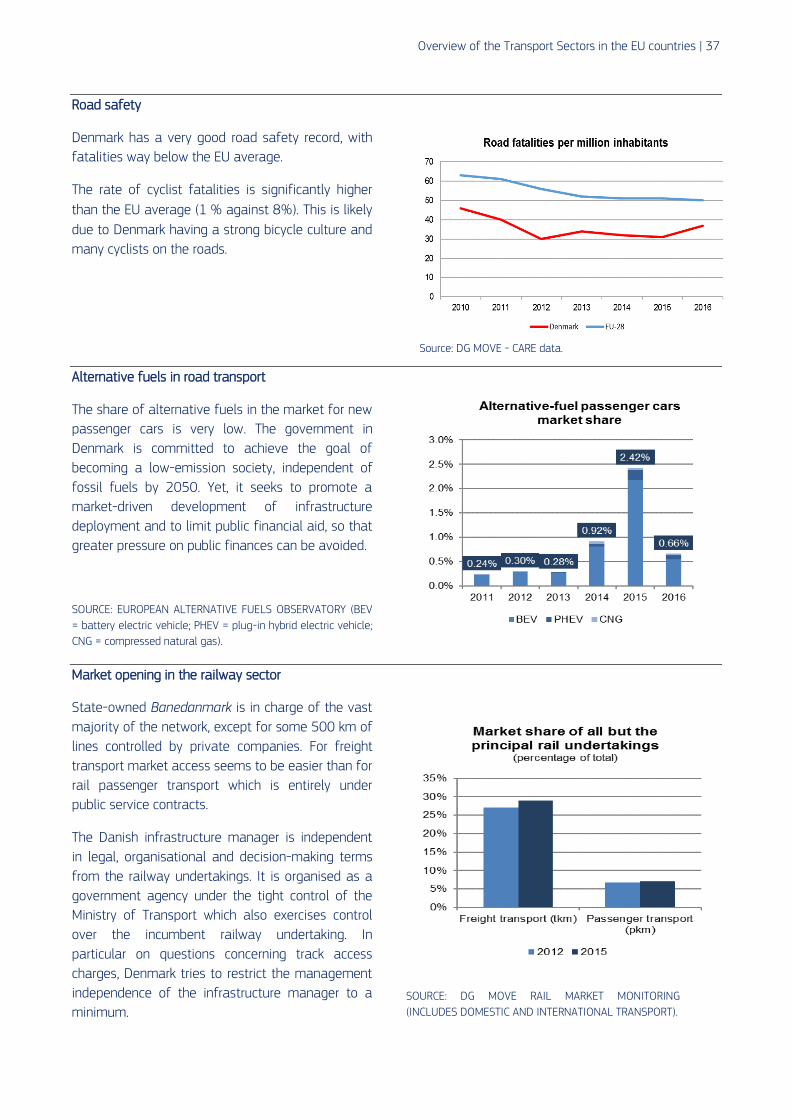
Overview of the Transport Sectors in the EU countries | 37
SOURCE: DG MOVE RAIL MARKET MONITORING
(INCLUDES DOMESTIC AND INTERNATIONAL TRANSPORT).
Road safety
Denmark has a very good road safety record, with
fatalities way below the EU average.
The rate of cyclist fatalities is significantly higher
than the EU average (1 % against 8%). This is likely
due to Denmark having a strong bicycle culture and
many cyclists on the roads.
Source: DG MOVE - CARE data.
Alternative fuels in road transport
The share of alternative fuels in the market for new
passenger cars is very low. The government in
Denmark is committed to achieve the goal of
becoming a low-emission society, independent of
fossil fuels by 2050. Yet, it seeks to promote a
market-driven development of infrastructure
deployment and to limit public financial aid, so that
greater pressure on public finances can be avoided.
SOURCE: EUROPEAN ALTERNATIVE FUELS OBSERVATORY (BEV
= battery electric vehicle; PHEV = plug-in hybrid electric vehicle;
CNG = compressed natural gas).
Market opening in the railway sector
State-owned Banedanmark is in charge of the vast
majority of the network, except for some 500 km of
lines controlled by private companies. For freight
transport market access seems to be easier than for
rail passenger transport which is entirely under
public service contracts.
The Danish infrastructure manager is independent
in legal, organisational and decision-making terms
from the railway undertakings. It is organised as a
government agency under the tight control of the
Ministry of Transport which also exercises control
over the incumbent railway undertaking. In
particular on questions concerning track access
charges, Denmark tries to restrict the management
independence of the infrastructure manager to a
minimum.

38 | Transport in the EU: Current Trends and Issues
Share of renewable energy in transport
The share of renewables in transport has remained
at a relatively high but unchanged level (and below
the 10 % target) for several years. Whilst Denmark
used to perform above the EU average, it is now
equal to the average.
Source: Eurostat.
Quality of the transport infrastructure in Denmark
Overall, Denmark scores relatively high in the
World Economic Forum (WEF) ranking on transport
infrastructure quality, but it is not among the top
performers. Its position in the international
comparison recently deteriorated, which could be
related to relatively low levels of investment in
infrastructure in the 2000s. The recent
improvements in the ranking could be linked with
the increase in transport infrastructure investment
in the years from 2010 to 2014 (from 0.5 % to
0.9 % of GDP).
Graph Source: World Economic Forum, The Global
Competitiveness Report. The bars represent the rank of the
country compared to the rest of the world, while the lines
represent the quality scores in a scale from 1 to 7.

Overview of the Transport Sectors in the EU countries | 39
Germany
Main current issues in Germany
Issue 1 - Competition in the railway market
More competition in the open-access passenger rail market by removing outstanding obstacles for potential
market entrants could benefit consumers in Germany.
More incentives for infrastructure managers could help to bring down costs of the infrastructure and limit
infrastructure charges.
Issue 2 - Investment in transport infrastructure
The recent increases in federal investments in transport infrastructure might be insufficient to meet
infrastructure investment requirements. An investment backlog in public infrastructure has cumulated notably in
financially weak municipalities.
The German Infrastructure Plan 2030 provides the basis for transport infrastructure investment planning in
Germany for the next 15 years. The Plan is of EU relevance, given the importance of upgrading in particular the
main transport axes which are also part of the TEN-T network.
The use of alternative funding instruments, such as public-private partnerships have not been used to a
substantial extent in Germany so far. Complex responsibilities, administrative bottlenecks and complicated
planning procedures are important barriers to investment. Efficiency and effectiveness of investment in
transport infrastructure are therefore not fully ensured.
Issue 3 - Application of German Minimum Wage Act to international transport operations on German territory
Germany, like other Member States, has introduced a minimum wage. The application of this measure to the
transport sector must ensure the balance between the social protection of workers and the basic principle of
freedom to provide cross-border services.
The application of minimum wage in a systematic way to all international transport operations, irrespective of
the time spent by a driver in a Member State, might be considered a restriction to the freedom to provide
services and the free movement of goods.
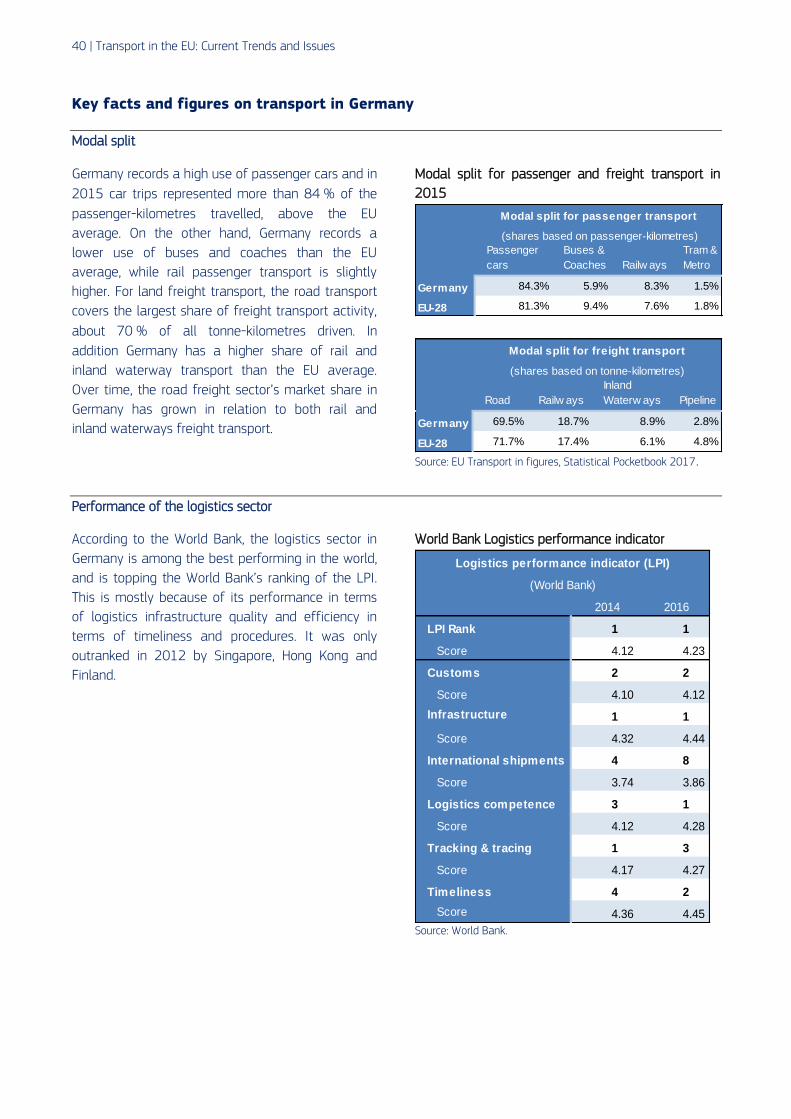
40 | Transport in the EU: Current Trends and Issues
Key facts and figures on transport in Germany
Modal split
Germany records a high use of passenger cars and in
2015 car trips represented more than 84 % of the
passenger-kilometres travelled, above the EU
average. On the other hand, Germany records a
lower use of buses and coaches than the EU
average, while rail passenger transport is slightly
higher. For land freight transport, the road transport
covers the largest share of freight transport activity,
about 70 % of all tonne-kilometres driven. In
addition Germany has a higher share of rail and
inland waterway transport than the EU average.
Over time, the road freight sector’s market share in
Germany has grown in relation to both rail and
inland waterways freight transport.
Modal split for passenger and freight transport in
2015
Source: EU Transport in figures, Statistical Pocketbook 2017.
Performance of the logistics sector
According to the World Bank, the logistics sector in
Germany is among the best performing in the world,
and is topping the World Bank’s ranking of the LPI.
This is mostly because of its performance in terms
of logistics infrastructure quality and efficiency in
terms of timeliness and procedures. It was only
outranked in 2012 by Singapore, Hong Kong and
Finland.
World Bank Logistics performance indicator
Source: World Bank.
Passenger
cars
Buses &
Coaches Railw ays
Tram &
Metro
Germany 84.3% 5.9% 8.3% 1.5%
EU-28 81.3% 9.4% 7.6% 1.8%
Modal split for passenger transport
(shares based on passenger-kilometres)
Road Railw ays
Inland
Waterw ays Pipeline
Germany 69.5% 18.7% 8.9% 2.8%
EU-28 71.7% 17.4% 6.1% 4.8%
Modal split for freight transport
(shares based on tonne-kilometres)
2014 2016
LPI Rank 1 1
Score 4.12 4.23
Customs 2 2
Score 4.10 4.12
Infrastructure 1 1
Score 4.32 4.44
International shipments 4 8
Score 3.74 3.86
Logistics competence 3 1
Score 4.12 4.28
Tracking & tracing 1 3
Score 4.17 4.27
Timeliness 4 2
Score 4.36 4.45
Logistics performance indicator (LPI)
(World Bank)

Overview of the Transport Sectors in the EU countries | 41
Road safety
The stock of registered passenger cars in Germany
has seen a steady increase in recent years to a total
of more than 45 million registered cars. While the
number of registered passenger cars is increasing,
the road fatalities have decreased. In 2016,
Germany reported 3 206 dead or 39 dead per
million inhabitants, the lowest figure ever (EU
average: 50).
Source: DG MOVE - CARE data.
Alternative fuels in road transport
The number of alternative-fuelled cars is increasing:
the number of new passenger cars using alternative
fuels has more than tripled over the period between
2011 (8 377) and 2015 (28 493).
Source: European Alternative Fuels Observatory (BEV = battery
electric vehicle; PHEV = plug-in hybrid electric vehicle; CNG =
compressed natural gas).
Market opening in the railway sector
There is no organisational and decision-making
independence of DB Netz from the Deutsche Bahn
(DB) holding. The holding exerts full management
control over DB Netz, as for the other subsidiaries.
In addition, DB Netz has to transfer its profits to the
holding.
Competition in the markets for passenger and
freight transport in Germany is continuing to
develop slowly. Market shares of the incumbent DB
still show monopolistic structures: 99% in long
distance passenger transport, about 80% in
regional passenger and about two thirds in freight
traffic. DB will keep this dominance if no measures
are taken. The development of long distance bus
traffic shows the market need for alternatives to
the incumbent in long distance rail services.
SOURCE: DG MOVE RAIL MARKET MONITORING (INCLUDES
DOMESTIC AND INTERNATIONAL TRANSPORT).

42 | Transport in the EU: Current Trends and Issues
Share of renewable energy in transport
The share of renewable energy in transport shows a
declining trend. Although it remained above the EU
average in 2015, the distance is growing to the
target share of 10% of renewable energy in
transport established by the Renewable Energy
Directive.
Source: Eurostat.
Quality of the transport infrastructure in Germany
Germany ranks among the top European countries
regarding the perception of its transport
infrastructure although numbers have been declining
in recent years especially in road and rail. The fall in
the subjective perception of the road quality can be
attributed to the rise in traffic congestion. Germany
is one of the top European countries in terms of time
spent in traffic (also due to the fact that it is a key
transit country).
Another underlying factor is the increasing concern
about the deteriorating state of the existing rail and
road infrastructure (in particular bridges) and
insufficient funds for road maintenance. The effects
of the recently increased public investment in the
infrastructure, especially in maintenance spending,
remains to be seen.
Graph Source: World Economic Forum, The Global
Competitiveness Report. The bars represent the rank of the
country compared to the rest of the world, while the lines
represent the quality scores in a scale from 1 to 7.
Overview of the Transport Sectors in the EU countries | 43
Estonia
Main current issues in Estonia
Issue 1 - Rail Baltica
In the context of the so-called Rail Baltica project, the Grant Agreement for the EUR 110 million allocated to the
Baltic States through the third Connecting Europe Facility call in 2016 has not been signed yet and is at risk. This
situation should be addressed by moving towards a much more integrated project delivery organisation. The
Commission is discussing this very actively with the authorities of the Baltic States.
Rail Baltica aims to link Warsaw via Elk, Kaunas and Riga to Tallinn by rail, with a connection to Vilnius. The
targeted date for completing the project (2025) was reaffirmed by the Intergovernmental Agreement ratified in
2017 by Estonia, Latvia and Lithuania. The updated cost-benefit analysis of the project, delivered in April 2017,
confirmed the expected positive impact on the economic growth in the region and on the environment due to
the likely modal shift from road to rail in passenger and freight transport (Ernst & Young Baltic Ltd (2017).69 In
October 2017, it was agreed to review the organisational setup of the Rail Baltica project in order to speed up
its implementation. The aim is to move to a highly integrated project delivery organisation, notably to ensure
the efficiency of EU funding in the framework of the Connecting Europe Facility, cost minimisation, full
interoperability and synchronisation of works.
Issue 2 - Greening of transport in Estonia
Estonia is unlikely to reach its 10 % target share of renewable energy in transport by 2020. The sales of
alternative fuel vehicles have decreased and greenhouse gas emissions from transport are increasing. Estonia
has the most environmentally unfriendly new vehicle fleet in the EU with an average CO2 emission of 137 grams
per kilometre compared to an EU average of 119 grams in 2015. Transport taxes (excluding fuel taxes) remain
amongst the lowest in the EU as there is no charge or CO2 based tax on vehicles applying to road transport,
although a new time-based charge on heavy goods vehicles was introduced in 2018.
Issue 3 - Investment sustainability
The sustainability of overall transport infrastructure is not ensured. Investments into transport infrastructure
depend mainly on EU funds with a focus on major projects, such as Rail Baltica. In particular, investment into
secondary infrastructure and maintenance of existing infrastructure is not actually ensured.
69 http://www.railbaltica.org/cost-benefit-analysis/.
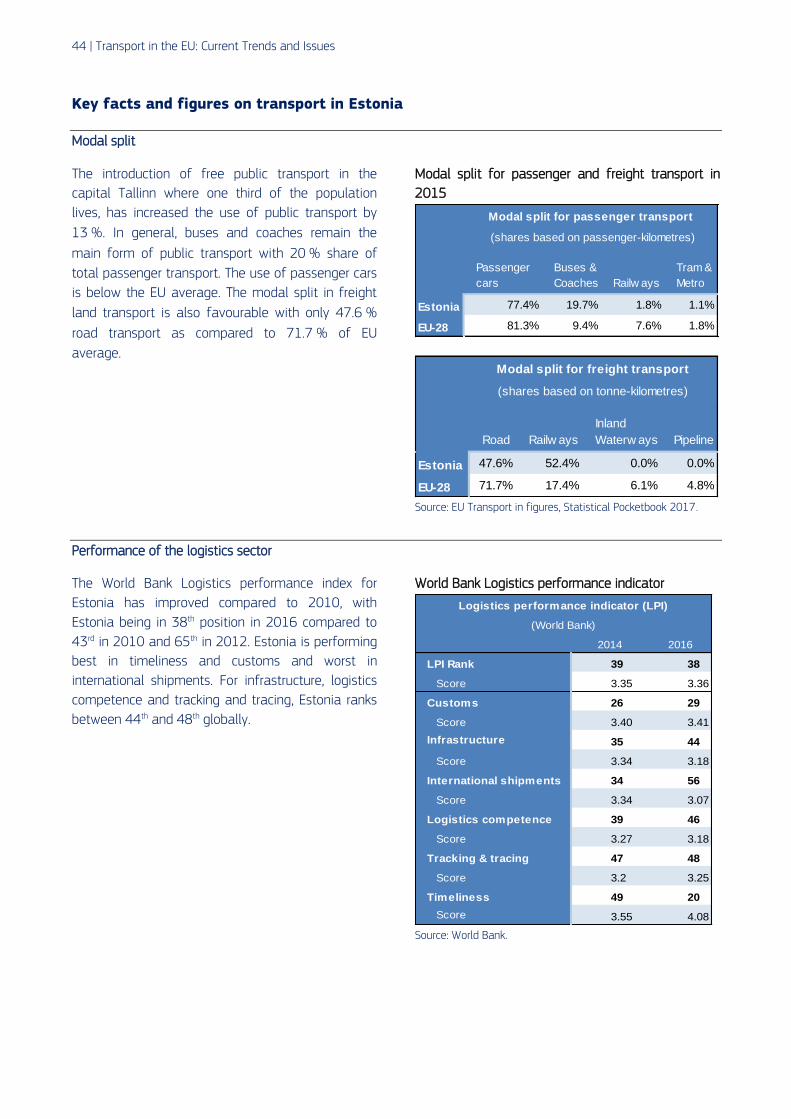
44 | Transport in the EU: Current Trends and Issues
Key facts and figures on transport in Estonia
Modal split
The introduction of free public transport in the
capital Tallinn where one third of the population
lives, has increased the use of public transport by
13 %. In general, buses and coaches remain the
main form of public transport with 20 % share of
total passenger transport. The use of passenger cars
is below the EU average. The modal split in freight
land transport is also favourable with only 47.6 %
road transport as compared to 71.7 % of EU
average.
Modal split for passenger and freight transport in
2015
Source: EU Transport in figures, Statistical Pocketbook 2017.
Performance of the logistics sector
The World Bank Logistics performance index for
Estonia has improved compared to 2010, with
Estonia being in 38th position in 2016 compared to
43rd in 2010 and 65th in 2012. Estonia is performing
best in timeliness and customs and worst in
international shipments. For infrastructure, logistics
competence and tracking and tracing, Estonia ranks
between 44th and 48th globally.
World Bank Logistics performance indicator
Source: World Bank.
Passenger
cars
Buses &
Coaches Railw ays
Tram &
Metro
Estonia 77.4% 19.7% 1.8% 1.1%
EU-28 81.3% 9.4% 7.6% 1.8%
Modal split for passenger transport
(shares based on passenger-kilometres)
Road Railw ays
Inland
Waterw ays Pipeline
Estonia 47.6% 52.4% 0.0% 0.0%
EU-28 71.7% 17.4% 6.1% 4.8%
Modal split for freight transport
(shares based on tonne-kilometres)
2014 2016
LPI Rank 39 38
Score 3.35 3.36
Customs 26 29
Score 3.40 3.41
Infrastructure 35 44
Score 3.34 3.18
International shipments 34 56
Score 3.34 3.07
Logistics competence 39 46
Score 3.27 3.18
Tracking & tracing 47 48
Score 3.2 3.25
Timeliness 49 20
Score 3.55 4.08
Logistics performance indicator (LPI)
(World Bank)

Overview of the Transport Sectors in the EU countries | 45
Source: DG MOVE Rail Market Monitoring (INCLUDES DOMESTIC AND INTERNATIONAL TRANSPORT)
Road safety
In 2016, there were about 54 road fatalities per
million inhabitants in Estonia. However, provisional
data for 2017 shows an impressive decrease of
32% on fatalities compared to 2% for the EU
average.
Fatalities in rural areas are highly over-represented
in Estonia compared to the EU average. The share
of pedestrian fatalities is significantly higher than
the EU average (31% versus 21%). Speeding has
increased on high speed rural roads in Estonia, as
well as the percentage of speed offenders.
The alcohol limit of 0.2‰ in Estonia is lower than
the common limit of 0.5‰ in the EU.
Source: DG MOVE - CARE data
.
Alternative fuels in road transport
Between 2012 and 2014, Estonia built up a nation-
wide network of fast-charger stations in the
framework of the Electro-Mobility Programme.
However, the number of registered new alternative
fuel vehicles declined significantly between 2014
and 2015 after abolition of a support scheme
demonstrating that without the direct support for
buying the specialised vehicles, the take up of
either electric or bio-methane run vehicles is
unlikely to be considerable. The Electro-Mobility
Programme helped to introduce slightly more than
1000 cars into circulation.
SOURCE: EUROPEAN ALTERNATIVE FUELS OBSERVATORY (BEV
= battery electric vehicle; PHEV = plug-in hybrid electric vehicle;
CNG = compressed natural gas).
Market opening in the railway sector
As regards the market share of all but principal rail
undertakings as an indicator of access to market for
new commercial operators, in rail freight Estonia
has an average share compared to other Member
States.
On the other hand, in passenger rail transport all
operations are run by a state-owned enterprise
since January 2014. This marks a re-nationalisation
of the sector after previous market opening.

46 | Transport in the EU: Current Trends and Issues
Share of renewable energy in transport
The current level of renewables in transport remains
at 0.4%. Estonia is unlikely to reach its 10% target
share of renewable energy in transport by 2020.
Estonia amended the Liquid Fuel Act with the aim
to incentivise biofuels and is promoting the use of
bio-methane in public transport trough
requirements in public transport concession tenders.
Excise tax policy is also used to promote LPG and
bio-methane use.
Source: Eurostat.
Quality of the transport infrastructure in Estonia
Compared to many other Member States that
joined since 2004, Estonia ranks highly in the
World Economic Forum’s ranking of infrastructure
quality. In particular, the port infrastructure is
considered to be of high quality.
The airport infrastructure, which was very low in
the past, has improved a lot since 2014. The
destinations directly accessible from Tallinn
international airport are increasing, waiting times
are short and the airport is well connected via
public transport. Tallinn airport is one of the first
airports in Europe with a tram connection to the
city centre.
The overall trend for the quality of land transport
infrastructure is positive since 2011. This is
despite Estonia having no highways and only
limited km of two-lane road. Overall progress of
improving the secondary road infrastructure is
slow. While the passenger railways have
considerably improved in recent years, there are
still only limited connections.
Graph Source: World Economic Forum, The Global
Competitiveness Report. The bars represent the rank of the
country compared to the rest of the world, while the lines
represent the quality scores in a scale from 1 to 7.
Overview of the Transport Sectors in the EU countries | 47
Ireland
Main current issues in Ireland
Issue 1 - Investment in transport infrastructure
Ireland invests less in transport infrastructure as a proportion of GDP compared to the other EU countries and
less than the estimated level needed to maintain the current system. Thus, while increased demand for
transport is driven by economic growth, investment in the sector is still constrained. There is a compelling case
for increased investment in the transport sector where issues are emerging which if not addressed may serve as
a constraint on continued economic growth. The issues are around both investment in new infrastructure in
particular for public transport, but also regarding the maintenance of the current primarily road infrastructure
which is not adequately resourced. Ireland also has a poorly developed railway infrastructure and the lowest rail
electrification rate in the EU (2.7% in 2015).70
Issue 2 –Use of public transport
Ireland’s urban transport policy emphasis to date has been on shifting commuters from their private cars to
other modes including public and sustainable transport. In 2017, 251 million passenger journeys were provided
by the bus operators Dublin Bus and Bus Éireann, the rail company Iarnród Éireann and the Dublin tramway
Luas on their public service obligation services. This was an increase of over 16 million passenger journeys, or
7% compared to 2016. The strong rebound of the Irish economy that started in 2014 has continued and gained
further momentum. This is already putting pressure on transport infrastructure and commuting times in urban
areas are increasing.
Issue 3 – Uptake rates for alternative fuels
Given that more needs to be done to promote alternative fuels in line with the Paris Agreement and the high
level of transport emissions, it is noted that diesel-powered vehicles account for 71 % of all new vehicle sales in
Ireland in 2016. The need for further public infrastructure investment has been demonstrated, in particular public
transport and cycling infrastructure in the main cities, and consideration needs to be given to the move away
from diesel fuelled public transport fleets.
Issue 4 – Brexit related issues
As the only EU country with a land-border with the United Kingdom, the movement of goods between Ireland
and the United Kingdom, including goods transiting the United Kingdom, will be affected by changes in post-
Brexit transit arrangements. Statistics for 2016 show that over 40% of maritime traffic from Ireland is with ports
in the United Kingdom. A smaller, but nonetheless significant share of Irish traffic to Great Britain uses ports in
Northern Ireland.71
Over 80% of Irish road freight to mainland Europe currently transits the United Kingdom using the so-called
"land-bridge route".72 It has been opined that this could travel directly by sea. This presupposes that there is
sufficient capacity at Irish ports to handle the increased volume of traffic. It also ignores the role of logistics in
supply chain management. In the case of Ireland, longer sea routes would entail much longer times for freight
than the current system of transiting through the United Kingdom.
70 Source: EU Transport in figures – statistical pocketbook 2017. 71 Source: Central Statistics Office Ireland, quoted in: T. Ferris (2017): “Implication of Brexit for Irelands Transport Sectors”, The Institute of International and European Affairs, Dublin, https://www.iiea.com/publication/implications-of-brexit-for-irelands-transport-sectors/. 72 Source: POLITICO (2017): “Brexit burns Ireland’s British bridge to EU markets”, https://www.politico.eu/article/cargo-food-production-producers-brexit-burns-irelands-british-bridge-to-eu-markets/.

48 | Transport in the EU: Current Trends and Issues
Key facts and figures on transport in Ireland
Modal split
Ireland shows a high level of reliance on cars for
passenger transport and in 2015 car trips
represented more than 80% of the passenger-
kilometres travelled, just below the EU average. On
the other hand, Ireland records a higher use of buses
and coaches than the EU average, while rail
passenger transport is less than half of the EU
average. For land freight transport, the road
transport covers almost the totality of the freight
transport activity, with 99% of all tonne-kilometres
driven. Rail accounts for the remaining 1%.
Modal split for passenger and freight transport in
2015
Source: EU Transport in figures, Statistical Pocketbook 2017.
Performance of the logistics sector
According to the World Bank, the performance of
Ireland’s logistics sector ranked 18 in worldwide
comparison.
In comparison to 2014, the performance has
worsened for almost all partial indicators, mainly
when it comes to customs procedures, but also
regarding logistics competence, the tracking of
shipments and the timeliness of deliveries.
World Bank Logistics performance indicator
Source: World Bank
Passenger
cars
Buses &
Coaches Railw ays
Tram &
Metro
Ireland 80.1% 16.6% 3.0% 0.3%
EU-28 81.3% 9.4% 7.6% 1.8%
Modal split for passenger transport
(shares based on passenger-kilometres)
Road Railw ays
Inland
Waterw ays Pipeline
Ireland 99.0% 1.0% 0.0% 0.0%
EU-28 71.7% 17.4% 6.1% 4.8%
Modal split for freight transport
(shares based on tonne-kilometres)
2014 2016
LPI Rank 11 18
Score 3.87 3.79
Customs 12 25
Score 3.80 3.47
Infrastructure 16 22
Score 3.84 3.77
International shipments 27 10
Score 3.44 3.83
Logistics competence 9 20
Score 3.94 3.79
Tracking & tracing 3 16
Score 4.13 3.98
Timeliness 16 29
Score 4.13 3.94
Logistics performance indicator (LPI)
(World Bank)
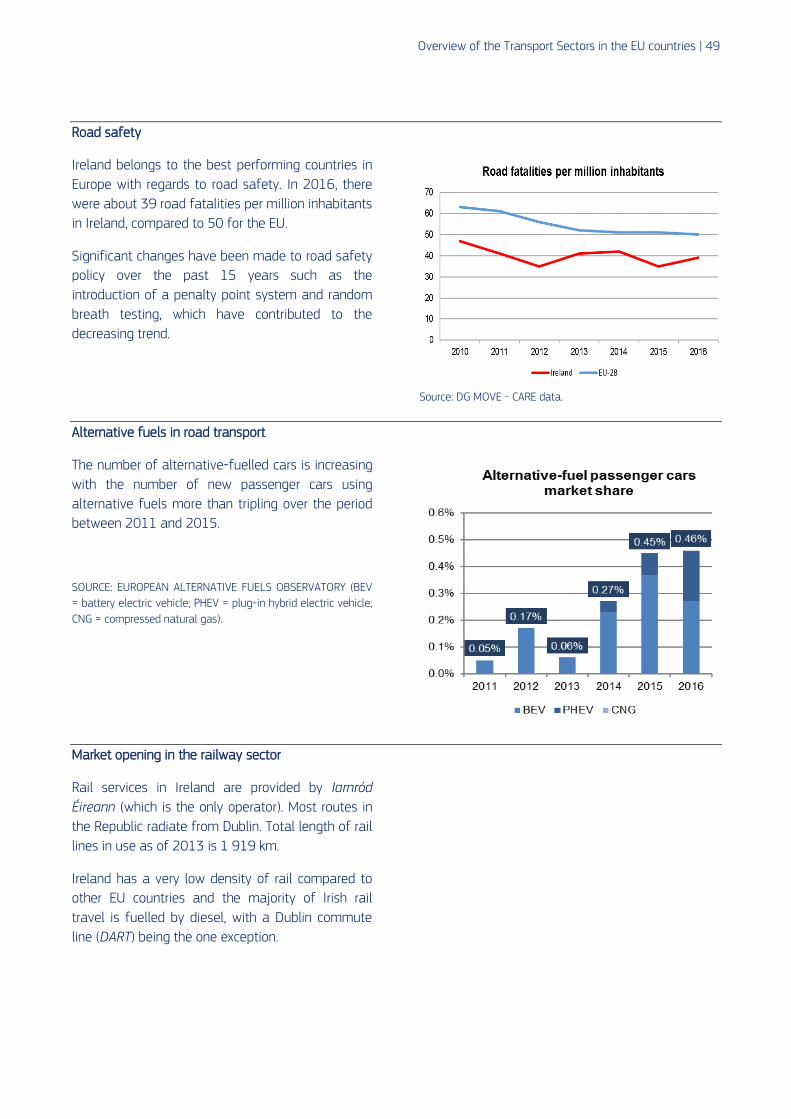
Overview of the Transport Sectors in the EU countries | 49
Road safety
Ireland belongs to the best performing countries in
Europe with regards to road safety. In 2016, there
were about 39 road fatalities per million inhabitants
in Ireland, compared to 50 for the EU.
Significant changes have been made to road safety
policy over the past 15 years such as the
introduction of a penalty point system and random
breath testing, which have contributed to the
decreasing trend.
Source: DG MOVE - CARE data.
Alternative fuels in road transport
The number of alternative-fuelled cars is increasing
with the number of new passenger cars using
alternative fuels more than tripling over the period
between 2011 and 2015.
SOURCE: EUROPEAN ALTERNATIVE FUELS OBSERVATORY (BEV
= battery electric vehicle; PHEV = plug-in hybrid electric vehicle;
CNG = compressed natural gas).
Market opening in the railway sector
Rail services in Ireland are provided by Iarnród
Éireann (which is the only operator). Most routes in
the Republic radiate from Dublin. Total length of rail
lines in use as of 2013 is 1 919 km.
Ireland has a very low density of rail compared to
other EU countries and the majority of Irish rail
travel is fuelled by diesel, with a Dublin commute
line (DART) being the one exception.
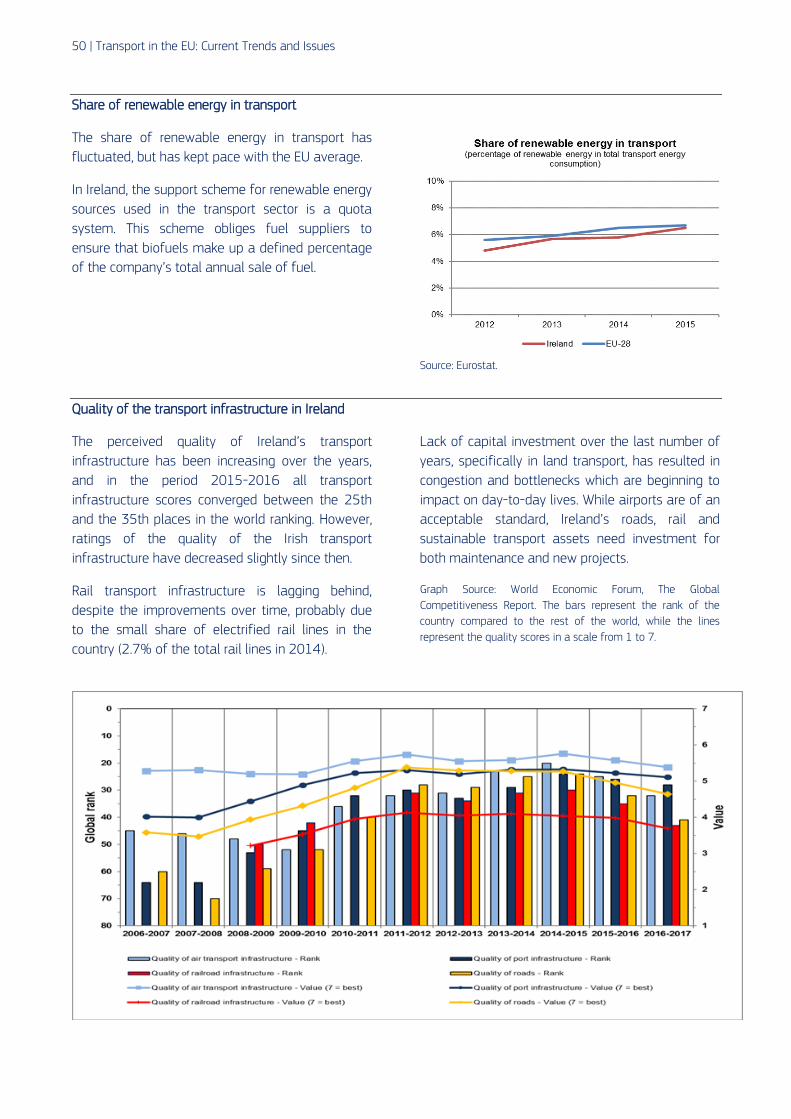
50 | Transport in the EU: Current Trends and Issues
Share of renewable energy in transport
The share of renewable energy in transport has
fluctuated, but has kept pace with the EU average.
In Ireland, the support scheme for renewable energy
sources used in the transport sector is a quota
system. This scheme obliges fuel suppliers to
ensure that biofuels make up a defined percentage
of the company’s total annual sale of fuel.
Source: Eurostat.
Quality of the transport infrastructure in Ireland
The perceived quality of Ireland’s transport
infrastructure has been increasing over the years,
and in the period 2015-2016 all transport
infrastructure scores converged between the 25th
and the 35th places in the world ranking. However,
ratings of the quality of the Irish transport
infrastructure have decreased slightly since then.
Rail transport infrastructure is lagging behind,
despite the improvements over time, probably due
to the small share of electrified rail lines in the
country (2.7% of the total rail lines in 2014).
Lack of capital investment over the last number of
years, specifically in land transport, has resulted in
congestion and bottlenecks which are beginning to
impact on day-to-day lives. While airports are of an
acceptable standard, Ireland’s roads, rail and
sustainable transport assets need investment for
both maintenance and new projects.
Graph Source: World Economic Forum, The Global
Competitiveness Report. The bars represent the rank of the
country compared to the rest of the world, while the lines
represent the quality scores in a scale from 1 to 7.
Overview of the Transport Sectors in the EU countries | 51
Greece
Main current issues in Greece
Issue 1 – Road Safety: high fatality rates
Greece has one of the highest fatality rates in the EU. The situation of vulnerable road users is of special
concern in Greece, in particular the high number of motorcyclists. Effectiveness of traffic law enforcement is
assessed as quite low. Seat-belt wearing rates are lower than the EU average.
Issue 2 – Rail freight and passenger traffic
The share of rail freight in the modal split remains low due to the sparse rail network, the non-developed
market, the missing links with the main sea ports and the different track gauges requiring transfer activities. The
modal share of rail passenger transport in land transport is one of the lowest in the EU.
Issue 3 – Rail infrastructure
The density of the rail network per surface and per population is one of the lowest in the EU. The limited
capacity of the railway lines place a limit on the number of high speed trains that can use the existing network.
The two different gauge systems (metric gauge in the Peloponnese and normal gauge in the rest of Greece) put
severe limitations on mainly cargo but also passenger traffic flows.
Issue 4 – Air: implementation of the law on the restructuring of the civil aviation authority
Law 4427/2016 on the restructuring of civil aviation authority has been adopted. However, the issuance of
secondary legislation (Presidential decrees) necessary for the compliance of the law with EU legislation is still
pending.
Issue 5 – Investment in infrastructure
Traditional funding sources, such as loan facilities and public investment programmes are becoming less
sustainable, shifting the financing focus to the private sector.
Issue 6 – Quality of port infrastructure
The extensive network of non-TEN-T ports is facing difficulties in obtaining the necessary funding to cover
maintenance and re-investment costs.

52 | Transport in the EU: Current Trends and Issues
Key facts and figures on transport in Greece
Modal split
Greece records a high use of passenger cars. In
2015 car trips represented more than 80% of the
passenger-kilometres travelled, close to the EU
average. Greece records a much lower use of
railways than the EU average. On the contrary the
share of buses and coaches passenger transport is
twice the EU average.
For land freight transport, road covers the largest
share of freight transport activity (about 97% of all
tonne-kilometres driven) leaving very small shares
for the other modes of transport.
Modal split for passenger and freight transport in
2015
Source: EU Transport in figures, Statistical Pocketbook 2017.
Performance of the logistics sector
The performance of the Greek logistics sector is
average in international comparison, according to
analysis carried out by the World Bank.
It should be noted, however, that the performance
has slightly deteriorated overall between 2014 and
2016, notably in terms of customs procedures and
logistics competence. At the same time, tracking,
tracing and timeliness of deliveries have improved.
World Bank Logistics performance indicator
Source: World Bank.
Passenger
cars
Buses &
Coaches Railw ays
Tram &
Metro
Greece 80.3% 17.3% 1.0% 1.4%
EU-28 81.3% 9.4% 7.6% 1.8%
Modal split for passenger transport
(shares based on passenger-kilometres)
Road Railw ays
Inland
Waterw ays Pipeline
Greece 97.3% 1.6% 0.0% 1.1%
EU-28 71.7% 17.4% 6.1% 4.8%
Modal split for freight transport
(shares based on tonne-kilometres)
2014 2016
LPI Rank 44 47
Score 3.2 3.24
Customs 28 55
Score 3.36 2.85
Infrastructure 42 37
Score 3.17 3.32
International shipments 62 64
Score 2.97 2.97
Logistics competence 40 60
Score 3.23 2.91
Tracking & tracing 61 30
Score 3.03 3.59
Timeliness 54 34
Score 3.5 3.85
Logistics performance indicator (LPI)
(World Bank)

Overview of the Transport Sectors in the EU countries | 53
Road safety
Road fatalities have decreased from 2010 to 2016
by 34% compared to the EU average of 19%.
Provisional data for 2017 show an impressive
decrease of 10% on fatalities compared to 2% on
average in the EU. However, current levels remain
significantly higher than the EU average and Greece
has by far the highest fatality rate amongst older
EU Member States (76 versus 44).
The situation of motorcyclists is of special concern
in Greece. The share of motorcyclist fatalities (29%)
is significantly higher than the EU average (14%).
Effectiveness of traffic law enforcement is
assessed as quite low. Seat-belt wearing rates are
lower than the EU average. Road-side surveys for
drink-driving have increased in recent years and the
percentage of offenders has decreased.
Source: DG MOVE - CARE data.
Alternative fuels in road transport
Greece generally has a very low share of alternative
fuels in its market for new passenger cars. The
main alternative fuel used is compressed natural
gas, however, amounts are marginal.
SOURCE: EUROPEAN ALTERNATIVE FUELS OBSERVATORY (BEV
= battery electric vehicle; PHEV = plug-in hybrid electric vehicle;
CNG = compressed natural gas).
Market opening in the railway sector
The state-owned railway company TRAINOSE has
been privatised and was 100% taken over by the
Italian Ferrovie Dello Stato in 2016. Ferrovie is
expected to increase commercial transport links as
well as passenger transport and has already raised
EUR 1 billion funding to proceed with investments
and upgrade the network.
These commercial transport links are expected to
further increase following the arrival of two new rail
freight carriers, Rail Cargo Logistics Goldair SA and
Piraeus Europe Asia Rail Logistics (Pearl) SA.
However, further liberalisation and increase of rail's
modal share remains a big challenge for Greece.

54 | Transport in the EU: Current Trends and Issues
Share of renewable energy in transport
The share of renewables in transport accounted
for only 1.4% in 2015, against an objective of
10% by 2020.
Source: Eurostat.
Quality of the transport infrastructure in Greece
According to the Global Competitiveness Report of
the World Economic Forum, Greece ranks 53rd
among all countries regarding the perception of its
transport infrastructure. The rising trend in the
perception of the road quality can be attributed to
the impending completion of the Motorways
network. On the other hand, perceptions on the
quality of the air infrastructure show a declining
trend, probably reflecting the lack of investments
in regional airports.
Graph Source: World Economic Forum, The Global
Competitiveness Report. The bars represent the rank of the
country compared to the rest of the world, while the lines
represent the quality scores in a scale from 1 to 7.

Overview of the Transport Sectors in the EU countries | 55
Spain
Main current issues in Spain
Issue 1 - Competition in freight and passenger rail services
In railways, the market share of the incumbent operator (RENFE Operadora) has dropped to about 83% in 2015
in the freight market, while it remained at 100% in the passenger market. For the passenger market, Spain
announced its intention to open up the market to competition several years ago, but has continued to postpone
market opening. The opening of the passenger rail market has now been postponed until 2020 (i.e. when it
becomes mandatory by virtue of the 4th Railway Package). Work on the transposition of the market pillar of the
4th Railway Package is underway: a draft law with amendments to the current railway sector legislative
framework is in public consultation and its adoption is expected in 2018.
On the freight transport side, new operators, in addition to RENFE Operadora, are emerging since the railway
network was opened up to competition, but this process is very slow.
Issue 2 - Completion of Spain's rail TEN-T Core Network by 2030
The completion of Spain's TEN-T rail Core Network by 2030 could raise concerns given the current pace of
implementation. Cross-border rail traffic of freight trains from Spain into France and Portugal remains a
bottleneck for completing the Atlantic and Mediterranean corridors. The different gauges used in the
neighbouring countries constitute a key barrier to the improvement of Spain's rail connectivity. Increased
cooperation between Spain, France and Portugal in the implementation of rail interoperability would help to
overcome these obstacles.
Issue 3 - Spanish freight transport relies mainly on road for the intra-EU trade exchanges
Serious road congestion problems appear repeatedly at cross-border points with France (Irun-Hendaye, La
Jonquera). The Motorways of the Sea could help to address the problem. However, a prerequisite is the
improvement of the hinterland connections, in particular freight railway links, between ports in the Atlantic
façade (e.g. Gijon) and in the Mediterranean coast (e.g. Valencia, Murcia), and the industrial production centres in
the interior of the Iberian Peninsula. This would include a better use of the rail infrastructure for freight transport.
Issue 4 - Competition in port services to raise ports' efficiency and competitiveness
Spanish ports play an important role for regional development purposes. A national long-term strategy for port
development, establishing investment priorities for ports according to their role and function would help to
ensure a better use of the extensive network of Spanish ports. In line with that strategy, ports should be able to
adopt more efficient pricing policies, facilitating maritime trade options and ensuring long term recovery of
infrastructural costs.
Issue 5 – Electro-mobility
The Spanish National Policy Framework submitted under the Directive 2014/94/EU on the deployment of
alternative fuels infrastructure has neither defined targets for electric vehicles nor for electric recharging points.
On the other hand, a significant development is foreseen for natural gas vehicles (CNG and LNG) and liquefied
petroleum gas (LPG) vehicles.

56 | Transport in the EU: Current Trends and Issues
Key facts and figures on transport in Spain
Modal split
Road transport is predominant with a share of more
than 90% of the total inland passenger transport in
2015, 3% less than in 2007, and 89% of the total
inland freight transport.
In 2015 as in 2014, there is a notable increase in
inland passenger’s transport by road, which is a
turning point, since there have been uninterrupted
decreases since 2010. Regarding the other modes,
the growing importance of rail transport can be
noted, although its share in the modal split is still
low compared to the EU average.
Modal split for passenger and freight transport in
2015
Source: EU Transport in figures, Statistical Pocketbook 2017.
Performance of the logistics sector
According to the World Bank, the logistics sector in
Spain has been performing slightly worse in
international comparison in 2016 compared to
2014. This is mostly because of a deterioration in
competence and quality of logistics services
(trucking, forwarding, and customs brokerage).
World Bank Logistics performance indicator
Source: World Bank.
Passenger
cars
Buses &
Coaches Railw ays
Tram &
Metro
Spain 79.9% 11.7% 6.6% 1.8%
EU-28 81.3% 9.4% 7.6% 1.8%
Modal split for passenger transport
(shares based on passenger-kilometres)
Road Railw ays
Inland
Waterw ays Pipeline
Spain 89.3% 5.6% 0.0% 5.1%
EU-28 71.7% 17.4% 6.1% 4.8%
Modal split for freight transport
(shares based on tonne-kilometres)
2014 2016
LPI Rank 18 23
Score 3.72 3.73
Customs 19 24
Score 3.63 3.48
Infrastructure 20 25
Score 3.77 3.72
International shipments 21 22
Score 3.51 3.63
Logistics competence 12 23
Score 3.83 3.73
Tracking & tracing 26 23
Score 3.54 3.82
Timeliness 17 26
Score 4.07 4
Logistics performance indicator (LPI)
(World Bank)

Overview of the Transport Sectors in the EU countries | 57
Road safety
During the last strategy period 2001-2010, Spain
reduced the number of road traffic fatalities by
55%, well over the EU target of halving road
deaths. The figures for 2016 show 39 deaths per
million inhabitants and a 27% reduction in the
number of fatalities in relation to 2010 (EU
average: 19%). However this trend has slowed
down in both Spain and the EU overall since 2013.
The best improvements over the last years are seen
for young people and less for motorcyclists and
pedestrians. Source: DG MOVE - CARE data.
Alternative fuels in road transport
The Spanish National Policy Framework estimates a
comparably low share of roughly 0.5 % electric
vehicles on the road in 2020 and focusses on LPG
and natural gas, for which substantial infrastructure
is already in place. It considers strong growth of
CNG and LPG vehicles and establishes appropriate
refuelling infrastructure targets consistent with the
vehicle projections.
Spain plans the deployment of 20 publicly
accessible hydrogen refuelling points and 500
hydrogen fuel cell vehicles by 2020.
SOURCE: EUROPEAN ALTERNATIVE FUELS OBSERVATORY (BEV
= battery electric vehicle; PHEV = plug-in hybrid electric vehicle;
CNG = compressed natural gas).
Market opening in the railway sector
The market share of the incumbent operator –
RENFE – has dropped to 74% in 2015 in the freight
market, while it remained at 100% in the passenger
market.
The opening of the passenger rail market has now
been postponed until 2020.
On the freight market, new operators are emerging
very slowly, mainly because the amount of rolling
stock for lease is very limited.
SOURCE: DG MOVE RAIL MARKET MONITORING (INCLUDES
DOMESTIC AND INTERNATIONAL TRANSPORT).

58 | Transport in the EU: Current Trends and Issues
Share of renewable energy in transport
The share of renewable energy in transport is very
low (less than 2%) and very far from achieving the
10% of renewable energy in transport established
by the Renewable Energy Directive.
The Spanish Government has started to apply
biofuels sustainability criteria in 2016, which will
make it possible to count biofuels towards the
renewable energy targets.
Source: Eurostat.
Quality of the transport infrastructure in Spain
Spain has managed to maintain its high score for
the perceived quality of its infrastructure until
recently. The last two years show a small
deterioration in the scores which has also affected
Spain's position in the ranking. Given that the reverse
in the trend is rather recent and not very significant,
the underlying factors are still undefined.
Graph Source: World Economic Forum, The Global
Competitiveness Report. The bars represent the rank of the
country compared to the rest of the world, while the lines
represent the quality scores in a scale from 1 to 7.

Overview of the Transport Sectors in the EU countries | 59
France
Main current issues in France
Issue 1 – Law on minimum wage in the road transport sector
Because of the decline of the road haulage sector in France, largely caused by competition from central and
eastern European countries, France has taken a rather protectionist stance in relation to road haulage in the last
few years. Notably, it has adopted a law concerning an application of the French minimum wage to the transport
sector, which entered into force in July 2016. The application of this measure to the transport sector must
ensure the balance between the social protection of workers and the basic principle of freedom to provide cross-
border services. Applying the minimum wage in a systematic way to all international transport operations,
irrespective of the time spent by a driver in a Member State, could restrict the freedom to provide services and
the free movement of goods. Therefore, the Commission decided on 16 June 2016 to address a letter of Formal
Notice to France. The case is currently pending, since negotiations in Council have started on the Commission
proposal for a lex specialis on the application of posting of workers rules to the road transport sector.
Issue 2 – Rail reform
France has been reforming its railway market since August 2014. The general reform law of 2014 received the
Commission's conditional approval. This took the form of an exchange of letters with the French Transport
Minister, based on assurances about the future content of the required implementing decrees. The reform
process has been highly controversial. While rail workers' unions protested against the risk of 'social dumping',
the rail regulatory body ARAFER adopted critical opinions on certain aspects of the reform which it considered
insufficiently pro-competitive. Issues are: guarantees of the independence of SNCF Réseau, management of
passenger stations, and the need for a new 'performance contract' between the State and SNCF Réseau to
ensure sufficient financing for infrastructure. Infringement proceedings were brought against France for failure
to communicate the transposition.

60 | Transport in the EU: Current Trends and Issues
Key facts and figures on transport in France
Modal split
Car trips represented more than 80% of the
passenger-kilometres travelled in France in 2015.
This remains slightly below the EU average of
81.3%. On the other hand, France records a lower
use of buses and coaches than the EU average,
while rail passenger transport is higher. For land
freight transport, the road transport covers the
largest share of freight transport activity, about 82%
of all tonne-kilometres driven. In addition France has
a much lower share of rail and inland waterway
transport than the EU average: combined, they
represent only 14% of land freight transport in
2015, compared to 23.5% at EU level.
Modal split for passenger and freight transport in
2015
Source: EU Transport in figures, Statistical Pocketbook 2017.
Performance of the logistics sector
The logistics sector in France only ranks 16th in the
World Bank’s 2016 ranking of the LPI. This is way
below the performances of Germany (1st),
Luxembourg (2nd), Sweden (3rd), the Netherlands (4th),
Belgium (6th), Austria (7th) and the United Kingdom
(8th). The main weaknesses are in international
shipments, customs and logistics competence (all
ranked below 4 out of 5 on the performance scale).
World Bank Logistics performance indicator
Source: World Bank.
Passenge
r cars
Buses &
Coaches Railw ays
Tram &
Metro
France 80.5% 7.8% 9.9% 1.8%
EU-28 81.3% 9.4% 7.6% 1.8%
Modal split for passenger transport
(shares based on passenger-kilometres)
Road Railw ays
Inland
Waterw ays Pipeline
France 82.2% 11.2% 2.8% 3.8%
EU-28 71.7% 17.4% 6.1% 4.8%
Modal split for freight transport
(shares based on tonne-kilometres)
2014 2016
LPI Rank 13 16
Score 3.85 3.9
Customs 18 17
Score 3.65 3.71
Infrastructure 13 15
Score 3.98 4.01
International shipments 7 20
Score 3.68 3.64
Logistics competence 15 19
Score 3.75 3.82
Tracking & tracing 12 15
Score 3.89 4.02
Timeliness 13 13
Score 4.17 4.25
Logistics performance indicator (LPI)
(World Bank)

Overview of the Transport Sectors in the EU countries | 61
Road safety
While the stock of registered vehicles in France has
slightly increased, the road fatalities have
decreased between 2010 and 2016 by 13% (EU
average: 19%), although this trend has slowed
down in both France and the EU overall since 2013.
In 2016, there were about 54 road fatalities per
million inhabitants in France, compared to 64 in
2010.
Source: DG MOVE - CARE data.
Alternative fuels in road transport
The number of alternative-fuelled cars is increasing with
the number of new passenger cars using alternative
fuels multiplying by more than 10 for the period between
2011 and 2016.
The number of electric charging points in France has
increased significantly over the period from 2013 to
2016. The largest increases were observed between
2014 and 2016, when the number of charging points
went from 1 834 to 15 843 units.
SOURCE: EUROPEAN ALTERNATIVE FUELS OBSERVATORY (BEV
= battery electric vehicle; PHEV = plug-in hybrid electric vehicle;
CNG = compressed natural gas).
Market opening in the railway sector
The French domestic rail passenger market remains
closed. The legal monopoly of State-owned
incumbent SNCF must disappear in 2019 (when the
4th Railway Package takes effect).
There is an on-going reflection on a change in the
management of passenger stations, which is
currently entrusted to the incumbent SNCF and has
been identified as an obstacle to market opening by
the regulatory body.
SOURCE: DG MOVE RAIL MARKET MONITORING (INCLUDES
DOMESTIC AND INTERNATIONAL TRANSPORT).
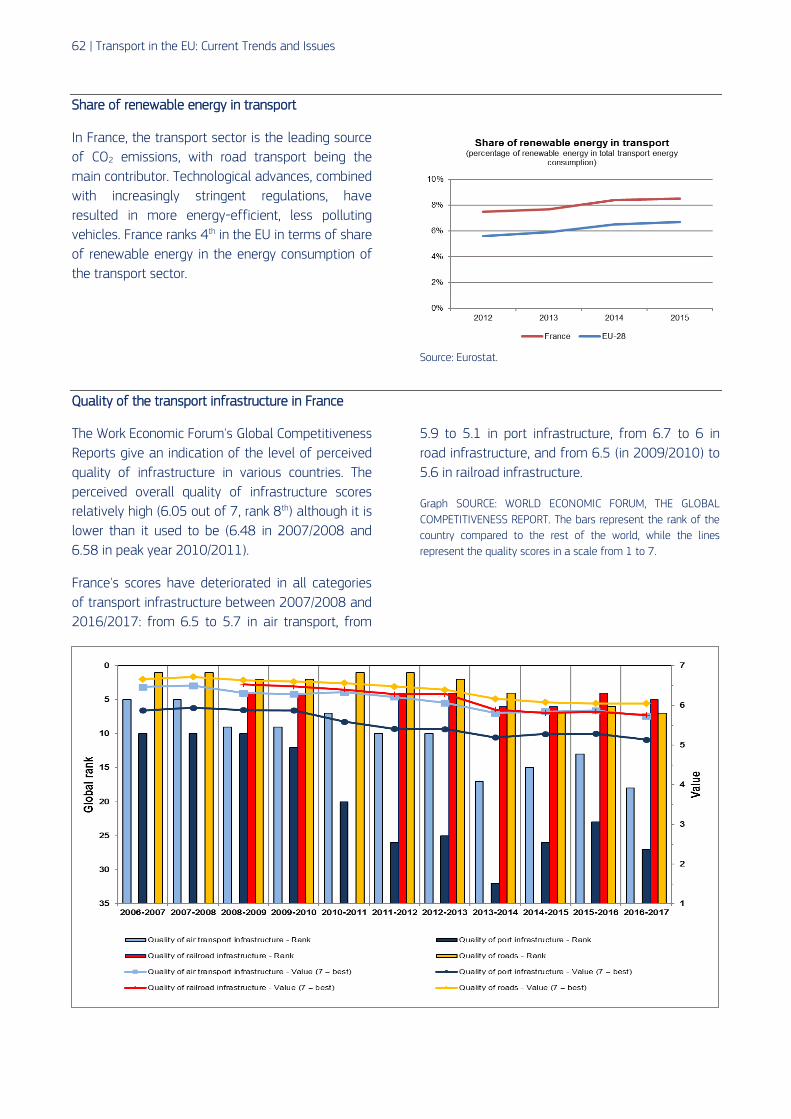
62 | Transport in the EU: Current Trends and Issues
Share of renewable energy in transport
In France, the transport sector is the leading source
of CO2 emissions, with road transport being the
main contributor. Technological advances, combined
with increasingly stringent regulations, have
resulted in more energy-efficient, less polluting
vehicles. France ranks 4th in the EU in terms of share
of renewable energy in the energy consumption of
the transport sector.
Source: Eurostat.
Quality of the transport infrastructure in France
The Work Economic Forum's Global Competitiveness
Reports give an indication of the level of perceived
quality of infrastructure in various countries. The
perceived overall quality of infrastructure scores
relatively high (6.05 out of 7, rank 8th) although it is
lower than it used to be (6.48 in 2007/2008 and
6.58 in peak year 2010/2011).
France's scores have deteriorated in all categories
of transport infrastructure between 2007/2008 and
2016/2017: from 6.5 to 5.7 in air transport, from
5.9 to 5.1 in port infrastructure, from 6.7 to 6 in
road infrastructure, and from 6.5 (in 2009/2010) to
5.6 in railroad infrastructure.
Graph SOURCE: WORLD ECONOMIC FORUM, THE GLOBAL
COMPETITIVENESS REPORT. The bars represent the rank of the
country compared to the rest of the world, while the lines
represent the quality scores in a scale from 1 to 7.

Overview of the Transport Sectors in the EU countries | 63
Croatia
Main current issues in Croatia
Issue 1 - Competitiveness of the rail market
The status of railway infrastructure lags significantly behind the EU average. Completion of the core TEN-T rail
network in Croatia stands at 5-6%, compared to the EU average of 60%. The outdated and limited rail
infrastructure results in low competitiveness, low quality of service and a general preference for other transport
modes, in particular road, where the quality of infrastructure is significantly higher. However, costs and the
negative environmental impacts are also higher for road infrastructure.
Despite recent improvements, restrictive regulations and policies still dominate the railway market in Croatia. In
order to improve competitiveness and quality of services and to further develop rail infrastructure, potential
measures could include removing regulatory restrictions, implementing open and transparent tendering
procedures, and facilitating the cooperation between state-owned enterprises, private operators, and
infrastructure managers.
Productivity appears to be particularly weak in Croatian state-owned enterprises, including the three which are
market-dominant in the rail sector. This may negatively affect the overall productivity of the industries in which
they operate.
Good hinterland transport by rail would positively affect ports by improving their cargo handling capacities and
connections to EU markets. A competitive railway market with modern infrastructure creates jobs and can
generate growth for the Croatian economy overall.
Issue 2 – Renewable energy in transport
Croatia is lagging behind with the uptake of renewable energy in the transport sector. The reduction of CO2
emissions from transport is at risk. Among other measures, a modal shift to rail could contribute to achieving
CO2 emission targets.
Issue 3 - Road safety
Despite a substantial decrease of the fatality rate since 2008, Croatia is one of the countries with the highest
fatality rates among the EU Member States.
Croatia reduced its number of road deaths by a comparably low 34 % between 2001 and 2010 (EU average
43%). Croatia further reduced road deaths by 28 % between 2010 and 2016 (EU average: 19%).
In 2016, Croatia was still among the five worst performing EU countries in terms of road safety. The initial data
for 2017 indicates a continuation of the negative trend, with Croatia being among the three Member States with
the highest number of fatalities per million inhabitants in 2017.
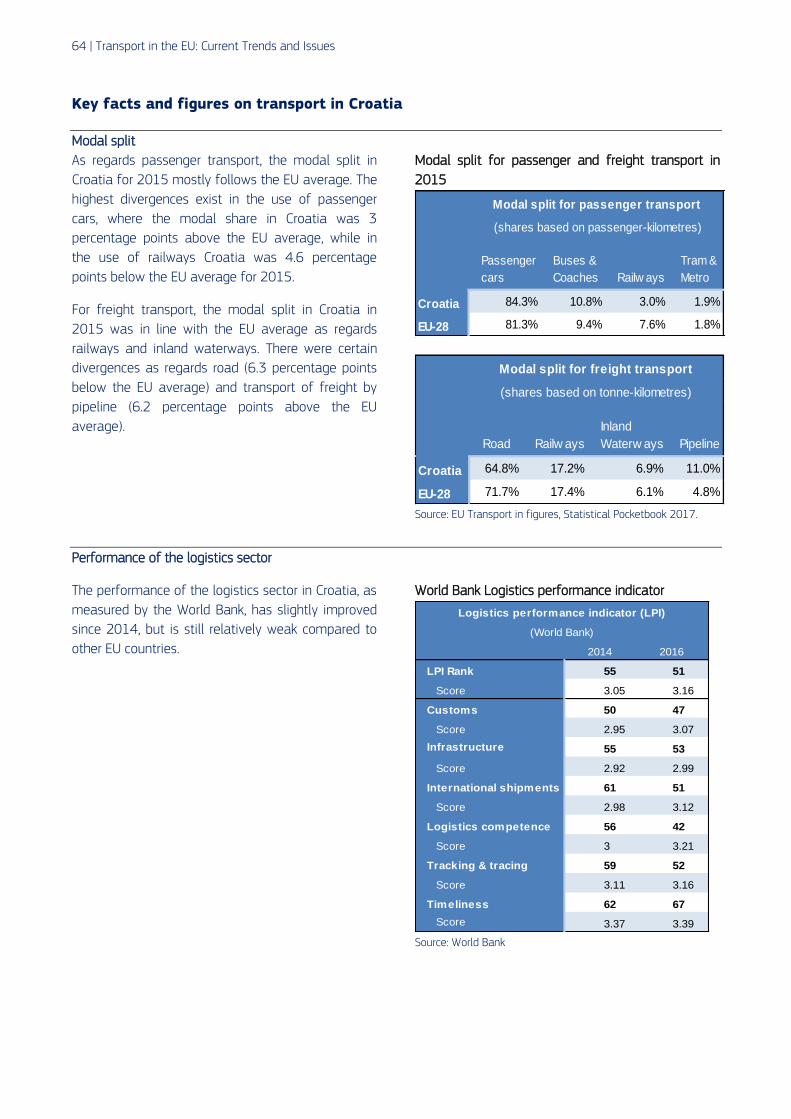
64 | Transport in the EU: Current Trends and Issues
Key facts and figures on transport in Croatia
Modal split
As regards passenger transport, the modal split in
Croatia for 2015 mostly follows the EU average. The
highest divergences exist in the use of passenger
cars, where the modal share in Croatia was 3
percentage points above the EU average, while in
the use of railways Croatia was 4.6 percentage
points below the EU average for 2015.
For freight transport, the modal split in Croatia in
2015 was in line with the EU average as regards
railways and inland waterways. There were certain
divergences as regards road (6.3 percentage points
below the EU average) and transport of freight by
pipeline (6.2 percentage points above the EU
average).
Modal split for passenger and freight transport in
2015
Source: EU Transport in figures, Statistical Pocketbook 2017.
Performance of the logistics sector
The performance of the logistics sector in Croatia, as
measured by the World Bank, has slightly improved
since 2014, but is still relatively weak compared to
other EU countries.
World Bank Logistics performance indicator
Source: World Bank
Passenger
cars
Buses &
Coaches Railw ays
Tram &
Metro
Croatia 84.3% 10.8% 3.0% 1.9%
EU-28 81.3% 9.4% 7.6% 1.8%
Modal split for passenger transport
(shares based on passenger-kilometres)
Road Railw ays
Inland
Waterw ays Pipeline
Croatia 64.8% 17.2% 6.9% 11.0%
EU-28 71.7% 17.4% 6.1% 4.8%
Modal split for freight transport
(shares based on tonne-kilometres)
2014 2016
LPI Rank 55 51
Score 3.05 3.16
Customs 50 47
Score 2.95 3.07
Infrastructure 55 53
Score 2.92 2.99
International shipments 61 51
Score 2.98 3.12
Logistics competence 56 42
Score 3 3.21
Tracking & tracing 59 52
Score 3.11 3.16
Timeliness 62 67
Score 3.37 3.39
Logistics performance indicator (LPI)
(World Bank)

Overview of the Transport Sectors in the EU countries | 65
Road safety
As regards road safety, Croatia lags significantly
behind the EU average, placing it among the least
safe Member States as regards fatalities in road
transport. In 2010, there were 99 road fatalities per
million inhabitants in Croatia, compared to the EU
average of 63 for the same year.
Croatia has followed the general EU trend of
decreasing road fatalities in the period between
2010 and 2016. The number of fatalities per
million inhabitants in 2016 was 73 which is still
significantly above the EU average of 50 for the
same year, as well as the EU average at the start of
the reference period in 2010.
Source: DG MOVE - CARE data.
Alternative fuels in road transport
The uptake of alternative fuels in road transport is
very low.
Croatia has communicated limited information to
the Commission on future scenarios for most
alternative fuels in the transport sector. For all fuels
and some modes, Croatia establishes targets. Yet,
there is a lack of concrete measures to encourage
and facilitate the deployment of recharging points.
SOURCE: EUROPEAN ALTERNATIVE FUELS OBSERVATORY (BEV
= battery electric vehicle; PHEV = plug-in hybrid electric vehicle;
CNG = compressed natural gas).
Market opening in the railway sector
Despite recent improvements, restrictive regulations
and policies still dominate the rail sector. The
dominant market position of the existing three rail
state-owned companies (HŽ Infrastruktura, HŽ
Putnički prijevoz, HŽ Cargo) prevents the
development of private rail enterprises in Croatia.
For example, HŽ Cargo accounted for around 91 %
of freight transport in the first three quarters of
2016, while in passenger rail transport the
incumbent continues to hold 100 % of the market.
In this latter segment, Croatia does not make use of
competitive tendering, but only of direct award to
the state-owned incumbent passenger operator.
The infrastructure manager HŽ Infrastruktura does
not have an asset register which forms the basis of
efficient asset management strategies. On the
positive side, Croatian ports have lifted a major
barrier by publishing complete lists of access
conditions and prices of rail-related services.

66 | Transport in the EU: Current Trends and Issues
Share of renewable energy in transport
Croatia has overall exceeded its 2020 target of
20% renewable energy, with a renewable energy
share of 28.2% in 2016. However, Croatia is
significantly lagging behind the 2020 target of 10%
of renewable energy sources in transport. Since
2013, the share of renewable energy sources in
transport is decreasing in Croatia.
The high share of passenger cars and the low
uptake of alternative fuels in road transport might
contribute to this development. Electrification of the
railway is poor in Croatia.
Source: Eurostat.
Quality of the transport infrastructure in Croatia
The overall quality of transport infrastructure can
be considered satisfactory on average. In
particular, the intensive investments in road
infrastructure have resulted in a dense road
network of high quality.
The quality of port infrastructure is satisfactory,
although further investments to increase capacity
and quality of service would be welcome both for
inland and seaports.
Investments in airport infrastructure have
increased over the recent years. In particular, a
new main terminal has been constructed at
Zagreb Airport, while a multi-phased investment is
ongoing at Dubrovnik Airport with the goal to
increase capacity and improve quality.
Croatia’s railway infrastructure is significantly
lagging behind. This is due to the lack of
infrastructure investments and maintenance over
a longer period of time.
The lack of quality of rail infrastructure has
resulted in the reduction of average speeds on the
network (for freight and passenger transport),
contributing to long journeys, low quality of service
and a shift to other transport modes, in particular
road.
Graph Source: World Economic Forum, The Global
Competitiveness Report. The bars represent the rank of the
country compared to the rest of the world, while the lines
represent the quality scores in a scale from 1 to 7.

Overview of the Transport Sectors in the EU countries | 67
Italy
Main current issues in Italy
Issue 1 - Quality of transport infrastructure
Italy performs below EU average in all the main infrastructure quality indicators. The poor performance has
negative effects on Italy's economic activities. People in Italy spent almost 38 hours in traffic congestion in
2016.73 As a result, the level of satisfaction of economic operators and the general public with national
infrastructures is low.
For ports, the lack of intermodal connections with the hinterland remains one of the major causes of inefficiency.
The situation is particularly difficult in the southern regions where only 8 % of ship berths are connected to the
inland railway network versus 48% in the north.
There is still a gap between north and south in terms of infrastructure endowment and traffic management
technology, which creates disparities, notably as regards the safety of regional railways.
Issue 2 – Performance of public transport, in particular local transport
Among the five largest economies in the EU, Italy shows the lowest ratio of operational revenues to operational
costs both in rural and metropolitan areas. The government recognises the need to improve such a ratio and has
established an Observatory (Osservatorio Nazionale sulle politiche del Trasporto Pubblico Locale) to monitor the
efficiency of transport undertakings performing public services.
A report published by the Observatory in May 2017 confirms the poor economic performance of local transport
and the high subsidies required. Although penalties are foreseen in the legislation for under-achievers, according
to the Ministry for Transport this system of penalties has not been fully applied. The revenues are also affected
by the low level of public transport fares and fare evasion.
Issue 3 – Competition in transport services
Increased use of competitive tendering of public service contracts is key to improve the quality and cost-
effectiveness of services. In the railway sector, only 5 regions have organised competitive tenders to date, and
three were unsuccessful due to legal action. Many regions have already directly awarded rail contracts to
Trenitalia which bind them over 15 years due to the company's investments in new rolling stock. The repeatedly
announced privatisation of the railway incumbent company (Ferrovie dello Stato) has not materialised so far. In
2017, the Italian Competition Authority found that the requirement to hold a national railway licence to operate
domestic rail passenger services hampered competitive entry.
As regards motorways, beyond the chronic issue of directly awarded motorway concessions, there is still no
competition on the market for electronic tolling systems.
Issue 4 - Safety of regional railways
After an accident leading to the death of 80 passengers in the southern region of Apulia in 2016, serious
shortcomings in the safety of rail infrastructure on 3000 km of local/regional lines managed by the regions
73 Source: EU Transport Scoreboard.

68 | Transport in the EU: Current Trends and Issues
became apparent. Italian authorities adopted a decree whereby the responsibilities over the regional lines
became subject to supervision by the National Safety Authority and subject to the application of safety
requirements in line with EU rules. The Italian historical operator has agreed to take over this infrastructure and
the government has pledged EUR 300 million of investments to improve the quality of infrastructure and align it
to the required safety standards.

Overview of the Transport Sectors in the EU countries | 69
Key facts and figures on transport in Italy
Modal split
Although Italy records a high use of passenger cars
and in 2015 car trips represented more than 80 % of
the passenger-kilometres travelled, this remains
slightly below the EU average. The use of buses and
coaches is above-average in Italy, however use of
rail, tram and metro remains below the EU average.
For freight, road haulage accounts for a very high
proportion of tonne-kilometres transported. Inland
waterways do not play a role in freight transport in
Italy.
Modal split for passenger and freight transport in
2015
Source: EU Transport in figures, Statistical Pocketbook 2017.
Performance of the logistics sector
According to the World Bank, the logistics sector in
Italy ranks 21st in the world, and 12th in an EU-wide
comparison. The sector suffers from fragmentation
and lack of digitalisation. Multi-modal integration to
promote accessibility and logistics connectivity could
also help to improve the sector’s performance.
World Bank Logistics performance indicator
Source: World Bank.
Passenger
cars
Buses &
Coaches Railw ays
Tram &
Metro
Italy 80.7% 12.2% 6.2% 0.8%
EU-28 81.3% 9.4% 7.6% 1.8%
Modal split for passenger transport
(shares based on passenger-kilometres)
Road Railw ays
Inland
Waterw ays Pipeline
Italy 81.4% 12.6% 0.0% 5.9%
EU-28 71.7% 17.4% 6.1% 4.8%
Modal split for freight transport
(shares based on tonne-kilometres)
2014 2016
LPI Rank 20 21
Score 3.69 3.76
Customs 29 27
Score 3.36 3.45
Infrastructure 19 19
Score 3.78 3.79
International shipments 17 17
Score 3.54 3.65
Logistics competence 23 21
Score 3.62 3.77
Tracking & tracing 14 20
Score 3.84 3.86
Timeliness 22 22
Score 4.05 4.03
Logistics performance indicator (LPI)
(World Bank)

70 | Transport in the EU: Current Trends and Issues
Road safety
Italy has an average position with respect to the
annual amount of fatalities per million inhabitants.
In 2016, Italy reported 3 283 dead or 54 dead per
million inhabitants, the lowest figure ever (EU
average: 50).
The share of fatalities among motorcyclists is,
however, alarmingly high: Italy represents 12 % of
the EU population, 25 % of the PTW stock and 18%
of all motorcycle fatalities. Furthermore, only
around 68% of motorcyclists and mopedists wear a
helmet. Source: DG MOVE - CARE data.
Alternative fuels in road transport
After some years of positive development, the
market share of new alternative-fuel passenger
cars has decreased again considerably.
For 2020, Italy estimates low shares of new sales
(1% - 3%) of electric vehicles and of electric
vehicles on the road (0.1% - 0.3%).
CNG has the largest share of alternative fuels in
new passenger cars. Italy has a dense network of
public refuelling points, especially in the northern
regions. Nevertheless, on a country level, Italy
currently does not, nor will it in the near future,
meet the level of at least one CNG refuelling point
per 600 CNG vehicles on the road.
SOURCE: EUROPEAN ALTERNATIVE FUELS OBSERVATORY (BEV
= battery electric vehicle; PHEV = plug-in hybrid electric vehicle;
CNG = compressed natural gas).
Market opening in the railway sector
At the legislative level, the rail market is already
open in Italy. However, competition is still limited,
with the notable exception of the high speed rail
segment.
The entrenched position of the railway incumbent
makes market entry difficult. The Italian national
railway company Ferrovie dello Stato SpA is
organised as a holding that controls both the
infrastructure manager (RFI) and the incumbent
operator, (Trenitalia) which has a very high market
share in both passenger and freight transport.
Italian law allows regions to freely tender their
public service contracts, but very few have done so.
Moreover, some legal restrictions to competition
remain, such as licence requirements.
Source: DG MOVE Rail Market Monitoring (INCLUDES DOMESTIC
AND INTERNATIONAL TRANSPORT)
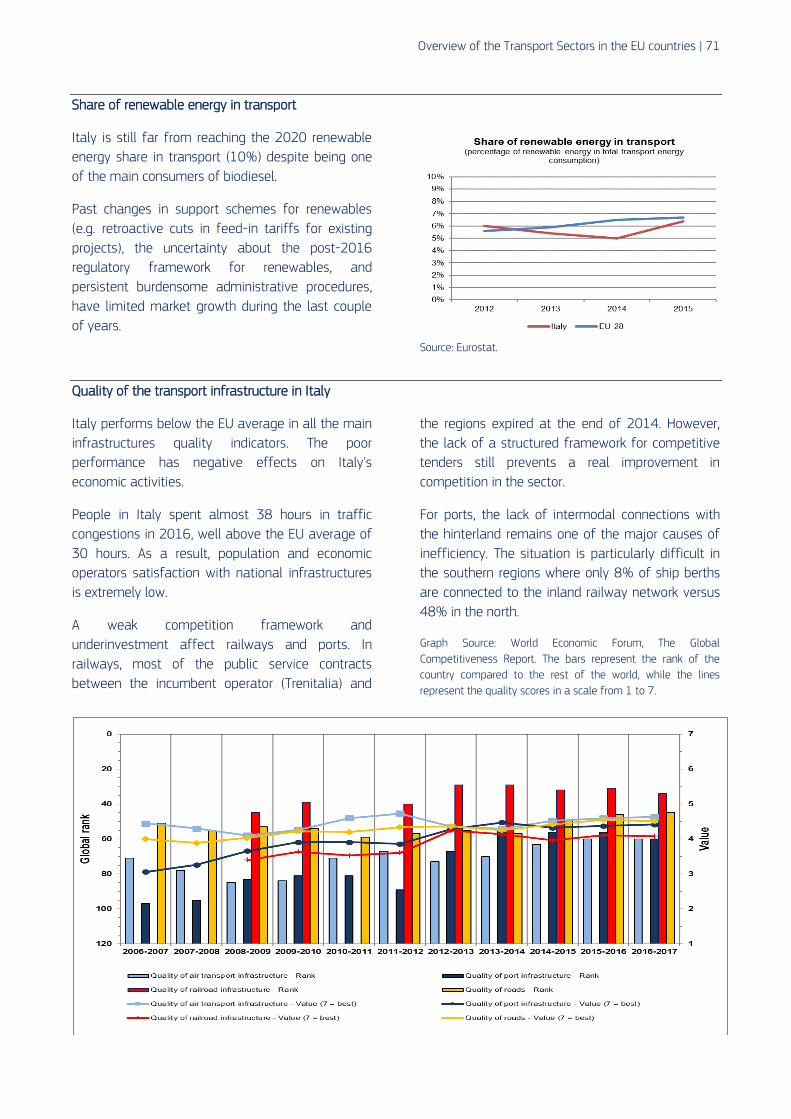
Overview of the Transport Sectors in the EU countries | 71
Share of renewable energy in transport
Italy is still far from reaching the 2020 renewable
energy share in transport (10%) despite being one
of the main consumers of biodiesel.
Past changes in support schemes for renewables
(e.g. retroactive cuts in feed-in tariffs for existing
projects), the uncertainty about the post-2016
regulatory framework for renewables, and
persistent burdensome administrative procedures,
have limited market growth during the last couple
of years.
Source: Eurostat.
Quality of the transport infrastructure in Italy
Italy performs below the EU average in all the main
infrastructures quality indicators. The poor
performance has negative effects on Italy's
economic activities.
People in Italy spent almost 38 hours in traffic
congestions in 2016, well above the EU average of
30 hours. As a result, population and economic
operators satisfaction with national infrastructures
is extremely low.
A weak competition framework and
underinvestment affect railways and ports. In
railways, most of the public service contracts
between the incumbent operator (Trenitalia) and
the regions expired at the end of 2014. However,
the lack of a structured framework for competitive
tenders still prevents a real improvement in
competition in the sector.
For ports, the lack of intermodal connections with
the hinterland remains one of the major causes of
inefficiency. The situation is particularly difficult in
the southern regions where only 8% of ship berths
are connected to the inland railway network versus
48% in the north.
Graph Source: World Economic Forum, The Global
Competitiveness Report. The bars represent the rank of the
country compared to the rest of the world, while the lines
represent the quality scores in a scale from 1 to 7.

72 | Transport in the EU: Current Trends and Issues
Cyprus
Main current issues in Cyprus
Issue 1 – Reliance on road transport produces negative externalities
The reliance on roads for inland transport fuels a number of policy challenges, e.g. the struggle to reduce air
pollution and greenhouse gas emissions, the dependency on imported oil products and the sensitivity of the
economy to changes in oil prices. It also leads to severe congestion in urban areas during peak hours and on
roads to and from ports.
Issue 2 – Conflict with Turkey impacts on merchant ship fleet
The restrictive measures imposed by the Turkish Government on ships flying the Cypriot flag have been
acknowledged as being contrary to the provisions of the Customs Union Agreement between the EU and Turkey
and the Protocol thereto, which extends the Agreement to the States which became members of the EU in 2004.
They are an obstacle for Cypriot merchant ships willing to engage in freight transport for trade with the
neighbouring country.
Issue 3 – Air traffic management
Cyprus had issues with the implementation of the new air traffic management system LEFCO. The contract to
buy and install LEFCO was signed in 2003 and the system was initially earmarked for a September 2005
delivery, however its delivery had been delayed over technical and compatibility issues. The government is
looking to acquire a new air traffic management system after terminating the contract for the purchase and
installation of LEFCO. In the meantime, Civil Aviation is upgrading its current primary traffic control system and
has installed a new backup system. The current infrastructure will support the smooth running of air traffic
control for the next four to five years. In February 2013, after a new tendering round, the Government selected
the Thales group to modernise the air traffic management system in Cyprus in cooperation with Cyta, the Cyprus
Telecommunication Authority.
Due to the current political division of the country, flights crossing the Cypriot-Turkish boundary experience
difficulties in communication, since no coordination exists between the air traffic control units of Cyprus and
Turkey. Moreover, Ercan, a station established in the areas of the island controlled by Turkey, interferes with air
traffic issuing instructions to pilots, which could impair flight safety.
Issue 4 – Uptake of renewable energy and alternative fuels in transport
Cyprus has a very low share of renewables in transport and to date no public policy that would incentivise
increasing that share. Moreover, the uptake of alternative fuels in the overly represented road transport mode is
extremely low. The Cypriot government’s ambitions to increase the share of electric vehicles in the country’s car
fleet appear to be modest.

Overview of the Transport Sectors in the EU countries | 73
Key facts and figures on transport in Cyprus
Modal split
Cyprus has no railways and no inland waterways. All
inland transport activities are by road.
Modal split for passenger and freight transport in
2015
Source: EU Transport in figures, Statistical Pocketbook 2017.
Performance of the logistics sector
The World Bank Logistics performance indicator for
Cyprus remains almost unchanged in 2016
compared to 2014. In international comparison, the
Cypriot sector’s performance is average, although
the timeliness of deliveries has improved.
World Bank Logistics performance indicator
Source: World Bank.
Passenger
cars
Buses &
Coaches Railw ays
Tram &
Metro
Cyprus 81.3% 18.7% 0.0% 0.0%
EU-28 81.3% 9.4% 7.6% 1.8%
Modal split for passenger transport
(shares based on passenger-kilometres)
Road Railw ays
Inland
Waterw ays Pipeline
Cyprus 100.0% 0.0% 0.0% 0.0%
EU-28 71.7% 17.4% 6.1% 4.8%
Modal split for freight transport
(shares based on tonne-kilometres)
2014 2016
LPI Rank 58 59
Score 3 3
Customs 53 44
Score 2.88 3.11
Infrastructure 59 52
Score 2.87 3
International shipments 60 78
Score 3.01 2.8
Logistics competence 63 76
Score 2.92 2.72
Tracking & tracing 65 98
Score 3 2.54
Timeliness 65 38
Score 3.31 3.79
Logistics performance indicator (LPI)
(World Bank)

74 | Transport in the EU: Current Trends and Issues
Road safety
Road fatalities in Cyprus are above the EU average.
Yet, the trend in road safety is generally positive.
The number of road deaths decreased by 39%
between 2001 and 2010 (the EU average was -
43%), and Cyprus further reduced the number of
road deaths by 23% between 2010 and 2016
(19% reduction at EU level).
It should be noted that small countries like Cyprus
tend to have bigger fluctuations from one year to
the next and that the long-term trend is the most
important indicator in these cases.
Source: DG MOVE - CARE data.
Alternative fuels in road transport
Alternative fuels in new passenger cars are almost
non-existent in Cyprus. Current policies aim at
increasing the share of electric vehicles, but
projections are very modest.
SOURCE: EUROPEAN ALTERNATIVE FUELS OBSERVATORY (BEV
= battery electric vehicle; PHEV = plug-in hybrid electric vehicle;
CNG = compressed natural gas).
Share of renewable energy in transport
With a 2.5% share in 2015, Cyprus is lagging
behind in the use of renewable energy sources in
transport and may have difficulties reaching the
binding 10% target by 2020. Currently there is no
support scheme or public incentive for the
promotion of renewable energy in the transport
sector in Cyprus.
Source: Eurostat.
0,00% 0,00% 0,00%0,04%
0,29% 0,31%
0,0%
0,1%
0,2%
0,3%
0,4%
2011 2012 2013 2014 2015 2016
Alternative-fuel passenger cars market share
BEV PHEV CNG
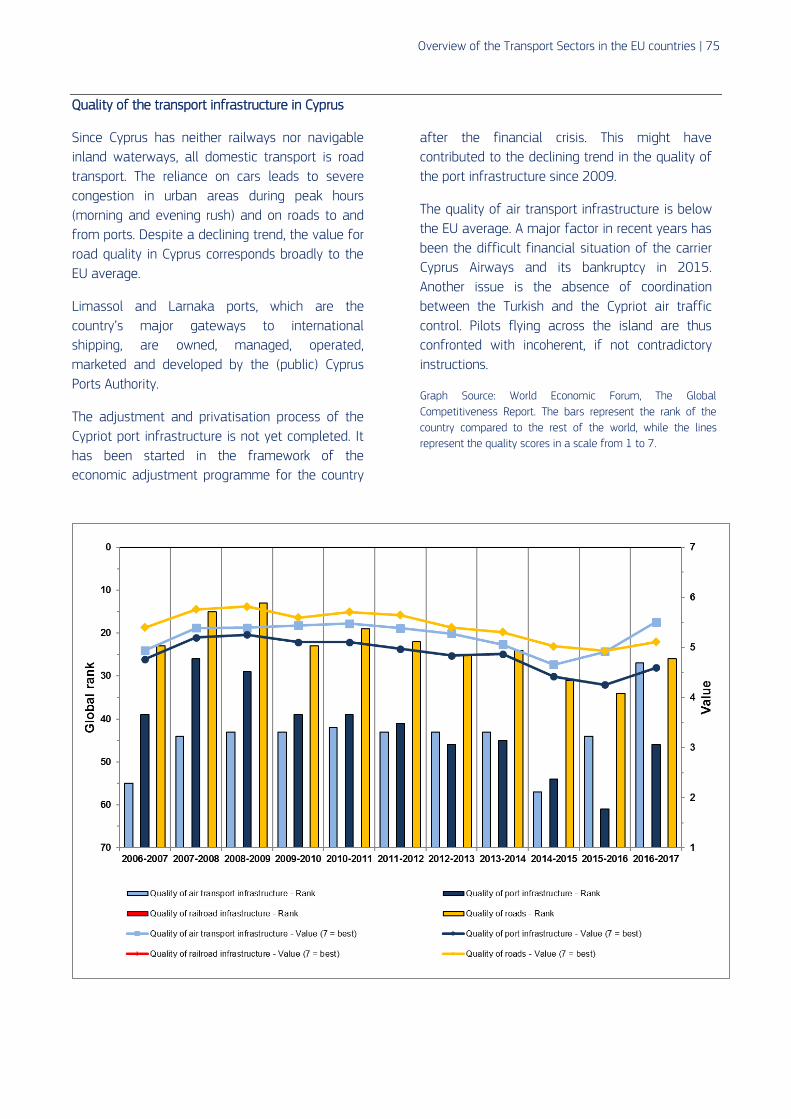
Overview of the Transport Sectors in the EU countries | 75
Quality of the transport infrastructure in Cyprus
Since Cyprus has neither railways nor navigable
inland waterways, all domestic transport is road
transport. The reliance on cars leads to severe
congestion in urban areas during peak hours
(morning and evening rush) and on roads to and
from ports. Despite a declining trend, the value for
road quality in Cyprus corresponds broadly to the
EU average.
Limassol and Larnaka ports, which are the
country’s major gateways to international
shipping, are owned, managed, operated,
marketed and developed by the (public) Cyprus
Ports Authority.
The adjustment and privatisation process of the
Cypriot port infrastructure is not yet completed. It
has been started in the framework of the
economic adjustment programme for the country
after the financial crisis. This might have
contributed to the declining trend in the quality of
the port infrastructure since 2009.
The quality of air transport infrastructure is below
the EU average. A major factor in recent years has
been the difficult financial situation of the carrier
Cyprus Airways and its bankruptcy in 2015.
Another issue is the absence of coordination
between the Turkish and the Cypriot air traffic
control. Pilots flying across the island are thus
confronted with incoherent, if not contradictory
instructions.
Graph Source: World Economic Forum, The Global
Competitiveness Report. The bars represent the rank of the
country compared to the rest of the world, while the lines
represent the quality scores in a scale from 1 to 7.

76 | Transport in the EU: Current Trends and Issues
Latvia
Main current issues in Latvia
Issue 1 – Quality of road infrastructure
In Latvia, the poor (and deteriorating) quality of road infrastructure is an important obstacle to safe and efficient
transport. It also leads to congestion in the vicinity of Riga.
Issue 2 – Rail connections with the rest of the EU countries
The development of railway traffic between the Baltic States and the rest of the EU countries, as well as the
efficient functioning of the railway market in Latvia, is affected by a missing high quality North-South rail link,
the difference in the track gauges (respectively 1520 and 1435 mm) and different signalling systems. The Rail
Baltica project could help remedy these issues. There is potential for improvement or creation of intermodal
terminals and suitably located, efficient transhipment terminals between the broad-gauge network and
standard-gauge Rail Baltica line.
Issue 3 – Competition in the maritime transport
Transparency and governance of port authorities is problematic and has created obstacles to competition in the
maritime transport market. Port authorities (owned by the municipalities and governed jointly by municipalities
and the central government) have to perform commercial activities in compliance with the existing regulatory
framework.
Issue 4 - Emissions from road transport
Reducing emissions and final energy consumption in the road sector is a key challenge in Latvia. Despite having
one of the lowest GDP per capital in the EU, Latvia is one of the countries with the highest emissions from new
passenger cars. The shares of renewable energy in the transport sector and of alternative fuels in the passenger
car fleet are very low.

Overview of the Transport Sectors in the EU countries | 77
Key facts and figures on transport in Latvia
Modal split
Latvia has a relatively high share of public transport
in its modal split for passenger transport.
The largest part of freight transport in Latvia is done
via railways (almost 75%). Inland waterways do not
play any role for freight transport.
Modal split for passenger and freight transport in
2015
Source: EU Transport in figures, Statistical Pocketbook 2017.
Performance of the logistics sector
According to the analysis of the World Bank, the
performance of the logistics sector in Latvia has
remained stable overall in its absolute score
between 2014 and 2016, but its global ranking has
deteriorated.
In particular, for the areas of customs and
international shipments the results are weak.
Developments seem more positive when it comes to
infrastructure.
World Bank Logistics performance indicator
Source: World Bank.
Passenger
cars
Buses &
Coaches Railw ays
Tram &
Metro
Latvia 81.7% 14.0% 3.6% 0.8%
EU-28 81.3% 9.4% 7.6% 1.8%
Modal split for passenger transport
(shares based on passenger-kilometres)
Road Railw ays
Inland
Waterw ays Pipeline
Latvia 18.7% 73.7% 0.0% 7.7%
EU-28 71.7% 17.4% 6.1% 4.8%
Modal split for freight transport
(shares based on tonne-kilometres)
2014 2016
LPI Rank 36 43
Score 3.4 3.33
Customs 35 45
Score 3.22 3.11
Infrastructure 51 41
Score 3.03 3.24
International shipments 33 44
Score 3.38 3.28
Logistics competence 42 37
Score 3.21 3.29
Tracking & tracing 30 39
Score 3.5 3.42
Timeliness 19 49
Score 4.06 3.62
Logistics performance indicator (LPI)
(World Bank)

78 | Transport in the EU: Current Trends and Issues
Road safety
Road fatalities in Latvia are among the highest in
the EU, 80 dead per million inhabitants versus 50 in
the EU on average. However Latvia reduced road
deaths by 28% between 2010 and 2016 (EU
average 19%) and provisional 2017 data show an
impressive decrease of 14% (2% at EU level).
The share of pedestrian fatalities is significantly
higher (38 %) than the EU average (21%), whereas
the share of motorcyclist fatalities (6%) is lower
than the EU average (14%).
The worst trend is among pedestrians, where the
fatality numbers are increasing. Pedestrians are
overrepresented in fatalities compared to their
share in other EU countries (35% versus 21%).
Source: DG MOVE - CARE data.
Alternative fuels in road transport
The share of alternative fuelled cars in total sales
of new cars on the Latvian market is very small and
numbers seem to be decreasing. This is particularly
noteworthy, as Latvia has particularly high CO2
emissions from its passenger car fleet.
SOURCE: EUROPEAN ALTERNATIVE FUELS OBSERVATORY (BEV
= battery electric vehicle; PHEV = plug-in hybrid electric vehicle;
CNG = compressed natural gas).
Market opening in the railway sector
In Latvia, the infrastructure manager is separate
from the rail service operators.
The domestic markets for freight and passenger rail
transport are open for competition, but only a few
operators are active on the Latvian market.
For many companies, the difference in track gauges
represents an obstacle to market access.
Freight traffic is dominated by transit cargo from
Russia and Belarus (as well as from countries
further afield) to the three main ports of the
country. Latvia’s high railway-share of tonne-km in
freight transport is mainly due to high transit
volumes.
Source: DG MOVE Rail Market Monitoring (INCLUDES DOMESTIC
AND INTERNATIONAL TRANSPORT).
0,01%0,09%
0,34%
1,40%
0,43%0,28%
0,0%
0,2%
0,4%
0,6%
0,8%
1,0%
1,2%
1,4%
1,6%
2011 2012 2013 2014 2015 2016
Alternative-fuel passenger cars market share
BEV PHEV CNG

Overview of the Transport Sectors in the EU countries | 79
Share of renewable energy in transport
The share of renewables in the Latvian transport
sector is stagnating significantly below the EU
average.
The main support scheme for the increased use of
renewable energy in transport sector is a blending
obligation of biofuels into liquid transport fuels.
Source: Eurostat.
Quality of the transport infrastructure in Latvia
In terms of infrastructure quality, Latvia receives
relatively good ratings from the World Economic
Forum for its railway and maritime infrastructure.
However, the road infrastructure is in very poor
condition and the situation has not improved in the
last 10 years.
Graph Source: World Economic Forum, The Global
Competitiveness Report. The bars represent the rank of the
country compared to the rest of the world, while the lines
represent the quality scores in a scale from 1 to 7.

80 | Transport in the EU: Current Trends and Issues
Lithuania
Main current issues in Lithuania
Issue 1 - Road safety
Lithuania is one of the EU countries with high road fatality rates despite the significant decreases that have
been recorded since 2007.
In 2016, Lithuania reported 192 dead or 66 dead per million (EU average: 50), an impressive improvement
compared to 2015 (-21 %). However, preliminary figures for 2017 suggest stagnation in the reduction of
fatalities.
Issue 2 - Competition in the rail market
No new entrants have emerged in rail freight and passenger transport markets over the period of 2010-2014
and in practice, competition does not exist in the Lithuanian rail market which is legally opened to competition.
However, there are positive signs: a new independent regulatory body has been established and has started its
activities. This is seen as an important prerequisite for creating favourable conditions for new entrants.
Issue 3 - Renewable energy in transport
There is no progress on the share of renewable energy in transport. The share of renewable energy in fuel
consumption of transport is decreasing: 4.3% in 2014, 4.6% in 2015 and 3.6% in 2016.
Issue 4 - Electrification in rail
The Lithuanian rail network remains among the lowest electrified rail networks in the EU. No progress has been
observed over the period of 2010-2014 and only 6.9% % of rail tracks are electrified.74 However, with the help
of different financial and funding instruments progress is expected over the coming years.
74 Source: Eurostat 2016. Only Ireland has a lower level of electrification constituting 2.7%.

Overview of the Transport Sectors in the EU countries | 81
Key facts and figures on transport in Lithuania
Modal split
In 2015, cars were the predominant passenger
transport mode in Lithuania and their share in
passenger transport was above EU average. At the
same time, the reliance of passengers in Lithuania
on buses and coaches as transport mode is almost
equal to the EU average. The share of railways for
passenger traffic in 2015 is significantly below the
EU average. There is no tram and metro transport in
Lithuania.
In freight transport, the share of road transport in
Lithuania was far below the EU average in 2015.
Railways played an important role for freight
transport in 2015 and are far above the EU average.
The inland waterways do not play any role for freight
transport in Lithuania.
Modal split for passenger and freight transport in
2015
Source: EU Transport in figures, Statistical Pocketbook 2017.
Performance of the logistics sector
According to the World Bank, the logistics sector’s
performance in Lithuania has impressively improved
in 2016 when Lithuania's ranking went up from 46
in 2014 to 29 in 2016. The most positive
developments have been observed in areas of
timeliness, tracking and tracing and logistics
competence. Overall, the performance of all
elements of the logistics chain has improved
considerably.
World Bank Logistics performance indicator
Source: World Bank.
Passenger
cars
Buses &
Coaches Railw ays
Tram &
Metro
Lithuania 89.2% 9.9% 0.9% 0.0%
EU-28 81.3% 9.4% 7.6% 1.8%
Modal split for passenger transport
(shares based on passenger-kilometres)
Road Railw ays
Inland
Waterw ays Pipeline
Lithuania 33.4% 64.4% 0.0% 2.3%
EU-28 71.7% 17.4% 6.1% 4.8%
Modal split for freight transport
(shares based on tonne-kilometres)
2014 2016
LPI Rank 46 29
Score 3.18 3.63
Customs 44 28
Score 3.04 3.42
Infrastructure 39 27
Score 3.18 3.57
International shipments 55 31
Score 3.1 3.49
Logistics competence 57 30
Score 2.99 3.49
Tracking & tracing 49 27
Score 3.17 3.68
Timeliness 43 17
Score 3.6 4.14
Logistics performance indicator (LPI)
(World Bank)

82 | Transport in the EU: Current Trends and Issues
Road safety
Road fatalities in Lithuania are above the EU
average (66 dead per million inhabitants in 2016).
Lithuania reduced its number of road deaths by
58% between 2001 and 2010 (EU average -43%).
Lithuania further reduced road deaths by 36%
between 2010 and 2016 (EU average -19%).
The share of pedestrian fatalities is significantly
higher (37%) than the EU average (21%).
Lithuania has adopted a long-term 'vision zero'
approach and a strategic target for 2017: to reach
a fatality rate of no more than 60 dead per million
inhabitants.
Source: DG MOVE - CARE data.
Alternative fuels in road transport
The share of alternative fuels in road transport is
low in Lithuania. Attention is placed on electric
vehicles without currently possessing a dense
network of publicly accessible recharging points.
The spatial distribution of recharging points does
not currently cover the needs of vehicles in terms of
distance requirements.
Lithuania has hybrid buses (electricity + CNG) in its
public transport fleet. Bicycles, as well as their
infrastructure, also receive support.
Lithuania currently has a sufficient network of CNG
refuelling points. Targets for an increase of the
number of CNG refuelling points by 2020 and 2025
are foreseen.
SOURCE: EUROPEAN ALTERNATIVE FUELS OBSERVATORY (BEV
= battery electric vehicle; PHEV = plug-in hybrid electric vehicle;
CNG = compressed natural gas).
Market opening in the railway sector
Obstacles to the efficient functioning of the internal
rail market persist, and competition in the rail sector
is limited despite an, in theory, opened rail market.
Lithuania needs to strengthen the efforts to use
open tenders in awarding public services contracts
in rail, if it wants to find new rail passenger market
entrants.
Rail (freight) traffic is largely dominated by East-
West flows, while the North-South axis is
underdeveloped.
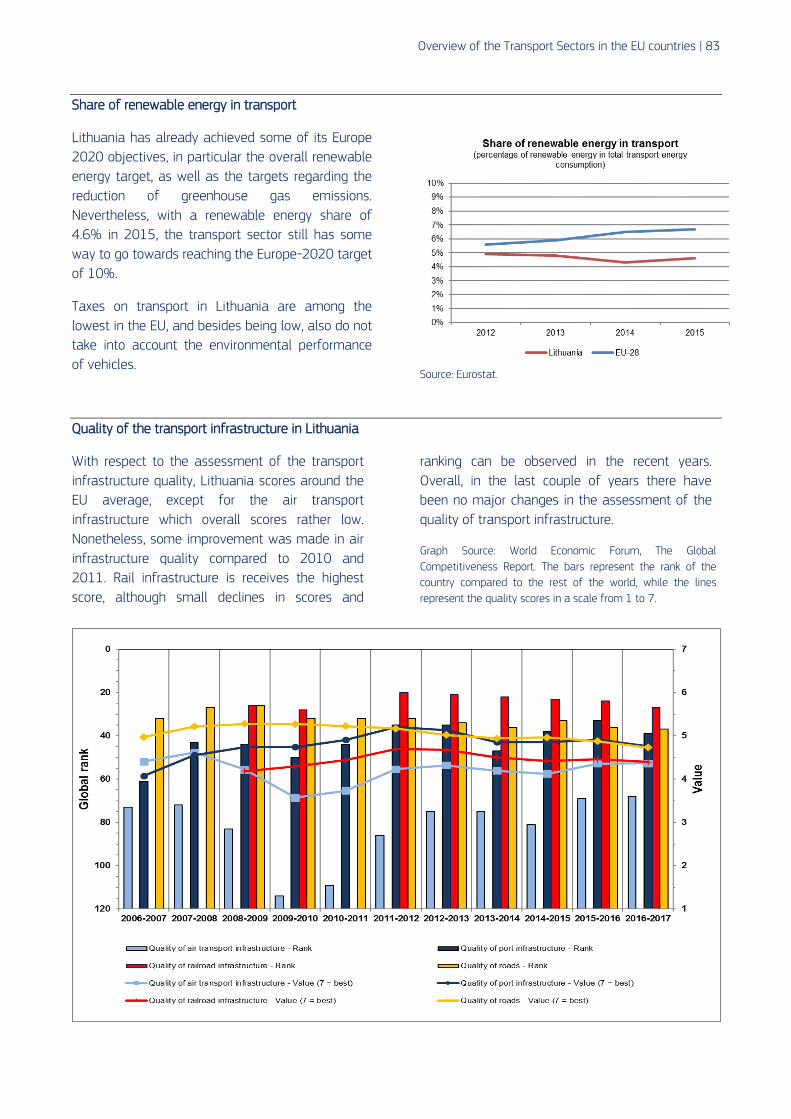
Overview of the Transport Sectors in the EU countries | 83
Share of renewable energy in transport
Lithuania has already achieved some of its Europe
2020 objectives, in particular the overall renewable
energy target, as well as the targets regarding the
reduction of greenhouse gas emissions.
Nevertheless, with a renewable energy share of
4.6% in 2015, the transport sector still has some
way to go towards reaching the Europe-2020 target
of 10%.
Taxes on transport in Lithuania are among the
lowest in the EU, and besides being low, also do not
take into account the environmental performance
of vehicles.
Source: Eurostat.
Quality of the transport infrastructure in Lithuania
With respect to the assessment of the transport
infrastructure quality, Lithuania scores around the
EU average, except for the air transport
infrastructure which overall scores rather low.
Nonetheless, some improvement was made in air
infrastructure quality compared to 2010 and
2011. Rail infrastructure is receives the highest
score, although small declines in scores and
ranking can be observed in the recent years.
Overall, in the last couple of years there have
been no major changes in the assessment of the
quality of transport infrastructure.
Graph Source: World Economic Forum, The Global
Competitiveness Report. The bars represent the rank of the
country compared to the rest of the world, while the lines
represent the quality scores in a scale from 1 to 7.

84 | Transport in the EU: Current Trends and Issues
Luxembourg
Main current issues in Luxembourg
Issue 1 - Road congestion and pollution
The car remains by far the favourite means of transport. Luxembourg has a very high number of cars per capita,
which can be explained by the unattractiveness of public transport, in particular buses, but also by the very low
fuel taxation. This results in severe congestion problems and pollution peaks. Solutions, such as developing
multimodal transport and park and ride stations are being developed, while the take-up of clean cars remains
very slow. Luxembourg is expected to miss its 2020 target reductions in greenhouse gas emissions.

Overview of the Transport Sectors in the EU countries | 85
Key facts and figures on transport in Luxembourg
Modal split
The modal split for both passenger and freight
transport shows a clear preference for road transport
over railways, trams and metro, even more when
compared to the EU average.
On the other hand, Luxembourg has a more
important share of inland waterways in its freight
transport modal split than the EU average.
Modal split for passenger and freight transport in
2015
Source: EU Transport in figures, Statistical Pocketbook 2017.
Performance of the logistics sector
According to the analysis of the World Bank,
Luxembourg’s logistics sector is highly competitive
and has even improved both its scores and its
rankings on the LPI from 2014 to 2016.
World Bank Logistics performance indicator
Source: World Bank.
Passenger
cars
Buses &
Coaches Railw ays
Tram &
Metro
Luxembourg 82.9% 12.4% 4.7% 0.0%
EU-28 81.3% 9.4% 7.6% 1.8%
Modal split for passenger transport
(shares based on passenger-kilometres)
Road Railw ays
Inland
Waterw ays Pipeline
Luxembourg 85.7% 6.7% 7.6% 0.0%
EU-28 71.7% 17.4% 6.1% 4.8%
Modal split for freight transport
(shares based on tonne-kilometres)
2014 2016
LPI Rank 8 2
Score 3.95 4.22
Customs 10 9
Score 3.82 3.90
Infrastructure 15 4
Score 3.91 4.24
International shipments 1 1
Score 3.82 4.24
Logistics competence 14 10
Score 3.78 4.01
Tracking & tracing 22 8
Score 3.68 4.12
Timeliness 1 1
Score 4.71 4.8
Logistics performance indicator (LPI)
(World Bank)
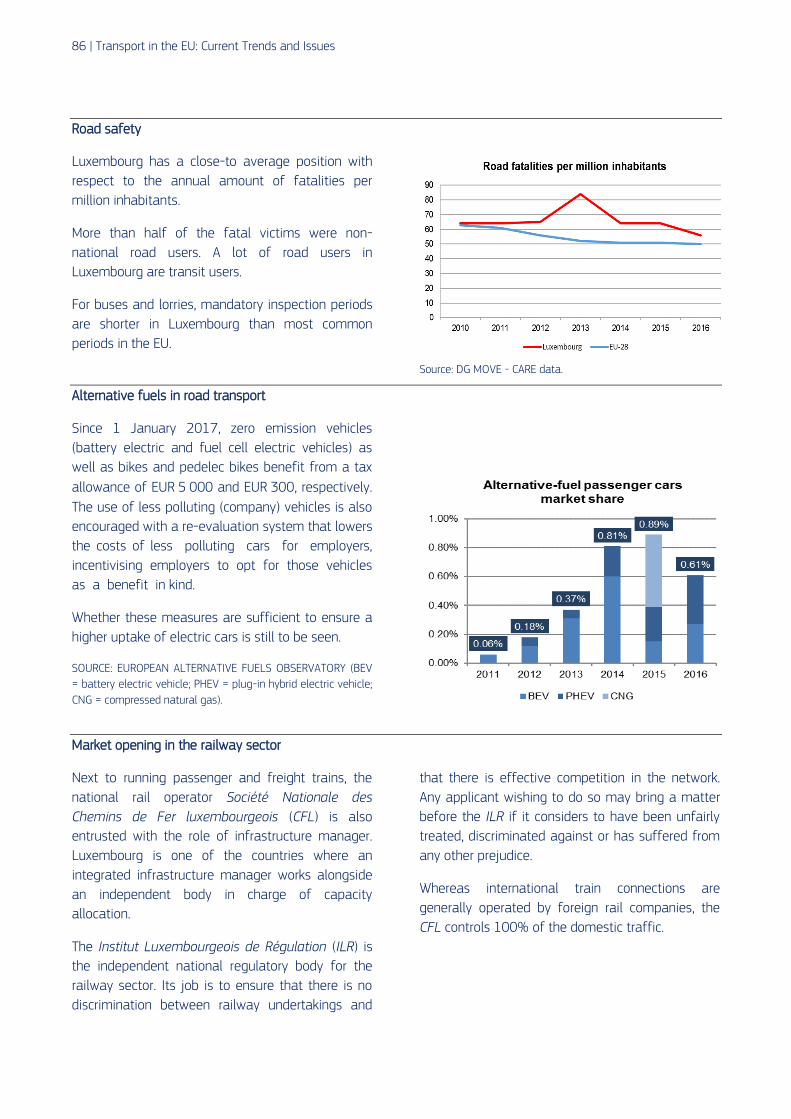
86 | Transport in the EU: Current Trends and Issues
Road safety
Luxembourg has a close-to average position with
respect to the annual amount of fatalities per
million inhabitants.
More than half of the fatal victims were non-
national road users. A lot of road users in
Luxembourg are transit users.
For buses and lorries, mandatory inspection periods
are shorter in Luxembourg than most common
periods in the EU.
Source: DG MOVE - CARE data.
Alternative fuels in road transport
Since 1 January 2017, zero emission vehicles
(battery electric and fuel cell electric vehicles) as
well as bikes and pedelec bikes benefit from a tax
allowance of EUR 5 000 and EUR 300, respectively.
The use of less polluting (company) vehicles is also
encouraged with a re-evaluation system that lowers
the costs of less polluting cars for employers,
incentivising employers to opt for those vehicles
as a benefit in kind.
Whether these measures are sufficient to ensure a
higher uptake of electric cars is still to be seen.
SOURCE: EUROPEAN ALTERNATIVE FUELS OBSERVATORY (BEV
= battery electric vehicle; PHEV = plug-in hybrid electric vehicle;
CNG = compressed natural gas).
Market opening in the railway sector
Next to running passenger and freight trains, the
national rail operator Société Nationale des
Chemins de Fer luxembourgeois (CFL) is also
entrusted with the role of infrastructure manager.
Luxembourg is one of the countries where an
integrated infrastructure manager works alongside
an independent body in charge of capacity
allocation.
The Institut Luxembourgeois de Régulation (ILR) is
the independent national regulatory body for the
railway sector. Its job is to ensure that there is no
discrimination between railway undertakings and
that there is effective competition in the network.
Any applicant wishing to do so may bring a matter
before the ILR if it considers to have been unfairly
treated, discriminated against or has suffered from
any other prejudice.
Whereas international train connections are
generally operated by foreign rail companies, the
CFL controls 100% of the domestic traffic.

Overview of the Transport Sectors in the EU countries | 87
Share of renewable energy in transport
In Luxembourg, the only support scheme for
renewable energy sources used in transport is a
quota system. This scheme obliges companies
importing or producing petrol, gas or diesel fuels to
ensure that biofuels make up a defined percentage
of the company’s total annual sale of fuel.
Source: Eurostat.
Quality of the transport infrastructure in Luxembourg
In the World Economic Forum Competitiveness
Index 2017, Luxembourg’s roads rank 20th
worldwide on the index of the perception of the
quality of infrastructure. This is slightly worse than
the ranking for its railway infrastructure (15th).
In absolute terms, the perceived quality of road
and rail infrastructure in Luxembourg is still
relatively high. However, all main transport
infrastructure indicators but one, show a slightly
negative trend. Inadequate supply of
infrastructure is assessed as the 8th most
problematic issue for doing business in
Luxembourg.
Luxembourg fares particularly badly when it
comes to ease of access to sea ports (53rd rank
worldwide, and downward trend). The only upward
trend can be observed in available airline seat
kilometres, however this started from a low level
in 2007.
Graph Source: World Economic Forum, The Global
Competitiveness Report. The bars represent the rank of the
country compared to the rest of the world, while the lines
represent the quality scores in a scale from 1 to 7.
88 | Transport in the EU: Current Trends and Issues
Hungary
Main current issues in Hungary
Issue 1 – Inland navigation / Danube challenge
Low water conditions on the Danube and unfavourable regulation causes operational problems for the inland
navigation sector resulting in delays of transit times and additional operational costs, i.e. lower competitiveness.
The inland navigation infrastructure needs upgrading to make navigability on the Danube more reliable. In
particular, multimodal transhipment possibilities in the main ports along the Danube constitute important
bottlenecks. In view of the dire maintenance condition of the river, Hungary submitted several inland waterway
projects under the first calls of the Connecting Europe Facility and proposals in order to improve the Danube’s
navigability.
Issue 2 - Road safety
The high number of road accidents continues to represent a substantial burden on society and the economy.
Despite a substantial decrease of the fatality rate from 2007 to 2011, there has been limited progress over the
last 5 years75. When compared to the number of passenger cars and kilometres driven, Hungary remains among
the worst performers in the EU. Among other factors, the quality of road infrastructure and the vehicle fleet play
a role in the evolution of the country's safety record. The protection of vulnerable road users, such as
pedestrians, cyclists and motorcyclists is a particular cause for concern.
Issue 3 – Accessibility & road congestion
The quality of the road and rail networks remains inconsistent. This, together with a projected increase in
congestion, represents a barrier to accessibility and productivity. In this context, the rehabilitation programme of
the long neglected lower class road network and investment in rail connectivity are positive developments. At
the same time, while motorisation is steadily increasing76, plans for a road access charge in Budapest appear to
have been shelved.
In recent years, road congestion has been attenuated by sluggish economic performance. This, however, is
changing. Urban congestion may become a barrier to productivity in Hungary77 as employment rate and
motorisation78 are picking up. With regard to the planned road access charging in Budapest, although serious
alternatives have been prepared, the introduction of yearly and monthly vignettes would merely serve to raise
revenues and have no effect on congestion.
75 606 road deaths reported in 2012 and 607 in 2016; preliminary figures for 2017 do not show any change compared to the previous year.
76 By 2-3 % per year since 2011. New passenger car registrations increased by over 25 % from 2015 to 2016, the highest rate in the EU. 77 According to JRC calculations, urban areas in Hungary were among the 5 most congested in Europe in 2013 (in terms of average ratio
of actual speed versus free-flow speed). 78 EU transport in figures – Statistical Pocketbook 2017, Tables 2.6.2 and 2.6.6, http://ec.europa.eu/transport/facts-
fundings/statistics/pocketbook-2017_en.htm and Hungarian Central Statistical Office, Tables 4.6.11, 4.6.15 and 4.6.17, https://www.ksh.hu/szallitas_kozlekedes.

Overview of the Transport Sectors in the EU countries | 89
Key facts and figures on transport in Hungary
Modal split
In 2015, car trips represented almost 66 % of the
passenger-kilometres travelled, recording a lower
use of passenger cars by around 15 % than the EU
average. At the same time, the use of buses and
coaches in Hungary is more than twice as high as
the EU average with railways and tram & metro use
also well above the EU average (by 21 % and 100 %
respectively).
For land freight transport, road covers just over 60 %
of the activity, i.e. significantly below the EU
average. The difference of roughly 10 % can be seen
in the higher share of railways in Hungary while
inland waterway transport is slightly below the EU
average.
Modal split for passenger and freight transport in
2015
Source: EU Transport in figures, Statistical Pocketbook 2017.
Performance of the logistics sector
In terms of how efficiently countries can ship their
products to other countries, Hungary is not lagging
behind. It has shown consistent improvement in its
Logistics performance indicator over the past 6
years, mainly due to the scores in Tracking and
tracing, Timeliness, and the overall upward trend in
international shipments compared to 2010.
World Bank Logistics performance indicator
Source: World Bank.
Passenger
cars
Buses &
Coaches Railw ays
Tram &
Metro
Hungary 65.8% 21.5% 9.2% 3.6%
EU-28 81.3% 9.4% 7.6% 1.8%
Modal split for passenger transport
(shares based on passenger-kilometres)
Road Railw ays
Inland
Waterw ays Pipeline
Hungary 60.7% 27.5% 5.0% 6.8%
EU-28 71.7% 17.4% 6.1% 4.8%
Modal split for freight transport
(shares based on tonne-kilometres)
2014 2016
LPI Rank 33 31
Score 3.46 3.43
Customs 48 49
Score 2.97 3.02
Infrastructure 40 32
Score 3.18 3.48
International shipments 32 34
Score 3.4 3.44
Logistics competence 37 34
Score 3.33 3.35
Tracking & tracing 15 41
Score 3.82 3.4
Timeliness 20 33
Score 4.06 3.88
Logistics performance indicator (LPI)
(World Bank)

90 | Transport in the EU: Current Trends and Issues
Road safety
Road fatalities in Hungary are above the EU
average. Despite a substantial decrease of the
fatality rate from 2007 to 2011, there has been
limited progress over the last five years. When
compared to the number of passenger cars and
kilometres driven, Hungary remains among the
worst performers in the EU.
The share of pedestrian and cyclists fatalities is
significantly higher (25% and 12%) than the EU
average (21% and 8%). Among other factors, the
quality of road infrastructure plays a role in the
evolution of the country's safety record. The
protection of vulnerable road users is a particular
cause for concern.
Source: DG MOVE - CARE data.
2.4 Alternative fuels in road transport
In 2013, there was a sudden rise in the number of
new passenger cars using safe compressed natural
gas (CNG) amounting to 5 496 cars (many of those
were probably taxis). Despite that, the share of
alternative-fuelled cars remains very low (310 new
passenger cars) without any positive progress in the
market expansion.
SOURCE: EUROPEAN ALTERNATIVE FUELS OBSERVATORY (BEV
= battery electric vehicle; PHEV = plug-in hybrid electric vehicle;
CNG = compressed natural gas).
Market opening in the railway sector
Despite passenger transport being open to new
entrants, domestic rail passenger transport is not
liberalised in Hungary. While the rail freight market
has opened up for competition and the rail freight
transport activity has increased by 13.6% between
2010 and 2015, passenger transport activity has
decreased by almost 1% with the market share of
new entrants at 3-3.5% in 2015.
There seems to be no intention for full separation
of the infrastructure manager and rail passenger
transport operator and the politically sensitive
preferential tariff system providing discounts to a
great proportion of passengers in an untargeted
way has been maintained.
SOURCE: DG MOVE RAIL MARKET MONITORING (INCLUDES DOMESTIC AND INTERNATIONAL TRANSPORT).
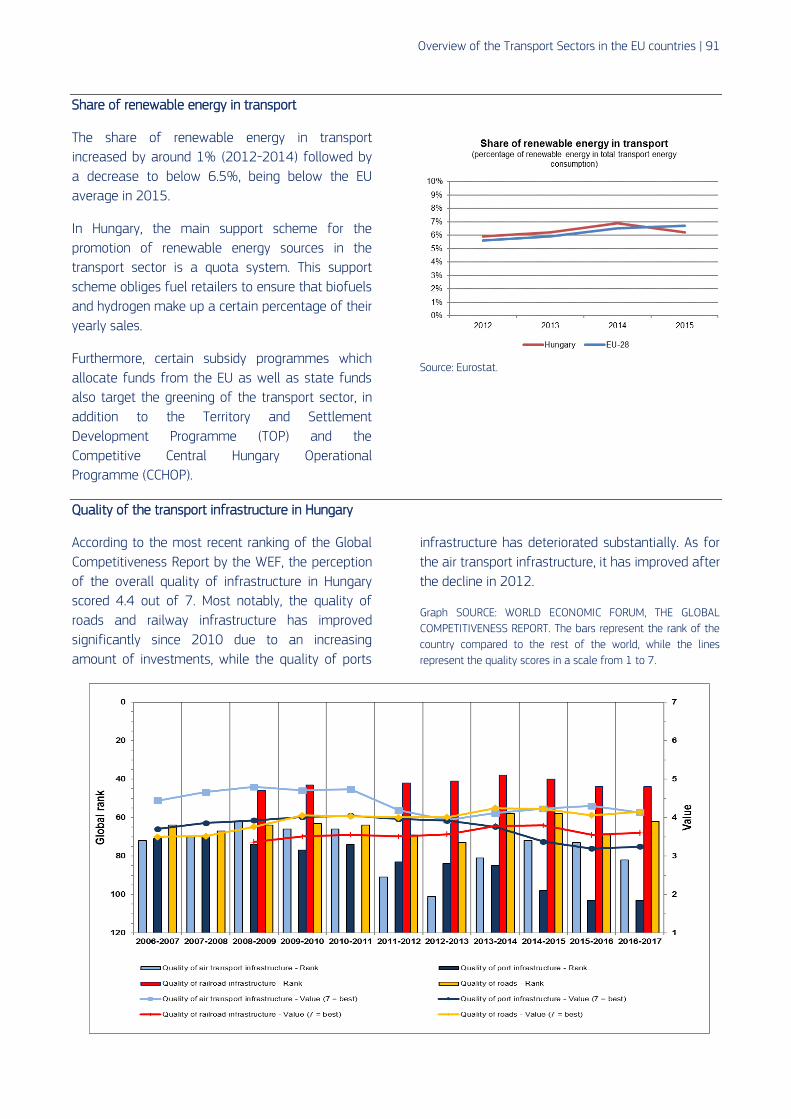
Overview of the Transport Sectors in the EU countries | 91
Share of renewable energy in transport
The share of renewable energy in transport
increased by around 1% (2012-2014) followed by
a decrease to below 6.5%, being below the EU
average in 2015.
In Hungary, the main support scheme for the
promotion of renewable energy sources in the
transport sector is a quota system. This support
scheme obliges fuel retailers to ensure that biofuels
and hydrogen make up a certain percentage of their
yearly sales.
Furthermore, certain subsidy programmes which
allocate funds from the EU as well as state funds
also target the greening of the transport sector, in
addition to the Territory and Settlement
Development Programme (TOP) and the
Competitive Central Hungary Operational
Programme (CCHOP).
Source: Eurostat.
Quality of the transport infrastructure in Hungary
According to the most recent ranking of the Global
Competitiveness Report by the WEF, the perception
of the overall quality of infrastructure in Hungary
scored 4.4 out of 7. Most notably, the quality of
roads and railway infrastructure has improved
significantly since 2010 due to an increasing
amount of investments, while the quality of ports
infrastructure has deteriorated substantially. As for
the air transport infrastructure, it has improved after
the decline in 2012.
Graph SOURCE: WORLD ECONOMIC FORUM, THE GLOBAL
COMPETITIVENESS REPORT. The bars represent the rank of the
country compared to the rest of the world, while the lines
represent the quality scores in a scale from 1 to 7.

92 | Transport in the EU: Current Trends and Issues
Malta
Main current issues in Malta
Issue 1 – Congestion and pollution from road transport
A very high motorisation rate combined with an ageing car fleet, an inefficient road network and an established
preference for private transport have resulted in significant road congestion problems and increased carbon
emissions. Road infrastructure remains under heavy pressure, is often highly congested and considered one of
Malta’s weak points, particularly from an investor’s point of view. In 2012, total external costs of traffic
congestion (air pollution, climate change, noise, accidents and economic costs of congestion) were estimated at
EUR 245 million representing roughly 4% of GDP.79 These costs were estimated to rise to EUR 317 million by
2020 if no policy measures were taken to address the issue.80
Maltese authorities estimate even higher congestion costs for 2025. These would amount to EUR 721 million of
economic costs of congestion (time spent in traffic and additional fuel costs) and costs linked to accidents, if
only a minimum amount of policy measures is put in place by national authorities to reduce traffic.
Scope for multimodal transport is limited, due to the absence of a rail network and inland waterways and no
scope for their development. This creates challenges for financing through TEN-T, given the limited financing for
road projects. Although the authorities have made substantial efforts to develop a coherent strategy addressing
many of the above issues, Malta has a below average GDP and co-financing major infrastructure projects is a
challenge.
79 Source: Attard, Maria; Van Brockdorff, Philip; Bezzina, Frank (2015): The external costs of passenger and commercial vehicles use in Malta, https://www.um.edu.mt/library/oar//handle/123456789/5014. 80 Source: Transport Malta, National Transport Strategy 2050 and National Master Plan 2025.

Overview of the Transport Sectors in the EU countries | 93
Key facts and figures on transport in Malta
Modal split
Road transport is the only mode of land transport
available in Malta. The share of passenger cars in
the modal split is comparable to the EU-average and
buses and coaches transport cover a much larger
share than the EU average. There are no official
statistics on Maltese road freight transport.
Modal split in 2015 (only available for passenger
transport)
Source: EU Transport in figures, Statistical Pocketbook 2017.
Performance of the logistics sector
The Logistics performance indicator published by the
World Bank provides a benchmark of a country's
performance on trade logistics. Malta has generally
scored poorly compared to other EU countries in the
indicators of 2010 to 2016. In 2016, Malta ranked
25th overall out of 28 Member States, scoring
relatively low on customs and logistics performance.
World Bank Logistics Performance Indicator
Source: World Bank.
Passenger
cars
Buses &
Coaches Railw ays
Tram &
Metro
Malta 82.3% 17.7% 0.0% 0.0%
EU-28 81.3% 9.4% 7.6% 1.8%
Modal split for passenger transport
(shares based on passenger-kilometres)
2014 2016
LPI Rank 51 56
Score 3.11 3.07
Customs 46 59
Score 3.00 2.78
Infrastructure 47 55
Score 3.08 2.94
International shipments 41 55
Score 3.23 3.09
Logistics competence 54 65
Score 3 2.85
Tracking & tracing 52 56
Score 3.15 3.12
Timeliness 81 50
Score 3.15 3.61
Logistics performance indicator (LPI)
(World Bank)
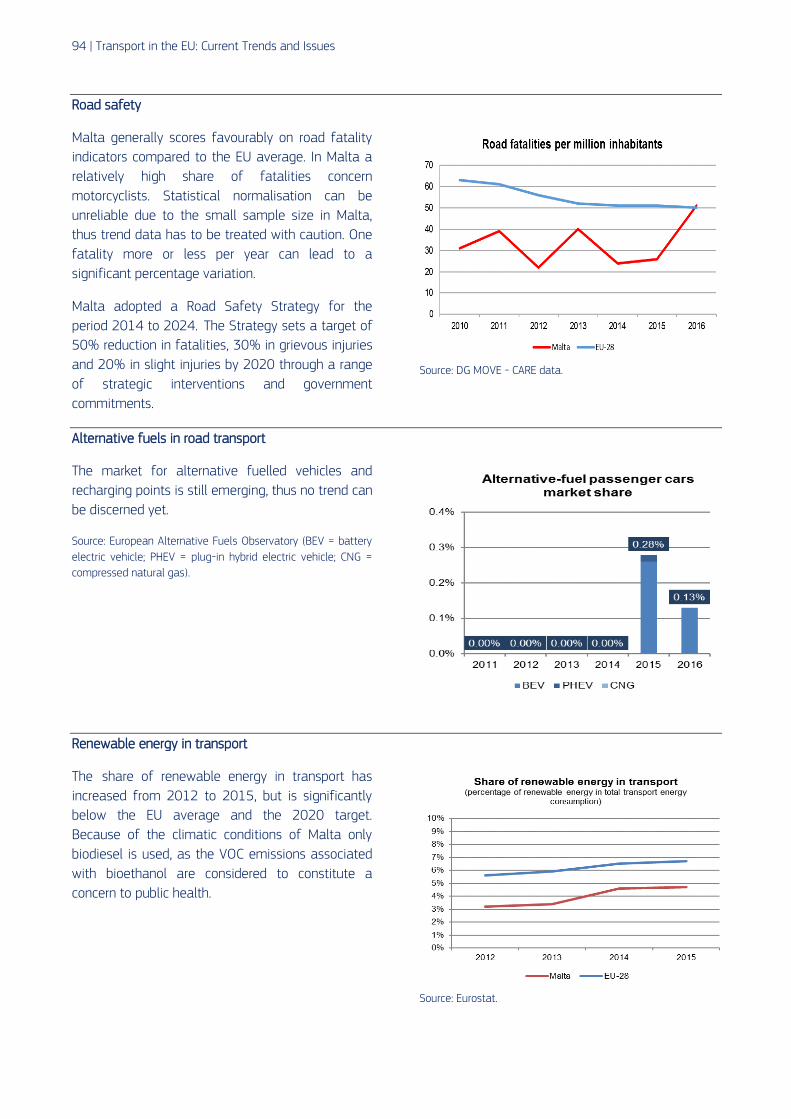
94 | Transport in the EU: Current Trends and Issues
Road safety
Malta generally scores favourably on road fatality
indicators compared to the EU average. In Malta a
relatively high share of fatalities concern
motorcyclists. Statistical normalisation can be
unreliable due to the small sample size in Malta,
thus trend data has to be treated with caution. One
fatality more or less per year can lead to a
significant percentage variation.
Malta adopted a Road Safety Strategy for the
period 2014 to 2024. The Strategy sets a target of
50% reduction in fatalities, 30% in grievous injuries
and 20% in slight injuries by 2020 through a range
of strategic interventions and government
commitments.
Source: DG MOVE - CARE data.
Alternative fuels in road transport
The market for alternative fuelled vehicles and
recharging points is still emerging, thus no trend can
be discerned yet.
Source: European Alternative Fuels Observatory (BEV = battery
electric vehicle; PHEV = plug-in hybrid electric vehicle; CNG =
compressed natural gas).
Renewable energy in transport
The share of renewable energy in transport has
increased from 2012 to 2015, but is significantly
below the EU average and the 2020 target.
Because of the climatic conditions of Malta only
biodiesel is used, as the VOC emissions associated
with bioethanol are considered to constitute a
concern to public health.
Source: Eurostat.

Overview of the Transport Sectors in the EU countries | 95
Quality of the transport infrastructure in Malta
Since 2006, an improvement can be seen in the
ranking for the quality of air transport and port
infrastructure. However, Malta ranks low for the
quality of road. The World Economic Forum’s
infrastructure satisfaction indicators do not provide
underlying reasons for possible dissatisfactions.
However, with respect to the Malta road network,
possible root causes could be the limited road
network and congestion. In this respect,
improvements would be needed.
Graph Source: World Economic Forum, The Global
Competitiveness Report. The bars represent the rank of the
country compared to the rest of the world, while the lines
represent the quality scores in a scale from 1 to 7.

96 | Transport in the EU: Current Trends and Issues
Netherlands
Main current issues in the Netherlands
Issue 1 - Congestion
Congestion remains a specific challenge in a dense and well equipped country that is a key player in EU logistics
with the biggest EU port in Rotterdam and one of the biggest airports in Schiphol. The issue has been alleviated
with additional infrastructure works but it still remains an issue with high social costs and hours wasted stuck in
traffic.
Issue 2 - Mainport strategy
For years, the Netherlands has made the strategic choice to focus on one big seaport (Rotterdam) and one big
airport (Schiphol) to develop and maintain its logistic hub function in Europe. Overall this has served them well
and allowed for a clear development plan for both ports. The strategy is now coming under pressure as Schiphol
airport is coming close to its maximum capacity and alternative sites are being explored to ensure future growth
in air connectivity. The government is looking to further develop Lelystad Airport as a second international hub.
However, there is some resistance from stakeholders and citizens.

Overview of the Transport Sectors in the EU countries | 97
Key facts and figures on transport in the Netherlands
Modal split
It should be noted that cars have a higher share in
the modal split for passenger transport than the EU
average, whereas buses, trams and metros have a
much lower share. Bicycles are not covered by these
figures. Yet, the relatively high share of passenger
cars hints at a contributing factor to congestion
problems.
For freight, the dominant transport modes in the
Netherlands are road and inland waterways.
Modal split for passenger and freight transport in
2015
Source: EU Transport in figures, Statistical Pocketbook 2017.
Performance of the logistics sector
The Netherlands has a strong export-oriented
economy. This is supported by its strategic maritime
location close to the sea, at the end of a network of
sea-going rivers and inland waterways and along a
main shipping line. It also makes good use of its
main and strategic airport (Schiphol) providing a
good connection via the skies.
The country’s geographic location and the
importance of its hubs are also reflected in the very
high scores the Netherlands achieve in the World
Bank Logistics performance indicator. For almost all
aspects of the indicator, the Netherlands is among
the top five in the world.
World Bank Logistics performance indicator
Source: World Bank.
Passenger
cars
Buses &
Coaches Railw ays
Tram &
Metro
Netherlands 85.7% 3.0% 10.8% 0.6%
EU-28 81.3% 9.4% 7.6% 1.8%
Modal split for passenger transport
(shares based on passenger-kilometres)
Road Railw ays
Inland
Waterw ays Pipeline
Netherlands 45.7% 5.8% 43.1% 5.4%
EU-28 71.7% 17.4% 6.1% 4.8%
Modal split for freight transport
(shares based on tonne-kilometres)
2014 2016
LPI Rank 2 4
Score 4.05 4.19
Customs 4 3
Score 3.96 4.12
Infrastructure 3 2
Score 4.23 4.29
International shipments 11 6
Score 3.64 3.94
Logistics competence 2 3
Score 4.13 4.22
Tracking & tracing 6 6
Score 4.07 4.17
Timeliness 6 5
Score 4.34 4.41
Logistics performance indicator (LPI)
(World Bank)

98 | Transport in the EU: Current Trends and Issues
SOURCE: DG MOVE RAIL MARKET MONITORING (INCLUDES DOMESTIC AND INTERNATIONAL TRANSPORT)
Road safety
On road safety, the Netherlands belongs to the best
performing countries in Europe and every year the
fatality rate has been lower than the EU average.
Nevertheless, the Netherlands reduced road deaths
by only 1% between 2010 and 2016 (EU average
19%) and the share of cyclist fatalities is the
highest in the EU (19%). This may be due to a
strong bicycle culture and many cyclists on the
roads.
A strategic road safety plan 2008-2020 specifies
12 priority areas: pedestrians, cyclists, single-person
accidents, children, elderly, novice drivers, mopeds,
scooters, microcars, motorcyclists, driving under the
influence of alcohol, speeding, lorries and delivery
vans, 50 and 80 km/h roads.
Source: DG MOVE - CARE data.
Alternative fuels in road transport
The Dutch policy on alternative fuels puts a lot of
emphasis on electric vehicles. The current overall
share of electric vehicles on the road is already
above 1% and among the new cars sold in 2016,
roughly 6% were battery electric or plug-in hybrid
vehicles. The Netherlands already has a
considerable number of recharging points.
SOURCE: EUROPEAN ALTERNATIVE FUELS OBSERVATORY (BEV
= battery electric vehicle; PHEV = plug-in hybrid electric vehicle;
CNG = compressed natural gas).
Market opening in the railway sector
For passenger transport, NS (Nederlandse
Spoorwegen) holds an exclusive concession for
passenger transport on the main network, including
the high-speed rail line (HSL) - Zuid. Regional
passenger services are managed by the regional
authorities. Out of total 8 companies operating
passenger transport, the most significant at
regional level are: Connexxion (Transdev), Arriva
(Deutsche Bahn) and Syntus (Keolis)81.
81 NS has decided in 2016 in principle not to compete for regional rail concessions during the HRN concession.
Rail freight operations are 100 % liberalised, and of
the 21 rail freight companies82 in operation in 2016,
DB Cargo had the biggest market share (55 %).
82 De ACM Spoormonitor 2016.
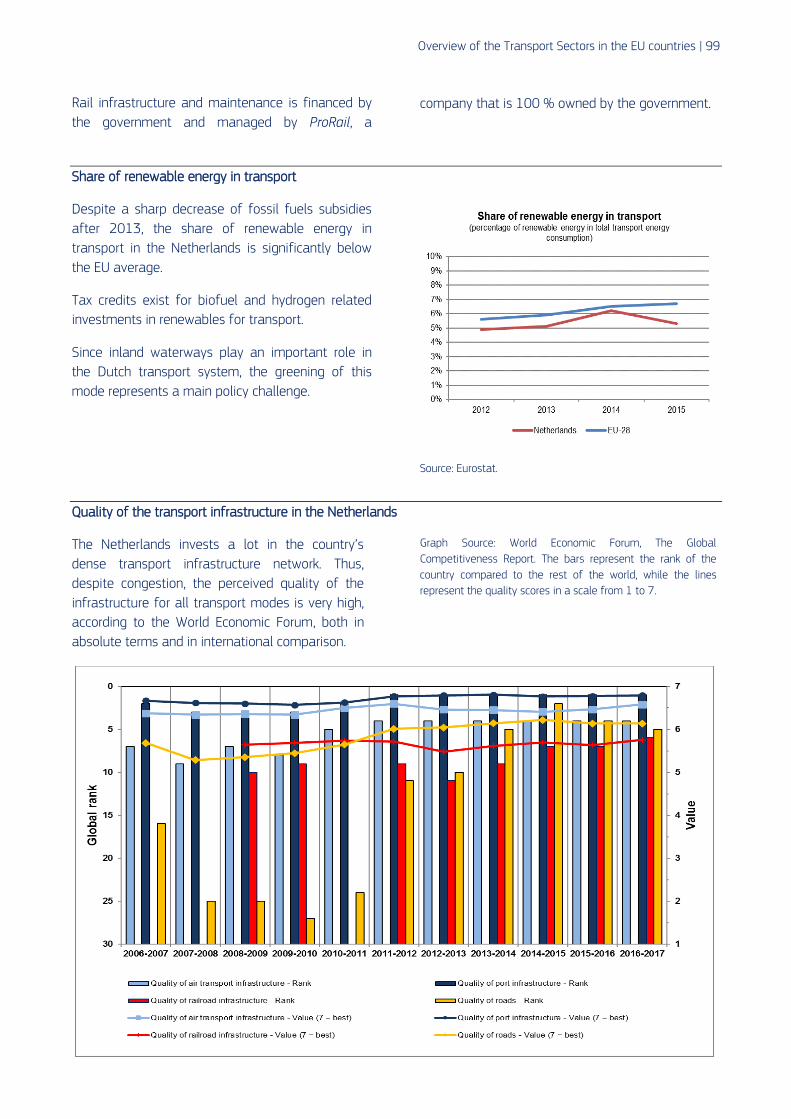
Overview of the Transport Sectors in the EU countries | 99
Rail infrastructure and maintenance is financed by
the government and managed by ProRail, a
company that is 100 % owned by the government.
Share of renewable energy in transport
Despite a sharp decrease of fossil fuels subsidies
after 2013, the share of renewable energy in
transport in the Netherlands is significantly below
the EU average.
Tax credits exist for biofuel and hydrogen related
investments in renewables for transport.
Since inland waterways play an important role in
the Dutch transport system, the greening of this
mode represents a main policy challenge.
Source: Eurostat.
Quality of the transport infrastructure in the Netherlands
The Netherlands invests a lot in the country’s
dense transport infrastructure network. Thus,
despite congestion, the perceived quality of the
infrastructure for all transport modes is very high,
according to the World Economic Forum, both in
absolute terms and in international comparison.
Graph Source: World Economic Forum, The Global
Competitiveness Report. The bars represent the rank of the
country compared to the rest of the world, while the lines
represent the quality scores in a scale from 1 to 7.
100 | Transport in the EU: Current Trends and Issues
Austria
Main current issues in Austria
Issue 1 – Road safety
Austria’s efforts to reach its self-defined goals in its "Transport Safety Programme 2011-2020"83 are important.
While the programme envisages halving the number of fatalities by 2020, this objective seems to be very
challenging (22% reduction over the period 2010 – 2016).
Road safety and security applications represent one of the priority areas for action under the Directive on
intelligent transport systems. Austria's implementation plan of the Directive so far includes fewer activities for
this priority area than for others.
Issue 2 – Third runway for the Vienna Airport
With a third runway, Vienna International Airport might become more competitive vis-à-vis other European
airports. The forecasts for 2020 predict that with only two runways, the development curve will tail off in terms
of both passengers and of employees. However, as the plans for a third runway are subject to an ongoing
lawsuit, the future of the project is uncertain.
Issue 3 – Navigability of the Danube
On inland waterways, the main issue is the promotion of inland navigation cross-border transport. Navigability
issues of the Danube are also an issue, specifically prevention of risks associated with flooding and with
episodes of low water levels.
Issue 4 – Promoting alternative fuels
The share of cars with alternative fuelled engines is still way below EU average. Despite Austria's efforts to
reduce CO2 emissions, transport fuel taxation is still comparatively low. There is still a possibility to use
environmental taxes to encourage progress towards Europe 2020 targets and beyond. Incentives exist for
electric vehicles, but could be more systematic for other alternative fuels.
83 https://www.bmvit.gv.at/en/verkehr/roads/safety/publications/index.html
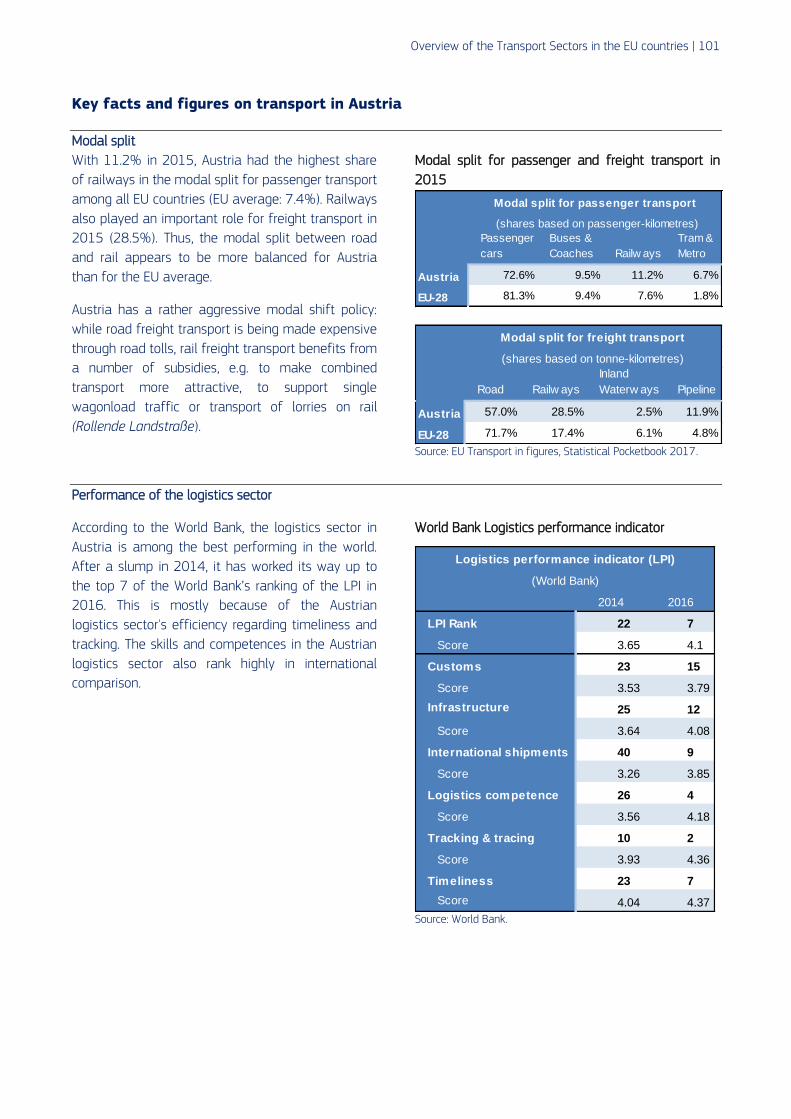
Overview of the Transport Sectors in the EU countries | 101
Key facts and figures on transport in Austria
Modal split
With 11.2% in 2015, Austria had the highest share
of railways in the modal split for passenger transport
among all EU countries (EU average: 7.4%). Railways
also played an important role for freight transport in
2015 (28.5%). Thus, the modal split between road
and rail appears to be more balanced for Austria
than for the EU average.
Austria has a rather aggressive modal shift policy:
while road freight transport is being made expensive
through road tolls, rail freight transport benefits from
a number of subsidies, e.g. to make combined
transport more attractive, to support single
wagonload traffic or transport of lorries on rail
(Rollende Landstraße).
Modal split for passenger and freight transport in
2015
Source: EU Transport in figures, Statistical Pocketbook 2017.
Performance of the logistics sector
According to the World Bank, the logistics sector in
Austria is among the best performing in the world.
After a slump in 2014, it has worked its way up to
the top 7 of the World Bank’s ranking of the LPI in
2016. This is mostly because of the Austrian
logistics sector's efficiency regarding timeliness and
tracking. The skills and competences in the Austrian
logistics sector also rank highly in international
comparison.
World Bank Logistics performance indicator
Source: World Bank.
Passenger
cars
Buses &
Coaches Railw ays
Tram &
Metro
Austria 72.6% 9.5% 11.2% 6.7%
EU-28 81.3% 9.4% 7.6% 1.8%
Modal split for passenger transport
(shares based on passenger-kilometres)
Road Railw ays
Inland
Waterw ays Pipeline
Austria 57.0% 28.5% 2.5% 11.9%
EU-28 71.7% 17.4% 6.1% 4.8%
Modal split for freight transport
(shares based on tonne-kilometres)
2014 2016
LPI Rank 22 7
Score 3.65 4.1
Customs 23 15
Score 3.53 3.79
Infrastructure 25 12
Score 3.64 4.08
International shipments 40 9
Score 3.26 3.85
Logistics competence 26 4
Score 3.56 4.18
Tracking & tracing 10 2
Score 3.93 4.36
Timeliness 23 7
Score 4.04 4.37
Logistics performance indicator (LPI)
(World Bank)

102 | Transport in the EU: Current Trends and Issues
Road safety
Austria is close to the EU average on fatalities per
million inhabitants. However, the share of fatalities
among motorcyclists is one of the highest in the EU
(20% compared to the EU average of 8%).
The main causes of accidents remain driving
without care and attention and non-respect of
speed limits. Three quarters of Austrian road
accidents resulting in fatalities occur in rural areas.
Source: DG MOVE - CARE data.
Alternative fuels in road transport
The overall share of passenger cars running on
alternative fuels is low (0.7%) compared to the EU
average (3.2%). However, the number of new
passenger cars using alternative fuels has more
than tripled over the period between 2011 and
2015. In Austria, electric vehicles are exempt from
both fuel consumption tax and from vehicle tax.
Source: European Alternative Fuels Observatory (BEV = battery
electric vehicle; PHEV = plug-in hybrid electric vehicle; CNG =
compressed natural gas).
Market opening in the railway sector
The rail freight market has opened up for
competition to a bigger extent than the passenger
sector, as market share for all but the principal
freight rail undertaking reached 24% in 2015, while
on the passenger side it was 12%. For the freight
sector, this degree of market opening is modest
compared to other EU countries. However, market
opening has improved in the Austrian rail sector. In
2010, the market shares of all but the principal
railway undertaking were 15% for freight and 5%
for passenger transport.
Source: DG MOVE Rail Market Monitoring (INCLUDES DOMESTIC
AND INTERNATIONAL TRANSPOR

Overview of the Transport Sectors in the EU countries | 103
Share of renewable energy in transport
Among the EU countries, Austria has one of the
highest shares of renewable energy used in
transport (11.4 % in 2015).
In Austria, the main support scheme for renewable
energy sources used in transport is a quota system.
This scheme obliges companies importing or
producing petrol or diesel to ensure that biofuels
make up a defined percentage of their annual fuel
sales. Furthermore, biofuels are supported through
a fiscal regulation mechanism. Moreover, the
scheme `klimaaktiv mobil` supports, amongst other
things, the conversion to alternative drive systems.
Source: Eurostat.
Quality of the transport infrastructure in Austria
Austria ranks among the top European countries
regarding the perception of its transport
infrastructure. This is despite numbers declining in
recent years, particularly in road and air transport,
as well as port infrastructure.
Graph Source: World Economic Forum, The Global
Competitiveness Report. The bars represent the rank of the
country compared to the rest of the world, while the lines
represent the quality scores in a scale from 1 to 7.
104 | Transport in the EU: Current Trends and Issues
Poland
Main current issues in Poland
Issue 1 - Road safety
Despite recent improvements in terms of reduction of road fatalities, there is still a poor road safety record in
Poland, in particular when it comes to vulnerable road users, such as pedestrians and cyclists. In cities,
pedestrians and cyclists are disproportionately affected, as they account for around 40 % % of fatal victims of
road accidents. Improvements could be brought by seriously addressing driving habits as well as building
adequate safety infrastructure.
Issue 2 - Modernisation of railway network
Despite an accelerated contracting rate of railway projects compared to preceding years, timely completion of
all railway investments planned until 2023 may be still endangered. This is due to limited construction market
capacity and institutional weaknesses of the railway infrastructure manager. Complex administrative and
financial procedures are still affecting the railway sector in comparison to the road sector and contribute to
delays and unnecessary bottlenecks of the projects.
Issue 3 - Strategic long-term planning of transport investments
There is still a lack of a strategic reflection on the coherent long-term (beyond 2023) development of the
transport networks in all modes where their respective roles would be clearly identified and attributed.
Issue 4 - ERTMS deployment and decommissioning of class-B systems
The legacy system for train command, control and signalling in Poland is obsolete. Poland has a very large
amount of EU funds devoted to rail (e.g. specifically for ERTMS some EUR 300 million under the Connecting
Europe Facility and roughly EUR 4.5 billion for TEN-T/rolling stock/other rail projects under the European
Structural and Investment Funds).
Poland has recently finalised a tender for the network-wide deployment of GSM-R deployment. There is an
opportunity to go for a network-wide deployment of ETCS.

Overview of the Transport Sectors in the EU countries | 105
Key facts and figures on transport in Poland
Modal split
In 2015, cars were the predominant passenger
transport mode in Poland, but their share in
passenger transport remained below the EU
average. At the same time, passengers in Poland are
relying to a much greater extent on buses and
coaches as a transport mode than the EU average.
The share of railways for passenger traffic has been
in general falling in the past decade and in 2015
was slightly below the EU average.
In freight transport, the share of road transport in
Poland was below the EU average in 2015. Railways,
despite a constant decrease in the modal share,
continue to play an important role for freight
transport in 2015 and are above the EU average.
Thus, the modal split between road and rail appears
more balanced for Poland than for the EU average.
Modal split for passenger and freight transport in
2015
Source: EU Transport in figures, Statistical Pocketbook 2017.
Performance of the logistics sector
According to the World Bank, the logistics sector in
Poland is lagging behind and its ranking has
deteriorated. In particular the scores for timeliness
and tracking and tracing have decreased
significantly.
World Bank Logistics performance indicator
Source: World Bank.
Passenger
cars
Buses &
Coaches Railw ays
Tram &
Metro
Poland 77.3% 14.5% 6.6% 1.6%
EU-28 81.3% 9.4% 7.6% 1.8%
Modal split for passenger transport
(shares based on passenger-kilometres)
Road Railw ays
Inland
Waterw ays Pipeline
Poland 67.0% 23.0% 0.0% 9.9%
EU-28 71.7% 17.4% 6.1% 4.8%
Modal split for freight transport
(shares based on tonne-kilometres)
2014 2016
LPI Rank 31 33
Score 3.49 3.43
Customs 32 33
Score 3.26 3.27
Infrastructure 46 45
Score 3.08 3.17
International shipments 24 33
Score 3.46 3.44
Logistics competence 33 31
Score 3.47 3.39
Tracking & tracing 27 37
Score 3.54 3.46
Timeliness 15 37
Score 4.13 3.8
Logistics performance indicator (LPI)
(World Bank)

106 | Transport in the EU: Current Trends and Issues
Road safety
In terms of road fatalities, per million inhabitants
Poland (80) is significantly above the EU average
(50). The same pattern is observed per passenger-
kilometre and per total number of passenger cars.
Compared to 2010 the situation has considerably
improved, but Poland is still clearly lagging behind
the EU average. Preliminary statistics for 2017
indicate a decrease of 5 % in fatality figures.
Inattentive driving and non-respect of speed limits
remain among the main causes of accidents. Source: DG MOVE - CARE data.
Alternative fuels in road transport
Poland puts a lot of emphasis on the development
of the market for electric and Compressed Natural
Gas (CNG) cars. However, it is currently at a very
early stage of its development. In view of the low
numbers of Electrified Vehicle (EV) and CNG cars
currently on the road, Poland has a sufficient
network of public recharging and CNG refuelling
points. Beyond 2020, Poland defined a very
ambitious target of reaching more than 1 million
EVs on the road by 2025. The support measures
defined in the national policy framework may not
be sufficient to ensure target achievement,
considering that the EV share in Poland is very low
today.
SOURCE: EUROPEAN ALTERNATIVE FUELS OBSERVATORY (BEV
= battery electric vehicle; PHEV = plug-in hybrid electric vehicle;
CNG = compressed natural gas).
Market opening in the railway sector
The liberalisation process in the Polish rail market
started with the Railway Transport Act in 1997
under which for the first time licensed operators
were authorised to provide railway services on the
Polish network. In addition, the Act provided for the
obligation of separate accounting of railway and
infrastructure operations.
SOURCE: DG MOVE RAIL MARKET MONITORING (INCLUDES
DOMESTIC AND INTERNATIONAL TRANSPORT).
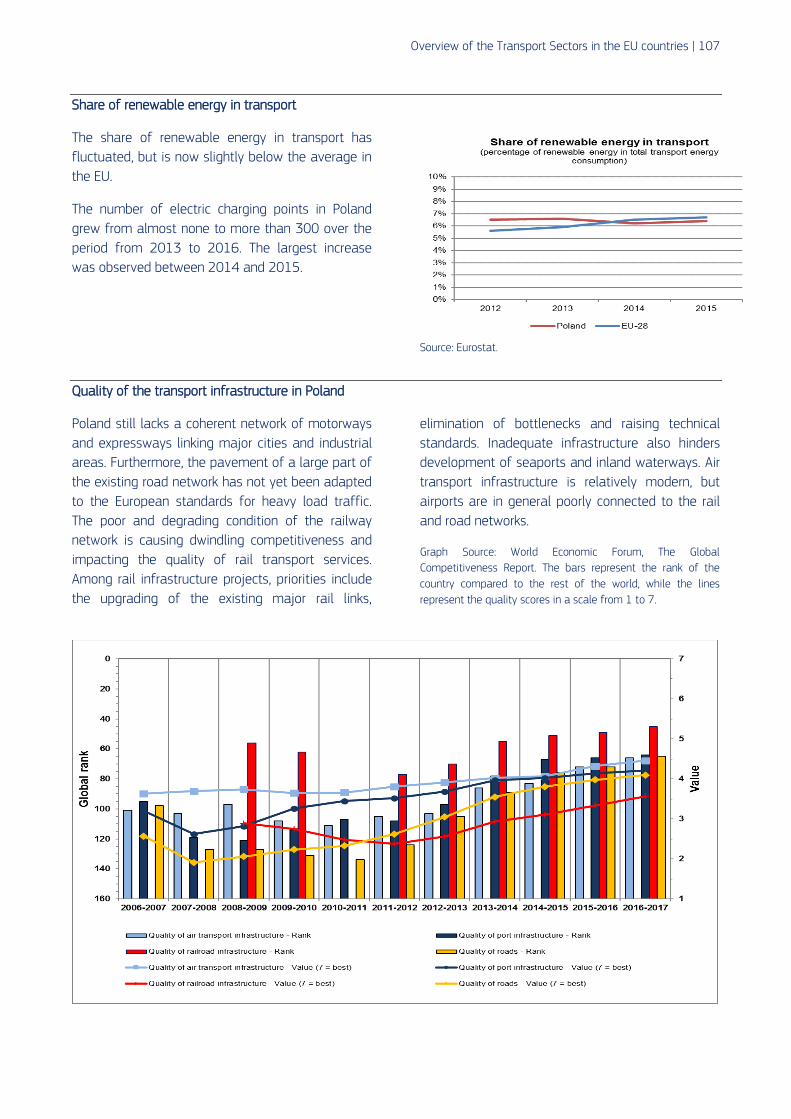
Overview of the Transport Sectors in the EU countries | 107
Share of renewable energy in transport
The share of renewable energy in transport has
fluctuated, but is now slightly below the average in
the EU.
The number of electric charging points in Poland
grew from almost none to more than 300 over the
period from 2013 to 2016. The largest increase
was observed between 2014 and 2015.
Source: Eurostat.
Quality of the transport infrastructure in Poland
Poland still lacks a coherent network of motorways
and expressways linking major cities and industrial
areas. Furthermore, the pavement of a large part of
the existing road network has not yet been adapted
to the European standards for heavy load traffic.
The poor and degrading condition of the railway
network is causing dwindling competitiveness and
impacting the quality of rail transport services.
Among rail infrastructure projects, priorities include
the upgrading of the existing major rail links,
elimination of bottlenecks and raising technical
standards. Inadequate infrastructure also hinders
development of seaports and inland waterways. Air
transport infrastructure is relatively modern, but
airports are in general poorly connected to the rail
and road networks.
Graph Source: World Economic Forum, The Global
Competitiveness Report. The bars represent the rank of the
country compared to the rest of the world, while the lines
represent the quality scores in a scale from 1 to 7.

108 | Transport in the EU: Current Trends and Issues
Portugal
Main current issues in Portugal
Issue 1 - Renegotiations of port concessions
The Portuguese authorities committed to launch the renegotiation of port concessions with the relevant
operators. The new port operation concessions should ensure that "(i) efficiency gains and cost-savings are
passed on to port customers; and (ii) minimum performance criteria are respected in order to foster competition
in the sector".
The Leixões port concession has been renegotiated, yielding positive results in terms of port user charges and
further investment in the port. The renegotiation of the Sines port concession was not successful. Renegotiations
of the main remaining port concessions are not yet concluded.
Issue 2 - Reform of port labour
Portugal reformed its port labour law in 2013 which caused a wave of protests. Port charges went down and
port throughput increased significantly.
Recently, on-going reforms in neighbouring Spain have failed to show any effects on the ground, due to strong
resistance from the trade unions. In this context, port unions in Portugal renewed their protests and expressed
solidarity with unions in Spain in the summer of 2017.
Developments in the Spanish port labour market might have repercussions in Portugal and endanger the acquis
of the 2013 reforms.
Issue 3 - Railway interoperability and investments
The most necessary investments in the railway infrastructure are already under way, but installed capacity is not
being used to its full potential. Portugal is completing the East-West international connections of the Atlantic
Corridor with the missing link of the Sines/Lisbon-Madrid and Aveiro-Salamanca lines under construction. This is
being done in the context of the Connecting Europe Facility.
However, railway interoperability with Spain is still an issue, owing to a lack of harmonisation in the height and
width of railway vehicles. A bigger coordination effort in this area would help deliver the potential of the Atlantic
Corridor.
The priorities for the interoperability are:
1. Harmonisation with ERTMS;
2. Full electrification (at the Portuguese and EU standard – 25kV) of the international connections;
3. Adaptation of sidings for the circulation of 740m-long trains (for freight transport).
The Atlantic Corridor already foresees (as the other Core Network Corridors) a multilevel governance involving
infrastructure managers, ministerial representation, regions, port authorities, etc. Another important coordination
mechanism and transport operation enabler is the Atlantic Rail Freight Corridor, in which Portugal takes part.
The additional coordination mechanism that can deliver is the joint working group consisting of Spain-Portugal
on the interoperability of the Iberian Peninsula. This group should deliver a strategic plan on future transition to
UIC gauge in the Iberian Peninsula and deployment of ERTMS – it is crucial to confirm the full compatibility of
ES-PT ERTMS-ETCS systems.

Overview of the Transport Sectors in the EU countries | 109
Key facts and figures on transport in Portugal
Modal split
Portugal records a high use of passenger cars and in
2015 car trips represented more than 88% of the
passenger-kilometres travelled, above the EU
average. On the other hand, Portugal records a lower
use of buses and coaches and railways than the EU
average. For land freight transport, the road
transport covers the largest share of freight
transport activity, about 84% of all tonne-kilometres
driven. In addition Portugal has a lower share of rail
and inland waterway transport than the EU average,
with no transport at all via inland waterways.
Modal split for passenger and freight transport in
2015
Source: EU Transport in figures, Statistical Pocketbook 2017.
Performance of the logistics sector
According to the World Bank, the logistics sector in
Portugal is an average performer in the world,
mostly penalised by poor infrastructure, internal
shipments and logistics competence.
World Bank Logistics performance indicator
Source: World Bank.
Passenger
cars
Buses &
Coaches Railw ays
Tram &
Metro
Portugal 88.5% 6.3% 4.1% 1.1%
EU-28 81.3% 9.4% 7.6% 1.8%
Modal split for passenger transport
(shares based on passenger-kilometres)
Road Railw ays
Inland
Waterw ays Pipeline
Portugal 84.1% 13.9% 0.0% 2.0%
EU-28 71.7% 17.4% 6.1% 4.8%
Modal split for freight transport
(shares based on tonne-kilometres)
2014 2016
LPI Rank 26 36
Score 3.56 3.41
Customs 31 30
Score 3.26 3.37
Infrastructure 31 49
Score 3.37 3.09
International shipments 29 47
Score 3.43 3.24
Logistics competence 20 47
Score 3.71 3.15
Tracking & tracing 20 29
Score 3.71 3.65
Timeliness 35 27
Score 3.87 3.95
Logistics performance indicator (LPI)
(World Bank)
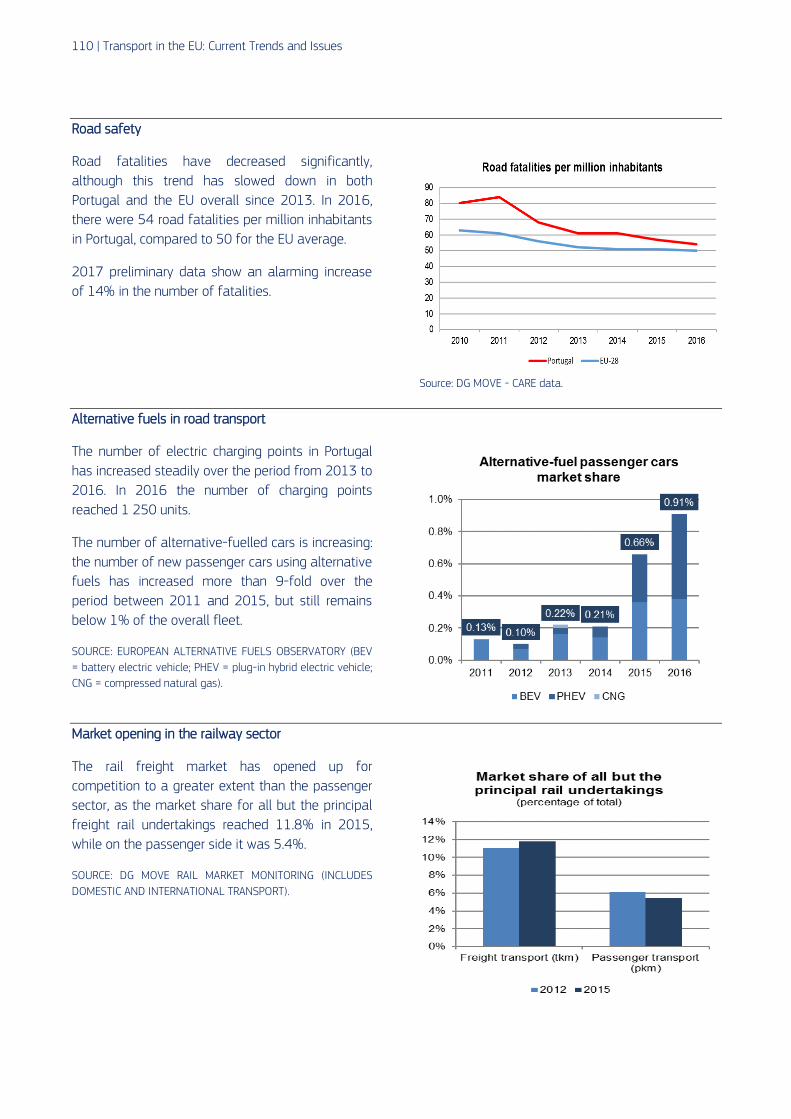
110 | Transport in the EU: Current Trends and Issues
Road safety
Road fatalities have decreased significantly,
although this trend has slowed down in both
Portugal and the EU overall since 2013. In 2016,
there were 54 road fatalities per million inhabitants
in Portugal, compared to 50 for the EU average.
2017 preliminary data show an alarming increase
of 14% in the number of fatalities.
Source: DG MOVE - CARE data.
Alternative fuels in road transport
The number of electric charging points in Portugal
has increased steadily over the period from 2013 to
2016. In 2016 the number of charging points
reached 1 250 units.
The number of alternative-fuelled cars is increasing:
the number of new passenger cars using alternative
fuels has increased more than 9-fold over the
period between 2011 and 2015, but still remains
below 1% of the overall fleet.
SOURCE: EUROPEAN ALTERNATIVE FUELS OBSERVATORY (BEV
= battery electric vehicle; PHEV = plug-in hybrid electric vehicle;
CNG = compressed natural gas).
Market opening in the railway sector
The rail freight market has opened up for
competition to a greater extent than the passenger
sector, as the market share for all but the principal
freight rail undertakings reached 11.8% in 2015,
while on the passenger side it was 5.4%.
SOURCE: DG MOVE RAIL MARKET MONITORING (INCLUDES
DOMESTIC AND INTERNATIONAL TRANSPORT).

Overview of the Transport Sectors in the EU countries | 111
Share of renewable energy in transport
The share of renewable energy in transport has
been increasing quite fast and overtook the EU
average in 2015.
In Portugal, there are two support schemes for the
use of renewable energy sources in the transport
sector: a tax exemption for small producers of
biofuels (PPDs) and a biofuel quota for companies
supplying fuels for consumption in the market.
Source: Eurostat.
Quality of the transport infrastructure in Portugal
The overall quality of the transport infrastructure in
Portugal is relatively high.
The quality of the road infrastructure is very good,
but has decreased in recent years. In the aftermath
of the financial crisis, public infrastructure funding
has been limited.
Portugal has not invested significantly in the
development of rail infrastructure. Preference was
given to the development of the road network,
which absorbed most structural and cohesion funds.
Rail investments have been limited to the
maintenance of the existing network.
Hinterland connections to and from main seaports
represent a bottleneck problem.
There is an untapped potential for Portuguese
airports, where the quality and efficiency of airport
services could be enhanced.
Graph Source: World Economic Forum, The Global
Competitiveness Report. The bars represent the rank of the
country compared to the rest of the world, while the lines
represent the quality scores in a scale from 1 to 7.

112 | Transport in the EU: Current Trends and Issues
Romania
Main current issues in Romania
Issue 1 - Transport infrastructure
The general condition and reliability of road and rail infrastructure remains poor. Despite substantial
investments, the state of the road infrastructure remains precarious. Motorways and national roads account for
slightly more than 20% of the road network, while some 90 % of national roads have only one traffic lane in
each direction. This is detrimental to delivery times and road safety. Heavy underinvestment in maintenance has
reduced train speed and affected rail freight delivery times.84 The poor state of the infrastructure affects the
efficiency with which Romania can ship its goods and connect producers with consumers compared to its main
trading partners.
Preparation, development and implementation of major infrastructure projects are lagging behind. A realistic and
mature project pipeline that can improve the quality and quantity of infrastructure, complete the multimodal
corridor and efficiently use the EUR 6.3 billion85 available for the 2014-2020 period is still needed. The projects
currently implemented under the 2014-2020 programmes are those prepared but not completed during the
previous programming period. Given the size and complexity of many of the projects, Romania risks losing part
of the EU funds earmarked for transport.
Issue 2 - Reform of the transport sector
The Romanian government adopted in September 2016 a national transport master plan, which is a
precondition for accessing 2014-2020 European Structural and Investment Funds. However, the plan only gives
a general picture of the priority projects and their readiness. To speed up investment in road infrastructure, the
management of infrastructure investments was split from the authority in charge of infrastructure
administration. The transport master plan and the accompanying railway reform provide the necessary strategic
framework for investments, but implementation remains slow.
The railway network needs to become financially viable but reform of the railway sector is lagging behind. The
rail reform agency is not fully operational and the socioeconomic analysis of the rail network still needs to be
finalised. In 2017, the market for train services was ranked very poorly by Romanian consumers and scored
significantly worse than in 2015.86
Issue 3 – Road safety
The road network in Romania includes few bypasses, with main roads passing through many villages and towns.
The high growth in vehicle fleet and the slow road infrastructure development has led to an alarming increase in
the number of accidents. Romania is one of the poorest performers in road safety in the EU. The fatality rate is
especially high in built-up areas and trends are particularly worrying as regards pedestrians. Important factors
are excessive speed and mixed traffic (several road user groups sharing the road). The road fatalities have
however decreased from 117 fatalities per million inhabitants in 2010 to 97 in 2016.
84 OECD (2016), OECD Competition Assessment Reviews: Romania, OECD Publishing, Paris: http://www.oecd-ilibrary.org/finance-and-investment/oecd-competition-assessment-reviews-romania_9789264257450-en. 85 From the European Structural and Investment Funds and the Connecting Europe Facility. 86 European Commission (2018b), Consumer Market Scoreboard 2018 edition, forthcoming.

Overview of the Transport Sectors in the EU countries | 113
Key facts and figures on transport in Romania
Modal split
Although below EU average, Romania records a high
use of passengers cars that amounted to 74.8 % of
the passenger-kilometres travelled in 2015. The use
of buses and coaches and of tram and metro is
higher than the EU average, while rail passenger
transport is below the EU average.
For land freight transport, the road transport covers
the largest share of freight transport activity, but is
considerably below the EU average. Romania has a
substantially higher share of rail and inland
waterways (five times more) than the EU average.
Modal split for passenger and freight transport in
2015
Source: EU Transport in figures, Statistical Pocketbook 2017.
Performance of the logistics sector
According to the World Bank, the logistics sector in
Romania ranks 60th in the LPI. It registered a
particularly low score for timeliness and both
logistics competence and tracking and tracing have
also shown low performance.
A major concern is that the score and ranking have
deteriorated in the 2016 edition of the indicator,
compared to 2014, suggesting increasing
bottlenecks in infrastructure capacity and inertia in
the transport sector.
World Bank Logistics performance indicator
Source: World Bank.
Passenger
cars
Buses &
Coaches Railw ays
Tram &
Metro
Romania 74.8% 14.5% 4.3% 6.3%
EU-28 81.3% 9.4% 7.6% 1.8%
Modal split for passenger transport
(shares based on passenger-kilometres)
Road Railw ays
Inland
Waterw ays Pipeline
Romania 37.1% 30.8% 29.7% 2.3%
EU-28 71.7% 17.4% 6.1% 4.8%
Modal split for freight transport
(shares based on tonne-kilometres)
2014 2016
LPI Rank 40 60
Score 3.26 2.99
Customs 59 50
Score 2.83 3.00
Infrastructure 64 58
Score 2.77 2.88
International shipments 36 57
Score 3.32 3.06
Logistics competence 43 67
Score 3.2 2.82
Tracking & tracing 34 64
Score 3.39 2.95
Timeliness 27 81
Score 4 3.22
Logistics performance indicator (LPI)
(World Bank)

114 | Transport in the EU: Current Trends and Issues
Road safety
Romania is one of the poorest performers in road
safety in the EU. The share of pedestrian fatalities
is one of the highest (37 % compared to 21 % on
average in the EU).
Important factors are excessive speed and mixed
traffic (several road user groups sharing the road).
Furthermore, traffic-calming measures and
separate paths for vulnerable road users (e.g.
sidewalks) are reportedly not sufficiently developed
or missing completely. However, road fatalities have
decreased from 117 fatalities per million
inhabitants in 2010 to 97 in 2016. Improvements
are due e.g. to the on-going construction of a
modern motorway network connecting all the larger
cities.
Source: DG MOVE - CARE data.
Alternative fuels in road transport
The share of electric cars in total sales on the
Romanian market is very small. CNG had looked
slightly more promising in the past, but does not
seem to be sold anymore.
Over the last three years the number of electric
charging points in Romania has increased from 15
units in 2014 to 63 units in 2016.
SOURCE: EUROPEAN ALTERNATIVE FUELS OBSERVATORY (BEV
= battery electric vehicle; PHEV = plug-in hybrid electric vehicle;
CNG = compressed natural gas).
Market opening in the railway sector
The administrative capacity of the Romanian
Railway Reform Authority (AFER), established in
2016, and of state railway infrastructure manager
CFR SA remains insufficient, notably with regard to
the management of public tenders, and the
planning, coordination and supervision of
infrastructure projects.
The passenger rail sector remains dominated by a
few players: the railway infrastructure manager,
CFR SA and the main operator of rail passenger
transport, CFR Calatori SA. In 2014, the market
share of all but the main rail passenger undertaking
was 9.1 % (no data available for 2015).
Source: DG MOVE Rail Market Monitoring (INCLUDES DOMESTIC
AND INTERNATIONAL TRANSPORT).

Overview of the Transport Sectors in the EU countries | 115
Share of renewable energy in transport
The current level of renewables in transport is
below EU average, but displays a slowly increasing
trend over the past few years.
Source: Eurostat.
Quality of the transport infrastructure in Romania
Romania places itself low in the quality ranking
and lowest among all EU countries for road and
rail infrastructure. Despite a relatively high
investment level as a share of GDP, the barriers to
investment hamper rapid improvements in
infrastructure. Romania has the lowest density of
motorways in the EU (2015), whilst the rail
network is "in an advanced state of disrepair due
to a chronic lack of maintenance", "very inefficient"
and continues to deteriorate (2015, European
Parliament report). The intermediate rise of
Romania in the international ranking for rail
infrastructure quality in the years 2014-15 to
position 59 and a value of 2.9, cannot be
explained by the doubling of its investment
spending on rail infrastructure (according to OECD
figures), as rates are declining again despite a
continued increase in investment spending in
2014 (OECD).
The falling passenger demand trend was also
turned around in 2014, reflecting the improving
attractiveness of rail travel. However, given the
renewed decline in ratings it remains doubtful that
the situation has changed sustainably. Overall,
transport infrastructure investment in Romania
has followed a declining trend since 2011,
according to the OECD.
Graph Source: World Economic Forum, The Global
Competitiveness Report. The bars represent the rank of the
country compared to the rest of the world, while the lines
represent the quality scores in a scale from 1 to 7.
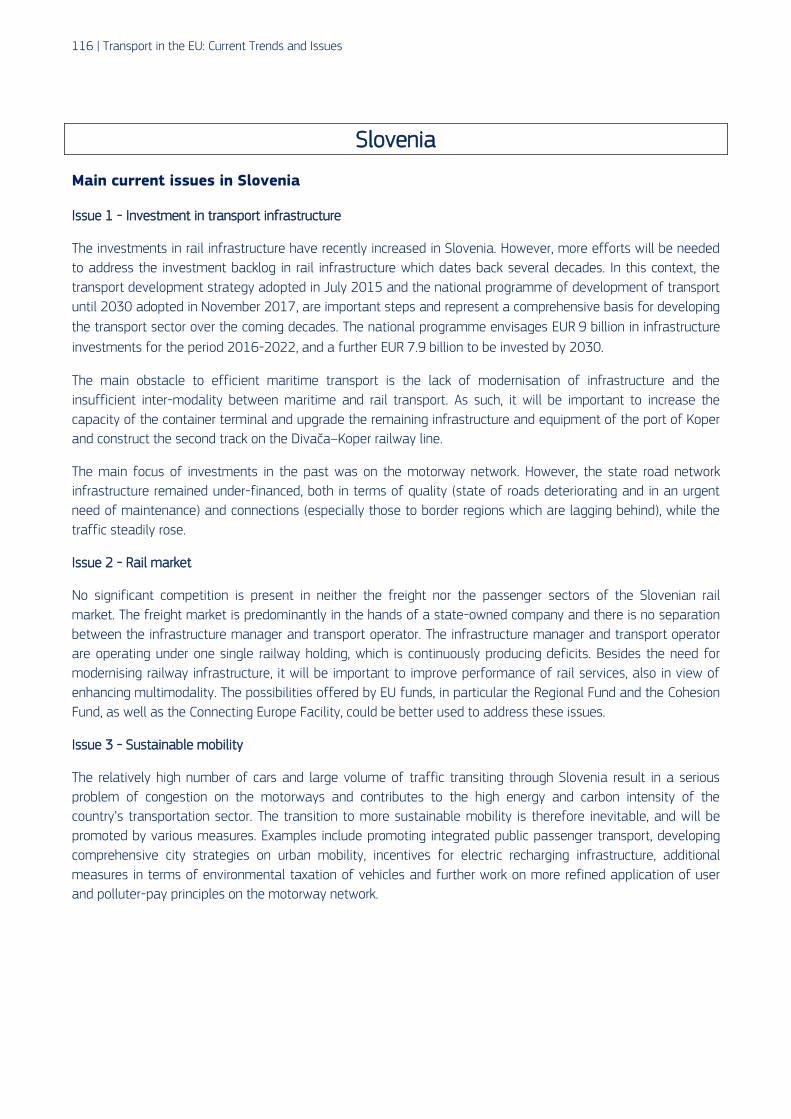
116 | Transport in the EU: Current Trends and Issues
Slovenia
Main current issues in Slovenia
Issue 1 - Investment in transport infrastructure
The investments in rail infrastructure have recently increased in Slovenia. However, more efforts will be needed
to address the investment backlog in rail infrastructure which dates back several decades. In this context, the
transport development strategy adopted in July 2015 and the national programme of development of transport
until 2030 adopted in November 2017, are important steps and represent a comprehensive basis for developing
the transport sector over the coming decades. The national programme envisages EUR 9 billion in infrastructure
investments for the period 2016-2022, and a further EUR 7.9 billion to be invested by 2030.
The main obstacle to efficient maritime transport is the lack of modernisation of infrastructure and the
insufficient inter-modality between maritime and rail transport. As such, it will be important to increase the
capacity of the container terminal and upgrade the remaining infrastructure and equipment of the port of Koper
and construct the second track on the Divača–Koper railway line.
The main focus of investments in the past was on the motorway network. However, the state road network
infrastructure remained under-financed, both in terms of quality (state of roads deteriorating and in an urgent
need of maintenance) and connections (especially those to border regions which are lagging behind), while the
traffic steadily rose.
Issue 2 - Rail market
No significant competition is present in neither the freight nor the passenger sectors of the Slovenian rail
market. The freight market is predominantly in the hands of a state-owned company and there is no separation
between the infrastructure manager and transport operator. The infrastructure manager and transport operator
are operating under one single railway holding, which is continuously producing deficits. Besides the need for
modernising railway infrastructure, it will be important to improve performance of rail services, also in view of
enhancing multimodality. The possibilities offered by EU funds, in particular the Regional Fund and the Cohesion
Fund, as well as the Connecting Europe Facility, could be better used to address these issues.
Issue 3 - Sustainable mobility
The relatively high number of cars and large volume of traffic transiting through Slovenia result in a serious
problem of congestion on the motorways and contributes to the high energy and carbon intensity of the
country’s transportation sector. The transition to more sustainable mobility is therefore inevitable, and will be
promoted by various measures. Examples include promoting integrated public passenger transport, developing
comprehensive city strategies on urban mobility, incentives for electric recharging infrastructure, additional
measures in terms of environmental taxation of vehicles and further work on more refined application of user
and polluter-pay principles on the motorway network.

Overview of the Transport Sectors in the EU countries | 117
Key facts and figures on transport in Slovenia
Modal split
Slovenia records a high use of passenger cars, and
car trips represented more than 86% of all
passenger-kilometres travelled, which is almost five
percentage points above the EU average. However,
in rail passenger transport Slovenia is well below the
EU average. For land freight transport, the road
transport covers the largest share of activity (65%)
which is below the EU average. On the contrary, the
rail freight transport represents an important share
of 35%, significantly above the EU average.
Modal split for passenger and freight transport in
2015
Source: EU Transport in figures, Statistical Pocketbook 2017.
Performance of the logistics sector
According to the World Bank, the performance of
Slovenia’s logistics sector is ranked 50 among 160
countries analysed. Compared to the best
performing in the region and in the world, Germany,
it lags behind in terms of customs and logistics
infrastructure quality. In terms of international
shipment, timeliness and tracking and tracing,
disparities are smaller. Still compared to its own
performance in 2010, it has improved on all the
logistics sub-indicators of the World Bank Logistics
performance indicator in 2016.
World Bank Logistics performance indicator
Source: World Bank.
Passenger
cars
Buses &
Coaches Railw ays
Tram &
Metro
Slovenia 86.1% 11.8% 2.1% 0.0%
EU-28 81.3% 9.4% 7.6% 1.8%
Modal split for passenger transport
(shares based on passenger-kilometres)
Road Railw ays
Inland
Waterw ays Pipeline
Slovenia 65.0% 35.0% 0.0% 0.0%
EU-28 71.7% 17.4% 6.1% 4.8%
Modal split for freight transport
(shares based on tonne-kilometres)
2014 2016
LPI Rank 38 50
Score 3.38 3.18
Customs 41 53
Score 3.11 2.88
Infrastructure 32 43
Score 3.35 3.19
International shipments 57 53
Score 3.05 3.1
Logistics competence 30 44
Score 3.51 3.2
Tracking & tracing 28 46
Score 3.51 3.27
Timeliness 37 60
Score 3.82 3.47
Logistics performance indicator (LPI)
(World Bank)

118 | Transport in the EU: Current Trends and Issues
Road safety
Road fatalities peaked at 146 killed per million
inhabitants in 2007 and since then have decreased
substantially. Between 2001 and 2010, Slovenia
decreased fatalities by 50% (EU average 43%) and
further reduced road deaths by only 6% between
2010 and 2016 (EU average: 19%).
In 2016, 130 dead or 63 dead per million
inhabitants were reported, which is still higher than
the EU average. Preliminary figures for 2017 show
an impressive decrease of 20% compared to the
previous year (EU average: 2%). (N.B. fluctuations
are normal for small countries; trends can only be
seen for longer time periods.) Source: DG MOVE - CARE data.
Alternative fuels in road transport
Slovenia puts emphasis on the development of the
market for electric vehicles. It estimates a share of
roughly 1% electric passenger cars on the road in
2020 and 16.9% in 2030. Measures are already in
place or planned to reach these estimated shares
(several tax exemptions and benefits, attractive
incentives for purchase and for use of electric
vehicles). Slovenia already has a well-developed
recharging infrastructure, with a ratio of one public
recharging point per only 1.64 electric vehicles. CNG
is considered to be the key alternative fuel for
buses in the future.
SOURCE: EUROPEAN ALTERNATIVE FUELS OBSERVATORY (BEV
= battery electric vehicle; PHEV = plug-in hybrid electric vehicle;
CNG = compressed natural gas).
Market opening in the railway sector
No major competition is present in neither the
freight nor the passenger sectors of the Slovenian
rail market. The freight market is dominated by a
state-owned company (88 % ) and there is no
separation between infrastructure and transport
operators. Awarding of public service contracts is
still done via direct award. There are doubts about
the administrative capacity of the regulator,
although progress was made by joining the railway
regulator with the independent regulator for
communications. SOURCE: DG MOVE RAIL MARKET MONITORING (INCLUDES
DOMESTIC AND INTERNATIONAL TRANSPORT).

Overview of the Transport Sectors in the EU countries | 119
Share of renewable energy in transport
The share of renewable energy used in transport in
Slovenia has decreased in the past years as
opposed to the EU average, where the share is on
the rise and reached almost 7% in 2015. The share
of transport, responsible for 31.8% of the Slovenian
CO2 emissions, remains above the EU average.
Slovenia is a transit country, which is a contributing
factor to this development.
Source: Eurostat.
Quality of the transport infrastructure in Slovenia
In the competitiveness ranking of the World
Economic Forum, Slovenia's perceived quality of
roads has improved between 2010/11 and
2012/13. Afterwards a drop was observed and its
ranking declined. Perceptions of the railway
infrastructure increased until 2013/14, however the
level of the quality perception for Slovenia is falling
for the third year in a row and reached 2.9 points in
2017/18 and with rank 62, the lowest rank recorded
so far.
The quality rankings for air and maritime transport
infrastructure have been relatively stable over the
last years.
Graph Source: World Economic Forum, The Global
Competitiveness Report. The bars represent the rank of the
country compared to the rest of the world, while the lines
represent the quality scores in a scale from 1 to 7.

120 | Transport in the EU: Current Trends and Issues
Slovakia
Main current issues in Slovakia
Issue 1 – Attractiveness of public transport
Interest in the public passenger bus transport in Slovakia has had a decreasing trend. The demand for suburban
bus connections dropped by 40% between 2006 and 2015. The issue is a low load factor of some trains and
buses, which may also be caused by unwanted concurrence. Therefore, the administration plans to set up a
transport authority which should coordinate the passenger trains, suburban buses, and eventually also the city
transport. The objective is to increase the accessibility, comfort, and hence the attractiveness of the public
passenger transport.
Issue 2 - Aviation safety
In the aviation safety field, the Commission has launched two pre-infringement procedures. The first one in the
airworthiness domain (6988/14) evolved into a Letter of Formal Notice (LFN 2015/2064). The second one in the
air operations domain (ref 8590/16) was launched more recently.
Both cases show the same problem: a lack of resources (basically safety inspectors) in the Slovak Civil Aviation
Authority to carry out the safety oversight tasks that the competent authority is bound to do under the
applicable EU regime.
Issue 3 - Road safety
In 2016, Slovakia reported 275 dead in road accidents or 51 dead per million inhabitants (EU average: 50).
Road safety needs to be improved in general, if Slovakia is to contribute to the EU strategic target of halving the
number of road deaths. To further improve the safety of its roads, special attention needs to be paid to the
safety of pedestrians.

Overview of the Transport Sectors in the EU countries | 121
Key facts and figures on transport in Slovakia
Modal split
In 2015, car trips represented 75.3% of the
passenger-kilometres travelled, slightly below the EU
average. On the other hand, Slovakia records a
higher use of buses and coaches than the EU
average, in addition to rail passenger transport which
is also slightly higher than the EU average. For land
freight transport, the road transport covers the
largest share of freight transport activity, about 50%
of all tonne-kilometres driven. In addition Slovakia
has a much higher share of rail (almost double) and
pipeline (almost triple) transport than the EU
average.
Modal split for passenger and freight transport in
2015
Source: EU Transport in figures, Statistical Pocketbook 2017.
Performance of the logistics sector
The performance of the logistics sector in Slovakia
has slightly improved between 2014 and 2016.
Mainly the customs procedures appear to have
become more efficient and tracking and tracing of
cargo has been improved. However, in terms of
logistics competence and timeliness Slovakia scored
lower in 2016 than in 2014.
World Bank Logistics performance indicator
Source: World Bank.
Passenger
cars
Buses &
Coaches Railw ays
Tram &
Metro
Slovakia 75.3% 14.7% 9.3% 0.7%
EU-28 81.3% 9.4% 7.6% 1.8%
Modal split for passenger transport
(shares based on passenger-kilometres)
Road Railw ays
Inland
Waterw ays Pipeline
Slovakia 49.4% 30.2% 2.6% 17.8%
EU-28 71.7% 17.4% 6.1% 4.8%
Modal split for freight transport
(shares based on tonne-kilometres)
2014 2016
LPI Rank 43 41
Score 3.25 3.34
Customs 52 32
Score 2.89 3.28
Infrastructure 37 39
Score 3.22 3.24
International shipments 38 36
Score 3.3 3.41
Logistics competence 46 51
Score 3.16 3.12
Tracking & tracing 63 55
Score 3.02 3.12
Timeliness 30 36
Score 3.94 3.81
Logistics performance indicator (LPI)
(World Bank)

122 | Transport in the EU: Current Trends and Issues
Road safety
Slovakia reduced the number of road deaths by
44% between 2001 and 2010 (EU average:
43 % %), then further reduced it by 22% between
2010 and 2016 (EU average: 19%). Preliminary
data for 2017 show an alarming increase of 12% in
the number of fatalities.
However, the share of pedestrian fatalities is
significantly higher than the EU average. Seat-belt
wearing rates are lower than the EU average.
Slovakia improves infrastructure via audits,
inspections and high-risk site treatment. Slovakia
has a zero tolerance law for drink-driving, which is
stricter than most other EU countries. Effectiveness
of law enforcement is at the level of most EU
countries.
Source: DG MOVE - CARE data.
Alternative fuels in road transport
The number of alternative-fuelled cars sharply
increased in 2013 (from 42 to 1 390) and
considerably declined to 279 in 2016. The market
share of alternative fuel cars is very marginal
(0.31%).
Slovakia partly addresses the requirements of
Article 3 of the alternative fuels infrastructure
directive in that for all mandatory fuels and modes
(electricity and natural gas) targets for
infrastructure development are established. No
measures have been taken to promote alternative
fuels infrastructure in public transport services or to
facilitate the deployment of recharging points.
Market opening in the railway sector
The market opening of the Slovak railway sector is
relatively advanced for freight transport. Yet, in the
passenger transport segment, market opening still
needs to be fostered further, despite the progress
made since 2012.
SOURCE: DG MOVE RAIL MARKET MONITORING (INCLUDES
DOMESTIC AND INTERNATIONAL TRANSPORT).
SOURCE: EUROPEAN ALTERNATIVE FUELS OBSERVATORY (BEV =
battery electric vehicle; PHEV = plug-in hybrid electric vehicle;
CNG = compressed natural gas).

Overview of the Transport Sectors in the EU countries | 123
Share of renewable energy in transport
Despite the low share of alternative fuelled
passenger cars, Slovakia has a high share of
renewable energy in its transport sector, possibly
due to the high share of railway in the modal split.
SOURCE: EUROSTAT.
Quality of the transport infrastructure in Slovakia
The overall quality of the railway infrastructure in
Slovakia is relatively high in international
comparison. Investments continue to flow into
modernisation of railway corridors, purchase of new
and the restoration of the existing train units.
The quality of the road infrastructure is much lower,
but has improved in recent years. In 2015, the total
expenditure of Slovakia on the construction of
motorways and highways was the highest in history,
partially due to the approaching end of the second
programming period of the EU funds.
However, the operating expenditure on
maintenance and repairs is insufficient. In 2015,
45% of roads were either in bad or emergency
condition and taking into consideration the actual
level of funds allocated to maintenance and repair,
even the roads which currently are in a good
condition will gradually deteriorate and will require
expensive reconstruction.
Inland waterway navigation on the Danube is
controlled by a monopolist, a former state-owned
enterprise. The poor quality of the port
infrastructure is also reflected by a declining
volume of inland waterway freight transport in
Slovakia.
GRAPH SOURCE: WORLD ECONOMIC FORUM, THE GLOBAL
COMPETITIVENESS REPORT.
The bars represent the rank of the country
compared to the rest of the world, while the lines
represent the quality scores in a scale from 1 to 7.

124 | Transport in the EU: Current Trends and Issues
Finland
Main current issues in Finland
Issue 1 – Maintenance investments in transport infrastructure
There is a need to establish an economically sustainable model for maintaining the transport infrastructure. The
infrastructure maintenance shortfall is currently around EUR 2.5 billion. The Finnish government has stated that
one of the priorities will be to reduce this amount but it is not clear how this will be done and what kind of
impact this will have on the existing comprehensive network.
Issue 2 – Competition in the railway market
More competition in the passenger and freight rail market by removing outstanding obstacles for potential
market entrants could benefit businesses and consumers in Finland. The Finnish government has announced
plans on when and how to open up the market for other operators. If applied, these measures could improve the
competitiveness of the sector.

Overview of the Transport Sectors in the EU countries | 125
Key facts and figures on transport in Finland
Modal split
The modal split for both passenger and freight
transport shows a clear preference for road transport
over railways, trams and metro, even more when
compared to the EU average.
On the other hand, Finland has a much higher share
of railways in its modal split for freight transport
than the EU average.
Transport on the Finnish inland waterways is often
combined maritime-inland waterways transport.
Thus the service providers tend to be larger
companies with bigger, sea-worthy vessels. For
purely national transport of goods and passengers
its role is rather marginal.
Modal split for passenger and freight transport in
2015
Source: EU Transport in figures, Statistical Pocketbook 2017.
Performance of the logistics sector
According to the analysis of the World Bank, the
competitiveness of Finland’s logistics sector has
improved considerably from 2014 to 2016, when
looking at its global ranking.
The absolute scores on the Logistics performance
indicator have improved mainly for the
infrastructure, tracking and tracing, and the
timeliness of deliveries.
However, the performance of international
shipments is still relatively low.
World Bank Logistics performance indicator
Source: World Bank.
Passenger
cars
Buses &
Coaches Railw ays
Tram &
Metro
Finland 84.5% 9.6% 5.2% 0.7%
EU-28 81.3% 9.4% 7.6% 1.8%
Modal split for passenger transport
(shares based on passenger-kilometres)
Road Railw ays
Inland
Waterw ays Pipeline
Finland 72.6% 27.0% 0.4% 0.0%
EU-28 71.7% 17.4% 6.1% 4.8%
Modal split for freight transport
(shares based on tonne-kilometres)
2014 2016
LPI Rank 24 15
Score 3.62 3.92
Customs 8 4
Score 3.89 4.01
Infrastructure 28 16
Score 3.52 4.01
International shipments 20 30
Score 3.52 3.51
Logistics competence 19 16
Score 3.72 3.88
Tracking & tracing 39 11
Score 3.31 4.04
Timeliness 38 16
Score 3.8 4.14
Logistics performance indicator (LPI)
(World Bank)
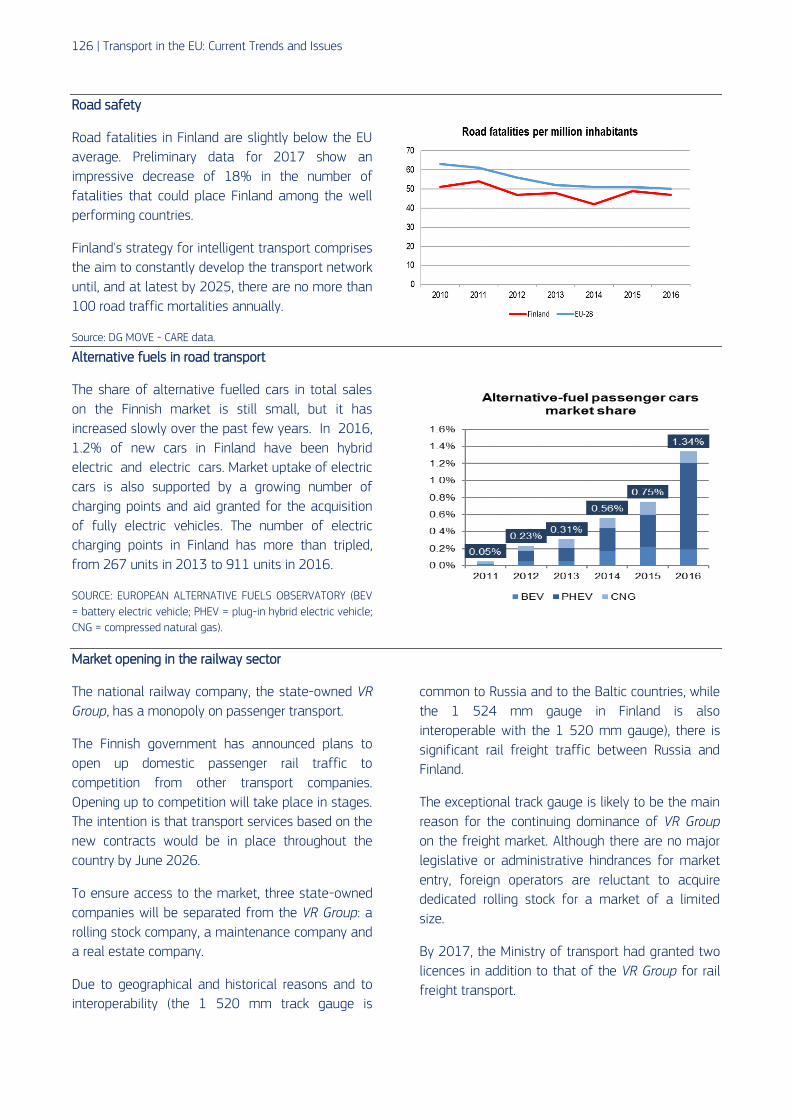
126 | Transport in the EU: Current Trends and Issues
Road safety
Road fatalities in Finland are slightly below the EU
average. Preliminary data for 2017 show an
impressive decrease of 18% in the number of
fatalities that could place Finland among the well
performing countries.
Finland's strategy for intelligent transport comprises
the aim to constantly develop the transport network
until, and at latest by 2025, there are no more than
100 road traffic mortalities annually.
Source: DG MOVE - CARE data.
Alternative fuels in road transport
The share of alternative fuelled cars in total sales
on the Finnish market is still small, but it has
increased slowly over the past few years. In 2016,
1.2% of new cars in Finland have been hybrid
electric and electric cars. Market uptake of electric
cars is also supported by a growing number of
charging points and aid granted for the acquisition
of fully electric vehicles. The number of electric
charging points in Finland has more than tripled,
from 267 units in 2013 to 911 units in 2016.
SOURCE: EUROPEAN ALTERNATIVE FUELS OBSERVATORY (BEV
= battery electric vehicle; PHEV = plug-in hybrid electric vehicle;
CNG = compressed natural gas).
Market opening in the railway sector
The national railway company, the state-owned VR
Group, has a monopoly on passenger transport.
The Finnish government has announced plans to
open up domestic passenger rail traffic to
competition from other transport companies.
Opening up to competition will take place in stages.
The intention is that transport services based on the
new contracts would be in place throughout the
country by June 2026.
To ensure access to the market, three state-owned
companies will be separated from the VR Group: a
rolling stock company, a maintenance company and
a real estate company.
Due to geographical and historical reasons and to
interoperability (the 1 520 mm track gauge is
common to Russia and to the Baltic countries, while
the 1 524 mm gauge in Finland is also
interoperable with the 1 520 mm gauge), there is
significant rail freight traffic between Russia and
Finland.
The exceptional track gauge is likely to be the main
reason for the continuing dominance of VR Group
on the freight market. Although there are no major
legislative or administrative hindrances for market
entry, foreign operators are reluctant to acquire
dedicated rolling stock for a market of a limited
size.
By 2017, the Ministry of transport had granted two
licences in addition to that of the VR Group for rail
freight transport.

Overview of the Transport Sectors in the EU countries | 127
Share of renewable energy in transport
Finland is among the few EU Member States which
has already achieved the renewable energy share in
transport, reaching 22 % in 2015.
In Finland, the main support scheme for renewable
energy sources used in transport is a quota system.
This system obliges fuel vendors to ensure that
biofuels make up a defined percentage of the
company’s total annual sale of fuel. Furthermore,
the use of biofuels is supported through tax
regulation.
Source: Eurostat.
Quality of the transport infrastructure in Finland
In terms of infrastructure quality, Finland ranks very
high in the international comparison by the World
Economic Forum.
However, in recent years, a steadily declining trend
of the perceived quality of the road infrastructure
can be observed. To a lesser extent, this is also
valid for the railway infrastructure.
Graph Source: World Economic Forum, The Global
Competitiveness Report. The bars represent the rank of the
country compared to the rest of the world, while the lines
represent the quality scores in a scale from 1 to 7.

128 | Transport in the EU: Current Trends and Issues
Sweden
Main current issues in Sweden
Issue 1 – Investment in transport infrastructure
In spring 2018, the government will decide on the 2018-29 national transport-modes plan, which the Swedish
Transport Administration presented in August 2017. The plan includes a budget of SEK 622.5 billion (SEK 100
billion more than for the previous 10-year-period). The budget allocates 26% to road maintenance (mainly
safety improvements and further enabling environmentally friendly solutions), and 20% to rail network
maintenance. The remaining 54% are allocated to new investments to match the growth in traffic volume.
Issue 2 – Shifting modes
The government aims to increasingly shift traffic from road to rail and maritime modes, thereby decreasing the
environmental impact of transport. Currently roughly 90% of all goods are transported by road domestically. A
transition to other modes would require significant investments.
Issue 3 - Energy efficiency and sustainability in transport
Despite the highest renewables share in transport in the EU, transport is still predominantly dependant on fossil
fuels. In order to improve energy efficiency and reduce emissions, a holistic approach is needed. Sustainable
biofuels can help but electrification of the railway network also bears potential for improvement.

Overview of the Transport Sectors in the EU countries | 129
Key facts and figures on transport in Sweden
Modal split
Sweden is one of the countries with a share of
railways in the modal split that is significantly above
EU average. This is mainly the case for freight
transport, but to a lesser degree also for passenger
transport.
Overall, the Swedish domestic transport system
seems to rely almost entirely on land transport, with
Sweden imposing a tax on travelling by air in order
to encourage citizens to use less polluting means of
transport.
Modal split for passenger and freight transport in
2015
SOURCE: EU TRANSPORT IN FIGURES, STATISTICAL POCKETBOOK 2017.
2.2 Performance of the logistics sector
Sweden’s logistics sector is among the best in the
world and scores high across all criteria the World
Bank takes into account to calculate its Logistics
performance indicator.
More could still be done to improve the efficiency of
customs procedures.
World Bank Logistics performance indicator
Source: World Bank.
Passenger
cars
Buses &
Coaches Railw ays
Tram &
Metro
Sweden 81.7% 7.2% 9.3% 1.8%
EU-28 81.3% 9.4% 7.6% 1.8%
Modal split for passenger transport
(shares based on passenger-kilometres)
Road Railw ays
Inland
Waterw ays Pipeline
Sweden 70.6% 29.4% 0.0% 0.0%
EU-28 71.7% 17.4% 6.1% 4.8%
Modal split for freight transport
(shares based on tonne-kilometres)
2014 2016
LPI Rank 6 3
Score 3.96 4.2
Customs 15 8
Score 3.75 3.92
Infrastructure 9 3
Score 4.09 4.27
International shipments 3 4
Score 3.76 4
Logistics competence 6 2
Score 3.98 4.25
Tracking & tracing 7 1
Score 3.97 4.38
Timeliness 8 3
Score 4.26 4.45
Logistics performance indicator (LPI)
(World Bank)

130 | Transport in the EU: Current Trends and Issues
Road safety
When it comes to road safety Sweden belongs to
the best performing countries in Europe and every
year the fatality rate has been lower than the EU
average.
Sweden developed the Vision Zero road safety
policy, a strategic approach towards a safe system
where no one is at risk of being fatally or severely
injured while using road transport.
Source: DG MOVE - CARE data.
Alternative fuels in road transport
Sweden has a very high share of alternative fuels in
its passenger car fleet. In public transport the use of
alternative fuels is also encouraged, though the
most common alternative fuel is biodiesel.
The number of rechargeable electric vehicles
doubled between 2014 and 2015, and this rate of
increase has, in principle, continued in 2016. There
were around 24 800 rechargeable electric vehicles
in Sweden in September 2016, approximately two-
thirds of these being plug-in hybrid electric vehicles
and one-third pure electric vehicles.
SOURCE: EUROPEAN ALTERNATIVE FUELS OBSERVATORY (BEV
= battery electric vehicle; PHEV = plug-in hybrid electric vehicle;
CNG = compressed natural gas).
Market opening in the railway sector
The railway undertaking is privatised for both
passengers and freight traffic with around 40
operators so far. Sweden currently does not have a
high-speed rail network.
SOURCE: DG MOVE RAIL MARKET MONITORING (INCLUDES
DOMESTIC AND INTERNATIONAL TRANSPORT).

Overview of the Transport Sectors in the EU countries | 131
Share of renewable energy in transport
Sweden has a very high share of renewable energy
in transport, to a large extent because the use of
biodiesel in combustion engines is very much
encouraged and because railways make up for an
important part of the modal split in the country.
Source: Eurostat.
Quality of the transport infrastructure in Sweden
Sweden has reported a constant downward
movement in both ranking and value of the
perceived quality of its railroad infrastructure during
the last decade, although an improvement can be
seen in 2016. The use of rail transport has
increased significantly over the last 26 years –
passenger km nearly doubled and freight traffic
increased by 12%. This has put a certain strain on
the network which saw a slight decline of lines in
use and heavily increased congestion.
Sweden ranks high in terms of the quality of its port
infrastructure (13 in the world in the 2014/15 and
2015/16 datasets). Maritime transport continues to
be a strong complimentary transport mode in
Sweden.
The perceived quality of the air transport
infrastructure in Sweden is very high and the score
remains stable around the value 6. In the
international ranking, although less stable, Sweden
generally attains scores between 20 and 22.
Graph Source: World Economic Forum, The Global
Competitiveness Report. The bars represent the rank of the
country compared to the rest of the world, while the lines
represent the quality scores in a scale from 1 to 7.

132 | Transport in the EU: Current Trends and Issues
United Kingdom
Main current issues in the United Kingdom
Issue 1 – Road congestion
Road congestion levels are significantly above the EU average. According to data from the Commission’s Joint
Research Centre, car occupants in the United Kingdom were second only to Maltese car users in terms of hours
spent in road congestion in 2015.
Issue 2 – Quality of rail services
The consumer satisfaction with rail transport in the United Kingdom is quite low in comparison with the EU
average, according to the Market Performance Index developed by DG JUST. In the 2015 index, the United
Kingdom scored 72.5 while the EU average value stood at 76.2.
The punctuality of the long-distance rail services is quite high in the United Kingdom, but less than 90% of the
regional and local trains were on time in 2014.
Issue 3 – Quality of transport infrastructure
Despite high investments in transport infrastructure in the United Kingdom, the perceived quality of the
infrastructure shows a declining trend. This is particularly the case for road and railway infrastructure, but also in
the field of aviation.

Overview of the Transport Sectors in the EU countries | 133
Key facts and figures on transport in the United Kingdom
Modal split
The United Kingdom records a high use of passenger
cars and in 2015 car trips represented more than
84% of the passenger-kilometres travelled, above
the EU average. On the other hand, the United
Kingdom records a lower use of buses and coaches
than the EU average, while rail passenger transport
is slightly higher. For land freight transport, the road
transport covers the largest share of freight
transport activity, about 84% of all tonne-kilometres
driven. The United Kingdom has a considerably lower
share of rail and inland waterway transport than the
EU average.
Modal split for passenger and freight transport in
2015
SOURCE: EU TRANSPORT IN FIGURES, STATISTICAL POCKETBOOK 2017.
Performance of the logistics sector
According to the World Bank, the logistics sector in
the United Kingdom is among the 10 best
performing in the world, mostly because of its
performance in terms of infrastructure, customs,
logistics competence and tracking and tracing. In
particular, in the areas of customs and infrastructure,
the performance of the United Kingdom's logistics
sector in 2016 was significantly better than in 2010.
World Bank Logistics performance indicator
Source: World Bank.
Passenger
cars
Buses &
Coaches Railw ays
Tram &
Metro
United Kingdom 84.5% 5.2% 8.5% 1.7%
EU-28 81.3% 9.4% 7.6% 1.8%
Modal split for passenger transport
(shares based on passenger-kilometres)
Road Railw ays
Inland
Waterw ays Pipeline
United Kingdom 83.8% 11.1% 0.1% 5.0%
EU-28 71.7% 17.4% 6.1% 4.8%
Modal split for freight transport
(shares based on tonne-kilometres)
2014 2016
LPI Rank 4 8
Score 4.01 4.07
Customs 5 5
Score 3.94 3.98
Infrastructure 6 5
Score 4.16 4.21
International shipments 12 11
Score 3.63 3.77
Logistics competence 5 7
Score 4.03 4.05
Tracking & tracing 5 7
Score 4.08 4.13
Timeliness 7 8
Score 4.33 4.33
Logistics performance indicator (LPI)
(World Bank)
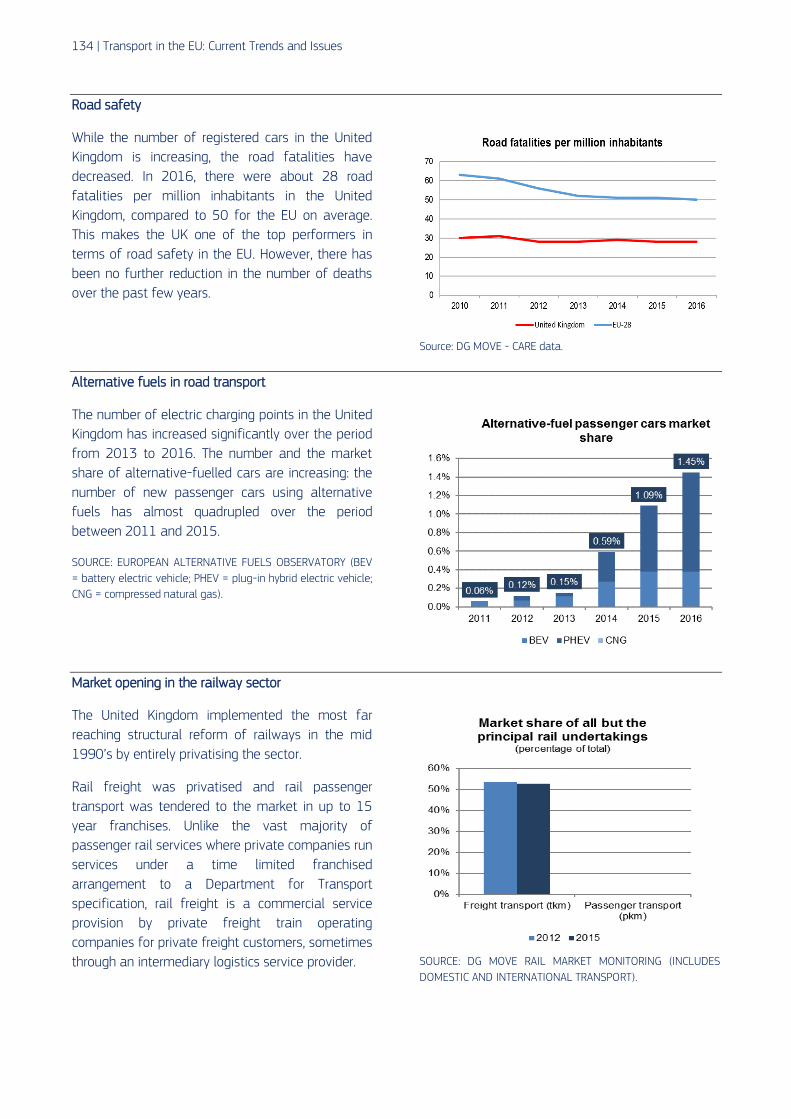
134 | Transport in the EU: Current Trends and Issues
Road safety
While the number of registered cars in the United
Kingdom is increasing, the road fatalities have
decreased. In 2016, there were about 28 road
fatalities per million inhabitants in the United
Kingdom, compared to 50 for the EU on average.
This makes the UK one of the top performers in
terms of road safety in the EU. However, there has
been no further reduction in the number of deaths
over the past few years.
Source: DG MOVE - CARE data.
Alternative fuels in road transport
The number of electric charging points in the United
Kingdom has increased significantly over the period
from 2013 to 2016. The number and the market
share of alternative-fuelled cars are increasing: the
number of new passenger cars using alternative
fuels has almost quadrupled over the period
between 2011 and 2015.
SOURCE: EUROPEAN ALTERNATIVE FUELS OBSERVATORY (BEV
= battery electric vehicle; PHEV = plug-in hybrid electric vehicle;
CNG = compressed natural gas).
Market opening in the railway sector
The United Kingdom implemented the most far
reaching structural reform of railways in the mid
1990’s by entirely privatising the sector.
Rail freight was privatised and rail passenger
transport was tendered to the market in up to 15
year franchises. Unlike the vast majority of
passenger rail services where private companies run
services under a time limited franchised
arrangement to a Department for Transport
specification, rail freight is a commercial service
provision by private freight train operating
companies for private freight customers, sometimes
through an intermediary logistics service provider.
SOURCE: DG MOVE RAIL MARKET MONITORING (INCLUDES
DOMESTIC AND INTERNATIONAL TRANSPORT).
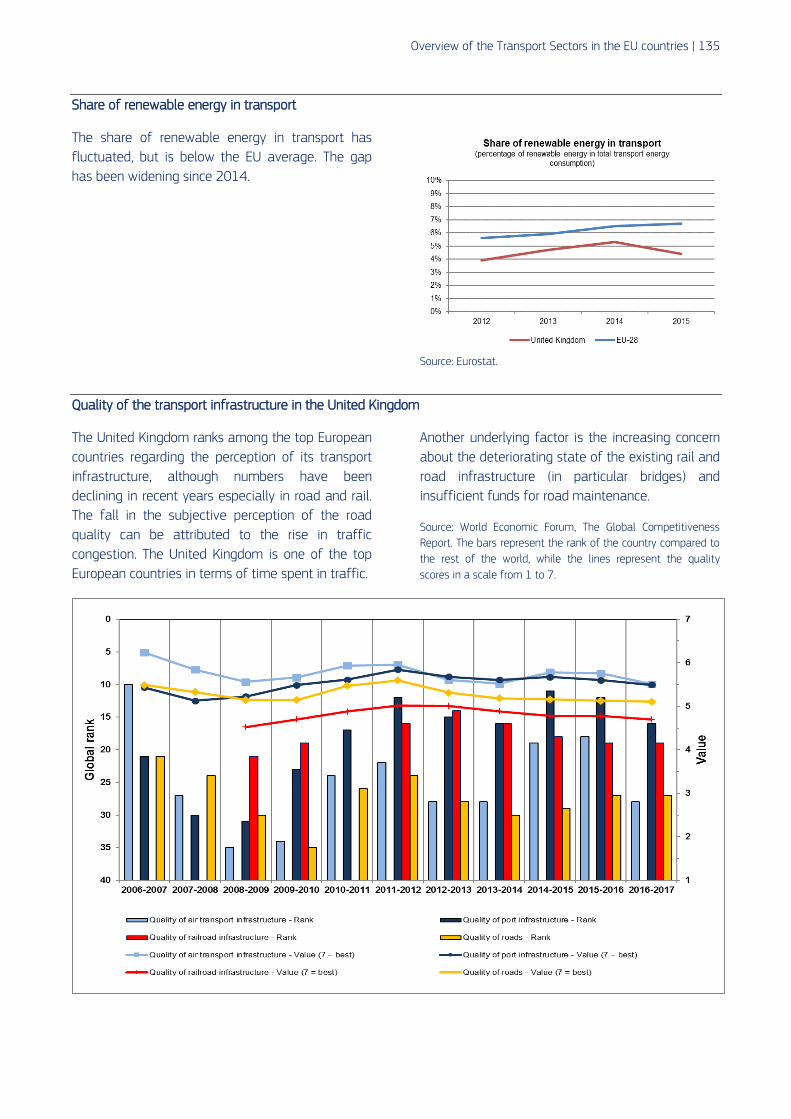
Overview of the Transport Sectors in the EU countries | 135
Share of renewable energy in transport
The share of renewable energy in transport has
fluctuated, but is below the EU average. The gap
has been widening since 2014.
Source: Eurostat.
Quality of the transport infrastructure in the United Kingdom
The United Kingdom ranks among the top European
countries regarding the perception of its transport
infrastructure, although numbers have been
declining in recent years especially in road and rail.
The fall in the subjective perception of the road
quality can be attributed to the rise in traffic
congestion. The United Kingdom is one of the top
European countries in terms of time spent in traffic.
Another underlying factor is the increasing concern
about the deteriorating state of the existing rail and
road infrastructure (in particular bridges) and
insufficient funds for road maintenance.
Source: World Economic Forum, The Global Competitiveness
Report. The bars represent the rank of the country compared to
the rest of the world, while the lines represent the quality
scores in a scale from 1 to 7.
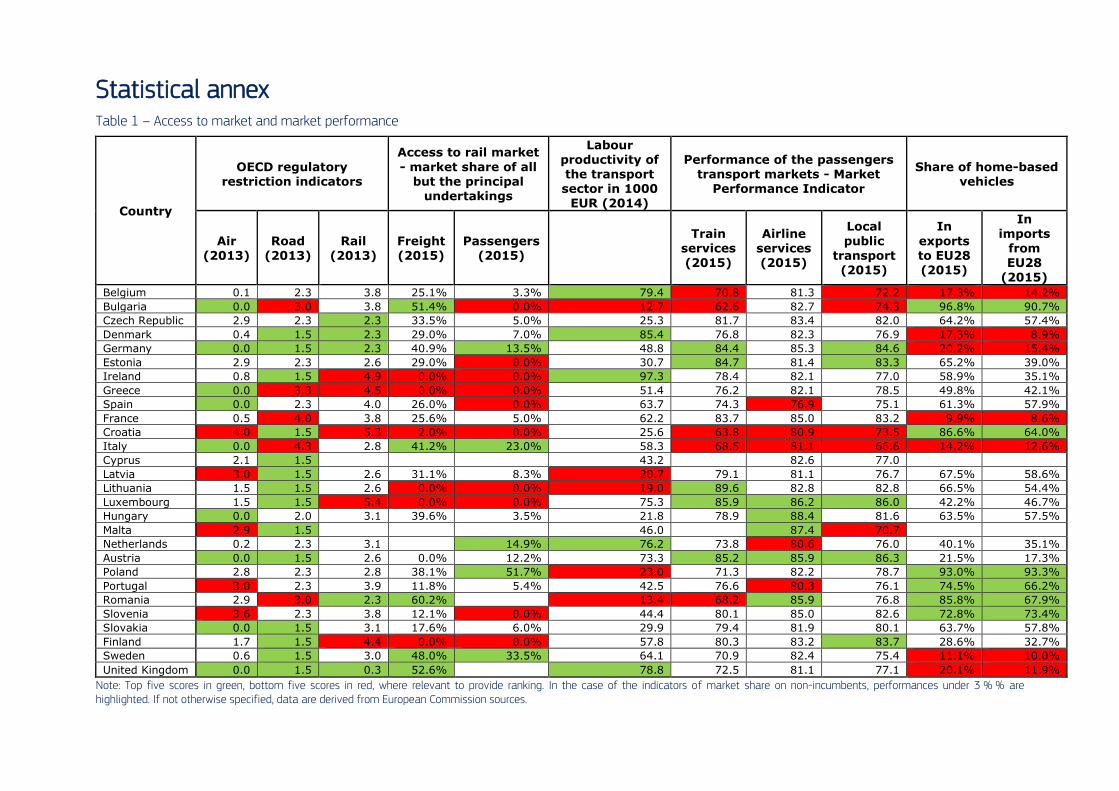
Statistical annex Table 1 – Access to market and market performance
Country
OECD regulatory restriction indicators
Access to rail market
- market share of all but the principal
undertakings
Labour productivity of the transport sector in 1000
EUR (2014)
Performance of the passengers transport markets - Market
Performance Indicator
Share of home-based vehicles
Air (2013)
Road (2013)
Rail (2013)
Freight (2015)
Passengers (2015)
Train services (2015)
Airline services (2015)
Local
public transport (2015)
In
exports to EU28 (2015)
In
imports from EU28
(2015)
Belgium 0.1 2.3 3.8 25.1% 3.3% 79.4 70.8 81.3 72.2 17.3% 14.2%
Bulgaria 0.0 3.0 3.8 51.4% 0.0% 12.7 62.6 82.7 74.3 96.8% 90.7%
Czech Republic 2.9 2.3 2.3 33.5% 5.0% 25.3 81.7 83.4 82.0 64.2% 57.4%
Denmark 0.4 1.5 2.3 29.0% 7.0% 85.4 76.8 82.3 76.9 17.3% 8.9%
Germany 0.0 1.5 2.3 40.9% 13.5% 48.8 84.4 85.3 84.6 20.2% 15.4%
Estonia 2.9 2.3 2.6 29.0% 0.0% 30.7 84.7 81.4 83.3 65.2% 39.0%
Ireland 0.8 1.5 4.9 0.0% 0.0% 97.3 78.4 82.1 77.0 58.9% 35.1%
Greece 0.0 3.3 4.5 0.0% 0.0% 51.4 76.2 82.1 78.5 49.8% 42.1%
Spain 0.0 2.3 4.0 26.0% 0.0% 63.7 74.3 76.9 75.1 61.3% 57.9%
France 0.5 4.0 3.8 25.6% 5.0% 62.2 83.7 85.0 83.2 9.9% 8.6%
Croatia 4.0 1.5 5.3 2.0% 0.0% 25.6 63.8 80.9 73.5 86.6% 64.0%
Italy 0.0 4.3 2.8 41.2% 23.0% 58.3 68.5 81.1 66.6 14.2% 12.6%
Cyprus 2.1 1.5 43.2 82.6 77.0
Latvia 3.0 1.5 2.6 31.1% 8.3% 20.7 79.1 81.1 76.7 67.5% 58.6%
Lithuania 1.5 1.5 2.6 0.0% 0.0% 19.0 89.6 82.8 82.8 66.5% 54.4%
Luxembourg 1.5 1.5 5.4 0.0% 0.0% 75.3 85.9 86.2 86.0 42.2% 46.7%
Hungary 0.0 2.0 3.1 39.6% 3.5% 21.8 78.9 88.4 81.6 63.5% 57.5%
Malta 2.9 1.5 46.0 87.4 70.7
Netherlands 0.2 2.3 3.1 14.9% 76.2 73.8 80.6 76.0 40.1% 35.1%
Austria 0.0 1.5 2.6 0.0% 12.2% 73.3 85.2 85.9 86.3 21.5% 17.3%
Poland 2.8 2.3 2.8 38.1% 51.7% 23.0 71.3 82.2 78.7 93.0% 93.3%
Portugal 3.0 2.3 3.9 11.8% 5.4% 42.5 76.6 80.3 76.1 74.5% 66.2%
Romania 2.9 3.0 2.3 60.2% 13.4 68.2 85.9 76.8 85.8% 67.9%
Slovenia 3.6 2.3 3.8 12.1% 0.0% 44.4 80.1 85.0 82.6 72.8% 73.4%
Slovakia 0.0 1.5 3.1 17.6% 6.0% 29.9 79.4 81.9 80.1 63.7% 57.8%
Finland 1.7 1.5 4.4 0.0% 0.0% 57.8 80.3 83.2 83.7 28.6% 32.7%
Sweden 0.6 1.5 3.0 48.0% 33.5% 64.1 70.9 82.4 75.4 11.1% 10.0%
United Kingdom 0.0 1.5 0.3 52.6% 78.8 72.5 81.1 77.1 20.1% 11.9%
Note: Top five scores in green, bottom five scores in red, where relevant to provide ranking. In the case of the indicators of market share on non-incumbents, performances under 3 % % are highlighted. If not otherwise specified, data are derived from European Commission sources.

Table 2 – Infrastructure
Country
World Bank Logistic Performance Indicator
(2016)
World Economic Forum Quality of Infrastructure Index (2016-2017)
Density of motorway network (km)
Density of rail network (km)
Km of high
speed rail
lines (2016)
Total inland transport
infra-structure
investment -% of GDP
(2015)
Global LPI
Infrastructure component
Roads Railroad Seaports Air
transport
per 1 000 km2
(2015)
per 1 000 inhabitants
(2015)
per 1 000 km2
(2015)
per 1 000 inhabitants
(2015) Belgium 4.1 4.1 4.5 4.8 6.1 5.7 57.8 157.4 118.2 320.4 209 0.5%
Bulgaria 2.8 2.4 3.4 3.0 4.1 4.3 6.6 101.3 36.2 558.0 1.2%
Czech Republic 3.7 3.4 4.0 4.4 3.5 5.3 9.8 73.8 120.0 898.2 1.2%
Denmark 3.8 3.8 5.5 4.6 5.7 6.1 28.7 220.2 59.2 450.9
0.9%
Germany 4.2 4.4 5.5 5.5 5.5 5.8 36.4 160.9 108.7 478.3 1 475 0.6%
Estonia 3.4 3.2 4.7 4.1 5.6 5.1 3.3 111.7 33.4 1 149.8 1.5% 1
Ireland 3.8 3.8 4.6 3.7 5.1 5.4 13.0 198.9 26.9 409.4 0.2%
Greece 3.2 3.3 4.5 2.8 4.5 4.8 12.0 145.5 17.0 207.1 1.3% 2
Spain 3.7 3.7 5.5 5.5 5.5 5.8 30.3 329.7 31.7 345.7 2 938 0.6%
France 3.9 4.0 6.0 5.8 5.1 5.7 18.3 176.2 45.4 433.5 2 142 0.8%
Croatia 3.2 3.0 5.5 2.8 4.6 4.2 23.1 308.5 46.0 616.3 1.4% 2
Italy 3.8 3.8 4.5 4.1 4.4 4.6 23.0 114.2 56.6 280.3 981 0.6% 3
Cyprus 3.0 3.0 5.1
4.6 5.5 29.4 317.0
Latvia 3.3 3.2 3.0 4.2 5.1 5.2 28.8 936.0 1.7%
Lithuania 3.6 3.6 4.7 4.4 4.8 4.4 4.7 105.0 28.7 642.5 1.2%
Luxembourg 4.2 4.2 5.5 4.9 4.6 5.6 62.3 292.9 106.3 488.5 1.0%
Hungary 3.4 3.5 4.1 3.6 3.2 4.1 20.3 190.7 84.9 801.5 1.8%
Malta 3.1 2.9 3.2
5.3 5.7 0.5% 3
Netherlands 4.2 4.3 6.1 5.8 6.8 6.6 66.4 163.8 73.6 180.9 120 0.6% 1
Austria 4.1 4.1 6.0 5.3 3.9 5.2 20.5 202.1 58.9 575.1 48 0.6%
Poland 3.4 3.2 4.1 3.6 4.2 4.5 5.0 41.0 59.2 487.0 224 0.4% 3
Portugal 3.4 3.1 6.0 4.2 5.2 5.5 33.3 293.9 27.6 245.3 0.2% 2
Romania 3.0 2.9 2.7 2.6 3.5 4.0 3.1 37.4 45.2 542.3 2.1% 3
Slovenia 3.2 3.2 4.4 2.9 5.0 4.3 38.1 375.0 59.6 586.1 1.2%
Slovakia 3.3 3.2 4.0 4.4 3.0 3.5 9.4 85.5 73.9 668.8 2.3%
Finland 3.9 4.0 5.4 5.6 6.2 6.3 2.6 161.6 17.5 1 082.5 1.6%
Sweden 4.2 4.3 5.5 4.6 5.5 5.8 4.7 219.7 24.2 1 119.1 5.2%
United Kingdom
4.1 4.2 5.1 4.7 5.5 5.5 15.5 58.6 66.5 250.3 113 0.1%
1 2011; 2 2013; 3 2014
Note: Top five scores in green, bottom five scores in red, where relevant to provide ranking. If not otherwise specified, data are derived from European Commission sources.

Table 3 – Environmental and social dimension
Country
Hours spent in
road congestion annually (2015)
Share of renewable
energy sources in transport (2015)
CO2 emissions from new registered vehicles
(g/km) (2015)
Share of electrified
railway lines over total lines
in use (2015)
Road fatalities
per million inhabitants
(2016)
Environmental taxes on transport (fuel and
other taxes) (2015)
Plug-in electric
vehicle share in new
registrations of passenger cars (2016)
Charging points per 100 000
inhabitants in (peri-)urban areas (2017) Passenger
cars
Light-duty
vehicles
As % of GDP
as % of total
taxation
Belgium 36.1 3.8% 117.9 175.7 85.6% 56 1.8% 4.1 % 1.7% 27.5
Bulgaria 30.4 6.5% 130.3 143.9 71.1% 99 2.7% 9.4 % 0.1% 1.7
Czech Republic 23.4 6.5% 126.3 143.2 34.0% 58 1.8% 5.4 % 0.1% 21.2
Denmark 22.9 6.7% 106.2 149.8 24.3% 37 2.4% 5.2 % 0.6% 199.6
Germany 29.6 6.8% 128.4 182.6 52.4% 39 1.5% 3.9 % 0.7% 57.8
Estonia 20.6 0.4% 137.2 165.0 8.7% 54 2.1% 6.3 % 0.3% 67.3
Ireland 32.2 6.5% 114.3 168.5 2.7% 39 1.5% 6.4 % 0.5% 77.1
Greece 38.8 1.4% 106.4 186.4 23.4% 76 2.6% 7.2 % 0.1% 0.7
Spain 26.6 1.7% 115.3 154.4 63.6% 39 1.4% 4.0 % 0.3% 6.1
France 29.3 8.5% 111.0 154.4 55.5% 54 1.4% 3.1 % 1.5% 71.8
Croatia 26.0 3.5% 112.9 156.0 37.3% 73 3.1% 8.3 % 0.2% 29.3
Italy 35.4 6.4% 115.4 153.2 71.2% 54 2.1% 5.0 % 0.2% 7.7
Cyprus 2.5% 125.8 154.2 54 2.7% 8.3 % 0.3% 4.3
Latvia 21.8 3.9% 137.1 172.6 13.4% 80 2.3% 7.8 % 0.3% 7.1
Lithuania 21.5 4.6% 130.0 165.1 6.5% 66 1.7% 5.9 % 0.4% 3.2
Luxembourg 32.2 6.5% 127.5 168.9 95.3% 56 1.8% 4.8 % 0.6% 37.7
Hungary 27.3 6.2% 129.6 176.9 39.0% 62 2.2% 5.6 % 0.3% 12.1
Malta 76.0 4.7% 112.9 148.9 51 2.5% 7.4 % 0.1% 22.6
Netherlands 30.2 5.3% 101.2 163.2 75.7% 31 2.1% 5.6 % 6.0% 240.1
Austria 27.1 11.4% 123.7 178.3 71.2% 50 2.1% 4.7 % 1.5% 111.4
Poland 25.4 6.4% 129.3 175.2 63.6% 80 2.2% 6.7 % 0.1% 3.4
Portugal 27.7 7.4% 105.7 141.7 64.4% 54 2.2% 6.5 % 0.9% 26.8
Romania 32.1 5.5% 125.0 170.3 37.4% 97 1.9% 6.9 % 0.2% 4.2
Slovenia 26.9 2.2% 119.2 186.6 41.4% 63 3.0% 8.2 % 0.4% 56.7
Slovakia 22.9 8.5% 127.7 174.1 43.8% 51 1.6% 5.1 % 0.1% 70.7
Finland 19.9 22.0% 123.0 174.7 55.1% 47 2.1% 4.8 % 1.2% 57.9
Sweden 21.5 24.0% 126.3 163.0 75.5% 27 1.4% 3.3 % 3.6% 75.1
United Kingdom 41.5 4.4% 121.3 178.0 33.2% 28 2.0% 5.9 % 1.5% 27.1
Note: Top five scores in green, bottom five scores in red, where relevant to provide ranking. If not otherwise specified, data are derived from European Commission sources.

Statistical annex | 139
Indicators presented in the tables:
Table 1 – Access to market and market performance
OECD regulatory restriction indicators: The selected indicators are the OECD indicators of regulation in energy, transport and communications (ETCR). They summarise regulatory provisions in air passenger transport and road freight transport (2013). The index scale ranges from 0 – least restrictive to 6 – most restrictive. The data are collected every 5 years.
Market share of all but the principal undertakings: The total market share of all but the principal railway undertakings, for both freight and passenger transport (2015, source: European Commission - DG MOVE) can be considered an indicator of the level of competition in the rail sector. Not applicable to Cyprus and Malta.
Labour productivity: Apparent labour productivity – gross value added per person employed in the transportation and storage sector (NACE rev. 2 section H) (data for 2015; source: Eurostat).
Performance of the passenger transport markets: The selected indicator is the "market performance indicator" (MPI). It indicates a country's rank among the other countries for a specific market in 2015, as perceived by users, related to train, airline and the local public transport services. MPI is a composite index reflecting five main aspects of consumer experience: (1) the ease of comparing offers, (2) consumer trust in retailers/providers to comply with consumer protection rules, (3) the experience of problems and the degree of detriment suffered, (4) overall consumer satisfaction and (5) choice of offers available (Source: European Commission).
Share of home-based vehicles in tonne-km generated in exports to and imports from other EU28 countries: This indicator measures the relative competitiveness of a country's road haulage sector in the EU via the share of vehicles registered in the reporting country in total tonne-km generated when goods were exported from or imported to that country by road to/from another EU country (2016, source: Eurostat).
Table 2 – Infrastructure
Logistics performance index: The selected indicator is the World Bank’s logistics performance index (World Bank, 2016). LPI ranks countries on six dimensions of trade - including customs performance, infrastructure quality, and timeliness of shipments. The data used in the ranking comes from a survey of logistics professionals. They are asked questions about the foreign countries in which they operate.
Quality of infrastructure: The selected indicators are the indices of satisfaction with respect to road, rail, seaports (for landlocked countries' accessibility to seaport facilities) and air transport infrastructure quality. They are part of the World Economic Forum Global Competitiveness Report 2017-2018 (1 = extremely underdeveloped/ among the worst in the world; 7 = extensive and efficient/ among the best in the world; weighted average; period covered 2016-2017). Based on the Executive Opinion Survey.
Density of the motorway network: Per 1000 km² of territory and per 1000 inhabitants (2015, source: European Commission).
Density of the railway network: Per 1000 km² of territory and per 1000 inhabitants (2015, source: European Commission).
Km of high-speed rail lines: For EU countries with high speed rail infrastructure, the length of lines, but not a ranking, has been provided (2016, source: European Commission).
Total inland transport infrastructure investment: Investment and maintenance spending on transport infrastructures (road, rail, sea ports and airports) as % of GDP (2015, source: OECD). It should be underlined that data for this indicator are not completely harmonised. Different categories of investments and maintenance could be included depending on the country. The coverage is partial for some countries. The data are collected on a voluntary basis. Furthermore, high values are not necessarily associated with a positive performance and would have to be compared to the actual investment needs (e.g. in the case of "catching-up" countries).

140 | Transport in the EU: Current Trends and Issues
Table 3 – Environmental and social dimension
Congestion: Average annual hours spent in congestion per vehicle (2015, source: JRC based on TomTom data).
Deployment of clean transport technologies: The selected indicators are the share of Renewable Energy Sources (RES) in transport (2015, source: Eurostat).
CO2 emissions from new passenger cars: Gram of CO2/km (2015, source: EEA).
CO2 emissions from new vans: Gram of CO2/km (2015, source: EEA).
Share of electrified railway lines over total lines in use: 2015, source: European Commission.
Road safety: The number of road fatalities per million inhabitants (2016, source: European Commission – CARE database).
Transport taxation: Revenues from environmental taxes on transport (fuel and other taxes) as % of GDP and total taxation revenues (2015, source: European Commission).
PEV market share in new passenger car registrations: Plug-in electric vehicles (PHEV+BEV), M1 category of vehicles (2016, source: European Alternative Fuels Observatory).
Charging points per 100 000 inhabitants in (peri-)urban areas: Total number of electric vehicle charging points divided by the population in urban areas and/or peri-urban areas. It is assumed that most of the charging points are installed in urban areas. (2017, source: European Alternative Fuels Observatory).