Mobiles share of the mix marketing evolution
18
MXS: Mobile’s X% Solution A Marketing Evolution Whitepaper August 2012
-
Upload
actionvn -
Category
Technology
-
view
757 -
download
2
description
Transcript of Mobiles share of the mix marketing evolution

MXS: Mobile’s X% Solution
A Marketing Evolution Whitepaper
August 2012

MXS: Mobile’s X% Solution, A Marketing Evolution Whitepaper
August 2012 1
Executive Summary: Marketers currently allocate less than one percent of their marketing budget to Mobile advertising. However, based on sophisticated return on investment (ROI) analysis of Mobile, the optimized level of spend in Mobile advertising for U.S. marketers is seven percent, on average. Over the next 4 years, Mobile’s share of the media mix is projected to increase to over 10 percent based on growth in adoption of smartphones only. It is safe to say, however, that the growth does not stop there. As with all new media, more effective targeting, creative excellence, better ad units, tighter industry standards, innovation in technology and other factors will all contribute to increased spend and the further establishment of mobile in a marketer’s mix. The following MXS white paper will present findings that support this conclusion based on a scientific ROI analysis vs. the simpler “share of time (should) equal share of budget” proxy that is often offered in lieu of ROI optimization. Marketing Evolution’s recommended mix is based on the best available empirical data and proven ROI measurement. The analysis demonstrates how combining datasets on ad impact and cost, in the context of reach and frequency provides a powerful framework for predicting ROI, and rebalancing the media mix to optimize marketing impact. Additionally the data suggests that the range marketers should spend on Mobile varies based on the marketing goal and industry category. Regardless of these variances, it’s clear that marketers are spending significantly less than they should in Mobile and by settling for a sub-optimal media mix are losing out on sales and profits. Consumer media habits are rapidly changing – the penetration of mobile smartphones has skyrocketed and it is clear that Mobile has proven to be effective in successfully achieving a variety of marketing goals. Even though these facts are indisputable, marketers have been slow to adjust and rebalance their media mix to reflect consumers’ mobile-centric world. In fact, it is appropriate to assert at this time that most marketers should significantly increase their investment in Mobile advertising. While this may be a bold statement, it is a statement based on science and mathematics; it is rooted in what we quantitatively know about all media’s impact as well as Mobile’s impact and penetration to date. Based on this information, Mobile advertising (display, video, audio) should be at least an $11 billion dollar market1 in the U.S. and higher globally assuming similar dynamics exist worldwide.
1 Based on Zenith estimates of total measured media in the U.S. of $171 billion. http://www.zenithoptimedia.com/zenith/global-advertising-growth-continues-as-latin-america-and-asia-pacific-compensate-for-weakening-europe/ The 7 percent solution was developed to assist advertisers and was not developed to calculate a resulting total Mobile industry display revenues. Knowing the comparison will be made, here is a following perspective on this industry analysis: If applied to just major media spend of $171billion in the U.S. for 2012, then total Mobile spend if all marketers average to an optimized level of 7 percent, would suggest Mobile display spend to $11.2 billion annually currently. That is about the same amount of display/sponsorship spend reported in internet media in 2011. As smartphone penetration increases over time and other factors (increased mobile marketing effectiveness, etc.), then very likely the industry grows beyond that level. It should be noted that the 7 percent does not include all mobile marketing options. It does not include SMS Customer Loyalty/CRM, Mobile Search, Mobile Couponing, Branded Apps (Owned Mobile Media). As a very rough approximation, one could apply the 7
MXS: Mobile’s X% Solution, A Marketing Evolution Whitepaper
August 2012 2
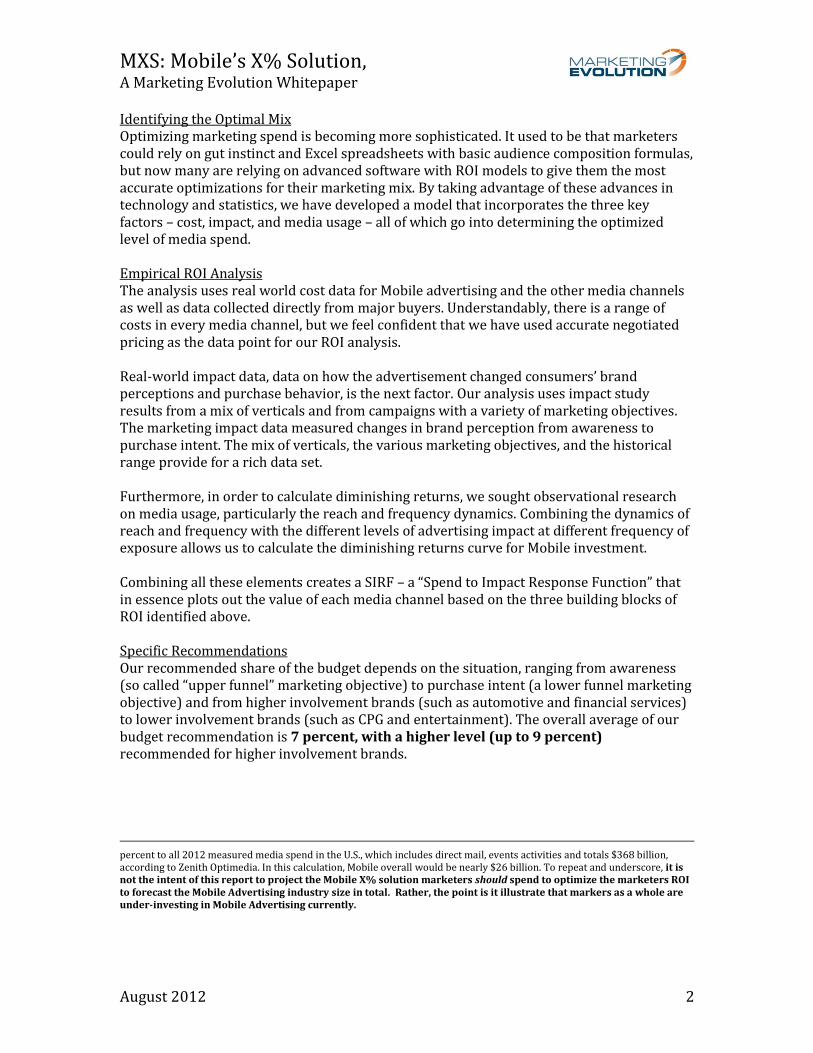
Identifying the Optimal Mix Optimizing marketing spend is becoming more sophisticated. It used to be that marketers could rely on gut instinct and Excel spreadsheets with basic audience composition formulas, but now many are relying on advanced software with ROI models to give them the most accurate optimizations for their marketing mix. By taking advantage of these advances in technology and statistics, we have developed a model that incorporates the three key factors – cost, impact, and media usage – all of which go into determining the optimized level of media spend. Empirical ROI Analysis The analysis uses real world cost data for Mobile advertising and the other media channels as well as data collected directly from major buyers. Understandably, there is a range of costs in every media channel, but we feel confident that we have used accurate negotiated pricing as the data point for our ROI analysis. Real-world impact data, data on how the advertisement changed consumers’ brand perceptions and purchase behavior, is the next factor. Our analysis uses impact study results from a mix of verticals and from campaigns with a variety of marketing objectives. The marketing impact data measured changes in brand perception from awareness to purchase intent. The mix of verticals, the various marketing objectives, and the historical range provide for a rich data set. Furthermore, in order to calculate diminishing returns, we sought observational research on media usage, particularly the reach and frequency dynamics. Combining the dynamics of reach and frequency with the different levels of advertising impact at different frequency of exposure allows us to calculate the diminishing returns curve for Mobile investment. Combining all these elements creates a SIRF – a “Spend to Impact Response Function” that in essence plots out the value of each media channel based on the three building blocks of ROI identified above. Specific Recommendations Our recommended share of the budget depends on the situation, ranging from awareness (so called “upper funnel” marketing objective) to purchase intent (a lower funnel marketing objective) and from higher involvement brands (such as automotive and financial services) to lower involvement brands (such as CPG and entertainment). The overall average of our budget recommendation is 7 percent, with a higher level (up to 9 percent) recommended for higher involvement brands.
percent to all 2012 measured media spend in the U.S., which includes direct mail, events activities and totals $368 billion, according to Zenith Optimedia. In this calculation, Mobile overall would be nearly $26 billion. To repeat and underscore, it is not the intent of this report to project the Mobile X% solution marketers should spend to optimize the marketers ROI to forecast the Mobile Advertising industry size in total. Rather, the point is it illustrate that markers as a whole are under-investing in Mobile Advertising currently.

MXS: Mobile’s X% Solution, A Marketing Evolution Whitepaper
August 2012 3
The range varies in the model based on the following variables:
The industry vertical (e.g., automotive behaves differently than CPG). The marketing objective (e.g., Mobile has a different impact on awareness than on
purchase intent). The profile of the people the marketer hopes to reach. The marketer’s budget and scope of the budget. (Our recommendation is based on a
typical budget level observed in each vertical, and includes the following media in the mix: TV, magazine, newspaper, radio, cinema, web display and social media).
As with any model, as more data is gathered and available, the recommendations will change over time. Finishing out 2012 and going into 2013, marketers and agencies need to look closely at how they are allocating against Mobile based on these findings. This project was supported by the Mobile Marketing Association (MMA) and interested parties from all facets of the marketing business that were invited to participate in the analytic process, and to review data and recommendations. These parties include marketers (Johnson & Johnson, Coca Cola Company, Adidas, Procter & Gamble, Colgate), agencies (Joule, The Integer Group, Ansible Mobile, The HyperFactory, MindShare World, Ogilvy, Havas Digital, Crispin Porter + Bogusky, Leapfrog Online, Harte Hanks, Mobext, MEC), research and measurement/data provider (InsightExpress), media owners (Turner, The Weather Channel, Millennial Media), and media planning software industry leader (Telmar). While these parties had an opportunity to review the data and recommendations, these recommendations are Marketing Evolution’s.

MXS: Mobile’s X% Solution, A Marketing Evolution Whitepaper
August 2012 4
Full Report: Perspective Page 4 Methodology Review: Calculating Media Mix Page 7 Findings Page 11 About Marketing Evolution, Telmar & MMA Page 16
PERSPECTIVE
The Mobile revolution did not happen overnight. We caught our first hint of the possibilities when we measured advertising effectiveness on the Palm Pilot in 2003, as part of Marketing Evolution’s widely published Cross Media Research. The screens were black and white, and low resolution by today’s comparisons, and the population using the pre-cursor to the smartphone was very small. Nonetheless, we analyzed the impact with a carefully designed exposed and control measurement and could see potential. A few years later, when we worked with Motorola to measure the ROI of their advertising programs, we marveled at how the RAZR became the hottest technology, selling 50 million devices in two short years. We saw first hand consumers’ appetite for Mobile devices when Marketing Evolution conducted the ROI analysis to determine the optimal media mix for Motorola SLVR in 2006. We then watched the subsequent rocket ship take off of the Apple iPhone launched mid 2007. And then came Android. Then the game changing iPad. These devices substantially expanded the population that can be reached by advertising. These devices deliver an amazing user experience with crisp full color displays, and processers capable of animating ads and even delivering video – ideal for advertising. We watched as consumers took their first hesitant steps in Mobile, experimenting with text messaging. Now teenagers send over 3000 texts a month, on average.2 We made note as devices grew more advanced, networks offered faster connections, and new things called apps shifted the value from voice calls to access and information. Through this all, the marketing innovators have been experimenting, testing, and learning how to connect with consumers in this new medium. Brands, agencies, and start-ups have pushed the envelope and celebrated as they blazed new trails in connecting with consumers. The only thing more amazing than how far we’ve come is how much further still the Mobile space will grow. We are now past the point of experimentation. A critical mass of quantitative experiments has produced data and insights that can be applied to a wide range of marketers. Now it’s the time to roll-up sleeves and build Mobile into an integrated marketing strategy. In 2012, marketers will spend $2.6 billion on Mobile advertising in the United States, and $6.5 billion
2 http://mashable.com/2010/10/14/nielsen-texting-stats/

MXS: Mobile’s X% Solution, A Marketing Evolution Whitepaper
August 2012 5
globally, according to eMarketer estimates. An already sizable spend but, this is just the beginning. Consider the following statistics:3
14% of the global population uses a smartphone in 2012; in the United States, 37%
By 2016, those numbers will be 59% in the U.S. and 30% worldwide
Mobile usage is the only media that has continually increased in time spent since
2008, almost doubling in time spent by 2011.
As…
1. marketers become aware of Mobile advertising ROI, and 2. media consumption patterns continue to shift toward Mobile, and 3. reach increases through the proliferation of smartphones and tablet devices (e.g.,
iPad, Kindle), …marketers will rely more heavily on Mobile as part of their campaign mix.
We already see companies shifting their business models to take advantage of Mobile. Many are offering innovative new content and experiences and other enticements to encourage audiences to engage. Companies are staking their claim in the Mobile landscape. If you are in doubt, consider the degree to which major media companies, like Facebook, Pandora, and The Weather Channel are identifying themselves as “Mobile First” companies today. Despite the possibilities, some skeptics have asked about the size of the Mobile screen and thus the impact of current ad formats. Too often, advertising people try to superimpose their own perceived reaction to advertising and may under-estimate its impact. These concerns echo the early days of online display advertising, and they can really only be answered with quantitative research to precisely measure the actual impact on consumers’ brand favorability and purchase behaviors. We’ve amassed enough of this research to draw conclusions – and it shows that Mobile can be effective in building awareness and purchase intent. The next logical question is, “What share of my marketing budget should I devote to Mobile advertising?” We address these questions using patented methodologies - first developed in the early 2000s and now perfected and adopted by hundreds of marketers covering thousands of studies measuring billions in advertising spending. This research has the proven ability to synthesize the existing data from a variety of sources to give marketers data-driven budget recommendations. This puts a stake in the ground in recommending the Mobile advertising investment level for marketers. As discussed in this paper, this Mobile mix recommendation is based on ROI data. Integrated here is the impact on a variety of metrics from brand awareness to purchase intent. This data is combined with media costs and reach and frequency distributions to calculate the budget recommendation that optimizes ROI.
3 eMarketer, 2012

MXS: Mobile’s X% Solution, A Marketing Evolution Whitepaper
August 2012 6
Bear in mind that not all marketers today use such a rigorous way to build a media mix. Some rely simply on updating last year’s plan, or go with a feeling about what media options fit with a message style, or are perceived as more valuable (the proverbial “I know it in my gut’ approach). The reason that John Wannamaker’s infamous quote (“I know half my advertising is wasted, trouble is I’m not sure which half”) persists is because many marketers lack the data and software to optimize media plans based on maximizing ROI. The analysis here embraces the tenets of “Impact Based Planning,” and uses software to get an objective benchmark of optimized industry mix. This provides a recommendation based on multiple synthesized data sources – an approach that is increasingly becoming the way savvy marketers’ approach budget allocation. Using a combination of statistical analysis and the deep experience of building models, Marketing Evolution’s results provide a never before seen insight into Mobile’s role in the marketing mix. Obviously, each marketer and each campaign is unique. Our meta-data establishes a benchmark for planning future budgets. But benchmarks are only a reference point. Nonetheless, media agencies and marketers that plan their marketing budget allocations with Impact Based Planning benchmarks and optimization software are consistently better off than those that build plans without spend-to-impact response functions (SIRFs). The tenets of Impact-Based Planning are:
1. No matter how ‘cool’ a medium is (or how good a fit it is for a brand), there is a point where the price is too high and the marketer is better off buying something else.
2. No matter how good the initial ROI is, there is a point of diminishing returns where it no longer makes sense to keep spending on a medium.
3. Impact Based Planning is not Reach/Frequency planning. Optimizing impact comes from examining how much impact per dollar spent each medium produces. This ROI optimization approach recognizes that not all impressions are of equal value in achieving a marketer’s goals, and allows the marketer to arrange the highest value media mix.
4. Because different media produce impact differently for different marketing objectives (i.e. awareness vs. purchase intent), the art of Impact Based Planning is in selecting the right marketing objective to match the business need.

MXS: Mobile’s X% Solution, A Marketing Evolution Whitepaper
August 2012 7
METHODOLOGY REVIEW: CALCULATING MEDIA MIX Over the past several years, Marketing Evolution has amassed a ROI database covering billions of dollars worth of marketing spending and developed software to integrate ROI data from a variety of sources. This allows us to offer integrated cross media marketing mix recommendations based on empirical data. At the heart of these recommendations are Spend to Impact Response Functions (SIRFs) for each media channel. With this analysis, we are adding Mobile advertising to our media planning database and software. How Does One Quantify The ROI Of Mobile Advertising? To answer this question, let’s recap how advertising creates value for marketers. As people use their Mobile devices, they have the opportunity to be exposed to ad messages. Those ad exposures are commonly quantified by ad servers delivering the ads, or by using reach and frequency analysis from research firms that track the usage of Mobile devices through a panel-based data set. But impressions, even when reported as reach and frequency distribution only indicate the opportunity to influence people based on exposure. What a marketer needs to know to calculate ROI is the impact of each exposure relative to the cost. The impact of the ad exposure can be quantified using well-designed advertising impact studies that measure the effectiveness in changing brand attitudes and purchase behavior. A growing database of these studies is available, and used in this analysis. Cost can be observed directly by examining the real-world negotiated price paid and delivered. For all media, we examined media cost and did not include creative production costs.

MXS: Mobile’s X% Solution, A Marketing Evolution Whitepaper
August 2012 8
Sidebar: Key Inputs to the ROI Model Since SIRFs are the building blocks to achieve the vision of ROI management, it is important to understand the raw materials of a SIRF. Behind the SIRF equation are people—people like you and me—who use media, buy stuff, and occasionally take a survey. Research has shown that marketers can’t simply ask customers why they bought a particular item and expect to get an accurate answer. Our brains simply don’t analyze the complex array of media and other factors that subtly influence our decisions. In fact, most people like to believe they are immune to advertising. But if instead of asking customers why they buy, we design experiments with different levels of advertising, we can observe what truly influences customers. Marketing Evolution uses data, particularly from exposed/control analysis, to understand what causes purchase, or changes brand perceptions. For the most part, one customer’s individual data isn’t enough to draw any conclusions. We need lots of people so we can compare and contrast to find patterns between marketing spending and impact. The key inputs that define the relationship between spend and impact are as follows:
1. Impact Lift: The observed way in which a marketing activity changes consumers’ attitudes or behaviors (shown here as a percent lift curve at each frequency of exposure compared to a control group).
2. Reach/Frequency: The exposure pattern of the media, specifically the way in which frequency builds (shown here as a reach and frequency curve).
3. Cost: The price of the media exposure. These three factors come together to produce a SIRF. The SIRF shows the total impact a marketer can expect at each dollar level of spending. This can be analyzed to find the optimal media mix (see chart 1).

MXS: Mobile’s X% Solution, A Marketing Evolution Whitepaper
August 2012 9
When the Mobile SIRF is combined with SIRFs for other media (as in the chart below for purchase intent in the automotive category, with Mobile shown as a dotted line), optimization calculus can be applied to generate the optimal media mix recommendation. That is, the recommendation that produces the greatest impact for the budget is calculated. The impact of Mobile will vary by industry, marketing objective and target audience. Since the SIRFs for all media have a curved shape with diminishing returns, the recommendation of share of mix will also depend on the total budget size.
This approach of marketing spend allocation supports zero-based budgeting, because the analysis starts with all media at zero budget, and then allocates each dollar according to what optimizes ROI. The recommendations can also be modified based on pre-existing commitments – in which case the software calculates the impact of the pre-existing mix items, and optimizes the remaining budget accordingly.
Methodology Caveats: Through this effort, we have brought together the best data available to shed light on Mobile ROI. As with any ROI model, it comes with a series of caveats based on the data used. 1. Impact Measurement: The impact of exposure to Mobile advertising has been measured using a modified control/exposed methodology where possible. The modification occurred because of the Mobile device limitations in cookie acceptance and the related limitations in ad server capabilities compared to online. In order to maintain as close a comparison to digital and traditional media, we only used impact data that employed a standard control/exposed methodology. We were also careful to factor in decay rates when impact was measured immediately after exposure.

MXS: Mobile’s X% Solution, A Marketing Evolution Whitepaper
August 2012 10
2. Media Synergy: Not included in this analysis are ways in which media may work synergistically. This research was designed to measure Mobile marketing’s incremental impact above and beyond other media in the mix, but there may be clear ways to create synergy among media with Mobile that we did not observe. We hope to address Mobile marketing synergy in future research and budget recommendations. 3. Reach & Frequency: Available reach and frequency data pass logic checks. The data sources however, are relatively new and have not been audited to the same degree as reach and frequency data in other media. In particular, footing the reach and frequency to a day, week or month (or a period of time matching a campaign) is not easy. 4. Cost: Cost data is collected from actual campaign spending from a variety of sources. However, there is a wide range in pricing for the same types of advertising. In this case, we’ve conducted this analysis based on the average impact data and the average cost data. It may be the case that some inventory is worth more than others but this cannot be known with any certainty until the impact data is gathered and matched to the exact same cost source data. For consistency with other ROI data in our database, the cost data only applies to the media spend and does not account for any creative development costs. 5. Analysis Focuses on Mobile Advertising: This analysis focuses on advertising delivered in the most common Mobile formats such as: web browsing, video, apps, audio, games, and social media. The following Mobile marketing programs are not included in this analysis, although the same ROI model could be applied to them at a future date, based on industry interest: SMS Customer Loyalty/CRM, Mobile Search, Mobile Couponing, Branded Apps (Owned Mobile Media). Unfortunately, reliable industry sources of data for lift benchmarks or audience reach and frequency for these types of Mobile campaigns are not available at this time.

MXS: Mobile’s X% Solution, A Marketing Evolution Whitepaper
August 2012 11
FINDINGS: Marketers are losing out on influencing millions of customers – this is the conclusion from Marketing Evolution’s analysis of the ROI of Mobile relative to other media choices. 1. As a guideline based on current ROI and smartphone penetration, Marketing
Evolution recommends 7 percent of the media mix, on average, should be invested in Mobile advertising.
Our data shows that the exact recommended share of the budget should be higher for marketers selling higher involvement products, such as automobiles and financial services – approximately 9 percent, and a bit lower for brands selling lower involvement products, such as fast moving consumer packaged goods. Moreover, the analysis shows that marketers focused on objectives such as influencing purchase intent (a lower funnel marketing objective) should invest more than average – approximately 8 percent. Those focused on so called upper funnel metrics such as awareness should invest a little less than average – around 5 percent. The chart below summarizes the share of media mix recommendation based on analysis of over 40 budget scenarios across a range of industries and marketing objectives.
The range varies in the model based on the following variables:
Industry vertical (automotive behaves differently than fast moving consumer packaged goods).
The marketing objective (Mobile has a different impact on awareness than on purchase intent).

MXS: Mobile’s X% Solution, A Marketing Evolution Whitepaper
August 2012 12
The profile of the people the marketer hopes to reach. Marketer’s budget and scope of the budget (this recommendation is based on a
media mix including TV, magazine, newspaper, radio, cinema, web display and social media).
Expressed as a total dollar figure, the 7 percent recommendation for the U.S. implies an $11 billion Mobile advertising industry in the U.S. alone, if all marketers sought to maximize their ROI. 2. Marketers are leaving profits on the table by under-investing in Mobile
Marketers currently devote less than one percent of their budget to Mobile advertising. Marketing Evolution recommends that, on average, most major marketers should be devoting 7 percent to Mobile advertising in 2012 and 2013. The point of budget allocation is to optimize the marketing mix to squeeze the most impact out of each dollar invested. Many marketers suspected that changing consumer’s habits would mean that more marketing budget should go to Mobile – but this research goes further by looking at the actual impact achieved per dollar invested. Increasing Mobile investment to the levels recommended will produce better business results for the same budget.
According to our analysis, a $50 million Automotive ad campaign for a new car launch that reallocated investment to Mobile would make 2.4 percent more people aware of the new car and would create purchase intention for an additional 3.4 percent compared to a $50 million investment in campaign mix that that did not include Mobile. For CPG Food, a $10 million campaign for a growing product, roughly 70,000 more people would intend to purchase the product in a campaign mix using Mobile than one without it. In other words, optimizing Mobile’s role in the mix delivers better results for the exact same budget.

MXS: Mobile’s X% Solution, A Marketing Evolution Whitepaper
August 2012 13
3. Marketers should increase their investment in Mobile to approximately 10 percent over the next four years. As smartphone penetration increases over the next several years, the reach and frequency of the Mobile advertising platform will continue to grow. eMarketer forecasts that total usage of smartphones will extend from 37 percent in 2012 to 59 percent in 2016. Using the eMarketer forecast to adjust the shape of the reach/frequency curve, Marketing Evolution estimates that the media budget allocation to Mobile advertising will increase over the next four years, shifting from 7 percent to 10 percent by 2016, assuming all other media remain similar in reach/frequency/cost and impact. If all marketers budgeted to maximize their advertising ROI, this would imply the advertising portion of the mobile industry would be about $17 billion by 2016. The total mobile marketing industry could be well in excess of this level when one considers non-advertising aspects of Mobile such as direct to consumer Apps, etc.
Optimized Budget Allocation: Recommended Mobile Share of the Media Mix for 2012,
And Projection For 2013-2016 Based On Estimated Increase In Smart Phone Usage
Can These Results Be Applied Globally? Marketing Evolution conducts marketing ROI analysis in over twenty countries, spanning mature markets of Western Europe, to developing countries including Brazil, China and Russia. The software and models have been built to recommend media mix by country, provided country level cost, impact and reach/frequency can be provided. While we have measured Mobile in different geographies around the globe, we do not have a sufficient number of studies to generate country-by-country Mobile mix recommendations. The recommendations in this paper are based on U.S. data and therefore should not be applied on a global scale.

MXS: Mobile’s X% Solution, A Marketing Evolution Whitepaper
August 2012 14
But here is a thought exercise to consider for global markets: What if impact and cost were similar around the globe? If this were the case, then the penetration of smartphones, or phones with media and ad format capabilities would change the reach and frequency dynamics and alter the recommended mix. In a country like Singapore, where smartphone penetration is reportedly 75 to 80 percent, if other dynamics of cost and impact are similar to the US data then a more appropriate mix would be in excess of 10 percent for Mobile. In a country like Brazil, where smartphones are less than 20 percent, the optimized mix might be closer to 5 percent. Here’s another thought exercise: What if cost per impact were different in different countries? Consider a country with heavy text messaging media – because text messaging is highly targeted and often immediately read with active attention, the impact produced may be greater than display advertisements. If the cost per impact of the text message is less than the average cost per impact of Mobile ad units (not including text messaging) then we might find a higher recommended share of the mix for Mobile. What if the dynamics of other media are different? If TV is priced differently, if Mobile or any channel’s impact is better, then the recommended mix will adjust according to the impact, price and diminishing return dynamic. In the absence of data, Marketers should work through their experience and assumptions carefully. Having an empirical ROI database is the best way to manage the complexity inherent in our increasingly fragmented media landscape. The point of the thought exercises is to bridge the gap in data with thoughtful consideration of the dynamics of ROI in any given country. While a marketer may recognize that the better approach to media budget planning is to use ROI data – one has to start somewhere. Getting the data may begin with a marketer identifying opportunities for investment, followed with careful measurement to populate the SIRF database. The idea is to quickly move from thought exercises and hypothesis to real-world data on a country specific level. As the empirical data mounts, recommendations based on a critical mass of ROI measurement and extensive analysis can be performed (as we have done for the U.S.). The net takeaway when considering a global perspective is that the methodology used to recommend Mobile’s role in the mix can be extended globally. Data from multiple ROI measurement firms can be integrated, provided the quality of data collection and the exposed/control method is rigorously applied. Marketing Evolution is working to amass data for each country they work in. We encourage further research to identify the optimal mix on a country-by-country basis, and collaboration to combine ROI databases to achieve critical mass, and enable an answer to “What is Mobile’s role in the mix” sooner. Conclusions: This white paper was developed to put a stake in the ground in terms marketing investment that should go toward Mobile advertising, based on ROI analysis. We hope to spark a serious dialogue across the industry and to advocate for further research. We hope to encourage greater collaboration so that we can integrate more data into SIRF databases to enable Impact Based Planning globally.

MXS: Mobile’s X% Solution, A Marketing Evolution Whitepaper
August 2012 15
What we believe to be true today is that marketers must revisit the way they are allocating their budgets to Mobile and should very quickly:
1. Allocate approximately 7 percent of media budgets per campaign to Mobile. 2. Do more best in class research to really understand the value of Mobile and the
opportunity inherent in capturing a competitive advantage. 3. Examine media synergy in research. For example, consider flighting Mobile
campaigns to reinforce the awareness message when other media (TV, print, etc.) hit their points of diminishing returns. Examine the value of consistent messaging look and feel across media. In other words, expand the understanding of Mobile’s synergy with the rest of the mix.
Marketers should feel confident that Mobile advertising has demonstrated a significant impact on consumers and justifies a larger media budget allocation than current industry practice. With the rapid evolution of Mobile advertising, devices, and consumer behaviors, this allocation percentage may shift, but is unlikely to decrease. Marketers that take these recommendations to heart will reap the benefits of the increased ROI. As marketers begin to dig deeper into reallocating their budgets, here are some further discussions points to consider:
1. How do I prioritize which Mobile media I purchase with my increased budget? 2. What metrics and measurements do I need to have in place to understand the
impact on the ROI that Mobile provides? 3. How do I go about identifying where my customers are spending time on Mobile? 4. What are the best practices for Mobile creative? How can A/B split tests help me
further maximize my ROI? 5. How do I conduct a cross media study to discover the synergistic role of Mobile in
the media mix?

MXS: Mobile’s X% Solution, A Marketing Evolution Whitepaper
August 2012 16
For more information, contact the white paper author: Rex Briggs, CEO & Founder Marketing Evolution +1 916 933 7536 [email protected] About Marketing Evolution: Marketing Evolution originated cross-media research a decade ago in an effort to determine the share of the mix digital advertising should receive. Since then, Marketing Evolution has served CMOs of leading companies to measure the effectiveness of their marketing campaigns and to help optimize their marketing and media mixes. Marketing Evolution specializes in integrating marketer’s ROI data into SIRF models for budget planning, and conducting original research to quantify marketing ROI. Marketing Evolution has been at the forefront of measuring digital display, search, and social media, as well as traditional media such as television, magazine, radio, and so on. Marketing Evolution’s methodology has been praised as the “gold standard” by an independent review by the ARF and called “best practice” by ESOMAR’s independent panel of academics and research industry experts that reviewed over 10,000 papers over the past decade. Marketing Evolution’s cross media method was one of only 30 best practices in all of marketing research to receive the prestigious honor and inclusion in the Best Practices book published by Wiley & Sons. Over the past several years, Marketing Evolution has amassed an ROI database covering billions of dollars worth of marketing spending and developed software to integrate ROI data from a variety of sources. This allows Marketing Evolution to offer integrated cross media marketing mix recommendations based on empirical data. Given Marketing Evolution’s tradition of ROI measurement and marketing mix modeling, the Mobile Marketing Association contracted Marketing Evolution to accelerate publishing a Mobile advertising budget guideline culled from the best available data to recommend what the share of the marketing mix should go to Mobile. About Telmar: Telmar is a world-wide leading supplier of media advertising software and services used for reach, frequency and optimization. Telmar’s 10,000 users across 85 countries include many of the world’s leading advertising agencies, digital and print publishers, broadcasters and advertisers. Telmar’s partnership with Marketing Evolution allows Telmar to offer media planning optimization based on Marketing Evolution’s ROI database. A full version with complete access to cross-media broken out by media type, including Mobile, Television, Social Media, Search, Magazine, Radio, non-mobile digital display, etc., is available as Telmar Media ROI (TMR). Marketers should contact Marketing Evolution [email protected] and advertising agencies and media owners should contact Telmar. Contact: [email protected] or Tel: +1 212 725-3000

MXS: Mobile’s X% Solution, A Marketing Evolution Whitepaper
August 2012 17
About MMA: The MMA is the premier global non-profit trade association established to lead the growth of Mobile marketing and its associated technologies. The MMA is an action-oriented organization designed to clear obstacles to market development, establish Mobile media guidelines and best practices for sustainable growth and preserving privacy, and evangelize the use of the Mobile channel. MMA includes more than 700 member companies, representing nearly 50 countries across the Mobile marketing industry including hardware providers, marketers, software developers and more. MMA global headquarters are located in the U.S., with regional chapters in North America, Europe, Latin America and Asia Pacific. For more information, please visit www.mmaglobal.com.