Mobile Scientists and International NetworksMobile Scientists and International Networks Giuseppe...
33
NBER WORKING PAPER SERIES MOBILE SCIENTISTS AND INTERNATIONAL NETWORKS Giuseppe Scellato Chiara Franzoni Paula Stephan Working Paper 18613 http://www.nber.org/papers/w18613 NATIONAL BUREAU OF ECONOMIC RESEARCH 1050 Massachusetts Avenue Cambridge, MA 02138 December 2012 The authors acknowledge support from Regione Piemonte for the GlobSci project and from the IPE Program, National Bureau of Economic Research. Stephan acknowledges support from the European Commission (FP7) Project "An Observatorium for Science in Society Based in Social Models - SISOB" Contract no. FP7 266588 and Collegio Carlo Alberto Project "Researcher Mobility and Scientific Performance." The views expressed herein are those of the authors and do not necessarily reflect the views of the National Bureau of Economic Research. NBER working papers are circulated for discussion and comment purposes. They have not been peer- reviewed or been subject to the review by the NBER Board of Directors that accompanies official NBER publications. © 2012 by Giuseppe Scellato, Chiara Franzoni, and Paula Stephan. All rights reserved. Short sections of text, not to exceed two paragraphs, may be quoted without explicit permission provided that full credit, including © notice, is given to the source.
Transcript of Mobile Scientists and International NetworksMobile Scientists and International Networks Giuseppe...

NBER WORKING PAPER SERIES
MOBILE SCIENTISTS AND INTERNATIONAL NETWORKS
Giuseppe ScellatoChiara FranzoniPaula Stephan
Working Paper 18613http://www.nber.org/papers/w18613
NATIONAL BUREAU OF ECONOMIC RESEARCH1050 Massachusetts Avenue
Cambridge, MA 02138December 2012
The authors acknowledge support from Regione Piemonte for the GlobSci project and from the IPEProgram, National Bureau of Economic Research. Stephan acknowledges support from the EuropeanCommission (FP7) Project "An Observatorium for Science in Society Based in Social Models - SISOB"Contract no. FP7 266588 and Collegio Carlo Alberto Project "Researcher Mobility and Scientific Performance."The views expressed herein are those of the authors and do not necessarily reflect the views of theNational Bureau of Economic Research.
NBER working papers are circulated for discussion and comment purposes. They have not been peer-reviewed or been subject to the review by the NBER Board of Directors that accompanies officialNBER publications.
© 2012 by Giuseppe Scellato, Chiara Franzoni, and Paula Stephan. All rights reserved. Short sectionsof text, not to exceed two paragraphs, may be quoted without explicit permission provided that fullcredit, including © notice, is given to the source.
Mobile Scientists and International NetworksGiuseppe Scellato, Chiara Franzoni, and Paula StephanNBER Working Paper No. 18613December 2012JEL No. F22,J24,J61,O30
ABSTRACT
This paper explores the link between mobility and the presence of international research networks. Data come from the GlobSci survey of authors of articles published in 2009 in four fields of scienceworking in sixteen countries. Summary evidence suggests that migration plays an important role inthe formation of international networks. Approximately 40 percent of the foreign-born researchersreport having kept research links with colleagues in their country of origin. Non-mobile researchersare less likely to collaborate with someone outside their country than are either the foreign born orreturnees. When the non-mobile collaborate, their networks span fewer countries. Econometric resultsare consistent with the hypothesis that internationally mobile researchers contribute significantly toextending the international scope and quality of the research network in destination countries at nodetriment to the quality of the research performed. Results also suggest that the “foreign premium”on collaboration propensity is driven in large part by mobile researchers who either trained or workedoutside the destination country where they were surveyed in 2011. With but one exception, the mobilityfindings persist when we estimate models separately for the US, Europe, and other countries.
Giuseppe ScellatoDepartment of Production Systemsand Business EconomicsPolitecnico di Torino10129 Turin, Italyand Bureau of Research in Innovation Complexity and Knowledge at Collegio Carlo Alberto, [email protected]
Chiara FranzoniDepartment of IndustrialEngineering & ManagementPolitecnico di Milano20133 [email protected]
Paula Stephan Department of Economics Andrew Young School of Policy Studies Georgia State University Box 3992 Atlanta, GA 30302-3992 and Università di Torino and also NBER [email protected]

3
1. INTRODUCTION
The capability of a country to attract foreign talent is fundamental to building and sustaining the quality of its national science and engineering workforces. The contribution of foreign-born scientists and engineers in most advanced economies is sizable. In the US, by way of example, currently about 48 percent of all PhDs awarded in science and engineering go to those who are either temporary or permanent residents. Almost 60 percent of all postdocs working in the United States are on a temporary visa (Stephan, 2012) and approximately 41.6 percent of those with a doctorate degree working in a science and engineering occupation in 2009 were born outside the United States (National Science Board, 2012, table 3-28). Significant mobility is also present across European countries. A study of postdoctoral researchers working in Europe in the life sciences found, for example, that 43 percent were working in a country different than that of origin (Empirica, 2005). The percent of foreign students enrolled in graduate science and engineering programs in the UK in 2008-2009 was 51.2 percent (table 2-40 (National Science Board, 2012). Foreign-born and foreign-educated scientists have been shown to be disproportionately distributed among those who make exceptional contributions in science (Stephan and Levin, 2001). Hunter et al. (2009), for example, found that 50 percent of all highly-cited PhD physicists in the world work in a different country than that in which they were born. Stephan and Levin found exceptionally productive scientists and engineers working in the United States, defined by a number of measures, to have a higher probability of being foreign born and foreign educated than the underlying population of US scientists. The gains from international migration, however, do not accrue only to countries that succeed in attracting talented individuals at the expenses of countries that lose human resources. Personal and professional ties often remain between immigrants and their country of origin or prior residence and constitute an invisible backbone enabling reverse knowledge flows (Saxenian, 2002). Previous contributions have highlighted the presence of a complex network of links between flows of researches and the generation and transformation of scientific networks (Melin, 2004; Jonkers and Tijssen, 2008). Research and innovation policies, particularly in Europe, have strongly supported international mobility of the high skilled workforce as a means for enhancing the overall scientific performance of both source and destination countries. Despite the importance attributed to such ties, few empirical studies have systematically investigated the topic, in part because of the lack of internationally comparable data, particularly for Europe1. Most of the available evidence on the effects of international mobility of scientists is based on observation of scientists from specific countries and disciplines or of researchers who applied for specific publicly sponsored mobility programmes2.
1 Two recent studies have gathered data on mobility of doctorate holders in Europe: the Careers of Doctorate Holders (CDH) developed by OECD and UNESCO (Auriol, 2010) and the MORE project (2010), funded by the European Commission. The CDH study focuses on all doctorate holders; data reported vary by date, depending upon country. The MORE study of researchers at universities has an exceptionally low response rate of 11percent and thus provides, at best, a noisy picture of mobility of scientists within Europe and to the United States. In the US the National Science Foundation’s Survey of Doctorate Recipients only recently began to track individuals trained in the United States who subsequently leave the United States. 2 Edler et al. (2011) analyse a sample of about 950 German academics from science and engineering faculties and investigate through a survey how the duration and frequency of scientists’ visits abroad affect technology transfer propensity, finding a positive effect of mobility in both the origin and host country. Hunter et al. (2009) collect data on the movement and productivity of elite scientists. They find that mobility is remarkable in this group: nearly half of the world’s most-cited physicists work outside their country of birth and they tend to migrate systematically towards nations with large R & D spending. Laudel (2005) also analyses the brain drain of elite scientists in two specific scientific fields (angiotensin and vibrational spectroscopy) using bibliometric data. The data reveal the

4
This paper contributes to our understanding of the role that migration plays in collaboration by providing new data on international mobility patterns of researchers working in four scientific fields and exploring the links between scientists’ migration and the establishment of international research networks. Data come from the GlobSci survey, conducted in the spring of 2011 by the three authors3. The survey is unique in that it studies scientists working in 16 “core” countries: Australia, Belgium, Brazil, Canada, Denmark, France, Germany, Italy, India, Japan, Netherlands, Spain, Sweden, Switzerland, UK, and the US. The methodology involved surveying corresponding authors of articles published in 2009 in four fields of science who were studying or working in one of the 16 countries. The four fields are biology, chemistry, earth and environmental sciences, and materials. Collectively the core countries produce about 70 percent of all articles published in these fields. The overall response rate was about 40% (Franzoni et al., 2012). The survey resulted in 19,183 records. The size and international scope of the survey allow us to produce a comprehensive picture of mobility patterns based on the mobility status of active researchers in 2009. Moreover, the data allow us to consistently control for a number of individual characteristics that cannot be observed through alternative research approaches such as bibliometric indicators or the analysis of the CVs of researchers.
Our analysis of the relationship of foreign-born scientists and returnees to the international openness of research networks reveals a number of interesting facts. First, a sizable share of foreign-born scientists included in our sample (about 40%) report research collaborations with research groups located in their country of origin. Second, we find robust evidence suggesting that both foreign-born scientists and returnees have larger international research networks than do native researchers who lack an international background. Such patterns appear to hold even when we conduct the analysis separately for the US, European countries and other countries. Third, we find that internationally co-authored papers with a foreign born or returnee corresponding author tend to have on average a higher scientific standing than those with a native non-mobile corresponding author. The effect on international collaborations and research quality of foreign-born researchers is driven primarily by migrants who did not get their PhD in the destination country, but rather came for a postdoc position or directly for employment at a university or public research centre in the destination country after doctoral training in another country. Such results suggest that research links established during doctoral training matter when the student moves. We also find that natives who return after having one or more international experiences have more international collaborations than those who do not have international experience. More generally, the overall evidence suggests the presence of a non-trivial impact of international mobility on the international openness of the research system of countries and the quality of the research produced. Results have clear policy implications in light of the high heterogeneity in the patterns of foreign-born attractiveness and returnee rates across the analysed core countries. The paper is organised as follows. In section 2 we introduce the characteristics of the GlobSci survey, the related datasets and discuss the evidence on international mobility patterns for the 16
presence of relevant field heterogeneity in migration rates and highlight that migration generally occurs before scientists have gained the ‘elite’ status. Furukawa et al. (2012) trace the movements of about 2,200 researchers in the domains of robotics, computer vision and electron devices using a bibliometric approach based on affiliation countries. Their results confirm that the US, China and India exhibit the greatest global flows of researchers. Nerdrum and Sarpebakken (2006) use data registers and a survey to examine the stock and flows of foreign-born researchers in Norway, and related reasons for moving. Filippo et al. (2009) present an analysis of mobility patterns and scientific performance based on a case study of Spanish universities.
3 The Global Science Project (GLobSci) has been funded by the Italian Governmenet (Regione Piemonte) and the IPE Program of the National Bureau of Economic Reserach (NBER, USA).

5
core countries. In section 3 we explore summary data concerning mobility and international collaboration. We present the econometric modelling of the data and show results in section 4. Section 5 summarises and discusses the main findings.
2. DATASET AND SUMMARY STATISTICS
2.1 The GlobSci survey
We surveyed active researchers in the four scientific disciplines of biology, chemistry, earth and environmental sciences, and materials science during the period February-June 2011. Surveyed countries are: Australia, Belgium, Brazil, Canada, Denmark, France, Germany, India, Italy, Japan, Netherlands, Spain, Sweden, Switzerland, United Kingdom, and the United States.
In order to construct the sample, we selected all journals classified by ISI as belonging to one of the four disciplinary fields and sorted them by Impact Factor for all subfields of the four disciplines. Impact Factor was taken from the latest available release of the Journal Citation Report of Thomson-Web of Science®. We then randomly picked a selection of journals in each quartile of the Impact Factor distribution in each of the subfields of the four disciplines. In the aggregate, this selection corresponds to approximately 30% of all journals published in the four fields.
We downloaded full bibliographic data for all scientific articles published in the selected journals in 2009 and retrieved the email address of the corresponding authors of each of the survey articles. In case of multiple corresponding authors, we picked the first name on the list. In the case of corresponding authors appearing repeatedly in the list, we randomly selected one record4. The main language of the survey is English. However, the questionnaire and the invitation emails were available in six other languages: French, German, Italian, Japanese, Portuguese and Spanish. The online questionnaire was developed through the platform Qualtrics®. Each respondent received a customised questionnaire, given that some questions made direct reference to the title, year and journal of the person’s own article included in the sample.
The final dataset contains information on the survey article selected by the sampling criteria as well as information on background characteristics of the corresponding author and co-authors of the survey article. In addition to standard bibliometric data, we also have information on the composition of the network of co-authors, whether the article involved an international collaboration, and a set of reported characteristics of the topic that the survey article addresses (e.g. whether it is in an emerging or multidisciplinary field and whether it is in a main research area for the author).5
With regard to the corresponding author, the structure of the dataset allows us to control for a number of individual characteristics, including age, gender, job position, type of affiliation, international mobility data (including country of origin, reasons for leaving the origin country, periods of education or work abroad) and type of initial entry in the host country (for PhD training, post-doc, direct employment).
In the two following sub-sections we present aggregated statistics on mobility patterns and on the relationship between mobility and research networks.
4 In the four selected fields 95 percent or more of all articles contain an email address for the corresponding author. More specifically, in 2009 the estimated number of records that did not report email address for corresponding author was 0.9% in biology, 3.6% in chemistry, 2.9% in earth and environmental sciences and 4.5% in materials science. 5 Survey response rates and response biases are discussed in Appendix A.
6
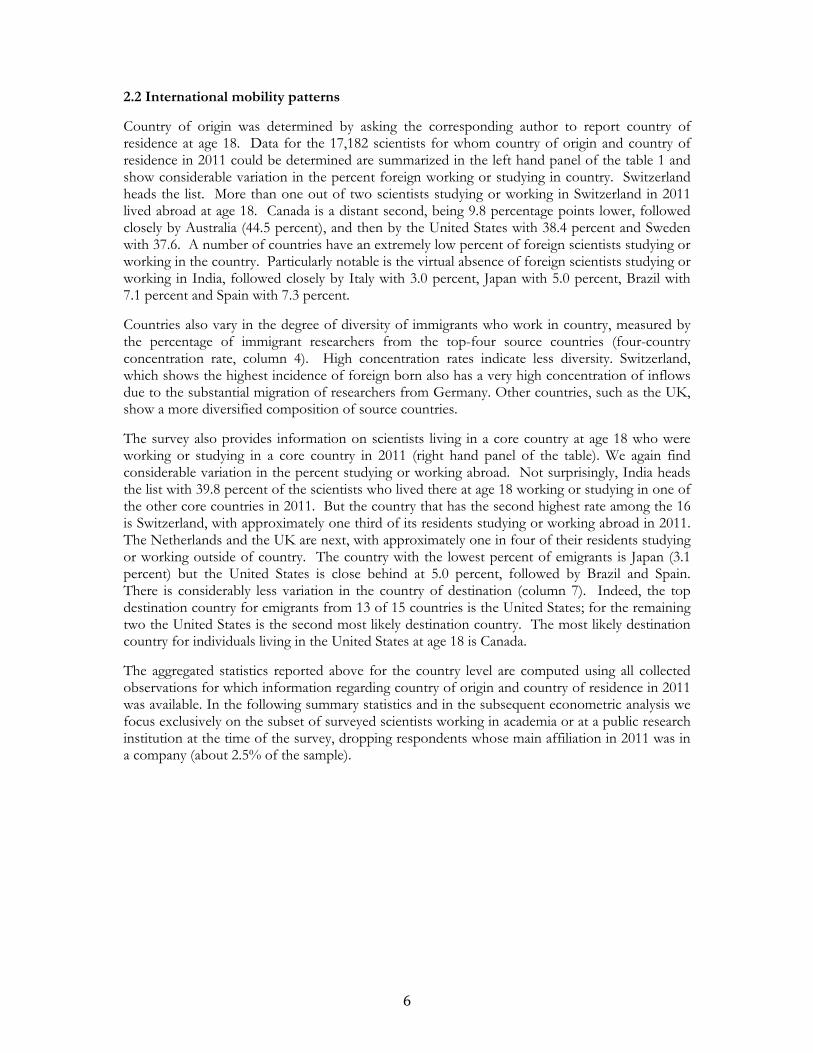
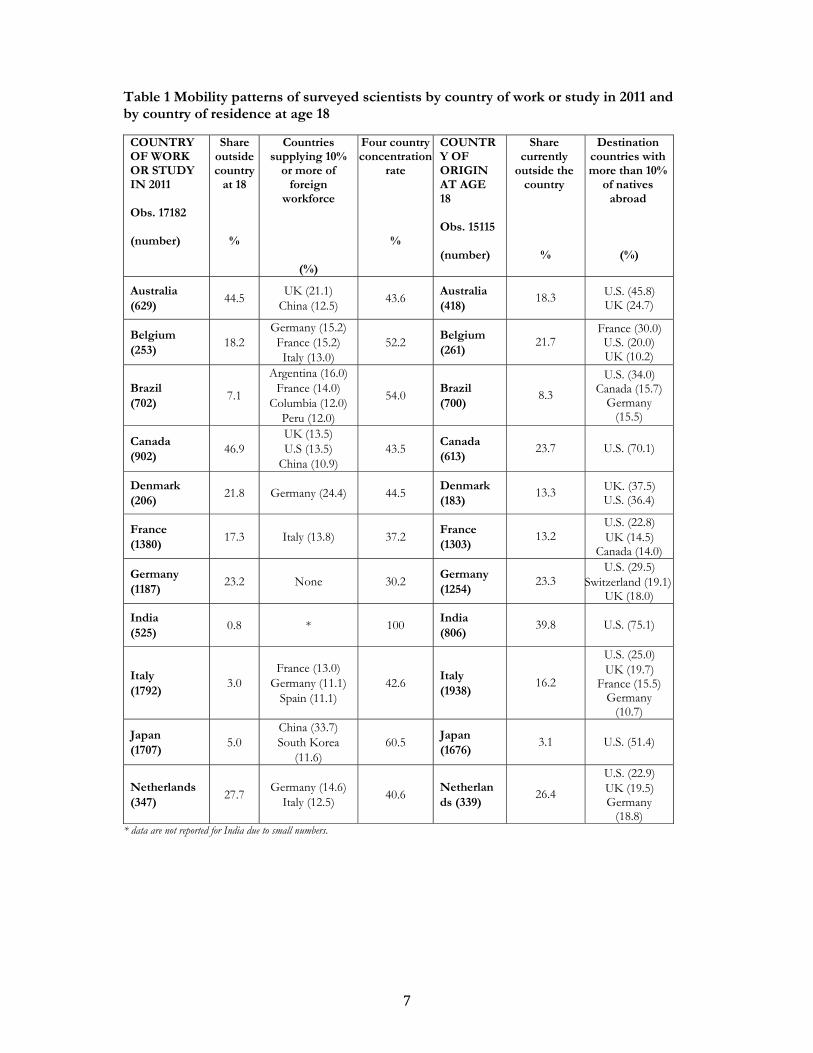
2.2 International mobility patterns
Country of origin was determined by asking the corresponding author to report country of residence at age 18. Data for the 17,182 scientists for whom country of origin and country of residence in 2011 could be determined are summarized in the left hand panel of the table 1 and show considerable variation in the percent foreign working or studying in country. Switzerland heads the list. More than one out of two scientists studying or working in Switzerland in 2011 lived abroad at age 18. Canada is a distant second, being 9.8 percentage points lower, followed closely by Australia (44.5 percent), and then by the United States with 38.4 percent and Sweden with 37.6. A number of countries have an extremely low percent of foreign scientists studying or working in the country. Particularly notable is the virtual absence of foreign scientists studying or working in India, followed closely by Italy with 3.0 percent, Japan with 5.0 percent, Brazil with 7.1 percent and Spain with 7.3 percent.
Countries also vary in the degree of diversity of immigrants who work in country, measured by the percentage of immigrant researchers from the top-four source countries (four-country concentration rate, column 4). High concentration rates indicate less diversity. Switzerland, which shows the highest incidence of foreign born also has a very high concentration of inflows due to the substantial migration of researchers from Germany. Other countries, such as the UK, show a more diversified composition of source countries.
The survey also provides information on scientists living in a core country at age 18 who were working or studying in a core country in 2011 (right hand panel of the table). We again find considerable variation in the percent studying or working abroad. Not surprisingly, India heads the list with 39.8 percent of the scientists who lived there at age 18 working or studying in one of the other core countries in 2011. But the country that has the second highest rate among the 16 is Switzerland, with approximately one third of its residents studying or working abroad in 2011. The Netherlands and the UK are next, with approximately one in four of their residents studying or working outside of country. The country with the lowest percent of emigrants is Japan (3.1 percent) but the United States is close behind at 5.0 percent, followed by Brazil and Spain. There is considerably less variation in the country of destination (column 7). Indeed, the top destination country for emigrants from 13 of 15 countries is the United States; for the remaining two the United States is the second most likely destination country. The most likely destination country for individuals living in the United States at age 18 is Canada.
The aggregated statistics reported above for the country level are computed using all collected observations for which information regarding country of origin and country of residence in 2011 was available. In the following summary statistics and in the subsequent econometric analysis we focus exclusively on the subset of surveyed scientists working in academia or at a public research institution at the time of the survey, dropping respondents whose main affiliation in 2011 was in a company (about 2.5% of the sample).
7
Table 1 Mobility patterns of surveyed scientists by country of work or study in 2011 and by country of residence at age 18
COUNTRY OF WORK OR STUDY IN 2011 Obs. 17182 (number)
Share outside country
at 18
%
Countries supplying 10%
or more of foreign
workforce
(%)
Four country concentration
rate
%
COUNTRY OF ORIGIN AT AGE 18 Obs. 15115 (number)
Share currently
outside the country
%
Destination countries with more than 10%
of natives abroad
(%)
Australia (629)
44.5 UK (21.1)
China (12.5) 43.6
Australia (418)
18.3 U.S. (45.8) UK (24.7)
Belgium (253)
18.2 Germany (15.2) France (15.2) Italy (13.0)
52.2 Belgium (261)
21.7 France (30.0) U.S. (20.0) UK (10.2)
Brazil (702)
7.1
Argentina (16.0) France (14.0)
Columbia (12.0) Peru (12.0)
54.0 Brazil (700)
8.3
U.S. (34.0) Canada (15.7)
Germany (15.5)
Canada (902)
46.9 UK (13.5) U.S (13.5)
China (10.9) 43.5
Canada (613)
23.7 U.S. (70.1)
Denmark (206)
21.8 Germany (24.4) 44.5 Denmark (183)
13.3 UK. (37.5) U.S. (36.4)
France (1380)
17.3 Italy (13.8) 37.2 France (1303)
13.2 U.S. (22.8) UK (14.5)
Canada (14.0)
Germany (1187)
23.2 None 30.2 Germany (1254)
23.3 U.S. (29.5)
Switzerland (19.1)UK (18.0)
India (525)
0.8 * 100 India (806)
39.8 U.S. (75.1)
Italy (1792)
3.0 France (13.0)
Germany (11.1) Spain (11.1)
42.6 Italy (1938)
16.2
U.S. (25.0) UK (19.7)
France (15.5) Germany
(10.7)
Japan (1707)
5.0 China (33.7) South Korea
(11.6) 60.5
Japan (1676)
3.1 U.S. (51.4)
Netherlands (347)
27.7 Germany (14.6)
Italy (12.5) 40.6
Netherlands (339)
26.4
U.S. (22.9) UK (19.5) Germany
(18.8) * data are not reported for India due to small numbers.
8
Table 1 Mobility patterns of surveyed scientists by country of work or study in 2011 and by country of residence at age 18 (continued)
COUNTRY OF WORK OR STUDY IN 2011 Obs. 17182 (number)
Share outside country
at 18
%
Countries supplying 10%
or more of foreign
workforce
(%)
Four country concentration
rate
%
COUNTRY OF ORIGIN AT AGE 18 Obs. 15115 (number)
Share currently
outside the country
%
Destination countries with more than 10%
of natives abroad
(%)
Spain (1185)
7.3 Argentina (12.6)
France (10.3) Italy (10.3)
40.2 Spain (1175)
8.4
U.S. (31.0) Germany (16.2)
UK (15.5) France (14.1)
Sweden (314)
37.6 Germany (11.9)
Russian Fed. (10.2)
34.7 Sweden (226)
13.9 U.S. (23.8) UK (13.8)
Germany (11.5)
Switzerland (330)
56.7 Germany (36.9) 59.4 Switzerland (209)
33.1 US (34.2) Germany
(29.5)
UK (1205)
32.9 Germany (15.2)
Italy (10.4) 37.6
UK (1090)
25.1 U.S. (46.9)
Canada (16.6) Australia (16.6)
U.S. (4518)
38.4 China (16.9) India (12.3)
42.9 U.S. (2924)
5.0
Canada (32.2) UK (16.3)
Australia (10.1) Germany
(10.0)
3. SUMMARY DATA CONCERNING MOBILITY AND INTERNATIONAL COLLABORATION
The last three decades have witnessed an increase in the extent of international scientific collaboration (Wagner and Leydesdorff, 2005). Numerous factors have been noted as contributing to the trend, from policy “push” initiatives (European Commission, 2005) to the advancement of technological solutions for remote collaborations (Ding et al. 2010) to the construction of large pieces of equipment, such as the Large Hadron Collider. Here we investigate the specific link between international mobility and the establishment of international research networks.
In the analysis that follows, surveyed researchers have been classified into one of three possible mobility statuses with respect to her/his country of residence in 2011: i) foreign born (24.3 percent of the sample); ii) returnee after one or more periods abroad for a PhD, a postdoc position or employment (29.7 percent); and iii) non-mobile natives (46.0 percent).
Based on the survey data, we derive two measures of the individual’s propensity to have an international research network using two alternative types of information: i) characteristics of the survey paper and ii) the number of countries with which the scientist reported having one or more collaborations in the past two years. Respondents directly declare the latter information in the questionnaire.

9
Table 2 provides information regarding the incidence by mobility status of researchers who are corresponding authors of a survey paper with one or more international co-authors. The data show that about 24 percent of the articles in our dataset involved an international collaboration, although there is some variance across the four disciplines. In all fields the incidence of internationally co-authored papers is lower for non-mobile researchers; with the exception of earth sciences, it is highest for foreign-born researchers. Note that these summary statistics do not account for additional factors (e.g. age, type of affiliation, country of origin and residence) that are likely to affect the propensity to engage in international collaboration. We will address such factors in detail in the section devoted to the econometric analyses.
Table 2 Incidence of internationally co-authored papers by scientific field and mobility status of corresponding author
Incidence of international collaborations on survey article
All fields Biology Chemistry Earth Science Material Science
Full Sample 23.94% 25.30% 23.61% 33.17% 22.82%
Foreign born 33.59% 30.52% 31.66% 42.68% 30.01%
Returnees 29.12% 28.85% 26.38% 43.23% 24.18%
Non Mobile 20.26% 20.41% 17.88% 24.74% 18.15%
10
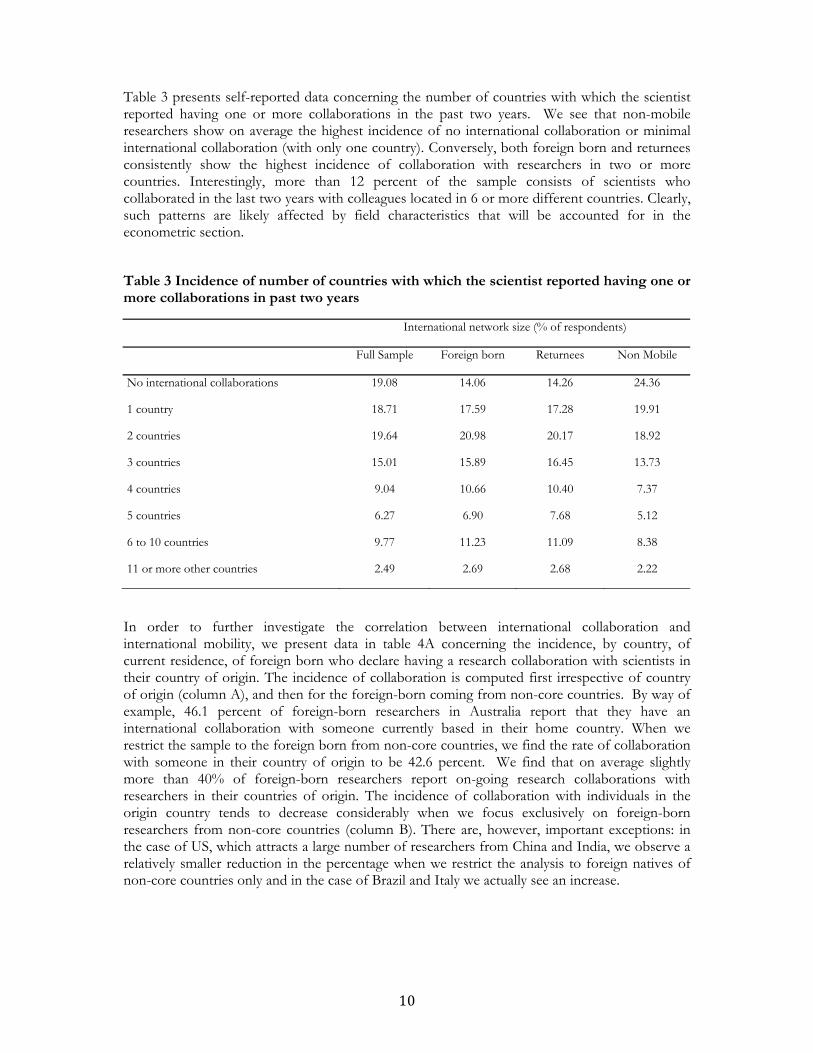
Table 3 presents self-reported data concerning the number of countries with which the scientist reported having one or more collaborations in the past two years. We see that non-mobile researchers show on average the highest incidence of no international collaboration or minimal international collaboration (with only one country). Conversely, both foreign born and returnees consistently show the highest incidence of collaboration with researchers in two or more countries. Interestingly, more than 12 percent of the sample consists of scientists who collaborated in the last two years with colleagues located in 6 or more different countries. Clearly, such patterns are likely affected by field characteristics that will be accounted for in the econometric section.
Table 3 Incidence of number of countries with which the scientist reported having one or more collaborations in past two years
International network size (% of respondents)
Full Sample Foreign born Returnees Non Mobile
No international collaborations 19.08 14.06 14.26 24.36
1 country 18.71 17.59 17.28 19.91
2 countries 19.64 20.98 20.17 18.92
3 countries 15.01 15.89 16.45 13.73
4 countries 9.04 10.66 10.40 7.37
5 countries 6.27 6.90 7.68 5.12
6 to 10 countries 9.77 11.23 11.09 8.38
11 or more other countries 2.49 2.69 2.68 2.22
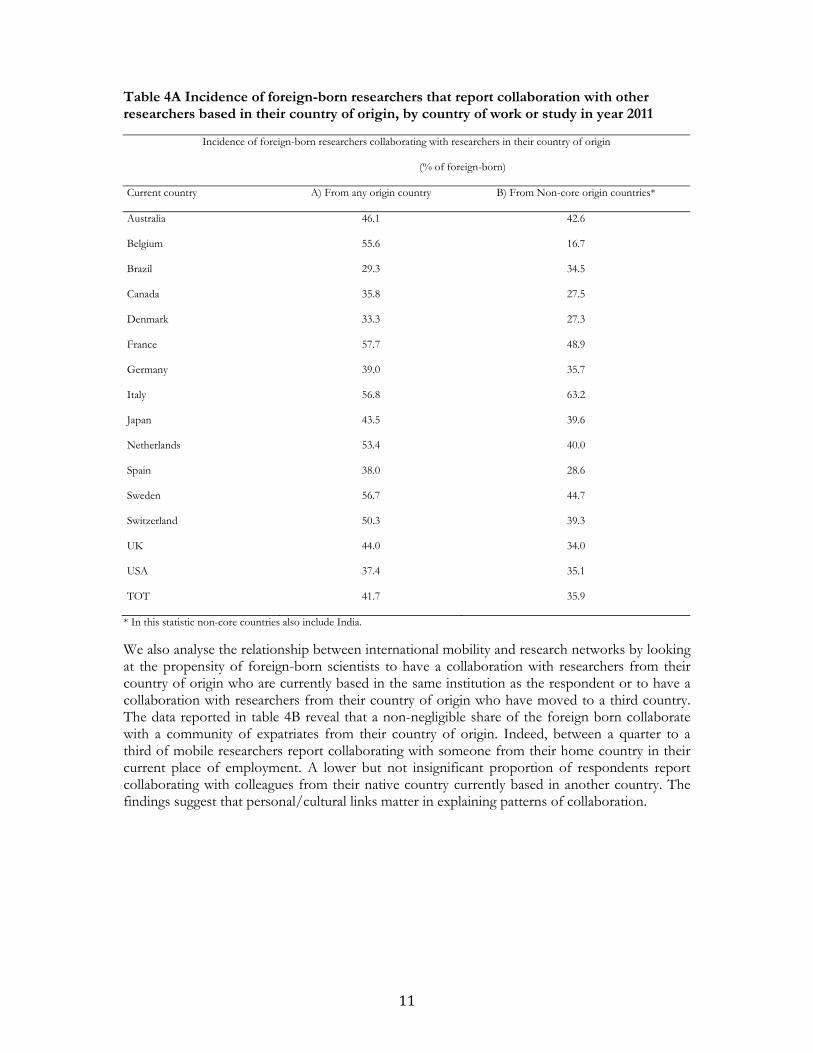
In order to further investigate the correlation between international collaboration and international mobility, we present data in table 4A concerning the incidence, by country, of current residence, of foreign born who declare having a research collaboration with scientists in their country of origin. The incidence of collaboration is computed first irrespective of country of origin (column A), and then for the foreign-born coming from non-core countries. By way of example, 46.1 percent of foreign-born researchers in Australia report that they have an international collaboration with someone currently based in their home country. When we restrict the sample to the foreign born from non-core countries, we find the rate of collaboration with someone in their country of origin to be 42.6 percent. We find that on average slightly more than 40% of foreign-born researchers report on-going research collaborations with researchers in their countries of origin. The incidence of collaboration with individuals in the origin country tends to decrease considerably when we focus exclusively on foreign-born researchers from non-core countries (column B). There are, however, important exceptions: in the case of US, which attracts a large number of researchers from China and India, we observe a relatively smaller reduction in the percentage when we restrict the analysis to foreign natives of non-core countries only and in the case of Brazil and Italy we actually see an increase.
11
Table 4A Incidence of foreign-born researchers that report collaboration with other researchers based in their country of origin, by country of work or study in year 2011
Incidence of foreign-born researchers collaborating with researchers in their country of origin
(% of foreign-born)
Current country A) From any origin country B) From Non-core origin countries*
Australia 46.1 42.6
Belgium 55.6 16.7
Brazil 29.3 34.5
Canada 35.8 27.5
Denmark 33.3 27.3
France 57.7 48.9
Germany 39.0 35.7
Italy 56.8 63.2
Japan 43.5 39.6
Netherlands 53.4 40.0
Spain 38.0 28.6
Sweden 56.7 44.7
Switzerland 50.3 39.3
UK 44.0 34.0
USA 37.4 35.1
TOT 41.7 35.9
* In this statistic non-core countries also include India.
We also analyse the relationship between international mobility and research networks by looking at the propensity of foreign-born scientists to have a collaboration with researchers from their country of origin who are currently based in the same institution as the respondent or to have a collaboration with researchers from their country of origin who have moved to a third country. The data reported in table 4B reveal that a non-negligible share of the foreign born collaborate with a community of expatriates from their country of origin. Indeed, between a quarter to a third of mobile researchers report collaborating with someone from their home country in their current place of employment. A lower but not insignificant proportion of respondents report collaborating with colleagues from their native country currently based in another country. The findings suggest that personal/cultural links matter in explaining patterns of collaboration.

12
Table 4B Incidence of scientific collaboration between foreign-born researchers and other researchers from the same country of origin who have emigrated, by country of work or study in year 2011
Current country
In my place of employment I work with at least one person who is from
my country of origin I collaborate with colleagues from my country of origin who are currently based in other countries
Australia 34.05% 26.29%
Belgium 40.00% 22.86%
Brazil 31.71% 12.20%
Canada 25.83% 19.44%
Denmark 43.33% 33.33%
France 32.34% 17.91%
Germany 32.86% 17.84%
Italy 27.27% 20.45%
Japan 37.10% 11.29%
Netherlands 26.03% 28.77%
Spain 45.07% 18.31%
Sweden 24.44% 17.78%
Switzerland 44.17% 26.38%
UK 26.24% 21.87%
US 23.91% 16.96%
TOT 28.25% 19.29%
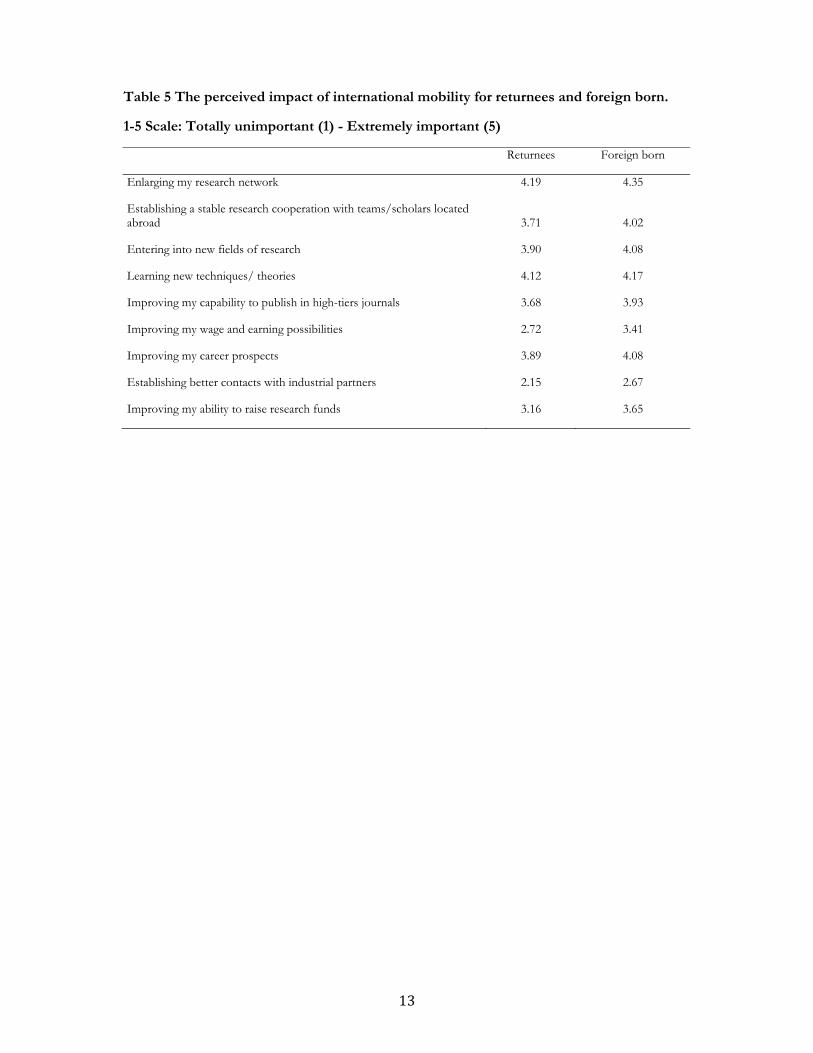
Table 5 reports summary statistics from our sample of mobile researchers regarding the perceived impact of their international mobility experience. We see that on average, both returnees and foreign-born researchers assign the highest average value to the item “enlarging my research network”, followed by “learning new techniques / theories”. This is consistent with the hypothesis that international mobility has a non-negligible impact on the international openness of the research systems of both source and destination countries. Notably, items related to economic and pecuniary benefits from international mobility receive on average lower ratings. This suggests that high-skilled migration patterns–at least in the case of scientific career--cannot be fully captured by underlying theoretical models that predict mobility primarily on the basis of wage differentials but rather factors contributing to research productivity play a large role in determining mobility.6
6 When returnees were asked to evaluate reasons for returning to their native country, the factor that received the highest score related to personal or family reasons rather than economic factors or career prospects in the country of origin.
13
Table 5 The perceived impact of international mobility for returnees and foreign born.
1-5 Scale: Totally unimportant (1) - Extremely important (5)
Returnees Foreign born
Enlarging my research network 4.19 4.35
Establishing a stable research cooperation with teams/scholars located abroad 3.71 4.02
Entering into new fields of research 3.90 4.08
Learning new techniques/ theories 4.12 4.17
Improving my capability to publish in high-tiers journals 3.68 3.93
Improving my wage and earning possibilities 2.72 3.41
Improving my career prospects 3.89 4.08
Establishing better contacts with industrial partners 2.15 2.67
Improving my ability to raise research funds 3.16 3.65
14
4. ECONOMETRIC ANALYSES
To date we have presented only descriptive statistics concerning the relationship between mobility and international collaboration. Here we extend the analysis by providing a set of econometric models that investigate the presence of significant correlations at the individual level between international mobility and the scope and quality of international research networks. We assess such relationships controlling for the researcher’s background, characteristics of the researcher’s scientific field and country of residence.
We perform two analyses to assess the degree to which international mobility of researchers is associated with international collaboration. First, we look at the correlation between the mobility status of the respondent and the likelihood that the survey paper is internationally co-authored. For this purpose we have created a dummy variable named INTER that equals one for survey articles in our sample that have an international network of co-authors. Second, we analyse the correlation between the mobility status of the scientist and the scope of the respondent’s international research network, measured by whether the respondent reported collaborating with individuals living outside the current country of work or study in the past 2 years. To be more specific, we create the dummy variable NETWORK and set it equal to one for respondents who report collaborations with authors in more than 4 countries in the last 2 years.
In our models we use the following article-specific variables: number of co-authors (SIZE), whether the author reports the article to be in her/his main area of research on a 1-5 scale (CORE_PROJ), the quality of the scientific article proxied by the impact factor of the related journal in 2009 (IF). In terms of author-specific characteristics, we control for the following: age (AGE), a dummy variable for gender (FEMALE), a dummy variable for whether the respondent has a job position that allows full research independence, i.e. professorship or staff scientist (INDEPENDENT), two dummy variables for mobility status (FOREIGN BORN, RETURNEE), a dummy variable set equal to one for those foreign-born researchers who received their PhD in the destination country (PHD_INCOMING). In the analyses we also include several full sets of control dummies: 16 country dummies that control for the baseline distribution in the core-country of residence of the respondents in 2011; 4 field dummies; 3 institution dummies (university, public research centre, other non-profit institutions). Table 6 provides the summary statistics of the variables used in the econometric models.

15
Table 6 summary statistics of variables used in the econometric analyses
Variable Mean Median St dev 1st percentile 99th percentileFOREIGN BORN 0.225 0 0.438 0 1 RETURNEE 0.299 0 0.458 0 1 PHD_INCOMING 0.096 0 0.269 0 1 SIZE 4.932 4 2.893 1 15 CORE_PROJ 4.195 4.5 0.909 1.4 5 INDEPENDENT 0.622 1 0.484 0 1 AGE 48.100 47 10.87 29 75 FEMALE 0.239 0 0.426 0 1 NETWORK 0.276 0 0.447 0 1 INTERN 0.259 0 0.438 0 1 IF 2.887 3.789 23.431 0.424 16.826
In all econometric models presented in the following sections we have adopted a standard approach which consists of dropping observations for which we were not able to collect all the required information in the survey. To check for robustness we present additional models which account for missing data7 and also introduce country-level weights that account for the variations in response rates across countries in Appendix B.
4.1 Mobility and international research network
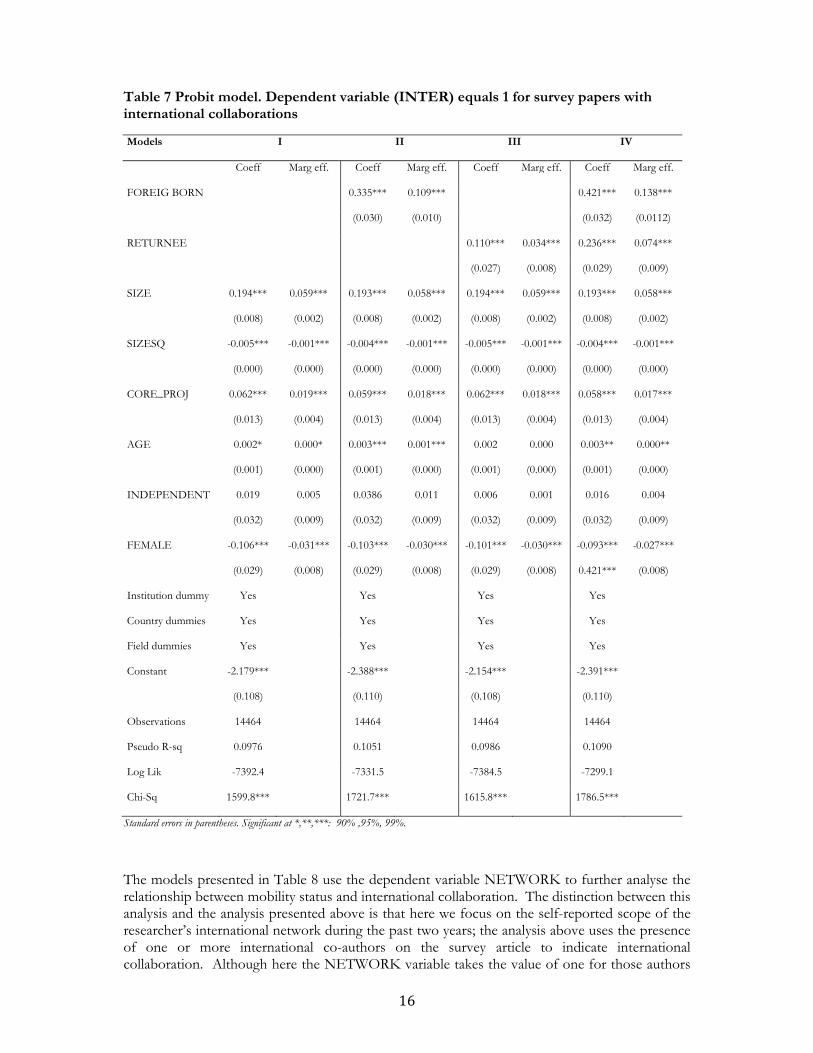
Table 7 presents estimates from a probit model testing for the presence of significant correlations at the individual level between mobility status and international co-authorship of the survey article. For all probit models we report both coefficients and marginal effects computed at covariate means. In model I we show the baseline specification while in models II – IV we test for the additional effect exerted by the mobility status of the author. Regardless of specification, we find that the probability of observing an international collaboration increases at a decreasing rate as the number of co-authors increases. We also find international collaborations to be more likely for articles that are in a main area of research interest of the author and that women are less likely to engage in international collaboration, even after controlling for field and country. Our results also suggest that, on average older researcher are more likely to be involved in international collaborations.
In Model II we differentiate between those who are foreign born vs. all other researchers working in the same country. In Model III the distinction is drawn between those who have returned from work or study abroad and all others. The results suggest that both types of mobility increase the probability that a researcher has written the survey article with one or more international co-authors. The effect appears larger, however, for the foreign born than for those who have returned. This is confirmed in model IV where we compute the marginal effects of both types of mobility on international collaboration relative to non-mobile researchers working in the same country and scientific field. We find the marginal effect of being foreign born on the likelihood of having an international collaboration, net of individual and article specific effects, to be 13.8 percentage points. The marginal effect of the variable RETURNEE is 7.4 percentage points. The estimated coefficient for the FOREIGN BORN variable is significantly higher (99 percent confidence level) than the coefficient for the RETURNEE variable.
7 In particular some individual characteristics used in the econometric models (e.g. age and gender) were asked at the end of the questionnaire. As a result, there are 880 missing entries for gender and 1034 missing entries for age, mostly due to respondent dropouts. We applied a methodology for the imputation of these missing data (see Little and Rubin, 2002). Results fully confirm the evidence reported in this section of the paper.
16
Table 7 Probit model. Dependent variable (INTER) equals 1 for survey papers with international collaborations
Models I II III IV
Coeff Marg eff. Coeff Marg eff. Coeff Marg eff. Coeff Marg eff.
FOREIG BORN 0.335*** 0.109*** 0.421*** 0.138***
(0.030) (0.010) (0.032) (0.0112)
RETURNEE 0.110*** 0.034*** 0.236*** 0.074***
(0.027) (0.008) (0.029) (0.009)
SIZE 0.194*** 0.059*** 0.193*** 0.058*** 0.194*** 0.059*** 0.193*** 0.058***
(0.008) (0.002) (0.008) (0.002) (0.008) (0.002) (0.008) (0.002)
SIZESQ -0.005*** -0.001*** -0.004*** -0.001*** -0.005*** -0.001*** -0.004*** -0.001***
(0.000) (0.000) (0.000) (0.000) (0.000) (0.000) (0.000) (0.000)
CORE_PROJ 0.062*** 0.019*** 0.059*** 0.018*** 0.062*** 0.018*** 0.058*** 0.017***
(0.013) (0.004) (0.013) (0.004) (0.013) (0.004) (0.013) (0.004)
AGE 0.002* 0.000* 0.003*** 0.001*** 0.002 0.000 0.003** 0.000**
(0.001) (0.000) (0.001) (0.000) (0.001) (0.000) (0.001) (0.000)
INDEPENDENT 0.019 0.005 0.0386 0.011 0.006 0.001 0.016 0.004
(0.032) (0.009) (0.032) (0.009) (0.032) (0.009) (0.032) (0.009)
FEMALE -0.106*** -0.031*** -0.103*** -0.030*** -0.101*** -0.030*** -0.093*** -0.027***
(0.029) (0.008) (0.029) (0.008) (0.029) (0.008) 0.421*** (0.008)
Institution dummy Yes Yes Yes Yes
Country dummies Yes Yes Yes Yes
Field dummies Yes Yes Yes Yes
Constant -2.179*** -2.388*** -2.154*** -2.391***
(0.108) (0.110) (0.108) (0.110)
Observations 14464 14464 14464 14464
Pseudo R-sq 0.0976 0.1051 0.0986 0.1090
Log Lik -7392.4 -7331.5 -7384.5 -7299.1
Chi-Sq 1599.8*** 1721.7*** 1615.8*** 1786.5***
Standard errors in parentheses. Significant at *,**,***: 90% ,95%, 99%.
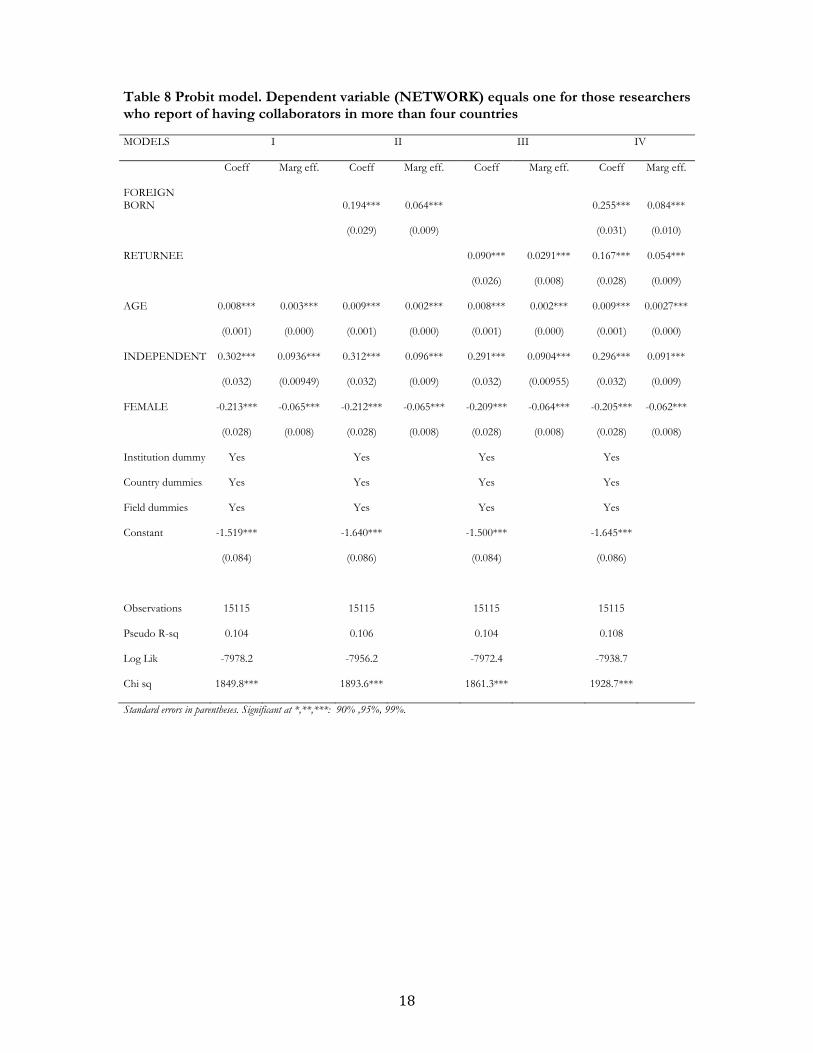
The models presented in Table 8 use the dependent variable NETWORK to further analyse the relationship between mobility status and international collaboration. The distinction between this analysis and the analysis presented above is that here we focus on the self-reported scope of the researcher’s international network during the past two years; the analysis above uses the presence of one or more international co-authors on the survey article to indicate international collaboration. Although here the NETWORK variable takes the value of one for those authors

17
who declare having collaborated with individuals in more than 4 countries in the past two years,8 we have also run alternative probit models using slightly higher and lower thresholds to measure scope in order to check for robustness. The main results presented below are confirmed.
Using this alternative indicator of international collaboration we again find a significant positive effect of the international mobility variables (models II-IV in Table 8), confirming the previous results presented in Table 7 that were based on the incidence of international co-authorships in the survey paper.9 Of more importance to this research is that once again the foreign-born dummy shows a significantly higher impact on international collaboration than the returnee dummy in model IV. As expected, we also find age to be positively related to collaboration and women to be less likely to have large international collaborative networks. The variable capturing job independence has a positive and significant effect on the scope of the international research network.
8 On average in our sample this amounts to about one fourth of surveyed researchers. 9 The number of observation available to estimate the NETWORK equations is greater than the number used to estimate the INTER equations because of the number of incomplete answers related to article-specific questions used as controls in the NETWORK equations
18
Table 8 Probit model. Dependent variable (NETWORK) equals one for those researchers who report of having collaborators in more than four countries
MODELS I II III IV
Coeff Marg eff. Coeff Marg eff. Coeff Marg eff. Coeff Marg eff.
FOREIGN BORN
0.194*** 0.064*** 0.255*** 0.084***
(0.029) (0.009) (0.031) (0.010)
RETURNEE 0.090*** 0.0291*** 0.167*** 0.054***
(0.026) (0.008) (0.028) (0.009)
AGE 0.008*** 0.003*** 0.009*** 0.002*** 0.008*** 0.002*** 0.009*** 0.0027***
(0.001) (0.000) (0.001) (0.000) (0.001) (0.000) (0.001) (0.000)
INDEPENDENT 0.302*** 0.0936*** 0.312*** 0.096*** 0.291*** 0.0904*** 0.296*** 0.091***
(0.032) (0.00949) (0.032) (0.009) (0.032) (0.00955) (0.032) (0.009)
FEMALE -0.213*** -0.065*** -0.212*** -0.065*** -0.209*** -0.064*** -0.205*** -0.062***
(0.028) (0.008) (0.028) (0.008) (0.028) (0.008) (0.028) (0.008)
Institution dummy Yes Yes Yes Yes
Country dummies Yes Yes Yes Yes
Field dummies Yes Yes Yes Yes
Constant -1.519*** -1.640*** -1.500*** -1.645***
(0.084) (0.086) (0.084) (0.086)
Observations 15115 15115 15115 15115
Pseudo R-sq 0.104 0.106 0.104 0.108
Log Lik -7978.2 -7956.2 -7972.4 -7938.7
Chi sq 1849.8*** 1893.6*** 1861.3*** 1928.7***
Standard errors in parentheses. Significant at *,**,***: 90% ,95%, 99%.

19
4.2 Mobility and the quality of internationally co-authored papers
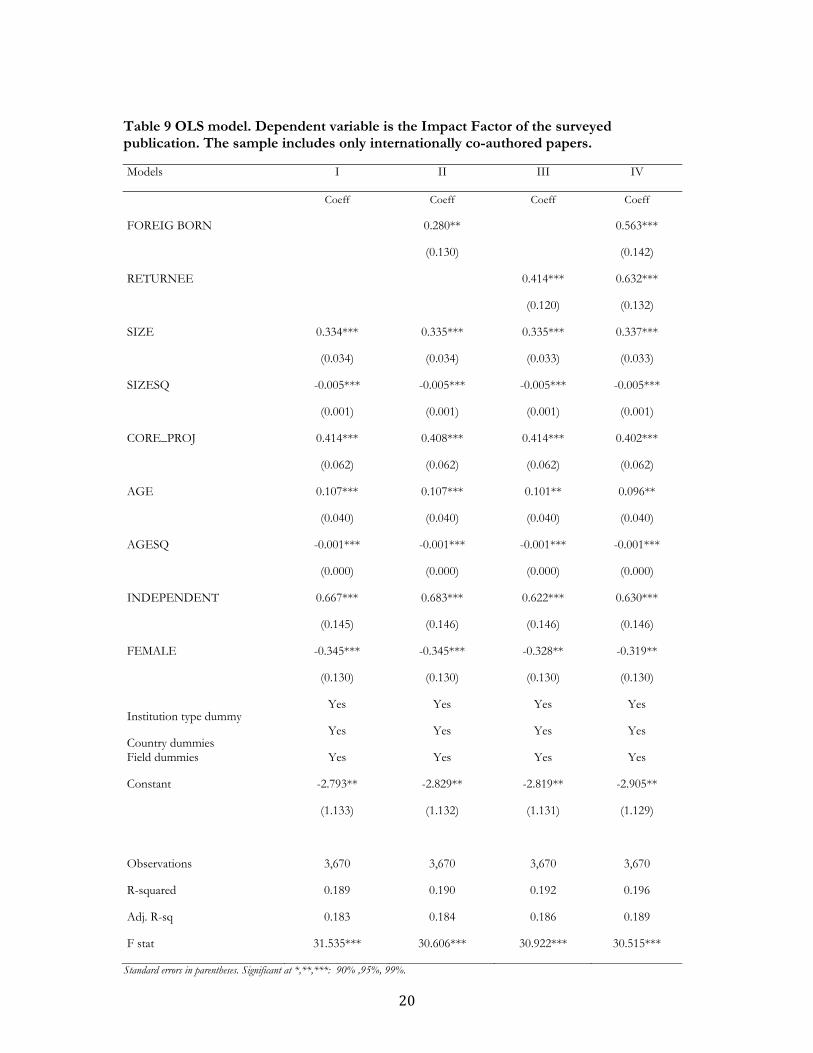
To date we have established that mobility -especially that of the foreign born- is positively associated with the propensity to have one or more international collaborations. But is this international collaborative research of the mobile of a higher quality than the international collaborative research of the non-mobile? Here we examine this question, using as a measure of quality the Impact Factor of the journal in which the 2009 survey article was published. We restrict the analysis to internationally co-authored papers to avoid spurious effects due to a possible average positive correlation between quality and international collaborative papers.
In all model specifications we keep field dummies in order to control for the baseline distribution of Impact Factors among the journals of a specific field. Following previous research regarding the determinants of researchers’ scientific output, we include both age and age squared among individual controls. In the baseline model specification (model I in Table 9) we find that the effect of both team size and age on quality increases at a decreasing rate. Job seniority – net of age effects - is also positively associated with research output quality. Of particular interest to our research is the finding that internationally co-authored papers with a mobile corresponding author tend to have on average a higher Impact Factor than those with a non-mobile corresponding author (model IV). However, we do not find a statistically different effect between the two types of mobility. Although we are well aware that the Impact Factor is but a partial measure of the actual scientific relevance of articles, the results suggest that the higher propensity of mobile researchers to collaborate across borders that we observed above does not translate into producing research of a lower quality.
20
Table 9 OLS model. Dependent variable is the Impact Factor of the surveyed publication. The sample includes only internationally co-authored papers.
Models I II III IV
Coeff Coeff Coeff Coeff
FOREIG BORN 0.280** 0.563***
(0.130) (0.142)
RETURNEE 0.414*** 0.632***
(0.120) (0.132)
SIZE 0.334*** 0.335*** 0.335*** 0.337***
(0.034) (0.034) (0.033) (0.033)
SIZESQ -0.005*** -0.005*** -0.005*** -0.005***
(0.001) (0.001) (0.001) (0.001)
CORE_PROJ 0.414*** 0.408*** 0.414*** 0.402***
(0.062) (0.062) (0.062) (0.062)
AGE 0.107*** 0.107*** 0.101** 0.096**
(0.040) (0.040) (0.040) (0.040)
AGESQ -0.001*** -0.001*** -0.001*** -0.001***
(0.000) (0.000) (0.000) (0.000)
INDEPENDENT 0.667*** 0.683*** 0.622*** 0.630***
(0.145) (0.146) (0.146) (0.146)
FEMALE -0.345*** -0.345*** -0.328** -0.319**
(0.130) (0.130) (0.130) (0.130)
Institution type dummy Yes Yes Yes Yes
Country dummies Yes Yes Yes Yes
Field dummies Yes Yes Yes Yes
Constant -2.793** -2.829** -2.819** -2.905**
(1.133) (1.132) (1.131) (1.129)
Observations 3,670 3,670 3,670 3,670
R-squared 0.189 0.190 0.192 0.196
Adj. R-sq 0.183 0.184 0.186 0.189
F stat 31.535*** 30.606*** 30.922*** 30.515***
Standard errors in parentheses. Significant at *,**,***: 90% ,95%, 99%.

21
4.3 The effect of international training on international collaboration and network advantage
The network edge and superior performance of foreign-born researchers with respect to other researchers in the same country and field could, of course, be due to the quality of their existing networks at the time they immigrate. Here we investigate this possibility by including in the model specifications a variable that equals one for those foreign born who received their PhD in the destination country (PHD_INCOMING). The sample analysed includes all researchers in each core country. The reason we control for this variable is that the foreign born who have trained in the destination country should have a more limited “international” advantage (e.g. no previous research networks abroad established during their training and research career) than the foreign born who trained outside the country. Thus, PHD_INCOMING is expected to have a moderating effect on the FOREIGN BORN variable.
Table 10 presents results when this variable is included in the analysis of the two measures of international collaboration propensity (model I and II) and in the analysis of research quality (model III). The estimates indicate that the variable PHD_INCOMING has indeed a negative and significant effect on all three of the measures. However, its moderating impact is different across model specifications. In the case of research quality (model III) the PHD_INCOMING dummy variable substantially offsets the FOREIGN BORN dummy variable. This suggests that the foreign born who receive their PhD in the destination country do not show a significantly higher level of performance than the average local researcher in the same field. In the case of international collaboration (Model II), the moderating effect of the PhD variable turns out to be relatively small in magnitude but significant. It is less small, and significant, in the case of the propensity to have a large international network (model I).
The results suggest that the aggregated “foreigner premium” effect is driven considerably by mobile researchers with training or work experience outside the destination country, i.e. by individuals who had the opportunity to form research networks prior to arriving in the destination country. Immigrants who come for a postdoc position represent a clear example of this typology of researchers. The effect may also be related to the ex-ante selection process which is likely to be more binding for postdocs or for immigrant researchers directly employed by universities or public research centres in the destination country, rather than for PhD candidates. In this regard our evidence is in line with other recent contributions that have pointed out the relevance of temporary international mobility (Edler et al. 2011).

22
Table 10 Testing the moderating effect of PhD in the destination country. Model I: probit model with dependent variable NETWORK; Model II: probit model with dependent variable INTER; model III OLS model with dependent variable IF.
Models Large Network Internationally-coauthored paper IF of internationally co-authored papers
Coeff Marg eff. Coeff Marg eff. Coeff
FOREIG BORN 0.259*** 0.086*** 0.368*** 0.120*** 0.413***
(0.035) (0.012) (0.036) (0.012) (0.151)
PHD_INCOMING -0.164*** -0.049*** -0.081* -0.024* -0.359*
(0.048) (0.014) (0.049) (0.014) (0.207)
SIZE 0.193*** 0.058*** 0.334***
(0.008) (0.002) (0.034)
SIZESQ -0.004*** -0.001*** -0.005***
(0.000) (0.000) (0.001)
CORE_PROJ 0.059*** 0.018*** 0.410***
(0.013) (0.004) (0.062)
AGE 0.009*** 0.002*** 0.003*** 0.001*** 0.106***
(0.001) (0.000) (0.001) (0.000) (0.040)
AGESQ -0.001***
(0.000)
INDEPENDENT 0.310*** 0.095*** 0.037 0.011 0.676***
(0.032) (0.009) (0.032) (0.009) (0.146)
FEMALE -0.212*** -0.065*** -0.103*** -0.031*** -0.347***
(0.028) (0.008) (0.029) (0.008) (0.130)
Institution type dummy Yes Yes Yes
Country dummies Yes Yes Yes
Field dummies Yes Yes Yes
Constant -1.626*** -1.349*** -2.804**
(0.086) (0.085) (1.132)
Observations 15115 14464 3670
Adj. R-squared -- -- 0.191
Pseudo R-sq 0.107 0.105 0.185
Log -7950.560 -7330.186 --
Chi-Sq 1905.0*** 1724.4*** --
Standard errors in parentheses. Significant at *,**,***: 90% ,95%, 99%.
23
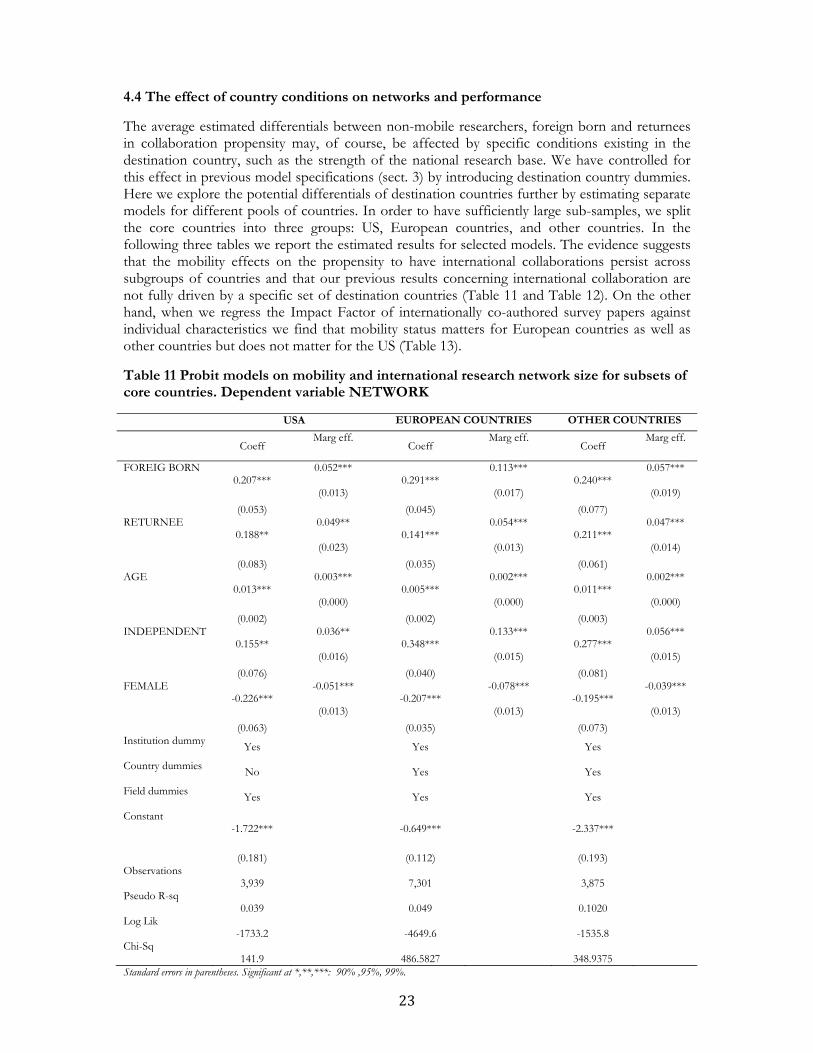
4.4 The effect of country conditions on networks and performance
The average estimated differentials between non-mobile researchers, foreign born and returnees in collaboration propensity may, of course, be affected by specific conditions existing in the destination country, such as the strength of the national research base. We have controlled for this effect in previous model specifications (sect. 3) by introducing destination country dummies. Here we explore the potential differentials of destination countries further by estimating separate models for different pools of countries. In order to have sufficiently large sub-samples, we split the core countries into three groups: US, European countries, and other countries. In the following three tables we report the estimated results for selected models. The evidence suggests that the mobility effects on the propensity to have international collaborations persist across subgroups of countries and that our previous results concerning international collaboration are not fully driven by a specific set of destination countries (Table 11 and Table 12). On the other hand, when we regress the Impact Factor of internationally co-authored survey papers against individual characteristics we find that mobility status matters for European countries as well as other countries but does not matter for the US (Table 13).
Table 11 Probit models on mobility and international research network size for subsets of core countries. Dependent variable NETWORK
USA EUROPEAN COUNTRIES OTHER COUNTRIES
Coeff Marg eff.
Coeff Marg eff.
Coeff Marg eff.
FOREIG BORN 0.207***
0.052*** 0.291***
0.113*** 0.240***
0.057***
(0.053)
(0.013)
(0.045)
(0.017)
(0.077)
(0.019)
RETURNEE 0.188**
0.049** 0.141***
0.054*** 0.211***
0.047***
(0.083)
(0.023)
(0.035)
(0.013)
(0.061)
(0.014)
AGE 0.013***
0.003*** 0.005***
0.002*** 0.011***
0.002***
(0.002)
(0.000)
(0.002)
(0.000)
(0.003)
(0.000)
INDEPENDENT 0.155**
0.036** 0.348***
0.133*** 0.277***
0.056***
(0.076)
(0.016)
(0.040)
(0.015)
(0.081)
(0.015)
FEMALE -0.226***
-0.051*** -0.207***
-0.078*** -0.195***
-0.039***
(0.063)
(0.013)
(0.035)
(0.013)
(0.073)
(0.013)
Institution dummy Yes Yes Yes
Country dummies No Yes Yes
Field dummies Yes Yes Yes
Constant -1.722*** -0.649*** -2.337***
(0.181) (0.112) (0.193)
Observations 3,939 7,301 3,875
Pseudo R-sq 0.039 0.049 0.1020
Log Lik -1733.2 -4649.6
-1535.8
Chi-Sq 141.9 486.5827
348.9375
Standard errors in parentheses. Significant at *,**,***: 90% ,95%, 99%.

24
Table 12 Probit models on mobility and international collaborations for subsets of core countries. Dependent variable INTER.
USA EUROPEAN COUNTRIES OTHER COUNTRIES
Coeff Marg eff. Coeff Marg eff. Coeff Marg eff.
FOREIG BORN 0.412*** 0.104*** 0.409*** 0.152*** 0.493*** 0.142***
(0.054) (0.014) (0.048) (0.018) (0.078) (0.025)
RETURNEE 0.418*** 0.116*** 0.189*** 0.067*** 0.263*** 0.068***
(0.085) (0.026) (0.038) (0.013) (0.060) (0.015)
SIZE 0.238*** 0.056*** 0.180*** 0.063*** 0.298*** 0.074***
(0.023) (0.005) (0.010) (0.003) (0.028) (0.006)
SIZESQ -0.007*** -0.001*** -0.004*** -0.001*** -0.011*** -0.002***
(0.001) (0.000) (0.000) (0.000) (0.002) (0.000)
CORE_PROJ 0.058** 0.013** 0.055*** 0.019*** 0.060** 0.015**
(0.029) (0.006) (0.018) (0.006) (0.029) (0.007)
AGE 0.008*** 0.001*** 0.002 0.000 -0.002 -0.000
(0.002) (0.000) (0.002) (0.000) (0.003) (0.000)
INDEPENDENT -0.245*** -0.062*** 0.063 0.022 0.113 0.027
(0.073) (0.02) (0.042) (0.014) (0.078) (0.018)
FEMALE -0.111* -0.025* -0.097*** -0.033*** -0.056 -0.013
(0.063) (0.014) (0.037) (0.012) (0.069) (0.016)
Institution dummy Yes Yes Yes
Country dummies No Yes Yes
Field dummies Yes Yes Yes
Constant -2.502*** -1.920*** -2.681***
(0.232) (0.147) (0.242)
Observations 3,779 7,007 3,678
Pseudo R-sq 0.101 0.083 0.105
Log lik. -1601.2 -4049.0 -1618.3
Chi-Sq 362.6405 736.9881 380.7782
Standard errors in parentheses. Significant at *,**,***: 90% ,95%, 99%.

25
Tab 13 OLS model on mobility and research quality for subsets of countries. Dependent variable is the Impact Factor of the surveyed publication. The sample includes only internationally co-authored papers.
USA
EUROPEAN COUNTRIES
OTHER COUNTRIES
Coeff Coeff Coeff
FOREIG BORN -0.321 0.944*** 0.639*
(0.322) (0.182) (0.339)
RETURNEE -0.590 0.827*** 0.962***
(0.476) (0.154) (0.286)
SIZE 0.291** 0.332*** 0.055
(0.136) (0.038) (0.121)
SIZESQ 0.001 -0.006*** 0.011
(0.007) (0.001) (0.007)
CORE_PROJ 0.449*** 0.366*** 0.509***
(0.169) (0.074) (0.134)
AGE -0.068 0.146*** 0.086
(0.099) (0.050) (0.090)
AGESQ 0.000 -0.002*** -0.001
(0.001) (0.000) (0.001)
INDEPENDENT 0.941** 0.663*** 0.068
(0.445) (0.167) (0.354)
FEMALE -0.895** -0.186 -0.358
(0.377) (0.151) (0.310)
Institution dummy Yes Yes Yes
Country dummies No Yes Yes
Field dummies Yes Yes Yes
Constant 4.468* -3.646*** -1.440
(2.628) (1.342) (2.376)
Observations 681 2276 713
Adj. R-sq 0.2087 0.1808 0.1731
F stat 13.809 22.824 9.277
Standard errors in parentheses. Significant at *,**,***: 90% ,95%, 99%.
26
5. CONCLUSION
This paper contributes to the existing evidence on international mobility of researchers working in four scientific fields, presenting results from the GlobSci survey that collected detailed data on the mobility and scientific collaborations of more than 19,000 researchers working or studying in 16 countries in 2011. The homogeneity of the administered survey allows for direct comparisons across countries of inflow and outflow patterns of high-skilled people involved in scientific research. Our summary evidence confirms the absolute relevance of the migration phenomenon for most advanced economies. More than 40% of the researchers sampled in the four fields in Switzerland, Canada and Australia are immigrants. The phenomenon is also non-negligible for the US and for certain other European economies such as the UK, the Netherlands, Germany and Sweden.
The specific focus of this paper is the relationship of mobility to international networks. We investigate the relationship in a variety of ways. Using descriptive analysis, we find, for example, that on average about 40% of foreign-born scientists in our sample report having kept research links with their country of origin, suggesting the presence of significant knowledge spillovers between source and destination countries. We also find, using descriptive analysis, that non-mobile researchers compared to the foreign born or to scientists who have returned to their country of origin, are the least likely to collaborate on research with someone working outside their country. When we estimate models that control for field, country, and individual effects, we find that both the foreign born and returnees are more likely to have an international co-author on the survey article than are the non-mobile benchmark; they are also more likely to have reported working with researchers in more than four countries during the past two years. The effect is more pronounced for the foreign born than it is for returnees. We also see evidence of a performance effect: when we restrict the sample to respondents who have an internationally co-authored survey article, we find that foreign born and returnees publish articles in higher quality journals, as measured by Impact Factor, than those who have not experienced mobility. With but one exception, the above results hold when we estimate comparable models for the US, Europe, and other countries.
Our results are consistent with the hypothesis that internationally mobile researchers significantly contribute to extending the international scope of the research network of destination countries at no detriment to the quality of the research output. All else equal, being foreign born increases the likelihood of having an international collaboration by 13.8 percentage points and being a native with work or study experience abroad increases the likelihood by 7.4 percentage points. Moreover, our results suggest that the “foreigner premium” on collaboration propensity and research quality is driven considerably by mobile researchers who have trained or worked outside the destination country where they were surveyed in 2011, as opposed to those who trained in the country of destination. This finding suggests that foreigners who arrive with a degree or work experience in hand contribute to openness by bringing a well-established network with them.
We also find that returnees and foreign-born researchers tend to assign the highest reason related to mobility to factors such as “enlarging my research network” and “learning new techniques/ theories”. This is consistent with the hypothesis that international mobility has a non-negligible impact on the international openness of the research systems of both source and destination countries. It is also consistent with the idea that high-skilled migration patterns – at least in the specific case of scientific careers - cannot be fully captured by underlying theoretical models that predict mobility primarily on the basis of wage differentials. In all instances other items related to economic and pecuniary benefits from international mobility receive on average lower ratings.
27
References
Auriol, L. (2010) Careers of Doctorate holders: employment and mobility patterns. OECD STI Working paper 2010/4 Allison, P. (2001) Missing data. SAGE University Press Bozeman, B., Corley, E. (2004) ‘Scientists’ collaboration strategies: implications for scientific and human capital, Research Policy, 33, pp. 599–616. Cañibano, C., F.J. Otamendi and F. Solís (2011) International temporary mobility of researchers: a cross-discipline study, Scientometrics, 89, pp. 653-67. Ding, W., Levin, S., Stephan, P., Winkler, A. (2010) The Impact of Information Technology on Academic Scientists’ Productivity and Collaboration Patterns. Management Science, 56 (9) pp. 1439-1461 Edler, J., Fier, H., Grimpe, C. (2011) International scientist mobility and the locus of knowledge and technology transfer. Research Policy, 40, pp. 791–805. Empirica GmbH (2005) Post-Docs in the Life Science. Paper prepared for the NetReAct project. Dowloadable at: www.netreact-eu.org/documents/NetreactDeliverable1.3.pdf Filippo, D., Casado, E., Gomez, S. (2009) Quantitative and qualitative approaches to the study of mobility and scientific performance: A case study of a Spanish university. Research Evaluation,18(3), pp. 191–200. Franzoni, C., Scellato, G., Stephan, P. (2011) Changing incentives to publish. Science, Vol. 333 no. 6043 pp. 702-703. Franzoni, C., Scellato, G., Stephan, P. (2012) Foreign Born Scientists: Mobility Patterns for Sixteen Countries, forthcoming in Nature Biotechnology Freeman, R. (2010) Gobalization of scientific and engineering talent: International mobility of students, workers, and ideas and the world economy. Economics of Innovation and New Technology 19 (5), pp. 398–406. Furukawa, T., Shirakawa, N., Okuwada, K., Sasaki, K. (2012) International mobility of researchers in robotics, computer vision and electron devices: A quantitative and comparative analysis. Scientometrics, 91 (1), pp. 185-202 Haeussler, C. (2011) Information-sharing in academia and the industry: A comparative study. Research Policy, 40 (1), pp. 105-122 Hunter, R. S., Oswald, A. J., Charlton, B. G. (2009) The elite brain drain. Economic Journal, 119 (538), pp. 231-251. Jonkers, K., Tijssen, R. (2008) Chinese researchers returning home: impacts of international mobility on research collaboration and scientific productivity. Scientometrics, 77 (2), pp. 309-333. Jöns, H. (2009) ‘Brain circulation’ and transnational knowledge networks: studying long-term effects of academic mobility to Germany, 1954–2000. Global Networks, 9(3), pp. 315–338.

28
Laudel, G. (2003) Studying the brain drain: can bibliometric methods help? Scientometrics, vol. 57(2), pp. 215–37. Laudel, G. (2005) Migration currents among the scientific elite’. Minerva, 43 (4), pp. 377–95. Levin, S., Stephan, P. (1999) Are the Foreign Born a Source of Strength for U.S. Science? Science 285, pp. 1213-14. Little, R., Rubin, D. (2002) Statistical analysis with missing data. New York: John Wiley & Sons. Melin, G. (2004) Postdoc abroad: inherited scientific contacts or establishment of new networks?, Research Evaluation, 13(2), pp. 95-102. Marceau, J., Turpin, T., Woolley, R., Hill, S. (2008) “Innovation agents: The inter-country mobility of scientists and the growth of knowledge hubs in Asia” 25th DRUID conference on Entrepreneurship and Innovation - Organisations, Institutions, Systems and Regions. Meyer, J. (2001) Network approach versus brain drain, lessons from the diaspora, International Migration, 39, pp. 91–110. MORE Project (2010) funded by the European Commision (DG Research) (http://www.researchersmobility.eu) National Science Board (2012) Science and Engineering Indicators: 2012. Arlington, VA: National Science Foundation. Nerdrum, L., Sarpebakken, B. (2006) Mobility of foreign researchers in Norway. Science and Public Policy 33 (3), pp. 217–229 Sauermann, H, Roach., M. (2010) Not all scientists pay to be scientists : Heterogeneous preferences for publishing in industrial research. Georgia Institue of Technology, working paper. Saxenian, A. L. (2002) Brain circulation: How high skill immigration makes everyone better off. The Brookings Review, 20 (1), pp. 28–31. Stephan, P. (2012). How Economics Shapes Science, Cambridge, MA. Harvard University Press. Stephan, P., Levin, S. G. (2001) Exceptional contribution to US science by the foreign-born and foreign-educated. Population Research and Policy Review, 20 (1–2), pp. 59–79. Wagner, C. S., Leydesdorff, L. (2005). Network structure, self-organization, and the growth of international collaboration in science, Research Policy, 34, pp. 1608–1618.

29
APPENDIX A
Survey response rates
Table A1 reports the number of answers received by country. Answers are further divided into complete answers and partial answers. The latter are answers from respondents who began the survey, but dropped-out before reaching the last question. The total dropout rate is 5%. The response rate is 40.6% if both complete and partial answers are counted. Reported response rates do not take into account undelivered invitations due to such things as incorrect email address, retirement or death and consequently underestimate the response rate.
Table A1 response rates by country
Panels Total
Answers Of which complete
Of which dropout
Total Response
Rate
Complete Response
Rate
Australia 1,571 676 610 66 43.00% 38.80%
Belgium 706 302 244 58 42.80% 34.60%
Brazil 1,537 762 692 70 49.60% 45.00%
Canada 2,455 1,020 897 123 41.50% 36.50%
Denmark 513 227 208 19 44.20% 40.50%
France 3,839 1,618 1,367 251 42.10% 35.60%
Germany 4,380 1,326 1,147 179 30.30% 26.20%
India 1,380 627 484 143 45.40% 35.10%
Italy 2,779 1,917 1,759 158 69.00% 63.30%
Japan 5,250 1,860 1,678 182 35.40% 32.00%
Netherlands 1,036 391 345 46 37.70% 33.30%
Spain 2,303 1,228 1,080 148 53.30% 46.90%
Sweden 882 353 301 52 40.00% 34.10%
Switzerland 919 356 320 36 38.70% 34.80%
UK 3,695 1,355 1,183 172 36.70% 32.00%
US 14,059 5,165 4,512 653 36.70% 32.10%
Total 47,304 19,183 16,827 2,356 40.60% 35.60%

30
Response rates by scientific field are reported in Table A2. Participation was highest for scientists in earth and environmental sciences and lowest for scientists in biology. Differences in country and discipline participation are likely to reflect in part the degree to which similar populations of scientists have been surveyed in the recent past by other, unrelated studies (Haeeussler, 2011; Sauermann and Roach 2011).
Table A2 response rates by field
Panels Total
Answers Of which complete
Of which dropouts
Total Response
Rate
Complete Response
Rate
Biology 15,290 5,810 5,097 713 38.00% 33.30%
Chemistry 15,549 6,324 5,524 800 40.70% 35.50%
Earth & Environment
8,616 3,956 3,532 424 45.90% 41.00%
Materials Science
7,849 3,093 2,674 419 39.40% 34.10%
Total 47,304 19,183 16,827 2,356 40.60% 35.60%
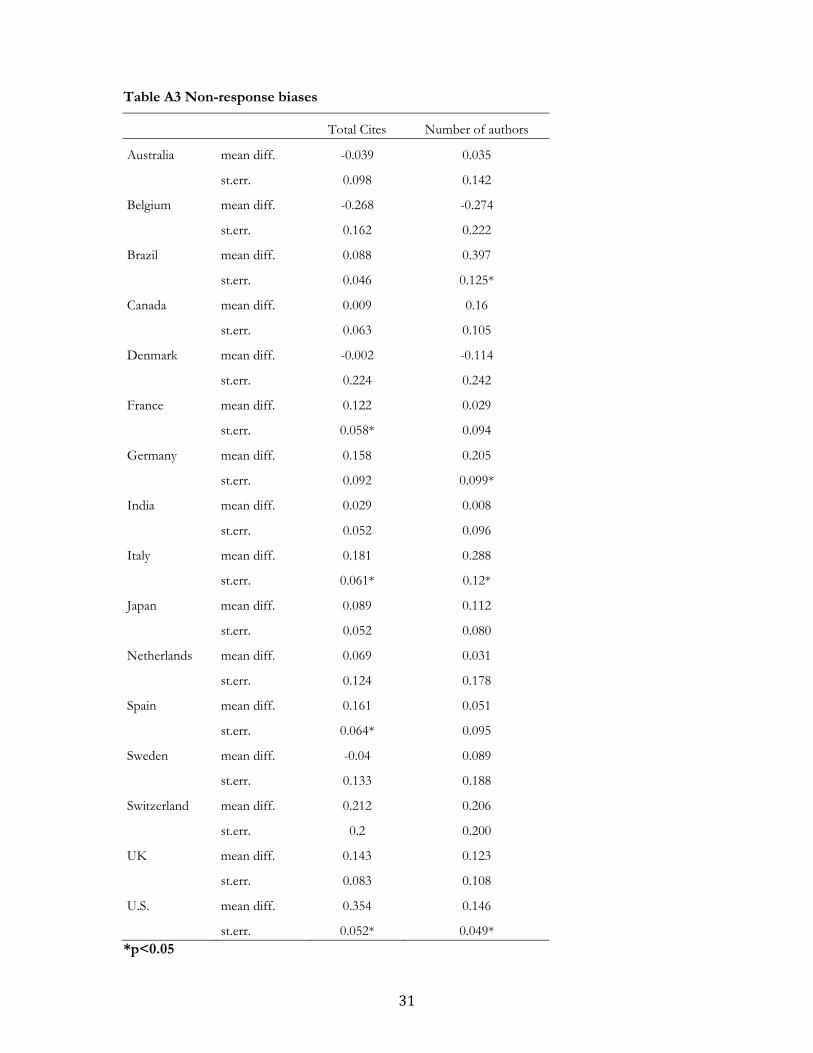
We have assessed non-response bias by comparing respondents against non-respondents. Comparison is done for two characteristics known for the entire panel and sample: total citations received by the underlying article and number of coauthors. Total citations are likely to be positively correlated with the eminence of the scientist and could potentially reflect differentials in the propensity to answer related to how busy the respondent is. Because the number of coauthors was a basis for a branching question in the survey, more coauthors meant that more questions were asked. Therefore, it is potentially associated with dropping out of the survey. Tests for equality of means are performed for each pair of country samples (Table A3). A relatively higher propensity to answer from authors with better-cited papers is found for France, Italy, Spain and the U.S. Authors of papers with more co-authors are also more likely to have answered from Brazil, Germany, Italy and the U.S. Thus, although there is some response bias, it is not in the direction that one might hypothesize.
31
Table A3 Non-response biases
Total Cites Number of authors
Australia mean diff. -0.039 0.035
st.err. 0.098 0.142
Belgium mean diff. -0.268 -0.274
st.err. 0.162 0.222
Brazil mean diff. 0.088 0.397
st.err. 0.046 0.125*
Canada mean diff. 0.009 0.16
st.err. 0.063 0.105
Denmark mean diff. -0.002 -0.114
st.err. 0.224 0.242
France mean diff. 0.122 0.029
st.err. 0.058* 0.094
Germany mean diff. 0.158 0.205
st.err. 0.092 0.099*
India mean diff. 0.029 0.008
st.err. 0.052 0.096
Italy mean diff. 0.181 0.288
st.err. 0.061* 0.12*
Japan mean diff. 0.089 0.112
st.err. 0.052 0.080
Netherlands mean diff. 0.069 0.031
st.err. 0.124 0.178
Spain mean diff. 0.161 0.051
st.err. 0.064* 0.095
Sweden mean diff. -0.04 0.089
st.err. 0.133 0.188
Switzerland mean diff. 0.212 0.206
st.err. 0.2 0.200
UK mean diff. 0.143 0.123
st.err. 0.083 0.108
U.S. mean diff. 0.354 0.146
st.err. 0.052* 0.049* *p<0.05
32
APPENDIX B
Robustness controls: observation weights and missing values
In this appendix we present the results for selected model specifications in which we account for missing values and we use sample weights to account for differential response rates across countries. For a review of the statistical properties and implication of multiple imputation of missing data we refer to Little and Rubin (2002) and Allison (2001)
The standard steps involved in multiple imputation processes are the following (Allison, 2001) : i) impute missing values using an appropriate model that incorporates random variation; ii) repeat the previous step M times, producing M “complete” data sets; iii) perform the statistical analyses on each data set using standard complete-data econometric techniques; iv) average the values of the parameter estimates across the M samples to produce a single point estimate; v) calculate the standard errors by averaging the squared standard errors of the M estimates and calculating the variance of the M parameter estimates across samples. Note that multiple imputation requires that the data must be missing at random (MAR), meaning that the probability of observing missing data on a particular variable Y can depend on other observed variables, but not on Y itself (controlling for the other observed variables).
Concerning the imputation of missing values, we have imputed only the variables age and gender. The imputation procedure is based on the use of predicted values from a Logit model (for the FEMALE dummy variable ) and of an OLS model (for AGE variable).
The specifications used in the imputation models include among the covariates country of residence in 2011, foreign experience ( PhD, postdoc and job), job position, affiliation type, the presence of secondary affiliations, and field of research. The data have been treated using the Multiple Imputation routine of STATA 12. We have generated M=5 imputations for each missing value. Note that due to the application of the multiple imputation procedure, for the subsequent estimates based on standard maximum likelihood methods we have computed standard errors for the estimated coefficients but we cannot derive traditional goodness of fit indicators such as pseudo R-squared
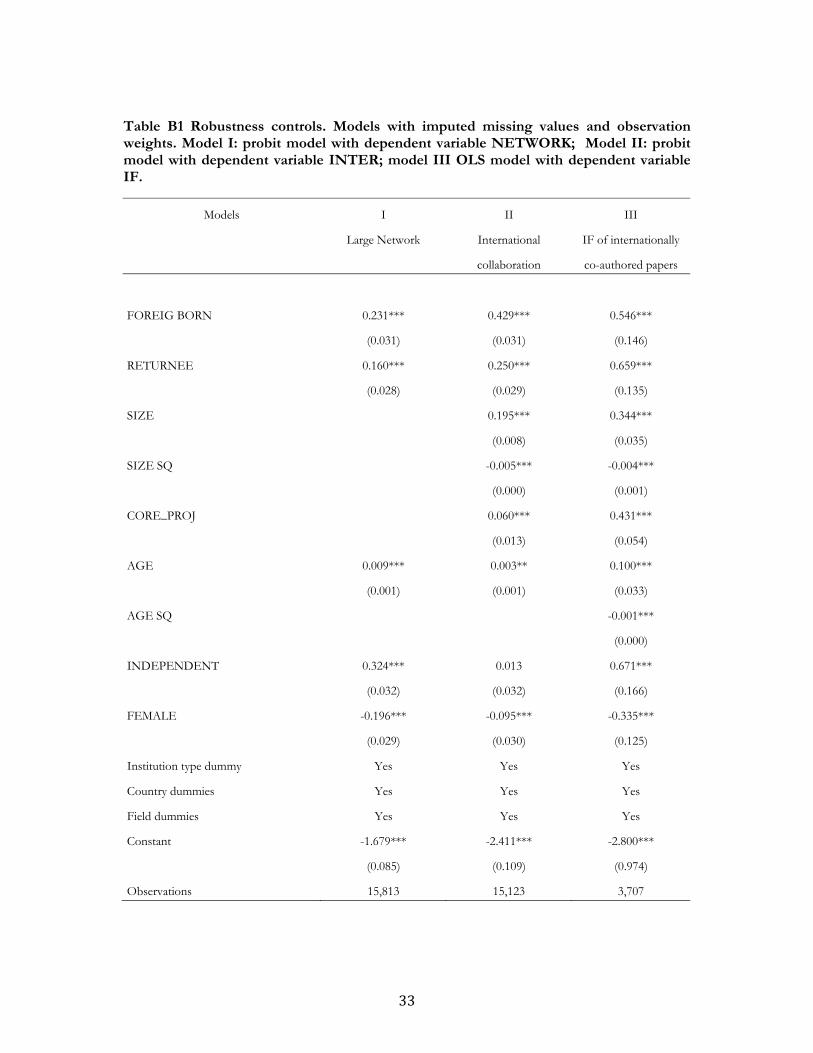
In the set of estimates presented in table B1 we have also included observation weights. The weights are equal for each respondent to the inverse of the complete response rate of the related core-country (see table A1). Of particular interest is the fact that both the foreign-born variable and the returnee variable maintain significance after including imputed variables and observation weights although in the case of the first two models the coefficients are substantially larger. They are approximately the same magnitude when the dependent variable is the Impact Factor.
33
Table B1 Robustness controls. Models with imputed missing values and observation weights. Model I: probit model with dependent variable NETWORK; Model II: probit model with dependent variable INTER; model III OLS model with dependent variable IF.
Models I
Large Network
II
International
collaboration
III
IF of internationally
co-authored papers
FOREIG BORN 0.231*** 0.429*** 0.546***
(0.031) (0.031) (0.146)
RETURNEE 0.160*** 0.250*** 0.659***
(0.028) (0.029) (0.135)
SIZE 0.195*** 0.344***
(0.008) (0.035)
SIZE SQ -0.005*** -0.004***
(0.000) (0.001)
CORE_PROJ 0.060*** 0.431***
(0.013) (0.054)
AGE 0.009*** 0.003** 0.100***
(0.001) (0.001) (0.033)
AGE SQ -0.001***
(0.000)
INDEPENDENT 0.324*** 0.013 0.671***
(0.032) (0.032) (0.166)
FEMALE -0.196*** -0.095*** -0.335***
(0.029) (0.030) (0.125)
Institution type dummy Yes Yes Yes
Country dummies Yes Yes Yes
Field dummies Yes Yes Yes
Constant -1.679*** -2.411*** -2.800***
(0.085) (0.109) (0.974)
Observations 15,813 15,123 3,707