Mobile Radio Propagation Prediction for Two Different...
18
Chapter 2 © 2012 Mahmood, licensee InTech. This is an open access chapter distributed under the terms of the Creative Commons Attribution License (http://creativecommons.org/licenses/by/3.0), which permits unrestricted use, distribution, and reproduction in any medium, provided the original work is properly cited. Mobile Radio Propagation Prediction for Two Different Districts in Mosul-City Farhad E. Mahmood Additional information is available at the end of the chapter http://dx.doi.org/10.5772/46469 1. Introduction Since the nineties, a great progress observed in wireless and mobile communications field. Mobiles make many tasks simple and easily to be accomplished. This requires imperatively good and accurate knowing and describing radio propagation for the intended area. Propagation of mobile radio signals is complex, and depend on the applied environment (Theodore S Rappaport, 2002). In this chapter, two theoretical models considered for the prediction of path loss in two different districts at Mosul city, using MATLAB 7.4 program. The propagation of radio wave of built-up area strongly influenced by the nature of environment, Parameters like antennas height, frequency band, interference, polarization etc, have an influence upon channel behavior. Reflection, diffraction and scattering from building add multipath, fast fading and slow fading effects to the signal. The Walfisch-Ikegami (W-I) model used for uniform heights and similar buildings in the Karama district to calculate the path loss. The other model used is Okumura-Hata (OH) model applied for irregular and dissimilar buildings (M.O. Kabaou 2007) in the Almajmoa'a district. The information buildings heights for two areas obtained from the Civil Engineering Department, in the University of Mosul. 2. Cellular concept The key idea of mobile communication system is to offer possibility for a communication link in the serving area of the mobile network regardless of the location of the user. These demand two requirements for service providers (operators) of mobile communication system. Firstly, the service area has to be geometrically large area in order to provide services for a large number of costumers. Secondly, the network has to be able to guarantee
Transcript of Mobile Radio Propagation Prediction for Two Different...

Chapter 2
© 2012 Mahmood, licensee InTech. This is an open access chapter distributed under the terms of the Creative Commons Attribution License (http://creativecommons.org/licenses/by/3.0), which permits unrestricted use, distribution, and reproduction in any medium, provided the original work is properly cited.
Mobile Radio Propagation Prediction for Two Different Districts in Mosul-City
Farhad E. Mahmood
Additional information is available at the end of the chapter
http://dx.doi.org/10.5772/46469
1. Introduction
Since the nineties, a great progress observed in wireless and mobile communications field. Mobiles make many tasks simple and easily to be accomplished. This requires imperatively good and accurate knowing and describing radio propagation for the intended area. Propagation of mobile radio signals is complex, and depend on the applied environment (Theodore S Rappaport, 2002).
In this chapter, two theoretical models considered for the prediction of path loss in two different districts at Mosul city, using MATLAB 7.4 program. The propagation of radio wave of built-up area strongly influenced by the nature of environment, Parameters like antennas height, frequency band, interference, polarization etc, have an influence upon channel behavior. Reflection, diffraction and scattering from building add multipath, fast fading and slow fading effects to the signal.
The Walfisch-Ikegami (W-I) model used for uniform heights and similar buildings in the Karama district to calculate the path loss. The other model used is Okumura-Hata (OH) model applied for irregular and dissimilar buildings (M.O. Kabaou 2007) in the Almajmoa'a district. The information buildings heights for two areas obtained from the Civil Engineering Department, in the University of Mosul.
2. Cellular concept
The key idea of mobile communication system is to offer possibility for a communication link in the serving area of the mobile network regardless of the location of the user. These demand two requirements for service providers (operators) of mobile communication system. Firstly, the service area has to be geometrically large area in order to provide services for a large number of costumers. Secondly, the network has to be able to guarantee
MATLAB – A Fundamental Tool for Scientific Computing and Engineering Applications – Volume 2 20
mobility, i.e., customers have to be able to move even considerably long distances without breaking already establish connections. Achieving this requirement is technically challenging, and more over there is limited amount of air interface frequency band available (T. Rappaport 2002).
One solution to satisfy these requirements is utilization of cellular concept (Lioh. Wacker. 2006). in cellular concept, the basic approach is to divide a large service area into smaller sub areas called cells. The main advantage of cellular solution is increasing capacity. Since the limited radio frequency, range used only in small areas. The same radio frequency can utilized again after a certain physical distance. Once other advantage is that, the base station antenna heights can be much lower due to smaller serving areas. This enables the usage of lower transmit powers, which also saves the battery of the mobile. Furthermore, change capacity and coverage demands for different area can be easily adopted using smaller cells where the traffic density is higher.
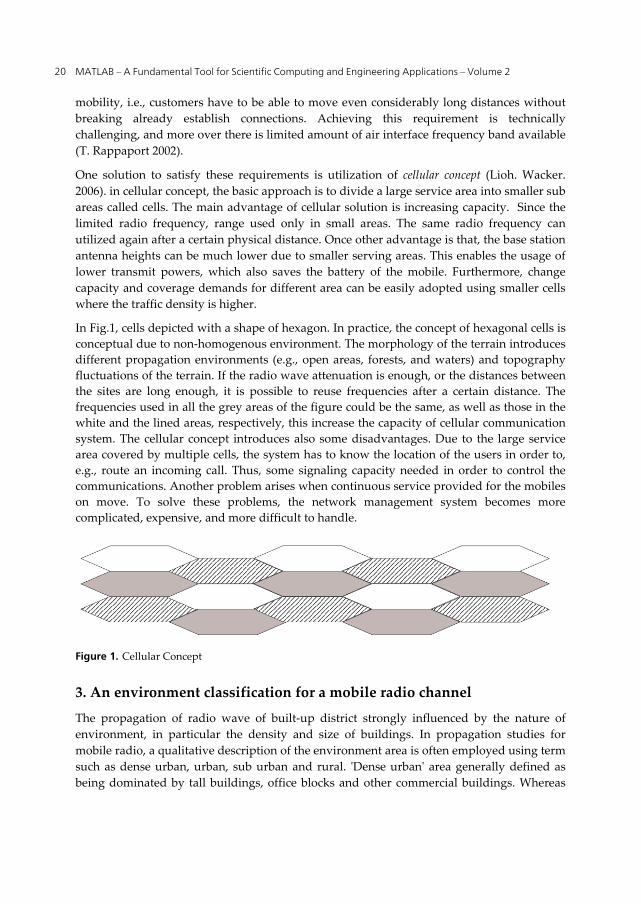
In Fig.1, cells depicted with a shape of hexagon. In practice, the concept of hexagonal cells is conceptual due to non-homogenous environment. The morphology of the terrain introduces different propagation environments (e.g., open areas, forests, and waters) and topography fluctuations of the terrain. If the radio wave attenuation is enough, or the distances between the sites are long enough, it is possible to reuse frequencies after a certain distance. The frequencies used in all the grey areas of the figure could be the same, as well as those in the white and the lined areas, respectively, this increase the capacity of cellular communication system. The cellular concept introduces also some disadvantages. Due to the large service area covered by multiple cells, the system has to know the location of the users in order to, e.g., route an incoming call. Thus, some signaling capacity needed in order to control the communications. Another problem arises when continuous service provided for the mobiles on move. To solve these problems, the network management system becomes more complicated, expensive, and more difficult to handle.
Figure 1. Cellular Concept
3. An environment classification for a mobile radio channel
The propagation of radio wave of built-up district strongly influenced by the nature of environment, in particular the density and size of buildings. In propagation studies for mobile radio, a qualitative description of the environment area is often employed using term such as dense urban, urban, sub urban and rural. 'Dense urban' area generally defined as being dominated by tall buildings, office blocks and other commercial buildings. Whereas

Mobile Radio Propagation Prediction for Two Different Districts in Mosul-City 21
suburban areas comprise residential houses, parks and gardens. The term 'rural' defines open farmland with sparse buildings, forest and woodland. When the effects of environment have been conceder, six factors are useful in classifying land usage (J.D.Parson 2000):
Building density (percentage of area covered by building). Building height. Building size (area covered by building) Building location. Vegetation location. Terrain density.
Mobile radio channels needs a rigorous vision of channel characterization; the study of channel will be useful for mobile wireless communication to make the best decision between source and destination, and even advising recommendations and directives for dimensioning exploited network (antenna heights, carrier, network architecture, etc...).
4. Radio mobile channel characterization
Propagation channel is a linear system defining a transformation between an input and an output signal, for best understanding the channel and overcome its eventual imperfections. In fact, signal affronts many distortions like delays, spreading. These distortions induced by various reflections that signal faces up during the Emission- Reception path. Consequently, other additive signals will be perceived by the receiver besides the main transmitted signal which must be captured in ideal situations. These additional signals have followed various and different paths. That is what usually named: Multipath. With higher rates used in digital communications e.g., symbols have small duration in comparison with the delay spreading scale and a really superposition between them will be observed.
4.1. Multipath propagation
Multipath is a phenomenon that happens in the channel of mobile systems when the transmitted signal arrives at the receiver via different paths due to reflection, diffraction and scattering resulting in fading. There is only one transmitted signal, due to obstacles like buildings, hills, trees, and so on, in the signal paths that cause different signals to arrive at the receiver from various directions with different delays (M. Rahnema 2008). In such situations, receiver will collect light of seen’s (LOS) rays but also other rays having arrived over indirect ways. They know as Non-light of Sight (NLOS) rays. More further, are Emission and the Reception one side from the other, more lower will be chosen the used frequency. Possible paths will consequently be higher. Propagation channel causes then Inter Symbol Interferences (ISI). For that, the parameter conditioning propagation delay spread values must imperatively specify. Fig. 2. illustrates three propagation components.

MATLAB – A Fundamental Tool for Scientific Computing and Engineering Applications – Volume 2 22
Figure 2. Propagation Component between Base Station and Mobile Station
Where (L. Poole 2006):
Path loss: decay of the signal strength with distance. Slow fading (Shadowing): is due to obstruction of the signal by natural obstacles. Fast fading: due to the multipath reflection of the transmitted signal.
Signals coming from the same source will arrive to at the receiver side affected by different delays. Delay spread evaluated as (S. Tabbane 2000):
Multipathspread = (1)
Where c commonly known light celerity. Table below shows and gives better and more accurate idea.
Environment type Delay spread (s) Free space < 0.2 Rural area 1 Mountainous area 30 to 50 Suburban area 0.5
Urban area 3 Indoor area 0.1
Table 1. Comparison of delay spread in different environments.
We can particularly note that delays caused indoor are fewer than other referred to abroad situations (some tens of s) (M. J. Nawrocki 2006). For that, a suitable modeling must accomplished for each situation often named Indoor/Outdoor. Therefore, the channel has many dimensions, giving a particular description as indicated in the fig. 3. (V. Erceg 2005)
Parameters like antennas heights, frequency band, interference, polarization etc, and have an influence upon channel behavior indicated above in the fig. 3.

Mobile Radio Propagation Prediction for Two Different Districts in Mosul-City 23
Figure 3. Channel characterization versus different vision
Direction and distance between reflectors (buildings, mountains, walls, cars) influence channel awkward and followed channel. The IR of a dispersive delay channel depends then on number of physical factors. The delay spread value varies from ten nanoseconds for indoor propagation up to some microseconds in outdoor propagation case as indicated in Table 1 for different areas and situations (J.D.Parson 2000).
4.2. Slow and fast fading
In addition to distance dependent path loss, the received signal level experiences also fluctuations that called slow and fast fading. When the receiver placed in, a coverage area that either omits the LOS component or other dominant component, the receiver is considered shadowed. Usually these shadowing obstacles are big trees, buildings, or in rural environment the hills. Slow fading is shown to follow log-normal distribution, and thus it is also called log-normal fading.
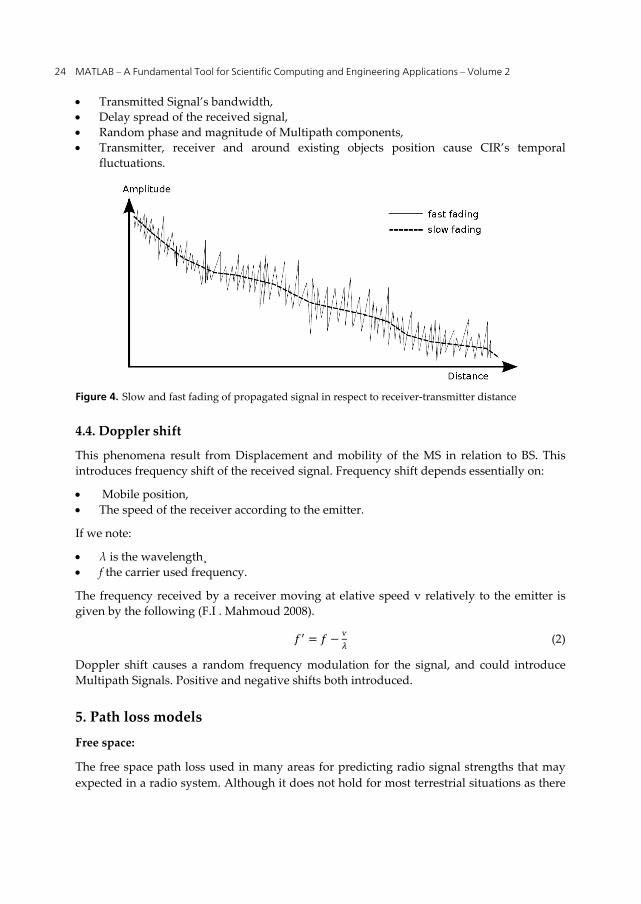
Fast fading is a consequence of the multipath propagation phenomena. As described earlier, the multipath propagated signal components can received either constructively or de-constructively depending on the relative phase difference between the components. This causes very rapid fluctuations in the received signal level. Slow and fast fading components of received signal illustrated in Fig.4. in respect to receiver-transmitter distance.
4.3. Rayleigh fading
After reflection, the phases and magnitude of the radio wave might be attaint attenuation or fading phenomena cause essentially temporal variations in phases. These come from additive multiple signals In this case; the resulting received signal in the receiver could be null or a very weak signal. Multiple received signals could also add in a constructive manner and the resulting received signal will have a magnitude greater than signal issued along directly path. Taking account of propagation conditions’s variation between kinds of domains, we must note fading depends on the following (J. S. Seybold 2005):
MATLAB – A Fundamental Tool for Scientific Computing and Engineering Applications – Volume 2 24
Transmitted Signal’s bandwidth, Delay spread of the received signal, Random phase and magnitude of Multipath components, Transmitter, receiver and around existing objects position cause CIR’s temporal
fluctuations.
Figure 4. Slow and fast fading of propagated signal in respect to receiver-transmitter distance
4.4. Doppler shift
This phenomena result from Displacement and mobility of the MS in relation to BS. This introduces frequency shift of the received signal. Frequency shift depends essentially on:
Mobile position, The speed of the receiver according to the emitter.
If we note:
λ is the wavelength¸ f the carrier used frequency.
The frequency received by a receiver moving at elative speed ѵ relatively to the emitter is given by the following (F.I . Mahmoud 2008).
= − ѵ (2)
Doppler shift causes a random frequency modulation for the signal, and could introduce Multipath Signals. Positive and negative shifts both introduced.
5. Path loss models
Free space:
The free space path loss used in many areas for predicting radio signal strengths that may expected in a radio system. Although it does not hold for most terrestrial situations as there

Mobile Radio Propagation Prediction for Two Different Districts in Mosul-City 25
are several situations in which it can be used and it also useful as the basis for understanding many real life radio propagation situations.
Calculation of free-space path loss:
The free space path loss formula or free space path loss equation is quite simple to use. Not only is the path loss proportional to the square of the distance between the transmitter and receiver, but the signal level is also proportional to the square of the frequency (T. Rappaport, 2002).
= (4 / )^2 (3)
Where:
FSPL is the Free space path loss
d is the distance of the receiver from the transmitter (metres) λ is the signal wavelength (metres) f is the signal frequency (Hertz) c is the speed of light in a vacuum (metres per second)
due to multipath effect and fading it cannot depend on free space formula to find path loss there are empirical model used to find path loss.
Methods to model the mobile radio propagation channel are (M.O. Kabaou 2007):
Statistical models ,like (Okumura-Hata) , Physical Models ,like (Walfisch-Ikegami), Mixed Models, In addition, References Models.
We study only the first two cases.
5.1. Okumura-Hata Model (OH), statistical models
Okumura-Hata Model is an Empirical model; which based on a Statistical Analysis of a great number of experimental measures that takes in account many parameters such as buildings, Base stations (BS) and Mobile stations heights (S.A.Mawjoud 2008). The model based on the field measurements made by Okumura in Tokyo in 1968. Okumura’s measurements were later fitted in a mathematical formula by Hata . The Okumura-Hata model is valid for frequency range of 150–1500 MHz, the BS height is 30-200m, the MS height is 1-10m and the distance is 1-20km. Because of the frequency band limitation of the Okumura-Hata model, the original model was later extended by the European CO-operation in the field of Scientific and Technical research (COST 231) to the frequency band of 1500–2000 MHz , which covers the bands allocated to the 3G networks (E. Damasso 1999), is given in equation (4) ( )( ) =46.3 + 33.9 ( ) − 13.82 log(ℎ ) − (ℎ ) + (44.9 − 6.55 log(ℎ )) log( ) (4)

MATLAB – A Fundamental Tool for Scientific Computing and Engineering Applications – Volume 2 26
Where:
is the operating frequency in MHz (1500 MHz -2000 MHz). ℎ the base station(BS) antenna height in meter (30m- 200m). ℎ the mobile(MS) antenna height in meter (1m – 10m) . the distance between BS and MS in km. (ℎ ) the correction factor for mobile antenna height which is given by:
(ℎ ) = (1.1 log( ) − 0.7)ℎ − 1.56 log( ) − 0.8 (5)
Where: 1 m ≤hm ≤ 10 m
Equation (3) is an extension version of original Hata model to work up to 2GHz by The European comparative for scientific and technical research (EURO-COST) (M. J. Nawrocki 2006).
The BS antenna height must be above the rooftop level of the buildings adjacent to the BS. Thus, the model is proposed to be used in propagation studies of macro-cells. There are several weaknesses in the empirical or semi-empirical models for propagation studies in micro-cellular environments. If the BS antenna height is below the level of the rooftop of surrounding buildings, the nature of the propagation phenomena will changes. This situation cannot be analyzed with statistical methods because the individual buildings are too large compared with the cell size and the exact geometrical properties of the buildings can no longer be ignored as they can in macro cellular models.
5.2. Walfisch-Ikegami Model (W-I) physical models
This model based on the assumption that the transmitted wave propagates over the rooftops by a process of multiple diffraction in regular area, regular area has rows of buildings, which are nearly of equal and uniform height and are located on flat terrain. The building are organized along the street grid with little or no side-to-side spacing and nearly equal front-to-front and back-to-back spacing. The propagation takes place primarily over building (T. Rappaport. 2002). The model considers the impact on rooftops and building heights using diffraction to predict average signal strength at street level. The models consider the path loss (L) to be the product of three factors (J.D.Parson 2000):
Free space loss. Losses added by diffraction. Losses introduced by rooftops near the studied area.
The geometry used in the Walfisch model shown in fig.5.
From fig. 5, it can be noted that the diffracted signals arrive at the receiver from the 1st, 2nd and 3rd as if the model show that the signals travels from rooftops.
This model depends on:
1. The height of the buildings. 2. The width of the streets and the width of the buildings.

Mobile Radio Propagation Prediction for Two Different Districts in Mosul-City 27
3. The distance between buildings. 4. The orientation of the streets relative to the line of sight (LOS) and non line of sight (NLOS). 5. The distance between the Tx. and receiver Rx, the heights of Tx. and Rx. antennas and
the frequency of operation.
Figure 5. Propagation geometry for Walfisch– Ikegami model
COST 231 Walfisch–Ikegami (WI) model is the most widely used empirical model today, being an extension of the models from J. Walfisch and F. Ikegami. To work up to 2GHz by The European comparative for scientific and technical, research (EURO-COST). It has been adopted as a standard model for 3G IMT 2000/UMTS systems. It is valid within the following constraints:
BS height: 4–50m. MS height: 1–3m. BS to MS separation : 0.02–5 km.
The Walfisch – Ikegami equation is given by:
L=LO +Lrts+Lmsd (6)
Where: LO : free space loss. Lrts : rooftop to street diffraction and scatter loss. Lmsd : multi screen diffraction loss due to the rows of building .
= 32.4 + 20 log + 20 (7)
= −16.9 − 10 log + 10 + 20 log ℎ − ℎ − (8)
Where: ℎ : The height of the buildings.
10 0.354 for 0 35deg
2.5 0.075 35 for 35 <55deg
4.0-0.114 55 for 55 <90deg
oriL
(9)
MATLAB – A Fundamental Tool for Scientific Computing and Engineering Applications – Volume 2 28
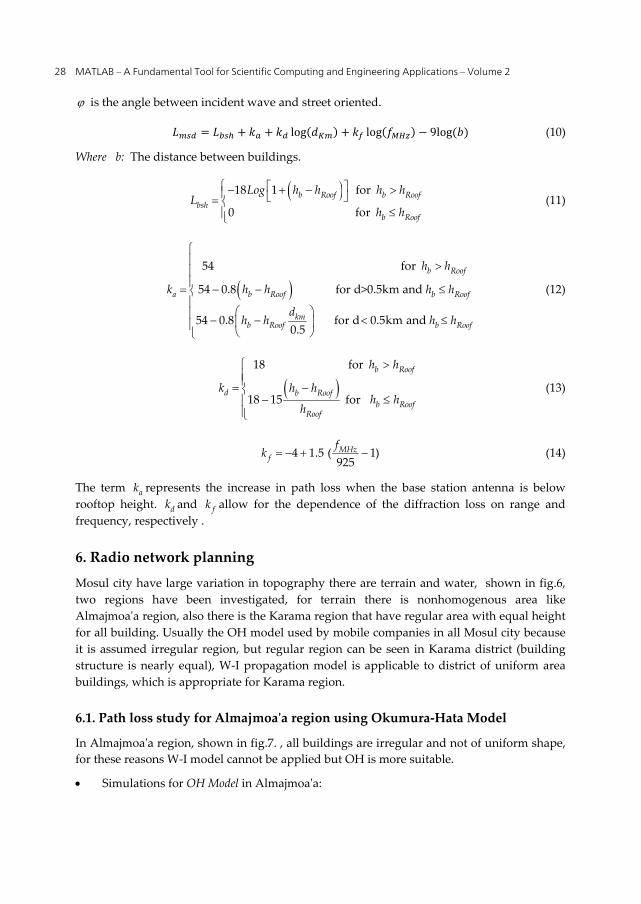
is the angle between incident wave and street oriented.
= + + log( ) + log( ) − 9log( ) (10)Where b: The distance between buildings.
18 1 for
0 forb Roof b Roof
bshb Roof
Log h h h hL
h h
(11)
54 for
54 0.8 for d>0.5km and
54 0.8 for d 0.5km and 0.5
b Roof
a b Roof b Roof
kmb Roof b Roof
h h
k h h h h
dh h h h
(12)
18 for
18 15 for
b Roof
d b Roofb Roof
Roof
h h
k h hh h
h
(13)
4 1.5 ( 1)925MHz
ff
k (14)
The term ak represents the increase in path loss when the base station antenna is below rooftop height. dk and fk allow for the dependence of the diffraction loss on range and frequency, respectively .
6. Radio network planning
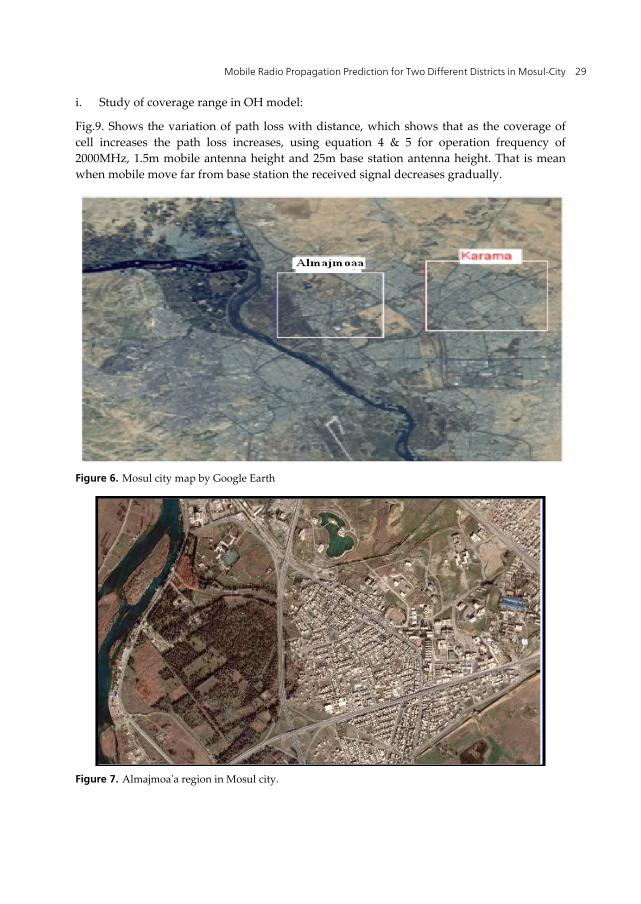
Mosul city have large variation in topography there are terrain and water, shown in fig.6, two regions have been investigated, for terrain there is nonhomogenous area like Almajmoa'a region, also there is the Karama region that have regular area with equal height for all building. Usually the OH model used by mobile companies in all Mosul city because it is assumed irregular region, but regular region can be seen in Karama district (building structure is nearly equal), W-I propagation model is applicable to district of uniform area buildings, which is appropriate for Karama region.
6.1. Path loss study for Almajmoa'a region using Okumura-Hata Model
In Almajmoa'a region, shown in fig.7. , all buildings are irregular and not of uniform shape, for these reasons W-I model cannot be applied but OH is more suitable.
Simulations for OH Model in Almajmoa'a:
Mobile Radio Propagation Prediction for Two Different Districts in Mosul-City 29
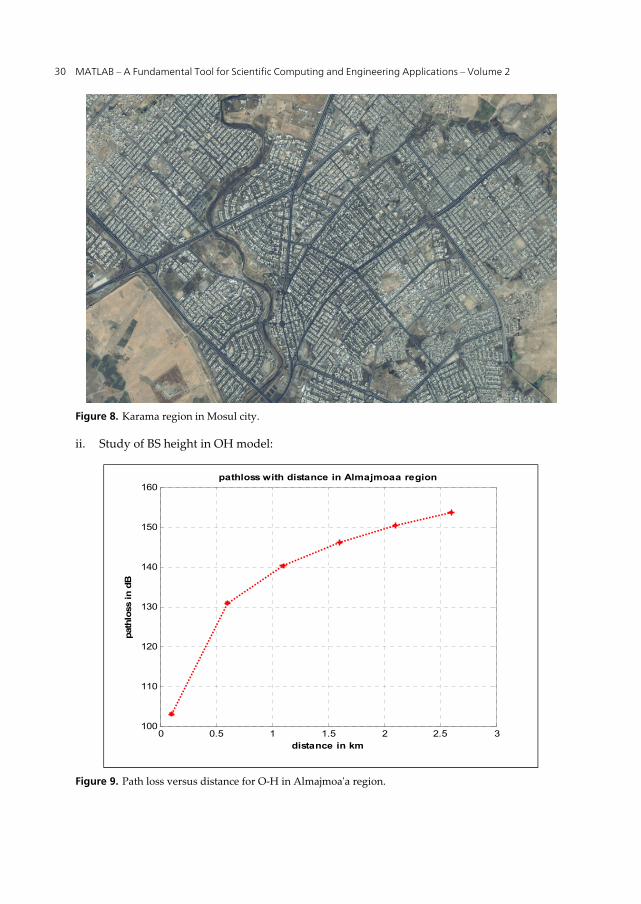
i. Study of coverage range in OH model:
Fig.9. Shows the variation of path loss with distance, which shows that as the coverage of cell increases the path loss increases, using equation 4 & 5 for operation frequency of 2000MHz, 1.5m mobile antenna height and 25m base station antenna height. That is mean when mobile move far from base station the received signal decreases gradually.
Figure 6. Mosul city map by Google Earth
Figure 7. Almajmoa'a region in Mosul city.
MATLAB – A Fundamental Tool for Scientific Computing and Engineering Applications – Volume 2 30
Figure 8. Karama region in Mosul city.
ii. Study of BS height in OH model:
Figure 9. Path loss versus distance for O-H in Almajmoa'a region.
0 0.5 1 1.5 2 2.5 3100
110
120
130
140
150
160
distance in km
path
loss
in d
B
pathloss with distance in Almajmoaa region
Mobile Radio Propagation Prediction for Two Different Districts in Mosul-City 31
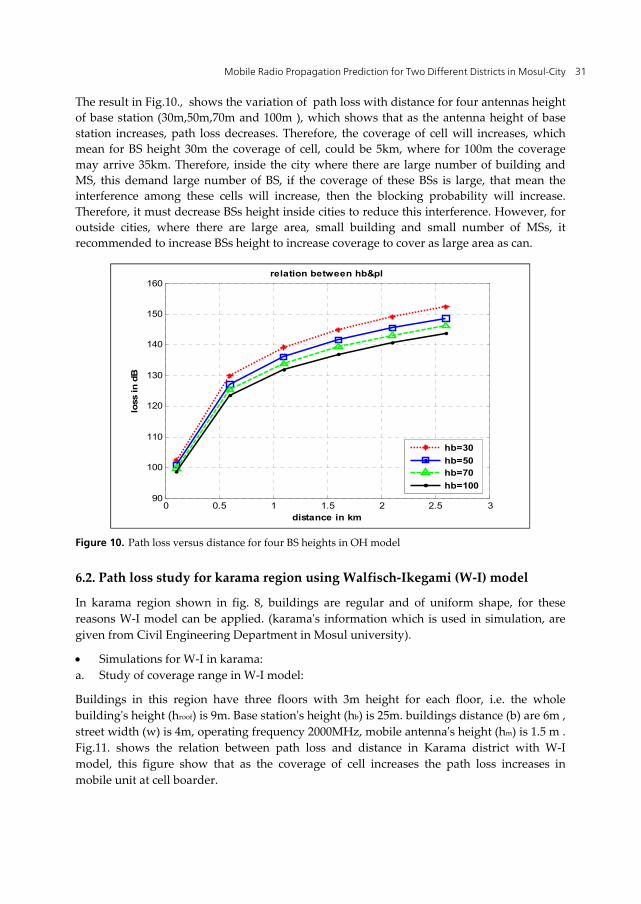
The result in Fig.10., shows the variation of path loss with distance for four antennas height of base station (30m,50m,70m and 100m ), which shows that as the antenna height of base station increases, path loss decreases. Therefore, the coverage of cell will increases, which mean for BS height 30m the coverage of cell, could be 5km, where for 100m the coverage may arrive 35km. Therefore, inside the city where there are large number of building and MS, this demand large number of BS, if the coverage of these BSs is large, that mean the interference among these cells will increase, then the blocking probability will increase. Therefore, it must decrease BSs height inside cities to reduce this interference. However, for outside cities, where there are large area, small building and small number of MSs, it recommended to increase BSs height to increase coverage to cover as large area as can.
Figure 10. Path loss versus distance for four BS heights in OH model
6.2. Path loss study for karama region using Walfisch-Ikegami (W-I) model
In karama region shown in fig. 8, buildings are regular and of uniform shape, for these reasons W-I model can be applied. (karama's information which is used in simulation, are given from Civil Engineering Department in Mosul university).
Simulations for W-I in karama: a. Study of coverage range in W-I model:
Buildings in this region have three floors with 3m height for each floor, i.e. the whole building's height (hroof) is 9m. Base station's height (hb) is 25m. buildings distance (b) are 6m , street width (w) is 4m, operating frequency 2000MHz, mobile antenna's height (hm) is 1.5 m . Fig.11. shows the relation between path loss and distance in Karama district with W-I model, this figure show that as the coverage of cell increases the path loss increases in mobile unit at cell boarder.
0 0.5 1 1.5 2 2.5 390
100
110
120
130
140
150
160
distance in km
loss
in d
B
relation between hb&pl
hb=30hb=50hb=70hb=100

MATLAB – A Fundamental Tool for Scientific Computing and Engineering Applications – Volume 2 32
Figure 11. Path loss versus distance for W-I in Karama
b. Study of BS height in W-I model :
Fig.12. shows the variation of path loss with distance for three BSs height (hb=25m>hroof , hb=9m= hroof & hb=5m<hroof) this figure shows that to reduce the path loss they must increase BS height to become higher than buildings height, to avoid reflection from buildings .
Figure 12. Path loss versus distance for different BS heights.
0 0.5 1 1.5 2 2.5 380
90
100
110
120
130
140
150
160
170
distance in km
path
loss
in d
B
pathloss vs. distance in Karama region
0 0.5 1 1.5 2 2.5 390
100
110
120
130
140
150
160
170
180
190
distance in km
path
loss
in d
B
pathloss vs. distance in three case[hb>hr,hb=hr,hb<hr]
hBS < hroofhBS = hroofhBS > hroof

Mobile Radio Propagation Prediction for Two Different Districts in Mosul-City 33
The BS height larger than rooftop case, it can be seen that there are difference by about 20 dB from rooftop BS height, regardless of distance between BS and MS.
However, for BS height less than rooftop the difference in bath loss increase gradually to be 10 dB at 3km, where in 600 meter the difference could be zero.
7. Comparison between O-H and W-I
The simulation results of the two different districts considered are shown in fig.13. (for same BS and MS antenna height and same operating frequency),which shows that Karama region using W-I model have larger path loss than Almajmoa'a region using OH model about 7 -10dB, because of rooftop and multi-screen effects in karama region which makes more diffraction for signal.
Figure 13. Path loss versus distance in karama and Almajmoa'a regions
0 0.5 1 1.5 2 2.5 3120
125
130
135
140
145
150
155
160
165
distance in km
path
loss
in d
B
Distance effect on Almajmoaa and karama regions
karama districtAlmajmoaa district

MATLAB – A Fundamental Tool for Scientific Computing and Engineering Applications – Volume 2 34
The path loss verses base stations height for O-H model and W-I model is shown in fig. 14., this result show that the path loss verses BS antenna height in karama district is higher than that for Almajmoa'a district, which can be attributed to high signal diffraction on roof top in karama region, and this figure shows that the decrease path loss in karama region greater than that in Almajmoa'a region by 7dB, due to the signals in karama region are release from rooftop and multi-screen effects for increasing BS height over the rooftop of karama regular buildings.
Figure 14. Path loss versus BS antenna height.
15 20 25 30 35 40 45 50150
152
154
156
158
160
162
164
166
168
170
BS antenna height (m)
path
loss
in d
B
pathloss vs. BS antenna height for Almajmoaa and karama regions
karama districtAlmajmoaa district
Mobile Radio Propagation Prediction for Two Different Districts in Mosul-City 35
8. Conclusions
In this study, two districts in Mosul city were investigated, one (Karama district) which has large number of similar and uniform building, Walfisch-Ikegami model is used which is suitable for radio network planning. The other is the Almajmoa'a district, which has dissimilar and irregular building, and less buildings density than Karama, Okumura-Hata model is applicable. Statistical Models are easier to be used than the physical ones. They do not need e.g. geographic databases. However, validity domain is often limited: Okumura-Hata model cannot be used for distances less than 1 km.
Author details
Farhad E. Mahmood Electrical Department, College of Engineering, University of Mosul, Iraq
9. References
Theodore S Rappaport, “Wireless communications principles and practice”. John Wiely&Sons, 2002.
J.D.Parson '' The mobile radio propagation channel '' second edition . John Wiely&Sons, 2000.
M.O. Kabaou."Multipath propagation models for radio mobile channel " Fourth international multi-conference on systems ,signals & devices .vol .3 2007 . Tunisia .
S.A.Mawjoud "Estimation of design parameters for cellular WCDMA network" .AL- Rafidain engineering journal .vol 16. No .4 . Oct. 2008.
M. J. Nawrocki M. Dohler "Understanding UMTS Radio Network Modelling, Planning and Automated Optimisation" John Wiley & Sons Ltd . 2006.
F.I . Mahmoud & S.A.Mawjoud " planning and design of a WCDMA network compatible with existing GSM system in Mosul city " 5th international multi-conference on systems ,signals & devices. IEEE . 2008. Jordan .
M. Rahnema, "UMTS Network Planning Optimization, and Inter-Operation with GSM", First Edition, John Wiley and Sons (Asia) Ltd, India, 2008.
L. Poole, "Cellular Communications Explained from Basics to 3G", First Edition, Elsevier Ltd, England, 2006.
S. Tabbane. Handbook of Mobile Radio Networks. Artech House Boston London, 2000. V. Erceg. Channels Modeling suitable for MBWA. Activity report, Junary 2003. J. S. Seybold, Introduction to RF Propagation. Wiley-IEEE, 2005. E. Damasso and L. M. Correia, Eds., Digital Mobile Radio towards Future Generation
Systems, COST 231 Final Report, 1999. H. Holma and A. Toskala, WCDMA for UMTS: HSPA Evolution and LTE, 4th ed. John
Wiley & Sons, 2007.

MATLAB – A Fundamental Tool for Scientific Computing and Engineering Applications – Volume 2 36
J. Laiho, A. Wacker, and T. Novosad, Radio Network Planning and Optimisation for UMTS, 2nd ed. John Wiley & Sons, 2006.