
Mobile Performance Testing Crash Course
62
T11 Session 4/16/2015 3:15 PM " Mobile Performance Testing Crash Course" Presented by: Dustin Whittle AppDynamics Brought to you by: 340 Corporate Way, Suite 300, Orange Park, FL 32073 8882688770 9042780524 [email protected] www.sqe.com
-
Upload
techwellpresentations -
Category
Software
-
view
33 -
download
5
Transcript of Mobile Performance Testing Crash Course

T11 Session 4/16/2015 3:15 PM
" Mobile Performance Testing
Crash Course"
Presented by:
Dustin Whittle
AppDynamics
Brought to you by:
340 Corporate Way, Suite 300, Orange Park, FL 32073 888-‐268-‐8770 ·∙ 904-‐278-‐0524 ·∙ [email protected] ·∙ www.sqe.com

Dustin Whittle
AppDynamics Dustin Whittle is a developer evangelist at AppDynamics where he focuses on helping organizations manage application performance. Dustin was previously CTO at Kwarter, a consultant at SensioLabs, and developer evangelist at Yahoo!. He has experience building and leading engineering teams and working with developers and partners to scale web platforms. When not working, Dustin enjoys flying, sailing, diving, golfing, and traveling around the world. Find out more at dustinwhittle.com or follow him @dustinwhittle.

Performance Testing Crash Course
Dustin Whittle / dustinwhittle.com / @dustinwhittle
The performance of your application affects your business more than you might think. Top engineering organizations think of performance not as a nice-to-have, but as a crucial feature of their product. Those
organizations understand that performance has a direct impact on user experience and, ultimately, their bottom line. Unfortunately, most engineering teams do not regularly test the performance and
scalability of their infrastructure. Join this session to find out about the latest performance testing tools
and why your team should add performance testing to your agile development process.
Agenda• Why performance matters?
• Case studies on business impact of performance
• Tools of the trade
• MultiMechanize
• Bees with Machine Guns
• Google PageSpeed
• AppDynamics
• Best practices
• Server Side
• Client Side
• Integrating into your process
• Develop -> Test -> Deploy -> Repeat
• What was the performance impact the last release?
• What about the impact of that configuration change or package upgrade?
Dustin Whittle
• dustinwhittle.com
• @dustinwhittle
• San Francisco, California, USA
• Technologist, Traveler, Pilot, Skier, Diver, Sailor, Golfer
What I have worked on
• Developer Evangelist @
• Consultant & Trainer @
• Developer Evangelist @
Why does performance matter?
Microsoft found that Bing searches that were 2 seconds slower
resulted in a 4.3% drop in revenue per user
When Mozilla shaved 2.2 seconds off their landing page, Firefox downloads increased 15.4%
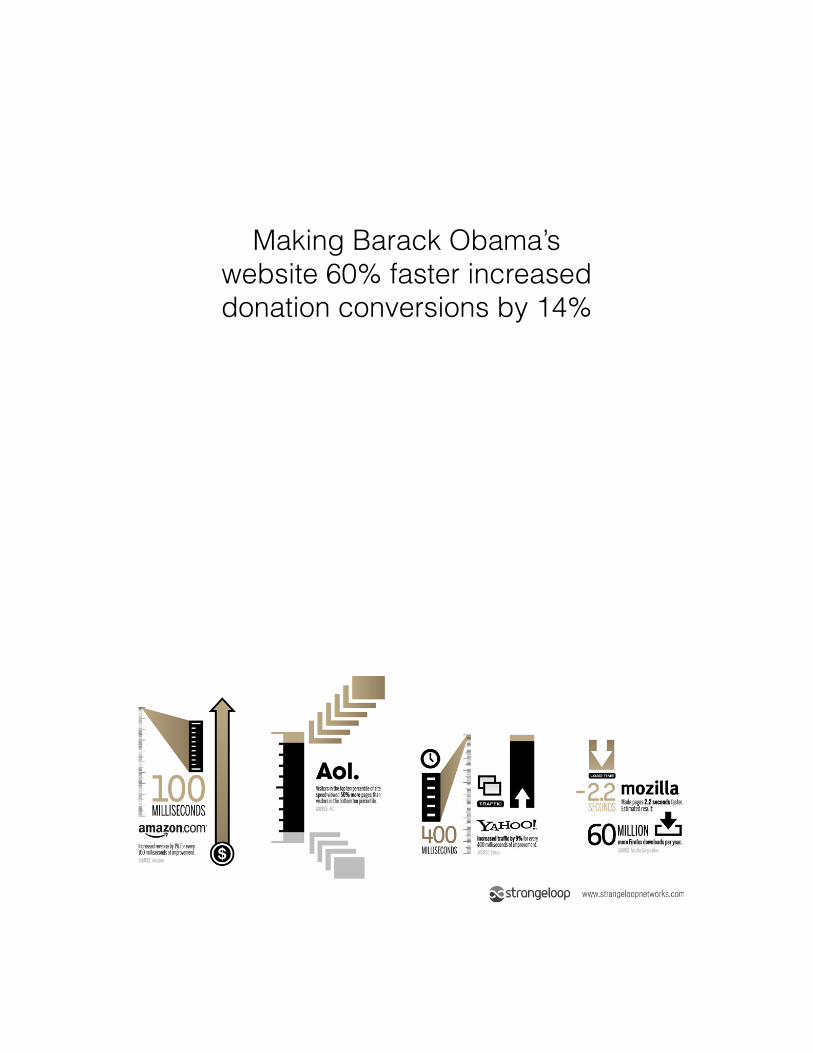
Making Barack Obama’s website 60% faster increased donation conversions by 14%
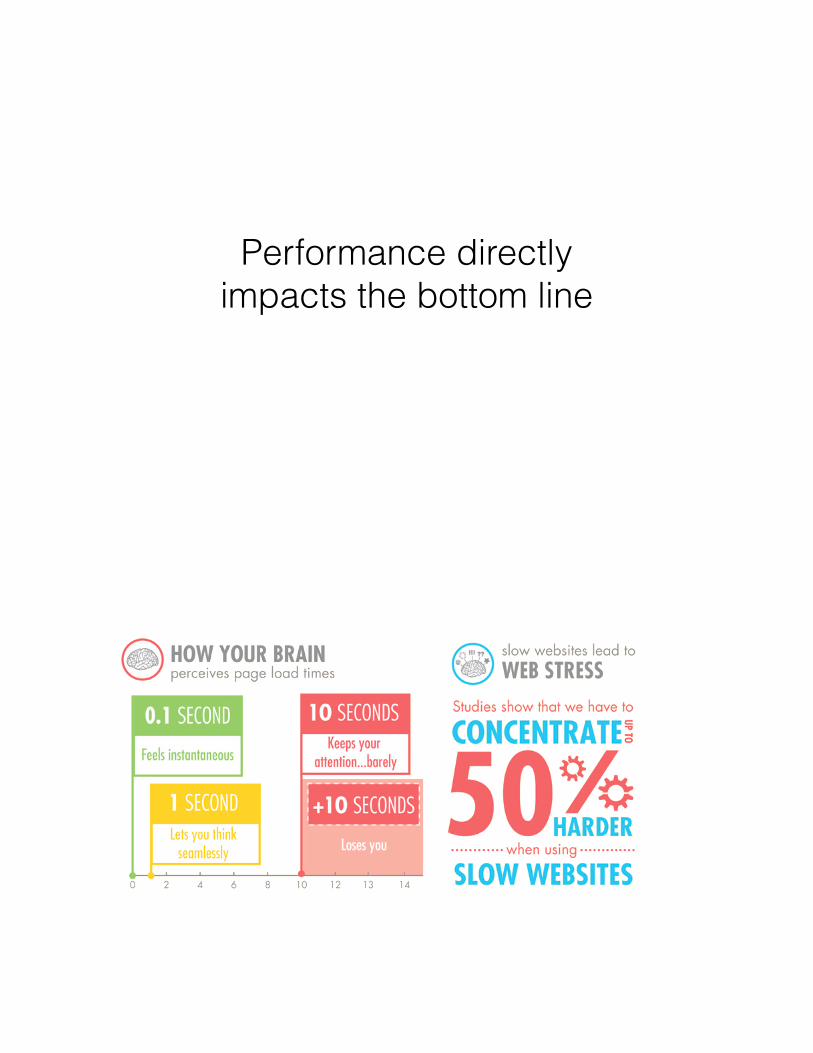
Performance directly impacts the bottom line
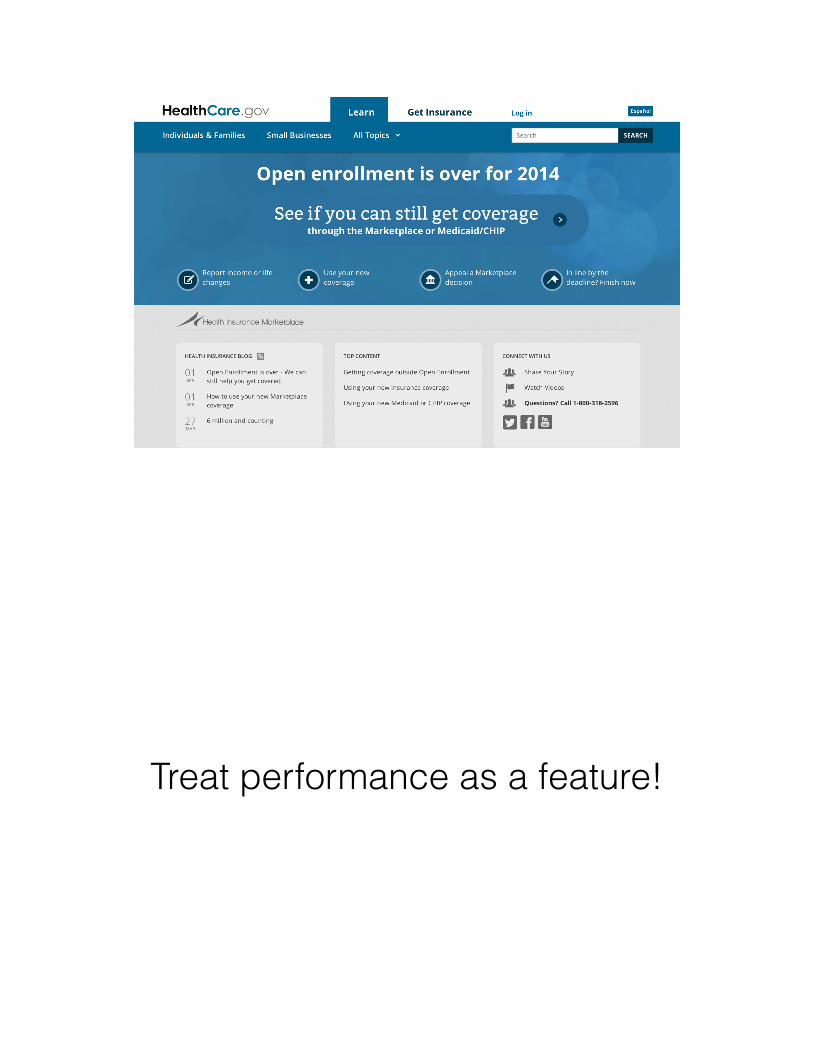
HealthCare.gov
Treat performance as a feature!
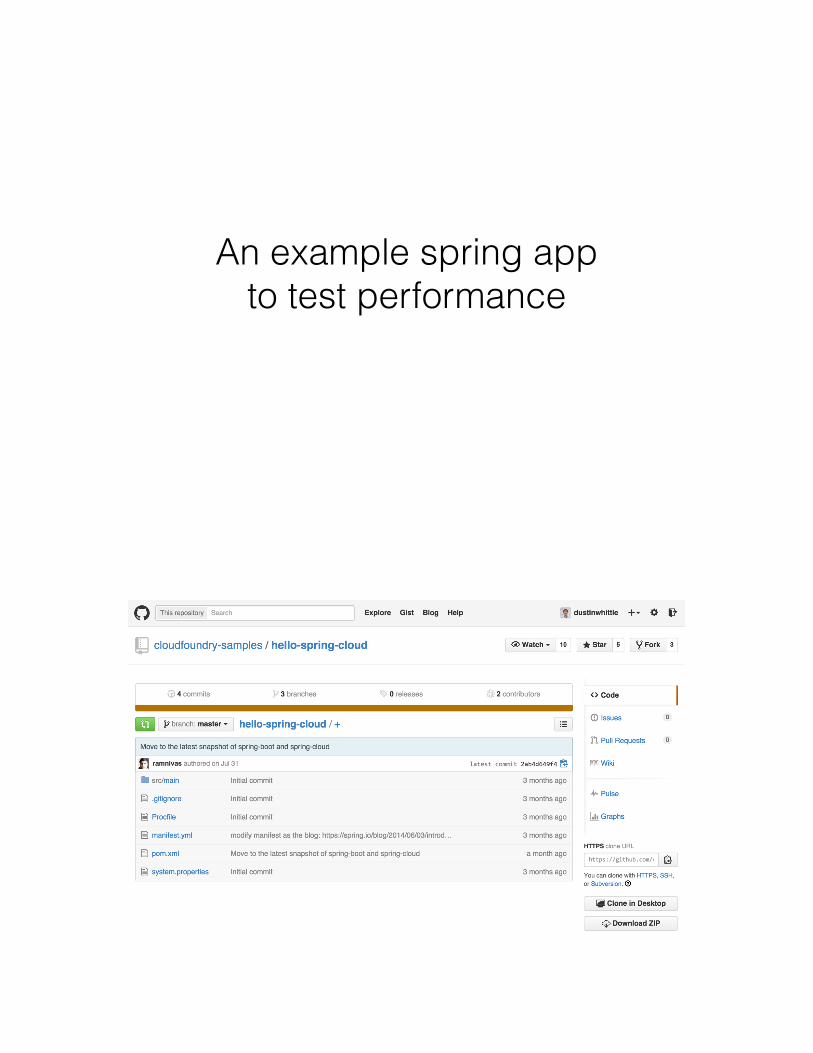
An example spring app to test performance
git clone https://github.com/cloudfoundry-samples/hello-spring-cloud
mvn package
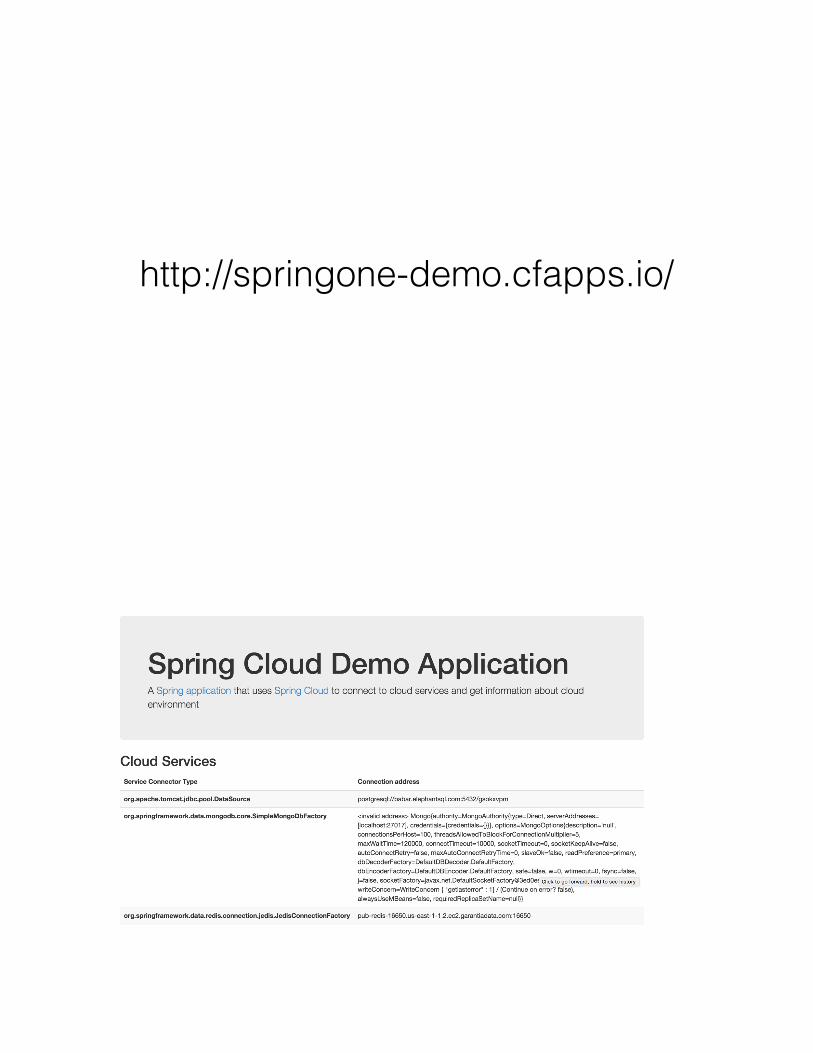
http://springone-demo.cfapps.io/
Tools of the trade for performance testing
Understand your baseline performance
Static
vs
Hello World
vs
Applications
Apache Bench
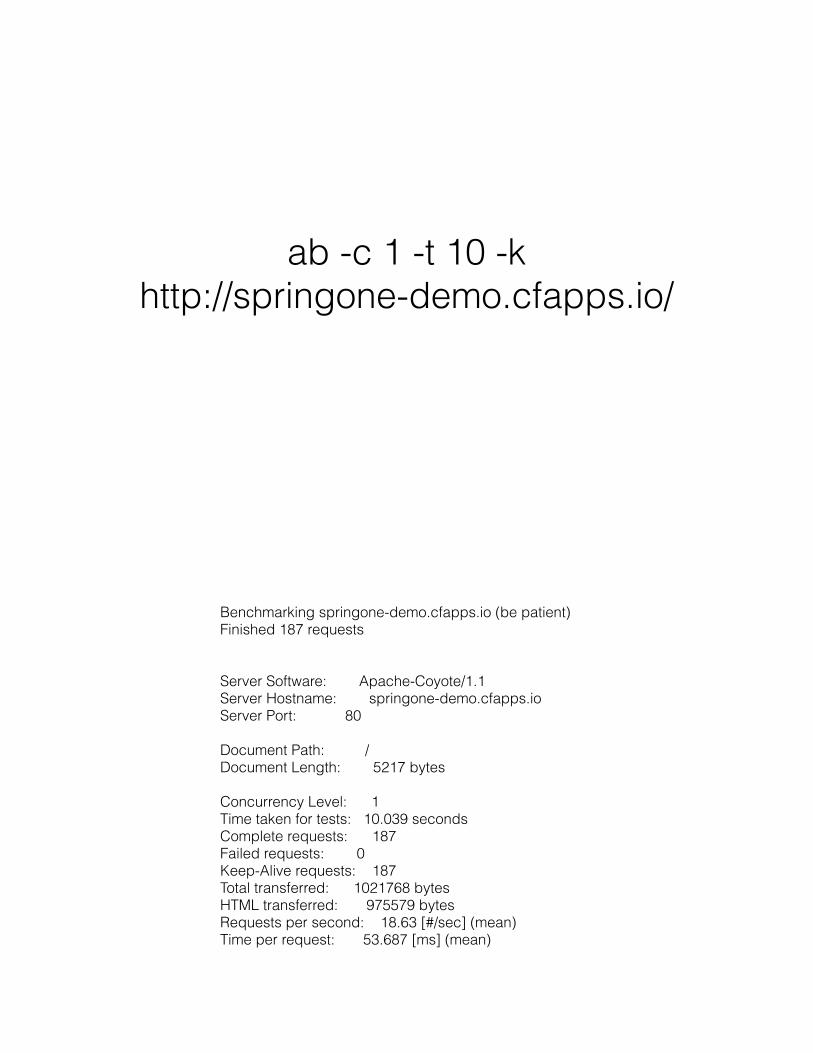
ab -c 1 -t 10 -k http://springone-demo.cfapps.io/
Benchmarking springone-demo.cfapps.io (be patient) Finished 187 requests
Server Software: Apache-Coyote/1.1 Server Hostname: springone-demo.cfapps.io Server Port: 80
Document Path: / Document Length: 5217 bytes
Concurrency Level: 1 Time taken for tests: 10.039 seconds Complete requests: 187 Failed requests: 0 Keep-Alive requests: 187 Total transferred: 1021768 bytes HTML transferred: 975579 bytes Requests per second: 18.63 [#/sec] (mean) Time per request: 53.687 [ms] (mean)
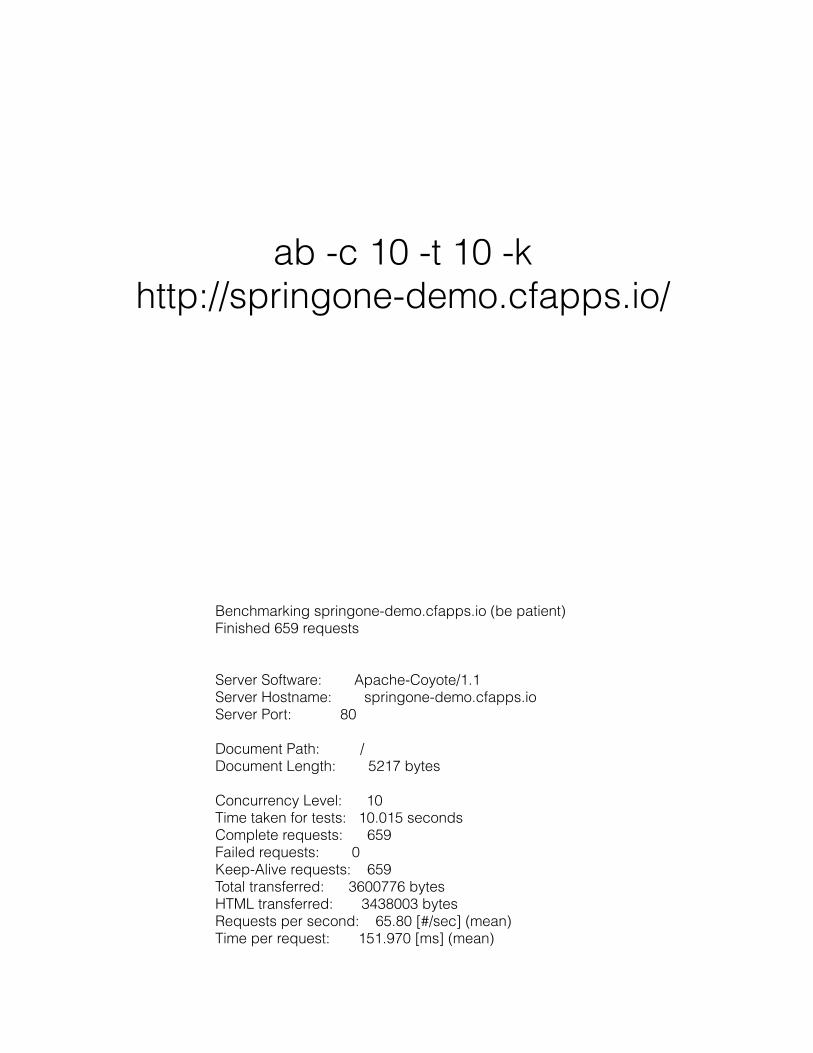
ab -c 10 -t 10 -k http://springone-demo.cfapps.io/
Benchmarking springone-demo.cfapps.io (be patient) Finished 659 requests
Server Software: Apache-Coyote/1.1 Server Hostname: springone-demo.cfapps.io Server Port: 80
Document Path: / Document Length: 5217 bytes
Concurrency Level: 10 Time taken for tests: 10.015 seconds Complete requests: 659 Failed requests: 0 Keep-Alive requests: 659 Total transferred: 3600776 bytes HTML transferred: 3438003 bytes Requests per second: 65.80 [#/sec] (mean) Time per request: 151.970 [ms] (mean)

Siege
siege -c 10 -b -t 10S http://springone-demo.cfapps.io/
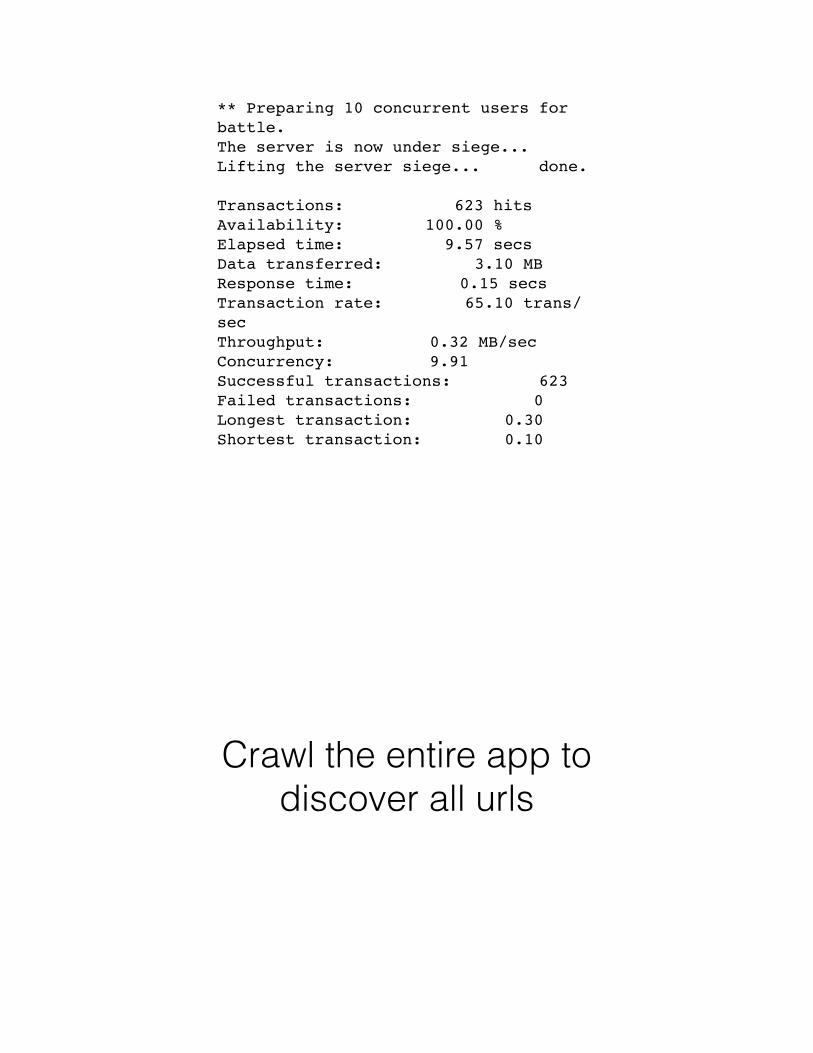
** SIEGE 3.0.6** Preparing 10 concurrent users for battle.The server is now under siege...Lifting the server siege... done.
Transactions: 623 hitsAvailability: 100.00 %Elapsed time: 9.57 secsData transferred: 3.10 MBResponse time: 0.15 secsTransaction rate: 65.10 trans/secThroughput: 0.32 MB/secConcurrency: 9.91Successful transactions: 623Failed transactions: 0Longest transaction: 0.30Shortest transaction: 0.10
Crawl the entire app to discover all urls

sproxy -o ./urls.txt
SPROXY v1.02 listening on port 9001 ...appending HTTP requests to: ./urls.txt
...default connection timeout: 120 seconds

wget -r -l 0 -t 1 --spider -w 1 -e "http_proxy = http://127.0.0.1:9001" "http://acmedemoapp.com/"
sort -u -o urls.txt urls.txt
http://acmedemoapp.com/ http://acmedemoapp.com/about http://acmedemoapp.com/cart
http://acmedemoapp.com/currency/change/EUR http://acmedemoapp.com/currency/change/GBP http://acmedemoapp.com/currency/change/USD
http://acmedemoapp.com/login http://acmedemoapp.com/register/
http://acmedemoapp.com/t/brand/bookmania http://acmedemoapp.com/t/category/books http://acmedemoapp.com/t/category/mugs
http://acmedemoapp.com/t/category/stickers http://acmedemoapp.com/terms-of-service

Benchmark traffic across all unique urls with siege
siege -v -c 50 -i -t 3M -f urls.txt -d 10
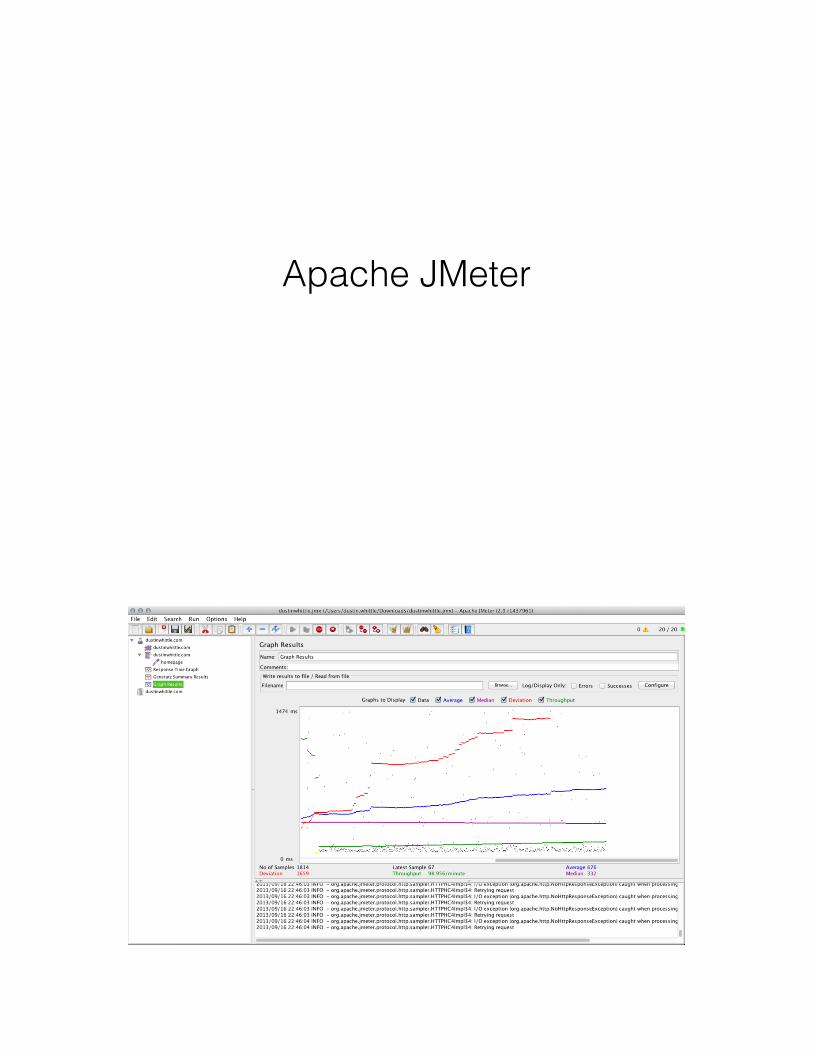
Apache JMeter
Multi-Mechanize is an open source framework for
performance and load testing
pip install multi-mechanize
multimech-newproject demo
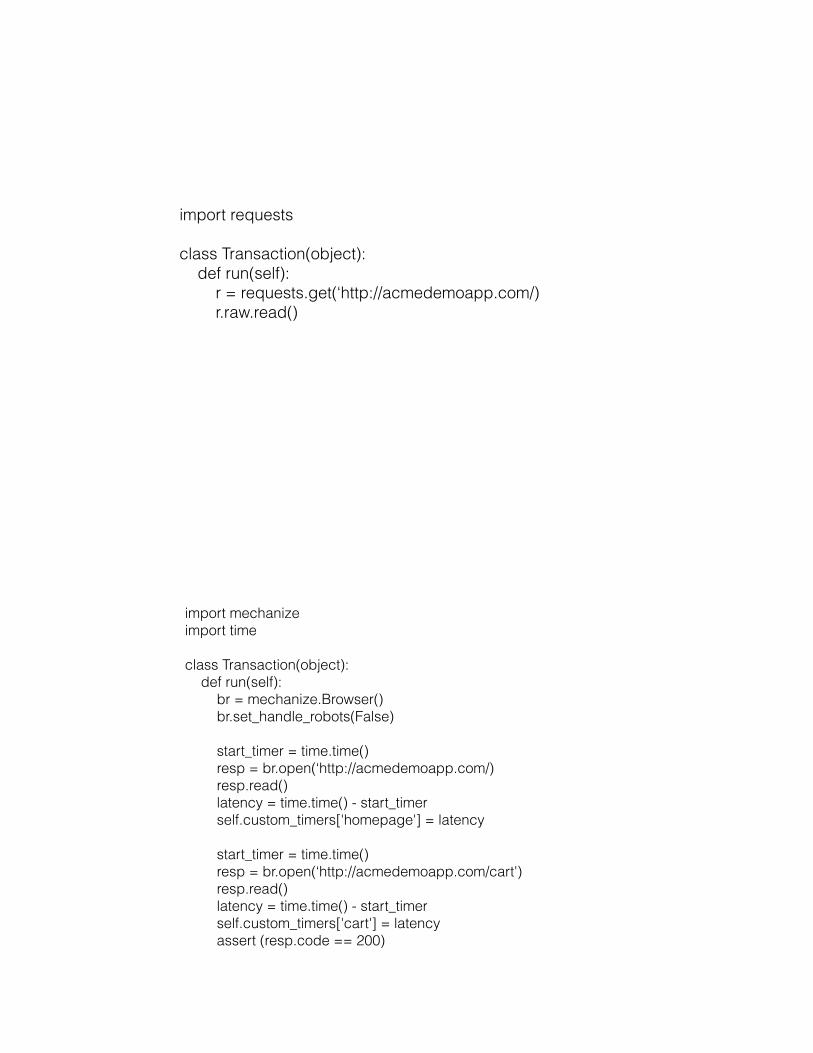
import requests
class Transaction(object): def run(self): r = requests.get(‘http://acmedemoapp.com/) r.raw.read()
import mechanize import time
class Transaction(object): def run(self): br = mechanize.Browser() br.set_handle_robots(False)
start_timer = time.time() resp = br.open(‘http://acmedemoapp.com/) resp.read() latency = time.time() - start_timer self.custom_timers['homepage'] = latency
start_timer = time.time() resp = br.open(‘http://acmedemoapp.com/cart') resp.read() latency = time.time() - start_timer self.custom_timers['cart'] = latency assert (resp.code == 200)
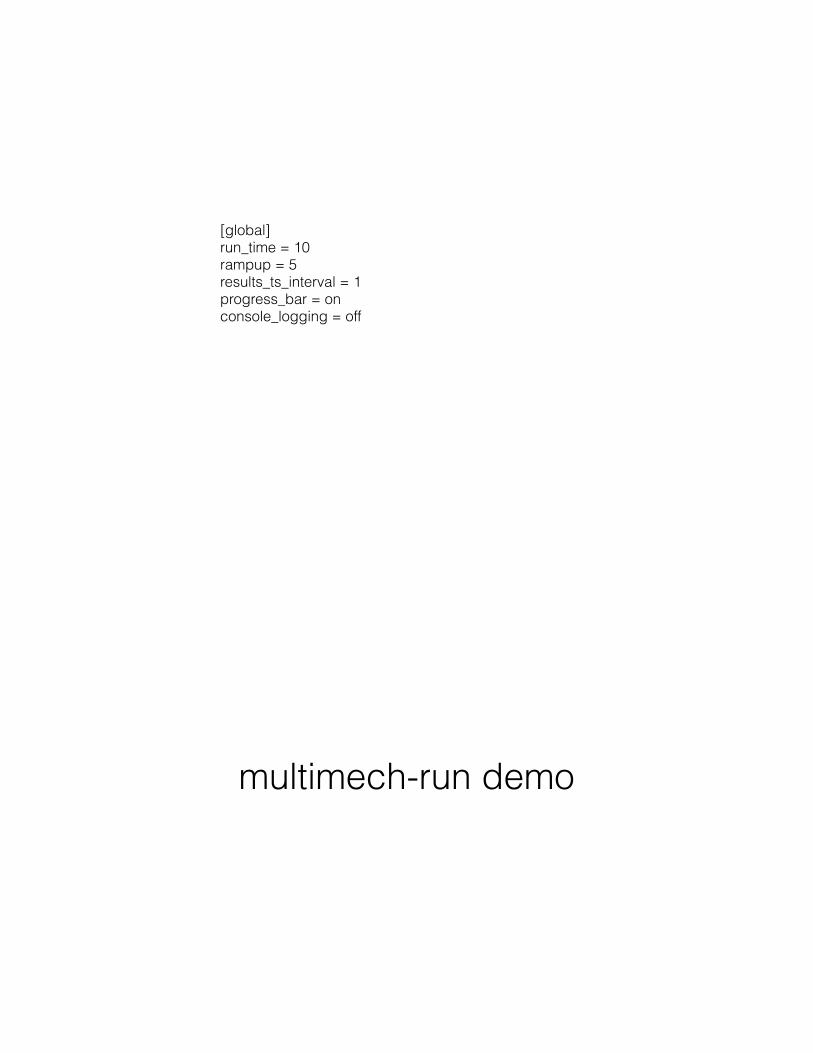
[global] run_time = 10 rampup = 5 results_ts_interval = 1 progress_bar = on console_logging = off
multimech-run demo
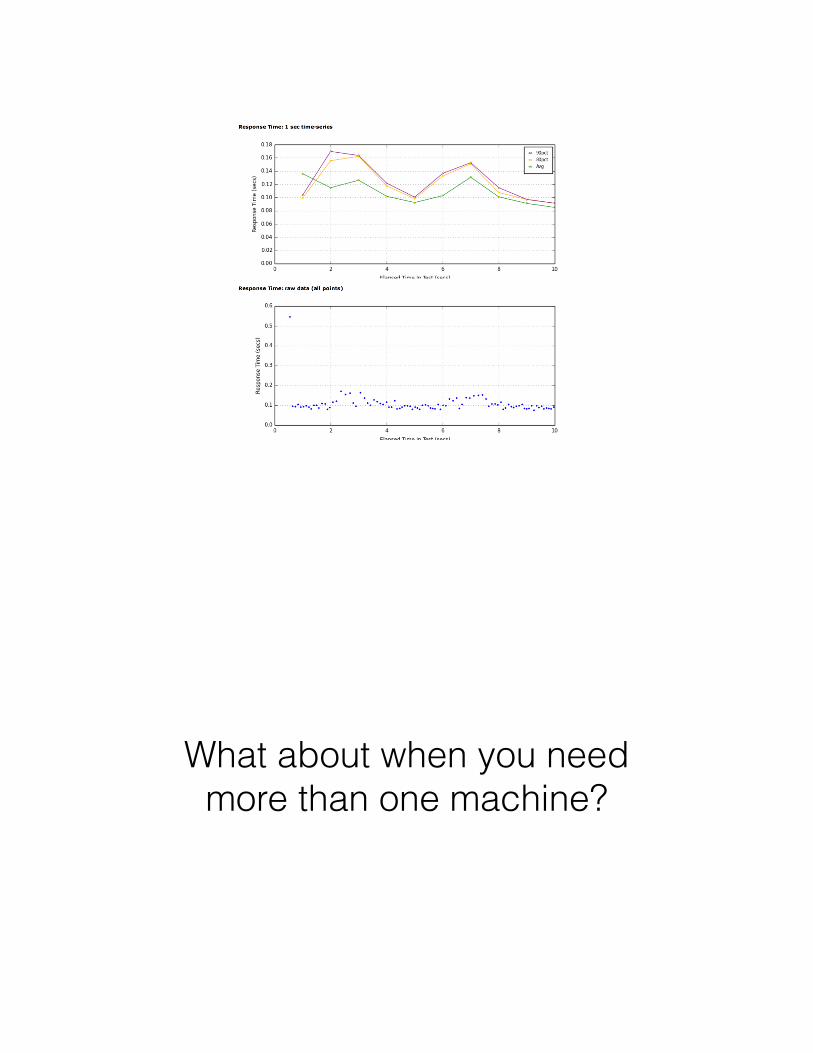
What about when you need more than one machine?

Who lives in the cloud?
Bees with Machine Guns

A utility for arming (creating) many bees (micro EC2 instances)
to attack (load test) targets (web applications)
pip install beeswithmachineguns
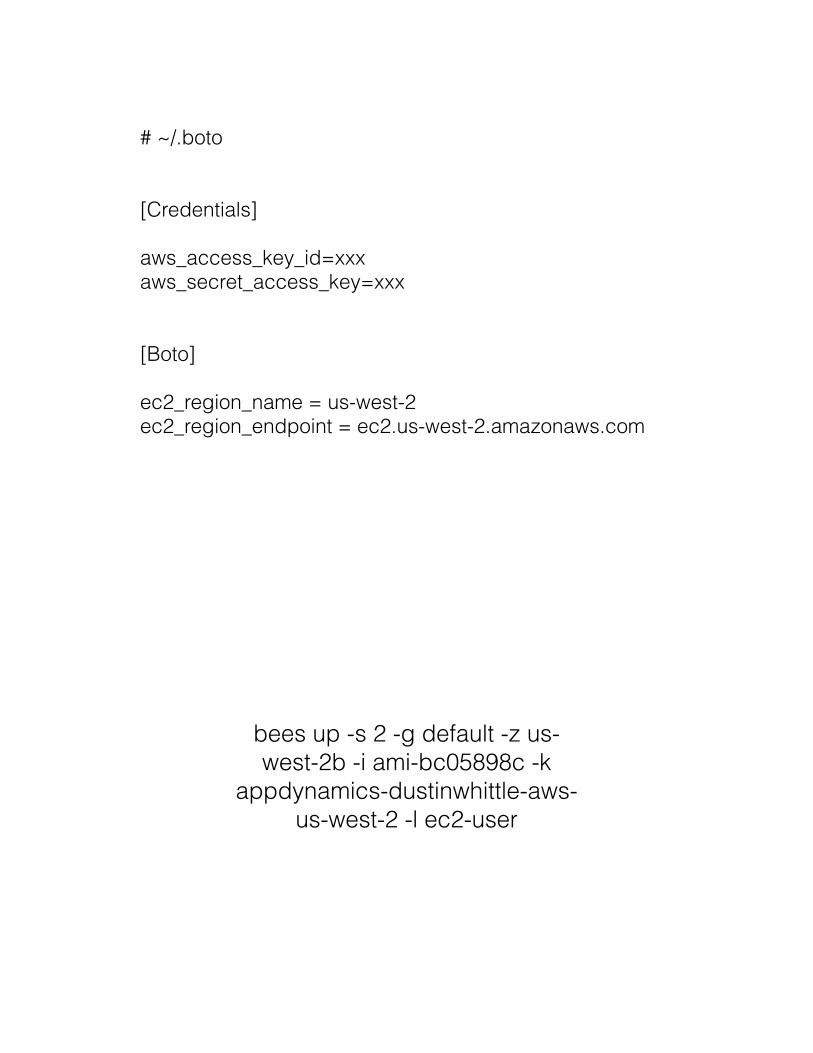
# ~/.boto
[Credentials]
aws_access_key_id=xxx aws_secret_access_key=xxx
[Boto]
ec2_region_name = us-west-2 ec2_region_endpoint = ec2.us-west-2.amazonaws.com
bees up -s 2 -g default -z us-west-2b -i ami-bc05898c -k
appdynamics-dustinwhittle-aws-us-west-2 -l ec2-user

Connecting to the hive. Attempting to call up 2 bees.
Waiting for bees to load their machine guns... . . .
bees report

Read 2 bees from the roster. Bee i-3828400c: running @ 54.212.22.176 Bee i-3928400d: running @ 50.112.6.191
bees attack -n 1000 -c 50 -u http://springone-demo.cfapps.io/
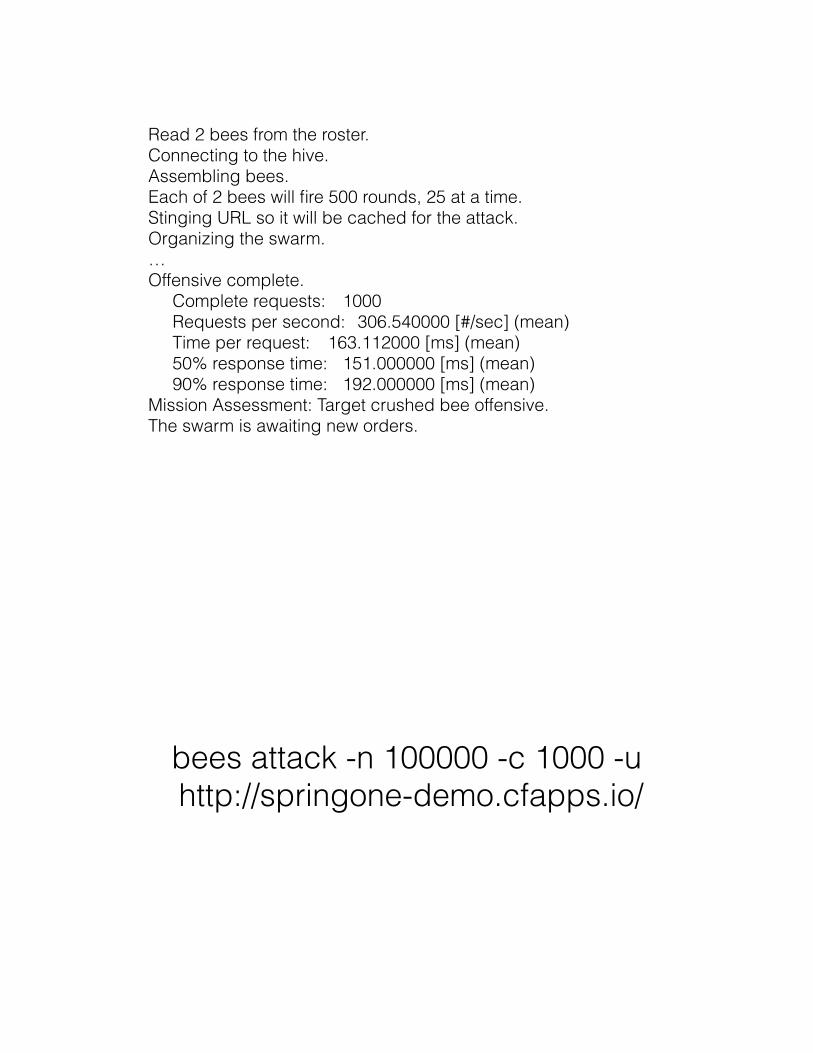
Read 2 bees from the roster. Connecting to the hive. Assembling bees. Each of 2 bees will fire 500 rounds, 25 at a time. Stinging URL so it will be cached for the attack. Organizing the swarm. … Offensive complete. Complete requests: 1000 Requests per second: 306.540000 [#/sec] (mean) Time per request: 163.112000 [ms] (mean) 50% response time: 151.000000 [ms] (mean) 90% response time: 192.000000 [ms] (mean) Mission Assessment: Target crushed bee offensive. The swarm is awaiting new orders.
bees attack -n 100000 -c 1000 -u http://springone-demo.cfapps.io/
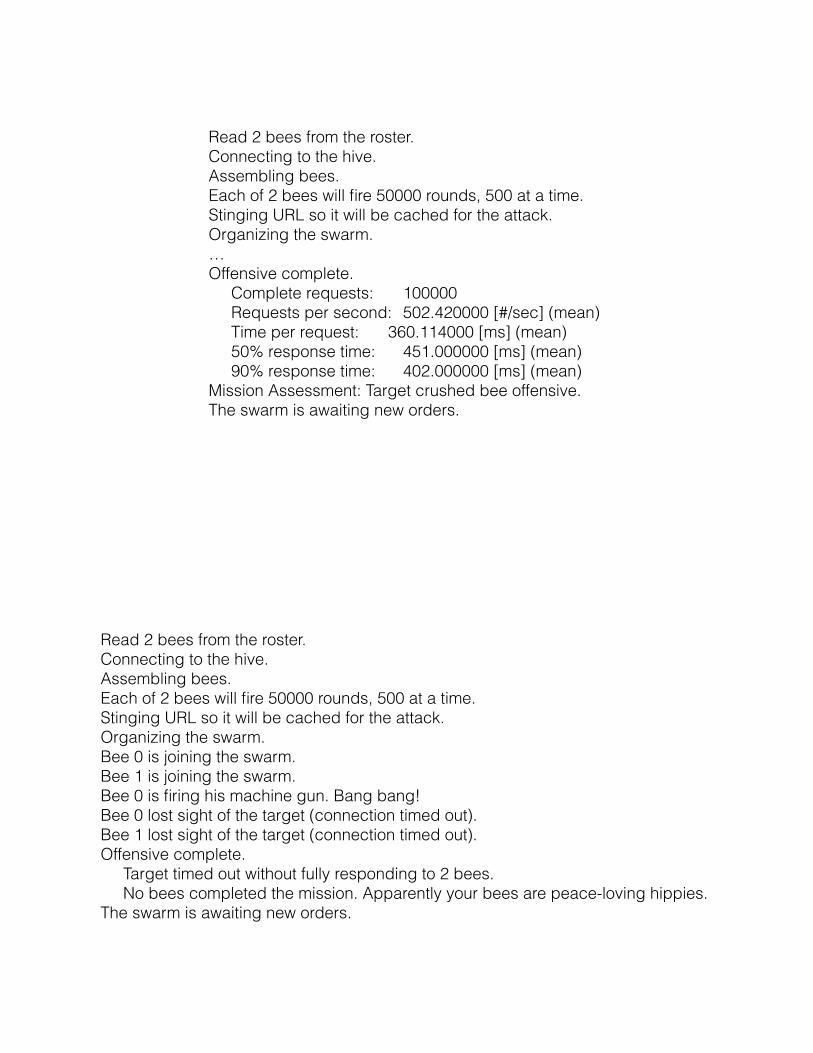
Read 2 bees from the roster. Connecting to the hive. Assembling bees. Each of 2 bees will fire 50000 rounds, 500 at a time. Stinging URL so it will be cached for the attack. Organizing the swarm. … Offensive complete. Complete requests: 100000 Requests per second: 502.420000 [#/sec] (mean) Time per request: 360.114000 [ms] (mean) 50% response time: 451.000000 [ms] (mean) 90% response time: 402.000000 [ms] (mean) Mission Assessment: Target crushed bee offensive. The swarm is awaiting new orders.
Read 2 bees from the roster. Connecting to the hive. Assembling bees. Each of 2 bees will fire 50000 rounds, 500 at a time. Stinging URL so it will be cached for the attack. Organizing the swarm. Bee 0 is joining the swarm. Bee 1 is joining the swarm. Bee 0 is firing his machine gun. Bang bang! Bee 0 lost sight of the target (connection timed out). Bee 1 lost sight of the target (connection timed out). Offensive complete. Target timed out without fully responding to 2 bees. No bees completed the mission. Apparently your bees are peace-loving hippies. The swarm is awaiting new orders.

bees down
Read 2 bees from the roster. Connecting to the hive. Calling off the swarm. Stood down 2 bees.
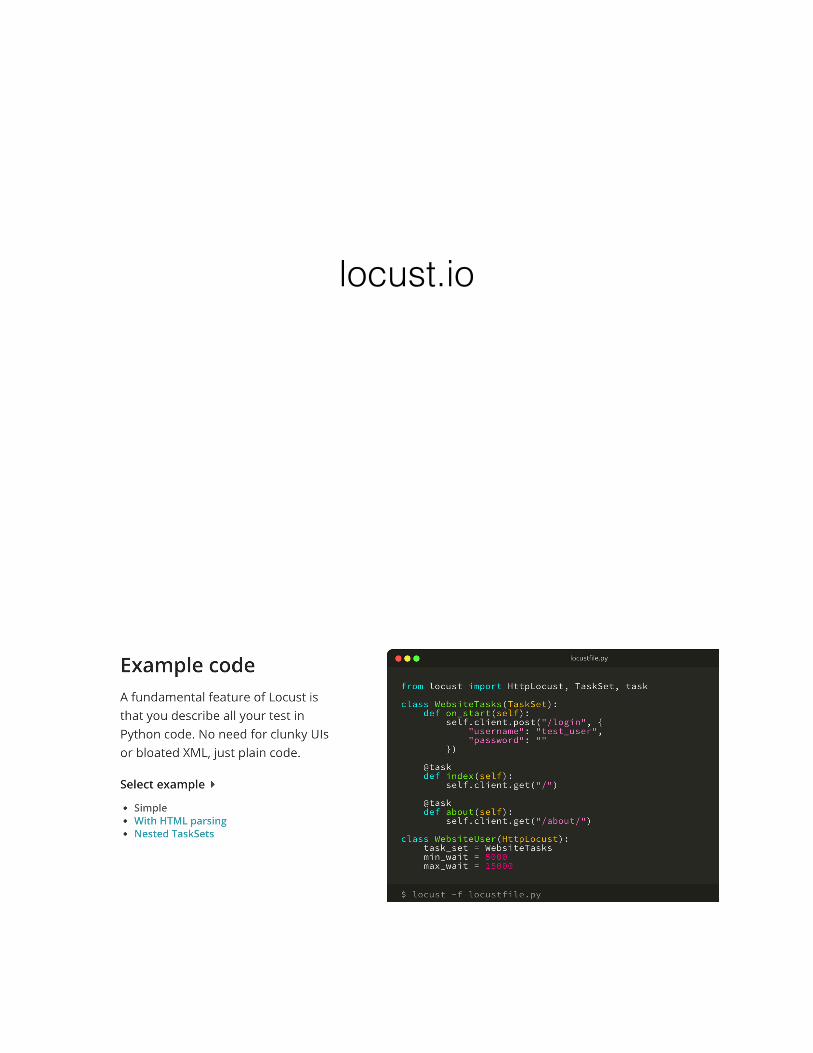
locust.io
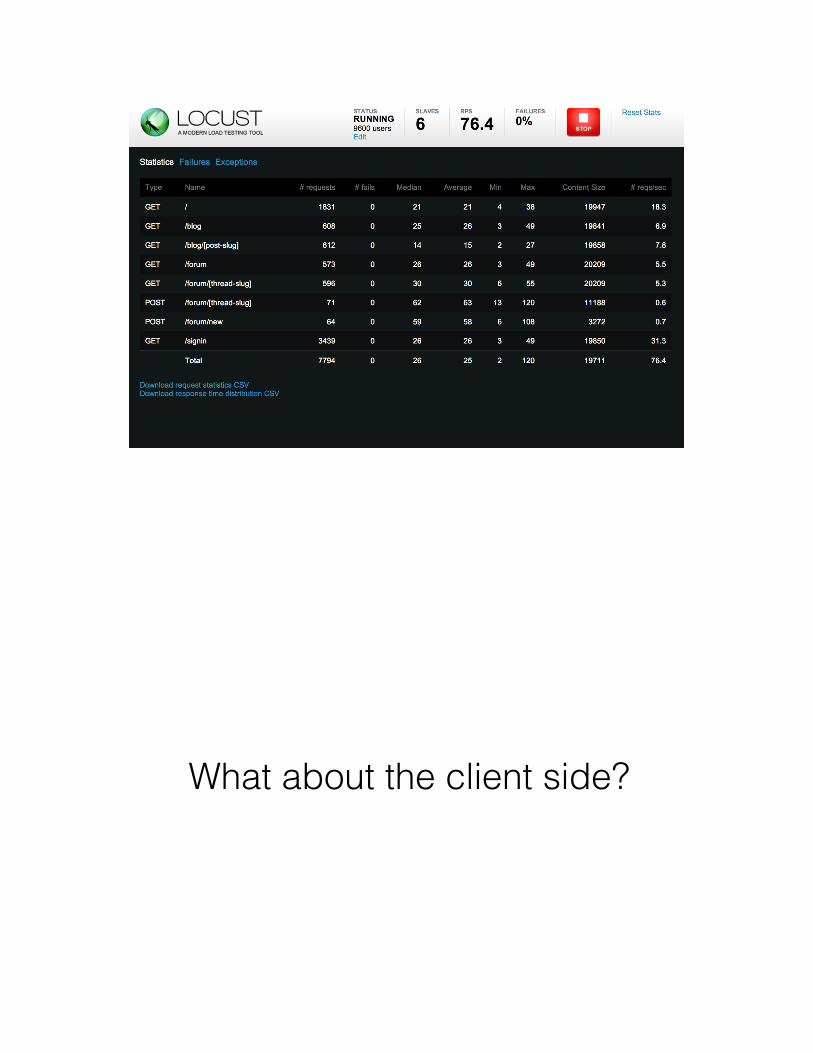
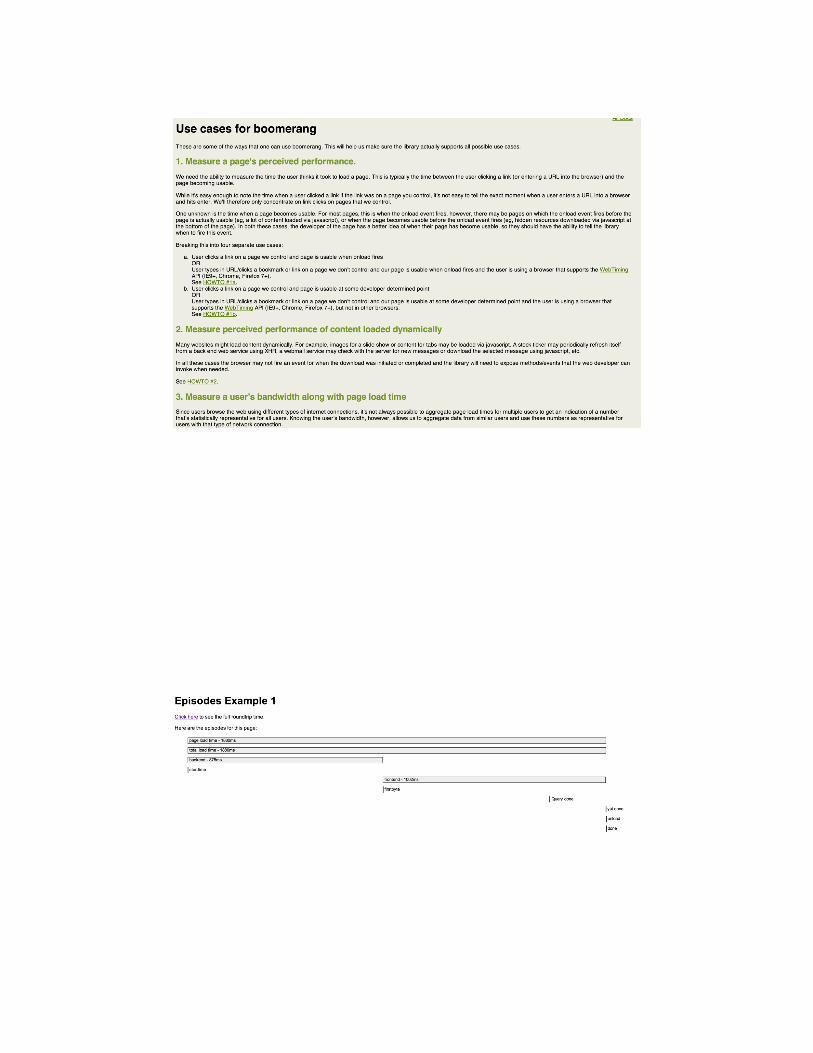
What about the client side?
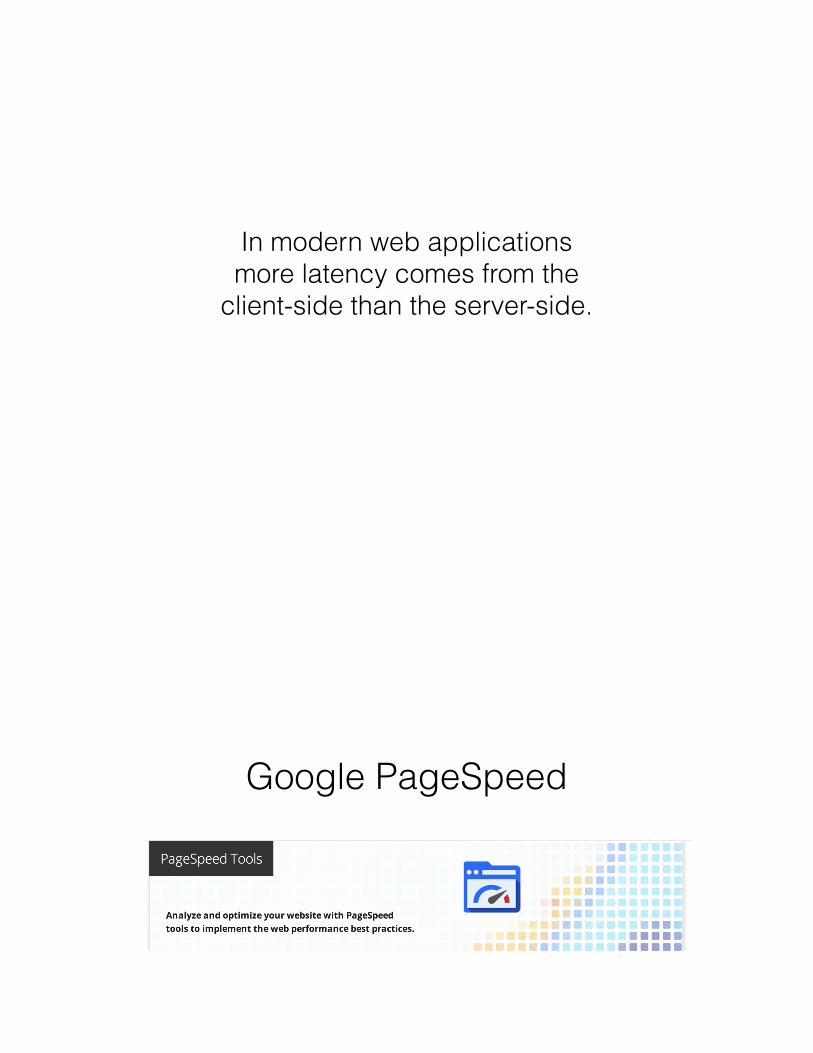
In modern web applications more latency comes from the
client-side than the server-side.
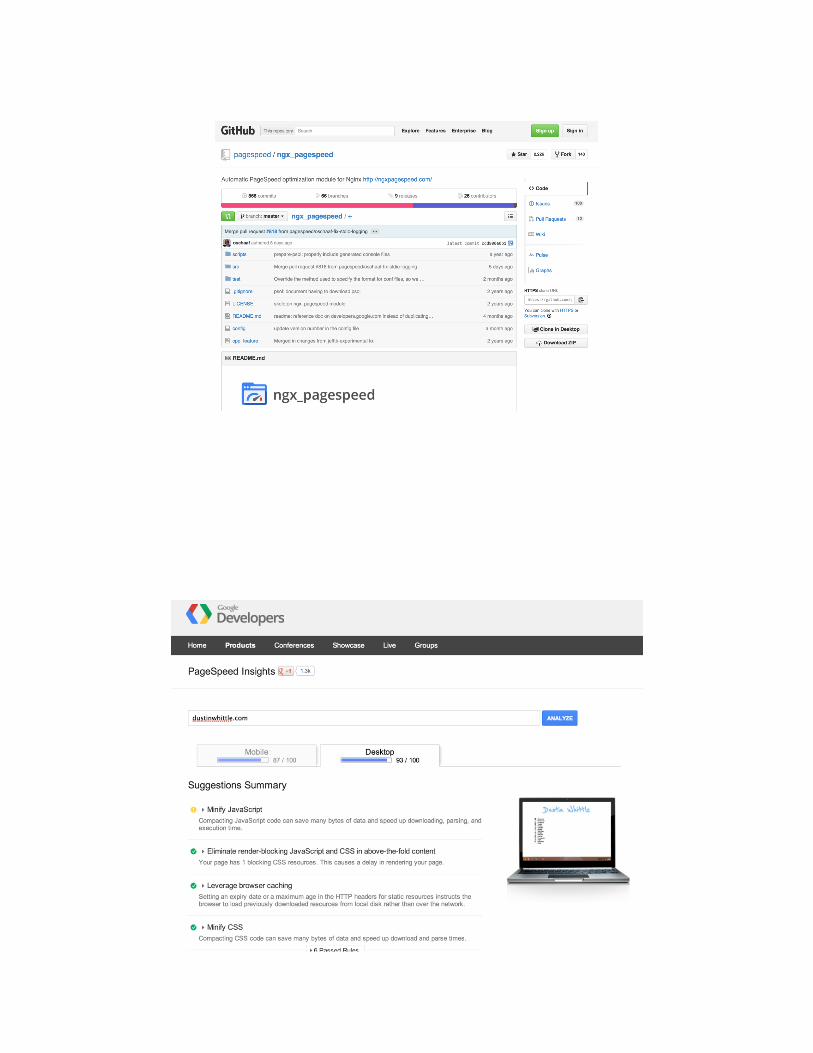
Google PageSpeed
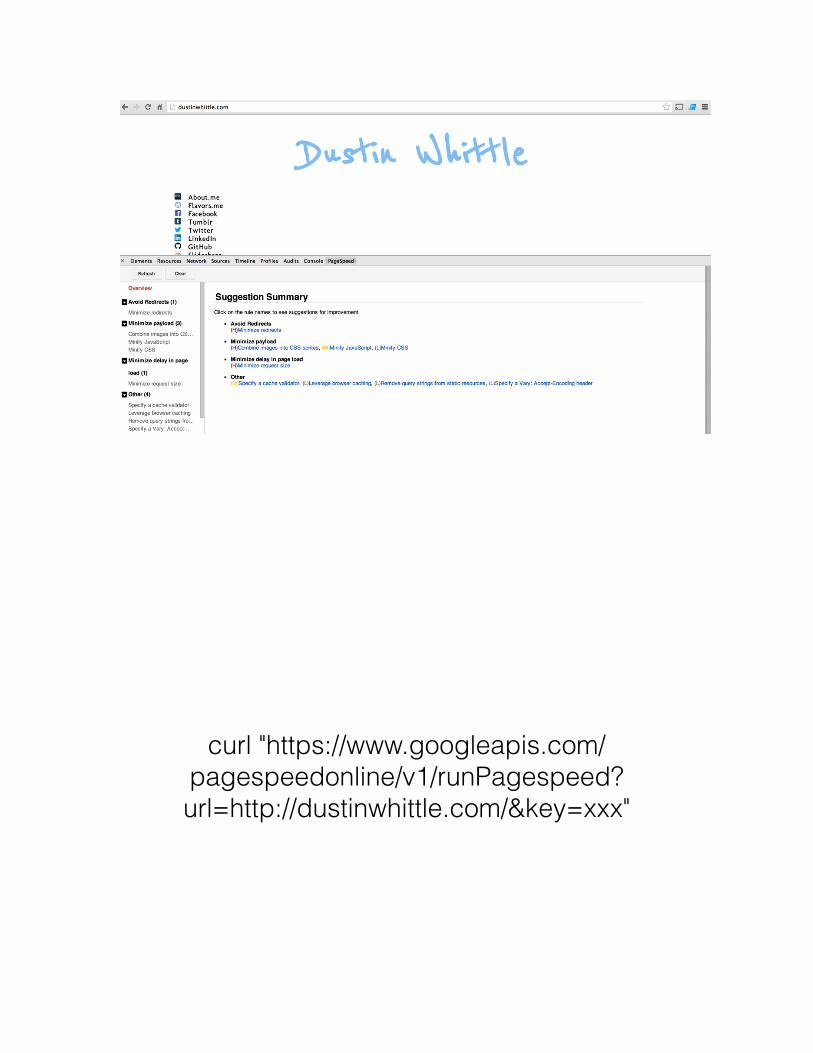
curl "https://www.googleapis.com/pagespeedonline/v1/runPagespeed?url=http://dustinwhittle.com/&key=xxx"

WBench
gem install wbench
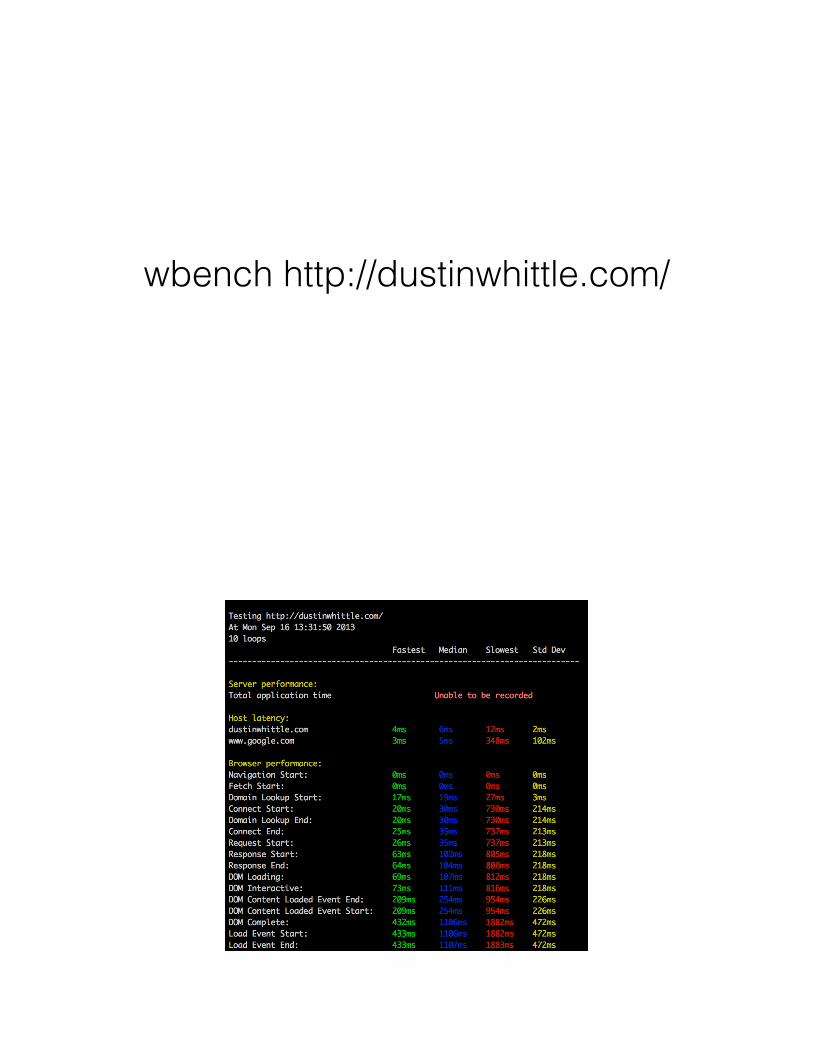
wbench http://dustinwhittle.com/
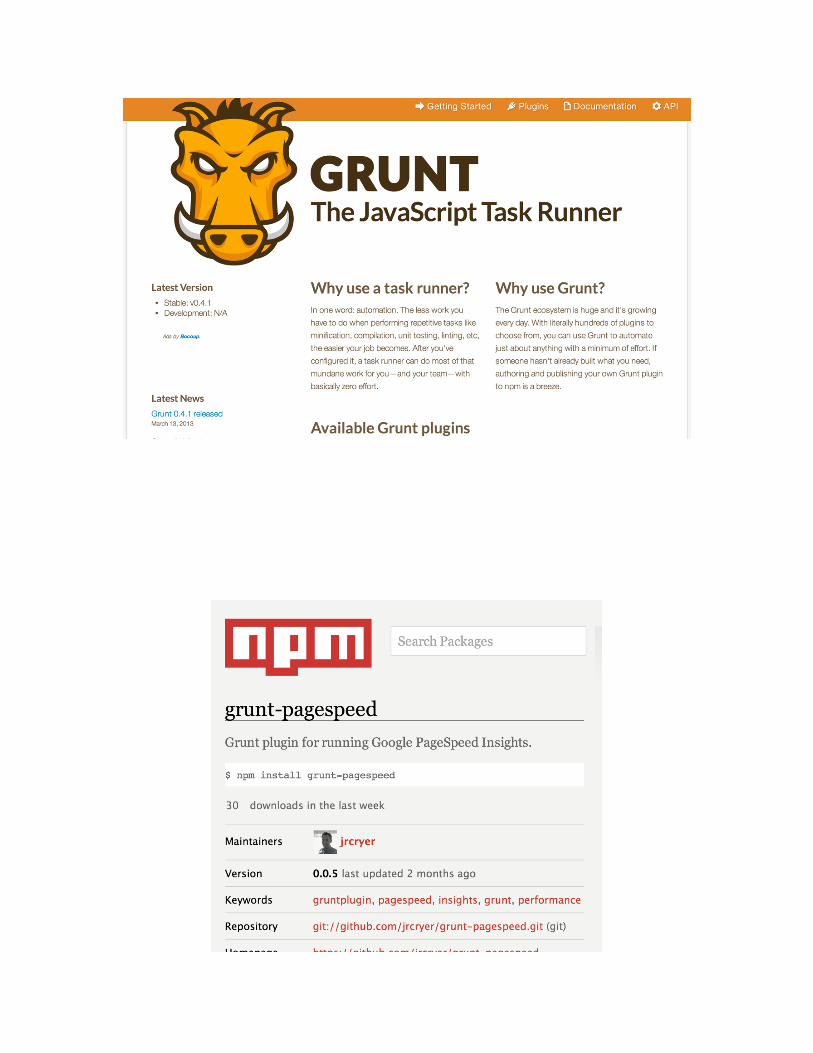
Automate client-side performance testing with Grunt
Use Bower (for dependencies), Grunt (for automation),
and Yeoman (for bootstrapping)
How many people understand exactly how fast their site runs in production?
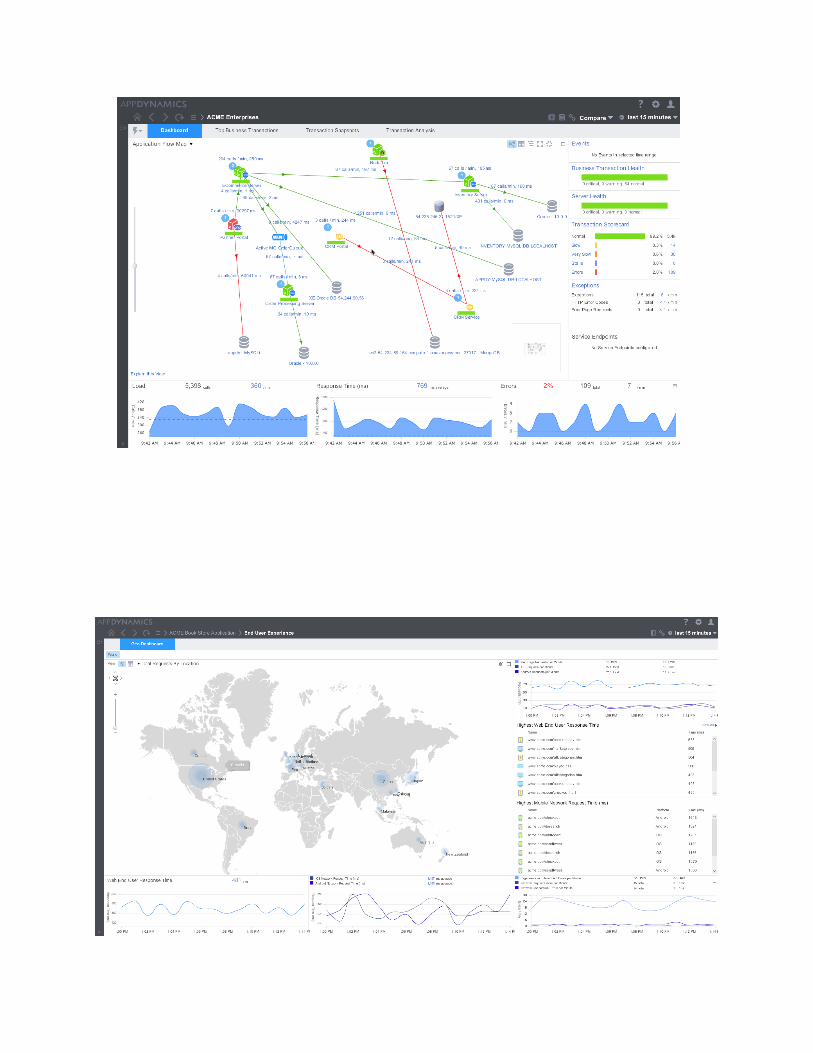
Track performance in development and
production
Instrument everything = code, databases, caches, queues, third party services, and infrastructure.
Chef / Sensu
http://sensuapp.org/
Statsd + Graphite + Grafana
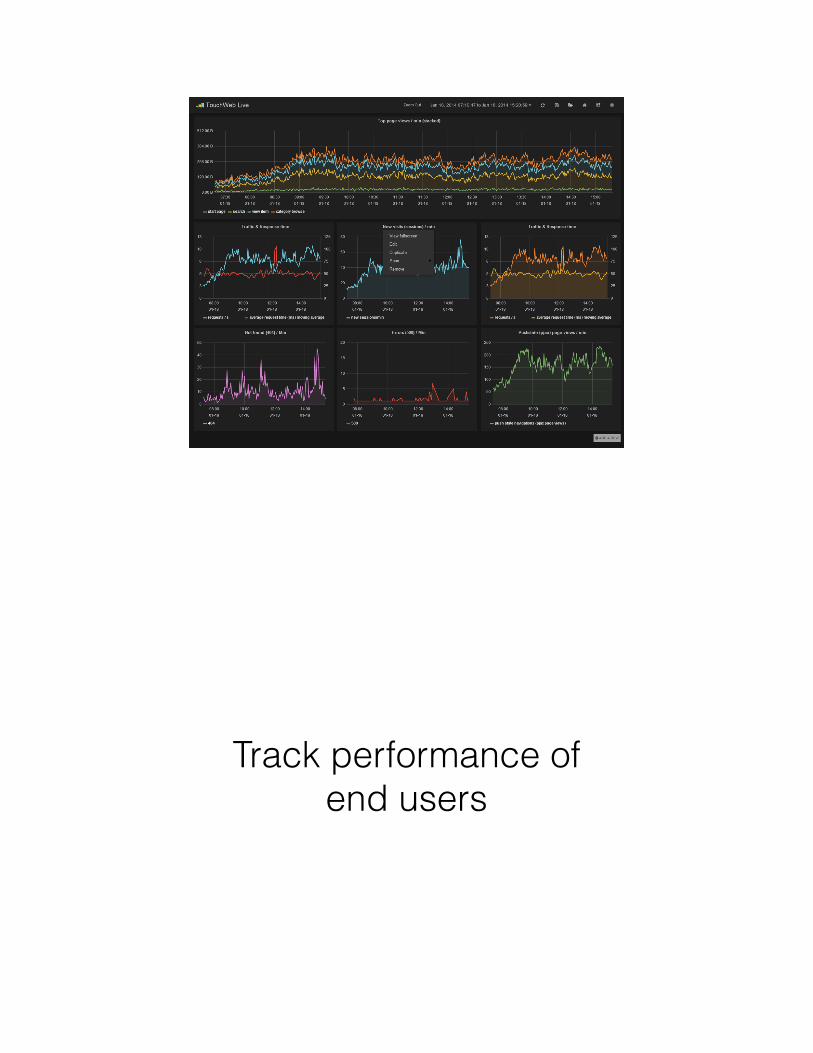
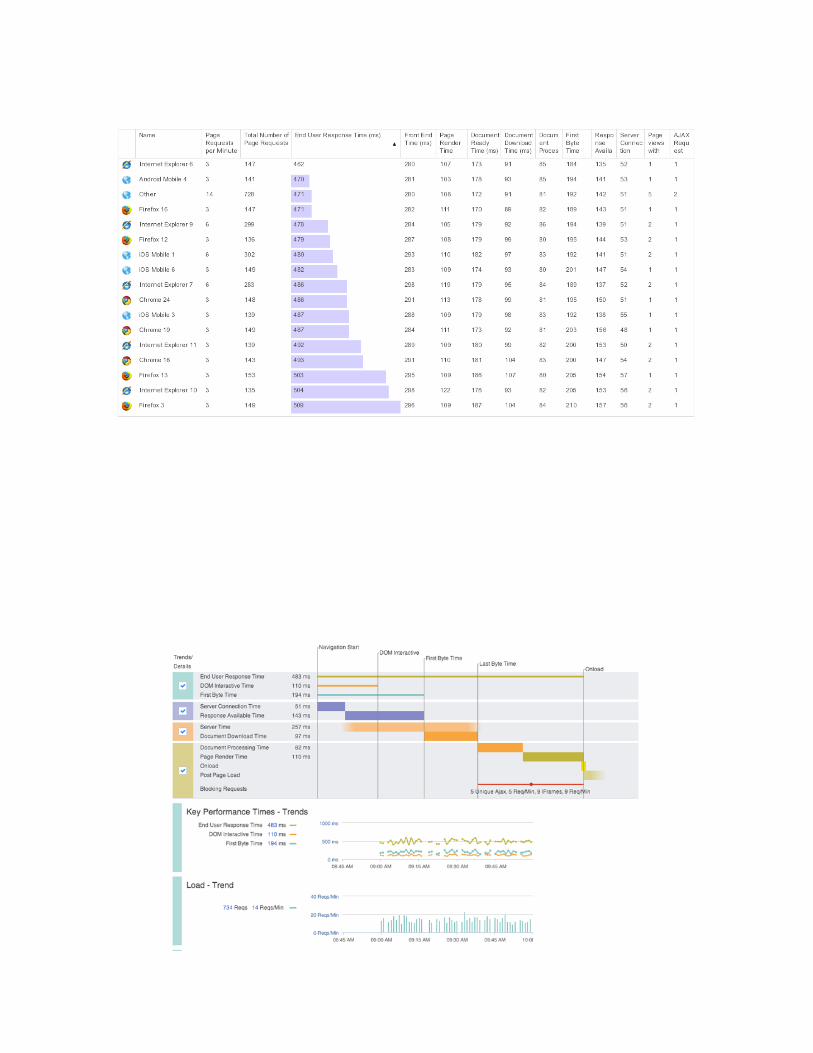
Track performance of end users

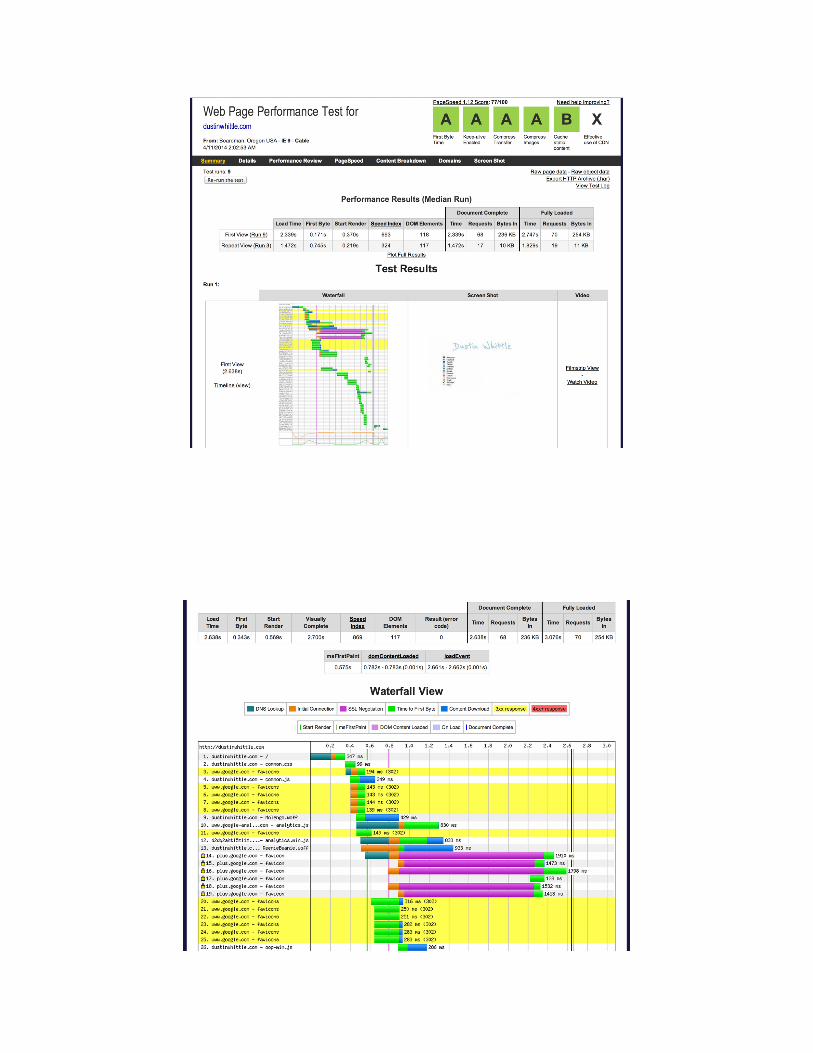
webpagetest.org
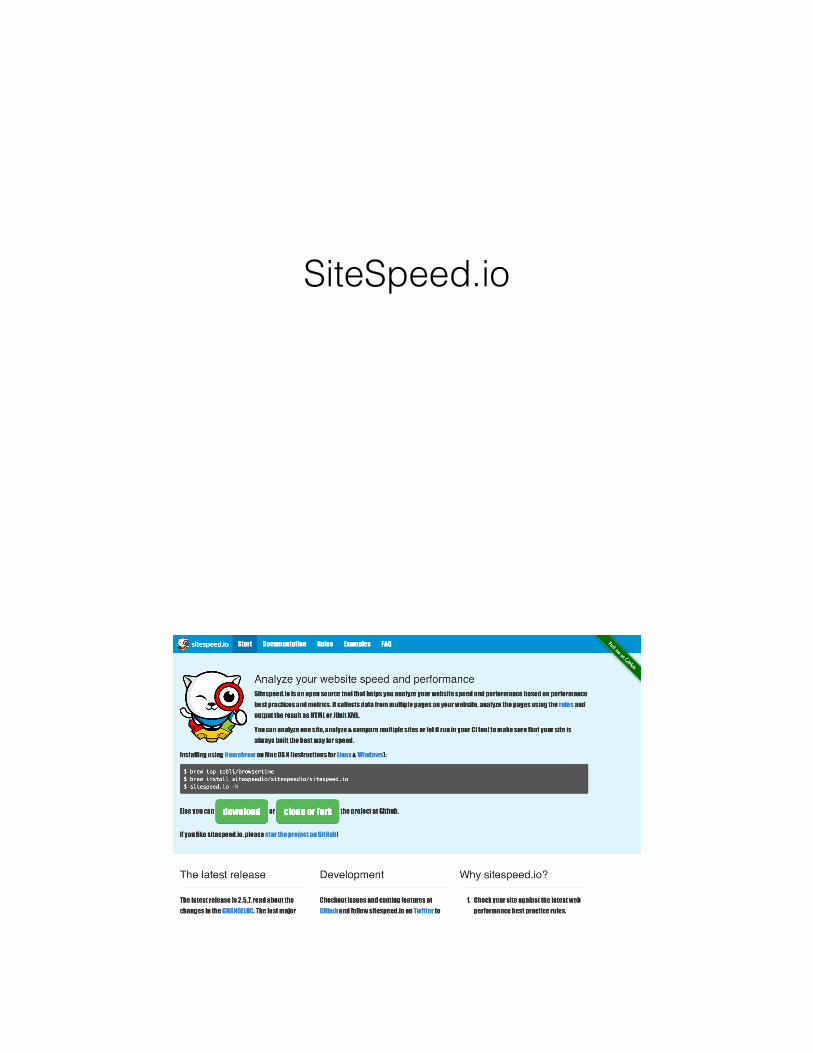
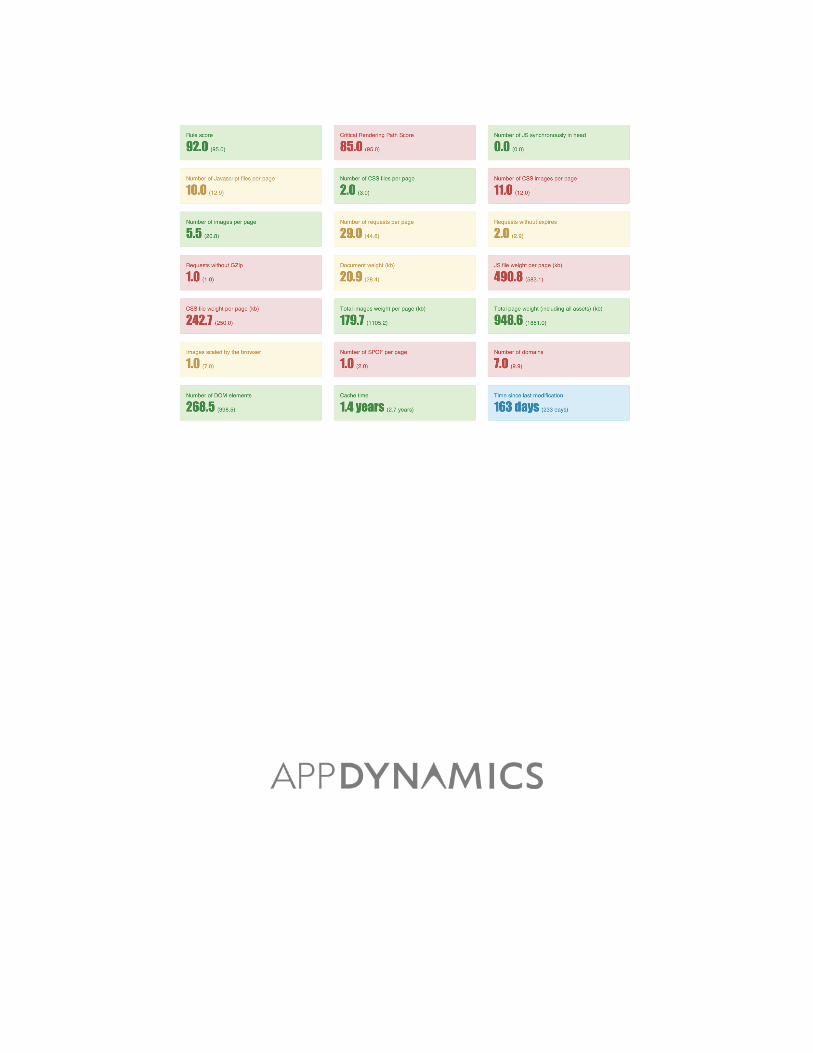
SiteSpeed.io
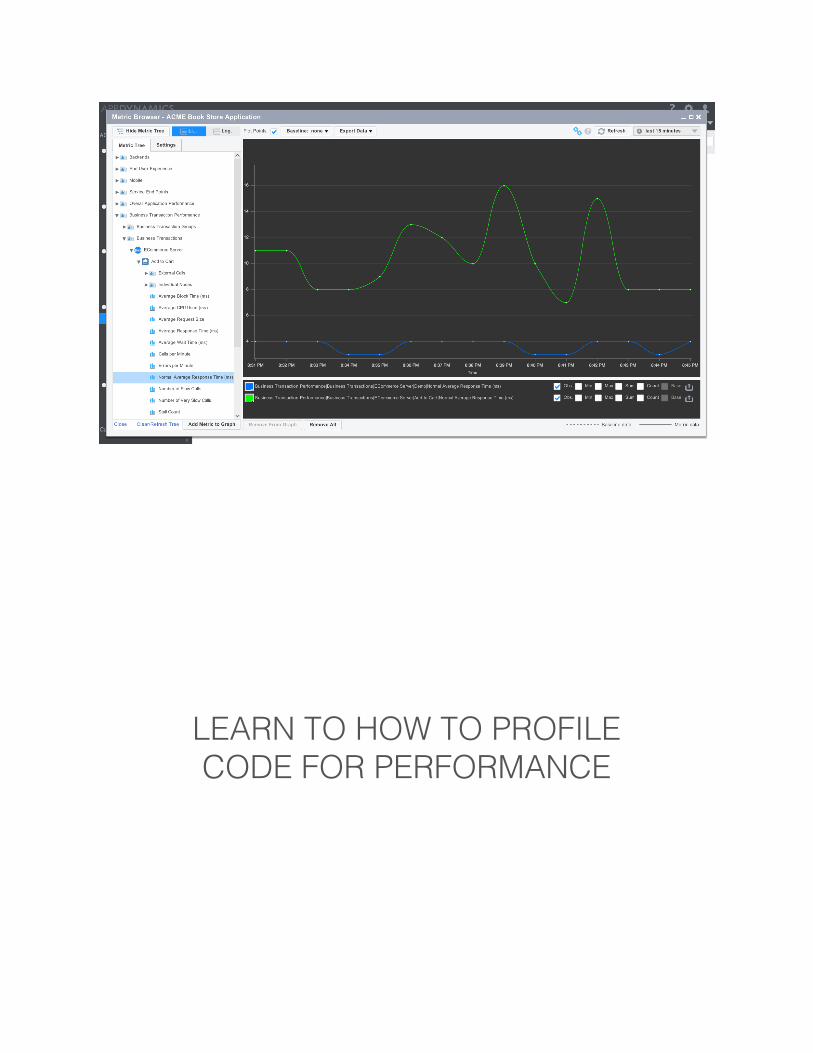
LEARN TO HOW TO PROFILE CODE FOR PERFORMANCE
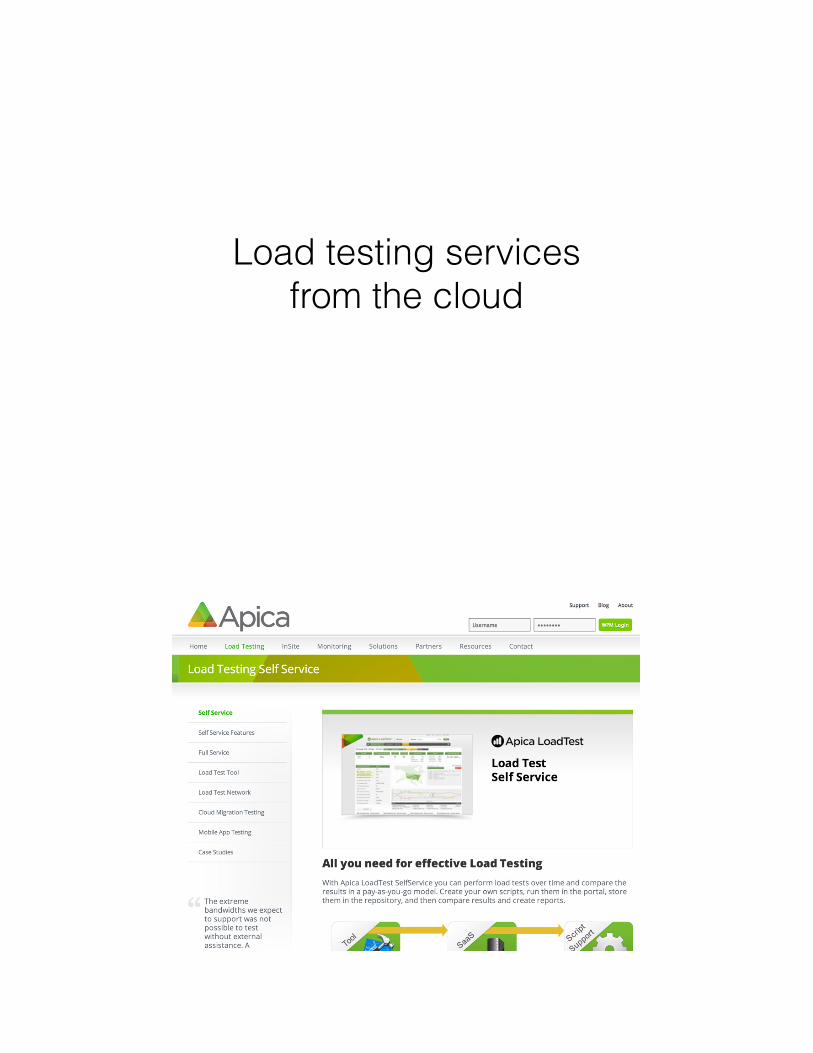
Load testing services from the cloud

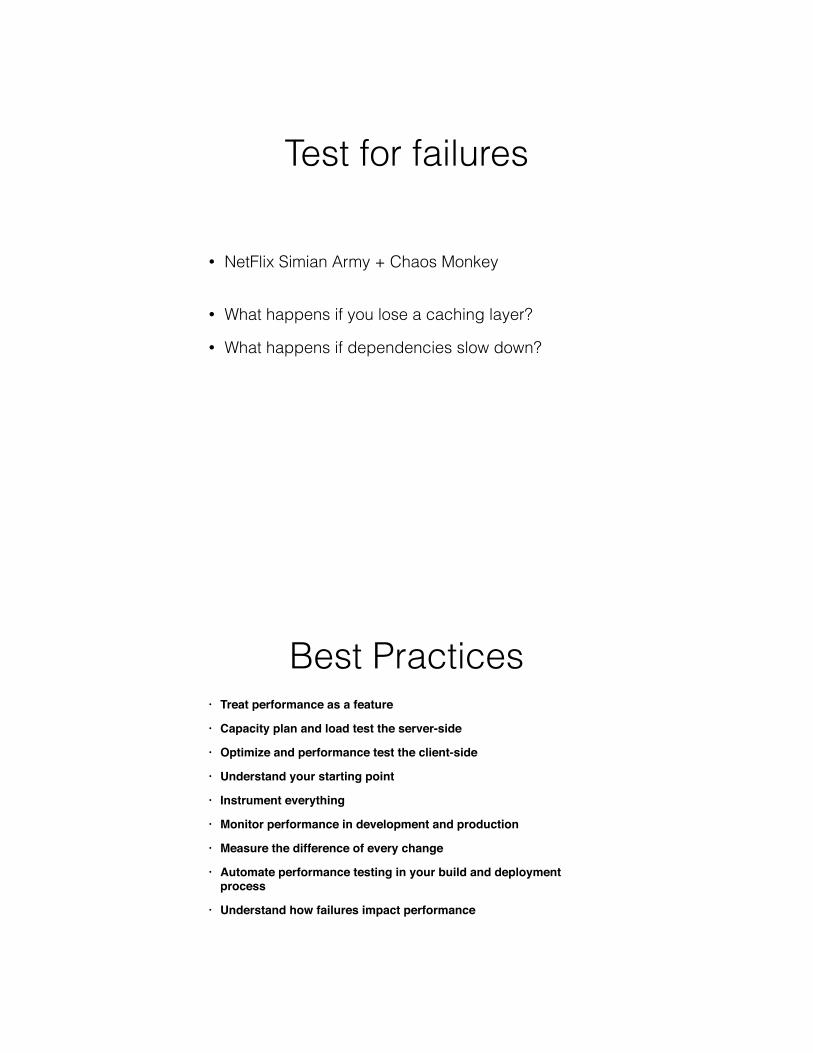
Test for failures
• NetFlix Simian Army + Chaos Monkey
• What happens if you lose a caching layer?
• What happens if dependencies slow down?
Best Practices• Treat performance as a feature
• Capacity plan and load test the server-side
• Optimize and performance test the client-side
• Understand your starting point
• Instrument everything
• Monitor performance in development and production
• Measure the difference of every change
• Automate performance testing in your build and deployment process
• Understand how failures impact performance
Integrate automated performance testing into continuous integration
for server-side and client-side
Understand the performance implications of every deployment
and package upgrade
Monitor end user experience from end to
end in production
Questions?

Find these slides on SpeakerDeck
https://speakerdeck.com/dustinwhittle