Mobile Interactive Image Soni cation for the Blind - …bschauer/pdf/...Mobile Interactive Image...
8
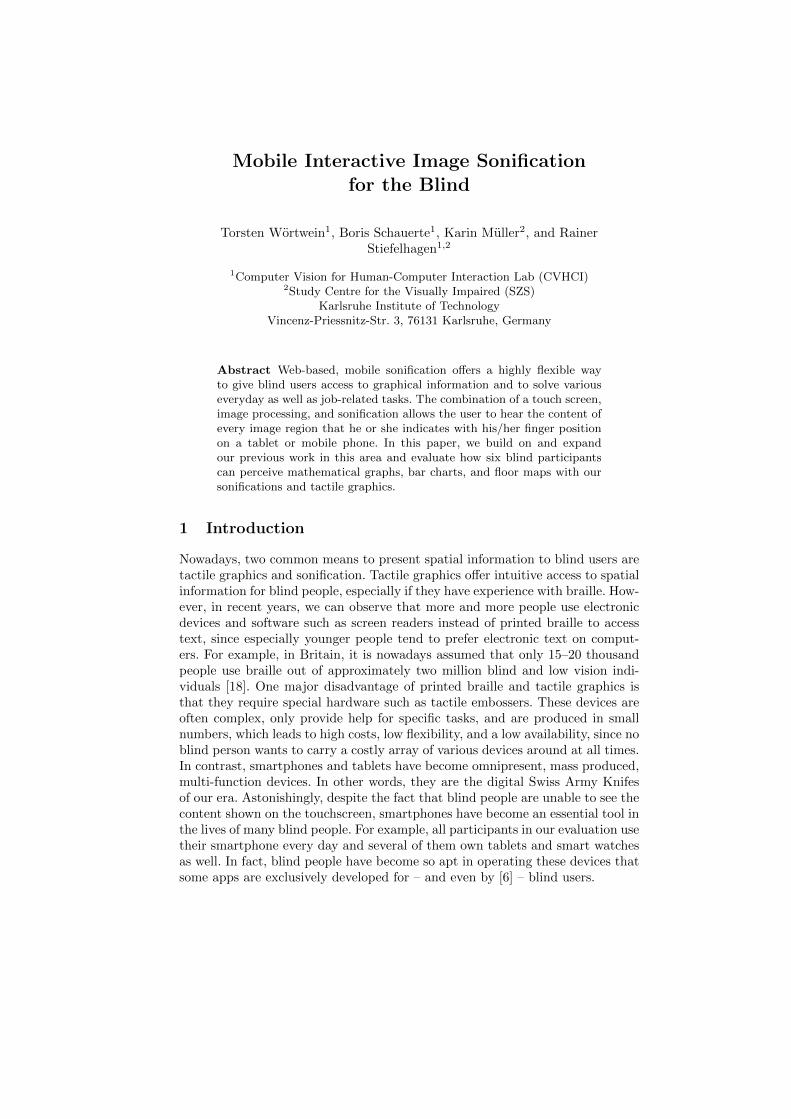
Mobile Interactive Image Sonification for the Blind Torsten W¨ ortwein 1 , Boris Schauerte 1 , Karin M¨ uller 2 , and Rainer Stiefelhagen 1,2 1 Computer Vision for Human-Computer Interaction Lab (CVHCI) 2 Study Centre for the Visually Impaired (SZS) Karlsruhe Institute of Technology Vincenz-Priessnitz-Str. 3, 76131 Karlsruhe, Germany Abstract Web-based, mobile sonification offers a highly flexible way to give blind users access to graphical information and to solve various everyday as well as job-related tasks. The combination of a touch screen, image processing, and sonification allows the user to hear the content of every image region that he or she indicates with his/her finger position on a tablet or mobile phone. In this paper, we build on and expand our previous work in this area and evaluate how six blind participants can perceive mathematical graphs, bar charts, and floor maps with our sonifications and tactile graphics. 1 Introduction Nowadays, two common means to present spatial information to blind users are tactile graphics and sonification. Tactile graphics offer intuitive access to spatial information for blind people, especially if they have experience with braille. How- ever, in recent years, we can observe that more and more people use electronic devices and software such as screen readers instead of printed braille to access text, since especially younger people tend to prefer electronic text on comput- ers. For example, in Britain, it is nowadays assumed that only 15–20 thousand people use braille out of approximately two million blind and low vision indi- viduals [18]. One major disadvantage of printed braille and tactile graphics is that they require special hardware such as tactile embossers. These devices are often complex, only provide help for specific tasks, and are produced in small numbers, which leads to high costs, low flexibility, and a low availability, since no blind person wants to carry a costly array of various devices around at all times. In contrast, smartphones and tablets have become omnipresent, mass produced, multi-function devices. In other words, they are the digital Swiss Army Knifes of our era. Astonishingly, despite the fact that blind people are unable to see the content shown on the touchscreen, smartphones have become an essential tool in the lives of many blind people. For example, all participants in our evaluation use their smartphone every day and several of them own tablets and smart watches as well. In fact, blind people have become so apt in operating these devices that some apps are exclusively developed for – and even by [6] – blind users.
Transcript of Mobile Interactive Image Soni cation for the Blind - …bschauer/pdf/...Mobile Interactive Image...
Mobile Interactive Image Sonificationfor the Blind
Torsten Wortwein1, Boris Schauerte1, Karin Muller2, and RainerStiefelhagen1,2
1Computer Vision for Human-Computer Interaction Lab (CVHCI)2Study Centre for the Visually Impaired (SZS)
Karlsruhe Institute of TechnologyVincenz-Priessnitz-Str. 3, 76131 Karlsruhe, Germany
Abstract Web-based, mobile sonification offers a highly flexible wayto give blind users access to graphical information and to solve variouseveryday as well as job-related tasks. The combination of a touch screen,image processing, and sonification allows the user to hear the content ofevery image region that he or she indicates with his/her finger positionon a tablet or mobile phone. In this paper, we build on and expandour previous work in this area and evaluate how six blind participantscan perceive mathematical graphs, bar charts, and floor maps with oursonifications and tactile graphics.
1 Introduction
Nowadays, two common means to present spatial information to blind users aretactile graphics and sonification. Tactile graphics offer intuitive access to spatialinformation for blind people, especially if they have experience with braille. How-ever, in recent years, we can observe that more and more people use electronicdevices and software such as screen readers instead of printed braille to accesstext, since especially younger people tend to prefer electronic text on comput-ers. For example, in Britain, it is nowadays assumed that only 15–20 thousandpeople use braille out of approximately two million blind and low vision indi-viduals [18]. One major disadvantage of printed braille and tactile graphics isthat they require special hardware such as tactile embossers. These devices areoften complex, only provide help for specific tasks, and are produced in smallnumbers, which leads to high costs, low flexibility, and a low availability, since noblind person wants to carry a costly array of various devices around at all times.In contrast, smartphones and tablets have become omnipresent, mass produced,multi-function devices. In other words, they are the digital Swiss Army Knifesof our era. Astonishingly, despite the fact that blind people are unable to see thecontent shown on the touchscreen, smartphones have become an essential tool inthe lives of many blind people. For example, all participants in our evaluation usetheir smartphone every day and several of them own tablets and smart watchesas well. In fact, blind people have become so apt in operating these devices thatsome apps are exclusively developed for – and even by [6] – blind users.

2 T. Wortwein, B. Schauerte, K. Muller, R. Stiefelhagen
Figure 1. Experiment setting: two blind participants equipped with a headphone try-ing to identify a box plot (left) and a mathematical function plot (right) by movingtheir finger on the tablet surface.
In our work, we use modern web-technologies to implement an interactive im-age sonification platform that can be accessed with a web-browser on devices thatmany blind users use on a daily basis (most importantly, smartphones, tabletsand desktop computers). Hence, our system can be used almost everywhere, seeFigure 1 for the minimal setup. Since we can implement various sonificationalgorithms and switch them depending on the user’s context, we can use thesesonifications to allow blind users access to a wide variety of information that istypically presented in the form of images (e.g., maps, plans, graphs, or charts).Furthermore, electronic devices allow flexible interaction with the user to adaptto his needs. For example, a tactile graphic does not change once it is printed,whereas an electronic representation allows to change its scale, the level of de-tails, the way of sonification, or even output modalities (e.g., sound, speech, orvibration).
2 Related Work
In recent years, various assistive systems for blind people have been developed(e.g ., [23, 25, 2]) that rely on a variety of different technologies such as, e.g .,computer vision [20], crowdsourcing [5], and touchscreens [13, 24]. For example,it is possible to use computer vision to detect the walkable area in front of ablind person and then transform the information about obstacles into haptic orauditory feedback to guide a blind user around detected obstacles (see [20, 15]).Turning information into auditory signals is called sonification (see [11]; e.g .,[1, 12, 19, 23, 25, 3, 17, 2]) and is a very common mean to present visual in-formation such as, e.g ., maps to blind people [23]. Sonification systems mayuse different techniques of sound synthesis, which we can differentiate into twobroad categories: Entirely synthetic sounds and sounds composed with musicalinstruments (e.g ., piano and guitar sounds) [1, 2]. As for sonification for visuallyimpaired people, there also exist two broad categories when it comes to imagesonification: Low-level sonification of arbitrary images (e.g ., [1, 2, 8]), i.e. soni-fication of basic image properties like color [8] and edges [25], and task-specificsonification (e.g ., [23]). Furthermore, we have to differentiate between sonifica-

Mobile Interactive Image Sonification for the Blind 3
Figure 2. Finger trajectories with function value sonification (left) and distance soni-fication (right).
tion methods that sonify the image as a whole and present it to the user in formof a pre-calculated audio clip (e.g ., [16]) and systems that allow user interaction(see, e.g ., [10]), e.g . by sonifying the image area under the mouse cursor (e.g .,[1, 25]). Web and mobile technologies have also been explored to assist blindpeople. Most prominently, Bigham et al . uses the crowd to enable blind peopleto take a picture with their iPhone and ask other people for assistance in findinga specific object [4, 5].
3 Interactive Image Sonifications
In the following, we briefly describe the evaluated sonifications for three tasks:mathematical graph identification, proportion estimation in bar charts, and pathfinding on floor maps.
3.1 Mathematical graphs: “Identify the underlying function of thepresented graph.”
The distance sonification sonifies the distance to the plotted function. The fre-quency becomes lower the closer you are to the function. Hence, it encouragesa free exploration of the whole image. We used an adapted depth-first-search tocalculate the shortest distance to the graph.
Similar to the sonification by Grond et al . [9], the value sonification sonifiesthe value of the function at the x-location of the user’s finger. Accordingly, theuser will hear a high tone, if the function’s value is high and vice versa. Asa consequence, it is only necessary to move your finger from left to right, seeFigure 2.
The following functions are used: a linear, hyperbolic, parabola, sine, square-root, and an exponential function. The function value is represented by theposition of the first non-background pixel per column.
3.2 Bar charts: “Interpret the relative dimensions between the barsin a bar chart.”
The semantic map sonification closely resembles a tactile graphic. Each textureis mapped to a different frequency (for the background and for each bar).

4 T. Wortwein, B. Schauerte, K. Muller, R. Stiefelhagen
Figure 3. Floor map as tactile graphic (left) and heat maps of frequencies of thesemantic map sonification (middle) as well as the guided sonification (right).
The value sonification again sonifies the function value or in other wordsthe height of the bars. Accordingly, the output frequency at an image locationcorresponds to the height of the bar at this location.
3.3 Floor maps: “Find the way through a corridor from one roomto another on a floor map.”
The semantic map sonification again resembles the tactile graphic, see Figure 3.The source (A) and destination (B) room, corridors, other rooms, and wallsare mapped to distinct frequencies. Thus, this sonification denotes the semanticinformation of a floor map.
To assist the task to find a path from room A to room B, the guided sonifi-cation guides the user to the destination. Therefore, a path from the source todestination is computed. The further you are away from the path the higher thefrequency. Walls are denoted with the highest frequency, while the source anddestination room share the lowest frequency. We use an A* algorithm to findthe shortest path between the two rooms. Since the shortest path is along thewalls and not centered in the corridor, we penalize pixel close to a wall based ona depth-first-search. After we calculated the path, we compute the distance tothe path in the same manner as in distance sonification.
3.4 Frequency mapping
All distances and function values are not directly mapped to output frequencies,because a twice as high frequency is not perceived as being twice as high bythe human auditory perception. Therefore, we use the Mel transformation [22]to have a meaningful auditory representation. However, too low frequencies arehardly heard, we add a constant offset just before the Mel transformation to haveperceivable frequencies. Thereby, we lose absolute relations but equal distancesare still perceived equally. Frequencies range from 51.49Hz (80 Mel) to 254.93Hz(350 Mel).
4 Experimental Evaluation
We performed experiments with six blind participants. Four of them were female.The average age was 38.2 years (SD = 8.1). All participants have normal hearing

Mobile Interactive Image Sonification for the Blind 5
Table 1. Average and standard deviation of time required by the participants tocomplete each task for all evaluated methods (in seconds).
method / task math. graphs bar charts floor maps
tactile graphics 9.5 (4.9) 28.8 (12.6) 49.4 (8.6)semantic map sonification 98.9 (28.3) 131.1 (80.5)value sonification 25.0 (6.7) 49.9 (9.1)distance/guided sonification 106.0 (43.0) 114.5 (70.2)
and use touchscreens on a daily basis. All except one participant have at leastpassed the German Abitur (A-Levels) examinations. Only two participants usetactile graphics on a regular basis (several times a month). The participants didnot have any prior training with our sonification system nor were they involvedin the development.
To exclude variations due to different hardware and software configurations(e.g ., in stimulus size), all participants used the same platform: A first generationSamsung Nexus 10 tablet (10-inch touchscreen) with Android 5.1, AKG K 701circumaural headphones and Google Chrome 47 as browser, see Figure 1.
4.1 Evaluation Methodology
All participants answered first a demographics questionnaire. To ensure a repro-duction of this experiment, the same instructions were read to all participants.In addition, they received the instructions in Braille without contractions (i.e.,Deutsche Blindenvollschrift). Our experiment consists of three tasks: mathe-matical function plots, bar charts, and floor maps. To solve each of them, threemethods were evaluated: first using tactile graphics followed by two sonificationsin random order. After each method, participants were asked the After-scenarioQuestionnaire (ASQ) on a five-point likert scale (third question is not appli-cable) to asses the usability of the methods [14]. After completing each task,participants were asked to rank the usability of the three used methods. Theoverall usability of the system was evaluated after all tasks on the positive Soft-ware Usability Scale (SUS) [7]. Each task and method had to be solved by severalexamples (six function plots, three bar charts, and three floor maps). To avoida learning effect between the methods and to have an equal difficulty for eachmethod, we varied the examples (function plots were scaled, bar charts werepermutated, and floor maps were flipped as well as rotated). The order of theexamples per method and task was randomized as well as whether and howthe example was varied. For all examples, we measured the time to complete thecurrent example and recorded the finger trajectory. In case of function plots, par-ticipants were asked to name or precisely describe the function. For bar charts,participants had to count the number of bars, name their order, and the ex-act relations relative to the smallest bar. Floor maps were evaluated whetherthey found the destination and whether they were able to describe a valid path

6 T. Wortwein, B. Schauerte, K. Muller, R. Stiefelhagen
between the source and destination room. Since many participants were not fa-miliar with mathematical functions, they were told the name of the functionafter each tactile example.
Table 2. Average and standard deviation of ASQ for all tasks and methods.
method / task math. graphs bar charts floor maps
tactile graphics 5.0 (0.0) 4.8 (0.6) 4.3 (0.8)semantic map sonification 3.8 (0.8) 3.1 (1.4)value sonification 4.0 (0.8) 3.7 (0.6)distance/guided sonification 2.2 (0.9) 2.7 (1.0)
4.2 Results
Table 1 and 2 summarize the required time and the ASQ. Let us now brieflypresent our results. If we compare our new sonifications (i.e., graph value, barvalue, and guided floor map) to the sonifications that we used in our priorpublications (i.e., graph distance, semantic bar map, and semantic floor map),we can see that the users require less time to solve the tasks with our newsonifications. The average task completion time reduced to 25.0 from 106.0, to49.9 from 98.9, and to 114.5 from 131.1 seconds for mathematical graph, barchart, and floor map understanding, respectively. For example, it can easilybe seen in Figure 2 that the value sonification requires only few, simple fingerswipes to understand the graph. But, this does not always lead to a higher usersatisfaction as measured by the ASQ. The graph value sonification is significantlybetter for the graph sonification (3.9 on the ASQ scale of 1 to 5) compared to thegraph distance sonification (2.2). But, the ASQ score of our new sonifications islower for the bar chart sonification (3.8 vs 3.7) and the floor map understanding(3.1 vs 2.7).
Compared to the tactile graphics, we still observe a substantial gap in theusers’ quantitative task performances and subjective ratings. The tactile graphicsstill perform best in terms of task completion times (9.5, 28.8, and 50.0 secondsfor graphs, bar charts, and floor maps, respectively) and ASQ scores (5.0, 4.8,and 4.3).
Overall, all users rate the intuitiveness of our mobile sonification systemas being very high, i.e. a 4.0 on the SUS scale of 1 to 5. Furthermore, eventhough our sonifications differ substantially, the whole system is perceived asbeing consistent (SUS score of 4.33).
5 Conclusion
We have tested several sonification with six blind users. We included tactilegraphics as a baseline in our evaluation. All our new sonifications reduced the

Mobile Interactive Image Sonification for the Blind 7
time that the participants require to interpret mathematical graphs, bar chartsand floor maps. Unfortunately, we observed that lower completion times do notautomatically correlate with a higher user satisfaction. Tactile graphics are stillpreferred over sonification by all but one of our participants. However, the factthat we already have users that prefer our sonification over tactile graphics isextremely promising and encouraging, because we should not forget that ourweb-based sonification is in an early technological stage and still suffers fromtechnical challenges such as, e.g., the lack of real-time capabilities in modernbrowsers (see [21]).
Although we use vibration to notify users when they leave the sonified imagearea, we have not yet used vibration as a distinct information channel, but weplan to do this as part of our future work.
Acknowledgments
We thank Giuseppe Melfi for his help during the experimental evaluation andGerhard Jaworek for being our voluntary blind user for alpha tests.
6 References
[1] M. Banf and V. Blanz. A modular computer vision sonification model forthe visually impaired. In Proc. Int. Conf. of Auditory Display, 2012.
[2] M. Banf and V. Blanz. Sonification of images for the visually impairedusing a multi-level approach. In Proc. Augmented Human Int. Conf., 2013.
[3] N. Bearman and E. Brown. Who’s sonifying data and how are they doingit? a comparison of icad and other venues since 2009. In Proc. Int. Conf.Auditory Display, 2012.
[4] J. P. Bigham, C. Jayant, H. Ji, G. Little, A. Miller, R. C. Miller, R. Miller,A. Tatarowicz, B. White, S. White, et al. Vizwiz: nearly real-time answers tovisual questions. In Proc. Ann. ACM symposium on User interface softwareand technology, pages 333–342. ACM, 2010.
[5] J. P. Bigham, C. Jayant, A. Miller, B. White, and T. Yeh. Vizwiz:: Locateit-enabling blind people to locate objects in their environment. In Proc. Com-puter Vision and Pattern Recognition Workshops (CVPRW), pages 65–72,2010.
[6] J. Bluher. About visorapps. http://en.visorapps.com/
about-visorapps/, 2015.[7] J. Brooke. SUS - a quick and dirty usability scale. Usability evaluation in
industry, 189:4–7, 1996.[8] S. Cavaco, J. T. Henriques, M. Mengucci, N. Correia, and F. Medeiros.
Color sonification for the visually impaired. Procedia Technology, 9:1048–1057, 2013.
[9] F. Grond, T. Droßard, and T. Hermann. Sonicfunction: experiments with afunction browser for the visually impaired. In Proc. Int. Conf. on AuditoryDisplay. Georgia Institute of Technology, 2010.

8 T. Wortwein, B. Schauerte, K. Muller, R. Stiefelhagen
[10] T. Hermann and A. Hunt. An introduction to interactive sonification. IEEEMultimedia, pages 20–24, 2005.
[11] T. Hermann, A. Hunt, and J. G. Neuhoff. The sonification handbook. LogosVerlag Berlin, 2011.
[12] W. Heuten, N. Henze, and S. Boll. Interactive exploration of city mapswith auditory torches. In CHI Extended Abstracts on Human Factors inComputing Systems, 2007.
[13] R. Klatzky, N. Giudice, C. Bennett, and J. Loomis. Touch-screen technologyfor the dynamic display of 2dspatial information without vision: Promiseand progress. Multisensory Research, 27(5-6):359–378, 2014.
[14] J. R. Lewis. Ibm computer usability satisfaction questionnaires: psychome-tric evaluation and instructions for use. International Journal of Human-Computer Interaction, 7(1):57–78, 1995.
[15] M. Martinez, A. Constantinescu, B. Schauerte, D. Koester, and R. Stiefel-hagen. Cognitive evaluation of haptic and audio feedback in short rangenavigation tasks. In Proc. Int. Conf. Computers Helping People with Spe-cial Needs, 2014.
[16] P. B. Meijer. An experimental system for auditory image representations.Trans. Biomedical Engineering, 39(2):112–121, 1992.
[17] F. Ribeiro, D. Florencio, P. A. Chou, and Z. Zhang. Auditory augmentedreality: Object sonification for the visually impaired. In Proc. Int. Workshopon Multimedia Signal Processing, 2012.
[18] D. Rose. Braille is spreading but who’s using it? http://www.bbc.com/
news/magazine-16984742, 2013. BBC News.[19] J. Sanchez. Recognizing shapes and gestures using sound as feedback. In
CHI Extended Abstracts on Human Factors in Computing Systems, 2010.[20] B. Schauerte, D. Koester, M. Martinez, and R. Stiefelhagen. Way to Go!
Detecting open areas ahead of a walking person. In ECCV Workshop onAssistive Computer Vision and Robotics, 2014.
[21] B. Schauerte, T. Wortwein, and R. Stiefelhagen. A web-based platformfor interactive image sonification. In Accessible Interaction for VisuallyImpaired People, 2015.
[22] S. S. Stevens, J. Volkmann, and E. B. Newman. A scale for the measurementof the psychological magnitude pitch. The Journal of the Acoustical Societyof America, 8(3):185–190, 1937.
[23] J. Su, A. Rosenzweig, A. Goel, E. de Lara, and K. N. Truong. Timbremap:enabling the visually-impaired to use maps on touch-enabled devices. InProc. Int. Conf. Human computer interaction with mobile devices and ser-vices, 2010.
[24] M. Taibbi, C. Bernareggi, A. Gerino, D. Ahmetovic, and S. Mascetti. Au-diofunctions: Eyes-free exploration of mathematical functions on tablets.In Computers Helping People with Special Needs: 14th International Con-ference, ICCHP 2014, Paris, France, July 9-11, 2014, Proceedings, Part I,pages 537–544, 2014.
[25] T. Yoshida, K. M. Kitani, H. Koike, S. Belongie, and K. Schlei. Edgesonic:image feature sonification for the visually impaired. In Proc. AugmentedHuman Int. Conf., 2011.