Mobile Industry Overview & Average Revenue Per (Mobile) User in Pakistan
8
Mobile Industry Overview & Average Revenue Per (Mobile) User in Pakistan Pakistan, like many other developing countries, has seen an explosion in its mobile communications market in recent years; from 2004 to 2007, the number of subscribers in the country more than doubled annually. By 2008, according to the Pakistan Telecommunication Authority (PTA), there were some 94.3 million subscribers, compared to only 5 million at the beginning of 2004. [1] Pakistan has also become a regional leader in the mobile communications market. Pakistan overtook India in 2005 and Sri Lanka in 2007 in the rate of mobile SIM card subscriptions per 100 residents. This is despite the fact that Pakistan is less densely populated than either country. During the 2008-09 financial year mobile access growth seems to have plateau compared to previous years. The PTA has attributed this to the saturation of many urban markets have become saturated. However, the overall mobile communications subscribership did grow at an estimated 6 percent. The PTA estimates that 58.2 percent of the population are subscribers. In the 2008 national survey, some 63 percent of respondents said they have household access to a mobile phone, while about 75 percent said that they have a mobile phone available to them somewhere-at home or elsewhere. Here are the results shown in the survey done by the Pakistan Telecommunications Authority recently. CELLULAR SUBSCRIBERS Mobilink Ufone Zong Instaphone Telenor Warid Total Growth Rate % 2000 114,272 80,221 112,000 306,493 15.39 2001 309,272 116,711 96,623 220,000 742,606 142.29 2002 800,000 350,000 218,536 330,000 1,698,536 128.73 2003 1,115,000 550,000 319,400 420,000 2,404,400 41.56 2004 3,215,989 801,160 470,021 535,738 5,022,908 108.90 2005 7,469,085 2,579,103 924,486 454,147 835,727 508,655 12,771,203 154.26 2006 17,205,555 7,487,005 1,040,503 336,696 3,573,660 4,863,138 34,506,557 170.2 2007 26,466,451 14,014,044 1,024,563 333,081 10,701,332 10,620,386 63,159,857 80.70 2008 32,032,363 18,100,440 3,950,758 351,135 18,125,189 15,489,858 88,019,812 39.4 2009 29,136,839 20,004,707 6,386,571 34,048 20,893,129 17,886,736 94,342,030 1.30
-
Upload
shirjeelzafar -
Category
Documents
-
view
216 -
download
0
Transcript of Mobile Industry Overview & Average Revenue Per (Mobile) User in Pakistan
8/9/2019 Mobile Industry Overview & Average Revenue Per (Mobile) User in Pakistan
http://slidepdf.com/reader/full/mobile-industry-overview-average-revenue-per-mobile-user-in-pakistan 1/8
Mobile Industry Overview & Average Revenue Per (Mobile) User in
Pakistan
Pakistan, like many other developing countries, has seen an explosion in its mobile
communications market in recent years; from 2004 to 2007, the number of subscribersin the country more than doubled annually. By 2008, according to the PakistanTelecommunication Authority (PTA), there were some 94.3 million subscribers,compared to only 5 million at the beginning of 2004. [1] Pakistan has also become a regional leader in the mobile communications market.Pakistan overtook India in 2005 and Sri Lanka in 2007 in the rate of mobile SIM cardsubscriptions per 100 residents. This is despite the fact that Pakistan is less denselypopulated than either country.During the 2008-09 financial year mobile access growth seems to have plateaucompared to previous years. The PTA has attributed this to the saturation of manyurban markets have become saturated. However, the overall mobile communicationssubscribership did grow at an estimated 6 percent. The PTA estimates that 58.2 percent of the population are subscribers. In the 2008 national survey, some 63 percent of respondents said they have household access to a mobile phone, while about 75 percent said that they have a mobile phone available to them somewhere-at home or elsewhere.
Here are the results shown in the survey done by the Pakistan TelecommunicationsAuthority recently.
CELLULAR SUBSCRIBERS
Mobilink Ufone Zong Instaphone Telenor Warid Total Growth
Rate %
2000 114,272 80,221 112,000 306,493 15.39
2001 309,272 116,711 96,623 220,000 742,606 142.29
2002 800,000 350,000 218,536 330,000 1,698,536 128.73
2003 1,115,000 550,000 319,400 420,000 2,404,400 41.56
2004 3,215,989 801,160 470,021 535,738 5,022,908 108.90
2005 7,469,085 2,579,103 924,486 454,147 835,727 508,655 12,771,203 154.26
2006 17,205,555 7,487,005 1,040,503 336,696 3,573,660 4,863,138 34,506,557 170.2
2007 26,466,451 14,014,044 1,024,563 333,081 10,701,332 10,620,386 63,159,857 80.70
2008 32,032,363 18,100,440 3,950,758 351,135 18,125,189 15,489,858 88,019,812 39.4
2009 29,136,839 20,004,707 6,386,571 34,048 20,893,129 17,886,736 94,342,030 1.30

8/9/2019 Mobile Industry Overview & Average Revenue Per (Mobile) User in Pakistan
http://slidepdf.com/reader/full/mobile-industry-overview-average-revenue-per-mobile-user-in-pakistan 2/8
July-09 29,551,075 20,057,079 6,486,338 11,917 21,299,334 18,141,542 95,547,285 1.28
Aug-09 29,840,415 19,607,299 6,556,697 3,575 21,428,286 18,347,366 95,783,638 0.25
Sep-09 30,046,050 19,104,594 6,629,761 1,073 21,658,592 18,468,208 95,908,277 0.13
Oct-09 30,275,979 18,329,967 6,752,031 1,073 21,975,271 18,584,409 95,918,729 0.01
Nov-09 30,480,398 18,361,072 6,869,174 1,073 22,279,449 18,718,419 96,709,585 0.83
Dec-09 30,800,354 18,510,175 6,920,234 1,073 22,500,789 18,847,315 97,579,940 0.93
Jan-10 31,063,901 18,577,750 6,933,634 1,073 22,640,060 16,192,927 95,409,354 -2.22
Feb-10 31,300,892 18,789,447 6,965,758 1,073 22,950,858 16,223,201 96,231,229 0.86
SCO Cellular Subscribers are 285,072
Note: Including AJK & NAs
CELLULAR MOBILE DENSITY
Year Mobile Density 2000 0.22 2001 0.52 2002 1.16 2003 1.61 2004 3.29 2005 8.30 2006 22.21
2007 39.94
2008 54.60
2009 58.20
July - 2009 58.50
Aug - 2009 58.50
Sep - 2009 58.60 Oct - 2009 58.60
Nov - 2009 59.03
Dec - 2009 59.60
Jan - 2010 58.20
Feb - 2010 58.70
Note: Including AJK & NAs
Table1: Mobile Cellular Services – Survey PTA [1]
8/9/2019 Mobile Industry Overview & Average Revenue Per (Mobile) User in Pakistan
http://slidepdf.com/reader/full/mobile-industry-overview-average-revenue-per-mobile-user-in-pakistan 3/8
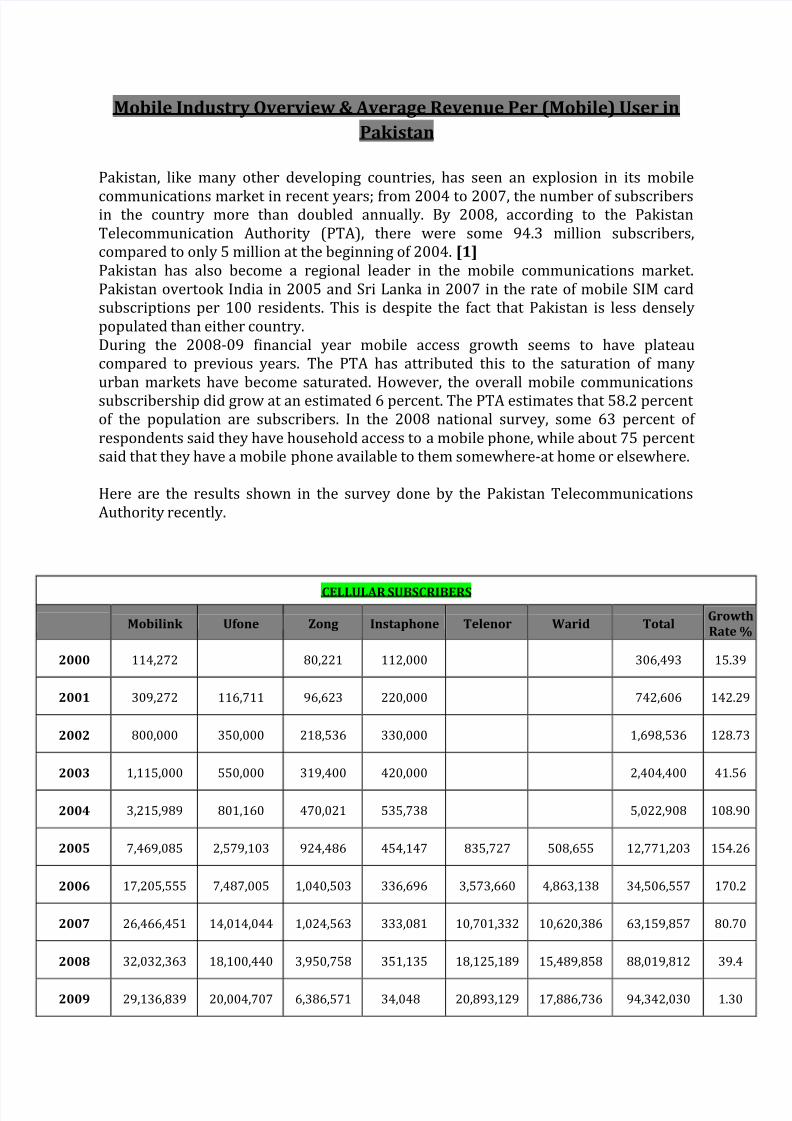
House-hold Mobile Phone access in Urban & Rural areas:
Fifty-nine percent of rural survey respondents said they have household access to a
mobile phone, versus 82 percent of urban respondents. Working to bridge this gap is
Pakistan's Universal Service Fund (USF), which was established in 2006 and is fundedby a 1.5 percent levy on telecommunications operators’ adjusted revenues. Subsidies
provided by the USF go toward extending basic telephony and data services
(http://www.usf.org.pk/Rural-Telecom-Programme.aspx). Despite the slowdown in
mobile access growth, the telecoms industry, with the help of the USF, has continued to
expand its service coverage areas. In fact, the number of cell tower sites in the country
increased 31 percent from 2008 to 2009 from 21,518 to 28,124.
Figure1: Income Level with Mobile Phone Access in Pakistan [2]
8/9/2019 Mobile Industry Overview & Average Revenue Per (Mobile) User in Pakistan
http://slidepdf.com/reader/full/mobile-industry-overview-average-revenue-per-mobile-user-in-pakistan 4/8
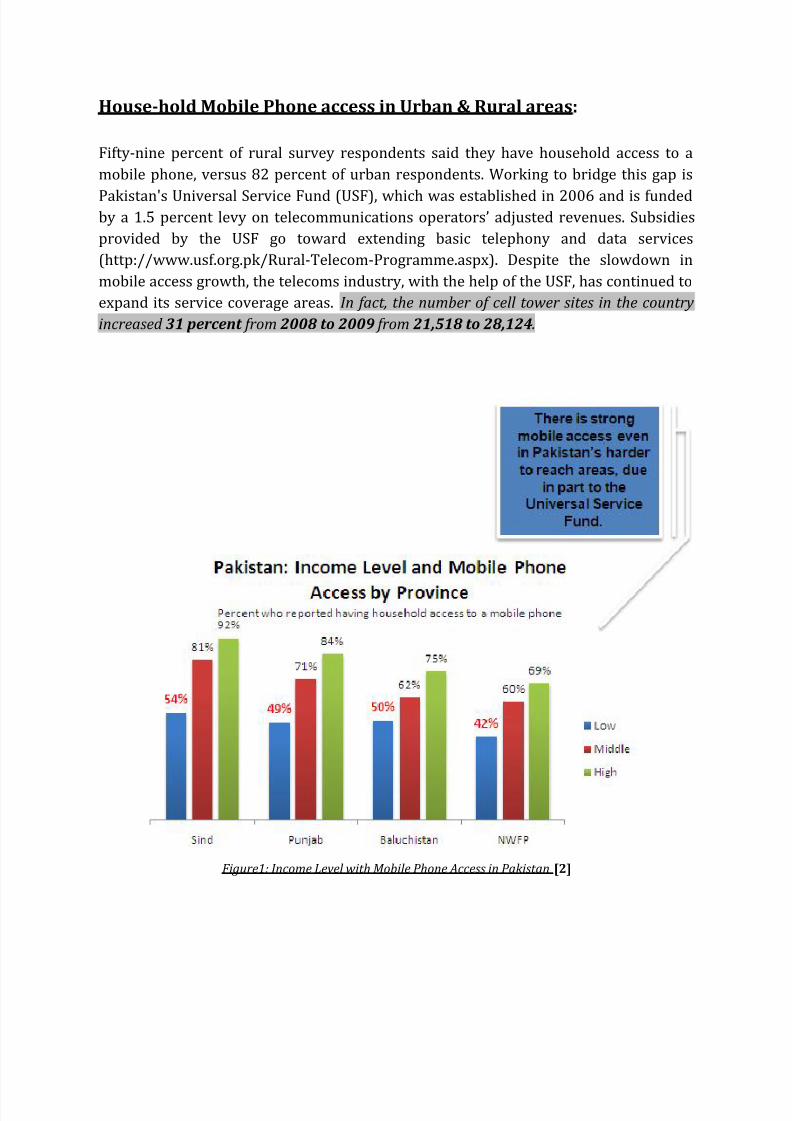
Recent Market Developments:
Despite the sector’s overall growth, profitability has been difficult to come by for many
of Pakistan’s service operators. In recent years, operators have been burdened by falling ARPUs (monthly average revenue per user), which decreased from an industry-wide
$9.00 in the 2003-04 financial year to $2.50 in 2009, as a majority of new mobilesubscribers are using prepaid SIM cards and are low-income users. They tend to beheavy users of voice services instead of data services, which are generally moreprofitable.In response, providers have begun to offer more non-voice value-added services such asmobile banking, mobile music and cultural services like Quranic recitation, Branchless
Banking, Mobile Internet, Mobile TV, Mobile Kiosk Services and many more.
Operators also have adapted their pricing schemes, as mentioned above. Thegovernment responded by the tougher market conditions by lowering certain tariffs.
For example, in 2009, the PTA cut the industry’s activation tax by 50 percent andreduced the import duty and regulatory charges on mobile handsets by 67 percent.
Pakistan is the world’s third fastest growing telecommunications market,1 adding on anaverage two million cellular subscribers per month, following India which is the world’sfastest growing mobile services market, adding on an average more than 8 millionsubscribers per month. However, Pakistan as of June 2008 had a total of 58.9% access
paths/ 100 people compared to 29.08 in India. The South Asian region as whole offers a
fertile ground for the growth of telecommunications. [3]
Figure2: Growth of Subscriber-base, Key Market/Regulatory Event, and Reduction in Tariff -Pakistan [3]

8/9/2019 Mobile Industry Overview & Average Revenue Per (Mobile) User in Pakistan
http://slidepdf.com/reader/full/mobile-industry-overview-average-revenue-per-mobile-user-in-pakistan 5/8
Telecomm Revenues:
The telecom sector revenue showed a 19.8% growth during 2008-09 compared to 18.2% inprevious year. During the year 2008-09, the telecom sector generated revenue to the tune of PKR. 333.9 billion, as compared to the last year's Rs. 278.5 billion. The cellular mobile sector
continued to be the leader in telecom revenue, whose share came out to be 64% in the totaltelecom revenues. The cellular mobile sector showed about 17% positive growth during thefiscal year 2008-09.
Figure3: Telecommunication Revenue statistics - Pakistan [4]
Cellular Mobile is the only segment that showed an encouraging growth pattern duringa tough year [2008-09] for Pakistan telecom sector.
Pakistan mobile market hosts some of the world’s largest and most experienced telecom
companies including Orascom, Telenor (Norway), Warid Telecom (Abu Dhabi Group),China Mobile and Etisalat, a UAE based company. These companies have heavily
invested in Pakistan to lay down the infrastructure and take mobile services to everynook and corner of the country. With the encouragement of Government of Pakistan andbest efforts by the regulator as well as the determined mobile operators, the sector hasrecovered from slow growth of past few months. Nonetheless, there is escalation inmobile penetration up to 7.4%, as the total mobile subscribers have reached to 94.3million, with more than 90% of the country having mobile service access.
As for competitive environment in the sector, there is intense competition among all 5operators. Since the market shares of all the operators have marginal difference and thegap between the market leader (Mobilink) and the rest of the operators is rapidly
narrowing, the companies are now getting into a price war, whereby undercutting eachother for Voice and SMS services is resulting into higher financial burden on the

8/9/2019 Mobile Industry Overview & Average Revenue Per (Mobile) User in Pakistan
http://slidepdf.com/reader/full/mobile-industry-overview-average-revenue-per-mobile-user-in-pakistan 6/8
companies. The operators have come to launch a range of value added services like Mobile
banking, Mobile Internet, Music Library, Utility Bills Payment, Stock Market Updates, Voice
Messaging, GPRS services, etc. that would help industry to improve ARPUs.
The regulator, operators and the Government, in their own respective spheres, have
been taking care of the mobile subscribers in Pakistan. The steps taken by these threeare bringing value added services, increased accessibility; better quality, lower tariffsand better value for money. PTA has estimated that cellular mobile subscribers wouldcross 102 million by 2011 in Pakistan.
In 2008-09, the cellular mobile companies in Pakistan added over 6.3 millionsubscribers, while the previous year, the addition was about 25 million, suggesting that the subscription grew by 7% this year, but it was over 39% in 2007-08. Saturation inthe market, Economic slowdown and heavy taxes could be major reason for this slowgrowth which the added mobile acquisition costs.
Figure3: Mobile Subscription statistics of Mobile Networks in Pakistan [4]

8/9/2019 Mobile Industry Overview & Average Revenue Per (Mobile) User in Pakistan
http://slidepdf.com/reader/full/mobile-industry-overview-average-revenue-per-mobile-user-in-pakistan 7/8
ARPU of Mobile Network Operators:
Until recently, the mobile operators in Pakistan enjoyed handsome ARPUs; however, forthe last couple of years especially after the global trend, the domestic ARPUs have been
falling sharply. Today, the industry's ARPU stands at 2.48 US$ per month. Majority of the prepaid connection holders are low-income users.
Figure3: ARPU of Mobile Network Companies in Pakistan [4]
They tend to be heavy users of voice rather than data services, thus resulting intolow ARPUs to the operators. As the operators have heavily invested on networks inPakistan and higher voice usage is not sufficient for improving ARPUs, the operatorshave to focus more on value added services for better returns.
Unfortunately, Pakistani mobile users generally use basic non-voice, SMS service,which is not a major revenue generation activity. With the introduction of more non-voice services like mobile banking, mobile music and culture- based services likeQuran recitation, the ARPU can be increased. The non-voice ARPU would hopefullyshow positive signs in the future, which would help improve the industry's ARPU.Mobilink has the highest ARPUs of US$ 3.04, followed by Telenor with US$ 2.85 andUfone with US$ 2.20. As for Data ARPU, Mobilink and Ufone have maximum dataARPUs, whereas Warid and Zong stand at number two with US$ 0.17. Thesecompanies are believed to be providing more value added services and better SMSpackages. [4]
Conclusion:
Pakistan's mobile cellular segment had been growing at a very fast pace; however, recently,the signs of slow down have indicated slow growth in subscriber base, penetration andrevenues. The international research companies still consider Pakistan to be a lucrativemarket as there still remains a portion of unmet demand in certain areas. Sector has alreadyshown signs of recovery. Pakistan would hopefully cross the number of 102 millionsubscribers by the next two year. However, in order to address low ARPUs, the need toboost data usage has increased. The operators are putting in their best efforts to introduce
data service, but the low local content availability and high low income prepaid base is notallowing them to grow on data services. Hopefully, once 3G licensing is completed, the

8/9/2019 Mobile Industry Overview & Average Revenue Per (Mobile) User in Pakistan
http://slidepdf.com/reader/full/mobile-industry-overview-average-revenue-per-mobile-user-in-pakistan 8/8
subscribers would be in better position to use enhanced data service on better speed, and thebusiness community will be benefited largely from it.
References:
[1]. “Indicators: Mobile Cellular Services”. Pakistan Telecommunication Authority. Updated
11 March 2010. Accessed March 2010.
http://www.pta.gov.pk/index.php?option=com_content&task=view&id=650&Itemid=6
03.
[2]. http://www.audiencescapes.org/country-profiles-pakistan-country-overview-mobile-
communications
[3]. http://lirneasia.net/wp-content/uploads/2009/07/TRE_Pakistan-
Final_2009Jan22.pdf
[4]. PTA – Annual Report 2009
Links:
http://www.audiencescapes.org/country-profiles-pakistan-country-overview-mobile-communications
http://www.usf.org.pk/Rural-Telecom-Programme.aspx
http://www.usf.org.pk/newsdescription.aspx?77
lirneasia.net/search/?cx=005600070838260215994%3Azquvduehpzm&cof=FORID%3A11&ie=UTF-
8&q=pakistan+mobile&sa=Search&siteurl=lirneasia.net%2Fsearch%2F&siteurl=lirneasia.net%2Fsearch
%2F#1184http://telecompk.net/tag/arpu/
http://portal.acm.org/citation.cfm?id=1539818 (The transformation of the mobile
telecommunications industry in Pakistan: A developing country perspective Source
((downloaded)
http://www.docstoc.com/
http://www.pakboi.gov.pk/eletter/News%20&%20Reports/PTA%20Industry%
20Analysis%20Report%202007.pdf (downloaded)