
Mobile Health Monitoring System - WSEAS · Mobile Health Monitoring System ... Wireless local area...
6
Mobile Health Monitoring System FAZLUR RAHMAN School of Electrical and Electronic Engineering Singapore Polytechnic 500 Dover Road, Singapore 139651 SINGAPORE http://www.sp.edu.sg Abstract: - A mobile health monitoring system for physiological studies and for assisting patient-centric health care management is developed. Pulse oximeter and temperature sensor are employed for data acquisition along with appropriate design of signal conditioning circuit. The system uses network approach to acquire the data from sensors and transmit them to a server through wireless propagation means. The system automates the acquisition and monitoring of physiological parameters by continuous display on the monitor screen. Programming is done using industry strength software to display data and trends in real time on a standard PC. The measured data is accurate and lives up to the standards of the industry. Key-Words: - Data acquisition, Health monitoring, Physiological measurement, Sensors, Signal conditioning, Transducers, Wireless local area network 1 Introduction In today’s modern world, many health monitoring devices are being developed to improve the well being and quality of life of individuals. The development of low cost transducers, sensors and PC hardware has enabled us to bring health care from hospital to home environment. For patient care, there are various vital physiological parameters that need to be monitored and rarely a single, low cost device can meet this requirement. Real-time, continuous monitoring for emergency detection of an abrupt change of a person’s health condition is required. In particular, an ambulatory system that would allow long term monitoring of mobile subjects is highly in demand. Numerous physiological, biomechanical and peripheral parameters have been data logged [1] successfully using ambulatory monitoring [2] including electroencephalography (EEG) [3] and blood pressure [4] among others. A flexible PC-based physiological monitoring system for animal experiments has also been developed [5]. A challenging issue is to satisfy the varying requirements for the collection of different parameters due to differing characteristics of the signal being measured. A ring sensor to monitor heart rate and oxygen saturation in a totally unobtrusive way has been developed [6]. A wearable garment that functions as a wearable health monitoring system [7] is developed. It can record heart rate, body temperature, motion, position and barrier penetration. The paper discusses future possible developments in wearable systems as well as the resulting transformation of healthcare and positive impact on the quality of life of individuals. Wireless approach to develop personal health monitoring [8] system based on wireless body area network of intelligent sensors has been developed [9]. PDA-based devices and more generally by mobile computing tools relying on IEEE 802.11b (wLAN), Bluetooth (wPAN) and cell phone technology (wMAN) is made used to integrate wearable technology into neurorehabilitation and consumer-centered mobile telerehabilitation [10]. Among the widely accepted physiological [11] indices, temperature, muscle strain, heart rate and oxygen saturation signals are a few of the important indicators of health condition. These indices can deliver abundant information about the health condition of a patient, provided that they can be monitored continuously over a reasonable duration of time, recorded and analysed. Although the physiological parameters are measured and monitored locally, the existing systems are bulky and lack the capability of transmitting the data for processing and diagnosis over the internet to a remote location. Usually, physiological data are provided by independent monitors, which, in the Proceedings of the 8th WSEAS Int. Conference on Automatic Control, Modeling and Simulation, Prague, Czech Republic, March 12-14, 2006 (pp340-345)
Transcript of Mobile Health Monitoring System - WSEAS · Mobile Health Monitoring System ... Wireless local area...

Mobile Health Monitoring System
FAZLUR RAHMAN School of Electrical and Electronic Engineering
Singapore Polytechnic 500 Dover Road, Singapore 139651
SINGAPORE http://www.sp.edu.sg
Abstract: - A mobile health monitoring system for physiological studies and for assisting patient-centric health care management is developed. Pulse oximeter and temperature sensor are employed for data acquisition along with appropriate design of signal conditioning circuit. The system uses network approach to acquire the data from sensors and transmit them to a server through wireless propagation means. The system automates the acquisition and monitoring of physiological parameters by continuous display on the monitor screen. Programming is done using industry strength software to display data and trends in real time on a standard PC. The measured data is accurate and lives up to the standards of the industry. Key-Words: - Data acquisition, Health monitoring, Physiological measurement, Sensors, Signal conditioning, Transducers, Wireless local area network 1 Introduction In today’s modern world, many health monitoring devices are being developed to improve the well being and quality of life of individuals. The development of low cost transducers, sensors and PC hardware has enabled us to bring health care from hospital to home environment. For patient care, there are various vital physiological parameters that need to be monitored and rarely a single, low cost device can meet this requirement. Real-time, continuous monitoring for emergency detection of an abrupt change of a person’s health condition is required. In particular, an ambulatory system that would allow long term monitoring of mobile subjects is highly in demand. Numerous physiological, biomechanical and peripheral parameters have been data logged [1] successfully using ambulatory monitoring [2] including electroencephalography (EEG) [3] and blood pressure [4] among others. A flexible PC-based physiological monitoring system for animal experiments has also been developed [5]. A challenging issue is to satisfy the varying requirements for the collection of different parameters due to differing characteristics of the signal being measured. A ring sensor to monitor heart rate and oxygen saturation in a totally unobtrusive way has been developed [6]. A wearable garment that functions as a wearable health
monitoring system [7] is developed. It can record heart rate, body temperature, motion, position and barrier penetration. The paper discusses future possible developments in wearable systems as well as the resulting transformation of healthcare and positive impact on the quality of life of individuals. Wireless approach to develop personal health monitoring [8] system based on wireless body area network of intelligent sensors has been developed [9]. PDA-based devices and more generally by mobile computing tools relying on IEEE 802.11b (wLAN), Bluetooth (wPAN) and cell phone technology (wMAN) is made used to integrate wearable technology into neurorehabilitation and consumer-centered mobile telerehabilitation [10]. Among the widely accepted physiological [11] indices, temperature, muscle strain, heart rate and oxygen saturation signals are a few of the important indicators of health condition. These indices can deliver abundant information about the health condition of a patient, provided that they can be monitored continuously over a reasonable duration of time, recorded and analysed. Although the physiological parameters are measured and monitored locally, the existing systems are bulky and lack the capability of transmitting the data for processing and diagnosis over the internet to a remote location. Usually, physiological data are provided by independent monitors, which, in the
Proceedings of the 8th WSEAS Int. Conference on Automatic Control, Modeling and Simulation, Prague, Czech Republic, March 12-14, 2006 (pp340-345)

Pulse Oximeter
Temperature Transducer
DAQ Card
Laptop Computer
RS-232
Server
Wireless
WWW
Fig. 1: Block Diagram of the System
+
U1OPAMP 741
1k
1 M
1.5k
39k
GND
8.2k
68k
-3.5V
15k
5.6k
+3.5V
470k
Output
470k
TP
absence of real-time collation, preclude quick assessment of all physiological variables [12]. In this paper we have developed a mobile health monitoring system which is low cost, portable and able to monitor multiple health parameters. The data collected is stored in a central computer, transmitted to a server through a wireless network [13] and this data can be accessed over the internet. 2 Design A block diagram of the physiological system is shown in Fig. 1. The system consists of several one sensor connected to the laptop computer through the DAQ Card and one sensor is connected directly to the RS232 port of the laptop computer. The data is logged onto the laptop and also transmitted to a server through a wireless local area network. The data on the server can be viewed by medical personnel via internet for diagnosis as well as monitoring purpose.
2.1 Pulse Oximeter Arterial blood hemoglobin oxygen saturation and the pulse frequency is measured non-invasively using a pulse oximeter. The blood volume changes during the systole and diastole, which has an effect on the light absorption. The light sources for this measurement are a red and an infrared LED, and a photodiode acts as detector. The pulse oximeter measures the ratio of red to infrared pulsating absorption, which is directly proportional to the oxygen saturation. In addition, the time interval between pulsations is converted into the pulse frequency.
2.2 Temperature Transducer Temperature transducer [14] is used to measure the skin temperature at the wrist. The sensor chip is placed in close thermal contact to the steel disk ensuring fastest possible temperature stabilization. The temperature probe measures the skin temperature and a signal conditioning circuit (Fig. 2) is designed to convert the resistance change into an equivalent voltage signal. The probe has a measuring range of 25 °C to 50 °C, with a measuring accuracy of ± 0.1°C of reading. 2.3 Signal Conditioning Signal conditioning circuit for temperature sensor is as shown in Fig. 2.
Fig. 2 Signal conditioning circuit for temperature
sensor The temperature sensor is calibrated as given in the following steps: • Insert a resistance of 2184 Ω (equivalent of
25ºC) in place of the temperature probe (TP). • Measure the output voltage and make the output
voltage to about 4V by tuning the 1 MΩ variable resistor.
• Insert a resistance of 1108 Ω (equivalent of 42ºC) in place of the temperature probe (TP).
• Measure the output voltage and make the output voltage to 5.6 V by tuning the 1 kΩ variable resistor.
Proceedings of the 8th WSEAS Int. Conference on Automatic Control, Modeling and Simulation, Prague, Czech Republic, March 12-14, 2006 (pp340-345)

Fig. 4: Front Panel
Fig. 5: VI Diagram
After calibration, the temperature sensor will measure the temperature between 25 ºC and 42 ºC with the corresponding voltage of 4 V and 5.6 V respectively (Fig. 3). The circuit will output an equivalent voltage when the temperature sensor changes its impedance accordingly.
Fig. 3: Two point calibration of Temperature Sensor
3 Hardware and Software The hardware system consists of one individual sensor connected to the laptop computer through the DAQ (data acquisition) card and one sensor is connected directly to the RS232 port of the laptop computer (Fig. 1). The laptop is interfaced with a PCMCIA 12-bit resolution data acquisition card. External signals from physiological sensors are fed to the DAQ input channels. For each analogue input channel the DAQ card samples the signal at a rate of 200 samples/sec. This is sufficient to capture the salient features of the various signals coming in. The data is logged onto the laptop computer and is also transmitted to a server through a wireless local area network (LAN). The Ethernet link through the server makes it possible to view the data by any other computer connected to it and helps medical personnel to access this data via internet for diagnosis and monitoring purpose. The system also has self monitoring facility, so that measurement outside set limits or thresholds generate an alarm signal. The portable system has battery pack to power the system. The main program is written using National Instrument’s LabVIEW® software and is used to log the data into the computer. The program captures, analyses, displays and transmits the data to the central server. The program checks if the data directory exists on the computer, whether files may be created in the directory and written to. This is necessary to guarantee that data can be written to a
file, since many networks and operating systems enforce strict schemes for file protection. When the program is started, it prompts for the name or identification of the subject whose physiological parameters need to be monitored. This name is used to specify a unique file for storing the acquired data. Existing records for the same subject is untouched and new data are appended at the end of the file every time the program is restarted. The Front panel (graphical user interface) is as shown in Fig. 4 and the virtual instrumentation (VI) diagram is shown in Fig. 5. Due to space constraint only a part of the VI diagram screen capture is shown in the paper. Separate software modules handle each type of input. By using this approach one is able to add different types of inputs at a later stage. The pulse oximeter data is received by the serial port software module, which continuously receives the heart rate and the SpO2 data in ASCII text format. If the sensor is not connected properly, an error data is received. The analogue voltage input software module receives the temperature data.
Temperature
Volts
5.6 V
4 V
25 °C 42 °C
Proceedings of the 8th WSEAS Int. Conference on Automatic Control, Modeling and Simulation, Prague, Czech Republic, March 12-14, 2006 (pp340-345)

3.1 Server Set-up On the server, LabVIEW® web server option is enabled and configured for this application. The TCP/IP option under the VI server setup in LabVIEW® is disabled to avoid the configuration clash with the web server setup. The root directory for the server is configured as a shared directory. The laptop (data collection station) that is used to collect the physiological parameter data is given remote wireless access to write into this shared server directory. The shared directory is password protected to avoid unauthorized access. Inside the shared directory a user data file is created to record the user’s name and identification number. Each time a user logs into the data collection station to record his physiological parameters, the persons name is checked against the user data file records and then it is decided whether the person is a new user or an existing user. For a new user, a new set of files (data file, trend graph picture file and html file to show trend graph on the web) is created. Also, for a new user, a set of lines are added to the index file in the server, these lines indicate the person’s identity and also the path for the person’s data file and trend graph file on the server. For an existing user the previous data file belonging to the user is picked up from the server and the new data entry is appended to the existing data file. The file is then transferred back to the server. At the same time the LabVIEW® program on the laptop generates a trend graph from the user’s present and previous data and the picture file of this trend graph is also stored onto the server. The index file of the server will show up all the selectable user names whose data is available on the server. It also provides the option to the user to see either the trend graph or the raw data file. The Cisco systems CISCO® AIRONNET 350 series wireless LAN adapter card on the data collection station and the CISCO® AIRONET 350 series wireless access point on the server side are configured for the wireless data transfer from the data collection station to the server. The maximum distance for wireless transmission between base station and server is 200 m. 4 Results The data obtained from the sensor through the data acquisition (DAQ) board is logged on to the laptop computer and the trends are displayed as shown in
Fig. 6. It shows an actual screen capture of the subject’s physiological parameters. The graph represents temperature, pulse rate and SpO2 data respectively in addition height and weight data are also displayed which is not discussed in this paper. The temperature is displayed in degree Celsius, the pulse rate in number of beats per minute and the SpO2 in percentage respectively. These variables were recorded for every 50 samples. This data can be sent to a server through a wireless local area network as explained earlier. The data and trends from the server can be viewed by the medical personnel anywhere, anytime.
Fig. 6: Screen capture of the monitoring system
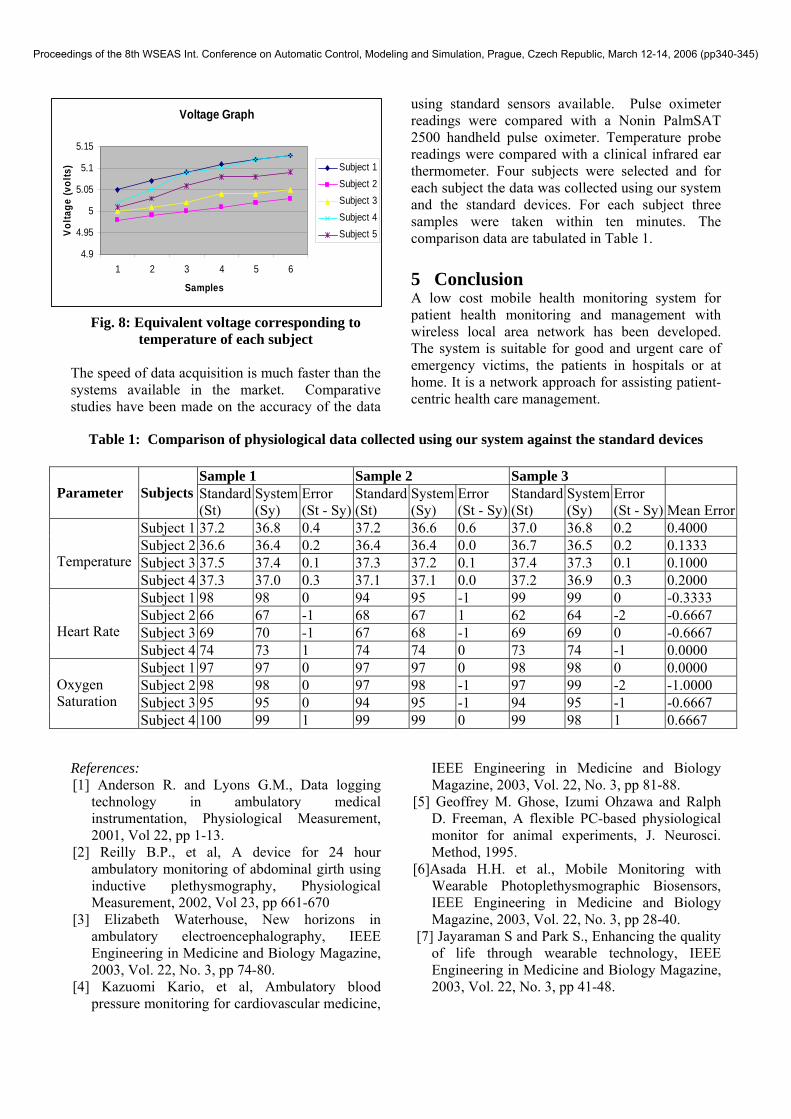
The temperature of five subjects recorded using the temperature probe is shown in Fig. 7. After signal conditioning and calibration which was done earlier the voltage signal for each of the five subjects are shown in Fig. 8.
Temperature Graph
33.534.034.535.035.536.036.537.037.5
1 2 3 4 5 6
Samples
Tem
peru
atre
(deg
)
Subject 1Subject 2Subject 3Subject 4Subject 5
Fig. 7: Body Temperature of different subjects
Proceedings of the 8th WSEAS Int. Conference on Automatic Control, Modeling and Simulation, Prague, Czech Republic, March 12-14, 2006 (pp340-345)
Voltage Graph
4.9
4.95
5
5.05
5.1
5.15
1 2 3 4 5 6
Samples
Volta
ge (v
olts
) Subject 1Subject 2Subject 3Subject 4Subject 5
Fig. 8: Equivalent voltage corresponding to temperature of each subject
The speed of data acquisition is much faster than the systems available in the market. Comparative studies have been made on the accuracy of the data
using standard sensors available. Pulse oximeter readings were compared with a Nonin PalmSAT 2500 handheld pulse oximeter. Temperature probe readings were compared with a clinical infrared ear thermometer. Four subjects were selected and for each subject the data was collected using our system and the standard devices. For each subject three samples were taken within ten minutes. The comparison data are tabulated in Table 1. 5 Conclusion A low cost mobile health monitoring system for patient health monitoring and management with wireless local area network has been developed. The system is suitable for good and urgent care of emergency victims, the patients in hospitals or at home. It is a network approach for assisting patient-centric health care management.
Table 1: Comparison of physiological data collected using our system against the standard devices
References: [1] Anderson R. and Lyons G.M., Data logging
technology in ambulatory medical instrumentation, Physiological Measurement, 2001, Vol 22, pp 1-13.
[2] Reilly B.P., et al, A device for 24 hour ambulatory monitoring of abdominal girth using inductive plethysmography, Physiological Measurement, 2002, Vol 23, pp 661-670
[3] Elizabeth Waterhouse, New horizons in ambulatory electroencephalography, IEEE Engineering in Medicine and Biology Magazine, 2003, Vol. 22, No. 3, pp 74-80.
[4] Kazuomi Kario, et al, Ambulatory blood pressure monitoring for cardiovascular medicine,
IEEE Engineering in Medicine and Biology Magazine, 2003, Vol. 22, No. 3, pp 81-88.
[5] Geoffrey M. Ghose, Izumi Ohzawa and Ralph D. Freeman, A flexible PC-based physiological monitor for animal experiments, J. Neurosci. Method, 1995.
[6]Asada H.H. et al., Mobile Monitoring with Wearable Photoplethysmographic Biosensors, IEEE Engineering in Medicine and Biology Magazine, 2003, Vol. 22, No. 3, pp 28-40.
[7] Jayaraman S and Park S., Enhancing the quality of life through wearable technology, IEEE Engineering in Medicine and Biology Magazine, 2003, Vol. 22, No. 3, pp 41-48.
Sample 1 Sample 2 Sample 3 Parameter
Subjects
Standard (St)
System (Sy)
Error (St - Sy)
Standard(St)
System(Sy)
Error (St - Sy)
Standard (St)
System (Sy)
Error (St - Sy) Mean Error
Subject 1 37.2 36.8 0.4 37.2 36.6 0.6 37.0 36.8 0.2 0.4000 Subject 2 36.6 36.4 0.2 36.4 36.4 0.0 36.7 36.5 0.2 0.1333 Subject 3 37.5 37.4 0.1 37.3 37.2 0.1 37.4 37.3 0.1 0.1000
Temperature
Subject 4 37.3 37.0 0.3 37.1 37.1 0.0 37.2 36.9 0.3 0.2000 Subject 1 98 98 0 94 95 -1 99 99 0 -0.3333 Subject 2 66 67 -1 68 67 1 62 64 -2 -0.6667 Subject 3 69 70 -1 67 68 -1 69 69 0 -0.6667
Heart Rate
Subject 4 74 73 1 74 74 0 73 74 -1 0.0000 Subject 1 97 97 0 97 97 0 98 98 0 0.0000 Subject 2 98 98 0 97 98 -1 97 99 -2 -1.0000 Subject 3 95 95 0 94 95 -1 94 95 -1 -0.6667
Oxygen Saturation
Subject 4 100 99 1 99 99 0 99 98 1 0.6667
Proceedings of the 8th WSEAS Int. Conference on Automatic Control, Modeling and Simulation, Prague, Czech Republic, March 12-14, 2006 (pp340-345)

[8] Fazlur Rahman et al, Network approach for Physiological Parameter Measurement, IEEE Transactions on Instrumentation and Measurement. 2005, Vol 54, No.1, pp 337-346.
[9] Jovanov E. et al., Stress Monitoring using a distributed wireless intelligent sensor system, IEEE Engineering in Medicine and Biology Magazine, 2003, Vol. 22, No. 3, pp 49-55.
[10] Winters J.M., et al, Wearable sensors and telerehabilitation, IEEE Engineering in Medicine and Biology Magazine, 2003, Vol. 22, No. 3, pp 56-65.
[11] Rowan D., Clinical physics and physiological measurement bibliography. Diagnostic investigations of the lower urinary tract, Clin.
Phys. Physiol. Meas. 1987, Vol 8, No. 4, pp 379-392.
[12] Phelps E.B. and Goldman T.M., Application of automated human voice delivery to warning devices in an intensive care unit: A laboratory study. Int J Clin Monitoring and Computing, 1992, Vol 28, pp 111-116.
[13] Agrawal D.P. and Zeng Q., Introduction to wireless and mobile systems, Pacific Grove, CA: Brooks/Cole, 2003.
[14] Joseph J. Carr and John M. Brown, Introduction to biomedical equipment technology, Upper Saddle River, N.J., Prentice Hall, 2001.
Proceedings of the 8th WSEAS Int. Conference on Automatic Control, Modeling and Simulation, Prague, Czech Republic, March 12-14, 2006 (pp340-345)


