Mobile Banking in New England: The Current State of the Market
46
1 Updates on Payment Trends from the Federal Reserve Bank of Boston Mobile Banking in New England: The Current State of the Market Breffni McGuire New England Automated Clearing House Association Marianne Crowe Federal Reserve Bank of Boston August 2009 The views expressed in this paper are solely those of the authors and not necessarily those of the Federal Reserve Bank of Boston, the Federal Reserve System, or NEACH.
Transcript of Mobile Banking in New England: The Current State of the Market

1
Updates on Payment Trends from the Federal Reserve Bank of Boston
Mobile Banking in New England:
The Current State of the Market
Breffni McGuire
New England Automated Clearing House Association
Marianne Crowe
Federal Reserve Bank of Boston
August 2009
The views expressed in this paper are solely those of the authors and not necessarily those of the Federal Reserve Bank of Boston, the Federal Reserve System, or NEACH.

2
Updates on Payment Trends from the Federal Reserve Bank of Boston
Introduction
This report summarizes the current state of the mobile banking landscape in the United States and presents the results of a survey of mobile banking at New England depository financial institutions (DFI).1 The survey was conducted in July of 2008 by the Federal Reserve Bank of Boston (FRBB) and the New England ACH Association (NEACH), and drew responses from more than 300 banks and credit unions throughout the region.
Now more than ever, to compete successfully in today’s complex, uncertain, and rapidly evolving financial services landscape, financial institutions need to understand the state of the market, specifically here in New England, and also nationally among the market‐setting banks. The survey was designed to help regional banks and credit unions achieve this goal by providing data about mobile banking services.
This report comprises two major pieces. The first section presents an overview of the domestic landscape, providing background and context on the services, technology, barriers, and risks for DFIs offering or considering mobile banking services. It also presents a summary outlook for the channel. The second, and primary, section of the report presents and discusses the results of the joint FRBB‐NEACH survey.
1 For purposes of this report, the term Financial Institution is used to represent Depository Financial Institutions ‐ credit unions and all other banks. It does not include FIs such as insurance companies and pension funds, which were not surveyed.

3
Updates on Payment Trends from the Federal Reserve Bank of Boston
I. Context: The Mobile Banking Landscape in the United States
Mobile banking provides a way for DFIs to increase customer value, grow their demand deposit bases, and satisfy their customers efficiently. Considered a low‐cost, broad‐reaching channel, mobile banking represents both an opportunity and a threat to players in the retail financial services industry.
Many in the payments industry believe that the mobile phone has great potential as a banking and payments delivery channel. In recent years cell phones have become ubiquitous; handset and application technology has become better, cheaper, and more available; and banks have built experience and developed comfort offering services via the Internet channel. By leveraging the ubiquitous, 7x24 availability of the mobile phone into a new communication channel, financial institutions can strengthen existing and develop new customer relationships, increasing their transaction volumes and potentially their revenues.
Mobile Banking Services Offered by DFIs
Mobile banking is defined as the use of a mobile device (cell phone or personal digital assistant (PDA)) to connect to a financial institution and conduct customer self‐service banking functions. These functions include, but are not limited to, viewing account balances, transferring funds between accounts (within the same FI or between FIs), paying bills, and receiving account alerts. A mobile payment, which in some definitions is included as a mobile banking service, is described as using a mobile device to make a purchase or other non‐banking, payment‐related transaction. It also includes use of a mobile device for person‐to‐person (P2P) payments.
Prevalence and Characteristics of Mobile Banking in the United States
Domestically, many banks and other financial institutions are actively deploying some type of mobile banking services and applications. All of the largest banks, most regional banks, and many smaller FIs now offer some type of mobile banking services. Initial services offered are almost always information‐based—branch and ATM locators, transaction history, balance inquiries, etc. Although offered by a number of FIs, mobile payment is considered a ”phase two” service.
It is difficult for most FIs to build a solid business case for mobile banking services because most do not charge for the services. Currently FIs that offer them appear to be absorbing the expense for strategic or competitive reasons. However, as consumer adoption increases and value‐
4
Updates on Payment Trends from the Federal Reserve Bank of Boston
added features are implemented, banks and credit unions have the opportunity to charge for selected services.
The technologies and platforms used to support mobile services vary. The large banks offer a range of technologies, while smaller FIs are more likely to offer one or at most two alternatives to their customers. Each platform has its advantages and disadvantages, and some mobile banking functions work better with a particular platform. SMS (short message service) leverages the mobile phone’s text messaging capabilities to allow mobile phone users to send and receive simple text messages. WAP (wireless application protocol) leverages the mobile phone’s web browser to access information from the Internet via the mobile handset. Downloadable applications were developed for consumers to download on their mobile phones to perform mobile banking functions. NFC (near field communication) is a contactless chip embedded in the mobile phone or in a sticker on the phone.
SMS requires the least amount of effort and support. It is a good choice for FIs that want to send balances and actionable alerts to their customers because it is low risk since no financial or personal information is included. WAP, which is Internet‐browser based, is suitable for a wider range of financial services, although they must be adapted to meet the requirements of the mobile phone browser. Standalone, downloadable applications allow a financial institution to customize applications and offer more robust, secure services. Downloadable applications, however, increase complexity and support tasks for FIs.2
Nationwide trends for mobile usage are positive. The number of cell phone users and text message subscribers has increased exponentially over the last five years, giving rise to the popularity of mobile platforms and applications, and setting the stage for cell phone users to adopt mobile banking activities.
Banking industry analysts, although they do not agree on the annual growth rates or number of users by 2011 (as shown in Figure I.1), virtually all predict substantial growth. Therefore, while consumer acceptance of mobile phones for banking is still new and volume too small for them to predict the pace of adoption with any certainty, analysts are certain the growth of banking services will take place.
2 Preparing for the Mobile Banking Era. Online Resources Corporation. 2007.

5
Updates on Payment Trends from the Federal Reserve Bank of Boston
Figure I.1 ‐ U.S. Mobile Banking User Forecast
Value Proposition for Financial Institutions to Offer Mobile Banking
Typically, FIs view mobile banking services as an extension of their online banking services, treating the mobile device as a front end to their online banking service. Some FIs, generally the largest, also see the mobile channel as a way to decrease costs by replacing routine call center inquiries (for example, balance inquiry) with self‐service balance inquiries via mobile phone.3
For other FIs, mobile banking may be a necessary service to maintain a competitive position and retain existing customers. It can also be an opportunity to acquire new customers, increase customer convenience, and offer value‐added services. Mobile banking may attract new customer segments, such as Generations X and Y, who have grown up with mobile phones and use them for numerous nonbanking purposes.
3 According to research by ORC in 2007, 37 percent of calls to typical bank call centers and voice response units were made from mobile phones.

6
Updates on Payment Trends from the Federal Reserve Bank of Boston
Some FIs promote mobile banking as a way to increase security and decrease the risk of financial loss to the consumer. For example, the mobile phone channel can enhance existing bank products by offering customers real‐time alerts when bills are due or there is suspicious account activity, or by acting as an authentication device for payments. With a mobile phone a consumer can report and freeze a lost or stolen debit or credit card more quickly and check funds availability or receive overdraft alerts on a virtually real‐time basis. Consumers may be willing to pay for this type of value‐added service.
Mobile banking also appeals to under‐banked and unbanked consumers; where FI efforts to draw them into the physical branch or the Internet banking channel have failed. Offering mobile remittance services to the unbanked competes directly with non‐bank money transmitters and gives FIs an opportunity to bring the unbanked into the banking environment (in addition to other avenues such as prepaid cards).
Little hard data exists on the actual extent of consumer adoption of mobile banking services. Most FIs, if they supply any data at all, present adoption data only as a percentage of their total online banking use. With little industry data to go by, FIs must understand trends and potential growth opportunities in their regional markets and their own customer demographics and product use to forecast adoption.
Consumer Education and Security Concerns
Only a fraction of the 30 million potential U.S. mobile banking customers have signed up for mobile banking services. Consumers need education on the available choices and to understand that not all handsets, applications, and carriers are interoperable. Consumers also specifically need to understand the benefits and risks of mobile banking and payment services. Although convenience is a big driver for using such services, customers view security as the main obstacle to adopting mobile banking and payments. In a 2008 mobile banking study,4 47 percent of consumers not using mobile banking cited security concerns as the reason—almost twice the number who were put off by fees and other costs. Consumers also believed that more serious threats may occur as mobile banking adoption increases.
FIs can alleviate some of the concerns by implementing tools and technologies like multi‐factor authentication and pin passwords on the cell phone, anti‐virus software on the mobile device, and the issuance of prompt alerts for suspicious activity. Limiting the types of transactions that consumers can perform (for example, allowing customers to download applications only from
4 US Mobile Banking Benchmark Study. Javelin Strategy & Research. 2008.

7
Updates on Payment Trends from the Federal Reserve Bank of Boston
trusted sources), checking to see whether a customer is using an unknown device, and making sure stolen phones are reported and deactivated immediately can also help.
Collaboration between Mobile Participants is needed
Participants in the mobile banking landscape include financial institutions, customers, card networks (credit card, debit card, ATM/EFT), clearing and settlement organizations, third party processors, and bank technology/core deposit vendors. Wireless carriers (aka mobile network operators or MNOs) and related technology companies are also major players, both supporting and competing with financial institutions for customer wallet share.
Potential conflicts exist between MNOs and FIs because of their different business models, cultures, transaction types, and customer philosophies. A key source of disagreement is customer ownership. Although FIs own the customer’s financial relationship, MNOs can argue that every consumer has a cell phone, and that, therefore, they (the MNOs) should control the process and receive the revenue. Consumer banking relationships, however, are very different from consumers’ relationships with wireless carriers. Control over the transaction payment process (billing, collection of payments, customer dispute and error resolution, fraud and risk management) remains an open issue, as does the pricing structure between FIs and MNOs.
Nonetheless, the evolution of a broader set of mobile banking services requires cooperation by FIs and wireless carriers on common standards for interoperability and operating models. Lack of interoperability is the foremost issue impeding greater adoption of mobile banking. Until standards and regulations are officially established, various limitations will remain on key players in the mobile banking landscape. Ultimately, the two industries, carriers and financial services, must determine what strengths each party brings to the table and how to leverage these strengths to create a successful and secure mobile banking environment.

8
Updates on Payment Trends from the Federal Reserve Bank of Boston
II. Mobile Banking in New England: Federal Reserve Bank of Boston‐NEACH Survey
The results of this Survey of Mobile Banking Services at New England Financial Institutions provide a comprehensive picture of the types of mobile banking services offered or planned by financial institutions in the region, as well as a wealth of information on the approaches that these FIs are taking in five key areas:
• Products and Services • Business Strategy • Mobile Payment Services • Barriers and Risks • Technology
The survey also solicited members’ views on an appropriate role for the Federal Reserve Bank of Boston or NEACH to play in enhancing banks and credit unions’ understanding of mobile banking and payments. Survey Objectives
A key goal shared by the FRBB and NEACH in developing the survey was to understand what is taking place in the local market and how the approaches taken by the differentiated base of commercial, savings, and cooperative banks differ from those of credit unions in the region. At the same time, the Boston Fed and NEACH wanted to provide regional institutions with actionable information to use in their channel and payments strategies.
The data presented in this section of the report provide an analysis of current mobile banking services in the region, as well as an indication or projection of how these services are likely to evolve in the next 12 to 24 months.
Specifically, the survey asked the following questions:
• What types of FIs are offering mobile banking services? • What are the drivers for banks and credit unions to offer such services? • What market segments are being targeted, by which type of FI? • Do the services offered or planned differ by FI type, asset size, or both? • What are FIs considering relative to mobile payments?

9
Updates on Payment Trends from the Federal Reserve Bank of Boston
Survey Methodology
The survey was conducted during the four weeks from July 15 to August 15, 2008. The survey instrument was mailed to almost 900 CEOs at all banks and credit unions in New England—891 recipients. Three hundred and fourteen (314) FIs responded, a 35 percent response rate. Many banks completed the survey online but the majority, 210 FIs or 67 percent, returned the hardcopy survey. (All data were entered online for analysis.)
Not all responses from financial institutions included the title of the submitter. However of the 132 that did, 13 percent of respondents were presidents/CEOs, 24 percent were COOs or senior vice presidents, 33 percent were vice presidents or assistant vice presidents, 8 percent were CFOs, and 6 percent were CIOs—indicating that 84 percent of respondents were executives or senior managers. CEO respondents were most common among smaller banks and credit unions; in particular, those that were not planning to implement mobile banking services in the next two years.
Some Caveats
Institutions that did not plan to offer mobile banking services within a 24‐month horizon (that is, by year end 2010) were instructed to complete only the demographic questions and were exempted from the detailed questions in the body of the survey. Most of the data in the report, therefore, is based on a sample of 172 respondents. The number of respondents to each question is shown below each slide.
Respondent Characteristics / Demographics
According to 2008 FRBB and FDIC5 data, there are 319 banking firms and 517 credit unions (CUs) in New England, totaling 836 financial institutions (FIs) ‐‐ the majority being community banks and credit unions.6 The FRBB categorizes a community bank as having assets of one billion dollars or less. Eighty‐six percent of all banks in the region have assets of less than $1 billion and 91 percent of New England credit unions have assets below $250 million.7
Because of mergers and acquisitions over the past decade, only five national banks continue to have a significant presence in New England: Bank of America, Citizens Financial Group,
5 http://www.FDIC.gov 6 The discrepancy between the number of financial institutions that received surveys and the number of FIs in New England based on FRBB/FDIC data may be attributed to multiple bank locations/ABAs for the same bank due to mergers and acquisitions listed in our mailing database. 7 http://www.ncua.gov/DataServices/IndexCUQuery.aspx

10
Updates on Payment Trends from the Federal Reserve Bank of Boston
Sovereign Bank, TD Bank, and State Street Bank & Trust Company. There are approximately 40 mid‐sized banks and credit unions, defined as having assets between $1 billion and $10 billion. The remaining approximately 800 financial institutions are relatively small, making the New England region atypical because of the large number of small FIs concentrated in a relatively small geographic region.
The 314 respondents represented a mix of banks and credit unions (see Figure II.1). One hundred and fifty‐two respondents, 48 percent of the total, were banks, including commercial banks, savings banks, and thrifts, and 162 (52 percent) were credit unions. Respondent FIs were primarily smaller banks and credit unions: the majority (71 percent) had assets below $500 million. This group is representative of the overall mix of New England financial institutions in terms of asset size in New England.
The way the survey categorized asset ranges did not correspond exactly with the available asset information for “actual” FIs in the region. In order to make an asset‐size comparison of FIs in the survey with the actual number of FIs, the surveyed FIs were categorized into two groups, those with assets of $1 billion or less and those with assets greater than $1 billion. The bank survey respondents are generally representative of New England banks as a whole: 82 percent of the banks that responded had assets of $1 billion or less compared with the actual statistic of 86 percent. Conversely, 18 percent of respondent banks had assets over $1 billion, compared with the actual 14 percent of all New England banks in this asset category. The result is that survey responses are weighted slightly more heavily toward larger institutions.
The same thing is true for credit unions. Five credit unions did not report asset size and are assumed to be in the under $1 billion asset category. Based on this assumption, 96 percent of the surveyed CU respondents had assets equal to $1 billion or less, while 4 percent had assets between $1 billion and $5 billion. In New England as a whole, 98.4 percent of all CUs had assets of $1 billion or less, but only 1.5 percent had assets greater than $1 billion—making the survey sample for credit unions somewhat skewed toward larger CUs.

11
Updates on Payment Trends from the Federal Reserve Bank of Boston
Figure II.1 shows the asset breakdown for respondent banks and credit unions at a finer level of detail than the less than or greater than $1 billion split.
Figure II.1 ‐ Respondent Type and Asset Size
Q28: What is your FI’s asset size? (n = 314). Banks = 152, CUs = 162.
82
43
216 0
142
8 70 5
0
20
40
60
80
100
120
140
160
<$500MM $500MM-$1B $1B-$5B > $5B Not ReportedBanks Credit Unions

12
Updates on Payment Trends from the Federal Reserve Bank of Boston
Figure II.2 shows how the 314 financial institutions that responded to the survey are spread across the six New England states.8
Figure II.2 ‐ Geographic Regions of Respondent Locations (Headquarters)
Q30. Where do you operate? Number of Headquarters n = 314
The numbers in Figure II.2 represent the number of FIs headquartered in each New England state. Massachusetts has the highest concentration of bank and credit union headquarters (47%). Connecticut and Maine are second and third, with 20 percent of respondents headquartered in Connecticut and 18 percent in Maine. FI respondents from New Hampshire, Rhode Island, and Vermont in aggregate comprised 15 percent of the total.
8 The 314 financial institutions represented 407 locations in New England and 16 locations outside of New England.
57 (18%)
20 (6%) 19 (6%)
147 (47%)
62 (20%) 9 (3%)

13
Updates on Payment Trends from the Federal Reserve Bank of Boston
This geographic distribution of respondents by state is representative of the overall New England FI landscape, with the exception of Maine, which was oversampled. For example, 56 percent of all banks and 44 percent of all CUs, or 48 percent of regional FIs, have headquarters in Massachusetts, and the survey drew 47 percent of its respondents from that state (Figure II.3).
Figure II.3 ‐ Percentage of Respondents versus Actual FIs per State
Survey % Actual % Massachusetts 47 48 Connecticut 20 24 Maine 18 12 Vermont 6 5 New Hampshire 6 6 Rhode Island 3 5
The final introductory question asked of all respondents was to comment on their plans for offering mobile banking services—whether they had already implemented mobile banking, had plans to offer mobile banking services in the near‐term, or had no plans to do so within the next three years. Almost half of the FIs (142) indicated that they did not have any plans to offer mobile banking services in the next three years. Just 37 FIs, or 12 percent of respondents, had already implemented mobile banking services, either within the last six months or more than a year ago. However, 135 FIs (43 percent) indicated that they plan to offer mobile banking services within the next three years (see Figure II.4).

14
Updates on Payment Trends from the Federal Reserve Bank of Boston
Of the 142 FIs with no plans to offer mobile banking, 70 percent (100) were credit unions, nine percent (12) were savings banks, and 21 percent (30) were commercial banks About half (18) of the FIs already in production were CUs, eight were savings banks, and eleven were commercial banks. Those planning a 2009 implementation were distributed evenly between credit unions (18), savings banks (18), and commercial banks (19), while among the 80 institutions looking at a two to three year horizon there was a much larger pickup among commercial banks—33 compared with 25 credit unions and 22 savings banks.
Figure II.4 ‐ Most Respondents Have Yet to Offer Mobile Banking
Q3: When did you start offering mobile banking to your customers? (n = 314)
Reasons that FIs did not plan to offer mobile banking services varied. Some FIs felt there was no clear business case or customer demand. Others had more pragmatic reasons such as poor connectivity in their geographic area to support mobile banking (for example, no cell phone
142(45%)
2 (1%)
7 (2%)
28 (9%)
55 (18%)
80 (25%)
0 40 80 120 160
Do not plan to offer
Within last 6 to 12 months
Within last 6 months
More than a year ago
Do no offer mobile banking, but plan to offer within next year
Do not offer, but plan to in next 2-3 years
Number of Respondents
135 FIs plan to offer in 12–36
months
37 FIs offer today
142 FIs have no current plans to offer

15
Updates on Payment Trends from the Federal Reserve Bank of Boston
towers) or not enough resources (either staff or financial) to implement mobile banking. Several FIs indicated security was a concern.9
Products and Services
The survey tested respondents’ knowledge of mobile banking services by presenting several descriptions and asking the institutions to select those that matched their definition of mobile banking. The response chosen by most respondents (85 percent) is the one used in the survey and is highlighted in Figure II.5. (Note that FIs were allowed to select more than one response.)
Figure II.5 ‐ How Respondents Define Mobile Banking
Q2: How does your Financial Institution define mobile banking? (n = 293)
FIs in New England use a combination of the three major mobile technologies to provide mobile banking services:
• Wireless application protocol (WAP) or browser‐based services • Short message service (SMS) text messaging services • Downloadable applications resident on the cell phone / mobile device
9 The survey did not ask specifically why banks did not plan to offer mobile banking services. The information was collected anecdotally from earlier discussions or interviews.
88 (30%)
248 (85%)
45 (15%)19 (6%)
0
50
100
150
200
250
300
Laptop computer wireless connection
(WiFi) to access online banking site
Mobile device connection to FI to conduct customer
self-service financial business
RFID or NFC for contactless payments
Other

16
Updates on Payment Trends from the Federal Reserve Bank of Boston
25%
45%
89%
0% 20% 40% 60% 80% 100%
Downloadable Application
SMS
WAP/Browser
22%
26%
70%
0% 20% 40% 60% 80% 100%
Downloadable Application
SMS
WAP/Browser
New England FIs offer (or plan to offer) browser‐based services as the primary technology platform. This finding is consistent with the findings of most national studies, although the New England percentages are higher than most cited nationally, such as those from Javelin (below, Figure II.6), which are based on a much smaller sample of large institutions. The pattern of SMS and downloadable applications offered by FIs in the region is also similar to that presented by Javelin, albeit again with a somewhat higher percentage of New England financial institutions offering or planning to offer browser‐ or text‐based services.
Figure II.6 ‐ Most Respondents Plan Browser‐Based Services
Q6: What mobile banking technology methods do you use or plan to use in the future? (n = 157)
Source: Javelin Strategy & Research. US Mobile Banking Benchmark study, 2008. (n = 23)

17
Updates on Payment Trends from the Federal Reserve Bank of Boston
Most FIs implement mobile services in a phased progression—a typical starting point being duplication of information and/or account inquiry capabilities offered on an FI’s web site. As shown below in Figure II.7, all New England FIs offering or planning to offer mobile services provide the ability to check demand deposit accounts (DDA) or savings account balances and to transfer funds between customer accounts. Ninety percent also give customers the ability to check account statements and history. Somewhat surprisingly, only 61 percent provide ATM/branch locator capabilities, a smaller group than the 79 percent of respondents that allow bill payment from the mobile device.
Somewhat inconsistently based on the data in the previous figure (II.6), 60 percent of respondents include text message alerts as a service that they (plan to) offer in Figure II.7—compared with the 45 percent who plan to offer SMS at all (as shown in Figure II.6). It is possible that not all respondents understand that SMS is required to offer text message alerts—particularly if the providers are marketing a package of features rather than promoting specific technologies.
Figure II.7 ‐ Initial Service Offerings Related to Account Information
Q4: Which mobile banking products & services do you offer or plan to offer in next 3 years? (n = 159)
2 (1%)
4 (3%)11 (7%)
25 (16%)
40 (25%)
96 (60%)
97 (61%)
125 (79%)
143 (90%)158 (99%)
159 (100%)
0 20 40 60 80 100 120 140 160
Other
Access brokerage services
Send remittances (P2P)
View credit card balances
Transfer funds between accts/customers, different FI
Receive SMS text message alerts
Find an ATM/branch location
Pay bills
Check account statements & history
Transfer funds between accts/customers, same FI
Check balances (DDA,Savings)
Number of Responses

18
Updates on Payment Trends from the Federal Reserve Bank of Boston
Certain areas of New England have significant populations of non‐English speakers or populations for whom English is not their native language. Nonetheless, the survey found that just 33 FIs in total plan to offer multilingual mobile banking services (Figure II.8). With both large banks and most FIs from non‐English population centers represented in the survey, this finding suggests that native English speakers are the primary target for mobile banking services, which may be related to the fact that FIs see mobile as an extension of their Internet banking services. Otherwise, there appears to be little to indicate why an FI has decided whether or not to offer multilingual services. The data show no common pattern for asset size or geography; they do show far fewer savings banks (three in total) are considering the idea, but the sample size makes it impossible to draw a conclusion.
Figure II.8 ‐ Multilingual Mobile Banking Service Is a “Nice to Have,”
But Most Banks Don’t Plan to Offer It
Q5: Do you or will you offer multilingual mobile banking services? (n = 160)
Most FIs that plan to offer mobile banking services are doing so for competitive reasons, and already the market has been sensitized to believe that mobile banking services are free. Consumers are unlikely or unwilling to pay simply because the services provided are accessed via a mobile phone.
33 (21%)YES
127 (79%)NO
Only 33 FIs offer or plan to offer language other than English
FIs currently offering:
MA – 10%, CT – 3%, NH – 3%
FIs planning to offer:
MA – 48%, CT – 24%,
ME – 9%, RI – 3%

19
Updates on Payment Trends from the Federal Reserve Bank of Boston
Although they represent 23 percent of the respondents, a mere 34 FIs are considering charging for the service (Figure II.9), and only two of them are in production. While it is impossible to generalize from so small a sample, the data indicate that banks are more likely than CUs to consider pricing the service and that FIs with under $1 billion in assets are far more likely (28 of 32 respondents) to do so. The most common pricing mechanism being considered is charging a monthly fee, a choice selected by more than half the group; few institutions plan to apply a transaction fee. In the Other category, one FI plans to charge a monthly subscription with direct deposit; the remaining 10 FIs in this group have not yet determined whether they plan to charge for mobile banking services.
Figure II.9 ‐ Writing on the Wall – Another Free Service
116 -NO
(77%)
34 -YES
(23%)
4 (12%)
18 (55%)
11 (33%)
Per transactionMonthly subscriptionOther
Pricing is mix of fees & transaction charges for the 23% that (plan to) charge for services
Q20: Do you or will you charge a fee for mobile banking services? (n=150)
Q21: If you answered yes to question 21, how do you charge? (n =33)

20
Updates on Payment Trends from the Federal Reserve Bank of Boston
Mobile Payment Services
The prevailing industry wisdom is that mobile payments are the key area for differentiation and revenue generation. Evidence from larger financial institutions that offer both mobile banking and payment services today confirms this opinion, as do our survey respondents (see below Figure II.10).
As noted earlier, 172 New England banks and credit unions currently offer or plan to offer mobile banking services by 2011. However FIs were not quite so sure about mobile payment services. Only 161 FIs replied to the question on their plans for mobile payment services (Figure II.10). Of these, 34 percent offer or plan to offer payment services within the next 12–24 months (that is, by year‐end 2010), and another 37 percent stated that they are likely to offer payment services in 2011—signifying that 71 percent of the group view payment services favorably. Notably, unlike the results related to charging fees for mobile banking services, almost half of the FIs that plan to offer mobile payment services (47%) want to charge for them.
Figure II.10 ‐ Mobile Payments is an Attractive Service Offering
Q23: Are you offering or do you plan to offer mobile payment services to your customers? (n = 161)
54 (34%)
60 (37%)
47 (29%)
Offer today or plan to offer in next 1‐2 years
Plan to offer in next 2‐3 yearsAt this time, no plans to offer mobile payments in the next 3 years

21
Updates on Payment Trends from the Federal Reserve Bank of Boston
Credit unions represented about 34 percent of respondents, and CU respondents indicate a slight uptick year‐over‐year in offering mobile payment services, in contrast to their plans for implementing mobile banking services. Responses from savings banks are flat over the same period, but there is a large jump in the number of commercial banks planning to offer mobile payment services in 2011. The biggest growth in implementations will come from the smallest FIs by asset size (those under $500 million), which is hardly surprising given the demographics of the region. Those with no plans to implement are also the smallest institutions.
Offering mobile payment services does not by definition equate to distinguishing offerings delivered via the mobile device from those offered via an FI’s online banking platform (see Figure II.11). However the considerable response (87 percent of 126 institutions) from FIs investigating what payment features or capabilities to offer was bills through our online banking platform. Making their Internet‐based services accessible from the mobile device remains the defining characteristic of most FIs’ mobile services. Respondents’ second selection, alerts for bills and other payments, selected by 39 percent of the group, follows the same logic. Just 29 percent selected payments for point of sale (POS) transactions.
Figure II.11 ‐ Most Planned Mobile Payment Services Are Bill‐Pay Related
Q24: If you offer/will offer mobile payment services, please select all features that your FI is considering? (n = 126)
3 (2%)
4 (3%)
14 (11%)
19 (15%)
25 (20%)
26 (21%)
31 (25%)
33 (26%)
37 (29%)
49 (39%)110 (87%)
0 20 40 60 80 100 120
Mobile lockbox payment (e.g via Wausau)
Other
Not applicable
Online payments billed to mobile phone number
Interbank P2P payments
Bill payments through biller direct website
On-us person to person payments
Online purchases via Internet banking service
Payments for POS transactions
Alerts for upcoming bills and other payments
Bills through our online banking system
Number of Responses

22
Updates on Payment Trends from the Federal Reserve Bank of Boston
Customer Adoption of Mobile Banking Services
Of the 37 FIs that have implemented mobile banking services already, six have more than 20 percent of their customer base signed up for their services (as shown in Figure II.12). All six were in the group of FIs that had been offering mobile banking services for more than a year as of the survey date.
Figure II.12 ‐ Customer Adoption Mirrors FI “Cautious” Rollout
Q17: What percentage of your current customers has signed up for or is using your mobile banking? (n = 160)
0
20
40
60
80
100
120
140
1-5% 6-10% 11-20% 21-30% 31-50% >50% N/A
14 6 11
3 2 1
123

23
Updates on Payment Trends from the Federal Reserve Bank of Boston
Customer complaints with an FI’s mobile services appear not to be frequent, although 29 of the FIs in production have received some customer feedback on the services, for a total of 40 comments. Complaints depend on the device and/or the technology that customers are using (Figure II.13). Although the most common problem centers on connectivity issues, application speed, the “real estate” available on the device screen, and text messaging are all areas of potential difficulty for FIs and can generate complaints from users. Anecdotal evidence from personal interviews suggests that FIs are considering how to make text messaging more acceptable to mobile users. In the “Other” category, one respondent cited bank to bank capabilities as an issue and two FIs said that password issues were a complaint they had received. The remaining three FIs stated that they had received no complaints about their mobile banking services.
Figure II.13 ‐ FIs Are Seeing Few Service Complaints
Q13: What are the most common customer problems and/or complaints about your mobile banking services? (n = 141)
112
13
6
7
6
5
3
0 20 40 60 80 100 120
Not applicable
Connectivity issues
Other
Speed of application
Difficult to use
Size of screen
Use of text messaging
Number of Responses
24
Updates on Payment Trends from the Federal Reserve Bank of Boston
Business Strategy
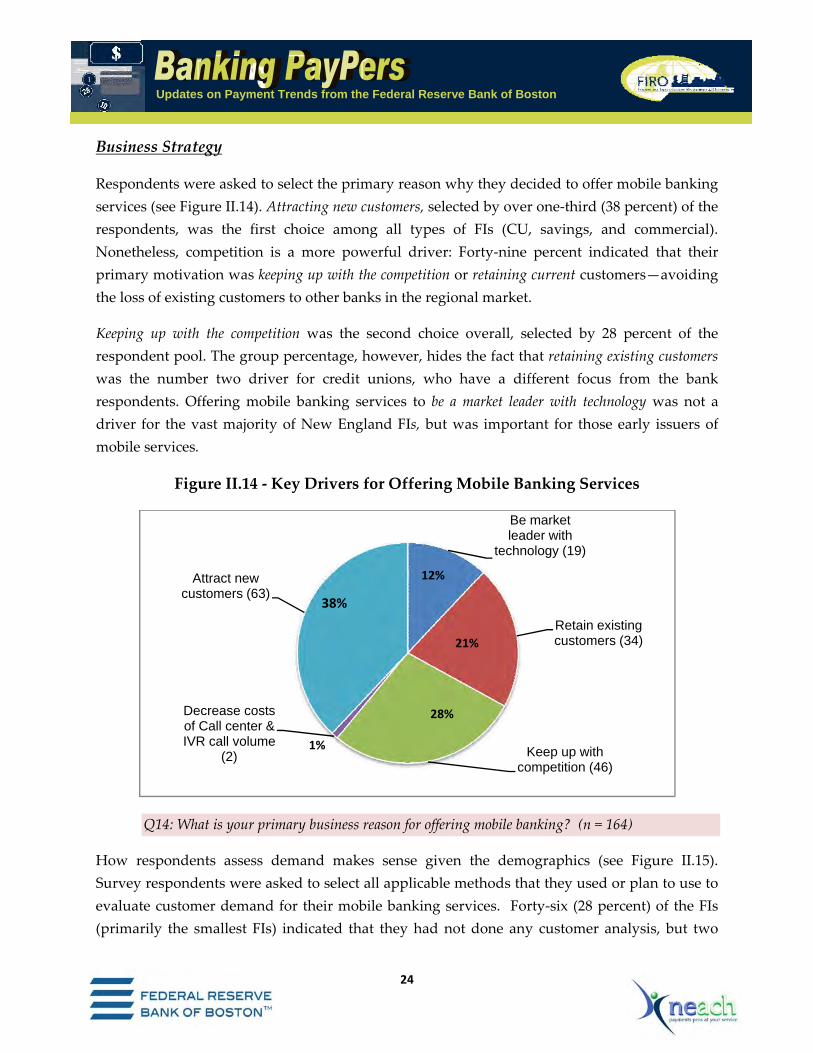
Respondents were asked to select the primary reason why they decided to offer mobile banking services (see Figure II.14). Attracting new customers, selected by over one‐third (38 percent) of the respondents, was the first choice among all types of FIs (CU, savings, and commercial). Nonetheless, competition is a more powerful driver: Forty‐nine percent indicated that their primary motivation was keeping up with the competition or retaining current customers—avoiding the loss of existing customers to other banks in the regional market.
Keeping up with the competition was the second choice overall, selected by 28 percent of the respondent pool. The group percentage, however, hides the fact that retaining existing customers was the number two driver for credit unions, who have a different focus from the bank respondents. Offering mobile banking services to be a market leader with technology was not a driver for the vast majority of New England FIs, but was important for those early issuers of mobile services.
Figure II.14 ‐ Key Drivers for Offering Mobile Banking Services
Q14: What is your primary business reason for offering mobile banking? (n = 164)
How respondents assess demand makes sense given the demographics (see Figure II.15). Survey respondents were asked to select all applicable methods that they used or plan to use to evaluate customer demand for their mobile banking services. Forty‐six (28 percent) of the FIs (primarily the smallest FIs) indicated that they had not done any customer analysis, but two
Be market leader with
technology (19)
Retain existing customers (34)
Keep up with competition (46)
Decrease costs of Call center & IVR call volume
(2)
Attract new customers (63)
1%
28%
21%
12%
38%

25
Updates on Payment Trends from the Federal Reserve Bank of Boston
thirds of the FIs evaluated customer demand for mobile banking using a variety of formal and informal methods.
Surveys and focus groups are formal methods for determining consumer demand, yet just over one third or 35 of the FIs in production or planning to implement mobile banking surveyed their customers.10 Commercial banks used surveys slightly more than credit unions or savings banks. Of the group using surveys, 25 FIs used an Internet survey, nine FIs conducted a telephone survey, and one savings bank conducted a written survey. Twenty‐two percent of total respondents (36 FIs) used focus groups to assess customer demand, and 13 percent purchased outside research.
Almost half the respondents used more informal methods as part of their process to determine demand, gathering information through networking events and/or by word of mouth. Credit unions were somewhat more likely than banks to rely on these methods.
These results illustrate that more FIs used informal, less costly approaches rather than more costly, formal methods to evaluate customer demand for mobile banking services, while some FIs used multiple approaches.
10 Of the 25 FIs that used an Internet survey, nine were credit unions, five were savings banks, and eleven were commercial banks. Phone surveys were conducted by four savings banks, four commercial banks, and one credit union.

26
Updates on Payment Trends from the Federal Reserve Bank of Boston
Figure II.15 ‐ FIs Assess Demand both Formally and Informally
Q15: How do you collect and evaluate customer preferences or demand for mobile banking services? Select all that apply. (n = 162)
46 (28%)
4 (2%)
5 (3%)
9 (6%)
22 (13%)
25 (15%)
36 (22%)
66 (40%)
70 (43%)
0 20 40 60 80
Did not evaluate
Informal vendor/market research
Informal or written data collection
Phone survey
Purchase research from consultants
Internet survey
Focus groups
Word of mouth
Networking/Industry Event
Number of Responses

27
Updates on Payment Trends from the Federal Reserve Bank of Boston
Virtually all FIs with mobile banking services in production (37) plus several not yet in production (47 in total) tested or plan to test their mobile banking services on their staff before rolling out to customers (Figure II.16). Only 11 FIs rolled out their services directly to their customers, and seven in this group started with a subset of their customers. Just two credit unions and two commercial banks engaged in an unrestricted customer implementation.
Figure II.16 ‐ Most New England FIs Start with Soft Rollout— Offer Mobile Banking to Employees First
Q19: What was your initial rollout strategy? (n = 61, representing FIs in production and several FIs planning to implement mobile banking. Remaining respondents indicated not applicable.)
11% (7) 7% (4)
5% (3)
77% (47)
External (subset of existing customers)
External (unrestricted rollout)
Not sure
Internal to employees first

28
Updates on Payment Trends from the Federal Reserve Bank of Boston
Marketing strategies and tactics differ widely among respondents (Figure II.17). No one choice stands out, but most FIs market primarily through the online channel. Almost all FIs (96 percent) post on (their) bank websites and 78 percent put information on their online banking website. The two choices clearly overlap. Advertising at branches was chosen by more than 80 percent of the group, followed closely by the 79 percent that use or plan to use statement stuffers to drive adoption of the service. FIs use all these options today to market their services; they are easy, inexpensive, and tried and true tactics.
Four of the FIs that selected Other choices were not sure what marketing tactics they would employ, but one institution indicated that it was trying a social media approach and advertising its services on Facebook.
Figure II.17 ‐ FIs Support a Mix of Marketing Tactics
Q16: How do you (plan to) market your mobile banking products and services? (n = 159)
152
134125 124
7166
46
50
20
40
60
80
100
120
140
160
Num
ber o
f Respo
nses

29
Updates on Payment Trends from the Federal Reserve Bank of Boston
Barriers and Risks
Respondents selected the top three concerns they viewed as barriers to adoption of mobile banking services (Figure II.18). Not surprisingly, like other institutions industry‐wide, New England FIs are most concerned about security. However, these concerns manifested themselves quite differently by institution type: in other words, credit unions, savings banks, and commercial banks share a common concern over security but differ as to the importance of specific aspects. Therefore, while more than half of the respondents (56 percent) in aggregate selected FI security concerns and 76 FIs (46 percent) chose customer perception of security concerns as key issues, the high‐level statistics obscure variations by FI type. The same is true for a few of the other key concerns highlighted. Ranking just below the security barriers were cost to deploy technology (43 percent), lack of customer demand (42 percent) and regulatory concern (36 percent).
The top three barriers for credit unions were FI security concerns, customer perception of security concerns, and cost to deploy technology. The top three barriers for savings banks were FI security concerns, lack of consumer demand, and customer perception of security concerns. For commercial banks, the three top concerns were lack of customer demand, FI security concerns, and cost to deploy new technology, respectively.11
These differences are interesting. On one hand, credit unions and savings institutions share concerns about their own and customer perceptions of security, while for commercial banks, customer security appears to be a problem that has been resolved, perhaps because of their own financial education and security practices. On the other hand, both savings and commercial banks are more concerned about their business (that is revenue generation) and customer demand for the service. ROI was chosen as a barrier by one third of the FIs, indicating that FIs are looking carefully at deployment of any new service that does not provide a clear return.
11 These top choices were determined by highest number of FIs within each FI category (CU, Savings, Commercial Bank).

30
Updates on Payment Trends from the Federal Reserve Bank of Boston
Figure II.18 ‐ Barriers to Implementation of Mobile Banking
z
Q11: What do you perceive to be the top three barriers to banks implementing mobile banking? (n = 164)
92 (56%)
76 (46%)
71 (43%)
69 (42%)59 (36%)
52 (32%)
26 (16%)
22 (13%)15 (9%)
4 (3%)
1 (1%)
0 10 20 30 40 50 60 70 80 90 100
FI security concerns
Customer perception of security concerns
Cost to deploy technology
Lack of customer demand/interest
Regulatory concerns
ROI
Poor mobile network coverage
Being locked-in to particular technology/vendor
Interoperability/lack of standards
Revenue sharing issues w/mobile carriers
Customer expense
Number of Responses

31
Updates on Payment Trends from the Federal Reserve Bank of Boston
Asked about their “top two” most important security concerns, the New England Banking Survey respondents selected securing personal information on the (mobile handset) device (85 FIs) and fraud (81 FIs). These results differ from results of a consumer survey that Javelin Strategy & Research conducted in 2008. The Javelin survey found that loss or theft of mobile device and viruses/hackers were top consumer concerns, selected by 69 percent and 62 percent of the sample, respectively. Loss or theft of a mobile device and viruses were selected as top concerns by only 18 percent and 8 percent of FIs, respectively, in the our survey.
While Javelin’s question asked more broadly about concerns with mobile banking, not just security, the difference in emphasis between the primary concerns of the FIs and those of the consumers may indicate a need for education for both parties about the different types of security issues they need to be aware of when using mobile devices for banking.
Figure II.19 ‐ Fraud and Securing Personal Information Are Primary Security Concerns
Javelin Strategy & Research 2008 New England Banking Survey
52%
50%
34%
26%
18%
14%
8%
1%
0% 20% 40% 60%
Securing personal information on device
Fraud
Security of transmission medium
Authentication
Loss/theft mobile device
Encryption
Viruses
None
Q12: What are your top two security concerns related to mobile banking? (n = 162)
Q. What are your main concerns surrounding mobile banking? (Select up to three) (n = 2,230)
69%
62%
28%
14%
9%
0% 20% 40% 60% 80%
Loss/Theft of mobile device
Viruses/hackers
Expensive data plan
Unreliable wireless service
Other

32
Updates on Payment Trends from the Federal Reserve Bank of Boston
Technology
The survey did not delve deeply into technology issues but sought high‐level information about how regional FIs chose the type of technology to offer to their customers and the primary decision factors for selecting both technology and service provider. Respondents were also asked more specifically about their provider.
Asked what factors influenced their decision on which platforms (SMS, WAP, or downloadable application) to offer, 54 percent of the FIs selected customer preference as the primary factor (Figure II.20). The only other factors selected by more than 40 percent of the respondents were vendor product offering, selected by 48 percent of FIs, and ease of implementation, which was selected by 41 percent of the 165 respondents. None of the remaining factors were chosen by more than a quarter of the group.
Figure II.20 ‐ Primary Factors Influencing Mobile Technology Decisions
Q7: What are the primary factors that influence your decision about which mobile technology method to use? (n = 165)
12 (7%)
20 (12%)
20 (12%)
25 (15%)
37 (22%)
67 (41%)
79 (48%)
89 (54%)
0 20 40 60 80 100
Other
Time to market
In-house expertise/research
Familiarity with the technology
Vendor or consultant recommendations
Ease of implementation
Vendor product offering
Customer preference
Number of Responses

33
Updates on Payment Trends from the Federal Reserve Bank of Boston
As part of their due diligence, the majority of FIs (56 percent) looked at or planned to look at three or four mobile banking vendors before coming to a decision (Figure II.21) and another two percent planned to look at five or more providers. A 42 percent minority, however, considered just one or two providers, a probable indication of the strength of the core processing provider relationship.
Figure II.21 ‐ Due Diligence Indicates FIs Looking at 3–4 Providers
Q9: How many vendors/providers did you (will you) consider? (n = 161) Q10: How do you (plan to) manage your mobile banking system (in/out)? (n = 101)
Although almost all vendors can support FIs of all sizes, several mobile banking vendors cater to different market segments by type and size (for example, bank or credit union, large regional, national, or community bank, etc.). Harland and Jack Henry, for example, do not support large FIs12 and offer mobile banking as an added service to their deposit product offerings. Both offer SMS and browser‐based (WAP) platforms that are considered simple and easy to implement for their banking clients. Some vendors partner with third‐party processors and may not deal
12 Mobile Banking Vendor Analysis. Javelin Strategy and Research. August 2008.
4 (2%)
21 (13%)
46 (29%)
90 (56%)
0 20 40 60 80 100
5+
2
1
3 - 4
Number of Responses
~ Process in-house: 23%~ Outsource to 3rd party: 77%

34
Updates on Payment Trends from the Federal Reserve Bank of Boston
directly with the FI, while others integrate the mobile banking software with their core deposit processing services.
Some FIs and processors use more than one mobile vendor in order to provide more alternatives and capabilities to their customers.
Survey respondents identified almost 30 different vendors and providers they use today or are considering. Large and well‐known third‐party processors, such as Fidelity, Fiserv, Jack Henry, and Metavante, were well represented in the responses. Mobile software vendors mentioned in the survey include ClairMail, Firethorn, M‐Foundry, Monitise, MShift, and Sybase 365. Some respondents named their core processors rather than a mobile banking service provider, which may indicate that the FI will select whichever mobile provider its core processor recommends.
Twenty‐four FIs indicated that they were partnering or planning to partner with a Fiserv company. (Fiserv has several businesses that offer mobile banking services to banks, credit unions, or both.) Five FIs used Metavante with either Monitise or MShift. (Metavante partners with both Monitise and M‐Shift to offer different mobile platforms.) Figure II.22 shows selected mobile banking processors and vendors used by two thirds of all financial institutions offering mobile banking services. Several other FIs surveyed had unique vendors/processors that are not shown below. Twelve FIs had not yet selected a vendor.

35
Updates on Payment Trends from the Federal Reserve Bank of Boston
Figure II.22 ‐ Selected Mobile Banking Vendors and FI Selections
3rd Party Mobile Banking Financial Institutions Processor Vendor Surveyed
Fiserv ITI (owned by Fiserv) 24
Jack Henry Go Dough in‐house 7
Metavante Monitise, MShift 5
Digital Insight MShift 5
ORCC In‐house 4
Synergent MShift, Jack Henry 2
Fidelity National
Clairmail, mFoundry 2
Harland Financial Cavion In‐house 2
NYCE Monitise 1
None indicated Firethorn 1
None indicated MShift 3
None indicated Monitise 1
None indicated Sybase 365 1
Other 27
Q8: Who is your mobile banking application vendor or service provider? Q10: Current or planned outsourcing partner? (n = 85)

36
Updates on Payment Trends from the Federal Reserve Bank of Boston
III. Conclusion
The survey provided answers to the following questions:
What types of FIs are offering mobile banking services?
Both banks and credit unions across New England are offering or planning to offer mobile banking and payment services. Not only large banks but also smaller FIs, especially credit unions, have been fast out of the gate with services for the mobile channel. The majority of the banks are implementing mobile banking services at a cautious, low‐cost, low‐risk pace, introducing the same information, account, and alert services already provided through their online banking services.
What are the drivers for banks and credit unions to offer such services?
Unlike the large national and regional banks, New England banks appear to be implementing mobile banking services as less a strategic move than a reactive step to prevent competitors from taking their customers. Despite the 12 percent that want to be market/technology leaders, most surveyed FIs have made or plan to make only minimal investment in the formal market analysis necessary to understand demographics and customer needs. Overall, the strategy of New England banks appears to be to “get something out there” for customers to try, without making a large investment. Because mobile banking services are still relatively new in the United States, and nascent in the region, this approach makes sense for now. Nonetheless, 38 percent still hope to attract new customers by offering mobile banking services.
Despite increasing momentum and interest in mobile banking, security remains a major concern of FIs and consumers. This concern is consistent among banks of all sizes and all types in New England, and is in line with industry‐wide concerns.
What market segments are being targeted, by which type of FI?
The survey looked only at the consumer market and did not delve into which demographic segments are being targeted. Survey findings clearly indicate, however, that online customers are a key market, so FIs are modeling services to conform with their home banking (and bill payment) offerings. The survey also reveals that English‐speakers are the primary target, a finding that is likely to be consistent with the demographics of online banking customers.

37
Updates on Payment Trends from the Federal Reserve Bank of Boston
Do the services offered or planned differ by FI type, asset size, or both?
Throughout the survey data, there are significant differences between banks and credit unions, and in some cases, technology decisions being a prime example, among FIs within different asset size ranges. Technology also marks a key divide between banks and credit unions because providers and processors cater to particular markets. Typically, those FIs with the greatest assets and resources offered (or plan to offer) more customized services, particularly payment services, on more platforms for more types of mobile devices.
What are FIs considering relative to mobile payments?
Regional FIs for the most part are only now considering mobile payment services. Most FIs are using their online banking services as the model for capabilities to deliver on the mobile device. Overwhelmingly, the focus is on bill payment applications. This focus notwithstanding, some FIs are looking at more robust payment services, including P2P payments. Here too, security remains a concern.
Industry Findings
The analyst community is more than a little divided about how fast FIs will roll out mobile banking and payment services and how many consumers will use them. Aite Group,13 for example, reports that there were 170 U.S. mobile banking implementations in 2007 and 245 in 2008 and estimates that this number will increase to 614 implementations in 2009.
The 2008 Aite number represents 1.5 percent of U.S. financial institutions. The FRBB‐NEACH survey found just 37 financial institutions offering mobile banking in 2008. This figure represents 12 percent of respondents, and accounts for four percent of all New England FIs. Although it is dangerous to extrapolate survey findings to the general population, this percentage is still greater than the projected national share.
Considering the fact that the survey represents findings from close to 40 percent of New England FIs, including most of the largest banks (by asset size), we believe that 12 to 13 percent is a reasonable figure for regional mobile banking implementations. Although almost half the respondents had no current plans to implement within the next 36 months, the survey found that the pace of adoption was to accelerate during 2009 and 2010. Results also indicate that CU installations would be a “done deal” after that point. Undoubtedly, there are very small,
13 The Mobile Transactions Landscape: Mapping New Territory. Aite Group. May 2009.

38
Updates on Payment Trends from the Federal Reserve Bank of Boston
municipal, and hospital CUs, for example, that are unlikely to offer mobile banking services. However, given the pace of change in the industry, both business and technology, it is reasonable to assume that some of the “with no plans to implement” FIs may come to a different decision over time.
In New England, and across the nation, vendors and industry proponents in general have more work to do to convince FIs, particularly smaller institutions, of the customer demand, safety, and value of mobile banking services. Even though one payments research organization indicates that 85 percent of the U.S. population has a cell phone14 and there is media excitement about the future, mobile banking is still a fledging service in many ways. With all the different software solutions and vendors, and numerous handset/carrier choices, FIs may find it difficult to know where the market is going and how to assess consumer demand. While the market is in transition, there is time to engage all parties to identify customer value, develop a strong business case, alleviate real and perceived security issues, and implement effective education programs for banks and customers.
14 Mobile Banking Vendor Analysis. Javelin Strategy & Research. August 2008.

39
Updates on Payment Trends from the Federal Reserve Bank of Boston
IV. Appendix
Top U.S. Financial Institutions Planned or Implemented Mobile Banking Platforms15
Figure IV.1 depicts the mobile banking platforms offered by the largest U.S. financial institutions (prior to recent mergers). Only one FI, Wells Fargo, offers all three platforms, and two FIs, Wachovia and HSBC, provide two platforms. Three of the six FIs providing only one platform offer WAP, two offer SMS, and one offers a downloadable application. Most have developed at least one platform in‐house. A few have vendor solutions as well, primarily for downloadable applications, which may be more or less expensive depending on the customization of the application.
Figure IV.1
Financial Institution
Application/Platform Mobile Vendor
1 Citigroup SMS/Text Downloadable application
In House mFoundry
2 Bank of America WAP/Browser‐based Downloadable application
In House
3 JP Morgan Chase SMS/Text In House
4 Wachovia WAP/Browser‐based Downloadable application
In House Firethorn/Checkfree
5 Wells Fargo SMS WAP/Browser‐based Downloadable application
In House In House In House
6 HSBC SMS/Text (Business customers only) Downloadable application (UK only)
In House Monitise
7 US Bank WAP/Browser‐based In House
8 Sun Trust Downloadable application Firethorn/Checkfree
9 Capital One WAP/Browser‐based In House 15 Mobile Banking Vendor Analysis. Javelin Strategy & Research. August 2008, updated by FRBB October 2008.

40
Updates on Payment Trends from the Federal Reserve Bank of Boston
Survey Instrument
New England FI Mobile Banking Services Survey
Please complete all 30 questions in the survey unless you are not planning to offer mobile banking or payment services, in which case please complete questions 1‐3 and 26‐30 only. Respondent Profile This information is needed to perform statistical analysis and to send you a copy of the final report. All information pertaining to your financial institution will be kept completely confidential as published results will be aggregated.
1. Please provide all requested information below. Name of Financial Institution: ____________________________________
Name of person completing the survey and to whom the final report should be sent: _________________________________________________ Address:
‐ Street/Mail Code: ______________________________________ ‐ City: ______________________________________ ‐ State: ______________________________________ ‐ Zip Code: ______________________________________
Phone Number: ______________________________________ Email address: ______________________________________
Definitions 2. How does your Financial Institution define mobile banking? (Select all that apply)
Using a laptop computer and a wireless connection (e.g. Wi‐Fi) to access an online banking site
Use of mobile device to connect to a financial institution to conduct customer self‐service (CSS) financial business, including but not limited to, viewing account balances, transferring funds between accounts, paying bills or receiving account alerts
Use of a Radio Frequency Identification (RFID) or Near Field Communication (NFC) chip embedded in the phone to make contactless purchases
Other __________________

41
Updates on Payment Trends from the Federal Reserve Bank of Boston
3. When did you start offering mobile banking to your customers? (Select one) Within the last 6 months Between the last 6 to 12 months More than one year ago Do not offer mobile banking, but plan to offer within the next year Do not offer mobile banking, but plan to offer within the next 2‐3 years Do not plan to offer (Please go directly to question 27.)
Products and Services Please refer to this definition of mobile banking when answering the remaining questions:
“Use of mobile device by a consumer or business to connect to a financial institution and conduct customer self‐service (CSS) financial business, including, but not limited to, viewing account balances, transferring funds between accounts, paying bills or receiving account alerts.”
4. Which of the following mobile banking products and services do you currently offer
or plan to offer within the next three years? (Select all that apply) Check balances (DDA, Savings) Check account statements and history (DDA, Savings) View credit card balances Transfer funds between accounts or customers, same FI Transfer funds between accounts or customers, different FI Find an ATM/branch location Pay bills Receive SMS text message alerts Access brokerage services Send remittances (person to person) Other __________________
5. Do you or will you offer a multilingual mobile banking service? (Select one)
Yes No
Technology Capabilities 6. What mobile banking technology methods do you use or plan to use in the future? (Select all that apply)
Downloadable application Browser based service Text‐messaging based service (SMS)

42
Updates on Payment Trends from the Federal Reserve Bank of Boston
7. What are the primary factors that influence your decision about which mobile
technology methods to use? (Select two) Customer preference Ease of implementation Time to market In‐house expertise/research Familiarity with the technology Vendor product offering Vendor or consultant recommendations Other _____________________________________________________
8. Who is your mobile banking application vendor? Leave blank if not applicable.
_______________________________________________________
9. How many vendors did you (will you) consider? One 2 3‐4 5+
10. How do you manage or plan to manage your mobile banking system?
Process in‐house Outsource or partner with __________________________________
Barriers and Risks 11. What do you perceive to be the top three barriers to banks’ implementing mobile banking? (Select three)
Lack of customer demand/interest Customer’s perception of security concerns Financial Institution’s security concerns Interoperability/lack of standards Regulatory concerns Poor mobile network coverage Being locked‐in to a particular technology (or third party vendor) Cost to deploy technology ROI Revenue sharing issues with mobile carriers Other __________________________________________________

43
Updates on Payment Trends from the Federal Reserve Bank of Boston
12. What are your top two security concerns related to mobile banking? (Select two) Fraud Viruses Security of transmission medium Encryption Authentication Securing personal information on mobile device Physical loss or theft of handheld device Other ___________________________________________________
13. What are the most common customer problems and/or complaints about your mobile banking services? (Select all that apply)
Difficulty of use Connectivity issues Size of the screen Speed of application Use of text messaging Not applicable Other ____________________________________________________
Business Strategy 14. What is your primary business reason for offering mobile banking? (Select one)
Attract new customers Retain existing customers Be market leader with technology Keep up with competition Increase revenue Decrease operations costs related to Call Center and IVR call volume Other _________________________________________________
15. How do you collect and evaluate data on customer preferences and demand for
mobile banking services? (Select all that apply) Phone survey Internet survey Purchase research from consultants Focus groups Networking/Industry events Word of mouth Not applicable Other ___________________________________________________

44
Updates on Payment Trends from the Federal Reserve Bank of Boston
16. How do you (plan to) market your mobile banking products and services? (Select all that apply)
Direct mail Statement stuffers Posting on our website Advertisement at branch(es) Information on internet home banking site Emails or phone calls to existing customers Radio, TV, Print advertisements Other _______________________________
17. What percentage of your current customers has signed up for or is using your mobile banking services? (Select one)
<1% 1‐5% 6‐10% 11‐20% 21‐30% 31‐50% >50% Not applicable
18. What percentage of your mobile banking customers are consumers versus
businesses? (Select one) 5 or less% 6‐10% 11‐20% 21‐30% 31‐50% >50% Not applicable
19. What was your initial roll‐out strategy?
Internal to employees first External (subset of existing customers) External (unrestricted rollout) Not applicable Other _______________________________________________________

45
Updates on Payment Trends from the Federal Reserve Bank of Boston
20. Do you or will you charge a fee for mobile banking services? Yes No
21. If you answered yes to question 20, how do you charge?
Per transaction Monthly subscription Other _______________________________________________________
22. How much do you (plan to) charge for mobile banking services? Indicate dollar amount next to applicable payment option.
Per transaction $____________ Monthly subscription $____________ Other ____________________ $____________
Mobile Payments Please indicate your expectations for the future of mobile payments as distinct from mobile banking – i.e. using a mobile phone to make bill payments, purchases at the point of sale or on the internet, etc. (Note: some features overlap with Mobile Banking) 23. Are you offering or do you plan to offer mobile payment services to your customers?
We offer today or plan to offer within the next 12‐24 months We plan to offer within the next 25‐36 months At this time, we have no plans to offer mobile payment services within the next 3 years
24. If you will offer mobile payment services, please select all features/capabilities that your FI is considering.
On‐us person‐to‐person payments Interbank person‐to‐person payments Bill payments through our online banking system Bill payments through biller direct website Payments for point‐of‐sale transactions Online payments via our Internet banking service (e.g. texting to purchase) Online payments billed to mobile (cell phone) number Alerts for upcoming bill and other payments Mobile lockbox payments (e.g. via Wausau) Not applicable Other ______________________________________________________

46
Updates on Payment Trends from the Federal Reserve Bank of Boston
25. Do you envision charging for these mobile payments services?
Yes No If no, why not? ______________________________________________
26. Please share your ideas on what role(s) the Federal Reserve Bank of Boston can play in helping to increase your knowledge of mobile banking and/or that NEACH can play in increasing your understanding of mobile payments. _________________________________________________________________________ _________________________________________________________________________ Demographics 27. What is your FI’s ABA number? ____________________________ 28. What is your FI’s asset size?
< $500 million Between $500‐$1 billion Between $1‐5 billion than $5 billion
29. How many branches do you have? 1 2‐10 11‐25 26‐50 50
30. Geographic locations (Select all that apply)
Connecticut Maine Massachusetts Boston Metro Area New Hampshire Rhode Island Vermont Beyond New England


![Digital Banking Maturity Study EMEA - deloitte.com Provider (very limited cases) Y Tomorrow Today’s Bank] BEYOND BANKING OPEN BANKING CURRENT BANKING products & …](https://static.fdocuments.net/doc/165x107/5b0b336c7f8b9ae61b8d663d/digital-banking-maturity-study-emea-provider-very-limited-cases-y-tomorrow-todays.jpg)