

Mobile App Installs - Jud Bowman, Appia
32
Mobile App Installs The Fight For Dollars & Discovery Jud Bowman, Founder & CEO January 27, 2015 1
-
Upload
lou-kerner -
Category
Mobile
-
view
976 -
download
0
Transcript of Mobile App Installs - Jud Bowman, Appia

Mobile App InstallsThe Fight For Dollars & DiscoveryJud Bowman, Founder & CEO
January 27, 2015
1

Appia at a Glance…
2
Leadership with more than 13 years
in mobile space
Delivered more than 95 million
sponsored app installs
Network reaches more than 1 billion
users globally
Partnerships spanning app
developers, mobile networks, OEMs,
and carriers
Advertisers represent 65% of the Top
100 Grossing Apps
Spans both iOS and Android

Smartphones & apps are the technology platform of
our time
75 Billionapp installs to
date as of
Sep. 2014
50 Billionapp installs to date
as of July 2013
1.4Bn smartphones shipped in 2014
3

4
# of Apps is Exploding1.3M+ apps on Google Play (August 2014)
1.3M+ apps in the App Store (September 2014)

Apps versus Mobile web
Monetization of other apps
lagging Google and Facebook.
5
We spend majority of time on apps versus mobile web, and app developers are
monetizing and making more money from apps
86% of time spent on mobile
on Applications.

Importance of Mobile Advertising
6

Cost of Launching a Mobile App
7
Top games-app publisher
$500,000 in 2009.
typically spend $5 million on mobilefor a new title, up from
“marketing “

$1.7B $2.4B $3.3B $4.7B $6.6B$9.2B
$8.5B
$11.9B
$16.7B
$23.4B
$32.8B
$46.0B
$0B
$5B
$10B
$15B
$20B
$25B
$30B
$35B
$40B
$45B
$50B
2011 2012 2013 2014 2015 2016
Tota
l M
ob
ile
Ap
p R
ev
en
ue
Forecast for App Marketing Spend
8Source: ABI Research, Gartner, Juniper Research
Total mobile app revenue forecast to reach $46B in 2016
Sales and Marketing spend $9.2B in 2016
Apple paid out $2Bn to app developers in Q1 2014 alone!
GREEN shaded area represents
estimated sales and marketing spend
= 20% of total revenue

Mobile Ad Spend positioned to grow
% of time spent in media versus
% of Advertising Spending, USA 2013.
Source: Advertising Spend based on IAB data for full year 2013. Print includes newspaper and magazine. $30B+ opportunity calculated on assuming internet and mobile ad spend share equal
their respective time spent share. Time spent share data based on eMarketer 7/13 (adjusted to exclude outdoors / classified media spend). Arrows denote Y/Y shift in percent share.
9
Remain optimistic about Mobile Ad spend growth… print remains way over-
extended
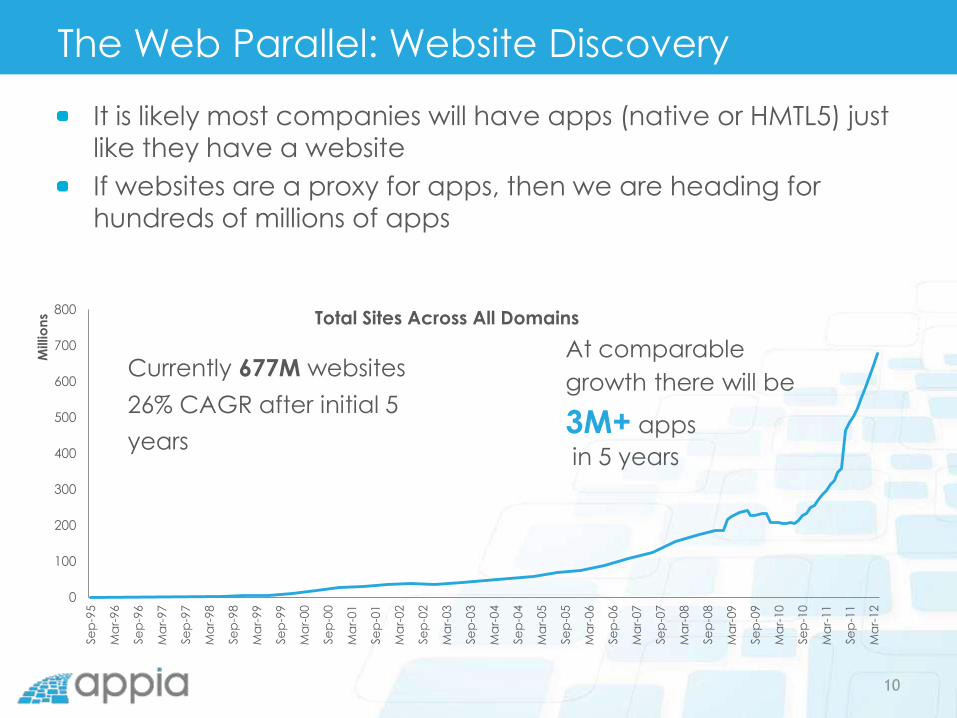
The Web Parallel: Website Discovery
It is likely most companies will have apps (native or HMTL5) just
like they have a website
If websites are a proxy for apps, then we are heading for
hundreds of millions of apps
0
100
200
300
400
500
600
700
800
Se
p-9
5
Ma
r-96
Se
p-9
6
Ma
r-97
Se
p-9
7
Ma
r-98
Se
p-9
8
Ma
r-99
Se
p-9
9
Ma
r-00
Se
p-0
0
Ma
r-01
Se
p-0
1
Ma
r-02
Se
p-0
2
Ma
r-03
Se
p-0
3
Ma
r-04
Se
p-0
4
Ma
r-05
Se
p-0
5
Ma
r-06
Se
p-0
6
Ma
r-07
Se
p-0
7
Ma
r-08
Se
p-0
8
Ma
r-09
Se
p-0
9
Ma
r-10
Se
p-1
0
Ma
r-11
Se
p-1
1
Ma
r-12
Millio
ns Total Sites Across All Domains
Currently 677M websites
26% CAGR after initial 5
years
At comparable
growth there will be
3M+ apps
in 5 years
10

The Web Parallel: Rise of Search Marketing
11

Facebook App Install Ads
FB stock hits low of $17.73 on September 4, 2012
Launches app install ads on October 17, 2012
350 million app installs through mid-2014
703 million mobile daily active users
Driving more than $1 billionin quarterly mobile ad revenue from app install ads
12

0
10
20
30
40
50
60
70
80
90
Ap
r-1
1
Ju
n-1
1
Au
g-1
1
Oc
t-11
De
c-1
1
Fe
b-1
2
Ap
r-12
Ju
n-1
2
Au
g-1
2
Oc
t-12
De
c-1
2
Fe
b-1
3
Ap
r-13
Ju
n-1
3
Au
g-1
3
Oc
t-13
De
c-1
3
Fe
b-1
4
Ap
r-14
Ju
n-1
4
Au
g-1
4
Millio
ns
Appia:#1 Independent App Install Network
13
Appia crossed 95M sponsored app installs
to date in January 2015

Appia’s App Install Advertisers (CPI)
14
Appia is working with 100+ Advertisers & Agencies to accelerate app installs,
and has 600+ live Android campaigns and 375+ live iOS campaigns

Publishers Leveraging the Appia Platform
15
Appia partners with 250+ Publishers to monetize their mobile traffic

End-to-End: Driving User Quality & LTV
16
• Appia’s platform is integrated
with 15 third party tracking
providers and advertisers
directly to obtain install and
post-install transactional data
in real-time.
• Appia utilizes this data to
provide high LTV users at the
right price for advertisers.

Highest CPI Rates Globally, 200+ Countries
17
AVG Rate iOS $2.50
Top 10 AVG iOS: $5.08
AVG Rate Android: $1.50
Top 10 AVG Android:
$3.00
Australia CanadaUKUS Germany
New Zealand SwedenFrance Norway Switzerland
Average CPI Rates by Country:
AVG Rate iOS $2.50
Top 10 AVG iOS: $5.08
AVG Rate Android: $1.50
Top 10 AVG Android:
$3.00
AVG Rate iOS $2.72
Top 10 AVG iOS: $5.44
AVG Rate Android: $1.55
Top 10 AVG Android:
$3.10
AVG Rate iOS $2.07
Top 10 AVG iOS: $4.14
AVG Rate Android: $1.03
Top 10 AVG Android:
$2.06
AVG Rate iOS $2.05
Top 10 AVG iOS: $4.10
AVG Rate Android: $1.13
Top 10 AVG Android:
$2.26
AVG Rate iOS $2.57
Top 10 AVG iOS: $5.14
AVG Rate Android: $1.21
Top 10 AVG Android:
$2.42
AVG Rate iOS $2.77
Top 10 AVG iOS: $5.54
AVG Rate Android: $1.09
Top 10 AVG Android:
$2.18
AVG Rate iOS $2.73
Top 10 AVG iOS: $5.46
AVG Rate Android: $0.81
Top 10 AVG Android:
$1.62
AVG Rate iOS $1.76
Top 10 AVG iOS: $3.52
AVG Rate Android: $0.77
Top 10 AVG Android:
$1.54
AVG Rate iOS $2.50
Top 10 AVG iOS: $5.08
AVG Rate Android: $1.50
Top 10 AVG Android:
$3.00

Install Insights
18

Appia User Acquisition Survey
19
35%54%
Which goals best evaluate the performance of a
mobile ad campaign?
brand-awareness
foot-traffic
increase-traffic
product-release
user-acquisition
all-of-the-above

Installs By Hour
20
0 50000 100000 150000 200000 250000 300000 350000 400000 450000 500000
0
1
2
3
4
5
6
7
8
9
10
11
12
13
14
15
16
17
18
19
20
21
22
23

Installs by Day
21
1050000 1100000 1150000 1200000 1250000 1300000 1350000 1400000 1450000
Sunday
Monday
Tuesday
Wednesday
Thursday
Friday
Saturday

Installs By Category
22
0
100000
200000
300000
400000
500000
600000
700000
800000
900000
Sunday Monday Tuesday Wednesday Thursday Friday Saturday
Installs by Day
Gaming Category

Installs by Category
23
0
10000
20000
30000
40000
50000
60000
Sunday Monday Tuesday Wednesday Thursday Friday Saturday
Installs by Category
Utilities
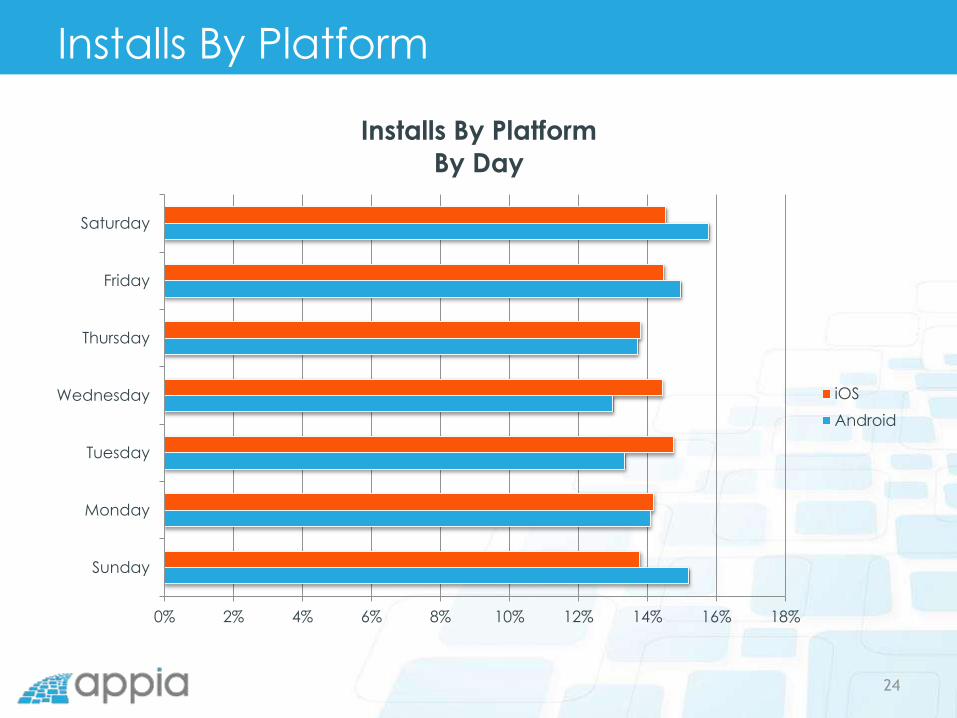
Installs By Platform
24
0% 2% 4% 6% 8% 10% 12% 14% 16% 18%
Sunday
Monday
Tuesday
Wednesday
Thursday
Friday
Saturday
Installs By Platform
By Day
iOS
Android

Post-Install Insights
25

Appia User Acquisition Survey
26
8%
8%
83%
Is it critical to monitor post-install events?
No
Not Certain
Yes

Appia User Acquisition Survey
27
0% 10% 20% 30% 40% 50% 60% 70%
bid-rate-optimization
campaign-optimization
creative-optimization
ltv-optimization
traffic-optimization
What is the Best Tool for Optimizing Campaigns?

Appia’s Performance Management Program
28
Focusing on installs alone will not drive
higher value user acquisition.
• 98.5% of advertisers using PIE data with Appia renew
spending, with an average increased spend of +35%
• Tools and technology to find fraudulent activity
• Advertiser Performance Team:• 2 PHD Data Scientists
• 1 Analyst
• 1 Technical Account Manager
• 1 Performance Manager • 5 Supply Managers

Post Install Event Optimization
29
• Test & Optimize Weekly, Monthly & Quarterly Spending
Microscopic focus on channel performance
Know where to grow, know where to say “NO”
Identify new, unique & exclusive inventory
opportunities
• Build Confidence Spend
Stability in long-term, safe spending
Data Driven
Risk reduction
Limit Fraudulent Activity
• Focus on top performing inventory that drives ROI
Optimized CPI for improved return on investment
Find and adjust spend for equivalent inventory value
High Volume Users + Quality

Case Study
Leading dating
app optimized
traffic
performance and
drove a 300%
increase
in ROI.
30

Case Study
By hyper-focusing on
pockets of high value
traffic, we were able
to optimized test
spend immediately
with a leading utility
app by removing
traffic sources
without healthy
revenue per user.
31


![Appia 1 Group Brochure[2]](https://static.fdocuments.net/doc/165x107/568bddaa1a28ab2034b6acb8/appia-1-group-brochure2.jpg)