Mobile Accessibility Tools for the Visually Impaired
133
Mobile Accessibility Tools for the Visually Impaired by Nektarios Paisios A dissertation submitted in partial fulfillment of the requirements for the degree of Doctor of Philosophy Department of Computer Science Courant Institute of Mathematical Sciences New York University May 2012 Professor Lakshminarayanan Subramanian
description
Mobile Accessibility Tools for the Visually Impaired
Transcript of Mobile Accessibility Tools for the Visually Impaired

Mobile Accessibility Tools for the
Visually Impaired
by
Nektarios Paisios
A dissertation submitted in partial fulfillment
of the requirements for the degree of
Doctor of Philosophy
Department of Computer Science
Courant Institute of Mathematical Sciences
New York University
May 2012
Professor Lakshminarayanan
Subramanian

c© Nektarios Paisios
All Rights Reserved, 2012

Acknowledgments
I would like to thank everyone who has helped me along the way during my years at New York
University and especially those who have assisted me in completing this research. Special thanks
to my reader, Alexander Rubinsteyn, for his strong dedication, unparalleled professionalism and
extremely bright contributions. I also would like to acknowledge my advisor, Lakshminarayanan
Subramanian, whose input and perseverance has been instrumental in helping me turn this work
into actual research publications. My heart goes out to my parents who have always stood by
my side and without whose support I would not have been studying in the United States. It
is thanks to them that I learned that mediocrity in any endeavor is unacceptable and that one
should always strive for excellence.
iii

Abstract
Visually impaired individuals are a growing segment of our population. However, social constructs
are not always designed with this group of people in mind, making the development of better
electronic accessibility tools essential in order to fulfill their daily needs. Traditionally, such
assistive tools came in the form of expensive, specialized and at times heavy devices which visually
impaired individuals had to independently look after and carry around. The past few years have
witnessed an exponential growth in the computing capabilities and onboard sensing capabilities
of mobile phones making them an ideal candidate for building powerful and diverse applications.
We believe that the mobile phone can help concentrate the main functions of all the various
specialized assistive devices into one, by enabling the rapid and cheap development of simple
and ubiquitous assistive applications. The current thesis describes the design, implementation,
evaluation and user-study based analysis of four different mobile applications, each one of which
helps visually impaired people overcome an everyday accessibility barrier.
Our first system is a simple to operate mobile navigational guide that can help its visually
impaired users repeat paths that were already walked once in any indoor environment. The
system permits the user to construct a virtual topological map across points of interest within
a building by recording the user’s trajectory and walking speed using Wi-Fi and accelerometer
readings. The user can subsequently use the map to navigate previously traveled routes without
any sighted assistance. Our second system, Mobile Brailler, presents several prototype methods
of text entry on a modern touch screen mobile phone that are based on the Braille alphabet and
thus are convenient for visually impaired users. Our third system enables visually impaired users
to leverage the camera of a mobile device to accurately recognize currency bills even if the images
iv

are partially or highly distorted. The final system enables visually impaired users to determine
whether a pair of clothes, in this case of a tie and a shirt, can be worn together or not, based on
the current social norms of color-matching.
v
Table of Contents
Acknowledgments iii
Abstract iv
List of Figures x
List of Tables xi
1 Introduction 1
1.1 Motivation . . . . . . . . . . . . . . . . . . . . . . . . . . . . . . . . . . . . . . . 2
1.1.1 The Population of Visually Impaired Individuals and Their Daily Needs . 3
1.1.2 A Barrage of Incompatible and Expensive Specialized Gadgets . . . . . . 5
1.2 Thesis Contributions . . . . . . . . . . . . . . . . . . . . . . . . . . . . . . . . . . 6
2 Navigating Unfamiliar Indoor Environments: A Mobile Tool for Independent
Way-Finding 9
2.1 Problem Description and Motivation . . . . . . . . . . . . . . . . . . . . . . . . . 13
2.2 Related Work . . . . . . . . . . . . . . . . . . . . . . . . . . . . . . . . . . . . . . 15
2.3 Sensors . . . . . . . . . . . . . . . . . . . . . . . . . . . . . . . . . . . . . . . . . 18
2.3.1 Choosing the Right Sensors . . . . . . . . . . . . . . . . . . . . . . . . . . 18
2.3.2 Using Wi-Fi Scans . . . . . . . . . . . . . . . . . . . . . . . . . . . . . . . 19
2.3.3 Efforts to Smooth Compass Data . . . . . . . . . . . . . . . . . . . . . . . 21
2.3.4 Attempting to Employ GPS . . . . . . . . . . . . . . . . . . . . . . . . . . 22
vi

2.3.5 Reasons Against Using the Camera and the Microphone . . . . . . . . . . 23
2.4 System Design . . . . . . . . . . . . . . . . . . . . . . . . . . . . . . . . . . . . . 24
2.4.1 Choosing a Wi-Fi Similarity Measure . . . . . . . . . . . . . . . . . . . . 24
2.4.2 Counting the User’s Steps Using the Accelerometer . . . . . . . . . . . . . 25
2.4.3 Map Construction . . . . . . . . . . . . . . . . . . . . . . . . . . . . . . . 30
2.4.4 Navigation . . . . . . . . . . . . . . . . . . . . . . . . . . . . . . . . . . . 33
2.5 Usability and the User Interface . . . . . . . . . . . . . . . . . . . . . . . . . . . . 37
2.5.1 Recording a New Path . . . . . . . . . . . . . . . . . . . . . . . . . . . . . 38
2.5.2 Signifying Turns by Using Rotation . . . . . . . . . . . . . . . . . . . . . 39
2.5.3 Indicating Turns by Using Swipes . . . . . . . . . . . . . . . . . . . . . . 39
2.5.4 Navigation . . . . . . . . . . . . . . . . . . . . . . . . . . . . . . . . . . . 40
2.6 Evaluating Navigational Quality . . . . . . . . . . . . . . . . . . . . . . . . . . . 40
2.6.1 Evaluating Localizational Accuracy on Straight Paths . . . . . . . . . . . 41
2.6.2 Measuring Navigational Accuracy . . . . . . . . . . . . . . . . . . . . . . 44
2.6.3 Observations . . . . . . . . . . . . . . . . . . . . . . . . . . . . . . . . . . 46
2.7 Evaluating the System through a User Study . . . . . . . . . . . . . . . . . . . . 47
2.7.1 Study Design and Evaluation Methodology . . . . . . . . . . . . . . . . . 47
2.7.2 Study Results . . . . . . . . . . . . . . . . . . . . . . . . . . . . . . . . . . 50
2.8 Summary . . . . . . . . . . . . . . . . . . . . . . . . . . . . . . . . . . . . . . . . 60
3 Typing on a Touchscreen Using Braille: A Mobile Tool for Fast Communica-
tion 62
3.1 Problem Description and Motivation . . . . . . . . . . . . . . . . . . . . . . . . . 64
3.2 The Challenge of Using a Touch Screen as an Input Device . . . . . . . . . . . . 66
3.3 Previous Work . . . . . . . . . . . . . . . . . . . . . . . . . . . . . . . . . . . . . 68
3.4 System Design . . . . . . . . . . . . . . . . . . . . . . . . . . . . . . . . . . . . . 71
3.4.1 A Variety of Input Methods . . . . . . . . . . . . . . . . . . . . . . . . . . 72
3.4.2 Gestures for Navigation and Editing . . . . . . . . . . . . . . . . . . . . . 76
3.5 Evaluating the System through a User Study . . . . . . . . . . . . . . . . . . . . 76
3.5.1 Study Design and Evaluation Methodology . . . . . . . . . . . . . . . . . 76
vii

3.5.2 Study Results . . . . . . . . . . . . . . . . . . . . . . . . . . . . . . . . . . 78
3.6 Discussion . . . . . . . . . . . . . . . . . . . . . . . . . . . . . . . . . . . . . . . . 82
3.7 Future Work . . . . . . . . . . . . . . . . . . . . . . . . . . . . . . . . . . . . . . 84
3.8 Summary . . . . . . . . . . . . . . . . . . . . . . . . . . . . . . . . . . . . . . . . 86
4 Exchanging Banknotes without Fear: A Mobile Tool for Reliable Cash Iden-
tification 87
4.1 Problem Description and Motivation . . . . . . . . . . . . . . . . . . . . . . . . . 88
4.1.1 Practical Challenges when Using Paper Bills . . . . . . . . . . . . . . . . 88
4.1.2 Algorithmic Challenges . . . . . . . . . . . . . . . . . . . . . . . . . . . . 90
4.2 Related Work . . . . . . . . . . . . . . . . . . . . . . . . . . . . . . . . . . . . . . 91
4.3 System Design . . . . . . . . . . . . . . . . . . . . . . . . . . . . . . . . . . . . . 92
4.3.1 Image Pre-Processing . . . . . . . . . . . . . . . . . . . . . . . . . . . . . 93
4.3.2 Aggregating SIFT Key-Points into Feature Vectors . . . . . . . . . . . . . 94
4.3.3 Classifying Banknotes . . . . . . . . . . . . . . . . . . . . . . . . . . . . . 96
4.3.4 Determining if the Object is a Banknote . . . . . . . . . . . . . . . . . . . 98
4.4 Evaluation . . . . . . . . . . . . . . . . . . . . . . . . . . . . . . . . . . . . . . . . 99
4.4.1 Data Collection . . . . . . . . . . . . . . . . . . . . . . . . . . . . . . . . . 99
4.4.2 Results for each Classification Approach . . . . . . . . . . . . . . . . . . . 100
4.5 Future Work . . . . . . . . . . . . . . . . . . . . . . . . . . . . . . . . . . . . . . 101
4.6 Summary . . . . . . . . . . . . . . . . . . . . . . . . . . . . . . . . . . . . . . . . 102
5 Choosing which Clothes to Wear Confidently: A Tool for Pattern Matching 103
5.1 Previous Work . . . . . . . . . . . . . . . . . . . . . . . . . . . . . . . . . . . . . 104
5.2 Methodology . . . . . . . . . . . . . . . . . . . . . . . . . . . . . . . . . . . . . . 105
5.2.1 Sampling . . . . . . . . . . . . . . . . . . . . . . . . . . . . . . . . . . . . 105
5.2.2 Data Preparation . . . . . . . . . . . . . . . . . . . . . . . . . . . . . . . . 107
5.2.3 Learning Algorithms . . . . . . . . . . . . . . . . . . . . . . . . . . . . . . 107
5.3 Results . . . . . . . . . . . . . . . . . . . . . . . . . . . . . . . . . . . . . . . . . . 108
5.4 Summary . . . . . . . . . . . . . . . . . . . . . . . . . . . . . . . . . . . . . . . . 109
viii

Conclusion 110
Bibliography 122
ix

List of Figures
2.1 Expected, actual and filtered compass angles . . . . . . . . . . . . . . . . . . . . 23
2.2 Similarity function definitions . . . . . . . . . . . . . . . . . . . . . . . . . . . . . 25
2.3 Spatial specificity of RBF and Tanimoto similarity measures . . . . . . . . . . . . 26
2.4 Steps counted on the accelerometer signal . . . . . . . . . . . . . . . . . . . . . . 29
2.5 System interface: (a) Initial menu (b) Recording a path (c) Selecting a route . . 38
2.6 Expected vs. actual physical distance of each scan from start of path . . . . . . . 43
3.1 Screenshots of interface . . . . . . . . . . . . . . . . . . . . . . . . . . . . . . . . 72
3.2 Distribution of touches for each dot . . . . . . . . . . . . . . . . . . . . . . . . . . 74
3.3 Completion time increases with age . . . . . . . . . . . . . . . . . . . . . . . . . . 80
4.1 Incomplete but clear images . . . . . . . . . . . . . . . . . . . . . . . . . . . . . . 100
5.1 A matching pair of shirts and ties . . . . . . . . . . . . . . . . . . . . . . . . . . . 106
5.2 The same shirt matches with more than one tie . . . . . . . . . . . . . . . . . . . 106
5.3 Non-matching pairs of shirts and ties . . . . . . . . . . . . . . . . . . . . . . . . . 106
x

List of Tables
2.1 Fluctuations of Wi-Fi signals while the user is stationary . . . . . . . . . . . . . 20
2.2 Localization error of standard algorithms . . . . . . . . . . . . . . . . . . . . . . 21
2.3 Node numbers adjacent to rooms in a long corridor . . . . . . . . . . . . . . . . . 35
2.4 Node numbers after using current nodes buffer in same corridor . . . . . . . . . . 35
2.5 Accuracy of turn instructions . . . . . . . . . . . . . . . . . . . . . . . . . . . . . 45
2.6 Accuracy of destination announcements . . . . . . . . . . . . . . . . . . . . . . . 46
2.7 Demographics of the user participants . . . . . . . . . . . . . . . . . . . . . . . . 48
2.8 User ratings of the navigational system . . . . . . . . . . . . . . . . . . . . . . . . 52
3.1 The user participants . . . . . . . . . . . . . . . . . . . . . . . . . . . . . . . . . . 78
3.2 User ratings of input methods . . . . . . . . . . . . . . . . . . . . . . . . . . . . . 80
4.1 Accuracy and speed of each key-point classification method . . . . . . . . . . . . 100
5.1 Performance of learning algorithms . . . . . . . . . . . . . . . . . . . . . . . . . . 109
xi
Chapter 1
Introduction
Much of our social infrastructure is organized with the premise that all members of society have
their full vision. Most countries maintain costly transportation systems which rely mainly, if not
exclusively, on the ability of sighted car owners to drive through an elaborate road network, whilst
urban and rural regions alike are kept adequately lit all throughout the night for the sole benefit
of sighted inhabitants. Given these organizational and financial priorities, the needs of visually
impaired citizens are at times not addressed adequately, a fact which creates several challenges
which visually impaired individuals have to deal with on a daily basis. However, some of the
obstacles encountered by visually impaired people can potentially be overcome through simple
and cheap assistive software which runs on modern mobile phones. In this thesis, we outline four
such mobile accessibility systems that address essential and practical needs of visually impaired
users: (a) A mobile navigational tool which provides visually impaired users with directions
in unknown indoor environments, (b) A mobile Brailler application for visually impaired users
to enter text on touch screens, (c) A system for recognizing currency bills using mobile phone
cameras and (d) A system which can determine which clothes could be worn together by using
the mobile phone’s camera. In this work, we describe the design, implementation and evaluation
of the above systems. We have evaluated two of these systems with visually impaired users and
describe the qualitative and quantitative enhancements of our solutions through detailed user
studies. The underlying theme across all these systems is how to design appropriate smart phone
1

based applications which take advantage of the rich array of sensors available on such modern
mobile phones in order to aid visually impaired users to perform such day-to-day tasks.
1.1 Motivation
“There was a time when disabled people had no choice but to ask for help - to rely
on the ’kindness of strangers.’ It was thought to be their lot,” [37].
Visually impaired individuals traditionally relied on the assistance and good will of others for
their everyday needs. This was due to the lack of basic accessibility affordances when carrying
out many daily life activities. Travelling alone was hard or even dangerous due to the lack of
carefully constructed sidewalks, or due to the inaccessibility of public transport, which lacked any
form of audio announcements [6]. This fact made venturing outside one’s familiar place of living
to be only undertaken by the truly adventurous of visually impaired individuals. Meanwhile,
finding one’s way in unknown buildings was impossible due to the lack of Braille signage on
building doors and elevators, in addition to the deficiencies present in safety regulations. This
further exacerbated the mobility difficulties experienced by such individuals solidifying their
social isolation. Any written form of communication was off-limits to blind individuals and
barely usable by partially sighted people, a fact which was detrimental to the education of this
segment of the population. This situation, coupled with a negative social perception about the
abilities of visually impaired individuals, ensured that such persons were more often than not
confined to specialized educational or habitational institutions [73]. The employment market was
especially hostile to such individuals, who were encouraged not to seek employment in the open
market but were protected and nurtured under the auspices of a philanthropic model of social
welfare [44].
In recent decades, social and legal developments have enabled the visually impaired to demand
a more equal position in modern society [84]. Technological improvements have given more
independence to the visually impaired population, overcoming the barriers preventing access
to written text and opening new horizons for enjoyable employment. Electronic devices and
especially personal computers and mobile phones have become carriers of assistive software,
enabling visually impaired users to obtain written material freely, communicate more easily
2

with the world outside their own community and perform their job duties effectively [24]. Mobile
phones with powerful processors have become ubiquitous, displacing previous specialized devices.
The rise of the World-Wide Web has especially boosted the access of its visually impaired users
to information which was previously available in print and only via the assistance of sighted
human readers. Furthermore, the widespread availability of free mapping services has enabled
the population of visually impaired people to locate and even explore places of interest before
actually visiting them, removing some of the obstacles to unhindered mobility.
However, even today and after years of progress, the interior of an unfamiliar building seems
like a labyrinth to some visually impaired individuals, who still have to rely on sighted guides
in order to locate a specific room. According to the lawsuit filed by a blind advocate orga-
nization [37], American currency is still inaccessible to blind people as all dollar bills have the
same shape and lack any tactile markings, making daily transactions inconvenient and even risky.
While getting dressed, visually impaired individuals still face dilemmas on what set of clothes
to wear together, since determining which of their clothes match still requires the skillful and
flawless organization of their wardrobe. Finally, even though the mobile phone has provided
many advantages to the visually impaired population, fulfilling their mobility and communica-
tion needs successfully, the arrival of touch screen phones has created new accessibility challenges,
especially in the realm of text-entry. Given that texting is a ubiquitous form of communication,
any such difficulties in entering text on touch screen devices can negatively affect the quality
of social interactions enjoyed by visually impaired individuals. This thesis attempts to provide
an answer to the above four accessibility challenges by designing and subsequently testing four
separate software solutions that can run on a mobile phone. These solutions can help a visually
impaired person navigate in an unknown building, recognize American currency, identify if pairs
of shirts and ties can be worn together and enter text on a touch screen phone.
1.1.1 The Population of Visually Impaired Individuals and Their Daily
Needs
Currently, 2.5 million individuals in the United States are blind or partially sighted [20], which
means that they have an optical acuity of 10% even with corrective lenses. However, with the
3

aging of the population, blindness is becoming more and more prevalent [5]. As reported by the
Center for Disease Control and Prevention [20], in the United States “Nineteen percent of persons
70 years of age and older had visual impairments”. In today’s uncertain global financial climate,
this aging of the population of visually impaired users could presumably reduce the availability of
meaningful accommodations. As such senior citizens are not always viewed by everyone as able
and productive members of society, the quantity of employment opportunities and recreational
outlets could also suffer. Regrettably, this assumption is confirmed by the U.S. National Center
for Policy Research for Women and Families [20], which states that “Poverty is a fact of life for
many blind adults, especially older women,” and “Few blind adults receive welfare”. In fact,
visually impaired individuals of all ages are at a disadvantage, given that “Nearly one in five [of
blind individuals] lives in poverty,” and “Only 19 percent are currently employed” [20].
With such a devastating rate of unemployment and the social repercussions that it entails,
large groups of visually impaired individuals might begin to feel negative self esteem [83], pre-
ferring not to leave the security of their home. This in turn could affect the level of social
independence that such individuals may attain, a fact which can negatively impact the develop-
ment of their interpersonal and practical skills. Any deficiencies in a person’s essential skills set
may in its turn result in an even more reduced self esteem. Fortunately, as put forward by works
like the current thesis, software-based assistive solutions may provide such individuals the social
and vocational independence they seek, breaking this vicious circle.
Personally, after interacting with many visually impaired people throughout my life, I have
come to believe that removing only a few everyday accessibility obstacles would go a long way
in drastically altering the social landscape in their favor. These obstacles could be grouped
into three large categories. Firstly, the ability to move around without any assistance is the
top desire of visually impaired people, especially being able to easily travel around their local
town or to find their way in unfamiliar buildings. Fulfilling this need adequately would help
them progress enormously on the road to independence. Their second most important concern
is access to written text including reading road and building signs, reading mail and completing
important documents, such as tax forms. Finally, handling daily tasks, such as effective house
cleaning, cooking and separating clothes for laundry/dressing, is also deemed important. At
least in the realm of employment, these observations are corroborated by a 1999 survey of 176
4

visually impaired and low vision individuals which reported that “employment barriers included
attitudes of employers and the general public; transportation problems; and lack of access to
print, adaptive equipment, and accommodations” [13].
1.1.2 A Barrage of Incompatible and Expensive Specialized Gadgets
Each technological solution to a blindness-related problem traditionally came in the form of a
specialized device. For example, the Eureka A4 was one of the first portable personal computers
for the blind [25]. This device offered features such as note-taking and music composition, among
many others, and it was released in 1986. The relatively small market for assistive technologies,
however, meant that few companies would develop for this audience making products very ex-
pensive and creating monopolies. For example, Eureka A4’s price was around $2500, whilst even
today a specialized printer for embossing Braille may cost upwards of $4000 [34]. Meanwhile,
these devices were generally not programmable and thus could not serve as a platform on which
independent software developers could thrive. In order to reduce costs, manufacturers of such
specialized devices may remove user interface components which are necessary for these devices
to be used by fully sighted individuals. For example, the Eureka A4 came with no screen and
with only a Braille keyboard built-in. This may deny blind individuals the ability to ask for help
with their specialized device from a sighted friend, whilst it would be unlikely to find technical
support or servicing from anywhere other than the original manufacturer. This unfamiliarity of
the general public with specialized devices did not only mean increased costs for the visually
impaired user if the device was ever to need repair, but it could also create negative social con-
notations. Such negative perceptions could develop especially among the social circles of young
users, since many of these specialized devices were bulky and lacked any aesthetic appeal. On
the other hand, the cost of incorporating extra assistive features into mainstream products was
high due to the increased cost of electronics design and production. Blind users were viewed as
a special group which was hard to accommodate, was little understood and was thus not seen as
a potential customer. Giving access to mainstream technology as a form of legal requirement or
social responsibility was not in any way mandated and was thus readily ignored. There was also
little market pressure to change this.
5

During the 90s, a strong push for building accessibility aids on mainstream personal com-
puters was undertaken. This effort has been successful in creating much widespread assistive
software, the most important of which is the screen reader. Such software, by allowing speech
and Braille access to the computer’s screen, has been extremely successful in work rehabilitation,
[22]. However, such software is still expensive and may cost more than $1000, [22]. Also, it is
not portable and thus cannot solve all the problems of accessing printed text.
More recently, the mobile phone is emerging as a rich unifying platform for assistive software
development. Legal requirements and increased awareness concerning the blind population made
manufacturers of mobile phones [33] start to incorporate accessibility into their devices. Third
party developers [15] stepped-in in order to fill the accessibility gaps of the remaining smart phone
platforms. The arrival of cheap smart phones with a high-resolution camera, an array of other
sensors and text-to-speech enables accessibility solutions to move away from specialized hardware.
Rich programmability allows cheaper development, faster updates and thus the involvement of
smaller software players in the accessibility space.
Despite the above advances, assistive or even accessible mobile phone software development is
still a nascent market. Consequently, visually impaired users face some challenges when operating
their mobile phones. Partially sighted users, for example, may complain about the size of the
letters on the relatively small phone screens, whilst blind users have difficulties finding items
easily on touch screen phones. These challenges, however, do not seem to be an impediment
to mobile phone adoption by the visually impaired. In fact, “people with disabilities continue
to choose commodity phones, even when they are aware of specialized access options”, [39].
This work uses the smart phone as a platform for consolidating and experimenting with a set of
assistive aids.
1.2 Thesis Contributions
This thesis describes the design, implementation, evaluation and user-study based analysis of
four different mobile accessibility applications which are summarized next:
1. Mobile Software for Independent Way-Finding in Indoor Places: Visually im-
paired people have a harder time remembering their way around complex unfamiliar build-
6

ings, whilst obtaining the help of a sighted guide is not always possible or desirable. By
sensing the users location and motion, however, mobile phone software can provide navi-
gational assistance in such situations, obviating the need of human guides. We present a
simple to operate mobile navigational guide that uses Wi-Fi and accelerometer sensors to
help the user repeat paths that were already walked once. The system constructs a topolog-
ical map across points of interest within a building based on correlating the users walking
patterns and turns with the Wi-Fi and accelerometer readings. The user can subsequently
use the map to navigate previously traveled routes. Our system requires minimal training
and no pre-existing building maps. Our system uses a combination of gesture and speech
interfaces to make it usable for visually impaired users.
2. Mobile Software for Typing on a Touch Screen Using Braille: For visually impaired
users, existing touch-screen keyboards are cumbersome and time-consuming. We present
several prototype methods of text entry on a modern touch screen mobile phone that are
based on the Braille alphabet and thus are convenient for visually impaired users. We
evaluate the strengths and weaknesses of our Braille-based methods through a user study
with 15 participants. Our results indicate that a spatially-oriented method of entering
Braille using a single finger was preferred since it balances simplicity with accuracy. We
discuss how insights revealed by our user study can help us further refine and improve the
preferred method.
3. Mobile Software for Reliable Cash Identification: Despite the rapidly increasing use
of credit cards and other electronic forms of payment, cash is still widely used for everyday
transactions due to its convenience, perceived security and anonymity. However, the visu-
ally impaired might have a hard time telling each paper bill apart, since, for example, all
dollar bills have the exact same size and, in general, currency bills around the world are not
distinguishable by any tactile markings. We experiment with the use of a broadly available
tool, the camera of a smart-phone, and several methods of classifying SIFT key-points to
recognize partial and even distorted images of paper bills.
4. Mobile Software for Clothes Matching: This part of the work attempts to make a
first step in computationally determining whether a pair of clothes, in this case of a tie and
7

a shirt, can be worn together or not, based on the current social norms of color-matching.
Our aim is to give visually impaired persons the ability, using snapshots taken by their
mobile phones, to independently and confidently be able to choose from their wardrobe
which set of clothes they can wear together.
8

Chapter 2
Navigating Unfamiliar Indoor
Environments: A Mobile Tool for
Independent Way-Finding
Visually impaired people frequently have a harder time familiarizing themselves with new indoor
environments. The predominantly visually organized society designs spaces in ways that create
barriers to exploration for those without vision. Recalling already traveled routes requires suf-
ficient information about the route to be communicated to and be readily remembered by the
visually impaired person. This includes both having to remember accurate turn-by-turn infor-
mation, as well as specific points of interest on each route, such as a particular office door, in
order to be able to both use them as a point of reference and as a possible destination. However,
this burden of having to build a conceptual map can be potentially alleviated by using a mobile
phone to track the location and the movement of the visually impaired person within a building,
giving navigation assistance upon request.
This work [66] presents the design and implementation of a mobile navigational guide that
uses a combination of Wi-Fi and accelerometer sensor readings with a mobile device to learn and
navigate unknown indoor environments. The navigational guide is designed to enable visually
9
impaired users to easily train the system and record new paths between two arbitrary points
within an indoor environment in a single traversal and allows the user to navigate any recorded
path in the future. During the training phase, the system correlates the physical trajectory of
the user with the Wi-Fi and accelerometer sensor readings from the mobile device to construct a
virtual topological map of each path. For navigation, the system infers the user’s current location
in the topological map and uses the Wi-Fi and accelerometer sensors to navigate the user to any
pre-recorded end-point within the environment.
Designing a highly accurate and usable mobile navigational system for visually impaired users
raises several fundamental challenges that this work addresses. First, while a mobile device has a
wide range of sensors including Wi-Fi, accelerometer, camera, GPS and compass that could aid in
navigation, not all of these sensors are suitable for visually impaired users for indoor navigational
purposes. In practice, all these inputs are highly noisy and we outline the shortcomings of these
sensors. Second, the accuracy of the navigational instructions provided to a visually impaired
user in an indoor environment needs to be significantly high. These way-finding instructions,
such as the announcement of turns, need to be accurate both in their content as well as in their
timeliness. They should give ample warning so as to enable visually impaired users to react to
their changing surroundings safely and promptly. Despite the large body of prior work on Wi-
Fi localization [63, 86, 74, 28, 11], existing solutions have exclusively focused on localizational
accuracy and not on navigation, a fact which makes them directly not applicable for the problem
domain. Offering way-finding assistance to a visually impaired user in an unknown building might
not be so much dependent on a perfectly accurate localizer, but on the ability of the system to
compute the optimal route to the user’s destination in real-time, continuously readjusting the
up-coming instructions that would be issued. Third, navigating unfamiliar environments should
require minimal training without any foreknowledge of the environment. In our usage scenario,
we require users to be able to retrace a path with only a single training traversal of the path.
Finally, the system has to be simple and usable by visually impaired users. The total reliance
of a visually impaired person on his senses of hearing and touch, in order to move safely and
successfully inside an unknown building, makes a careful design of the user interface of our
system especially important. This is because the phone’s default touch screen interfaces and
visual interactions cannot be engaged or perceived by a visually impaired user, making the use of
10

an audio-based interface essential. In this work, we explore how to minimize audio interactions
by using motion or haptic gestures which minimize the disturbances to the user’s main cognitive
task of sensing his surroundings. The overall contribution of this work is the implementation of a
highly accurate, portable and easy to use indoor navigation system with very minimal training.
Based on a detailed evaluation across multiple different indoor environments as well as a user
study involving nine visually impaired users, we show the following results. First, using a combi-
nation of Wi-Fi and accelerometer readings, our system is able to issue navigational instructions
with an accuracy of less than six feet across a significant fraction of the paths; the worst case
error was less than ten feet. Second, the navigation system could provide almost completely
correct turn instructions within a few feet of the actual turn for almost all the navigation tests;
in the worst case, for one of the paths, a turn was announced roughly 3− 4 feet after the actual
turn was taken. All the participants of the user study were very enthusiastic in using and testing
our system; all of the users expressed willingness in using such a system on their phones. 8 out
of the 9 users expressed happiness in the level of navigational accuracy of the system when issu-
ing turn directions, whilst the dissatisfaction of the single remaining user was based on the fact
that he encountered technical difficulty when initially training the system. Most of the visually
impaired users found our swipe gesture interface coupled with a transparent input overlay (to
filter unnecessary user touches) to be very easy to use. In summary, we believe that this system,
while not perfect, is a significant step forward towards realizing the vision of a usable and highly
accurate mobile navigational indoor guide for visually impaired users.
The main algorithmic and UI contributions of this work are as follows:
• Provides a new Wi-Fi scan similarity measure which is more sensitive in distinguishing
scans separated with differing physical distances than previous approaches.
• Offers a robust method of counting walking steps using a phone’s accelerometer.
• Describes a method of creating a representative topological map of a building floor using
similarities between Wi-Fi scans and distance information from an accelerometer.
• Details how to combine Wi-Fi sensing together with motion information from an accelerom-
eter to improve navigational accuracy and the expressiveness of navigational instructions.
11

• Uses swipe gestures, which have a very low attention-grabbing effect, to indicate turns with
a very high accuracy. To prevent users from accidentally invoking touch commands, we also
provide a transparent input overlay to filter user’s touch inputs to only allow our limited
set of input gestures.
The technical workings of our navigational system can be summarized as follows:
From the set of sensors in the mobile phone, we use Wi-Fi scanning and the accelerometer to
“sense” the environment for location and distance information respectively. Wi-Fi scans include
the mac-address of each visible access point and its signal strength, as discussed further in
section 2.3. This information can be used to construct fingerprints which are related to regions
of space, but they cannot tell us how large of a region we are dealing with or whether a user is
moving. So, in addition to Wi-Fi scans, we can use the accelerometer to determine lengths of
such regions and how fast, if at all, the user is walking 2.3. While walking, the user can use swipe
gestures to mark turns and use speech recognition to input labels of nearby landmarks, such as
“Water fountain”, as shown in section 2.5.
The Wi-Fi scans coupled with accelerometer and turn information enable us to construct
a topological map of the floor automatically, as detailed in section 2.4.3. This map partitions
space in a uniform and semantically logical way. Places on the map with quite distinct physical
characteristics, such as those separated by turns, are delineated as such. Also, places marked as
distinct in the same physical region by the system divide the space evenly. The user labels are
then attached to these places, if previously recorded. The use of human labels is more memorable
to a user than physical coordinates as explained in 2.5. Meanwhile, when issuing navigational
instructions, information from the accelerometer is used to adapt the navigational algorithm, in
order to predict the next location of the user. This improves navigational accuracy, in addition
to the wording of the navigational instructions themselves, as demonstrated in section 2.4.4.
During navigation, the system uses text-to-speech as described in section 2.5 to prompt
the user to walk straight or turn at the correct spots. The instructions are enhanced with
distance estimations measured in steps, to help the user virtually sketch out the up-coming part
of the route. Advance warnings are also provided both before turns and before arriving at the
destination. Instructions can optionally be given as vibratory feedback if desired.
12

In short, Wi-Fi scans can tell us what locations exist and their topological relationship to one
another. The accelerometer data can give us distances, without which navigational instructions
would be less useful and without which navigational accuracy would suffer. The user can give
names to locations which have a personal meaning and do not feel detached or static, section 2.5.
These names of landmarks are given using the more natural input modality of speech, to prevent
the delays and the inaccessibilities inherent in touch-typing. Turns are marked using fast and
unobtrusive gestures across the phone’s screen.
2.1 Problem Description and Motivation
The high rates of unemployment for visually impaired people, reaching up to about 80% in the
United States [20], indicate that such persons are still, despite recent technological and legal
breakthroughs, not realizing their full potentials. The inaccessibility of buildings has been for
years a major hindrance to the free movement of such individuals, either due to unfriendly
and even at times unsafe design practices, or due to the lack of Braille signage, such as door
labels. The above coupled with the chronic lack of mobility instructors due to the fact that less
and less people decide to follow this arduous profession, exacerbates the mobility difficulties of
such individuals. The result is that many visually impaired people decide to stay in a familiar
environment most of their time, such as their home, and do not actively seek employment or
social opportunities outside it. This is because the lack of information on how to navigate an
unknown building, would make a visually impaired person have to turn to a sighted guide for
assistance, placing a social burden on both the visually impaired individual and the sighted guide.
The following scenario elucidates the issue further.
Consider the case where a visually impaired person visits a new indoor environment (such
as a hotel) with no prior knowledge. A small set of people within the environment initially
volunteer to assist the visually impaired person within the environment to specific end-points of
interest (such as a hotel room or dining room ). However, the visually impaired person wants to
be independent and not have to rely on others beyond a few initial interactions. Our goal is to
provide a mobile navigational guide, which without any foreknowledge of the indoor environment
and with little training, would be able to repeat any part of a route in the building. This system
13

should be able to “sense” its surroundings and collect relevant location and motion information,
data which could be used later to determine accurately the location of the user inside the building
and provide navigation instructions to a user-specified destination, like the ones that the user
would have had to remember in the absence of such a system, including informing him on when
a turn or when the destination is approaching.
Designing such a navigation system requires us to address several challenges. Given the
target audience and the problem setting, the system should be highly portable and easy to learn
and use. To work in unknown environments, the system cannot rely on complicated floor maps,
which require a lengthy preparation procedure, [85], building structure models [35] or pre-existing
geographic information systems [53]. The need for portability implies that no heavy equipment,
such as a portable computer, [75], or a costly and hard to set-up server farm, [32], should be
required or even assumed to be available. Existing commercial aids for the visually impaired
are also not as suitable as might be deduced at first glance. This is because such aids might
be expensive while being fragile, or, simply be quite awkward to carry around. Some examples
are ultrasonic canes or laser glasses. At the same time, solutions based on sensitive or heavy
equipment, such as camera glasses, a robotic guide dog [45] or a wearable computer, are also
cumbersome. On the one hand, the above equipment places a burden on the user who now has
to carefully look after such devices given their expense. On the other hand, such specialized
devices may create a non-esthetic appearance for their visually impaired users, who might feel
singled-out.
These constraints lead us to the use of one device, which is nowadays available in every pocket,
the mobile phone. Not only is the mobile phone ubiquitous but it is familiar to the target group
[39], lightweight and above all is equipped with an array of sensors which we can use to our
advantage for effective tracking. Employing the above sensors, however, can be algorithmically
difficult since the sensor readings can be highly erroneous. It has been shown in the literature
numerous times, however, that the signal strength of neighboring Wi-Fi networks can be used to
determine an approximate location of the user without necessarily knowing the topology of the
Wi-Fi beacons, [28, 17, 60]. A significant question that remains is how can we avoid the need
of ready-made floor maps or building models? The solution is to employ the user as the initial
trainer of the system. Given that this operation should be carried out once, we feel that the
14

social burden is much lower than having to ask for assistance or reassurance more often. The
costs of acquiring such ready-made maps or models in a lot of buildings are also prohibitively
high and would require specialized skills.
Any electronic navigational aid, however accurate, cannot be the sole mobility guide to a
visually impaired user. This is because many obstacles and other ground anomalies may not be
capture by such a system, even though their detection is essential for a safe mobility. The sen-
sors’ accuracy and computing power required for such an endeavor would be prohibitive, whilst
algorithms for such an accurate steering are yet to be perfected. The physical world’s complexity
creates a moving target for the designers of such systems who cannot certainly anticipate every-
thing that can “go wrong” in a fast-changing environment. In addition, movable furniture and
other humans who might be walking around the vicinity offer additional challenges to an elec-
tronic navigational guide. As a result, current-day commercial navigational systems are limited
to offering turn-by-turn directions.
In fact, visually impaired users make extensive use of hearing and touch in order to explore
their surroundings and identify suitable landmarks which could assist in determining their loca-
tion. Landmarks that could be employed for finding a specific room, for example, could include
the presence of a wall with a certain feel or even the absence of a high obstacle, such as an
open door at a certain point along a corridor. Hence, any electronic navigational aid, however
accurate, cannot be the sole mobility guide and should not over-ride conventional mobility aids,
such as a cane, or overload the information received through the senses of touch and hearing.
2.2 Related Work
Location tracking and movement detection have been the focal-point of a set of bourgeoning ap-
plications. On the location tracking side, chief amongst them are applications providing mapping,
driving directions and social networking services. Other scenarios including Crowd-sourcing (for
vehicular traffic estimation or for gathering location data [70, 2]), for security (such as tracking
of stolen or rogue devices [79], for better scheduling of everyday activities and regulating phone
functions depending on location, such as [36], have been proposed in the literature. Regard-
ing movement detection and measurement, the greatest areas were such techniques have been
15

employed are in medical care and fitness [93].
In general and according to the survey carried out in [50], localization systems in the literature
can vary in the way they describe locations using physical coordinates, or, relative or topological
using natural language; the last being the approach followed in this work. The localization
algorithms themselves can be categorized into those which use the signal strength, the signal’s
angle or the time of arrival. The localization unit can either be a transmitter and thus be localized
by various stationary receivers like in sensor networks, or, be a receiver sensing the signals of
several stationary transmitters [50]. Earlier related work used one of sonar, vision and laser
sensing technologies, in both mainstream systems, [86, 74, 59, 14], in addition to systems built
specifically for the visually impaired community, [45]. However, the high cost, the difficulty of
deployment and the high demand of computational resources is problematic for large-scale usage
of such work.
An empirical method for finding the user’s physical coordinates on a map grid using Wi-
Fi signals was proposed in the Microsoft Research RADAR location system [63] and further
extended in works such as [10, 46, 47, 48] and more recently in [11]. In [11] GPS was used
to opportunistically capture physical coordinates at building boundaries which were in turn
used to bootstrap a Wi-Fi signal propagation model which localized indoor Wi-Fi beacons and
devices. However, in our own experiments GPS was not visible at all inside the building, even
at boundaries, and one had to leave the building and wait for some time for the GPS receiver to
return any useful data.
For their location tracking algorithms a number of techniques were proposed, such as prob-
abilistic Bayesian Particle Filters [29], nearest neighbor-based, neural networks [3] and support
vector machines [8]. An accelerometer in conjunction with the Wi-Fi signals is used in [55] to
improve the accuracy and precision of the localizer in an online manner, as well as providing
directionality information. The fact that a user is moving or not (a motion model) is also found
to be important in [58] and to improve the accuracy of a Bayesian Wi-Fi localizer in [4]. In
Simultaneous Localization and Mapping (SLAM) [80], a robot can simultaneously build a map
of its environment while traversing it. This usually requires input from a number of different
sensors with statistically independent errors.
However, the general drawback with the above systems is that they require either a dense
16

installation of the Wi-Fi sensors, such as in every office, or a lot of training. Our work proposes
a system which is trained by the user and which does not require having any notion of physical
coordinates, a fact which also eases the semantic labeling of locations. Traditionally, their goal
was to minimize the localization error which was defined in the literature as the mean or median
squared error in Euclidian distance, i.e. the distance between the predicted and the actual
Cartesian coordinates. The reliability of such systems can then be determined using the variance
of the error. However, one may wonder in what way such a description of the error is interpreted
when a localization system is used to aid in navigating a person on a route. Moving correctly on
a route involves making the right turns on time and at the right place, avoiding obstacles while
verifying your location by observing landmarks. All of these requirements are not tested by the
error function used in many traditional localizers and thus a more empirical approach is followed
when evaluating our navigational algorithm.
Concerning the design of a touch-based user interface, [89] describes and evaluates a whole
array of multi-touch gestures which can be used in rich interactive applications. Amongst them is
the “flick” gesture, a long and fast swipe motion across the width of the phone’s screen, which we
also employ. Our system draws on the experience of [38] when attempting to make the phone’s
touch screen accessible. In that paper ten subjects who were blind were given access to the iPhone
for the first time. This was achieved by employing different types of touch gestures depending
on the task. According to [38], these gestures were easy to memorize but hard to confuse with
one another or to accidentally invoke when related to sensitive operations. For example, moving
through a list of items was performed using a flick gesture whilst the more “dangerous” gesture of
activating an item required two fingers to perform. Further, in their comparative analysis between
using an iPhone and a more traditional phone with buttons, [38] found that users expressed more
satisfaction and increased enjoyment when using the former, even though they were faster when
carrying out the tested tasks on the latter. This demonstrates that touch interfaces, given their
novelty, might engage the blind users more than traditional button-based interfaces by arousing
their curiosity.
17
2.3 Sensors
In this section we describe the various sensors available on a mobile phone, we detail the obstacles
encountered when attempting to use these sensors for way-finding purposes and we explain our
findings which led us to specifically focus on the Wi-Fi and accelerometer sensors.
2.3.1 Choosing the Right Sensors
Modern smart phones include a variety of sensors, amongst them a Wi-Fi card, an accelerometer,
a compass, a GPS receiver, a camera and a microphone. A Wi-Fi card which, by periodically
scanning for neighboring beacons, can “sense” their signal strength, provides as with an energy
wise cheap albeit a noisy sensor, [42]. Similarly, an accelerometer can be a low-power solution to
“sense” movements, however, its signal is also noisy and contains all the movements that a user’s
body might make, ranging from the minutest shaking of the arm to the abruptness of someone
being pushed, most of which do not represent walking.
Since our system should work indoors the use of a GPS receiver was deemed to be infeasible.
This determination was arrived at after testing which showed that GPS satellites were only
visible outside the building boundaries and at times stable coordinates were returned only after
a considerable amount of time had elapsed in order for the GPS receiver to acquire a fix. This
result rules out the use in our system of the most accurate but power-hungry [42] location
sensor. At the same time, a navigational algorithm which can detect user motion and location
using Wi-Fi signals still cannot determine the directionality of the user without employing a
compass or waiting for the user to move a certain distance before determining the direction in
the map towards which he is walking. Moreover, the usefulness of a compass while constructing a
topological map by the system is apparent as without it the orientation of the whole map would
be absent. However, after attempting to smooth the noisy signal provided by the compasses on
two of our phones, we found that it was not really possible given the sudden jumps and erroneous
information that such a sensor would often provide. An explanation could be the iron structures
and electronic installations in many buildings which provide a high source of interference for these
sensors, coupled with perhaps a low quality of the compasses found in smart phones. Further
18

details concerning the experiments on the unsuitability of the GPS and compass can be found at
the end of this section.
2.3.2 Using Wi-Fi Scans
For location estimation, we propose the use of Wi-Fi signals from wireless networks, which are
already ubiquitous in most modern buildings in the Western world, such as apartment houses,
hotels and campuses. The wireless 802.11 functionality is used to sniff nearby wireless beacons.
These measurements of the strength of wireless signals should provide a sufficient fingerprint of
the current location, i.e. given a new scan containing mac-addresses and measurements of their
signal strengths at a point and a list of previously recorded scans, we should be able to find a
rough estimate of the scan neighborhood in the collection of previous scans in which the new scan
lies, with a sufficiently small margin of error. A scan neighborhood of a specific scan includes the
scans which have been recorded close in physical space to that scan. To achieve this we assume
that scans close together in physical space should exhibit similar characteristics, i.e. list a similar
set of beacons with comparable signal strengths. Therefore, a similarity function must be defined
which ranks pairs of scans which list a similar set of beacons with comparable signal strengths
high, whilst scans which have few beacons in common and whose signal strengths are too far
apart are ranked low. Further, any similarity measure should be able to discriminate scans which
are closely located but which are clearly semantically separate via a physical morphology, such
as a turn. The measure should be stable in places with weak beacon signals or diverse beacon
densities.
The difficulty of such an endeavor lies in the fact that “Intrinsic noises in the signals caused
by multi-path, signal fading, and interference make such task challenging”, [42]. Beacons may
“appear” and “disappear” intermittently, especially at the boundaries of buildings and in hallways
with many physical obstacles. Even the human body can cause interference and thus Wi-Fi
signals are expected to differ depending on the number of people currently walking around the
building and how fast they are moving. Even in the simplest case, where a user is standing
still or rotating slowly at a single location, we observed nearly a 20 dB difference between the
maximum and minimum RSSI for a given access point. Given the fluctuations of Wi-Fi signals
19

Access Point Min RSSI Max RSSI
AP1 -78 -58
AP2 -91 -71
AP3 -79 -58
AP4 -96 -88
AP5 -92 -81
Table 2.1: Fluctuations of Wi-Fi signals while the user is stationary
at a point, designing a navigation system purely using Wi-Fi signals can lead to high localization
errors. Table 2.1 illustrates the variations in signal strength extracted from a mobile device when
standing still or rotating slowly around a fixed point. What is striking is that the difference
between the minimum and the maximum can be as high as 20 dB which is a factor of 100
difference at the receive power levels.
To illustrate the poor localization accuracy obtained by using only Wi-Fi signals, we consid-
ered an indoor testbed with 23 Wi-Fi access points and ran four standard localization algorithms
from the research literature: weighted k-Nearest Neighbors (kNN), linear ridge regression, kernel
regression and neural networks. We trained these algorithms across multiple spots within the
floor and tested it for random locations within the floor. We considered the basic versions of these
algorithms and also optimized the parameters for our settings and found the minimum localiza-
tion error was 10.2 feet while the unoptimized versions had a much higher error as illustrated
in Table 2.2. Despite attempting to exhaustively fine-tune the various parameters of our neural
network, the localization error was consistently over 16 feet. Similarly, kernel regression did not
offer substantial differentiation over the other approaches. Finally, we unsuccessfully attempted
to combine a neural network with our best performer, weighted k-Nearest Neighbor. Essentially,
we used the neural network as a mechanism of producing extra artificial neighbors which were
then fed to the weighted kNN algorithm.
A further complication which arises when developing software which probes the phone’s Wi-
Fi card for neighboring Wi-Fi beacons is that their signal strength, or RSSI, is represented in a
vendor specific way. The RSSI is a value of one byte in length, denoting the signal strength for
20

Method Average Error (feet)
Weighted kNN (unoptimized) 19.2
Ridge regression (unoptimized) 22
Weighted kNN (optimized) 10.2
Ridge regression (optimized) 14.4
Table 2.2: Localization error of standard algorithms
each visible Wi-Fi access point. However, the range, sign and scale of this value is not defined
in a common standard and so some phone platforms represent RSSI in decibels whilst others in
an even more arbitrary way.
2.3.3 Efforts to Smooth Compass Data
In our system, we originally attempted to employ the phone’s compass to determine the user’s
orientation and thereby automatically mark the turns on a route. As a magnetic sensor, the
compass can be very sensitive to fluctuations in the magnetic field caused by the proximity of
metallic objects, electronic equipment and building infrastructure.
After the phones software has stored the compass readings, post-processing was carried out in
order to remove noise. A moving window of readings is taken over the whole set of readings and
the value at the mid-point of the window is replaced by the median of the whole window. After
experimentation, we chose a window size of five. The window is then shifted one position forward
and the process repeated. This helps to smooth the otherwise very jittery compass readings.
However, the meaning of the term median is not clearly defined over compass readings, which
by definition are given in degrees. Thus, we have to define a circular median which can work
over degree values. This is because there is no notion of greater than or less than in the realm of
angles. This can clearly be seen by asking oneself, what is the median of 0, 5 and 355 degrees.
The mathematically defined median = 5. But clearly the correct answer should be 0. After
placing all our angle values on a circle, the circular median is thus defined by first finding the
arc of the circle which is mostly covered by our angle values, i.e. by excluding from the circle the
region which consists of the largest difference between all pairs of our angle values. This circular
21

median is then used in the above moving window filter, which we call, the circular median filter.
The second post-processing step acts to sharpen the difference in compass readings at the
routes turns. This is for the sake of other algorithms which are used in other parts of our code-
base, where we wish to be able to detect turns in the recorded route relatively fast. This is
impossible if every time we wish to find all the turns in a routes graph, we were forced to use
sophisticated turn detection logic which would try to locate all gradual changes in orientation
and interpret them as turns of the right direction. Thus, our post-processing, using a moving
window like the circular median filter above, finds all the turns and sharpens or moves further
apart the orientations of the compass readings at each turn. One can say that this step removes
compass noise caused by turning. This is achieved by finding the difference in degrees between
consecutive compass readings and summing a moving window over these differences. One expects
such a sum to be close to 0, if the differences in consecutive compass readings are due to noise.
Otherwise, if the sum of differences is over a threshold, e.g. 60 degrees, a turn should be detected.
The peaks amongst the resulting sums of the windows of differences, therefore, are the turns. So,
the remaining compass readings in the window of readings where the peak has been detected are
moved further apart by adding or subtracting a value proportional to the amount of the actual
turn.
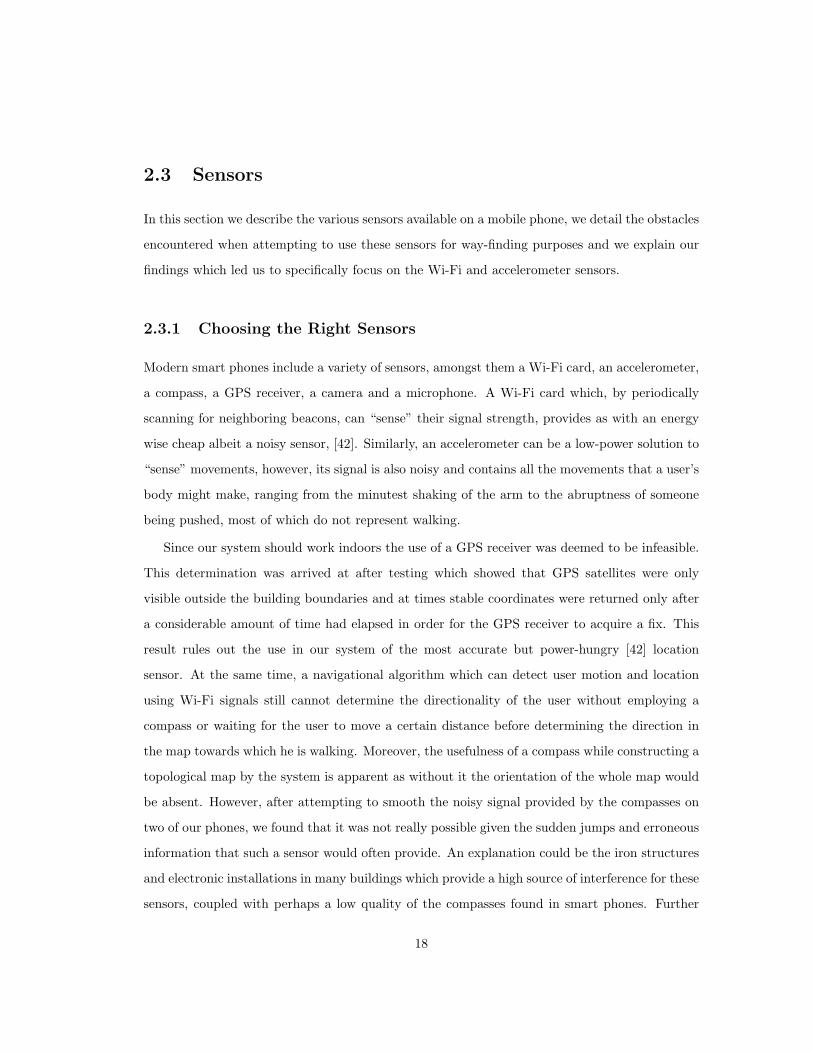
However, as is clearly visible in the following graph 2.1, the user’s orientation returned by
our compass has retained many of its Deviations from the expected orientation, even after being
filtered through the above algorithm.
2.3.4 Attempting to Employ GPS
In [11], opportunistic GPS at the boundaries of a building has been successfully employed to
provide the grounding physical coordinates to a mathematical model of Wi-Fi signal propagation,
which could in turn compute the physical coordinates of the user. However, the Android phones
that we tested regularly did not yield any GPS readings within our indoor settings as we observed
the GPS signal only sparingly within building boundaries. Using other phones such as a Windows
phone 7, while we were able to localize to within a building, different readings within the building
yielded overlapping results; the northern portion of the building mapped to the southern portion
22
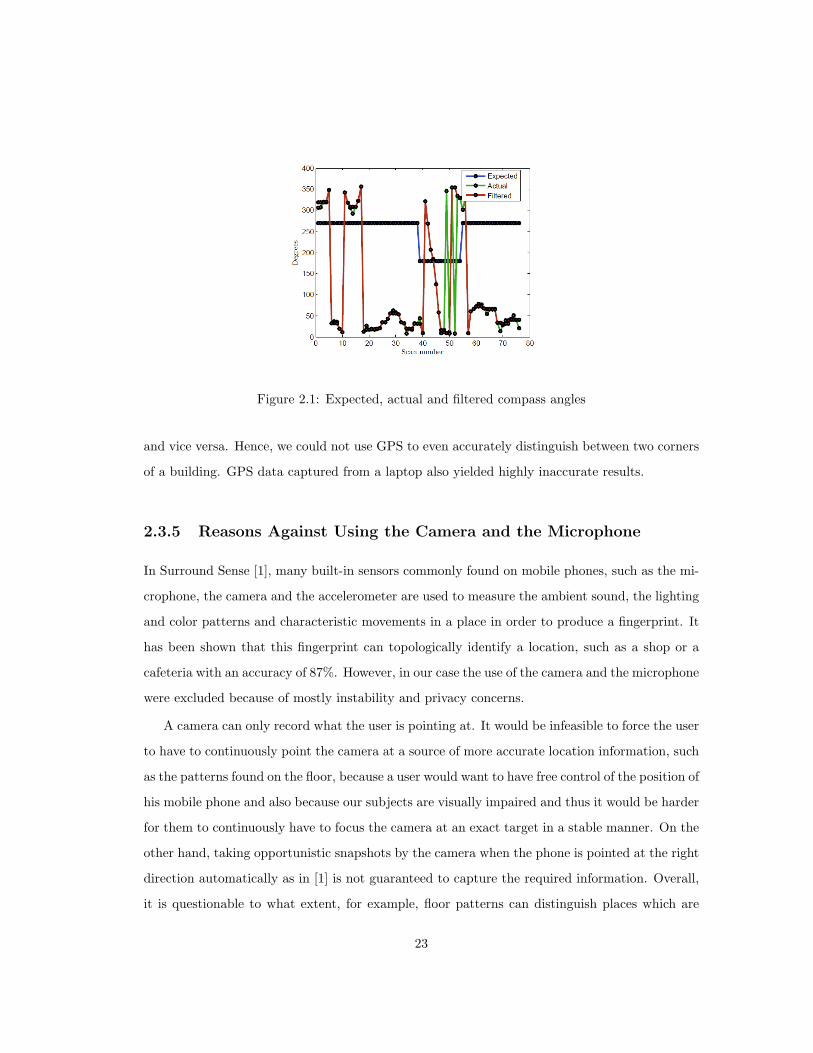
Figure 2.1: Expected, actual and filtered compass angles
and vice versa. Hence, we could not use GPS to even accurately distinguish between two corners
of a building. GPS data captured from a laptop also yielded highly inaccurate results.
2.3.5 Reasons Against Using the Camera and the Microphone
In Surround Sense [1], many built-in sensors commonly found on mobile phones, such as the mi-
crophone, the camera and the accelerometer are used to measure the ambient sound, the lighting
and color patterns and characteristic movements in a place in order to produce a fingerprint. It
has been shown that this fingerprint can topologically identify a location, such as a shop or a
cafeteria with an accuracy of 87%. However, in our case the use of the camera and the microphone
were excluded because of mostly instability and privacy concerns.
A camera can only record what the user is pointing at. It would be infeasible to force the user
to have to continuously point the camera at a source of more accurate location information, such
as the patterns found on the floor, because a user would want to have free control of the position of
his mobile phone and also because our subjects are visually impaired and thus it would be harder
for them to continuously have to focus the camera at an exact target in a stable manner. On the
other hand, taking opportunistic snapshots by the camera when the phone is pointed at the right
direction automatically as in [1] is not guaranteed to capture the required information. Overall,
it is questionable to what extent, for example, floor patterns can distinguish places which are
23

anyway located on the same floor as in our problem. In the same vein, microphone data cannot
be stable enough to delineate between locations on the same floor to the same fine-grain extend
as Wi-Fi, especially when taking into consideration that sound conditions in many places, e.g.
classrooms, may change depending on the time-of-day and the current function performed in that
vicinity, e.g. if a lesson is currently taking place. Finally, capturing camera and microphone data
is a sensitive issue with privacy implications, which cannot be alleviated by simply algorithmic
means, as even the possibility of such a violation might discourage potential users regardless of
any algorithmically designed assurances to the contrary.
2.4 System Design
In this section, we describe how our navigational system builds a topological map of an indoor
route using Wi-Fi and accelerometer measurements. We begin by detailing how to compare the
Wi-Fi scans in a spatially meaningful manner and how to use the accelerometer sensor readings
for counting the number of steps walked, before we outline our map construction algorithm.
2.4.1 Choosing a Wi-Fi Similarity Measure
Determining an approximation of the physical distance between two Wi-Fi scans is essential for
building a navigational system. We tested a number of Wi-Fi similarity functions, two of which
are shown in figure 2.2. Our functions represent the two Input Wi-Fi scans which are to be
compared as two sparse vectors. Each vector maps every MAC-address visible at any one of the
two scans to its corresponding Received Signal Strength Indicator (RSSI) value at the specific
scan. Since most MAC-addresses are not visible at any given location, we assign to them an RSSI
value of 0, a fact which accounts for the vectors’ sparseness. Using the change in the visibility
of Wi-Fi beacons and the change in RSSIs at each scan as the measure of differentiation, the
similarity functions compute their costs as follows:
1. Dice Coefficient: Given two Wi-Fi scans,
finds the number of measurements coming from the same source (having the same Mac-
address) and divides two times this value by the total number of RSSIs from both scans.
24

Tanimoto(x, y) =x · y
||x||2 + ||y||2 − x · y
RBFσ(x, y) = exp(−||x− y||2
σ2
)
Figure 2.2: Similarity function definitions
2. Cosine Similarity Measure: Given two Wi-Fi scans, finds the RSSIs which do not come
from the same source, finds their dot-product and divides by their norms.
3. Tanimoto Similarity Measure: Finds the RSSIs which come from the same source,
calculates their dot-product and divides by the norms of the two vectors squared minus the
dot product.
4. Radial Basis Similarity Measure (RBF): Given two collections of Wi-Fi measure-
ments, finds the RSSIDs which come from the same source and creates a normal distribu-
tion with mean equals the average of the squared element-wise differences between the RSSI
values, times by their mean, and a width (variance) parameter determined experimentally
to be 50.
The last two measures have proven the most capable in separating signal vectors from different
locations apart as it can be seen in the following graph 2.3:
The graph 2.3 plots for both the RBF and the Tanimoto similarity measures, the average
similarity between scans of 22 paths which are at the specified distance apart. We can see that,
as the distance between the two scans is increased, the RBF similarity measure decays much more
rapidly than the Tanimoto measure which does not react quickly enough to distance changes.
This makes the RBF measure more reliable, even for scans which are only a small distance apart.
2.4.2 Counting the User’s Steps Using the Accelerometer
In order to improve our navigational algorithm, it was necessary to furnish it with information on
the user’s movements. For example, the algorithm needs to be aware when the user is stationary
and when the user is walking, and, be able to have at minimum some kind of notion of walking
speed. Given that modern smart-phones come equipped with 3-axes accelerometers, it was
25

Figure 2.3: Spatial specificity of RBF and Tanimoto similarity measures
decided that a step-counter could be build employing these sensors which would fulfill the above
needs.
Accelerometer readings, however, can fluctuate rapidly, regardless of the phone’s model or
manufacturer. A mobile user can potentially point the phone in any direction while on the move,
making it difficult to compute the vertical axis of acceleration which could be used to count the
number of steps that the user has walked. Simple actions such as rotating a phone can cause
significant variations in the accelerometer readings across the three axes of measurements. In this
section, we show how we can clean accelerometer measurements to provide a reasonable measure
of the distance traversed by the user.
Our goals for the pedometer were that it should be relatively accurate, work on-line, do
not consume excessive processor time or power slowing down the remaining of the navigational
algorithm, do not require foot-mounted equipment or extra devices and not require a training
phase. Accelerometer signals, especially those produced in a mobile phone, are usually noisy and
sometimes unreliable. They are also not expected to provide data at a very high rate, more than
perhaps 20 readings per second. Our algorithm, therefore, should operate with noisy input and
be able to detect steps even with a small number of such inputs.
Unfortunately, algorithms found in previous work could not be used as is because they were
26

not designed with our specific goals in mine. The pedometer described in [93] requires a foot-
mounted device to be present, for example, whereas the pedometer in our study should work in a
mobile phone which might be placed at any position on the body. Since our pedometer needs to
work on-line, the algorithm described in [49] where a fast Furrier Transform is used to discover
the periodicity of steps in accelerometer signals could not be used due to the expensive processing
requirements of FFT. Due to the different modes and styles of walking amongst various activities
and individuals, a set threshold in accelerometer magnitude for detecting steps [57] could not be
used, even if such a threshold has been found experimentally. Finally, the on-line nature of our
algorithm precluded the use of any techniques with a training phase when determining any step
detection thresholds, such as the one described in [31].
Instead, our pedometer algorithm works as follows:
1. An array of accelerometer measurements is continuously filled-up from the phone’s ac-
celerometer sensors. The size of the array is currently kept at 70. Once the array has been
completely filled-up,, a snapshot is taken and it is examined to find and count the number
of steps taken on a separate thread. At the same time, the original array is emptied and
the process of filling-up the array is repeated in parallel.
2. The three axes of the accelerometer readings are smoothed independently by applying an
exponential convolution by multiplying the whole of the readings array with a moving win-
dow of length five, containing coefficients giving exponentially lower weight to neighboring
readings.
3. To find which of the three axes is the perpendicular one and thus the one containing step
information, the variance of the three axes is computed independently and the axis having
the largest variance is kept whilst the remaining data is discarded.
4. The derivative of the chosen axes is calculated and the readings of that axis are multiplied
by this derivative to produce an array of magnified readings in order to smooth out noise.
5. The tenth and ninetieth percentiles of the magnified readings are computed, as it was
discovered experimentally that peaks lie above and below these values respectively.
27

6. Both positive and negative peaks in the magnified readings are detected and counted. A
peak is a reading which is above the high percentile value calculated above and below
the low percentile value. Also, a peak has to be 0.65 times higher or lower than all its
neighboring readings in the intervals down to and up to the previous and next peaks. In
addition, peaks have to occur within at least a distance of ten readings from one another.
7. All sequential distances between each positive and between each negative peak are com-
puted. The variance of these distances between the positive peaks is compared to the
variance of the distances between the negative peaks. The peaks which have the smaller
variance are the ones deemed to contain step information, since a lower variance of the
distances signifies a more periodic signal. The number of those peaks is equivalent to the
number of steps taken.
The above pedometer algorithm is designed so as to meet our previously stated goals of
accuracy and efficiency. For example, the size of the array of recorded accelerometer readings
is large enough to ensure a quite accurate step count, but it is small enough to enable on-line
computation of the peaks without large delays between each pedometer update. The size is also
kept at a value which should not affect performance when performing array operations on the
readings array. The exponential convolution ensures that the signal is filtered so that outliers
and noise are removed as far as possible. It is also a very simple and fast operation to perform.
Meanwhile, rather than a more complicated approach using a computationally expensive method
of principle component analysis, finding the axis with the largest variance is very fast and can
thus be performed in real-time. This procedure provides an easy way to determine the axis of
acceleration with the greatest movement and so isolate the axis in which step information is
most likely to be present. In addition, multiplying with the derivative weakens the low-frequency
components whilst magnifying the high-frequency components from the large slopes, most of
which should represent actual steps. This removes more noise in the input signal. Similarly, by
calculating and using percentiles as cut-off values for finding peaks, our algorithm does not rely
on a pre-determined cut-off value and can thus adapt more easily to different walking styles by
relying on the actual data to guide its decisions. As a result, a training phase is not needed.
By ensuring that peaks are a specific distance apart, which in our case translates to around 0.5
28

Figure 2.4: Steps counted on the accelerometer signal
seconds, the peak detection algorithm avoids over-counting steps thereby avoiding more of the
problems of a very noisy signal. The fact that peaks have to be by a certain factor above or below
all their neighbors also tackles more of the noise issue by eliminating local peaks. Rather than
squaring or taking the absolute value of the readings, our approach of looking at the positive and
negative peaks separately and choosing which one is authoritative regarding the number of steps
taken, does not suffer from the fact that positive peaks mixed with negative peaks may actually
over-count the number of steps as some of the peaks may be counted twice, both as positive and
as negative peaks. In our observations, we have seen that usually peaks of one of the signs are
informative, whilst the peaks of the opposite sign are usually too sparse and noisy. Choosing the
right sign, therefore, removes such noisy input.
From the above graph 2.4 we can see that the pedometer algorithm ignores sudden or spurious
jumps in the accelerometer signal but is quite accurate when counting the actual steps walked
by a test subject.
29

2.4.3 Map Construction
According to [19], “humans do not appear to derive accurate cognitive maps from path integration
to guide navigation but, instead, depend on landmarks when they are available”. In other words,
humans do not take into account Euclidian distance or angles when navigating but the previously
encountered landmarks. Our map construction should therefore enable the user to easily mark
places that he finds of interest, in addition to the route’s turns. For them to be effective, such
annotations should only cover a region of space large enough to accommodate a sufficient location
context so that the user could identify it, but not too large so that it would encompass multiple
semantically disparate places.
Our novelty is that Wi-Fi and accelerometer data from previously visited locations are laid
out in a topological map and not, as traditionally done, in a Cartesian grid. This means that a
single path is broken up into a number of segments called nodes, each one housing a collection
of Wi-Fi scans representing a particular contiguous region of space. The approximate length of
each node is also measured using the number of steps walked at that particular region of space
as estimated by the accelerometer data. This approach, frees our localization module from the
burden of requiring extensive floor maps, which are in any case difficult to come by. Training
and labeling of the topological map can be carried out directly by the user, by simply taking note
and thus labeling turns and landmarks while traversing a route for the first time. Employing a
topological map makes its nodes more amenable to labeling as described above, but also provides
us with an interesting experimental query: Can we achieve higher accuracy of navigation on a
more course-grained representation of space than the traditional way of using a thickly covered
grid?
While navigating an already recorded path, the user’s approximate location could be deter-
mined by comparing the sensory data present on the previously constructed topological map with
the current sensory input. In this approach, the grouping of scans into nodes can improve local-
izational accuracy. This is because given a single scan representing the user’s current location, it
is more accurate to identify the similarity, and thus the physical proximity, of this scan to a group
of other scans representing a region of space, i.e. a node on a topological map, than to unrelated
pairs of other single scans scattered around the space. Given the high level usage scenario of the
30

system, using a single scan for tracking and navigation is essential as Wi-Fi scan probes take
around 0.7 or more seconds on all of our test phones. Waiting instead to get a window of scans,
would slow down tracking considerably making way-finding less safe and effective.
Segmentation Algorithm
As summarized previously, in order to train the system, the user walks a path and along the way
marks all turns and records labels for any landmarks, such as “Door to the Cafeteria”. During
this phase, the system scans for Wi-Fi networks logging their mac-addresses and signal strengths,
every around 0.7 seconds which was the fastest rate achievable on our mobile devices. At the
same time, it counts the number of steps being walked. After the path has been travelled, the
segmentation algorithm splits the Wi-Fi scans into sequential collections of map nodes using the
step count information as a parameter. Edges are created in the map between nodes labeled with
turn indicators based on the turns that the user has marked along the path.
For the segmentation algorithm to be effective it should work fast and should not struggle
to scale, as the number of Wi-Fi scans is dramatically increased. This is because a path can
be from tens of scans in length to hundreds, and splitting them into map nodes should at most
take a cubic time in the number of scans so that it does not discourage potential users of the
algorithm. Our solution meets this challenge by using a dynamic programming approach which
tries to minimize a cost function over all the set of possible sequential scan splits. More formally,
given an existing sequential split of scans into nodes up to scan i, it attempts to find the next
split which will minimize the node creation cost function of node i + 1 to j, where j can be from
i + minNodeLength to i + maxNodeLength. This meets the cubic complexity requirement of
our goals. Defining a cost function over a sequential split of scans can be done easily by observing
that:
1. Scans within a node should have a high mutual similarity (intra-node similarity) but should
exhibit a relatively low similarity with the scans of neighboring nodes (inter-node similar-
ity). Finding sequential groupings of scans which improve intra-node similarity whilst
decreasing inter-node similarity should, therefore, be preferred.
2. A node with turns amongst its scans should be less desirable than a node with no or less
31

turns inside it.
3. Nodes above a certain length (cut-off value) should be less preferred as their length in-
creases. This is to penalize longer nodes, whilst the cut-off value exists to prevent very
small nodes of getting a lower penalty. The pedometer measurements taken during train-
ing could be used as the measure of the length of each node.
4. Nodes containing scans with a higher variance in their similarities should be discouraged,
whilst nodes containing scans with a smaller variance should be preferred.
To find the similarity amongst the scans of one node or between the collections of scans of
neighboring nodes, the previously developed Radial Basis Similarity Measure can be used, by
taking the average similarity of all pairs between the scans of the single node or of each pair of
scans coming from each of the two neighboring nodes. The exponential function can be used
to make the scale of the five above costs (intra-node, inter-node, turn, length and variance), be
comparable. To further calibrate the algorithm we could also use a cut-off value below which the
diminishing effects of the intra-node similarity on the magnitude of the cost are not considered.
The sum of the above five costs can be weighed and thus empirically tested to find a cost function
which with attain the right balance amongst them.
Our evaluation criterion is the fact that Wi-Fi readings taken while standing stationary should
be grouped into a single node, whilst scans taken along a path should be split into nodes which
cover the space in an evenly manner and which do not encompass turns inside them. In other
words, we should show that maps are stable and only have a single node in them when the
user is not moving. They should contain multiple relatively small but not minute nodes when
representing a long path with separate nodes at each side of every turn.
Sensitivity analysis of the above cost weight parameters shows that the intra-node similar-
ity and the turn cost are the most important in creating a map meeting the above evaluation
conditions. In addition, it was determined that both the intra-node similarity and the turn cost
should be weighed equally and thus were assigned the same weight of 1.0. Finally, the cut-off
value of the intra-node similarity was empirically set to 0.7.
32

2.4.4 Navigation
Provided that the user has traversed the same path once in the past, our navigational system
should determine a user’s location, find the best path to a destination, and give meaningful
instructions along that path. While attempting to navigate an already constructed map, the
system must track its belief about the users current location on that map. We utilize the Bayesian
filtering framework, well described by Fox et. al. [21], to integrate our estimate of the signal
distribution at each location with a model of how much the signal distribution changes as a
person walks for a particular number of steps.
Bayesian Filtering
Different sensors provide different inputs and different resolutions. They can never be completely
exact and might be noisy. So, a mathematical technique has to be used to deal with the issues
arising out of these complexities. In our case, this technique has to also be probabilistic, given the
complex propagation characteristics of the Wi-Fi signals which cannot be modeled accurately. A
Bayesian Filter can provide a statistical view of location tolerant to noise.
Formally, we observe a sequence of Wi-Fi scans s(1), s(2), . . . , s(t) and maintain a time-varying
belief vector Bel(x(t)) which is the probability of the state x(t) conditioned on all sensor data
available at time t. Bel(x(t) = i) designates our belief that the user is at map node i after we
have received a signal vector s(t). This Bayesian filtering framework includes two components:
the perceptual model and the system dynamics.
1. The perceptual model encodes the probability of obtaining sensor input s given being at
node location i. In our case it represents the signal distribution at each map node and
describes the likelihood of making the observation s given that we “believe” that we are at
x(t). We implement this model by normalizing the distribution of similarities between all
the nodes in the map and the current scan observation, similarities which are computed
using the RBF similarity function, to create a distribution over nodes.
2. The transition probabilities, or system dynamics, encodes the change in the belief over time
in the absence of sensor data. In our case, it captures the spatial connectivity of map nodes
33

and how the system’s state changes as the user walks. Nodes which are closer in the map
have higher probabilities of transitioning from one to the other and nodes which are far
away have lower probabilities. These distances are embedded in the node information as
captured by the pedometer while training.
Localization tracking happens iteratively as signal vectors are received and used to refine
the systems belief vector. Transition probabilities should reflect or at least be comparable to
the probabilities of reaching node j from node i within one step. However, when the user has
not changed nodes, i.e. when still walking within the bounds of a single node, the probability
of staying within that node should be smaller for shorter nodes and larger for longer nodes. In
other words, the transition probability between two nodes should be inversely proportional to the
distance between them, whilst the probability of transitioning between a node and itself should
be proportional to the node’s length. To calculate transition probabilities the following reasoning
is followed:
1. We first observe that since paths are essentially a chain of nodes, there are two ways of
leaving a certain node once the user has entered it:, i.e., by walking forward or by walking
backwards to the two nodes adjacent to it. If the node is divided into s steps, then there
are 2 ∗ s choices of movements that a user can take within one step. Only two of these will
lead the user out of the node.
2. The probability of staying at a node is defined as nodeLength−1 / nodeLen, where nodeLength
is the number of steps in that node.
3. The probability of leaving a node should then be defined as 1− theprobabilityofstaying.
4. Given a path of nodes i1, i2, . . . , in, to reach node in from node i1, one should leave nodes
i1 to i(n − 1) and stay at node in. So, the probability of reaching node in from i1 should
be the product of the probabilities of leaving nodes i1 to i(n−1), times the probability of
staying at node in.
Calculating the next belief involves simply multiplying the transition probabilities with the
previous belief in order to account for the effect of user movement. Then, and having received
34

Room No. 312 311 310 309 308 307 306 305 304 303 302 301 Destination
Node 1 2 1 3 5 4 6 7 9 10 14 13 16
Table 2.3: Node numbers adjacent to rooms in a long corridor
Room No. 312 311 310 309 308 307 306 305 304 303 302 301 Destination
Node 1 2 2 2 5 7 7 10 12 14 14 13 16
Table 2.4: Node numbers after using current nodes buffer in same corridor
a new Wi-Fi scan from the environment, this result is multiplied with the probabilities of the
conceptual model, i.e. with the probabilities of being at each node given the new scan. This final
result is the new belief.
The Stabilizing Effects of a Current Nodes’ Buffer
A fundamental deciding factor when employing a Bayesian Filter is the requirement to handle
noisy and unstable sensory inputs. However, in our experiments we have observed that despite
this precaution, the estimate of the current node is at times unstable, jumping from one map
node to another, even jumping among nodes that are not close together in space as is visible in
the following table 2.3:
To prevent jitter in the estimate, we propose the use of a current nodes’ buffer of size three.
When a new location is determined it is added to the buffer, displacing the older entry. When
the system is requested to find the user’s current location, it does not simply return the current
estimate, but the estimate having the majority in the current nodes’ buffer. If no estimate is
repeated more than once and thus there is no majority, the previous estimate is returned until a
majority is attained. This has a smoothing effect on the returned estimates, whilst eliminating
erroneous estimates due to noise. The following table shows the majority node in the current
nodes’ buffer along the same path shown above, indicating that most of the erroneous estimates
were avoided 2.4:
35

Improving Wi-Fi Navigation Using Motion Estimation
While providing navigational instructions, it may be beneficial to combine the feedback from the
surrounding Wi-Fi signals together with the current step count provided from the accelerometer,
in order to create a more stable and accurate navigational algorithm. As discussed above the
two components of a topological Bayesian Filter are the sensory input, in our case provided by
the Wi-Fi signals, and the transition probabilities, in our case calculated by the relative lengths
of each node. However, it cannot be assumed that these probabilities remain stable as the user
walks, since movement towards a specific direction should make the departure from a certain
node and the arrival at another one more certain than the probability of being at any other
node.
To incorporate pedometer input in the transition probabilities, we simply raise the transition
matrix to the power of the number of steps taken between our previous and the current estimate.
This is because each transition probability is calculated in such a way to represent the likelihood
of making the given transition if the user takes one step. To incorporate a notion of walking in
the transition probabilities we do the following:
1. We determine the possible movements made by the user. We do this by keeping a history
of the previous probabilities of being at each node and comparing them with the current
ones. We do this for all pairs of nodes. If the probability of being at node i has decreased
and the probability of being at node j has increased between the previous and the current
probabilities, we could assume that the user might have moved from node i to j. Similarly,
if the opposite has happened and the probability of being at node i has increased whilst the
probability at node j has decreased, then we say that it is not likely that the user would
have moved from node i to node j.
2. Given the above findings, we compute the geometric mean between the previous probability
at node i and the current probability at node j. We do this in order to prevent noise
drastically influencing our results.
3. We then multiply the current transition probability from node i to node j with the calcu-
lated geometric mean, if we had found in step one that it is likely that the user has moved
36

from node i to node j. Alternatively, if it is more likely that the user has not moved from
node i to j, we multiply by 1− thegeometricmean calculated in step two.
Generating Navigational Instructions by Using a Step Horizon
Taking the majority location from the Current Nodes’ Buffer, the system calculates the shortest
path to the destination. The system then gives the user appropriate instructions to walk toward
map nodes further down the shortest path. Navigational instructions are derived using the length
and directionality of map edges.
Certainly, instructing a user to turn after the actual turn, even if the instruction comes
very close to the actual correct position is certainly a serious bug in the navigational algorithm.
However, even if the instruction to turn or the acknowledgement that the user has arrived at his
destination comes at the exact position where the turn or where the destination is to be found,
this also does not make for a good user experience. A user needs to know beforehand that a
turn is coming up so that he will plan ahead, especially when the user is visually impaired. This
heads-up should come accompanied with an estimate of the number of steps required to reach
the announced turn, landmark or destination.
In our system, this is achieved by means of a step horizon. The navigational algorithm, when
deciding which instruction to issue, uses the current direction of motion of the user to predict
along the path to the destination, if there is a turn or another important point of reference
after a certain number of steps ahead, currently twelve. If a turn is detected on the path to the
destination which falls within at most the above number of steps, it is pre-announced together
with the number of steps required to reach it. The same for a reference point, such as the
destination.
2.5 Usability and the User Interface
The interface of the navigational system provides the user with the option to either record a new
route or to be guided toward a previously recorded destination. If the user wishes to construct
a new route, they must merely walk toward some destination while the device passively samples
wireless signal strengths and counts the user’s steps along the way. Explicit user input is, however,
37

(a) (b) (c)
Figure 2.5: System interface: (a) Initial menu (b) Recording a path (c) Selecting a route
required at any turns along the path and for annotating landmarks.
Figure 2.5 shows the main menu of the application and the most important functions are
“Record new path” and “Navigate to”. When navigating the application’s menu, the user uses
a simple screen reader to read the menu and choose the appropriate option. We use a screen
reader only in situations where the user is stationary. We do not use the screen reader when the
user is in motion, such as while recording new paths or navigating to a destination.
In [38], most visually impaired users expressed their frustration and anxiety when using
a touch-based phone since they could accidentally invoke a command unintentionally. In our
system, we prevent this by placing a transparent input overlay covering the entire application
surface, which filters the user’s touch inputs allowing only scrolling and turn instruction gestures.
Next, we discuss the user interface for recording new paths and navigating to a prerecorded
destination.
2.5.1 Recording a New Path
Upon choosing to capture a new path, the application asks for the path’s name which is the user-
identifiable label for the path. While the user is walking along a new path, the mobile device
records the relevant sensory information. A key feature of the UI presented when recording a
new path is to allow the user to explicitly mark turns on the path.
38

2.5.2 Signifying Turns by Using Rotation
A navigational system must interact with the user in a modality suitable for that user’s needs.
One important restriction when designing an interface for the visually impaired is that the con-
tinuous use of a screen reader is undesirable due to the already important role of the sense of
hearing in obstacle avoidance. Secondly, the availability of advanced sensors, such as accelerom-
eters, only on the most expensive mobile phones together with the fact that almost all of these
phones are touch input based, limits our choices of input methods.
As shown in Section 2.3, the compass was insufficient to accurately capture turns in a path.
Originally, our interface used a novel idea of indicating turns which involved flipping the phone
90 degrees to the left or to the right. If the user wished to indicate a left turn, he would
rotate the phone 90 degrees to the left and conversely if he wished to turn to the right. These
motion gestures were used both when recording a new route and during navigating a recorded
route. In this way the user did not have to interact at all with the phone’s touch screen. However,
during our experimentations and as demonstrated in section 2.3, we subsequently determined that
Wi-Fi signals fluctuate substantially, even when simply turning the phone at a single location.
Consequently, we decided to abandon this input mode of rotation gestures and develop a solution
that makes good use of the phone’s already available touch screen.
2.5.3 Indicating Turns by Using Swipes
In our subsequent iteration of the user interface we employ the phones touch screen as a mecha-
nism for indicating turns. If the user wishes to turn left, they simply swipe left along the screen,
after which the phone vibrates to signal its acknowledgement of the turn and optionally issues a
text-to-speech output. For turning right, the user swipes right along the width of the screen and
a similar but distinct vibration is issued together with optionally a speech output. These swipes
have a quite natural character, are easy to perform and very hard to the phone to misinterpret
since they are horizontal and cannot take the place of any swipes that could be misunderstood
as indicating scrolling. To further prevent accidental swipes, the phone is programmed to accept
only swipes which are above a certain threshold in length. The speed of a swipe could also be
used to filter erroneous gestures, however, in our initial testing this was not found to be neces-
39

sary. During recording or navigating a route the phone’s touch screen is also kept blank of any
other interactive touch controls and only displays informative text for the benefit of the sighted
assistant if required. Other interactions are carried out using the phone’s standard application
menu which can easily be accessed via a special button at the bottom of the screen.
The source location, the final destination, and any landmarks along the way are all optionally
labeled using speech recognition. The speech recognition engine is provided by the phone’s
operating system and we use it here without any modifications.
2.5.4 Navigation
When using the system to navigate towards a known location, the user must select a desired
destination from the systems database of recorded paths. It is acceptable here to temporarily
make use of the screen reader, since the user will not be walking a route that he has not even
started. The system then infers the users most likely location along the recorded path and issues
walking commands such as Go straight for 20 steps, Turn left after 5 steps, etc.
Again, since it is preferable to not use the screen reader while walking we also have devised a
small set of vibratory commands which are easy to learn. For example, one long vibration signals
that the user should continue walking straight, whereas three short vibrations indicate that the
user has arrived at their destination.
2.6 Evaluating Navigational Quality
In this section we evaluate the navigational accuracy of our system. First we determine how our
topological-based Wi-Fi localizer compares to traditional Wi-Fi localization approaches. Then,
we perform a case study with the help of a totally blind individual who was asked to walk
a number of paths on different indoor locations while we were observing the accuracy of the
system’s instructions. This study with only a single blind individual was undertaken so that
we could examine our system’s practical performance, including carefully analyzing its accuracy
and its usability, in the greatest depth possible. We also wished to do this before embarking on
a larger study so that we could flesh out any technical issues still remaining. The next section
takes this effort to its ultimate conclusion by performing a much larger user study with many
40

more visually impaired participants in order to gain multiple insides from a more diverse subject
group.
2.6.1 Evaluating Localizational Accuracy on Straight Paths
Localizational accuracy is how much the user’s physical location, as reported by the navigational
system, deviates from his true location at that moment. Calculating localization accuracy is
informative as it enables us to compare our system’s performance to that of traditional Wi-
Fi localization algorithms found in previous work. Since our navigational system does not use
physical locations, accuracy has to be determined based on our map’s topological nodes. On the
one hand, determining the localizational accuracy of our navigational system depends on how
well our map construction algorithm 2.4.3 breaks-up physical space into topological nodes which
are representative of the building’s physical characteristics. On the other hand, during navigation
it depends on how accurately and quickly are incoming Wi-Fi scan probes are matched to the
corresponding topological node to which they are physically closest. So, to calculate localizational
accuracy, we can compare the user’s current node as reported by the system while navigating a
path, with the actual node that the user is currently in. To determine the actual node that a
user is currently in, we can use pre-determined points in physical space which are situated within
each node and use these points to find out where on our map the user should currently be.
In our case, a rough estimate of where in physical space each node starts and ends is discovered
by laying out and marking on the floor a complete Cartesian grid. More specifically, we have
divided the third floor of our main departmental building into a grid consisting of six units in
the x-axis and ten units in the y-axis. Each x-axis unit is equal to nine feet and two inches and
each y-axis unit is ten feet. We have devised this uneven arrangement of grid cells so as to be
able to cover the whole floor in a practical manner, i.e. have grid lines correspond as much as
possible with walls or centers of corridors.
While recording a new path, we walk on our path normally until reaching the point on the
floor at which we have covered exactly 1 axis unit, either in the x or in the y direction. Then,
we note down the corresponding identifier of the Wi-Fi scan that is currently being recorded at
that location. Afterwards, when the map with the topological nodes has been constructed, we
41

determine which Wi-Fi scans each node contains and therefore we can discover roughly around
which region of physical space each node is situated. We can do this by interpolating from the
locations of the scans we had just noted down in order to find out the approximate locations of
all the scans on the recorded path.
When the user navigates the path for a second time, we use sticky tape to mark on the floor
where each node starts and where it ends and we then use a measuring tape to determine each
node’s actual length. In a similar manner as above, we record the node number the system
is currently reporting when crossing any of our grid lines. By assuming that each node as a
straight line of equidistant segments, each one corresponding to each of the node’s scans, we can
determine the approximate physical location of each Wi-Fi scan during navigating. In this way,
we compute to what extend the estimated location of each scan during path recording matches
with the estimated location of the same scan during navigating the same path.
Using the above methodology, we walked twelve paths on the third floor and recorded the
locations of scans at each grid line while the phone was recording Wi-Fi and accelerometer
data. We then walked the same paths disabling the pedometer and the transition model of our
navigational algorithm so that it would not positively affect in any way the results of the Wi-
Fi localizer. The localizational accuracy is determined by finding the mean Euclidian distance
between the approximate physical locations of each scan estimated while recording each path
and the location of the same scans estimated while navigating. The results are shown in the
following graphs 2.6 where green lines represent the expected physical distance of each scan from
the starting-point of its path, whilst blue lines represent the actual distance:
As can be seen from the above graph 2.6, our topological localizer achieved similar accuracy
to previous work, i.e. around a mean of 3.6 feet. Even though we depict only straight paths, we
nevertheless attempted to calculate the localizational accuracy of paths with more complicated
shapes too. However, it is difficult to determine the approximate location in space where a node’s
scan is situated, when a topological node is not a straight line but can span a wider region of
space. Inherently, our topological localizer works on a very different concept from traditional
localizers, making direct comparisons beyond the straight line case non-trivial and even unfair.
42

Path 1 Path 2
Path 3 Path 4
Figure 2.6: Expected vs. actual physical distance of each scan from start of path
43

2.6.2 Measuring Navigational Accuracy
Navigational accuracy encompasses the effectiveness of all aspects of the navigational algorithm
when guiding a user on a path. Not only the navigational instructions “straight, left, right, etc”
should be correct but they should come at the correct time, neither to early nor too late, and the
same with the pre-announcement of turns and the arrival to the destination. Thus, it is not easy
to come up with a uniform and objective measure of navigational accuracy given the subjectivity
involved when defining when the “correct time” is.
The best way to handle the above problem is to observe the system in its actual intended
usage, i.e. test the system by having a visually impaired individual try out the system by first
recording some paths with the assistance of a visual guide and then figuring out if the same
individual can navigate the recorded paths without going the wrong way or taking the wrong
turn. In our case, we decided to adopt this approach but make it stricter by also recording when
the announcement of a turn or the arrival to the destination did not come at the exact point
upon which the turn or the destination were reached.
We used an Android Nexus 1 phone for our experiments and the user was a totally blind
user who is 29 years old with prior experience using mobile devices and speech interfaces for the
blind. We tested our system across multiple floors in two separate buildings: A and B. We report
our results across 23 separate paths across four different floors in buildings A and B. The two
floors in building A had an identical layout while the two floors in building B had a very different
layout. We chose these 2 identical floors to be able to check whether our navigational system
was consistent and reliable in its navigational instructions if the Wi-Fi signals were to change
slightly. The lists of Wi-Fi networks across the two buildings are also significantly different.
Within the same building, the Wi-Fi networks also showed very different RSSI characteristics
across different floors. We specifically chose paths which the user did not have much familiarity.
The chosen paths ranged in complexity from the simple straight path, to paths with some turns
at the end, to paths with a U-shape or to those with multiple turns in both directions from one
side of the building to the other resembling an H-shape. Each path was traversed exactly once
and was retested at different times after the training phase (to eliminate time-biases).
Tables 2.5 and 2.6 show the accuracy of our navigation system measured across two metrics:
44

Correct -2ft. -3ft. -4ft. -5ft. -6ft. -7ft. -8ft. +2ft. Total Paths
22 2 3 3 3 1 1 3 1 39
Table 2.5: Accuracy of turn instructions
turn instructions and destination announcements. Here, again, the main take-away message is
that the accuracy of our navigation system is extremely high with median error rates less than
1− 2 feet in most cases. The user of the system also observed very few navigational inaccuracies
across all the paths. From table 2.5, we see that from the 39 “Turn left/right” instructions, 22
of them or around 56% were issued to the user upon arriving at the exact physical location of
the turn or upon waiting at that intersection for some seconds without taking the turn. A total
of eleven turn instructions (around 28%) were issued a little bit early, ranging from two feet in
advanced to five feet. This is a very short distance in length and also includes the distance of
around one to two feet required for the user’s body to enter the actual region of the intersection.
In addition, five turn instructions (around 13%) were given at an even earlier location from
the actual turn, as they were issued six to eight feet in advance of the intersection. However,
given that many turns were pre-announced by our system before the actual “Turn left/right”
instructions were given, the visually impaired user was expecting to find the turn in his route
anyway. This makes the occasional turn instruction which mistakenly comes even six to eight
feet in advance, not to be a problem in our experiments. Only one turn instruction was given
after having to walk into the turn, but even in this case, the error was negligible (2 − 3 feet)
that the user did not perceive it as an error. From table 2.6, we observe that on 18 out of the
23 paths or around 78% of them, the announcement of the destination took place at the correct
location. Only around two announcements took place 2 − 4 feet before the actual destination
in advance. In addition, two announcements were given 8 − 10 feet in advance of the actual
destination’s location. Finally, on one path, the destination was not announced at all but the
system correctly indicated that the destination would be arrived at in “1 step”. Together, these
results demonstrate the high navigational accuracy of our system with very minimal training.
When interacting with our user interface, the blind user did not encounter any difficulties. The
disabling of the phone’s touch gestures, except of the menu activation taps and of the scrolling
45

Correct -3ft. -4ft. -8ft. -10ft. +1ft. Total Paths
18 1 1 1 1 1 23
Table 2.6: Accuracy of destination announcements
and turn flick gestures, successfully prevented any accidental user touches to be interpreted as
a command to the application or to the Android OS. The flick gestures used to indicate turns
taken by the user were also totally accurate, as they were interpreted correctly on all 23 of our
paths and the user needed no training and experienced no delay when using them. Finally, the
application’s menus were easy to learn to use even with the admittedly simplistic built-in screen
reader.
Despite the high noise of the Wi-Fi signals and the difficulty of localization accuracy as
demonstrated in the high amount of training required in previous work, our system seems to be
highly accurate for navigational purposes. This is because only on two paths the announcement
of a turn or the arrival to the destination came after the fact, i.e. after taking the turn or
bypassing the destination. These are the only times when our visually impaired user might have
been lost in an unknown environment.
2.6.3 Observations
From the above results, the key algorithmic observation is that the weight placed on the tran-
sitional model of the Bayesian filter creates a trade-off between announcing instructions a bit
early, or having to wait a bit before the instruction is announced. In other words, we can make
the system too sensitive so that it will jump to nodes ahead faster or make it slower to adjust
and create some delays. In this test run of the system, it appears that the right balance was
achieved. However, in our second building there were no mistakes concerning having to wait for
some seconds at a turn or the destination and there were almost no turns announced in advance.
Whilst with the same system, in our first building, there were a few delays. So, an adjustment
to the system’s weight parameters might not be simple to perform as the parameters seem to be
based on the characteristics of the buildings Wi-Fi.
Detecting that the user has arrived at a turn or the destination is exclusively based on reaching
46

the node at the specific turn or the final node of the route respectively. This somewhat inflexible
approach can explain the fact that one of the arrivals to the destination was never announced,
since the final node in the map for that route seems to have never been entered. A reason for
this issue might be the relatively small length of the node in question, a fact which would make
the Wi-Fi signature of that node in the map weak. Future experimentations should perhaps lead
to an improved method of constructing maps in such a way to avoid any such problems.
2.7 Evaluating the System through a User Study
In this section, we summarize the design of our user study and give an overview of the demo-
graphic characteristics of our participants. Then, we list the users’ impressions of our system
and group them into pertinent categories based on which aspect of our navigational system they
are related to. We give special emphasis to the system’s strengths and weaknesses that the study
participants have also chosen to concentrate on. Finally, we analyze the responses given by our
study participants together with the observed system accuracy during the user study, to come
up with a main list of improvements that should be undertaken as part of future work.
2.7.1 Study Design and Evaluation Methodology
We recruited nine visually impaired participants from the New York City area to take part in
our user study to test our navigational system. Almost all of our participants were totally blind
and only one out of the nine was partially sighted. This was a desirable user sample as totally
blind individuals are the ones who would benefit the most from an indoor navigational system,
whilst at the same time we did not want to exclude the feedback of the partially sighted from
our study. There was variety in the sample concerning the time of onset of blindness, as a slight
majority of the study participants were congenitally blind whilst the rest had lost their sight
later in life. Our sample encompassed individuals of both younger and older ages, as well as both
people who had used a navigational aid before and others who had never used one. Three of
our participants were relatively young as their ages did not surpass the age of 30. Another three
were in their fifties, whilst we had two participants who had an age of 60 and above. Our user
sample included both novices as well as experts in the use of navigational systems, as five of the
47

Characteristic Yes No
Age < 50? 4 5
Totally blind? 8 1
Blind since birth? 5 4
Uses touch screen phone? 5 4
Used a navigational aid before? 4 5
Table 2.7: Demographics of the user participants
participants had never before employed such a system, whilst four of them were already familiar
with a GPS-based navigational system. In fact three out of the four had in the past tried or were
currently using outdoor GPS-based software solutions that were specifically manufactured for the
visually impaired. Since our system ran on a touch screen phone which requires a different mode
of user interaction than a traditional keypad phone, we enquired whether our users had ever used
such a device before. A slight minority of the people involved in our study had never used a
touch screen phone before, whilst the rest were familiar with such a mode of user interaction. A
summary of these characteristics of our participants are listed in the table below 2.7.
The software was tested on an Android-based phone. At the start of each session, each
participant was given an overview of the navigational system, including an explanation of the
software’s operation. If required, users were allowed to familiarize themselves with the touch
screen and to practice the particular swipes for marking turns. Each participant was asked to
walk a number of paths in the same building in order to record them. The aim of this training
phase was for the user to get a first feel of the route and for the turns to be marked in the
system using the touch gestures. For this, the interviewer would guide the user on the paths to
be recorded by either allowing the user to hold him by the arm, or by having the user follow him
in a safe distance, depending on the user’s preference. After the routes were recorded and the
topological map constructed by the software, each participant was requested to walk each path
alone, while being guided by the navigational system. The interviewer would stay beside the
user of following him/her at a safe distance, while observing the performance of the navigational
system. The user was expected to follow any directions that the system would provide to him/her
48

and the interviewer would only intervene if the user had veered sufficiently off course.
After all the paths had been walked, the impressions of each participant concerning the system
were recorded using a questionnaire containing both quantitative and qualitative questions. A
set of the quantitative questions tried to measure each user’s satisfaction with the accuracy, the
simplicity, the responsiveness and the safety of the system on a scale from 1 to 4, where 1 means
“Strongly disagree” and 4 means “Strongly agree”. Another set of similarly structured questions
enquired if the users had found the system to be easy to learn, a useful mobility aid and if they
were willing to use it on their own phone. On the other hand, the quantitative questions were
open-ended and prompted the users to respond with a few sentences concerning the parts of the
system they liked, disliked and list any additional features they wished to be added to it. At
the end of each session, the person conducting the interview would enter detailed notes on what
took place during each path walk, both during recording and when navigating. The interviewer
would also write down any important detail or fact that was observed during the user’s use of
the system and which the participant had omitted to mention as part of the responses given to
the open-ended questions.
The paths walked were almost the same for eight out of the nine users. These were four
paths on the third floor of our main departmental building. This simple experimental design
was preferred, as some participants felt more comfortable with the surroundings than others and
as we did not wish to burden any group of participants unnecessarily. Some users for example,
took longer to walk certain more complicated paths and most disliked having to switch floors.
Furthermore, we did not want to use different experimental designs for different groups of users,
due to the small size of our user sample.
All four paths included two turns each. Two of these paths were H-shaped and involved asking
the user to walk from one corner of the building to the diametrically opposite one, starting from
a classroom and arriving at an office at each respective corner. One path involved walking in a
U-shape along the same side of the building. The last path required the system starting from
one side of the building to direct the user to a specific office at the other side, three quarters of
the way down a corridor. The last path was designed to test the ability of the system to direct
a user to a specific door.
One of the participants was asked to walk the same four paths on the fourth floor of the same
49

building. This floor has an identical layout as the third floor. The experiment was undertaken in
order to compare the behavior of the system on two separate floors having possibly different Wi-
Fi topologies but an identical layout. Additionally, one other participant, after having walked the
four same paths on the third floor, was asked to move to the thirteenth floor for walking another
two paths, in order to test the system in a more open space. This is because the thirteenth floor
houses the department’s cafeteria, a trickier place to walk around, due to the place featuring a
large sitting area. One of the paths tested the system by guiding the study participant from the
elevator through the cafeteria to a classroom and by helping him find a particular chair. This
chair was not easy to find, as it was situated two rows before the back of the classroom and
towards the middle of that row of seats. Another path involved getting to the same classroom
chair through another route which avoided the cafeteria.
2.7.2 Study Results
This section summarizes the results of our user study. On the whole, they demonstrate a naviga-
tional system which features sufficient accuracy to be used on short routes with limited complexity
but which may behave inconsistently at times due to Wi-Fi fluctuations.
Walked Routes and Navigational Accuracy
For most users, the system gave correct instructions at the right locations. For the turns, sufficient
advanced warning was given and the instruction to turn was usually issued very close to the exact
location where the turn was located. The direction of the turn was usually reported correctly,
unless the user had swiped the wrong way when marking the turn during the training phase,
2.7.2. However, out of the four paths that most users had walked, there was usually at least
one turn or one arrival to the destination which was announced 5 − 6 steps off, or in a few
isolated cases as much as ten feet in advance. For example, once the system instructed one of
the participants to “Walk straight for 19 steps” and then turn right, whilst the turn was actually
after 21 steps. Another time the system told the same participant to walk seven steps and reach
the destination, whilst the destination was after five steps instead. For two of the participants,
the second turn on the one of the H-shaped paths was not announced unless the user had turn
50

a little towards the corridor at the start of which the turn was located. In the most egregious of
cases, the arrival to the destination on the U-shaped path was announced 17 to 20 feet before
the actual destination but the user was able to realize and correct the inaccuracy easily. When
trying to locate a specific office door, the system usually directed our participants to another
office which is right next to the office in question. However, these two office doors are right next
to one another with only a wall’s width in separation. Most users could realize this error using
their sense of touch. The reliability of the system suffered somewhat when we tried to make it
locate a particular chair at the back of a classroom on the thirteenth floor. Although a chair
close to the target one, i.e. one row in front and two chairs to the left was repeatedly identified
instead, the directions taking you to that particular chair were at times confused. For example,
while the user was in the classroom the system would decide along the way to the chair that
the user had arrived at their destination, to immediately change its mind to tell the user to
turn the correct way towards the row where the chair was located. On the other hand, the path
through the cafeteria did not pose any difficulties to the system. Overall, however, this handful
of inaccuracies concerned only a small part of the traversed routes. As can be deduced by the
ratings the participants gave our system, its general accuracy was sufficient for the tested routes,
a fact also reflected in the users’ comments and enthusiasm.
Questionnaire Responses
As depicted in the table 2.8, the individuals taking part in our user study rated our navigational
system on a scale of one to four, by responding to a set of short questions, such as: “Is the system
simple to operate?” For each question the table shows the number of users who chose each rating
1− 4, i.e. from “Strongly disagree” to “Strongly agree”. These questions could be grouped into
three categories. The first category, made up of the first two questions, attempts to measure
the accuracy of the navigational system when announcing turns and arrivals to the destination.
As can be seen in 2.8, the participants were overall relatively satisfied with the accuracy of the
navigational system, as for both questions there was only one user who rated the system with
a rating of two. However, whilst for the accuracy of the turns the users appeared to be divided
between “Agree” and “Strongly agree”, for the announcement of the destinations two thirds of
the participants showed a strong approval.
51

Is the system... Strongly Disagree Agree Strongly mean ± std
disagree agree
Accurate when 0 1 4 4 3.33 ± 0.71
announcing turns?
Accurate when 0 1 2 6 3.56 ± 0.73
announcing the destination?
Simple to operate? 0 0 3 6 3.67 ± 0.5
Fast and responsive? 0 1 2 6 3.56 ± 0.73
Easy to learn? 0 0 3 6 3.67 ± 0.5
Safe to walk alone using it? 0 1 2 6 3.56 ± 0.73
A useful navigational aid? 0 0 3 6 3.67 ± 0.5
Something you would 0 0 2 7 3.78 ± 0.44
use on your phone?
Table 2.8: User ratings of the navigational system
The second category included the next three questions which aim to evaluate the user interface
aspects of the navigational system. It can be observed that the great majority of the participants
were in strong agreement that the system was simple to operate and easy to learn, whilst the
responsiveness of the system received a slightly lower rating by only one participant. The final
category of three questions targeted the general picture that the participants had obtained from
the use of the system. From these questions, the first asked the users to express the level of
safety they felt when they were walking by following the system’s guidance. From the responses,
it can be seen that most users felt safe when relying on the system’s guidance, as eight out of the
nine participants chose a rating of three and above. The participants also found the system to
be a very useful navigational aid that would help them navigate more independently in indoor
environments, a fact that was partly supported by the very positive responses accompanying the
next question. The participants’ enthusiasm about the system was further demonstrated with
the final question which asked the users if they were willing to use the navigational system on
their own phone in the future, a question to which an even larger majority strongly ascended.
52

Discussion and Future Work
During this user study a set of nine participants were asked to walk mostly the same four paths
on the third floor of our building. This was to compare if the results were the same among
different users. We found that Wi-Fi interference makes repetitions of the same experiment give
somewhat different results. This difference is very small and it concerns the exact points on each
route where the directions are being issued. However, finding a particular door or a specific seat in
a classroom when it is your specific destination might be important in some navigation scenarios.
Even though our system would direct users to the correct destination by approximately a meter
of accuracy, this might not be enough if a neighboring door or seat is near enough as to make
the user accidentally knock on the wrong door or seat in somebody else’s chair. For example, on
the thirteenth floor of our building, the reliability of the system went somewhat down when we
tried to make it locate a particular chair at the back of a classroom.
Nevertheless, our users generally praised the idea of implementing such a type of navigational
aid, a system which they could see as necessary and useful in their own lives. They were enthu-
siastic about the whole project, a fact discernible from some of the responses provided to the
open-ended questions of our questionnaire. For example, three of our participants when asked
what they enjoyed most about the navigational system expressed their sentiments as follows:
“I think it is a great thing.” “I think it is an excellent idea.” “I liked everything, I think it
was great.” Others when so far as to suggest that our system could be a viable addition to the
existing GPS products which work only outdoors: “I love it. You have to commercialize it. So
many people will benefit from it.” “It is more accurate than the other GPS systems I am using
for outdoors.” Some users even described previous bad experiences they themselves had when
walking around unfamiliar buildings. One particular user said that he enjoyed going on cruises
relatively often, but the lack of a secure method of finding his way independently around the
ship made it difficult for him to have the best experience. A navigational system like ours, the
user suggested, would fulfill this need of independent mobility. This idea of the participant could
work, provided of course that Wi-Fi networks would be visible on board.
Concerning the users impressions from the actual usage of the system, Participants found
it capable and functional. They described it as relatively accurate when giving directions: “It
53
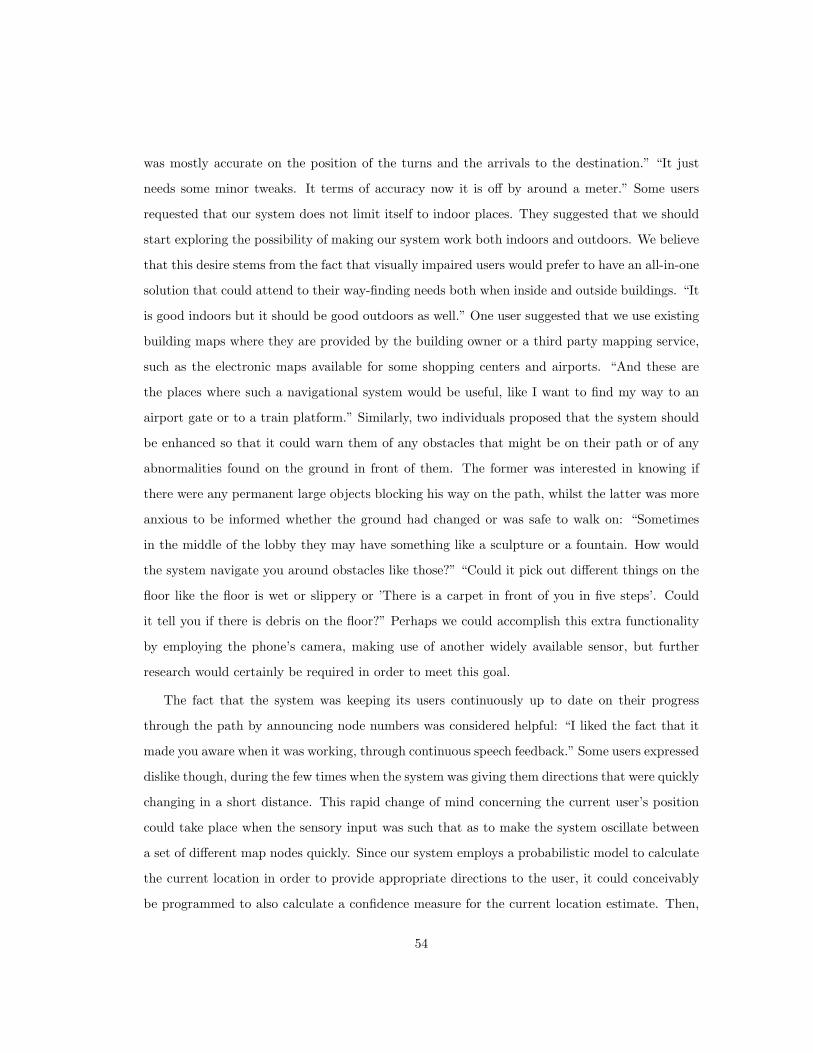
was mostly accurate on the position of the turns and the arrivals to the destination.” “It just
needs some minor tweaks. It terms of accuracy now it is off by around a meter.” Some users
requested that our system does not limit itself to indoor places. They suggested that we should
start exploring the possibility of making our system work both indoors and outdoors. We believe
that this desire stems from the fact that visually impaired users would prefer to have an all-in-one
solution that could attend to their way-finding needs both when inside and outside buildings. “It
is good indoors but it should be good outdoors as well.” One user suggested that we use existing
building maps where they are provided by the building owner or a third party mapping service,
such as the electronic maps available for some shopping centers and airports. “And these are
the places where such a navigational system would be useful, like I want to find my way to an
airport gate or to a train platform.” Similarly, two individuals proposed that the system should
be enhanced so that it could warn them of any obstacles that might be on their path or of any
abnormalities found on the ground in front of them. The former was interested in knowing if
there were any permanent large objects blocking his way on the path, whilst the latter was more
anxious to be informed whether the ground had changed or was safe to walk on: “Sometimes
in the middle of the lobby they may have something like a sculpture or a fountain. How would
the system navigate you around obstacles like those?” “Could it pick out different things on the
floor like the floor is wet or slippery or ’There is a carpet in front of you in five steps’. Could
it tell you if there is debris on the floor?” Perhaps we could accomplish this extra functionality
by employing the phone’s camera, making use of another widely available sensor, but further
research would certainly be required in order to meet this goal.
The fact that the system was keeping its users continuously up to date on their progress
through the path by announcing node numbers was considered helpful: “I liked the fact that it
made you aware when it was working, through continuous speech feedback.” Some users expressed
dislike though, during the few times when the system was giving them directions that were quickly
changing in a short distance. This rapid change of mind concerning the current user’s position
could take place when the sensory input was such that as to make the system oscillate between
a set of different map nodes quickly. Since our system employs a probabilistic model to calculate
the current location in order to provide appropriate directions to the user, it could conceivably
be programmed to also calculate a confidence measure for the current location estimate. Then,
54
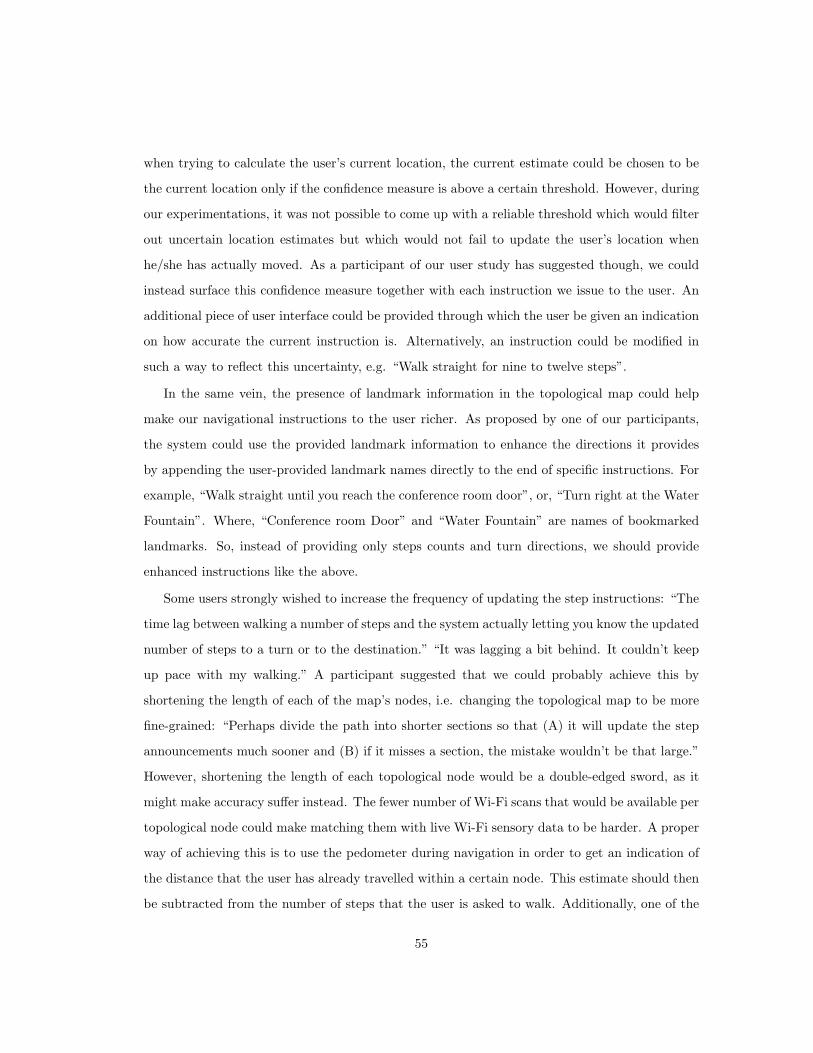
when trying to calculate the user’s current location, the current estimate could be chosen to be
the current location only if the confidence measure is above a certain threshold. However, during
our experimentations, it was not possible to come up with a reliable threshold which would filter
out uncertain location estimates but which would not fail to update the user’s location when
he/she has actually moved. As a participant of our user study has suggested though, we could
instead surface this confidence measure together with each instruction we issue to the user. An
additional piece of user interface could be provided through which the user be given an indication
on how accurate the current instruction is. Alternatively, an instruction could be modified in
such a way to reflect this uncertainty, e.g. “Walk straight for nine to twelve steps”.
In the same vein, the presence of landmark information in the topological map could help
make our navigational instructions to the user richer. As proposed by one of our participants,
the system could use the provided landmark information to enhance the directions it provides
by appending the user-provided landmark names directly to the end of specific instructions. For
example, “Walk straight until you reach the conference room door”, or, “Turn right at the Water
Fountain”. Where, “Conference room Door” and “Water Fountain” are names of bookmarked
landmarks. So, instead of providing only steps counts and turn directions, we should provide
enhanced instructions like the above.
Some users strongly wished to increase the frequency of updating the step instructions: “The
time lag between walking a number of steps and the system actually letting you know the updated
number of steps to a turn or to the destination.” “It was lagging a bit behind. It couldn’t keep
up pace with my walking.” A participant suggested that we could probably achieve this by
shortening the length of each of the map’s nodes, i.e. changing the topological map to be more
fine-grained: “Perhaps divide the path into shorter sections so that (A) it will update the step
announcements much sooner and (B) if it misses a section, the mistake wouldn’t be that large.”
However, shortening the length of each topological node would be a double-edged sword, as it
might make accuracy suffer instead. The fewer number of Wi-Fi scans that would be available per
topological node could make matching them with live Wi-Fi sensory data to be harder. A proper
way of achieving this is to use the pedometer during navigation in order to get an indication of
the distance that the user has already travelled within a certain node. This estimate should then
be subtracted from the number of steps that the user is asked to walk. Additionally, one of the
55

participants was obsessed with the accuracy of the step count reported in each of the instructions.
Once, the system instructed him to “Walk straight for 19 steps” and then turn right, whilst the
turn was actually after 21 steps. Another time the system told him to walk seven steps and reach
the destination, whilst the destination was after five steps instead. He was annoyed about that
and he said that if the system is not extremely accurate when reporting the number of steps that
are to be walked, he could not consider it a safe system because he may walk into danger. The
reason is that the algorithm of counting steps is too coarse-grained to allow itself to be calibrated
for users with different walking strides, such as for people with different heights: “The steps were
not very accurate because suppose I am taller than you I would be making less steps than you.
How do you calibrate that?” Others found the step counter not as accurate as they would have
wished: “I wasn’t feeling secure because of the limitations in recognizing the step count. It was
good but off.” In the future, perhaps announcing distances in meters or in feet would remove the
one size fits all approach of the current step counter: “If you give distances in feet or meters it
will remove the variability of the step measure.”
Currently, there is no way in our system for the user to correct an error in a path while it is
being recorded, by deleting say sections from it and re-recording them. Additionally, there is no
user interface enabling users to add landmarks or change turn directions after a path has been
entered into the system. A participant proposed that we implement an on-line way of correcting
mistakes while recording a new path: “You want to be able to delete on the go, while being guided
the first time. Like create a system where you can pause, delete previous path sections, continue,
etc.” A related improvement should also be considered, whereby users are able to virtually browse
and explore all the recorded paths without moving away from the comforts of their armchairs,
making corrections if necessary. Such a feature would not only permit the correction of mistakes
but would also help the users to familiarize themselves with the recorded routes better, allowing
them to memorize these routes more easily.
A weakness that the users wanted to be remedied was the fact that the system as designed
does not work across multiple floors. This means that if a route is started on one floor, it cannot
finish on another floor. This is because we have not tested this scenario to ensure that Wi-Fi
signals could be a sufficient method of determining the floor on which a user is currently being
located: “How will it know on which floor you are ... say if you are on thirteenth or on the
56

twelfth ... I mean there is only a short ceiling between the floors ... how will it know?” In the
future, more instructions need to be programmed into the system and the topological map may
need to be augmented in order to handle stairs and elevators. Our pedometer algorithm may
require modifications, as one of our participants shrewdly observed: “If I am taking an escalator
or the stairs, it wouldn’t calculate the right number of steps. If you are taking stairs and you
are on an escalator there is no body movement and even if you are taking ordinary stairs, there
is very little horizontal distance change but a lot of change in the vertical distance. How would
the system accommodate that?”
Another important disadvantage of our system that was brought to the foreground by some
users was the fact that the system is not able to provide corrective action and assist users who
have veered off the recorded route to get back onto that route: “What if you get off your path.
How would the system find which way you are now facing? And how would the system help you
come back on the right path?” However, without access to the whole of the building’s floor map
or without a way to join already walked paths in order to try and construct such a floor map,
it would be difficult to provide any corrective action similar to the one describe by the following
participant: “If it overshoots your destination or a turn by some distance, would it say that
you have to go back two steps for example?” Nevertheless, one of the participants commended
the fact that the system could start or continue navigating from any arbitrary location of the
recorded path and adapt its instructions accordingly: “I also like that it recalculated the road
depending on your current location.”
A possible way to help the user get back on the right path was put forward by a participant
who explained that the system could try and calculate the distance that the user is away from
the prescribed path and provide the user with this information. Since the system does not use a
compass, the participant mentioned, it cannot give directions to re-orient the user on the right
path, but it could at least give the user some estimate of how far he/she is from the path. The
systems inability to put a user back on the correct path is due to the fact that the system does
not have the new location the user has mistakenly walked to in its database and so it would
match the new location to some totally irrelevant place on the recorded path. In this case, i.e.
when the probability of being at any one node is too low, the system should switch to another
mode where it would just calculate the distance that the user is from the right path and just
57

give him/her this information, since it cannot provide any other form of directions. This solution
was thought by the participant to be a sufficient alternative given our constraints. Implementing
this idea though will require us to find a way to calculate approximate distances between a set of
known Wi-Fi measurements belonging to a particular path and some unseen Wi-Fi measurements
outside the path.
Guiding a user around an unfamiliar building accurately necessitates the use of precise lan-
guage when formulating instructions. This is even more essential in buildings which feature
corridors with complicated junctions, corners which do not make right angles or large hallways.
However, our system can only issue turn instructions which ask the user to make a full 90 degree
turn. As it was observed by one of our study participants, our set of instructions needs to be
enriched in order for the system to be more useful in the above situations: “... we need to figure
out a system where the turns are not all 90 degree angles. ... Perhaps ’Turn slightly to the
right’, etc.?” Similarly, walking a route in reverse from the direction it had been recorded seems
to require more testing as observed by one of our participants. The biggest issues were that the
system could not figure out the orientation of the user correctly every time and that the first node
of the path, i.e. the destination since we were walking the path in reverse, was not identified,
perhaps due to the fact that it was too small. Therefore, appropriate measures must be taken to
ensure that all nodes that could serve as the destination are sufficiently large in order to allow
matching by the navigational algorithm. We should also try to find a way to tell the direction a
user is facing from their motion, since we cannot rely on the phone’s compass.
Concerning our user interface, participants’ comments were directed at both capabilities of
our system to provide navigational instructions using synthetic speech as well as using vibratory
feedback. Currently the system repeats instructions using text-to-speech more than once if the
user does not move to another node after five seconds. It was suggested that if the current
instruction was a repetition of an instruction which had already been given to the user, we
should add the word “repeat” to it. Meanwhile, after discussing the matter with some of our
participants, it became clear that a number of them wished us to make the system work with voice
commands in addition to the current functionality of marking landmarks with speech recognition.
In fact, speech recognition functionality might not be necessary after all when recording landmark
names, as recording the actual speech utterance directly in an audio file might be sufficient. This
58

is because the names of the landmarks are not searched textually in any way but they are
presented as a list from which the user is asked to select a destination. This list can simply be
made up of a selection of the original pieces of audio recorded using the user’s voice for each
landmark. In this way, no Internet connection would be needed as is the case now for the speech
recognition service to work.
“Initially I did not know which vibrations corresponded to which turn or to which instruction.”
This revelation by a particular study participant made us realize that perhaps our vibration
patterns were not distinctive enough to be easily remembered. Even though we have tried
varying both the number and the length of each vibration among different instructions, we only
varied the number of the vibrations between the “Turn left” and “Turn right” instructions. Also,
after talking to a number of our participants, we discovered that they did not always notice the
vibrations, when both speech and vibratory feedback were turned on. In the future, we should
improve the vibratory feedback given after each user action to be distinctive for each command
and turn vibratory feedback on by default for all directions given to the user, as in the current
implementation vibratory feedback had to be enabled by each user.
While our user study was under way, we determined that our user interface should be modified
in order to make the swiping gesture more resilient so that wrong turn directions will not be
recorded. This need arose in the case of one of our user study participants where, the system was
mostly accurate in its navigation instructions except that 3 out of the 8 turns were announced
the opposite direction. This is the first time we had experienced this issue which makes it very
plausible that during training the user just did not swipe the correct way causing these errors.
In the future, the system should also be altered to give speech feedback when swiping to mark a
turn in addition to vibratory feedback, as one of the participants had complained about the lack
of such feedback: “Make it tell you which way you have swiped when indicating a turn so that
you are sure that you have not swiped the wrong way.”
Finally, more haptic gestures could be added to the system in such a way to make the use
of the phone’s screen reader even more redundant, or for enabling additional usage scenarios.
For example, we envisioned above the virtual exploration of recorded routes by the user before
actually walking them. This scenario might be useful for learning and experimentation purposes.
In summary, even though described as simplistic, the users praised the algorithmically more
59

complex facets of our system. These facets include the system’s ability to discover their approx-
imate location within a route they had previously walked and its ability to count the number
of steps they had taken. In any case, an algorithmically strong navigational system which also
presents a simple to operate user interface, was the design approach we had aimed for. One user
specifically stressed that the fact that the system is “programmed” by the actual end-user and
does not rely on pre-constructed maps is a positive aspect. The user was perhaps alluding to the
freedom that our approach provides, namely the ability to employ the system in any building
with visible Wi-Fi hotspots without previously involving the building’s owner in the mapping
process. In general, however, for the users’ enthusiasm to last, we have to prove to them that the
system could be accurate in many more settings and situations than currently tested. Our users
need to get more time familiarizing themselves with the system and for us to let them train it
and use it for some hours on various paths, in order to be able to provide us with more holistic
opinions.
In future work, an automatic calibration of the system’s weight parameters according to the
characteristics of the buildings Wi-Fi might improve accuracy even more. Also, detecting that
the user has arrived at a turn or the destination is exclusively based on reaching the node at the
specific turn or the final node of the route respectively. This somewhat inflexible approach can
explain the fact that in our original case study one of the arrivals to the destination was never
announced, since the final node in the map for that route seems to have never been entered.
A reason for this issue might be the relatively small length of the node in question. Future
experiments should perhaps lead to an improved method of constructing maps in such a way to
avoid any such problems.
2.8 Summary
This work has presented a practical and useful navigational aid, which can remind visually
impaired people how to independently find their way on any route they had previously traversed
once when using sighted assistance. Its minimalistic gesture-base interface has made it simple
to operate even while holding a cane or trying to listen to environmental sounds. Despite the
high noise of the Wi-Fi signals and the high amount of training required in previous work, our
60

system seems to be very accurate for navigational purposes. From the 23 paths tested in our
original case study, only in one path the announcement of a turn came after taking the turn itself,
making it the only time our totally blind user might have been lost in an unknown environment.
Similarly, based on our detailed user study with nine visually impaired users, we found that eight
out of the nine users found our system very easy to use and could successfully navigate different
paths in an indoor environment. Overall, we believe that this system, while not perfect, provides
a significant step forward towards realizing the vision of a mobile navigational indoor guide for
visually impaired users.
61
Chapter 3
Typing on a Touchscreen Using
Braille: A Mobile Tool for Fast
Communication
The fast and widespread adoption of mobile phones which use only a touch screen for input has
created several accessibility challenges for visually impaired individuals. These challenges include
navigating a primarily visual user interface, finding numeric buttons to enter phone numbers and
typing text on a purely visual keyboard.
Improving interface navigability for visually impaired users has been dealt with in [39] through
a set of gestures which allow the user to move around the UI controls and listen to their contents.
Commercial implementations of this interface now exist [33]. However, concerning text entry,
blind users are still forced to use the built-in on-screen keyboard. Even though this keyboard
may be able to speak the character above which the user’s finger is located, typing using this
method is time consuming and error-prone. Letters on such keyboards are tiny and are placed
too close to one another due to the constrained screen size and so the plethora of touch targets
makes typing slow to the point of frustration.
In previous work [26, 7, 23, 76, 56] researchers have tried to tackle this issue by proposing a
62

set of new input methods, some of which use the Braille alphabet. In most cases, the new method
of entering text was compared with a standard QWERTY implementation on a touch screen and
found to be superior. However, the various Braille-based input methods have not been compared
systematically and empirically so that their individual advantages and disadvantages could be
analyzed in detail. In this paper, we put the Braille system of writing under our microscope and
ask the question: Given that we have to design a Braille input method, what would be the best
way that such a method would be implemented? We do this by proposing a set of four Braille
input methods augmented with a small set of editing gestures. We compare our methods along
with one existing method from the literature [78] in a usability study.
By testing a set of diverse input methods, we are able to explore the solution space from
different angles and elicit different feedback from different groups of users who might be attracted
or served best by different methods. Even though this need to cater to the wide diversity of the
blind population when typing on a touch screen has been previously recognized in the literature
[62], this diversity has not been directly used to guide the design of future input methods. Further,
instead of proposing a set of potentially numerous and separate input methods each one to be
used by a different group of visually impaired individuals, the current work takes a different
approach: We rely on the data collected during our user study to guide us in improving the
Braille input method that our users preferred the most.
Previous work [41] has shown that visually impaired users are not as accurate when performing
touch gestures compared to sighted individuals. This makes it all the more important that a
Braille input method should be able to produce text with as few mistakes as possible while
relying on noisy touch input. Also, most visually impaired individuals may employ canes or
guide dogs as mobility aids in their everyday life. This makes it hard to touch-type on a mobile
phone while one of your hands is otherwise occupied, making the existence of a single handed
input method essential. Unlike related research in this area, both of the above factors have been
taken into consideration when designing our Braille input methods.
63
3.1 Problem Description and Motivation
Creating a successful touch keyboard is complicated, as it involves much more than simply
drawing a pictorial representation of a physical keyboard on a touch screen. One reason for this
extra complexity is that with an on-screen keyboard, users are unable to touch-type like on a
physical keyboard. Finding the next character to enter is a more involved mental process, as it
requires the visual identification of the target letter before directing a finger to touch it. Compare
this to a physical keyboard on which users who have learned to touch-type can locate and acquire
letter targets with no conscious effort. Indeed, totally blind individuals can train themselves to
become extremely fast typists on a physical keyboard, taking advantage of touch-typing. Similar
to sighted typists, experienced blind typists can locate characters on physical keyboards without
having to exert any mental effort when locating each key as their fingers “automatically” jump to
it. However, given the narrow width of a touch screen and the lack of any physical markings, it is
impossible for any user to place all of his/her fingers on a touch keyboard or let alone keep them
at a constant and pre-determined location for a long time without drifting, in order to touch-
type. Also, since touch screen phones are mobile devices which are most often in use while on the
go, one hand is often occupied just by holding the phone and cannot be used for touch-typing.
Whilst the lack of a touch-typing ability on touch keyboards is not as detrimental for sighted
users typing speed, it can negatively affect the typing rate of blind individuals enormously. This
is because without the immediacy of visual feedback, blind individuals are forced to painfully
explore the screen by slowly moving a finger over the region surrounding the target letter, until
it has finally been located.
Touch keyboards are usually known to suffer from a low hit-rate. This means that once the
target character has been located, it is very easy to accidentally tap a nearby character instead
of the desired one due to the close proximity of the touch targets on the seemingly tiny phone
screen. This issue, which affects both sighted and visually impaired users of touch keyboards,
can be more aggravating to the latter group though, who after mistakenly activating a nearby
character and after lifting their fingers from the screen, need to repeat the agonizingly slow
exploration again from the beginning in order to find and acquire the correct character.
To compensate for the above problems of the lack of touch-typing and of the low hit-rate on
64

touch keyboards, software developers have added extra algorithmic sophistication which can pre-
dict what users are intending to type from what they actually type. These prediction algorithms
can then auto-correct on the fly the users erroneous virtual key touches and output the text
that most closely matches the users intentions, as they have been perceived by the algorithm.
These auto-correcting features of touch keyboards though, might be disabled by blind or visually
impaired users, as they often require the user to make a choice between different suggestions of
corrected text while typing. These suggestions can interrupt the normal flow of selecting and
activating character targets or may appear at unexpected times, confusing the visually impaired
user who is forced to listen more carefully to the speech output from his/her mobile phone in
order to identify their arrival. Indeed, similar to the fact that sighted users must continuously
glance at the phones screen while typing on a touch keyboard, visually impaired individuals need
to continuously and attentively listen to the phones screen reader when entering text. Paying
attention to the phones synthetic speech output is vital as screen readers are often programmed
to echo each individual character and/or word typed enabling the visually impaired user to verify
the correctness of his/her input. This need forces especially blind individuals to have to continu-
ously hold the phone close to their heads, in order to use the touch keyboard while being present
in a noisy environment or simply in order to maintain their confidentiality. For example, sending
a text message during a meeting might need to be done quietly and discreetly, i.e. with limited
intrusions by the phone’s screen reader and without having to extensively expose the phone into
view. A more intuitive method of entering text is therefore essential in order to ease the above
pain-points experienced by such users.
A possible solution to the challenge posed to the blind community by the inability to efficiently
type on touch screen phones can be the use of a new input method based on the Braille alphabet.
The Braille system of writing represents each letter or numeral as one or more Braille cells. Each
Braille cell is a pattern made up from a possible set of six dots all of which appear at very
specific cell locations. This makes the number of the possible touch targets extremely small and
their placement very predictable compared to a touch keyboard. Similarly, the six Braille dots
appear in two columns of three dots each, an arrangement which, compared to the proximity of
the virtual keys on the touch keyboard, makes it much harder to accidentally touch the wrong
target. Figuring out the most preferred approach of entering Braille on a touch screen can be a
65

challenge of its own though. Obviously, the proposed Braille method should be fast to use and
at least easy to adapt to for a person who is familiar with Braille. However, the proposed Braille
input method should also prevent the user from making mistakes through spurious or accidental
touches, should keep as few of the users fingers as possible occupied to enable comfortably holding
the device while on the move and should permit the user to effortlessly type without having to
continuously hold the phone close to his/her ear in order to verify every action taken. In fact,
it would be ideal if such an input method would, with practice, become second-hand nature to
the user, who would then enter text without having to continuously maintain a heightened level
attention, similar to the automatized manner in which other daily tasks, such as driving, are
performed.
3.2 The Challenge of Using a Touch Screen as an Input
Device
Having decided on developing a Braille input method, we have to now discuss how we can use
effectively the only relevant input device available to us on modern mobile phones, i.e. the touch
screen. Since the early days of the availability of touch screens, there have been efforts to make
it accessible to visually impaired individuals. Turning a device which was visual in nature into
a tool that the blind community could also use has been, and still is, a challenging riddle for
the research community and the industry alike. In general, when attempting to make the touch
screens available on modern smart phones accessible, four distinct approaches of finding and
activating user interface elements have been proposed:
1. Linearly move amongst items one by one, where a set of simple swipe gestures are used to
move a virtual cursor through the applications UI elements in the order they appear on
screen. This is one of the techniques employed on the iPhone [33] and although a potentially
time consuming method on screens with many items, it is very simple to perform. It can
also be easily adapted to most application interaction scenarios. In addition, navigating
the user interface linearly is the preferred method employed by the visually impaired when
interacting with a desktop computer. One way of possibly implementing our Braille input
66

method could be to have the user move through the six dots and choose the ones required
for each Braille pattern that the user wishes to enter. Repeating this procedure for every
Braille pattern to be entered though, would be extremely tedious and thus undesirable.
2. Use parts of the screen as special hot regions, where usually the screen corners are des-
ignated as having a special meaning. These hot regions are usually chosen to be easy to
memorize or are marked by a tactile sign. The screen corners are especially preferred as
that they can be located by blind individuals quickly and reliably [41]. By tapping or
double-tapping these special screen regions in a specific order, different commands are per-
formed. For example, on some ATM machines tapping the bottom-left corner of the touch
screen moves a virtual cursor to the next on-screen UI element, whilst tapping the bottom-
right corner activates the current item. The Mobile Speak screen reader [15] employs this
approach. Even though this method is simple to learn and operate, it would seem that
the full potential of using a touch screen is not realized as most of its surface area would
be unused. When using this approach for our Braille input method, the designated hot
regions act as simple virtual buttons and the potential of having rich spatial interactions
as afforded by the presence of the touch screen is ignored.
3. Allow the user to explore the screen, reading each UI element as the user’s finger moves over
it and providing a different gesture for activating the touched element. This is an easy to
implement approach which is currently used by the iPhone among other devices. However,
exploring the screen can be extremely slow, especially if there are no auditory guides to
help you locate the numerous UI elements scattered around it. In a recent study [40],
this challenge of searching among a great number of targets became particularly evident
as researchers tried to tackle the inaccessibility which still plagues large touch screens
such as those used at public kiosks. However, given that our Braille input method would
require only 6 items each one representing each Braille dot to be present on screen, an
implementation based on screen exploration might be viable.
4. Use specialized gestures for different commands, where a different single or multitouch
gesture is assigned to a different command in the user interface. This technique would
allow for a rich repertoire of gesture interactions but at the cost of a steeper learning curve.
67

However, starting from the premise that the Braille Alphabet is a familiar form of written
communication within the visually impaired community, the above learning curve should
be minimal. Although blind users are able to perform more complicated gestures than
sighted users [41], their accuracy suffers. This is because such individuals prefer a guide
(screen edge) or an immovable starting-point (screen corner) to be part of the gesture.
Entering Braille, however, should not be time-consuming and so our Braille system should
pick simple and intuitive gestures involving at most two fingers.
Given the above analysis, it might be beneficial to design a set of Braille input methods each of
which would take advantage of a different touch interaction approach. In this work [65], we design
one Braille input method which takes advantage of the spatial placement of Braille dots, another
which emphasizes screen exploration and two which use intuitive gestures to enter each row of a
Braille cell. A method which relies on the ability of the touch screen to be used spatially would
permit us to effectively make use of the total surface area available to us on this input device.
It would also appeal to blind users’ familiarity with Braille, as it would provide a one-to-one
mapping between each Braille pattern and the way that it is input. On the other hand, methods
which employ a set of simple stationary gestures can be more robust as such gestures can be
readily distinguished from one another regardless of the phone’s orientation, making the margin
of error really small. Additionally, a method which encourages painless exploration of the screen
would enable users to learn the system more easily, as well as allowing them to ensure that their
input is correct before being submitted, preventing an unnecessary type/undo cycle. Ultimately,
the different interaction approaches, including the emphasis each one gives to a different design
tenant, i.e. familiarity, robustness and painless screen exploration [7], are compared against one
another in a user study.
3.3 Previous Work
A variety of mechanical devices featuring physical keyboards have been employed for typing
Braille over the years and in different parts of the world. Most of these keyboards make use
of the technique of cording, whereby the user presses one or more keys at the same time to
create a Braille pattern. The use of the same technique for typing using the Braille alphabet
68

has previously been proposed in [12], where a pair of specialized gloves were used as the input
device to the computer. These gloves were equipped with a set of special regions under each
finger, which were made up of a pressure-sensitive material, each one acting as a virtual key. By
applying pressure to one or more of these regions at the same time, all the dot combinations
making up the Braille Alphabet could be entered. However, as designed, the material making up
these pressure-sensitive regions made the gloves relatively bulky [12].
Instead of using a specialized input device, the use of various forms of stylus strokes or gestures
for writing text on a touch screen was explored in [82, 72]. In [82], each letter was represented
with a set of Graffiti-based strokes, which the users were required to learn. To ease the learning
process, the strokes making up each letter were made to resemble the general shape of the letter
itself, but were drawn using only straight lines and in a manner similar to a geometric shape. In
the Quikwrite system [72], groups of different letters of the alphabet were separated into different
screen regions. Users had to first select the group containing the desired letter and then choose
the actual letter from that group. However, both of the above stroke-based techniques either
require the blind individual to learn the shape of the actual print letters or to quickly navigate
a possibly crowded screen and find precise targets. It is unlikely that most totally blind people
will have learned the shapes of the letters of the English alphabet while at school and attempts
to entice them to do this just for the use of a novel text-entry system might not bear fruit.
A system using the eight compass directions of North, Northeast, etc., was proposed in [92].
In this system, the user would gesture from the center of an imaginary circle towards any of
the eight compass directions in order to select the character which was uniquely mapped onto
that direction. Three such imaginary circles of letters where available and the user would switch
between them by varying the delay between touching the screen and performing the actual
directional gesture. Using gestures instead of having to explore the screen in order to locate and
activate specific targets, certainly makes for a friendlier mode of interaction for visually impaired
users. However, precisely gesturing towards a very specific direction, especially while being on the
move, might be hard as the phone would not be always held with exactly the same orientation.
A faster way of switching between the three different circles of letters without having to wait for
a pre-determined delay might also be desirable.
The familiarity of most users with the placement of the number keys on a standard telephone
69

keypad, in addition to the standard association of specific letters to each number, was taken
advantage of in [78]. In this work, the touch screen was divided into nine virtual keys, representing
the first nine numbers of a telephone keypad. Characters were entered by tapping the virtual key
representing the number associated with the desired character multiple times, until the desired
character had been selected. Even though the static and well-known positions of the nine numbers
on the touch screen made this approach easy to learn, the fact that each number had to be tapped
more than once could enable the user’s finger to drift, tapping a nearby number accidentally.
Previous attempts have enabled blind users to select letters by moving a virtual cursor around
the alphabet [26] or type by selecting letters from eight standard character groupings using a two-
level hierarchy [7]. Specifically, a swipe towards the left or towards the right was used in [26] to
move a virtual cursor backwards and forwards through all the letters of the alphabet respectively,
whilst locating letters faster was accomplished by an upwards or a downwards swipe which would
move only among the vowels. However, since words do not usually have letters which are close
in alphabetical order to one another, the procedure of having to continuously jump from one
place of the alphabet to another would be agonizingly slow. Even the five vowels are not equally
spaced out over the alphabet to be used as adequate anchors and so employing the shortcut
for moving among the vowels when trying to reach a particular letter might not be sufficient to
speed the text-entry process up. The use of a two-level hierarchy for selecting characters was
proposed in [7], where the screen was divided into eight segments. Each segment was assigned
a list of characters, like the numbers on a telephone keypad. The user could explore the screen
using one finger and when a particular segment would be touched, the characters assigned to that
segment would be spoken. Touching using a second finger would activate that character group,
whereby the user was able to select in a similar manner the desired character from a list arranged
alphabetically from the top of the screen downwards. Compared with a direct, spatially-oriented
Braille input method, however, a possible weakness with the above method is that the two-level
hierarchy coupled with the fact that a split-tap gesture is always needed to select a screen target
might unacceptably slow down each character’s entry.
In [23, 76] typing Braille on a smart phone’s touch screen similar to the way that Braille is
entered on a mechanical Brailler was demonstrated. However, this method requires the use of at
least three fingers from each hand, making holding the phone with the remaining fingers difficult
70

and allowing for spurious touches. The use of a set of gestures in order to enter each Braille
character row-by-row has been proposed in [56]. Despite the fact that this approach is similar to
one of our Braille input methods discussed below 3.4.1, our method is different in the sense that
it was designed to be used single-handed, a common usage scenario. Contrary to the method in
[56] which includes gestures requiring three fingers, our corresponding method can be used on
phones with narrower screens or on phones which do not support more than two simultaneous
touches, a limitation which unfortunately is present on various devices.
The diversity of the population of visually impaired users and its effects on the usage of touch
screen input methods has been identified in [62]. The authors found that the age, the time of
onset of blindness, as well as the cognitive and spatial abilities of the individual can play a role
in the speed and accuracy of using various input methods that had been described previously
in the literature. However, the authors did not try to design an improved input method but
proposed that all text entry methods should be available in order to fulfill the needs of different
users. Additionally, the authors did not compare different Braille input techniques in order to
discover if the relative slowness determined in the Braille input method they used could be in
any way remedied.
In contrast, various Braille input techniques were described in [16]. However, their usage was
not thoroughly evaluated and the relationships between the different methods not investigated to
the point of deriving guidelines to assist in creating an improved Braille input method. Finally,
a common weakness of most of the above solutions is that little emphasis was given on methods
for editing or navigating already entered text.
3.4 System Design
This section describes the implementation of the four Braille input methods we have devised.
An additional fifth method which is derived from research encountered in the literature [78, 7]
and which we have included in our application for comparison purposes is also presented. For
all the methods, we detail the complete user experience they offer, i.e. how the user is supposed
to interact with each method and how the system responds to the user’s touches. For the first
of our Braille-based methods, we emphasize the algorithm we developed in order to improve the
71

Main screen Application’s menu Menu cont.
Figure 3.1: Screenshots of interface
accuracy of that particular method. Finally, the editing and navigation gestures available in our
Brailler application are described.
3.4.1 A Variety of Input Methods
As already discussed 3.1, instead of having to learn a new system of touches or swipes, our system
aims to use the Braille Alphabet, solving the memorization problem of other approaches. In our
system the touch screen is used as the surface where Braille characters are entered, making our
implementation able to run on most modern smart phones. To permit editing and review of
entered text, we have also implemented a set of simple directional gestures which act as the
space, backspace and arrow keys.
On initial load, the system shows a Braille cell where dots can be tapped using one finger to
form a Braille pattern 3.1. Once touched, Braille patterns are interpreted and the corresponding
letter of the English alphabet is typed in a standard text box. To erase a character, the user can
swipe left with one finger. Activating the menu offers the user the ability to switch amongst the
various ways of entering Braille, such as a thumb-based or a single-handed method, described
below. An extra input method which employs the first nine numbers of the telephone keypad
is also offered, in addition to the ability to hide the edit box in which the actual characters are
typed.
The input methods offered are listed next. As previously discussed 3.2, each one was designed
72

with a different design tenant in mind.
1. One-Finger: This method was designed with user familiarity in mind. Each Braille dot is
selected spatially on a virtual three-by-two grid by tapping. Each time a dot is tapped, the
software speaks the dot’s number. After a specific short interval has passed without any
screen touches, the entered dots are interpreted and the resultant character is typed.
This method allows the user to effectively “sketch out” the character he or she wishes to
enter using Braille. The interval before the entered dots are interpreted is calibrated to be
short enough to make this input method appear natural to a blind Braillist, but long enough
to allow a character with multiple dots to be entered without mistakes. Even though the
dots are placed on a visual grid, our algorithm does not rely on the user having to touch
the exact locations where dots are visually present, but can intelligently deduce the entered
character by the overall shape of the tapped locations.
More specifically, when using this method, a depiction of an empty Braille cell appears
on the phone’s screen and Braille dots light up when touched. This is for the benefit of
the partially-sighted. Users are expected to select each dot making up the Braille pattern
they desire by touching it. However, after analyzing a set of touches for various Braille
patterns 3.2, we realize that touches corresponding to each Braille dot were not always in
the designated rectangular region for that dot. This suggested that a better approach of
interpreting Braille dots from a list of touch locations should be devised. To fix this, our
algorithm tries to find the Braille pattern which most closely resembles the shape of the
touch locations. It enumerates all the possible Braille patterns whose dots centers are at the
visible predetermined screen locations and finds the one that has the minimum Euclidian
distance from all of the touch locations.
2. Split-Tap: This method emphasizes painless exploration of the on-screen content. Each
dot is selected spatially as above but not by single taps. Instead the user moves a finger
around the screen until he or she hears the desired dot number. Then, the user places a
second finger on the screen to select it. After selecting all the dots making up the desired
character, the user finishes entering the character by lifting up the first finger. As soon as
the finger is lifted, text-to-speech is again used to speak the character just typed.
73

Figure 3.2: Distribution of touches for each dot
By confirming each dot before being selected, this method should also help the user to be
more accurate when entering Braille. To achieve this accuracy, however, it is apparent that
typing speed is somewhat sacrificed. Ultimately, a user study should decide whether this
sacrifice of speed is worth the additional accuracy.
3. Two-Finger: To facilitate single handed text entry, we allow the ability to input a Braille
character one row at a time. For each character the user taps each row of the Braille cell
individually using the following gestures: If a row contains both dots, then two fingers are
tapped. Otherwise the corresponding left or right dots are tapped. If a row has no dots,
then a downward gesture is performed with both fingers. The remaining three fingers are
used to hold the phone. Before the last row has been entered, the user can swipe upwards
using two fingers to a previous row and correct it in case of error. Corrections can be
performed using the same gestures for entering dots, which when repeated for a second
time on the same row, erase their corresponding dots. After selecting the dots of each row,
the system uses text-to-speech to speak out the numbers of the dots selected. Similarly,
after erasing a set of dots for a specific row, their numbers are spoken with the word “off”
appended to them.
This method together with the next one were designed in order to enable a more robust
text-entry technique, which would not depend on how the user is holding the phone or
where exactly the user would have to touch, but on simpler to distinguish touch patterns,
such as whether the user is touching with the left or with the right finger.
74

4. Thumb-Typing: To allow the user to hold the phone more securely with one hand, a method
of typing only using the thumb is proposed. Given the popularity of using the thumb by
many individuals to type on touch screens, it was hoped that this method would be deemed
familiar by most. The Braille pattern is also entered row-by-row as in the previous method.
The thumb is tapped in the vicinity of the top-left quadrant of the screen to indicate that
the left dot in the current row is selected and it is tapped towards the top-right quadrant
to indicate that the right dot is selected. To select both dots in a row, the thumb bends
in a natural manner and taps in the bottom-half of the screen. To leave a row empty, the
thumb swipes down. Previous rows of the Braille cell could also be revisited and edited by
swiping up, as in the previous method.
5. Nine-Digit: We implemented a combination of the methods detailed in [78, 7] but with a
slight twist to prevent accidental touches arising out of the need to accurately tap multiple
times on a single target. The numbers 1 to 9 with their corresponding letters appear in a
standard telephone keypad formation. Instead of the user having to tap a number multiple
times in order to get to the desired letter, however, the user chooses first a number and
then taps one of its letters from a list arranged horizontally. The user can also explore
the positions of the nine numbers and, once a number has been selected, the position of
its letters, by moving a finger around the screen without lifting it, similar to the approach
adopted in [7]. Once the finger is lifted or a second tap with another finger is performed,
the number or character which was last touched is selected.
Obviously, given the great familiarity of most users with the telephone keypad, the place-
ment of the nine numbers should be predictable. Their locations should be easy to find
using the screen’s edges and corners as guides. Also, instead of each number occupying a re-
gion of screen real-estate commensurate to its shape, the screen is equally divided into nine
rectangles and each number can be activated by touching anywhere within its correspond-
ing rectangle. The above design decisions should decrease the need for screen exploration
to a minimum. Also, for most numbers which have three corresponding characters, these
characters are arranged so that each one virtually takes up an entire column. So, tapping
anywhere on the left side of the screen would activate the first character, tapping towards
75

the middle the second one and touching anywhere close to the right edge of the screen the
third. For numbers with more than three characters, the last one takes up the whole of
the bottom half of the screen, whilst the top half is divided into three columns as before.
This arrangement is very practical as the top half of the screen is easier to reach than the
bottom and so mistakenly activating the fourth character should be difficult. In the same
manner as in [7], a leftward swipe performed after having selected a number, cancels the
selection.
3.4.2 Gestures for Navigation and Editing
Most related work has left the all essential editing functionality out of their implementations. In
contrast, we have defined four directional swipes which can be used as follows: For all methods,
a space character can be entered using a rightward swipe, whilst a leftward one is used for
backspace. Similarly, moving the editing cursor left and right character-by-character through the
entered text is enabled by swiping upwards and downwards respectively, except when using the
Thumb-Typing method, where a two-finger up and down swipe is used instead. While moving
the cursor, the letter to the right of the cursor is always spoken. When the backspace gesture is
performed, the character being erased is also announced, but in a higher pitch.
3.5 Evaluating the System through a User Study
3.5.1 Study Design and Evaluation Methodology
Many attempts at designing new input methods have tried to evaluate their design choices only
through the use of relatively dry metrics such as typing accuracy and speed. Even though we take
such quantitative measurements into consideration and whilst they are important as an overall
evaluation of the text-entry system, we feel that they cannot tell the whole story as it is hard to
derive the causes which are responsible for producing them. Research studies concentrating on
these metrics do not find enough time to present many alternative prototype implementations to
users simultaneously, so as to permit them to compare and contrast amongst an array of choices
at once.
76

In this work, we carried out a user study which included 15 visually impaired participants
from the greater New York City area 3.1. The software was tested on an Android-based phone.
For each of the participants, we gave them a short training time to familiarize themselves with
each input method. This training phase could include a description of each input technique,
its various gestures and idiosyncrasies, such as a listing of the dot locations which could be
tapped and the expected verbal announcements that would be heard. Not all users managed to
complete this training for all five input methods. Some users who required more training would
be asked to enter some letters of the English alphabet, or some short words if necessary, in order
to familiarize themselves with the input method being tested. After the training phase, we told
our users that we would begin recording their touches and their entered text in order to discover
any shortcomings and bugs of the system, and not in order to evaluate their own typing skills.
The subjects were then given randomly chosen phrases from a standard phrase set, which they
were asked to type. The users were asked to answer a questionnaire with the same quantitative
and open-ended questions for each input method. The quantitative questions asked the users
to rate on a scale of 1 to 4 how easy each method was to use, how easy it was to learn, and
how likely they would be to use it in the future. The open-ended questions prompted the users
to give more details about what they liked and disliked about each method and their responses
were recorded verbatim. At the end of each session, the person conducting the interview would
enter detailed notes on what was deduced from the participant’s expressed feelings and thought
processes when employing the system. For example, any difficulties that the user had encountered
in understanding and using each method would be described, in addition to any suggestions on
how such difficulties arose and how they should be overcome.
As can be seen from the above protocol, during our user study, we engaged our participants
into a verbal dialog, in addition to collecting standard touch and timing log data. As a result,
we do not only passively witness the outcome of testing our different input methods, but we
also try to glean the reasons behind the participants actions, exposing their underlining mental
processes.
Our age representation appears to include both younger and older individuals. Around two
thirds of our participants were totally blind whilst the rest were legally blind. The group of
totally blind persons includes some users who had extremely limited vision, e.g. they could see
77
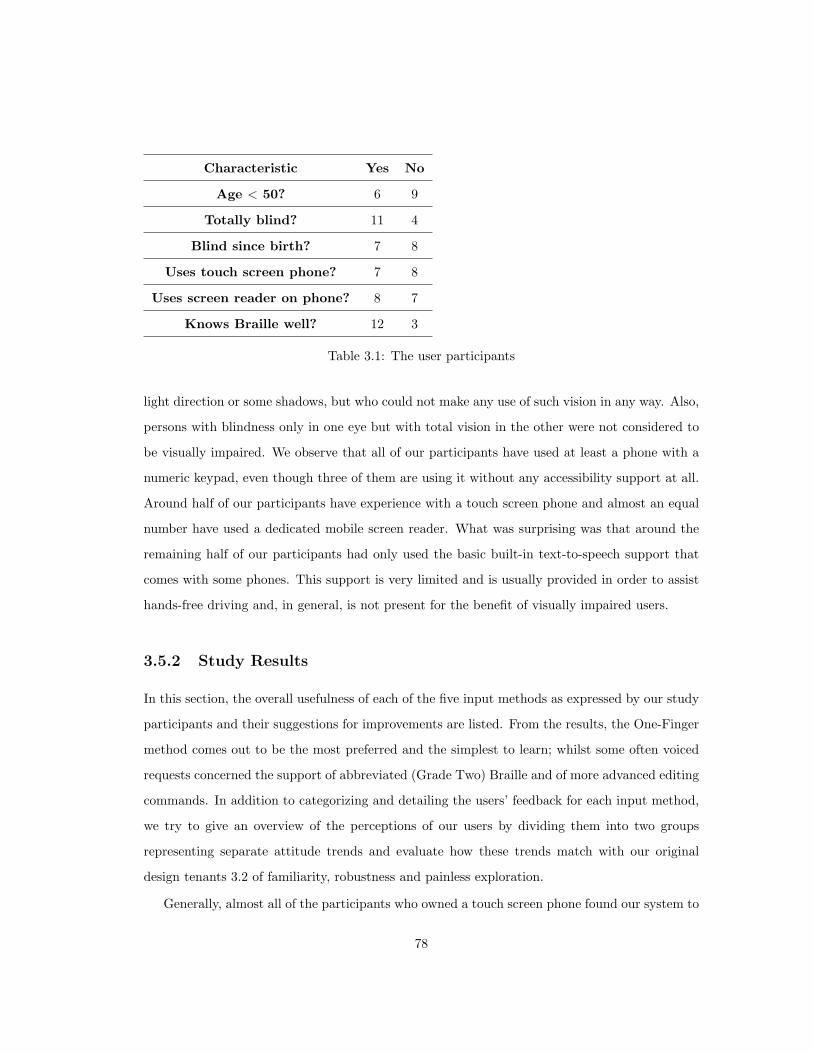
Characteristic Yes No
Age < 50? 6 9
Totally blind? 11 4
Blind since birth? 7 8
Uses touch screen phone? 7 8
Uses screen reader on phone? 8 7
Knows Braille well? 12 3
Table 3.1: The user participants
light direction or some shadows, but who could not make any use of such vision in any way. Also,
persons with blindness only in one eye but with total vision in the other were not considered to
be visually impaired. We observe that all of our participants have used at least a phone with a
numeric keypad, even though three of them are using it without any accessibility support at all.
Around half of our participants have experience with a touch screen phone and almost an equal
number have used a dedicated mobile screen reader. What was surprising was that around the
remaining half of our participants had only used the basic built-in text-to-speech support that
comes with some phones. This support is very limited and is usually provided in order to assist
hands-free driving and, in general, is not present for the benefit of visually impaired users.
3.5.2 Study Results
In this section, the overall usefulness of each of the five input methods as expressed by our study
participants and their suggestions for improvements are listed. From the results, the One-Finger
method comes out to be the most preferred and the simplest to learn; whilst some often voiced
requests concerned the support of abbreviated (Grade Two) Braille and of more advanced editing
commands. In addition to categorizing and detailing the users’ feedback for each input method,
we try to give an overview of the perceptions of our users by dividing them into two groups
representing separate attitude trends and evaluate how these trends match with our original
design tenants 3.2 of familiarity, robustness and painless exploration.
Generally, almost all of the participants who owned a touch screen phone found our system to
78

be easier, more intuitive and more desirable for them to use than their phones’ touch keyboard.
Those participants who did not know Braille very well considered our system to be an excellent
vehicle through which they could learn it quickly.
“I did not need to go around searching for the letter like with QUERTY touch keyboard.”
“I liked it because it was interesting for me to learn something new. (Meaning to learn
Braille.) I thought Braille was very complicated but it is not.”
None of the participants said though that entering Braille using a touch screen would be more
desirable than using a device with physical buttons. However, given the current hardware trends,
such devices would be all the more difficult to find in the market.
“I think having keys and buttons, something that you can feel would be easier.”
Comparing Amongst Input Methods
The One-Finger method was judged to be the simplest, the most intuitive and the most preferred,
followed by the Nine-Digit method. The One-Finger method was described as very natural and
requiring no training, whilst a negative aspect of the Nine-Digit method was the difficulty of its
two-step process for letter selection.
An isolated group of users enjoyed the Two-Finger method very much and believed that it was
a clever idea. However, most disliked its row-by-row input and the way it forced you to hold the
phone, a result that we personally found very surprising. The Split-Tap method was perceived
as being more accurate but much slower, causing frustration. The Thumb-Typing method was
generally not understood or its gestures were found to be hard to perform.
On a scale of 1 to 4, the following table 3.2 lists the mean and standard deviations for each
rating across each input method:
For the One-Finger method, there appears to be a correlation between the user’s age and
the average typing speed for each Braille pattern 3.3. Older users complete Braille patterns
faster than younger ones. This indicates that a possible improvement to the One-Finger method
would be to dynamically adjust the algorithmic parameters (such as the interpretation delay) to
accommodate different ages.
79
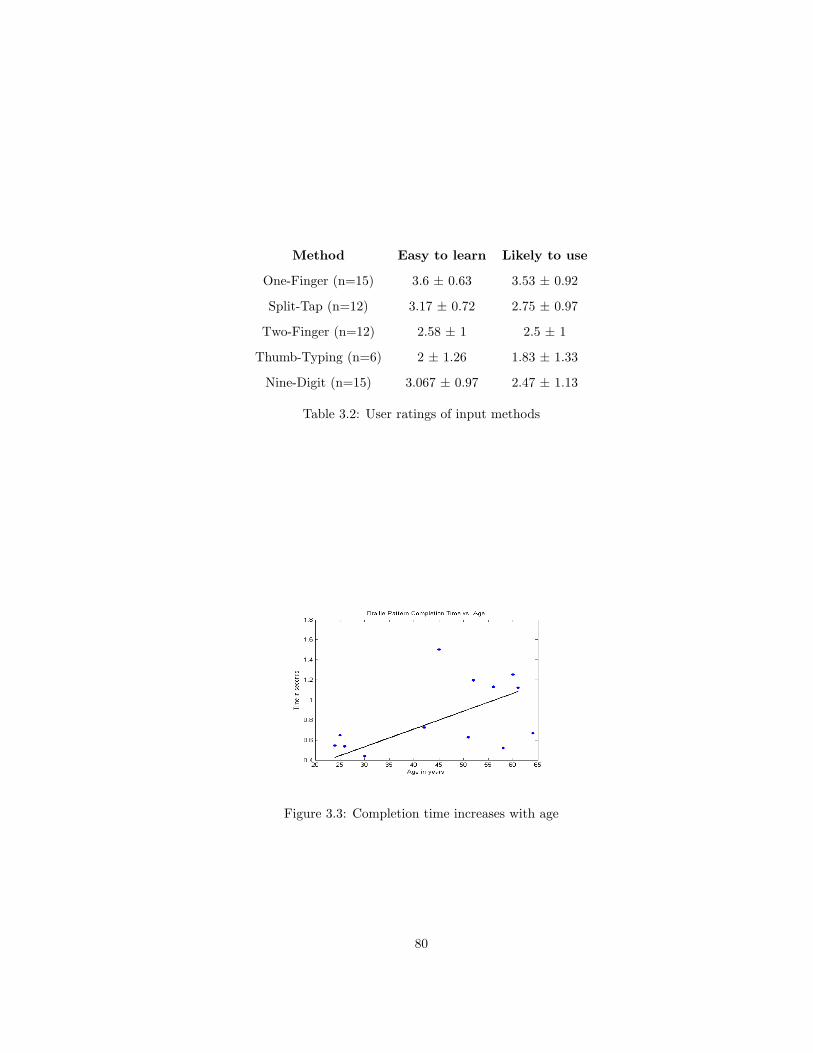
Method Easy to learn Likely to use
One-Finger (n=15) 3.6 ± 0.63 3.53 ± 0.92
Split-Tap (n=12) 3.17 ± 0.72 2.75 ± 0.97
Two-Finger (n=12) 2.58 ± 1 2.5 ± 1
Thumb-Typing (n=6) 2 ± 1.26 1.83 ± 1.33
Nine-Digit (n=15) 3.067 ± 0.97 2.47 ± 1.13
Table 3.2: User ratings of input methods
Figure 3.3: Completion time increases with age
80

Comparing Between User Groups
Our user participants can be roughly divided into some general categories based on their general
inclinations when using the system:
1. Six totally blind users who know Braille very well and use it, but who had no experience
using smart phones or phones with a touch screen. They only know how to place or
answer calls on phones with a numeric keypad but they do not use any screen reader or
their experiences with one were less than satisfactory. They are thus unable to read text
messages. They include both younger as well as older individuals. Also, they seem to be
attracted to our Braille system, i.e. they find it “interesting”, due to some sentimental
attachment with the Braille system of writing in general.
2. Eight users of varying ages who are either totally blind or legally blind and who have enough
familiarity or own a touch screen phone, most times the iPhone. Some of these users might
be excellent Braille readers whilst others might read Braille but slowly.
3. One user who falls into neither of the above categories, since this user neither knows Braille
well nor owns a touch screen phone.
The two main groups can be called the Braillists and the Technologists. The Braillists are
strong proponents of the Braille system of writing, they have been using Braille continuously
since many years for their daily needs. They enjoy getting their information in a tactile manner
and are not so much into text-to-speech or electronic technologies. On the contrary, the Tech-
nologists are not so dependent on Braille and own or are in the process of learning how to use a
touch screen phone. They rely more on mainstream gadgets or software for their daily needs of
communication and information. After carefully looking through their questionnaire responses,
for the Braillists, familiarity was the key design tenant for a successful text input method, fol-
lowed by robustness. For the technologists, robustness was more important than familiarity, as
to them it signified a well-written piece of software which they felt eager to explore. However,
the possible robustness offered by the Two-Finger method was outweighed by its relative com-
plexity and slowness. It is no wonder, therefore, that after all factors had been considered, most
users of both groups preferred the familiarity offered by the One-Finger method, coupled with
81
the robustness ensured by its pattern-matching algorithm, which allowed for inaccurate touches.
In contrast to our expectations, the painless exploration afforded by the Split-Tap method was
found to be unnecessary and even frustrating by experienced and beginners alike.
3.6 Discussion
The One-Finger method received the highest ratings because the users who knew Braille could
grasp how it worked very quickly. Some of them even became comfortably proficient using it
after less than an hour. Unlike the Two-Finger or the Thumb-Typing methods, which required
a higher cognitive load and a longer learning curve, the One-Finger method proved to be a more
natural way of entering Braille. Similarly, the Nine-Digit method, despite its familiar numpad
design, proved somewhat less desirable compared to One-Finger due to its two-level hierarchy.
Even when using the One-Finger method though, many users took exception with the length
of the interval before the entered pattern was interpreted. A group of users wanted the interval to
be adjustable either manually based on their skill-level, or, automatically by a heuristic depending
on the physical characteristics of their touches, such as their pressure or their ordering. This
strongly suggests that fixed delays in a UI are annoying to users, as some of them would find them
too short, whilst others too long. Clearly, concerning the One-Finger method, the interpretation
interval needs to adapt to users’ typing speed and currently entered Braille pattern.
Concerning the benefits of the Split-Tap method, it was clear that specific users wanted to be
able to cancel erroneously entered dots before completing the whole Braille pattern, whilst others
wanted to be able to confirm each dot pressed. They felt that waiting until the whole pattern
has been entered and interpreted, just to be subsequently able to delete it, was a waste of time.
In spite of this, using the Split-Tap method for this purpose was deemed undesirable as many
participants rejected the split-tap gesture as too slow and cumbersome, whilst some found the
whole Split-Tap method as too hard to learn. Performing this gesture while the first finger was
towards the edges of the screen felt awkward, whilst the second tap would at times make some
users accidentally lift up the first finger, registering the wrong Braille pattern. This indicates
that for text entry input methods, the split-tap gesture might be inappropriate and should be
avoided.
82

Nevertheless, some form of input verification appears necessary, as some participants would
continuously use backspace to ensure themselves that they had correctly typed something or in
order to check their progress in the text. Ultimately, the participants wanted to have the ability
that the Split-Tap method offers to confirm each Braille dot, but without having to perform
a slow split-tap gesture each time. Designing such a method though would be hard, as using,
for example, a double-tap gesture for confirming each dot, might turn a cumbersome method
into an even more cumbersome one. At the end of the day, the seemingly simplistic One-Finger
method offered a compromise for these users needs, as its pattern-matching algorithm would
automatically compensate their desire for higher accuracy.
Most participants who knew Braille would conceptualize each Braille cell in terms of two
columns of three dots. They had a hard time adapting to the row by row separation of the
Two-Finger method, including those users who had enough vision. The widely known numerical
ordering of the dots, which places dots 1 − 3 on the left column and dots 4 − 6 on a second
column, seems to be creating this problem. Even users who understood the Two-Finger method
conceptually, still had trouble switching to a different dot ordering required by the Two-Finger
method. However, the few participants who familiarized themselves with this method quickly,
found it extremely preferable. This indicates that training is needed for mastering this method
but once learned the method might prove very useful. For this possibly laborious training to be
undertaken by the user though, a sufficient motive should be present. The benefits of the input
method, such as providing one-handed input or an enjoyable game-like approach of teaching
yourself Braille, should outweigh the effort involved.
A part of our design which might need improvement is the fact that a cursor was not showing
up on the screen when using the system. Users who relied on some limited form of vision could not
tell their location easily by listening only to a stream of letters that were passed over when using
the virtual cursor. However, showing a text box with the cursor was considered and tried. It was
found to take up important screen real-estate and make totally blind users tap it accidentally.
As a result, it was hidden by default with the option to turn it back on if required.
83

3.7 Future Work
One user wisely mentioned: “I would think that the letters would start on the left. They should
work in a motion from left to right.” Taking this comment into consideration, We should change
the pattern matching algorithm so that between competing choices of letters, it would prefer
those that have patterns which, when tapped from left to right and from top to bottom more
closely resemble the entered pattern. In other words, make the ordering of the user taps influence
the decision of the matching algorithm.
For all the methods we should add a filter which will use the pressure of the touch to determine
whether it was an accidental or an intentional touch. Also, for some of the methods, touching
with more than one finger and for all the methods double-tapping is not a valid gesture. We
should write filters for each method which would remove such invalid accidental touches in order
to assist users like some participants who did not have the best finger dexterity. To fix this we
should make the software ignore extra touches when the One Finger method is used. Additionally,
users would accidentally tap the same dot more than once without realizing it. Given this, our
system should ignore multiple taps at the same dot for this input method since there would be
no valid Braille pattern which can have one dot pressed twice.
With users who are relatively advanced, their extra confidence would sometimes, especially
for characters with few dots, work against them. It would make them forget to wait for the
entered dots to be interpreted and they would get two patterns of neighboring characters mixed
together. On the contrary, when a character had too many dots, the interpretation interval would
sometimes prove to be too short for them, making the system erroneously break up an entered
pattern into many characters. During the study, an inside on how to tackle this problem came
from another user who gave the One-Finger method a lower score than his successful experience
using it would suggest. This is because of the lack of mastery he felt due to the issues with the
interpretation time-out. He said that he wanted to type as fast or as slow as he wanted to and
that the delay made him lose this control over the software. As a result, an adjustable interval
based on the length of the entered pattern or based on the speed that dots are entered should be
implemented. When a pattern has more dots, the interval should lengthen to give you extra time
to move around the screen and mentally construct the complex pattern. Similarly, when the dots
84

are typed with a faster speed, the interval should shorten itself, to allow for a more experienced
user to complete what he/she is typing without frustration.
Another issue was that users were confused about the maximum height of the input view
as they would originally think that it did not span the whole of the screen but that it only
took up the top part of it. This is because the bottom row of the screen was taken up by the
Android’s default buttons, a fact that made most users feel uncomfortable and lose the sense
of boundaries. Removing these buttons, therefore, should be a top priority, whilst dynamically
resizing the typing view based on the user’s preferred touch area and touch history should also
be considered.
A few users would have desired a more tactile or more personalized set of boundaries than
the current set which were roughly the physical edges of the screen. The current reliance on
the physical screen edges is corroborated by the findings in [41] where it was shown that screen
edges are a site where most visually impaired users perform most of their gestures. From the
interviews as well as the recorded touch data, it is apparent that most visually impaired users
would be better served by an auditory guide which would help them identify the boundaries of
the application’s typing area and the size of the area occupied by each Braille dot. Otherwise
some would accidentally activate extraneous UI elements or lose their orientation.
Most users, when trying to perform a swipe gesture, accidentally do not swipe as fast causing
the screen exploration feature to be activated instead. Taking this into account, we should add
sounds that would indicate that you are exploring the screen, like those present on the iPhone,
which would make it clear when someone is exploring and when they are swiping. This will
“teach” the users what the correct speed sensitivity is.
A top request for us was to implement the full set of the Braille writing system, i.e. ab-
breviated Braille, symbols and Mathematics. Also, many users wanted to be able to control
the amount of information spoken or have additional speech commands, such as to echo each
word upon completion. Adding extra configuration options to our software, however, should be
carefully balanced against the need to maintain intuitiveness, namely that our system should
continue to be easy to learn. Lastly, the need for more editing gestures, such as a Clear All
gesture, was brought up by some of the participants.
85

3.8 Summary
We have proposed four Braille-based text-entry techniques which use the Braille alphabet, one of
which minimizes mistakes through pattern matching of user touches and all of which provide easy
editing through swipe-based cursor manipulations. We have evaluated our system through a user
study which compares our input methods with one another, as well as with an existing numpad-
based technique. We have found that a balanced approach provided by the One-Finger method
which combines ease of use with a relatively good accuracy is most preferable. Other methods,
which either enable a faster typing speed but impose more complicated gestures (Two-Finger
method) or provide the ability to confirm each dot entered but are slower (Split-Tap method),
are too cumbersome to be useful.
As future work, we plan to improve the One-Finger method to make it more resilient to noisy
touches and more adaptive to users’ spatial idiosyncrasies. To achieve this, we are planning to
use an adjustable interpretation interval based both on the length of the entered pattern and on
the speed that dots are entered. We also plan to improve the method’s robustness by dynamically
re-locating the position of each Braille dot away from the current symmetric layout, depending
on the spatial concentration of each user’s touches.
86

Chapter 4
Exchanging Banknotes without
Fear: A Mobile Tool for Reliable
Cash Identification
The ability to correctly and effortlessly exchange cash is fundamental for our everyday needs.
Many simple transactions which are conducted each day, such as buying groceries or dining at
a restaurant, require not only the handing over of paper bills but, more often than not, the
return of some change. Unfortunately, in certain countries, visually impaired individuals cannot
distinguish banknotes of different denominations from one another. In the United States, for
example, dollar bills of different denominations all have the same size, shape, texture and color.
This has been a source of anguish for the visually impaired community, sparking a successful
lawsuit against the government of the United State [37].
Visually impaired people are dependent on the good will, the honesty and kindness of others
to help them organize and recognize their banknotes. Given the central role that money and more
specifically cash plays in our social and professional lives, this dependence on others places the
visually impaired at a stark disadvantage. To overcome this dependence, the visually impaired
have come up with various forms of coping methods which can help them, to an extent, deal with
87

the situation. These practical but often fragile methods include folding some bills in their wallets
while keeping those of other denominations straight, or even storing different denominations in
different pockets. These procedures are easy to mix up and forget, given that they must be
performed with great detail and care every time a new banknote has been received. Relying on
the assistance of others when using inaccessible currencies has become therefore a fact of life for
most visually impaired individuals, robbing them of their independence.
The popularity of smart phones with built-in high-resolution cameras can provide a possible
solution to the currency recognition problem. In this work [67, 64] we propose a software system
which runs on a smart phone and employs the phone’s camera to take a continuous stream
of images of the object placed in front of it. This software analyzes the provided images and
determines whether they depict a dollar bill. If so, the software recognizes the denomination of
the banknote. It subsequently uses synthetic speech to announce the results of its recognition.
The software employs the Scale Invariant Feature Transform (SIFT) [54] for feature extraction
but a faster approach for feature classification so that it can work effectively on the mobile phone.
We evaluated our algorithm using real pictures of bills taken by a visually impaired user through
the phone’s camera.
4.1 Problem Description and Motivation
This section explains in more detail the everyday problem that visually impaired users in some
countries face when handling banknotes. It then outlines the practical challenges that arise when
trying to develop a piece of mobile phone software for identifying such paper currency.
4.1.1 Practical Challenges when Using Paper Bills
In the United States, dollar bills of different denominations all have the same size and so cannot
be easily separated by measuring or comparing one against another. To make things worse, there
are no tactile markings or other forms of identification on each bill to enable a blind person to
discover its value without any sighted assistance. The various engravings or embossed pictures
currently found on such paper bills are too thin and lightweight to be felt by the sense of touch. As
a Federal court noted, “it can no longer be successfully argued that a blind person has ’meaningful
88

access’ to currency if she cannot accurately identify paper money without assistance”, [37].
In 120 other countries, including the countries which have adopted the Euro, paper currency
comes in different sizes, [87]. However, in the European Union, despite the fact that Euro bills
of larger denominations have larger sizes, it might still not be easy to separate them quickly and
effortlessly. Comparing several Euro bills in your hand against one another takes time especially if
a person has low finger dexterity, a difficulty faced by many seniors which are a group representing
the majority of visually impaired individuals, [20]. Also, the difference between the sizes of these
Euro bills might not be as drastic as some individuals would have required. The difference in
width between a 5 Euro bill, for example, which is the smallest in denomination, and a 500 Euro
bill, which is the largest, is only 2 centimeters, [87].
According to [87], paper bills of different denominations around the world do not differ only
in size, but in many countries they also differ by color and tactile markings. Very large numerals
are used in order to assist the partially sighted and certain other population groups whose sight
is diminishing. Using more distinctive colors or larger numerals, however, cannot certainly be of
any use to the totally blind. Countries which have used tactile markings have discovered that
such markings disappear after bills have been in circulation for a while as they tend to wear out
with time and the extensive usage of the bill. Employing a pattern of distinctive holes or cut
corners is undesirable, as this could lessen the lifetime of the bill by allowing it to be more easily
torn. Even though electronic devices which can identify dollar bills are available on the market,
these devices can cost up to $300 and are not always accurate, especially with older or worn
out bills. Meanwhile, visually impaired individuals do not want to carry around with them yet
another specialized gadget just to help them distinguish their paper currency.
While credit cards and other forms of electronic payment are gaining popularity, paper cur-
rency is still widely used, [87], especially for transactions of smaller value. People still carry cash
in their pockets alongside their credit cards, whilst the various efforts to create an electronic
software-based wallet have still to gain any widespread traction. This preference for paper cur-
rency is understandable due to the perceived security, the simplicity and above all the anonymity
that it offers. Unlike other currently available forms of payment, cash is accepted everywhere
and it does not require an electronic connection to any financial network to be valid, whilst using
it does not necessitate giving away any personal information, such as your name.
89

The inability to recognize bills exposes blind individuals to fraud as, for example, it can enable
unscrupulous sellers to hand bills to visually impaired buyers which have much less value than
the correct amount. Such forms of cheating may never be discovered or may be discovered too
late by the visually impaired victim for him or her to be able to take any appropriate action.
4.1.2 Algorithmic Challenges
The reliance of the visually impaired on the assistance of their sighted friends or even on the
untrusted assistance of strangers when handling banknotes, cannot be replaced with a piece of
software which will either work on half of the bills or which will assign the wrong denominations
to banknotes. When waiting to pay on a busy line, the visually impaired users should not be
expected to have to spend a long amount of time for the mobile phone software to be able to
recognize each dollar bill. In addition, other irrelevant objects which happen to be captured
should not be identified as banknotes. Identifying banknotes using mobile phone software can
be, therefore, algorithmically challenging as such software requires a high accuracy and speed.
This extra speed is not guaranteed to be available on a mobile phone given that most advanced
image feature extraction algorithms are computationally hungry.
When a blind user wants to find out the value of a particular piece of currency, he or she
will not be aware of the intensity or even of the availability of a suitable light source. So,
the software should work under various and even under difficult lighting conditions. Similarly,
one cannot expect a visually impaired individual to place the banknote straight in front of the
phone’s camera, removing any other objects, such as furniture, which might happen to be in
the background. No assumptions could be made about which face of the bill would be pointed
towards the camera, or that a specific background, such as a white-colored table surface, would
always be used.
A blind person might not even know the exact location of the camera’s lens and so might
inadvertently position a finger or another protrusion in between the phone and the banknote. It
would be an inconvenience for the user to have to unfold each banknote and position it in a very
specific orientation or with a specific face pointing towards the phone. In fact, the user would
most probably present banknotes to the system which would be folded, rotated with various
90

angles and at various distances from the camera’s lens.
Pictures taken by a visually impaired user might be blurred. This is because, the quality of
the pictures gathered from mobile devices can be highly variable. Some images may be so blurred
that even human recognition would be hard.
In summary, a successful currency recognition algorithm needs to work accurately under
various lighting conditions and even when bills are folded or covered by fingers, i.e. under partial
occlusion, whilst banknotes need to be identified from several angles and distances.
4.2 Related Work
Previous attempts [52, 51, 69, 71] have used very specific and specialized techniques when tackling
the problem of unhindered access to paper currency. However, any specialized technique can be
fragile and hard to port from one type of currency to another. In addition, such techniques suffer
from the fact that they do not take advantage of the vast research in image feature extraction
that took place in the field of computer vision in the last years.
The AdaBoost learning algorithm was used in [52, 51], to train a set of weak classifiers in
order to determine the value of dollar bills. These weak classifiers consisted of a set of specific
pixel pairs on each bill which were picked by the researchers. However, even though this system
works on both faces of the bill, it seems that it still requires the particular face to be exposed
fully to the camera and so would not work on folded bills or bills with distortion. The blind user
would still need to orient each bill and take care where the phone’s camera was being pointed, a
procedure hard to perform when standing in line at a store. In comparison to a robust and well
established image recognition algorithm which can reliably extract distinguishing features from
any image presented, the authors’ procedure of selecting numerous distinct pixel pairs for each
bill cannot easily scale, especially when having to port the system to more currencies of other
countries.
Similarly, in [71], specific regions which contain “characteristic saliencies that differ enough
from one bill to the other” were selected. These characteristic image regions were also rotated
in order to create more training samples which were then fed to an image recognition algorithm.
However, although identifying bills under multiple orientations is very useful to a visually im-
91

paired individual, the distinguishing regions for each bill are still picked by hand and do not
cover the whole of the bill’s surface. In fact, users of the system had to first locate the plastic
strip on each bill before taking a picture of that specific area in order that the recognition would
work.
The idea of finding specific unique characteristics which could easily separate one banknote
from another was taken a step further in [69]. The authors employed an algorithm which would
help the user move the bill until the denomination’s value printed on it would be exposed to the
camera. Asking the user to move the banknote around until a region of interest has been located,
however, can be tedious and time consuming.
Using real humans as a part of the image recognition process was proposed in [90]. In this
work, images are first labeled by using an automatic approach such as a database or an image
search engine and the results are validated in a distributed manner by paid human workers
through Amazon Mechanical Turk. This system can certainly be adapted and used by the
visually impaired to identify their banknotes. However, the use of human workers means that
the users would need to incur at least some financial cost, a fact which can be avoided by
building a completely automatic and high-accuracy currency recognition system which could
also run without any connection to an online service.
4.3 System Design
Our system works by using a set of sample images of dollar bills which are used to train a set
of classification algorithms outlined below 4.3.3. The system parameters are not tuned manually
and it does not rely on any hand-picked distinguishing visual characteristics of bills. Instead a
more robust machine learning approach is followed whereby the training data is used to guide the
algorithm in recognizing similar bills when they are later presented to it by the visually impaired
user.
In this section we describe the algorithms used in our system and our efforts to improve both
the accuracy as well as the efficiency of these algorithms so that they can successfully run on a
mobile phone. We also list all the methods we experimented with, but which were found to yield
low accuracy during this process. The ultimate performance benefits of each of these methods
92

are listed in the next section 4.4.2. First we outline how we pre-process our image samples before
extracting SIFT key-points 4.3.1. This is followed by an explanation of the methods we employ to
encode and aggregate the key-points into feature vectors describing each image 4.3.2. Finally, we
detail the classification algorithms 4.3.3 we employ on the computed features in order to identify
the denomination of unseen bills, including how we determine if an object is a bill or not 4.3.4.
4.3.1 Image Pre-Processing
Our system stores and uses an array of training images for each supported denomination, ($1, $5,
$10 and $20), the collection methodology of which is described in section 4.4.1. Pictures of the
bills to be recognized (the testing data) are captured by a visually impaired user. Each image is
resized to a height of 300 pixels and its width is proportionally scaled. A 200 pixel white border
is added around the image. The effects of the color of the lighting source on the images are
removed using the Gray World Assumption 4.3.1 and each image is turned into grayscale. For
experimentation and to account for image distortions, we optionally create additional artificial
training images by taking the existing images and rotating them through 90, 180 and 270 degrees,
in addition to scaling each one by 0.5 and by 1.5. Finally, an implementation of the SIFT
algorithm is used to extract a collection of key-points for each of the training images 4.3.1.
Fixing Lighting with The Gray World Assumption
As outlined in section 4.1.2, blind users cannot be expected to adjust in any way or even be
aware of the light source available in their environment. However, images captured under lights
with different colors will look much different from one another. Any sample images use to train
our currency recognition algorithm would appear dissimilar from the test samples of the same
denomination, making recognition difficult. This problem whereby the color of the light source
affects the captured image can be remedied using color-balancing algorithms. One such balancing
algorithm uses the Gray World Assumption to remove the effects of the light source, [18]. This
assumption is based on the fact that in any realistic and thus sufficiently diverse scene, we expect
to have a diverse amount of colors and color differences. At a very high and simplistic level, one
could even assume that this variety in colors may average out to the color gray.
93

In our system, we employ the Gray World Assumption on all our banknote images. The
mean value of each red/green/blue (RGB) color component is computed over all the pixels of
each image. These mean values should be equivalent to the values of a uniform gray color for
the image under normal lighting conditions, if the Gray World Assumption holds. A common
gray color for each image is computed by taking the average of the 3 RGB mean values. The
value for the gray color for each image is divided by the mean values for the RGB components
computed above to create a scaling factor for each color component. All pixels are then adjusted
by multiplying each of their color components with the corresponding scaling factor. As a result,
each component is adjusted based on the amount of deviation from the common gray color for
that image.
Employing the SIFT Algorithm
We employ an adaptation of the Scale Invariant Feature Transform (SIFT) algorithm [54] which is
widely used in the vision community for detecting similarities across images. The SIFT algorithm
identifies key-points or descriptors within any image and generates a multi-dimensional feature
vector representation of each key-point. SIFT is an ideal choice since it can be used to perform
robust classification in the face of positional, rotational and scale variants.
Normalization of SIFT Key-Points
Since some classification algorithms expect input features to be scaled similarly, we normalized
SIFT key-point dimensions by subtracting their mean and dividing by their standard deviation.
4.3.2 Aggregating SIFT Key-Points into Feature Vectors
Comparing and classifying the SIFT key-points on a mobile phone might be a time-consuming
process as it potentially involves performing floating-point calculations on thousands of key-point
pairs belonging to the training sample set and the images to be recognized. This might make the
operation slow to the point of being infeasible, since the input data from the phone’s camera will
arrive at a faster speed than it can be processed. However, achieving high classification accuracy
is paramount and it should not be sacrificed for faster performance. This section outlines various
94

methods and heuristics that were employed in order to try and improve classification performance.
The Bag of Words Approach
One way of enhancing performance during classification is to drastically reduce the number of
the SIFT key-points of the training set. In this manner, the number of comparisons between
the training key-points and the testing ones will be much fewer. To achieve this, we employed a
procedure which would select the most representative of the key-points from each denomination
and then transform or encode all the training and testing key-points based on their relationship
to these representatives. This encoding would produce a much smaller set of encoded feature
vectors for each class. This whole methodology is called the Bag of Words Approach, and the
resultant set of representative key-points is called a dictionary. The methods we tested when
creating the dictionary are outlined below, followed by two procedures we tested for encoding all
the key-points using the dictionary.
Using a Random Dictionary
The dictionary is created by picking the set of representative key-points randomly. After provid-
ing the number of entries that the dictionary should contain, key-points are selected randomly
in a uniform manner from all classes from the training image set.
Using K-Means to Build the Dictionary
The K-Means clustering algorithm is used to create a dictionary. The algorithm clusters the
key-points into groups and finds centroids which minimize the intra-group distances of all the
group’s key-points to its centroid. In more detail, a number of representative key-points equal to
the length of the dictionary are first picked randomly as above. We call these selected key-points
the centroids. Then, all key-points compute their Euclidian distance to each centroid and cluster
around the centroid which is closest. Each cluster re-computes its centroid by finding the mean
key-point in the cluster and the process repeats itself until there is no change in the centroids.
The resulting centroids make up the dictionary.
95

Key-Point Encoding
This section details how the original SIFT key-points for each training and each testing image
are aggregated into a smaller set of feature vectors.
• Given a list of representative key-points (the dictionary) we take each key-point from our
training and testing images and we either:
1. Triangle Encoding: Use the Triangle encoding method which finds the Euclidian dis-
tance from all the key-points in the dictionary to the key-point we are encoding and
returns a vector of the distances which are less than the mean distance, whilst setting
the remaining distances to 0, or,
2. Nearest Neighbor entry: We transform each key-point into a vector with 1s for each
dictionary entry which has this key-point as its nearest neighbor when compared with
the remaining dictionary entries.
• We average over a number of the above vectors for each training or testing sample so that
we can return fewer encoded feature vectors than key-points.
4.3.3 Classifying Banknotes
This section details our attempts of achieving high classification accuracy.
Nearest Neighbor
The simplest approach for determining the class of the SIFT key-points or the encoded feature
vectors of the image to be recognized (testing image) is to employ an approach whereby each
encoded feature vector is assigned the class of the closest feature vector in the training set. Firstly,
for all the feature vectors of the testing image, the Euclidian distance, the angle or the Histogram
Similarity is computed to all the feature vectors in the training set. Subsequently, for each testing
feature vector we find the closest training feature vector and note its class. We also take the
distance to the nearest neighbor and invert it in order to create a similarity measure. We keep a
total of all the similarity measures for each class. In order to remove any possible skewing effects
96

that may be created if training classes do not contain the same number of images, we divide
each similarity total with the total number of training feature vectors for that class. For each
testing feature vector we assign the class with the highest similarity total as its denomination
label. A normalized sum of all the similarity measures from all the testing feature vectors which
have been classified to a specific class is then used as the distance measure of the testing image
to that class.
The Histogram Similarity is a similarity measure between two feature vectors computed as
follows:
• The two vectors are compared element-by-element and from each pair the minimum is kept.
• The sum of these minimums gives the Histogram Similarity.
Nearest to Second Nearest Neighbor Ratio
To improve classification accuracy of a testing feature vector, we observe that we would be more
confident to accept the class label of the nearest neighbor in the training feature vectors set
if that nearest neighbor happened to be much closer than any other training feature vector.
Otherwise, if several of the training feature vectors are within a small radius from our testing
feature vector, then the class label of the nearest neighbor cannot be trusted, as any one of
several training feature vectors might have happened to be the closest simply by chance. For
this reason, a classification result for a specific testing feature vector is only accepted if the ratio
between the distance of the nearest and the second nearest neighbor is below a specific threshold.
This threshold has been determined empirically to be 0.85.
Support Vector Machines (SVMs)
Instead of using nearest neighbor to assign class labels to the encoded feature vectors, we could
use a more complex but a mathematically more proven methodology. In its simplest form, a
Support Vector Machine (SVM) tries to compute the best hyperplane which would separate as
accurately as possible the samples of two given classes. In our case, we compute all class pairs
and we train one SVM per pair of classes. For each pair of classes, we take the encoded feature
vectors created above and we train a specific SVM for that class pair which would be able to
97

separate them. Then, when we have computed the encoded feature vectors for our testing images,
each SVM makes a prediction concerning the class to which each encoded feature vector belongs.
The class which has been predicted the most times is the winner.
Breaking the Image into Smaller Patches
To improve classification accuracy another approach was tried whereby all training and testing
images are split up into non-overlapping patches of 13-by-13 pixels. These patches are each
reduced into a feature vector. The patches from the training images, therefore, make up the
training feature set and similarly for the testing images. Then, both nearest neighbor and Kernel
Regression were employed in order to classify the testing images. Unfortunately, the accuracy
was extremely poor so as to discourage us to further investigate this approach.
4.3.4 Determining if the Object is a Banknote
When instructed by a visually impaired user to recognize a banknote, our system takes snapshots
continuously from the phone’s camera which are pre-processed 4.3.1 and are fed into SIFT for key-
point extraction. The extracted key-points from each captured image are then aggregated 4.3.2
into feature vectors and then compared with the feature vectors of the training samples in order to
be classified 4.3.3 according to denomination. The more feature vectors that the system classifies
as belonging to a specific denomination, the higher the confidence that the object currently being
photographed is a banknote of that specific denomination. After a sufficiently high confidence
value has been attained, the system stops taking snapshots and announces, using the phone’s
built-in synthetic speech, the denomination of the recognized banknote. On the other hand, if
the object being captured is not a banknote, the system’s classification confidence will not reach
the required built-in threshold. The system will continue taking snapshots and nothing will be
announced until a banknote is put before the camera.
The classification confidence measure should indicate how similar the image to be recognized is
to a certain currency denomination. For example, if the feature vectors of an image are classified
so that an equal subset of them belongs to each denomination, then there is no way that we
could classify the whole image with certainty and we would want to get a confidence of 0. To
98

do this, we first find a collection of measures each one indicating the distance of the captured
image to each class. This can simply be the ratio of the image’s feature vectors which have been
classified as belonging to each particular denomination. Then we compute 1 minus the entropy
of the above distance measures, which gives as the confidence.
4.4 Evaluation
This section details our evaluation methodology, including how we collected training and testing
images of dollar bills and how each of the classification methods described above performed.
4.4.1 Data Collection
Training data was collected by taking clear and complete pictures of bills through the phone’s
camera under a uniform light source and on a white background. The banknotes used for the
training set were placed on a white sheet of paper and exposed to an electric lamp which shone
from above in an otherwise darkened room. The pictures were taken by the phone’s camera held
at the same angle and distance for all samples. The images were then post-processed to remove
the surrounding white background so as to leave the clear and complete image of the bill on its
own. In total, there were 91 training images used. Of them, 21 were of 1 dollar bills, 28 of 5
dollar bills, 22 of 10 dollar bills and 20 of 20 dollar bills.
All 82 testing samples were captured by a totally blind user using the same phone. Naturally,
these images are full of occlusions and may be blurred. The user was asked to take pictures,
one bill at a time, in any way he deemed desirable. Thus, many of the testing samples contain
partial and distorted images of banknotes, in addition to pictures of the users fingers and of the
background furniture embedded in them, 4.1. The user was also asked to randomly move about
in the room while he was taking the pictures.
More specifically, from the 82 testing images captured, 17 were of 1 dollar bills, 28 of 5 dollar
bills, 17 of 10 dollar bills and 20 of 20 dollar bills. The above counts also include pictures of the
same banknotes capture from a different angle/distance by the blind user.
99

Figure 4.1: Incomplete but clear images
Classification method Accuracy Speed
textbfNearest neighbor 71.6% 2.29 secs
Nearest to second nearest neighbor heuristic 93.83% 2.2 secs
Random dictionary 20.99% 3.94 secs
K-Means 20.98% 5.5 secs
SVM 17.28% 2.22 secs
Table 4.1: Accuracy and speed of each key-point classification method
4.4.2 Results for each Classification Approach
In section 4.3.3 we have described various methods of accurately classifying the SIFT key-points
computed from each testing image. Optionally, these methods could be employed after aggregat-
ing or encoding the set of training SIFT key-points in an effort to speed up our system 4.3.2. The
following table 4.1 shows the accuracy of each classification method along with the time taken to
classify each testing banknote image. For the first two methods (Nearest Neighbor and Nearest
to Second Nearest Neighbor), the SIFT key-points were used without any encoding. For the
next two results presented, a dictionary of 500 entries was created using both the Random and
the K-Means approaches on which the Nearest to Second Nearest Neighbor classification method
was subsequently run. Finally, a dictionary of 50 entries was used with the SVM method. The
encoding of the SIFT key-points using the above dictionaries was performed with the Nearest
Neighbor entry method.
From the above table 4.1, we can conclude that the two nearest neighbor approaches, when
used on the original SIFT key-points, are much more accurate than any of the approaches which
use a dictionary. In fact, even though the number of comparisons performed by both the nearest
neighbor algorithms between pairs of training and testing SIFT key-points is much larger than the
100
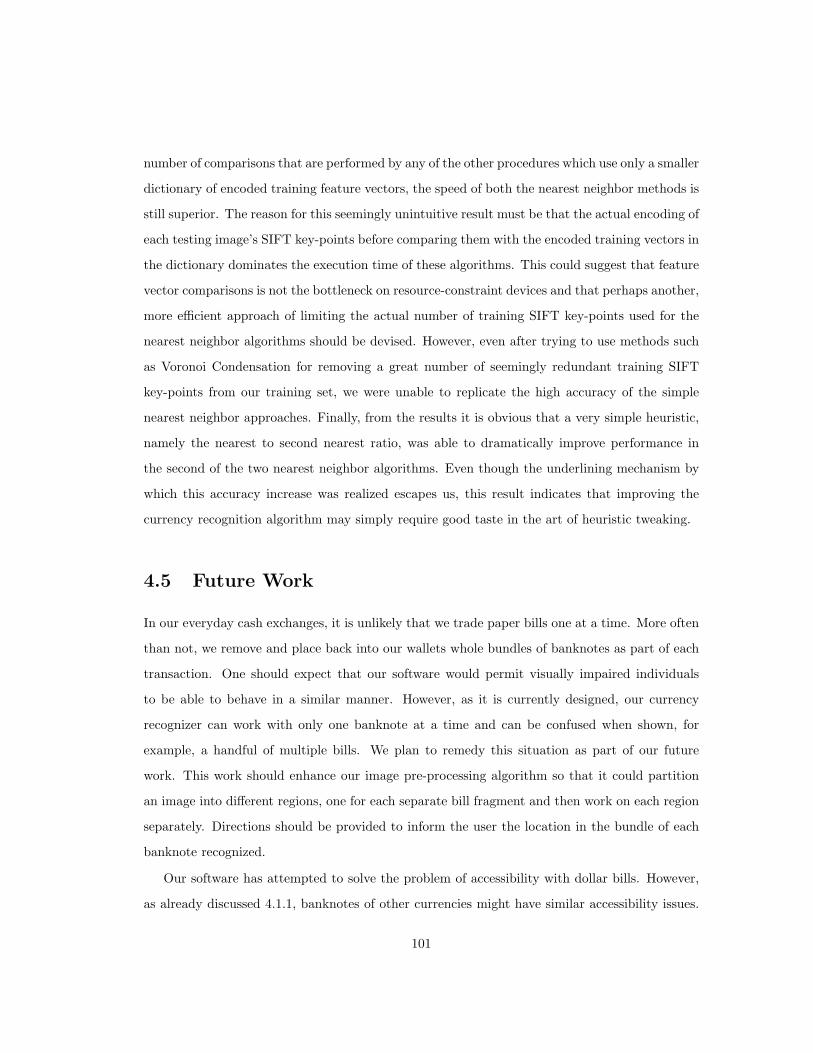
number of comparisons that are performed by any of the other procedures which use only a smaller
dictionary of encoded training feature vectors, the speed of both the nearest neighbor methods is
still superior. The reason for this seemingly unintuitive result must be that the actual encoding of
each testing image’s SIFT key-points before comparing them with the encoded training vectors in
the dictionary dominates the execution time of these algorithms. This could suggest that feature
vector comparisons is not the bottleneck on resource-constraint devices and that perhaps another,
more efficient approach of limiting the actual number of training SIFT key-points used for the
nearest neighbor algorithms should be devised. However, even after trying to use methods such
as Voronoi Condensation for removing a great number of seemingly redundant training SIFT
key-points from our training set, we were unable to replicate the high accuracy of the simple
nearest neighbor approaches. Finally, from the results it is obvious that a very simple heuristic,
namely the nearest to second nearest ratio, was able to dramatically improve performance in
the second of the two nearest neighbor algorithms. Even though the underlining mechanism by
which this accuracy increase was realized escapes us, this result indicates that improving the
currency recognition algorithm may simply require good taste in the art of heuristic tweaking.
4.5 Future Work
In our everyday cash exchanges, it is unlikely that we trade paper bills one at a time. More often
than not, we remove and place back into our wallets whole bundles of banknotes as part of each
transaction. One should expect that our software would permit visually impaired individuals
to be able to behave in a similar manner. However, as it is currently designed, our currency
recognizer can work with only one banknote at a time and can be confused when shown, for
example, a handful of multiple bills. We plan to remedy this situation as part of our future
work. This work should enhance our image pre-processing algorithm so that it could partition
an image into different regions, one for each separate bill fragment and then work on each region
separately. Directions should be provided to inform the user the location in the bundle of each
banknote recognized.
Our software has attempted to solve the problem of accessibility with dollar bills. However,
as already discussed 4.1.1, banknotes of other currencies might have similar accessibility issues.
101

It would be hard, however, for any software developer to create a mobile phone-based system
which would be designed and tested to work with all the diverse currencies around the world.
We aim to allow users to be able to train the system to recognize arbitrary bills, such as those
of any foreign currency, by themselves. This would involve the software asking the user for some
training samples for each denomination from the specific currency. These samples would be
provided under a more controlled environment concerning lighting conditions and the banknotes’
orientation. The system would guide the user in creating this training environment and would
evaluate the quality of the training samples provided accordingly. The system would then process
the sample images, remove noise and train itself to recognize the new currency.
4.6 Summary
We have presented the design, implementation and evaluation of a mobile currency recognition
system that provides high detection accuracy for visually impaired users. In our limited sample
set, our algorithm exhibited good classification accuracy with high confidence for images that
were clear and properly taken even if the currency bill was folded, incomplete or had orientation
and rotation effects.
102
Chapter 5
Choosing which Clothes to Wear
Confidently: A Tool for Pattern
Matching
Being dressed in a socially acceptable combination of clothes is extremely important in a modern
society. Wearing clothes that match in color or design with one another is, to some degree,
considered common sense. Visually impaired persons, however, have difficulty matching their
clothes as they cannot readily identify their color or visual design patterns. To solve this prob-
lem, some visually impaired people rely on the help of their family or friends who help them
either organize their wardrobes by placing sets of matching clothes in the same pile, or tag each
matching set of clothes with a unique tactile marker or Braille label. However, establishing an
organizational structure in one’s wardrobe is fragile and extremely tedious, as the same procedure
has to be repeated after each time a piece of clothing has been worn. For this reason, many blind
people prefer to buy only plain clothes which are of similar colors and which feature no salient
design patterns. Even though according to [9], blind individuals are primarily interested in how
their clothes feel, they also do not want to neglect their appearance. Some blind people in fact
associate popular colors with certain meanings, e.g. red with fire [9].
103

Electronic devices which are able to recognize and provide the color of any object using audio
feedback exist on the market [88]. However, even in cases where other means of color identification
are available, such as electronic color detectors and the already mentioned tactile markers, blind
people lack the sensory experience to know if a color combination matches. Training oneself to
memorize which colors match and which do not can certainly be a solution, but it is hard to
achieve fully given the vast number of color-combinations. This work [68] does not fully solve
the clothes matching problem but makes preliminary progress by attempting to identify whether
samples of shirt/tie pairs match. We employ and then evaluating the accuracy of three standard
machine learning algorithms: Ridge regression, a standard neural network and a Siamese Neural
Network.
5.1 Previous Work
A set of RFID tags were attached to each piece of clothing in [77] for identification purposes.
Information about the clothes was also stored in an online database which employed fashion
experts to classify them. The RFID tags could be read by a handheld system which would help
the visually impaired user find matching clothes by using information in the online database.
Similarly, a set of RFID tags were also used in [43] where a system was built to propose matching
clothes to its users based on the individual’s personal style, the current weather conditions and
the individual’s daily schedule.
Some research work to determine which sets of colors are visually compatible with one another
based on human preferences was undertaken in [61]. The researchers first attempted to find out
whether certain theories of human color preferences can be validated using three large online
datasets. Then, they created feature models which could predict the visual compatibility of any
set of five colors and which could also improve such a set of colors to make it more aesthetically
pleasing. Work specifically targeting the visually impaired was described in [94, 81], where a
clothes-matching system algorithmically analyzes pairs of images of clothes, both for matching
colors and for similar texture patterns. To identify matching colors, a color histogram is created
for each image containing only the dominant colors detected on that image. This dominant color
set is subsequently used in conjunction with an edge detection algorithm in order to find which
104

edges on each image are surrounded by different dominant colors, i.e. they form part of a texture
pattern. Radon transforms are then used to determine how much to turn each of the two images
so that the detected texture patterns have a similar orientation, whilst histogram equalizations
are performed to fix changes due to lighting. Wavelet features and Gray co-occurrence matrices
are finally employed to compare the detected textures from each image and statistically determine
whether the two images match. At the same time, design patterns on clothing can be classified
with the algorithm proposed in [91] by combining both structural and statistical features from
wavelet subbands using a confidence margin. Clothes can then be characterized as stripe, lattice,
special or patternless. Finally, a method for identifying suits in images of people has been
proposed in [30] where a set of suitable color and shape features are described for this purpose.
5.2 Methodology
This section describes how we collected our sample images of shirts and ties, in addition to the
learning algorithms we used for classifying them.
5.2.1 Sampling
A total of 41 pairs of images of shirts and matching ties were collected from several clothing
websites. 74 x 74 pixel patches were extracted from the front of each shirt and center of each
tie 5.1. For our sample set, each pair was included together with a label indicating that they
match. Also, non-matching pairs were artificially created by pairing each shirt and each tie with
itself, creating a total of 82 non-matching pairs 5.3. In total there were 123 samples in our
training/testing set. However, other pairings were also tried, such as the all possible pairings.
For the results reported here we chose to go with the simpler approach, as our pairs labeled
“non-matching” are certainly so, a fact which cannot be reliably claimed for the non-matching
pairs of the all pairs set. This is because many ties can match with one shirt, making some of
the “non-matching” labels in the all-pairs set invalid 5.2.
105

Shirt Matching Tie
Figure 5.1: A matching pair of shirts and ties
Shirt Matching Tie
Figure 5.2: The same shirt matches with more than one tie
Shirt Non-Matching Tie
Figure 5.3: Non-matching pairs of shirts and ties
106

5.2.2 Data Preparation
Each image was used to create a color histogram. The histogram was created by dividing the 3-
dimensional color space of red, green and blue into a configurable number of equal bins (we tried
experimenting with 8*8*8, 4*4*4 and 2*2*2 bins) and by determining in which bin each pixel
falls. This was carried out after the luminance of each image was factored out by normalizing it.
Each bin was normalized by dividing with the total number of pixels. Unnormalized histograms
were also tried but attained worse performance. The color histograms of each matching pair
and non-matching pair, chosen above, were then concatenated into one feature vector and a
corresponding label of +1 or 0 was attached.
5.2.3 Learning Algorithms
The following learning approaches were tried in order to classify the computed feature vectors:
• Ridge Regression: This algorithm attempts to calculate the vector of weights which would
return for each seen data point its corresponding score. In addition, the penalty term tries
to minimize the norm of the weight vector to produce more stable solutions. Although
regression is not a classification algorithm, its output can be thresholded to get a classifi-
cation label. In our case, we set the threshold at 0.5 and so if regression returns a value
which is less than 0.5 it receives the 0 (not a match) label and if greater than 0.5 it receives
the 1 (a match) label.
• Standard neural network: A network with two hidden layers is trained using either stochas-
tic or batch training, using the Sigmoid as its activation function.
• Siamese Neural Network: The Siamese Neural Network which is described in [27], is imple-
mented as follows:
1. Two sets of outputs for each layer are stored each one corresponding to one of the two
samples in the given training pair.
2. The loss function is set to the derivative of a hinge loss function, which aims to make
the distance between outputs smaller when the pair of images matches but which tries
107

to make the distance large, but only up to a threshold, when they do not.
3. Uses the same error for the output layer for both images, but reverses the sign of the
error for the second image.
5.3 Results
The following table 5.1 shows the regression and the 10-fold cross-validated classification errors
for the two of our three approaches (regression and standard) neural network, together with the
type one and type two errors, i.e. false-positives over (true-positives + false-positives) for the
type one error and false-negatives over (true-negatives + false-negatives) for the type two error.
The Siamese Neural Network was tried with 10 output and 10 and 100 hidden neurons but
produced very bad results, (classification error = 23 ). This is because, as our inputs are structured,
the non-matching pairs are made up of two images that are the same in order to give the standard
network the most negative samples that it can get. However, it is impossible for a Siamese Neural
Network to identify the distance between two identical images, as by definition of this algorithm
the distance should be 0. More experimentation is clearly needed by providing pairs which
visually do not match but this is left for a future work. In addition, the matchings are not
symmetric, meaning that a shirt might match with many ties but not the other way round. A
suitable solution perhaps was to add an extra dimension to the input to identify if a sample is a
tie or a shirt.
Ten hidden neurons were also found sufficient for the standard neural network in addition to
a learning rate value of 0.1, with a binning of 4 for the color histogram as other values did not
change the 10-fold cross-validation regression error substantially. The stopping condition for the
cross-validation was 0.00001.
The regression error is calculated by taking the Frobenius norm of the difference between
the expected and actual outputs for each data point and averaging over all points and over all
cross-validation folds.
108

Algorithm Regression Error Classification Error Type1 Error Type2 Error
Regression 0.704427 0.175 0.3 0.11253
Neural 0.0955543 0.05 0.125 0.0125
Table 5.1: Performance of learning algorithms
5.4 Summary
In summary, given a sample of 41 pairs of shirts and corresponding matching ties of 74 pixels
squared and using a color-histogram of 8 bins, we have shown that with Ridge Regression we can
achieve a 10-fold cross-validation classification error of 0.175, with a standard neural network
with 10 hidden neurons a 10-fold cross-validation classification error of 0.05 and with a Siamese
neural network an accuracy of only 0.33.
From the above results, it appears that the standard neural network exhibits a superior per-
formance over the Ridge Regression algorithm in this particular problem setting. However, more
work is needed, especially in finding more samples for other types of clothes, in order to evaluate
these algorithms more successfully and develop a more holistic solution to the clothes-matching
problem. Symmetric matching pairs should be found in order to deploy the already designed
Siamese Neural Network effectively. More importantly, our algorithm should be enhanced to
take into consideration other characteristics of the clothes, such as their texture or their design
patterns. The above will necessitate a user study to discover how humans actually distinguish
between sets of clothes that match and sets that do not.
109

Conclusion
We have outlined the development of four mobile applications that can assist the visually impaired
in their everyday lives. The problems that these applications have tried to solve are essential issues
which continue to plague the blind community. The first has attempted to push the envelope
on the important issue of unhindered mobility by demonstrating an indoor navigational system.
The second has enhanced the accessibility of modern communication devices by proposing several
methods of text input on touch screens. The third, by contributing to the solution of the currency
recognition problem, has endeavored to remove some of the obstacles encountered by the visually
impaired when accessing printed information. Meanwhile, assisting in overcoming one of the
most frequent of daily needs has been the goal of the last application for clothes-matching. Our
extensive testing has proven the practical usefulness of our applications in daily scenarios.
The main contributions of our navigation system are an algorithm creating a user-trained
topological map for navigation instead of using a pre-developed floor map, as well as an algorithm
for counting the user’s steps. For the mobile Brailler system, our user study has resulted in a
number of important findings, chief of which are the fact that visually impaired users would prefer
an intuitive but potentially more inaccurate spatial method for entering Braille, instead of a more
complex but stationary one, or a slower but more accurate one. Lastly, with both our currency
recognizer and our clothes-matching attempts, we have demonstrated that off-the-shelf feature-
extraction and machine learning approaches can be combined in a new way to create assistive
software in the field of computer vision. Most importantly, we believe that these applications
together provide a suite of important mobile accessibility tools to enhance four critical aspects of
a day-to-day routine of a visually impaired user: to navigate easily, to type easily, to recognize
110

currency bills (for payments) and to identify matching clothes.
In addition to a single overarching goal which is to enhance the daily lives of visually impaired
individuals, there is another important factor which unifies the above four applications. This is
the fact that all four of these applications take advantage of a single device: the mobile phone.
As already discussed, this device has attained unparalleled popularity due to the widespread
communication needs of our society which it can so efficiently meet. It has also acquired a rich
development platform whose growth has been fueled by this popularity. The fact that we have
built four separate assistive solutions which run on this widespread platform is not accidental.
It was an experiment to determine both the platform’s ability to support such demanding appli-
cations and a test of the potential acceptance of these applications within the community of the
visually impaired. As this work has demonstrated through our user studies, applications which
run on smart phones are met with enthusiasm by the visually impaired, due to their portability
and social acceptance. This result indicates that when accessibility aids are attached onto main-
stream platforms instead of on specialized devices, they can quickly attain a larger and dedicated
user-base, finding their way into many more hands which are eager to provide feedback and assist
in their further development. This does not in any way mean that specialized devices do not
have their uses and cannot offer their own differentiated affordances which could make them at-
tractive in some situations. However, attaching an accessibility aid to a mainstream device, and
especially to the mobile phone, is not only expedient from a marketing point of view. It can also
open the way to such assistive applications becoming part of the phone’s platform, if popularity
demands it. Indeed, by building popular momentum behind assistive solutions, they can in turn
“infect” popular software, making it more accessible and usable by all. Thus, accessibility would
be regarded as a feature of all software, instead of an add-on required only by the few. In fact,
adding accessibility features to all software would make it more flexible, enabling it to cater to
the needs of all its users, regardless whether they identify themselves as having a disability or
not.
111

Bibliography
[1] M. Azizyan, I. Constandache, and R. Roy Choudhury. Surroundsense: mobile phone localiza-
tion via ambience fingerprinting. In Proceedings of the 15th annual international conference
on Mobile computing and networking, pages 261–272. ACM, 2009.
[2] A. Barry, B. Fisher, and M. Chang. A long-duration study of user-trained 802.11 localization.
In Proceedings of the 2nd international conference on Mobile entity localization and tracking
in GPS-less environments, pages 197–212. Springer-Verlag, 2009.
[3] R. Battiti, T. Nhat, and A. Villani. Location-aware computing: a neural network model
for determining location in wireless LANs. Universita degli Studi di Trento, Tech. Rep.
DIT-0083, Feb, 2002.
[4] M. Berna, B. Sellner, B. Lisien, S. Thrun, G. Gordon, and F. Pfenning. A learning algorithm
for localizing people based on wireless signal strength that uses labeled and unlabeled data.
In International Joint Conference on Artificial Intelligence, volume 18, pages 1427–1428.
Citeseer, 2003.
[5] J. Bickenbach. The world report on disability. Disability & Society, 26(5):655–658, 2011.
[6] B. Blasch and K. Stuckey. Accessibility and mobility of persons who are visually impaired:
A historical analysis. Journal of Visual Impairment & Blindness (JVIB), 89(05), 1995.
[7] M. Bonner, J. Brudvik, G. Abowd, and W. Edwards. No-Look Notes: Accessible eyes-free
multi-touch text entry. Pervasive Computing, pages 409–426, 2010.
112

[8] M. Brunato and R. Battiti. Statistical learning theory for location fingerprinting in wireless
LANs. Computer Networks, 47(6):825–845, 2005.
[9] M. Burton. Fashion for the blind: a study of perspectives. In The proceedings of the 13th
international ACM SIGACCESS conference on Computers and accessibility, pages 315–316.
ACM, 2011.
[10] R. Chandra, J. Padhye, A. Wolman, and B. Zill. A location-based management system
for enterprise wireless LANs. In Fourth Symposium on Networked Systems Design and
Implementation (NSDI), 2007.
[11] K. Chintalapudi, A. Padmanabha Iyer, and V. Padmanabhan. Indoor localization with-
out the pain. In Proceedings of the sixteenth annual international conference on Mobile
computing and networking, pages 173–184. ACM, 2010.
[12] M. Cho, K. Park, S. Hong, J. Jeon, S. Lee, H. Choi, and H. Choi. A pair of Braille-based
chord gloves. In Wearable Computers, 2002.(ISWC 2002). Proceedings. Sixth International
Symposium on, pages 154–155. IEEE, 2002.
[13] A. Crudden and L. McBroom. Barriers to employment: A survey of employed persons who
are visually impaired. Journal of Visual Impairment and Blindness, 93:341–350, 1999.
[14] K. Dufkova, J. Le Boudec, L. Kencl, and M. Bjelica. Predicting user-cell association in
cellular networks from tracked data. Mobile Entity Localization and Tracking in GPS-less
Environnments, pages 19–33, 2009.
[15] C. Factory. Introducing Mobile Speak. http://www.codefactory.es/en/products.asp?
id=316, April 2012.
[16] H. Fard and B. Chuangjun. Braille-based text input for multi-touch screen mobile phones.
2011.
[17] A. Ferscha, W. Beer, and W. Narzt. Location awareness in community wireless LANs.
In Proceedings of the Informatik 2001: Workshop on Mobile internet based services and
information logistics, September 2001. Citeseer, 2001.
113
[18] G. Finlayson and E. Trezzi. Shades of gray and colour constancy. In IS&T/SID Twelfth
Color Imaging Conference, pages 37–41, 2004.
[19] P. Foo, W. Warren, A. Duchon, and M. Tarr. Do Humans Integrate Routes Into a Cognitive
Map? Map-Versus Landmark-Based Navigation of Novel Shortcuts. Journal of Experimental
Psychology: Learning, Memory, and Cognition, 31(2):195, 2005.
[20] V. for the Blind and V. Impaired. Quick Facts — VISIONS/Services for the Blind and
Visually Impaired. http://www.visionsvcb.org/statistics.html, December 2010.
[21] D. Fox, J. Hightower, L. Liao, D. Schulz, and G. Borriello. Bayesian filtering for location
estimation. IEEE Pervasive Computing, pages 24–33, 2003.
[22] I. Freedom Scientific. Jaws screen reading software by freedom scientific. http://www.
freedomscientific.com/products/fs/jaws-product-page.asp, April 2012.
[23] B. Frey, C. Southern, and M. Romero. Brailletouch: mobile texting for the visually impaired.
Universal Access in Human-Computer Interaction. Context Diversity, pages 19–25, 2011.
[24] E. Gerber. The benefits of and barriers to computer use for individuals who are visually
impaired. Journal of Visual Impairment & Blindness, 97(0), 2003.
[25] R. Group. Eureka a4 braille computer and personal organizer. http://www.sensorytools.
com/eureka.htm, April 2012.
[26] T. Guerreiro, P. Lagoa, H. Nicolau, P. Santana, and J. Jorge. Mobile text-entry models
for people with disabilities. In Proceedings of the 15th European conference on Cognitive
ergonomics: the ergonomics of cool interaction, page 39. ACM, 2008.
[27] R. Hadsell, S. Chopra, and Y. LeCun. Dimensionality reduction by learning an invariant
mapping. In Computer vision and pattern recognition, 2006 IEEE computer society confer-
ence on, volume 2, pages 1735–1742. IEEE, 2006.
[28] A. Haeberlen, E. Flannery, A. Ladd, A. Rudys, D. Wallach, and L. Kavraki. Practical
robust localization over large-scale 802.11 wireless networks. In Proceedings of the 10th
114

annual international conference on Mobile computing and networking, pages 70–84. ACM,
2004.
[29] J. Hightower and G. Borriello. Particle filters for location estimation in ubiquitous comput-
ing: A case study. UbiComp 2004: Ubiquitous Computing, pages 88–106, 2004.
[30] L. Huang, T. Xia, Y. Zhang, and S. Lin. Finding suits in images of people. Advances in
Multimedia Modeling, pages 485–494, 2012.
[31] Y. Huang, H. Zheng, C. Nugent, P. McCullagh, S. McDonough, M. Tully, and S. Connor. Ac-
tivity monitoring using an intelligent mobile phone: a validation study. In Proceedings of the
3rd International Conference on PErvasive Technologies Related to Assistive Environments,
pages 1–6. ACM, 2010.
[32] A. Hub, J. Diepstraten, and T. Ertl. Design and development of an indoor navigation and
object identification system for the blind. ACM SIGACCESS Accessibility and Computing,
(77-78):147–152, 2003.
[33] A. Inc. Apple - Accessibility - Voiceover - In Depth. http://www.apple.com/
accessibility/voiceover/, June 2011.
[34] A. Ingenuity. Braille embossers. http://www.accessingenuity.com/products/vision/
braille-embossers, April 2012.
[35] C. Jacquet, Y. Bourda, and Y. Bellik. A context-aware locomotion assistance device for the
blind. People and Computers XVIIIDesign for Life, pages 315–328, 2005.
[36] C. Jernigan, C. Bayley, J. Lin, and C. Wright. Locale. http://people.csail.mit.edu/
hal/mobile-apps-spring-08/, May 2008.
[37] R. J. U. S. D. Judge. American Council Of The Blind, et al., Plaintiffs, v.Henry M. Paulson,
Jr., Secretary of the Treasury Defendant. Civil Action No. 02-0864 (JR). http://www.
dcd.uscourts.gov/opinions/2006/2002-CV-0864∼12:3:41∼12-1-2006-a.pdf, Novem-
ber 2006.
115

[38] S. Kane, J. Bigham, and J. Wobbrock. Slide rule: making mobile touch screens accessible
to blind people using multi-touch interaction techniques. In Proceedings of the 10th inter-
national ACM SIGACCESS conference on Computers and accessibility, pages 73–80. ACM,
2008.
[39] S. Kane, C. Jayant, J. Wobbrock, and R. Ladner. Freedom to roam: a study of mobile device
adoption and accessibility for people with visual and motor disabilities. In Proceedings of
the 11th international ACM SIGACCESS conference on Computers and accessibility, pages
115–122. ACM, 2009.
[40] S. Kane, M. Morris, A. Perkins, D. Wigdor, R. Ladner, and J. Wobbrock. Access overlays:
improving non-visual access to large touch screens for blind users. In Proceedings of the 24th
annual ACM symposium on User interface software and technology, pages 273–282. ACM,
2011.
[41] S. Kane, J. Wobbrock, and R. Ladner. Usable gestures for blind people: understanding
preference and performance. In Proceedings of the 2011 annual conference on Human factors
in computing systems, pages 413–422. ACM, 2011.
[42] D. Kim, Y. Kim, D. Estrin, and M. Srivastava. SensLoc: sensing everyday places and paths
using less energy. In Proceedings of the 8th ACM Conference on Embedded Networked Sensor
Systems, pages 43–56. ACM, 2010.
[43] S. Kim. Integration of environmental contexts and personal factors for coordinating gar-
ments: an environmental user interface paradigm to enrich user interactions. In Proceedings
of the 47th Annual Southeast Regional Conference, page 59. ACM, 2009.
[44] F. Koestler. The unseen minority: A social history of blindness in the United States. Amer
Foundation for the Blind, 2004.
[45] V. Kulyukin, C. Gharpure, P. Sute, N. De Graw, J. Nicholson, and S. Pavithran. A robotic
wayfinding system for the visually impaired. In PROCEEDINGS OF THE NATIONAL
CONFERENCE ON ARTIFICIAL INTELLIGENCE, pages 864–869. Menlo Park, CA;
Cambridge, MA; London; AAAI Press; MIT Press; 1999, 2004.
116

[46] A. Ladd, K. Bekris, G. Marceau, A. Rudys, D. Wallach, and L. Kavraki. Using wireless
ethernet for localization. In Intelligent Robots and Systems, 2002. IEEE/RSJ International
Conference on, volume 1, pages 402–408. IEEE, 2002.
[47] A. Ladd, K. Berkis, A. Rudys, L. Kavraki, and D. Wallach. Robotics-based location sensing
using wireless ethernet. Wireless Networks, 11(1-2):189–204, 2005.
[48] B. Li, A. Dempster, C. Rizos, and J. Barnes. Hybrid method for localization using WLAN.
In Spatial Sciences Conference, pages 341–350. Citeseer, 2005.
[49] R. Libby. A Simple Method for Reliable Footstep Detection in Embedded Sensor Platforms,
2009.
[50] H. Liu, H. Darabi, P. Banerjee, and J. Liu. Survey of wireless indoor positioning techniques
and systems. Systems, Man, and Cybernetics, Part C: Applications and Reviews, IEEE
Transactions on, 37(6):1067–1080, 2007.
[51] X. Liu. A camera phone based currency reader for the visually impaired. In Proceedings of
the 10th international ACM SIGACCESS conference on Computers and accessibility, pages
305–306. ACM, 2008.
[52] X. Liu, D. Doermann, and H. Li. Mobile visual aid tools for users with visual impairments.
Mobile Multimedia Processing, pages 21–36, 2010.
[53] J. Loomis, R. Golledge, and R. Klatzky. Navigation system for the blind: Auditory display
modes and guidance. Presence, 7(2):193–203, 1998.
[54] D. Lowe. Distinctive image features from scale-invariant keypoints. International journal of
computer vision, 60(2):91–110, 2004.
[55] Q. Mary. Indoor Location and Orientation Determination for Wireless Personal Area Net-
works. In Mobile Entity Localization and Tracking in GPS-less Environnments: Second
International Workshop, MELT 2009, Orlando, FL, USA, September 30, 2009, Proceedings,
page 91. Springer, 2009.
117

[56] S. Mascetti, C. Bernareggi, and M. Belotti. Typeinbraille: a braille-based typing application
for touchscreen devices. In The proceedings of the 13th international ACM SIGACCESS
conference on Computers and accessibility, pages 295–296. ACM, 2011.
[57] M. Mladenov and M. Mock. A step counter service for java-enabled devices using a built-in
accelerometer. In Proceedings of the 1st International Workshop on Context-Aware Mid-
dleware and Services: affiliated with the 4th International Conference on Communication
System Software and Middleware (COMSWARE 2009), pages 1–5. ACM, 2009.
[58] K. Muthukrishnan, B. van der Zwaag, and P. Havinga. Inferring motion and location using
WLAN RSSI. In Proceedings of the 2nd international conference on Mobile entity localization
and tracking in GPS-less environments, pages 163–182. Springer-Verlag, 2009.
[59] D. Niculescu and B. Nath. Ad hoc positioning system (APS) using AOA. In INFOCOM
2003. Twenty-Second Annual Joint Conference of the IEEE Computer and Communications.
IEEE Societies, volume 3, pages 1734–1743. Ieee, 2003.
[60] M. Ocana, L. Bergasa, and M. Sotelo. Robust navigation indoor using wifi localization. In
Proceedings of the 10th IEEE International Conference on Methods and Models in Automa-
tion and Robotics, pages 851–856.
[61] P. O’Donovan, A. Agarwala, and A. Hertzmann. Color compatibility from large datasets.
In ACM Transactions on Graphics (TOG), volume 30, page 63. ACM, 2011.
[62] J. Oliveira, T. Guerreiro, H. Nicolau, J. Jorge, and D. Goncalves. Blind people and mobile
touch-based text-entry: acknowledging the need for different flavors. In The proceedings of
the 13th international ACM SIGACCESS conference on Computers and accessibility, pages
179–186. ACM, 2011.
[63] V. Padmanabhan and V. Bahl. RADAR: An in-building RF-based user location and tracking
system. In Proceedings of IEEE INFOCOM, volume 2, pages 775–784, 2000.
[64] N. Paisios, A. Rubinsteyn, and L. Subramanian. Exchanging cash with no fear: A fast
mobile money reader for the blind. In Workshop on Frontiers in Accessibility for Pervasive
Computing. ACM, 2012.
118

[65] N. Paisios, A. Rubinsteyn, and L. Subramanian. Mobile brailler: Making touch-screen typing
accessible to visually impaired users. In Workshop on Frontiers in Accessibility for Pervasive
Computing. ACM, 2012.
[66] N. Paisios, A. Rubinsteyn, L. Subramanian, M. Tierney, and V. Vyas. Tracking indoor
location and motion for navigational assistance. In Proceedings of the 24th annual ACM
symposium adjunct on User interface software and technology, pages 83–84. ACM, 2011.
[67] N. Paisios, A. Rubinsteyn, V. Vyas, and L. Subramanian. Recognizing currency bills using
a mobile phone: an assistive aid for the visually impaired. In Proceedings of the 24th annual
ACM symposium adjunct on User interface software and technology, pages 19–20. ACM,
2011.
[68] N. Paisios, L. Subramanian, and A. Rubinsteyn. Choosing which clothes to wear confidently:
A tool for pattern matching. In Workshop on Frontiers in Accessibility for Pervasive Com-
puting. ACM, 2012.
[69] S. Papastavrou, D. Hadjiachilleos, and G. Stylianou. Blind-folded recognition of bank notes
on the mobile phone. In ACM SIGGRAPH 2010 Posters, page 68. ACM, 2010.
[70] J. Park, B. Charrow, D. Curtis, J. Battat, E. Minkov, J. Hicks, S. Teller, and J. Ledlie.
Growing an organic indoor location system. In Proceedings of the 8th international confer-
ence on Mobile systems, applications, and services, pages 271–284. ACM, 2010.
[71] R. Parlouar, F. Dramas, M. Mace, and C. Jouffrais. Assistive device for the blind based
on object recognition: an application to identify currency bills. In Proceedings of the 11th
international ACM SIGACCESS conference on Computers and accessibility, pages 227–228.
ACM, 2009.
[72] K. Perlin. Quikwriting: continuous stylus-based text entry. In Proceedings of the 11th annual
ACM symposium on User interface software and technology, pages 215–216. ACM, 1998.
[73] H. Phtiaka. Special kids for special treatment?, or, How special do you need to be to find
yourself in a special school? Routledge, 1997.
119
[74] N. Priyantha, A. Chakraborty, and H. Balakrishnan. The cricket location-support system. In
Proceedings of the 6th annual international conference on Mobile computing and networking,
pages 32–43. ACM, 2000.
[75] L. Ran, S. Helal, and S. Moore. Drishti: an integrated indoor/outdoor blind navigation
system and service. 2004.
[76] M. Romero, B. Frey, C. Southern, and G. Abowd. Brailletouch: designing a mobile eyes-free
soft keyboard. In Proceedings of the 13th International Conference on Human Computer
Interaction with Mobile Devices and Services, pages 707–709. ACM, 2011.
[77] J. Rose. Closet buddy: dressing the visually impaired. In Proceedings of the 44th annual
Southeast regional conference, pages 611–615. ACM, 2006.
[78] J. Sanchez and F. Aguayo. Mobile messenger for the blind. In Proceedings of the 9th
conference on User interfaces for all, pages 369–385. Springer-Verlag, 2006.
[79] P. Tao, A. Rudys, A. Ladd, and D. Wallach. Wireless LAN location-sensing for security
applications. In Proceedings of the 2nd ACM workshop on Wireless security, pages 11–20.
ACM, 2003.
[80] S. Thrun and M. Montemerlo. The graph SLAM algorithm with applications to large-scale
mapping of urban structures. The International Journal of Robotics Research, 25(5-6):403,
2006.
[81] Y. Tian and S. Yuan. Clothes matching for blind and color blind people. Computers Helping
People with Special Needs, pages 324–331, 2010.
[82] H. Tinwala and I. MacKenzie. Eyes-free text entry with error correction on touchscreen mo-
bile devices. In Proceedings of the 6th Nordic Conference on Human-Computer Interaction:
Extending Boundaries, pages 511–520. ACM, 2010.
[83] D. Tuttle and N. Tuttle. Self-esteem and adjusting with blindness: The process of responding
to life’s demands. Charles C Thomas Pub Ltd, 2004.
120

[84] E. Walk, H. Ahn, P. Lampkin, S. Nabizadeh, and R. Edlich. Americans with disabilities
act. Journal of Burn Care & Research, 14(1):91, 1993.
[85] Z. Wang, B. Li, T. Hedgpeth, and T. Haven. Instant tactile-audio map: Enabling access
to digital maps for people with visual impairment. In Proceedings of the 11th international
ACM SIGACCESS conference on Computers and accessibility, pages 43–50. ACM, 2009.
[86] R. Want, A. Hopper, V. Falcao, and J. Gibbons. The active badge location system. ACM
Transactions on Information Systems (TOIS), 10(1):91–102, 1992.
[87] M. Williams and R. Anderson. Currency design in the united states and abroad: counterfeit
deterrence and visual accessibility. REVIEW-FEDERAL RESERVE BANK OF SAINT
LOUIS, 89(5):371, 2007.
[88] D. World. Talking color detectors. http://www.disabled-world.com/assistivedevices/
visual/talking-color-detectors.php, May 2012.
[89] M. Wu and R. Balakrishnan. Multi-finger and whole hand gestural interaction techniques
for multi-user tabletop displays. In Proceedings of the 16th annual ACM symposium on User
interface software and technology, pages 193–202. ACM, 2003.
[90] T. Yan, V. Kumar, and D. Ganesan. Crowdsearch: exploiting crowds for accurate real-time
image search on mobile phones. In Proceedings of the 8th international conference on Mobile
systems, applications, and services, pages 77–90. ACM, 2010.
[91] X. Yang, S. Yuan, and Y. Tian. Recognizing clothes patterns for blind people by confidence
margin based feature combination. In Proceedings of the 19th ACM international conference
on Multimedia, pages 1097–1100. ACM, 2011.
[92] G. Yfantidis and G. Evreinov. Adaptive blind interaction technique for touchscreens. Uni-
versal Access in the Information Society, 4(4):328–337, 2006.
[93] H. Ying, C. Silex, A. Schnitzer, S. Leonhardt, and M. Schiek. Automatic step detection in
the accelerometer signal. In 4th International Workshop on Wearable and Implantable Body
Sensor Networks (BSN 2007), pages 80–85. Springer, 2007.
121

[94] S. Yuan. A system of clothes matching for visually impaired persons. In Proceedings of
the 12th international ACM SIGACCESS conference on Computers and accessibility, pages
303–304. ACM, 2010.
122