MnDOT: Congestion Report
17
2019 Congestion Report 1 2019 Congestion Report Metropolitan Freeway System November 2020
Transcript of MnDOT: Congestion Report

2019 Congestion Report 1
2019 Congestion Report
Metropolitan Freeway System November 2020

2019 Congestion Report 2
Table of Contents
Purpose and Need ………………………………………………………………………………………………..……..3
Introduction ………………………………………………………………………………………………………..3
Methodology …………………………………………………………………………………………………………4
2019 Results …………………………………………………………………………………………………………5
Project Spotlight ………………………………………………………………….....................................….8
Explanation of Percentage Miles of Twin City Urban Freeway System Congested Graph …………………………………………………………………………………………………….………………………….……….9
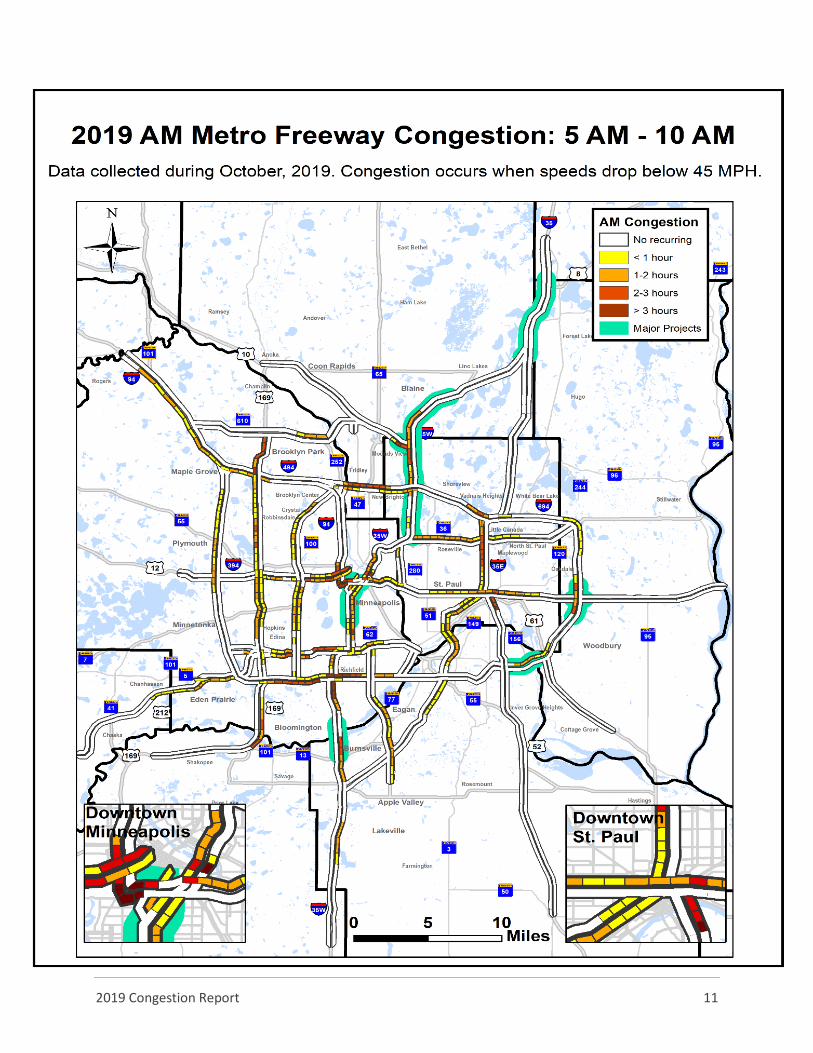
2019 AM Metro Freeway Congestion Map ………………………………………………………………….….11
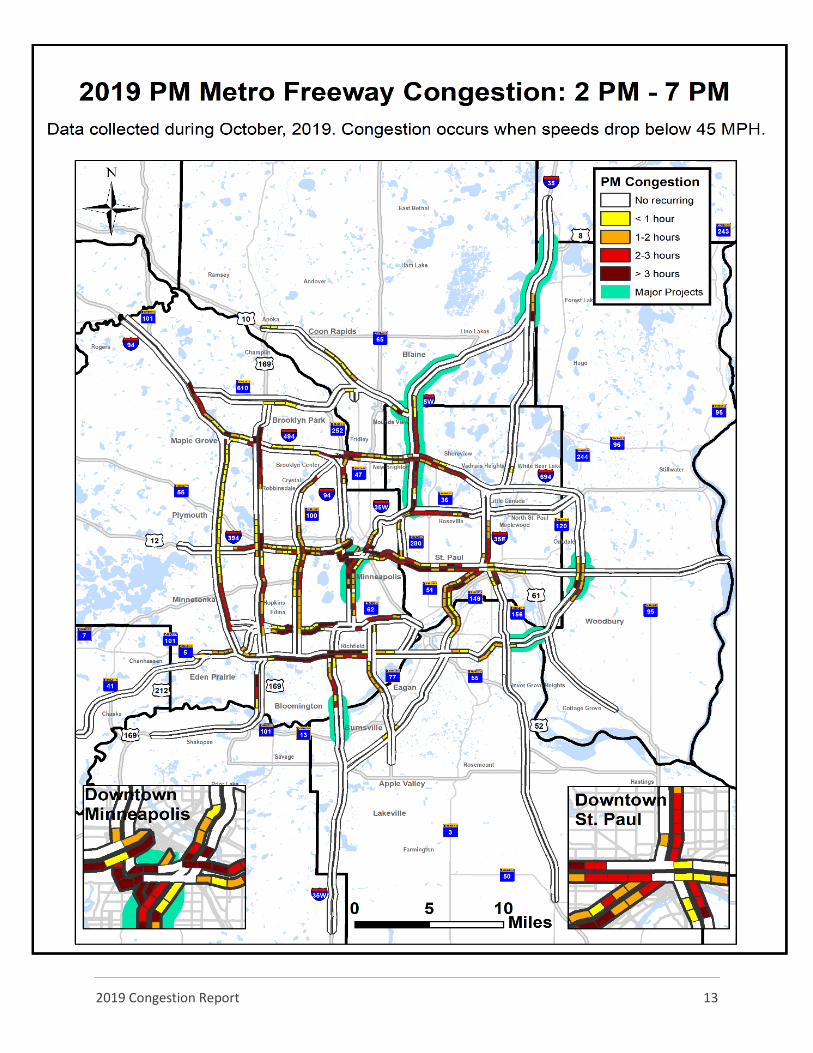
2019 PM Metro Freeway Congestion Map ………………………………………………………………….….13
Appendix A: Centerline Miles of Highway Measured for Congestion……………………………….15
Appendix B: Daily Congestion Map.………………………………………………………………………………...17
2019 Congestion Report 3
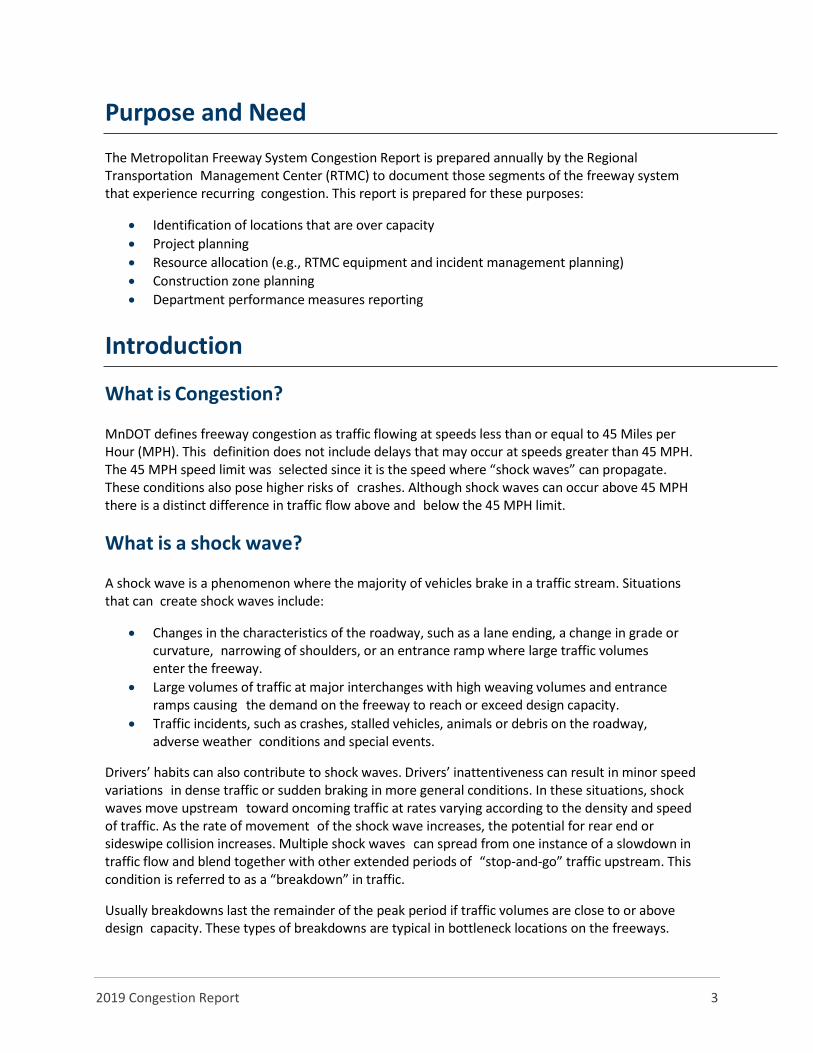
Purpose and Need
The Metropolitan Freeway System Congestion Report is prepared annually by the Regional Transportation Management Center (RTMC) to document those segments of the freeway system that experience recurring congestion. This report is prepared for these purposes:
• Identification of locations that are over capacity • Project planning • Resource allocation (e.g., RTMC equipment and incident management planning) • Construction zone planning • Department performance measures reporting
Introduction
What is Congestion?
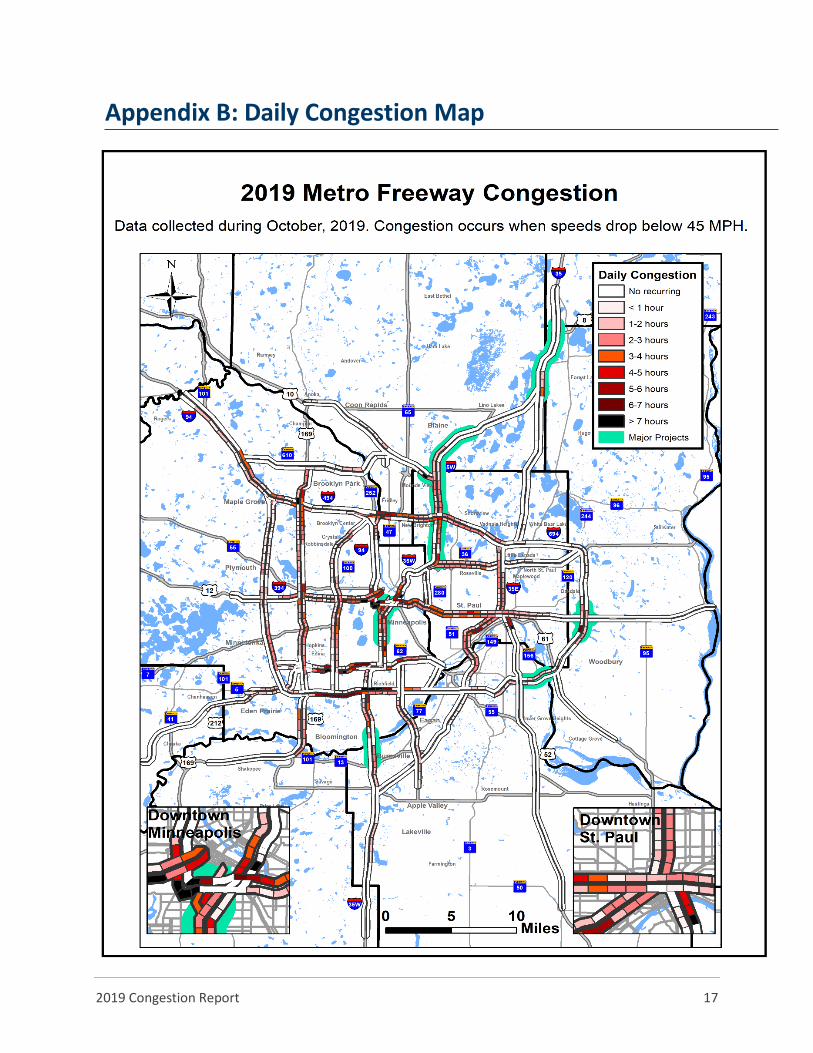
MnDOT defines freeway congestion as traffic flowing at speeds less than or equal to 45 Miles per Hour (MPH). This definition does not include delays that may occur at speeds greater than 45 MPH. The 45 MPH speed limit was selected since it is the speed where “shock waves” can propagate. These conditions also pose higher risks of crashes. Although shock waves can occur above 45 MPH there is a distinct difference in traffic flow above and below the 45 MPH limit.
What is a shock wave?
A shock wave is a phenomenon where the majority of vehicles brake in a traffic stream. Situations that can create shock waves include:
• Changes in the characteristics of the roadway, such as a lane ending, a change in grade or curvature, narrowing of shoulders, or an entrance ramp where large traffic volumes enter the freeway.
• Large volumes of traffic at major interchanges with high weaving volumes and entrance ramps causing the demand on the freeway to reach or exceed design capacity.
• Traffic incidents, such as crashes, stalled vehicles, animals or debris on the roadway, adverse weather conditions and special events.
Drivers’ habits can also contribute to shock waves. Drivers’ inattentiveness can result in minor speed variations in dense traffic or sudden braking in more general conditions. In these situations, shock waves move upstream toward oncoming traffic at rates varying according to the density and speed of traffic. As the rate of movement of the shock wave increases, the potential for rear end or sideswipe collision increases. Multiple shock waves can spread from one instance of a slowdown in traffic flow and blend together with other extended periods of “stop-and-go” traffic upstream. This condition is referred to as a “breakdown” in traffic.
Usually breakdowns last the remainder of the peak period if traffic volumes are close to or above design capacity. These types of breakdowns are typical in bottleneck locations on the freeways.
2019 Congestion Report 4
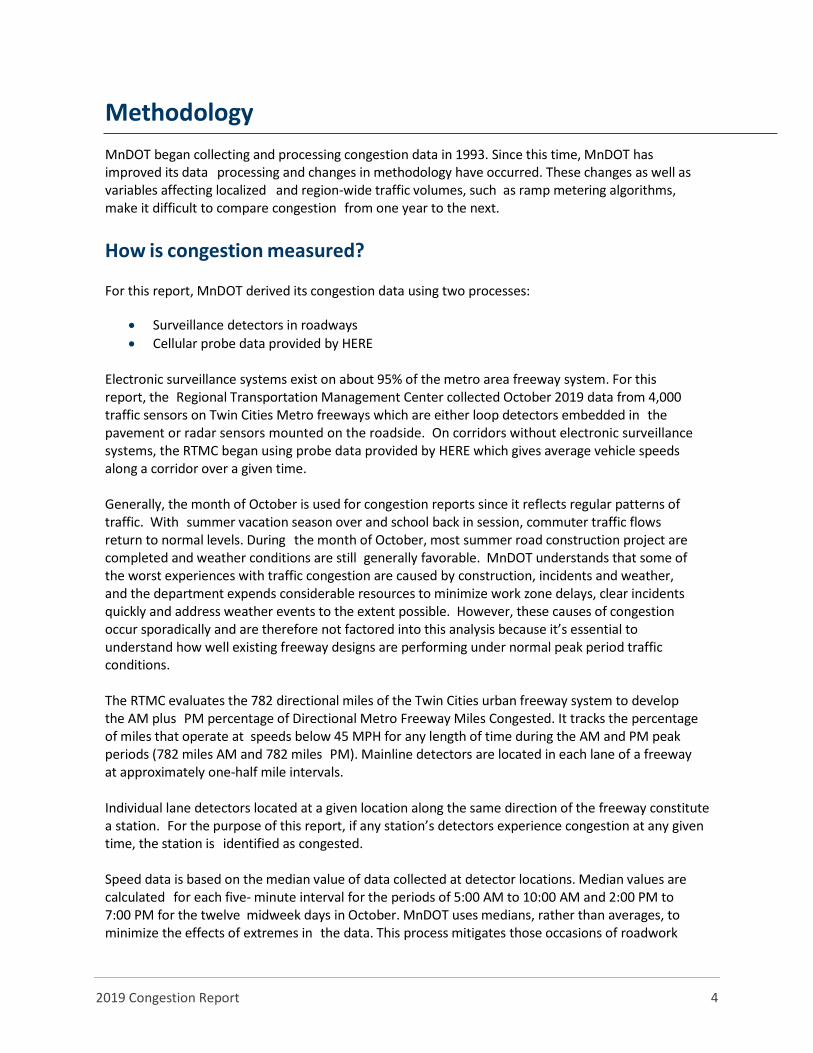
Methodology
MnDOT began collecting and processing congestion data in 1993. Since this time, MnDOT has improved its data processing and changes in methodology have occurred. These changes as well as variables affecting localized and region-wide traffic volumes, such as ramp metering algorithms, make it difficult to compare congestion from one year to the next.
How is congestion measured?
For this report, MnDOT derived its congestion data using two processes:
• Surveillance detectors in roadways • Cellular probe data provided by HERE
Electronic surveillance systems exist on about 95% of the metro area freeway system. For this report, the Regional Transportation Management Center collected October 2019 data from 4,000 traffic sensors on Twin Cities Metro freeways which are either loop detectors embedded in the pavement or radar sensors mounted on the roadside. On corridors without electronic surveillance systems, the RTMC began using probe data provided by HERE which gives average vehicle speeds along a corridor over a given time.
Generally, the month of October is used for congestion reports since it reflects regular patterns of traffic. With summer vacation season over and school back in session, commuter traffic flows return to normal levels. During the month of October, most summer road construction project are completed and weather conditions are still generally favorable. MnDOT understands that some of the worst experiences with traffic congestion are caused by construction, incidents and weather, and the department expends considerable resources to minimize work zone delays, clear incidents quickly and address weather events to the extent possible. However, these causes of congestion occur sporadically and are therefore not factored into this analysis because it’s essential to understand how well existing freeway designs are performing under normal peak period traffic conditions.
The RTMC evaluates the 782 directional miles of the Twin Cities urban freeway system to develop the AM plus PM percentage of Directional Metro Freeway Miles Congested. It tracks the percentage of miles that operate at speeds below 45 MPH for any length of time during the AM and PM peak periods (782 miles AM and 782 miles PM). Mainline detectors are located in each lane of a freeway at approximately one-half mile intervals. Individual lane detectors located at a given location along the same direction of the freeway constitute a station. For the purpose of this report, if any station’s detectors experience congestion at any given time, the station is identified as congested.
Speed data is based on the median value of data collected at detector locations. Median values are calculated for each five- minute interval for the periods of 5:00 AM to 10:00 AM and 2:00 PM to 7:00 PM for the twelve midweek days in October. MnDOT uses medians, rather than averages, to minimize the effects of extremes in the data. This process mitigates those occasions of roadwork
2019 Congestion Report 5
lane closures, significant traffic incidents, and one-time traffic events not related to daily commuting patterns.
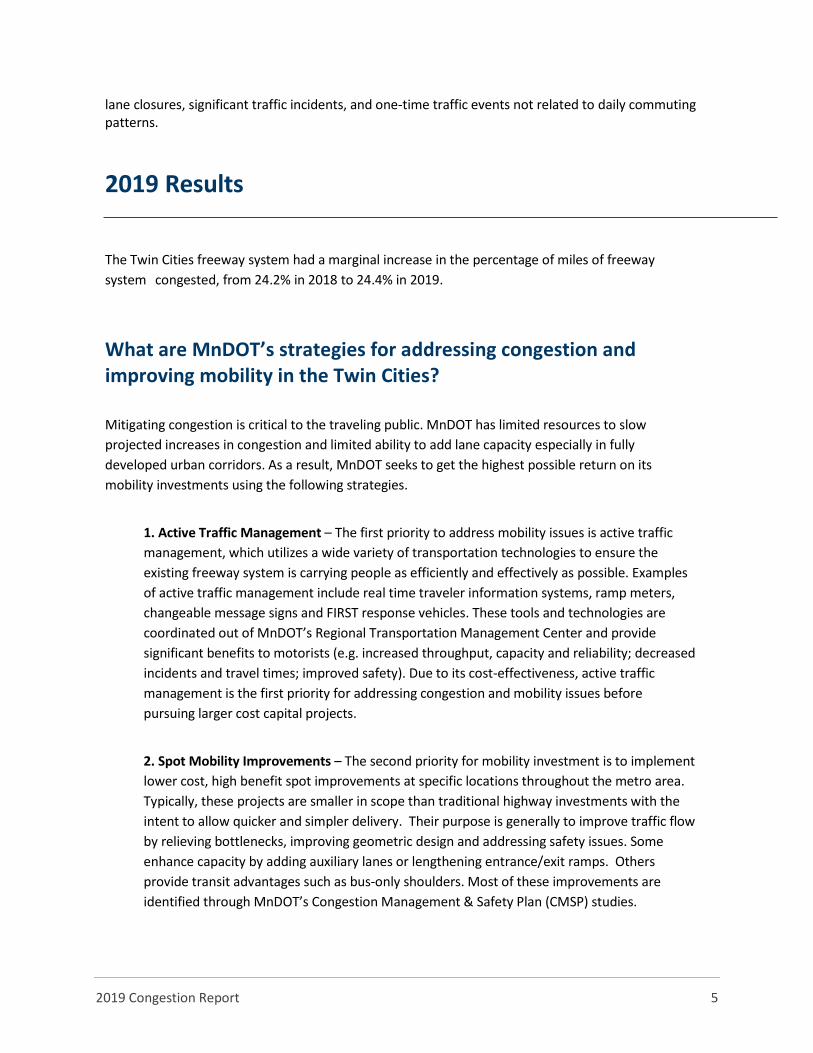
2019 Results
The Twin Cities freeway system had a marginal increase in the percentage of miles of freeway system congested, from 24.2% in 2018 to 24.4% in 2019.
What are MnDOT’s strategies for addressing congestion and improving mobility in the Twin Cities?
Mitigating congestion is critical to the traveling public. MnDOT has limited resources to slow projected increases in congestion and limited ability to add lane capacity especially in fully developed urban corridors. As a result, MnDOT seeks to get the highest possible return on its mobility investments using the following strategies.
1. Active Traffic Management – The first priority to address mobility issues is active traffic management, which utilizes a wide variety of transportation technologies to ensure the existing freeway system is carrying people as efficiently and effectively as possible. Examples of active traffic management include real time traveler information systems, ramp meters, changeable message signs and FIRST response vehicles. These tools and technologies are coordinated out of MnDOT’s Regional Transportation Management Center and provide significant benefits to motorists (e.g. increased throughput, capacity and reliability; decreased incidents and travel times; improved safety). Due to its cost-effectiveness, active traffic management is the first priority for addressing congestion and mobility issues before pursuing larger cost capital projects.
2. Spot Mobility Improvements – The second priority for mobility investment is to implement lower cost, high benefit spot improvements at specific locations throughout the metro area. Typically, these projects are smaller in scope than traditional highway investments with the intent to allow quicker and simpler delivery. Their purpose is generally to improve traffic flow by relieving bottlenecks, improving geometric design and addressing safety issues. Some enhance capacity by adding auxiliary lanes or lengthening entrance/exit ramps. Others provide transit advantages such as bus-only shoulders. Most of these improvements are identified through MnDOT’s Congestion Management & Safety Plan (CMSP) studies.
2019 Congestion Report 6
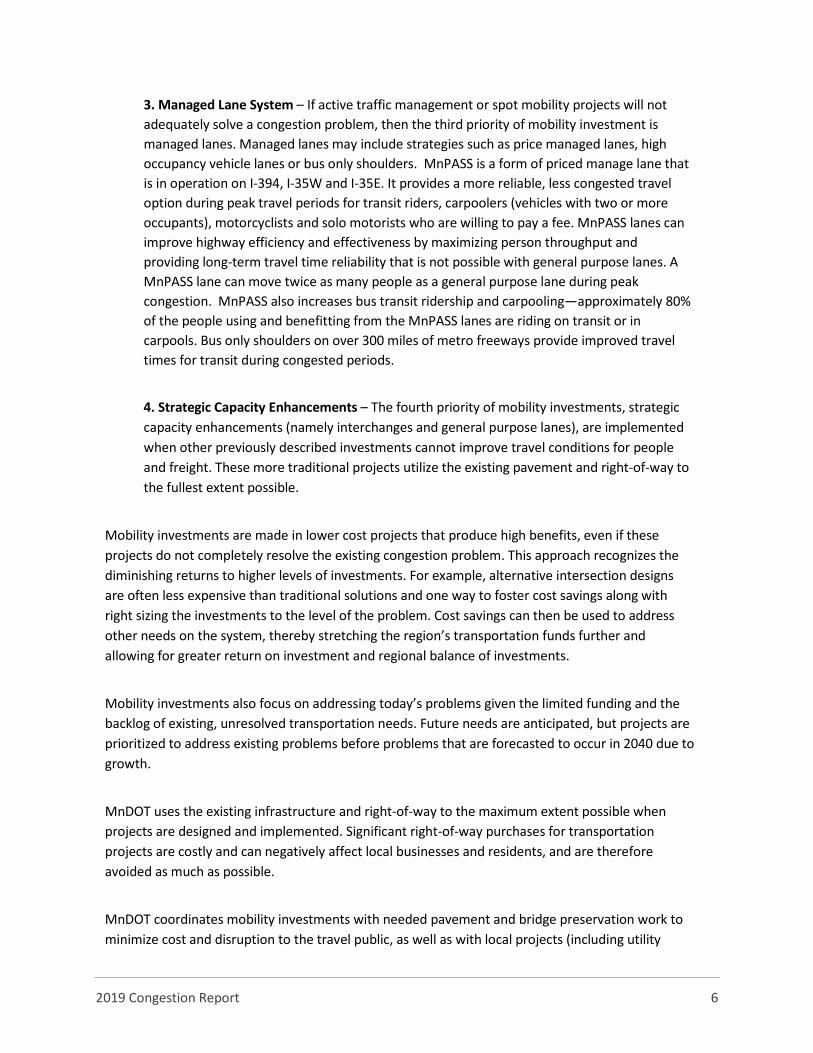
3. Managed Lane System – If active traffic management or spot mobility projects will not adequately solve a congestion problem, then the third priority of mobility investment is managed lanes. Managed lanes may include strategies such as price managed lanes, high occupancy vehicle lanes or bus only shoulders. MnPASS is a form of priced manage lane that is in operation on I-394, I-35W and I-35E. It provides a more reliable, less congested travel option during peak travel periods for transit riders, carpoolers (vehicles with two or more occupants), motorcyclists and solo motorists who are willing to pay a fee. MnPASS lanes can improve highway efficiency and effectiveness by maximizing person throughput and providing long-term travel time reliability that is not possible with general purpose lanes. A MnPASS lane can move twice as many people as a general purpose lane during peak congestion. MnPASS also increases bus transit ridership and carpooling—approximately 80% of the people using and benefitting from the MnPASS lanes are riding on transit or in carpools. Bus only shoulders on over 300 miles of metro freeways provide improved travel times for transit during congested periods.
4. Strategic Capacity Enhancements – The fourth priority of mobility investments, strategic capacity enhancements (namely interchanges and general purpose lanes), are implemented when other previously described investments cannot improve travel conditions for people and freight. These more traditional projects utilize the existing pavement and right-of-way to the fullest extent possible.
Mobility investments are made in lower cost projects that produce high benefits, even if these projects do not completely resolve the existing congestion problem. This approach recognizes the diminishing returns to higher levels of investments. For example, alternative intersection designs are often less expensive than traditional solutions and one way to foster cost savings along with right sizing the investments to the level of the problem. Cost savings can then be used to address other needs on the system, thereby stretching the region’s transportation funds further and allowing for greater return on investment and regional balance of investments.
Mobility investments also focus on addressing today’s problems given the limited funding and the backlog of existing, unresolved transportation needs. Future needs are anticipated, but projects are prioritized to address existing problems before problems that are forecasted to occur in 2040 due to growth.
MnDOT uses the existing infrastructure and right-of-way to the maximum extent possible when projects are designed and implemented. Significant right-of-way purchases for transportation projects are costly and can negatively affect local businesses and residents, and are therefore avoided as much as possible.
MnDOT coordinates mobility investments with needed pavement and bridge preservation work to minimize cost and disruption to the travel public, as well as with local projects (including utility

2019 Congestion Report 7
projects and private sector developments when possible) to combine multiple projects where appropriate and in other cases to avoid having multiple projects along nearby parallel corridors at the same time.
The potential benefits teleworking could have on congestion. During the COVID-19 pandemic stay-at-home orders, telecommuting became a primary way to conduct business. Highway volume decreased by 30-50%, congestion largely disappeared and air quality improved. As the stay-at-home order lifted, many employers have chosen to keep their employees at home in a teleworking status. Traffic volumes are still down about 15-20% as of August 2020 on metro area freeways and congestion is still significantly lower than normal with congestion only returning on some of the metro’s busiest corridors.
Although this report shows congestion levels from October 2019, the results from the pandemic indicate that telecommuting can be a promising, effective, and feasible form of travel demand management (TDM) in the Twin Cities Metro Area. Increased participation in telecommuting presents a true opportunity to reduce congestion and potentially improve air quality. The goal of TDM is to reduce the peak travel demand that often drives congestion and the needs on the system. An increase in telecommuting from the normal 5% of daily commuters up to 20% or even higher could begin to decrease miles of congestion in the metro area downward from its historical upward trend. An increase in telecommuting will also reduce statewide vehicle miles travel and vehicle emissions.
2019 Congestion Report 8
Project Spotlight
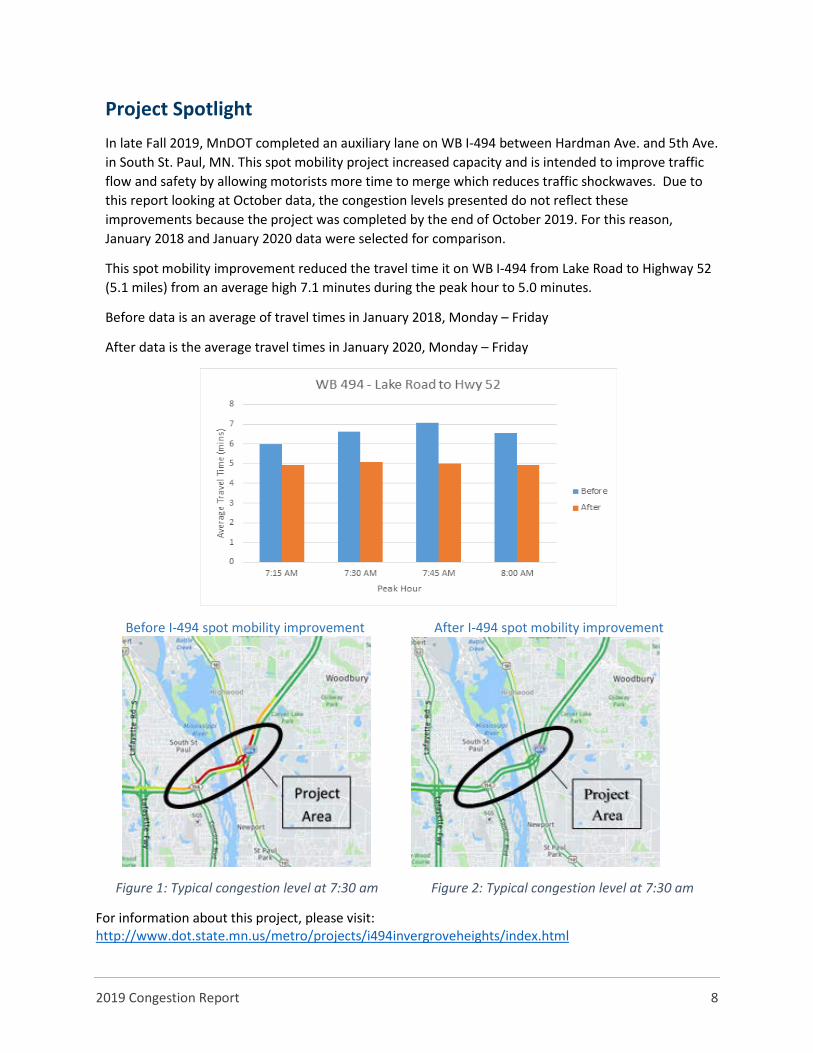
In late Fall 2019, MnDOT completed an auxiliary lane on WB I-494 between Hardman Ave. and 5th Ave. in South St. Paul, MN. This spot mobility project increased capacity and is intended to improve traffic flow and safety by allowing motorists more time to merge which reduces traffic shockwaves. Due to this report looking at October data, the congestion levels presented do not reflect these improvements because the project was completed by the end of October 2019. For this reason, January 2018 and January 2020 data were selected for comparison.
This spot mobility improvement reduced the travel time it on WB I-494 from Lake Road to Highway 52 (5.1 miles) from an average high 7.1 minutes during the peak hour to 5.0 minutes.
Before data is an average of travel times in January 2018, Monday – Friday
After data is the average travel times in January 2020, Monday – Friday
Before I-494 spot mobility improvement After I-494 spot mobility improvement
Figure 1: Typical congestion level at 7:30 am Figure 2: Typical congestion level at 7:30 am
For information about this project, please visit: http://www.dot.state.mn.us/metro/projects/i494invergroveheights/index.html
2019 Congestion Report 9
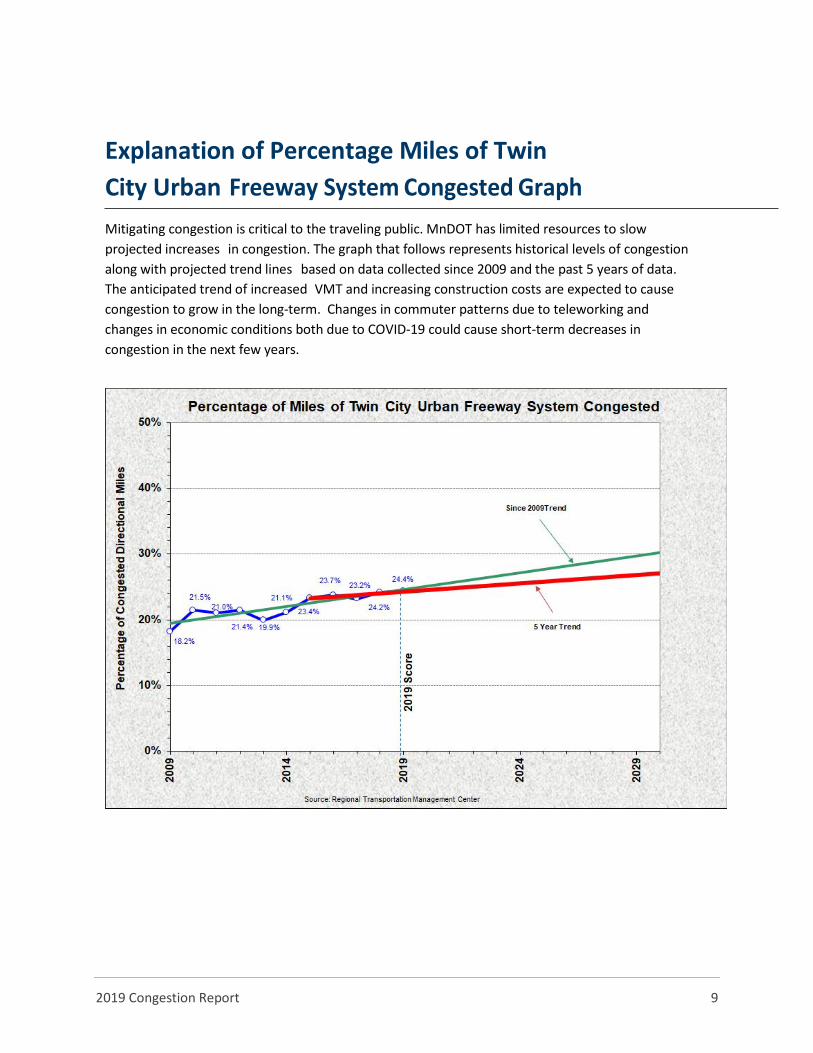
Explanation of Percentage Miles of Twin City Urban Freeway System Congested Graph
Mitigating congestion is critical to the traveling public. MnDOT has limited resources to slow projected increases in congestion. The graph that follows represents historical levels of congestion along with projected trend lines based on data collected since 2009 and the past 5 years of data. The anticipated trend of increased VMT and increasing construction costs are expected to cause congestion to grow in the long-term. Changes in commuter patterns due to teleworking and changes in economic conditions both due to COVID-19 could cause short-term decreases in congestion in the next few years.
2019 Congestion Report 10
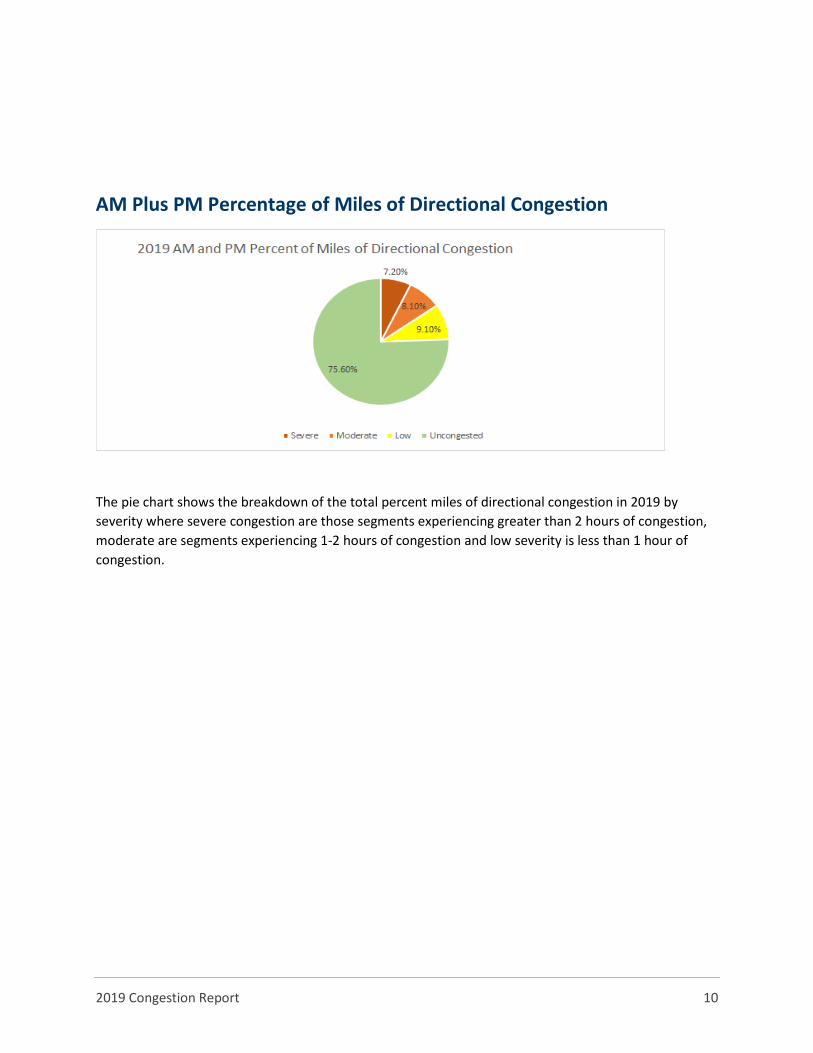
AM Plus PM Percentage of Miles of Directional Congestion
The pie chart shows the breakdown of the total percent miles of directional congestion in 2019 by severity where severe congestion are those segments experiencing greater than 2 hours of congestion, moderate are segments experiencing 1-2 hours of congestion and low severity is less than 1 hour of congestion.
2019 Congestion Report 11

2019 Congestion Report 12
Miles and Duration of Congestion: 5:00 AM – 10:00 AM
2019 Congestion Report 13
2019 Congestion Report 14
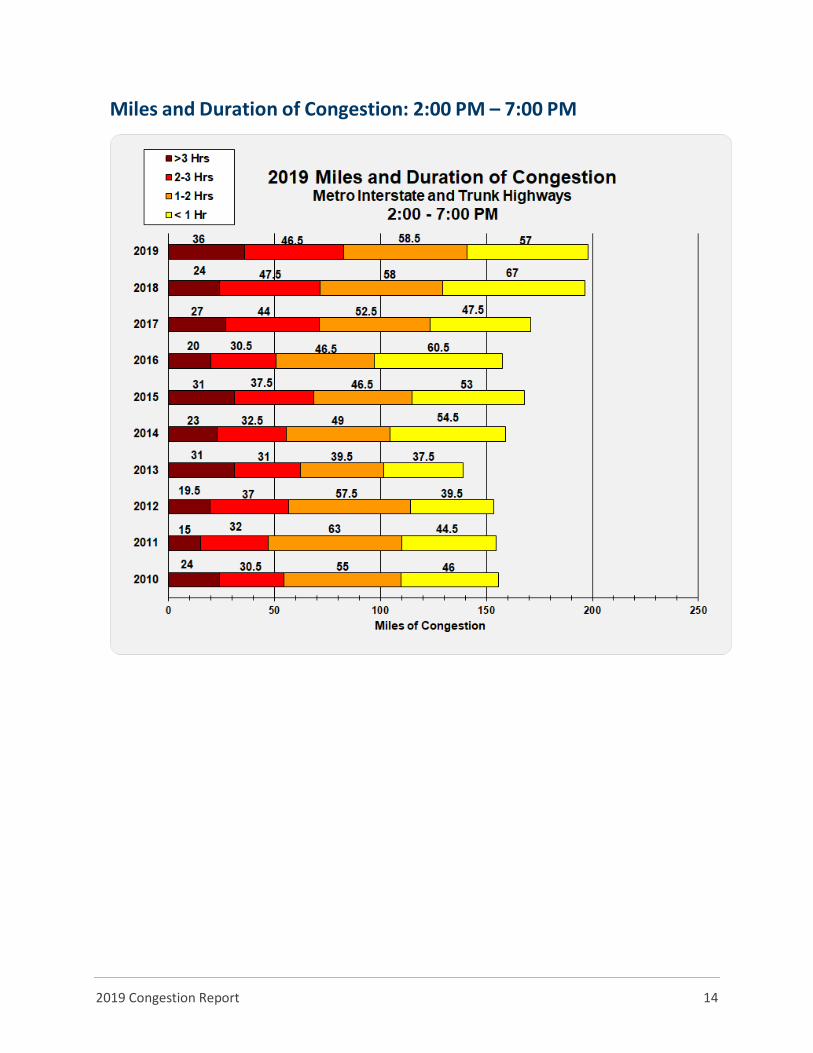
Miles and Duration of Congestion: 2:00 PM – 7:00 PM
2019 Congestion Report 15
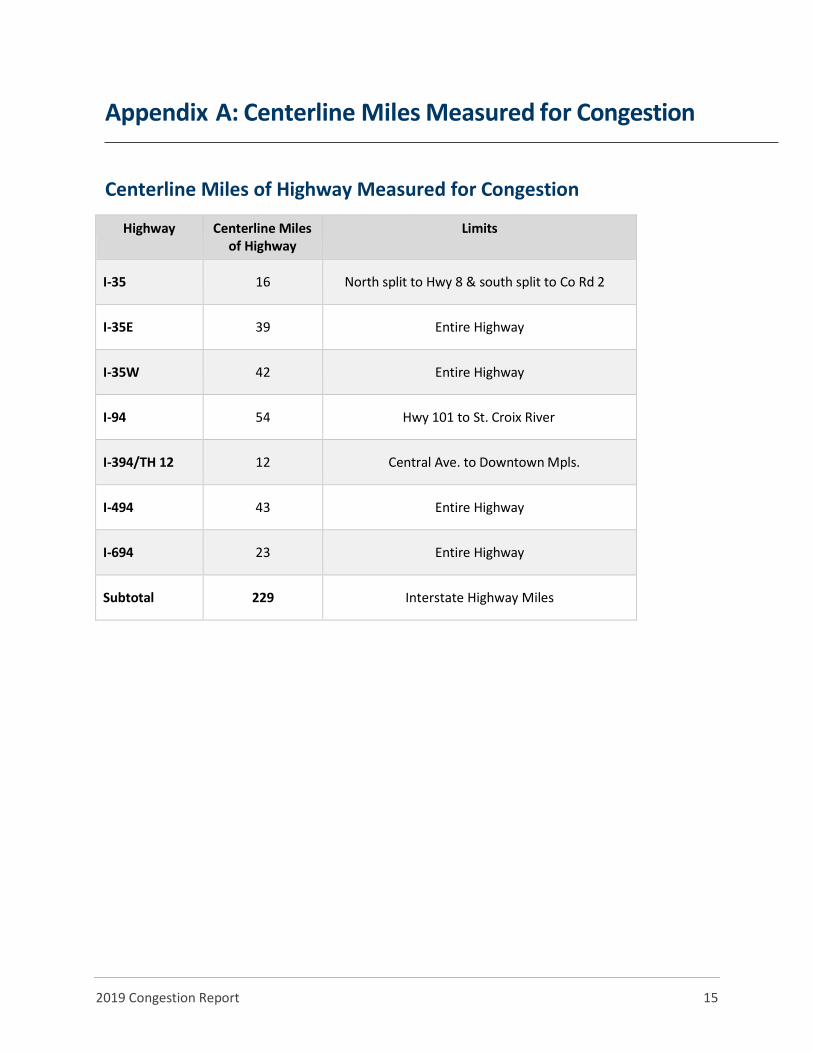
Appendix A: Centerline Miles Measured for Congestion
Centerline Miles of Highway Measured for Congestion
Highway Centerline Miles of Highway
Limits
I-35 16 North split to Hwy 8 & south split to Co Rd 2
I-35E 39 Entire Highway
I-35W
42
Entire Highway
I-94 54 Hwy 101 to St. Croix River
I-394/TH 12 12 Central Ave. to Downtown Mpls.
I-494 43 Entire Highway
I-694 23 Entire Highway
Subtotal 229 Interstate Highway Miles
2019 Congestion Report 16
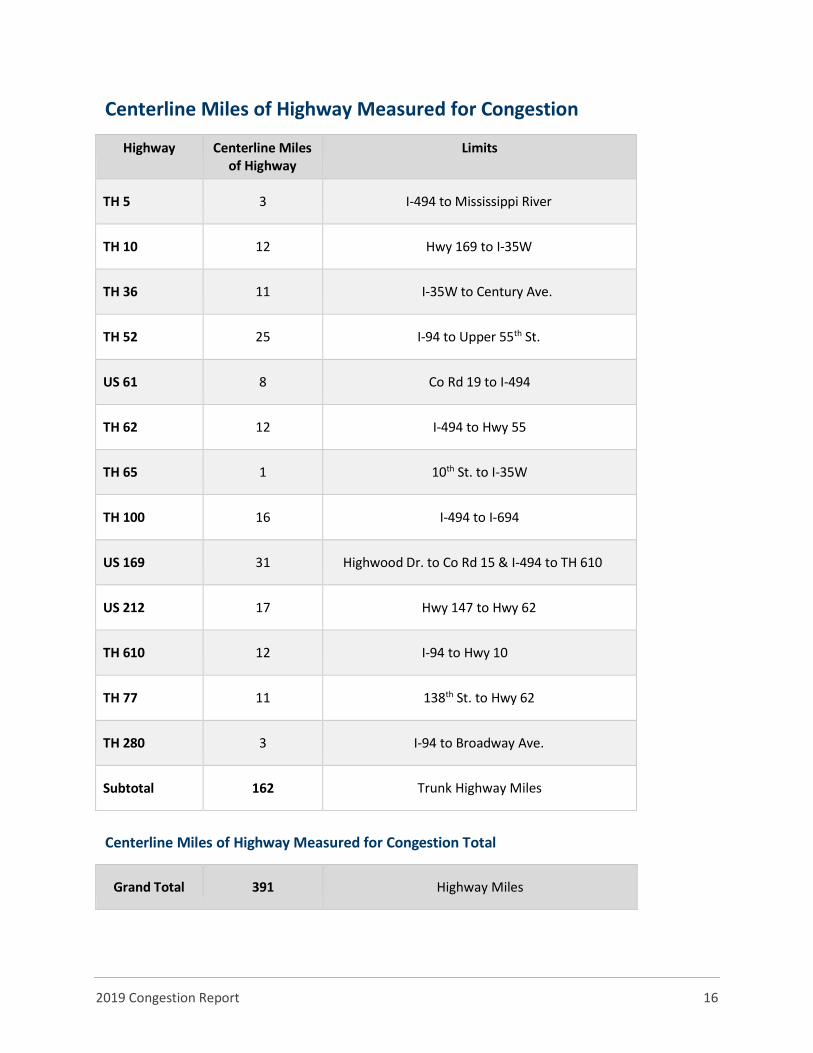
Centerline Miles of Highway Measured for Congestion
Highway Centerline Miles of Highway
Limits
TH 5 3 I-494 to Mississippi River
TH 10 12 Hwy 169 to I-35W
TH 36 11 I-35W to Century Ave.
TH 52 25 I-94 to Upper 55th St.
US 61 8 Co Rd 19 to I-494
TH 62 12 I-494 to Hwy 55
TH 65 1 10th St. to I-35W
TH 100 16 I-494 to I-694
US 169 31 Highwood Dr. to Co Rd 15 & I-494 to TH 610
US 212
17
Hwy 147 to Hwy 62
TH 610 12 I-94 to Hwy 10
TH 77 11 138th St. to Hwy 62
TH 280 3 I-94 to Broadway Ave.
Subtotal
162 Trunk Highway Miles
Centerline Miles of Highway Measured for Congestion Total
Grand Total 391 Highway Miles
2019 Congestion Report 17
Appendix B: Daily Congestion Map