MMG - Paper GEE
22
Av. da República nº. 79 1050 – 243 Lisboa Telf: (351) 217998150 Fax: (351) 217998154 Web Site: www.gee-min.economia.pt ISSN 1647-6212 !"# $% &’ (& )* (+)& &(,
Transcript of MMG - Paper GEE

Av. da República nº. 79 1050 – 243 Lisboa Telf: (351) 217998150 Fax: (351) 217998154 Web Site: www.gee-min.economia.pt ISSN 1647-6212
�
����������������������� �������������
������
��������������������� !����"#�������$������������������%�
�
�
�����������������������������������&'����������� �������(&�)���*���
��(+�)��&������&(,���
��
Are the dynamics of knowledge-based industries any different? – Ricardo Mamede, Daniel Mota e Manuel Mira Godinho
2
�
��������������������� !����"#�������$������������������%����&'����������� ���†��� ��������������� ��������������� � ���� ���������� ����������������������������� ������� ���� � � �����! ��������(&�)���*������� �������� ���"��������#�� ������(+�)��&������&(,������������ �������$�� ����������� ��������������� ���� ��������� ������! �������)�&-&'�./��0�!%�!&'����12���%�(��)"����*������ ������ ��+����(�������,+�- ������� ��"���
���*��'*��The concept of «knowledge-based industries» (KBIs) has been widely used both in the academy and in policy-making over the last decade, due to the increasing role those industries play – both in terms of value added and employment – in contemporary, advanced economies. In this paper we discuss the extent to which KBIs differ from other industries in what concerns some of the stylised facts and regularities of industry dynamics usually found in the literature. In particular, we analyse the patterns and the determinants of firm entry and post-entry performance (measured in terms of survival of new firms), comparing KBIs groups with the remaining industries, using data for the Portuguese economy in the second half of the 1990s. We find that KBIs and the firms within them show some signs of distinctiveness in their dynamics as compared to the general case. In particular, on average, KBIs firms have higher survival chances, and entry within the KBIs groups is less responsive to incentives.
�����Financial support from the European Commission (FP6) Project: «KEINS - Knowledge-Based
Entrepreneurship: Innovation, Networks and Systems», Contract n.: CT2-CT-2004-506022 is gratefully
acknowledged. The authors would like to thank Camilla Lenzi, Fabio Montobbio, and the other participants at
KEINS academic events for their helpful comments and suggestions.
† E-mail: [email protected]
Are the dynamics of knowledge-based industries any different? – Ricardo Mamede, Daniel Mota e Manuel Mira Godinho
3
3(�&'�
45 Introduction 4
�5 Data and the classification of KBIs 5
65 Descriptive statistics on entry, growth, and survival 7
75 Theoretical considerations on panel data and survival models 11
85 Determinants of industry entry rates 14
95 Determinants of new firm survival 17
�5 Conclusions 19
:5 References 21
�545 Appendix 22
Are the dynamics of knowledge-based industries any different? – Ricardo Mamede, Daniel Mota e Manuel Mira Godinho
4
1. Introduction
The concept of «knowledge-based industries» has been widely used both in the academy and in policy-
making over the last decade. The OECD (1999) has defined such industries as ones which are relatively
intensive in their inputs of technology and/or human capital. This definition includes not only manufacturing
industries which are found to be highly dependent on R&D inputs, but also a number of services activities that
are intensive users of high technology and/or have the relatively highly skilled workforce required to fully
benefit from technological innovation (ibidem).
Knowledge-based industries (henceforth KBIs), thus defined, have been shown to play an increasing role in
contemporary, advanced economies. Between the mid-1980s and the mid-1990s, the contribution of those
industries to the business value added of the advanced economies has grown from around 45% to more than
50% (OECD, 1999). After a downturn in the beginning of the millennium (e.g., the share of high- and medium-
high-technology manufacturing fell to about 7.5% of total OECD value added in 2002, compared to about
8.5% in 2000), the relative importance of KBIs in valued added, international trade, and GDP growth has
shown clear signs of recovery (OECD, 2005).
Such secular rise in the relevance of KBIs has drawn the attention of an increasing number of scholars to the
study of such industries. Qualitative and quantitative studies on activities such as ICT-related industries,
pharmaceuticals, biotechnology, and business services, among others, have proliferated in the recent
decades. While the detailed study of specific KBIs has certainly contributed to a better understanding of each
industry – and has often produced crucial insights that could be generalised to different contexts – it is,
however, not clear to what extent the «knowledge-based» category is actually useful if one is concerned with
understanding the evolution of firms and industries. Put differently, while there are strong reasons to draw the
attention of academics and policy makers to those industries which are strongly based in knowledge inputs, it
is sensible to ask whether the dynamics of KBIs significantly differ from the dynamics of other industries.
There might be at least three different reasons one may expect KBIs to have a different behavioural pattern
than the one found on other industries: demand directed to KBIs grows at higher rates; these industries tend
to be younger in terms of their industry and technology life-cycles; they may face different sets of entry and
exit barriers, namely in connection to necessary investments in specialized knowledge assets.
As is well known by now, the empirical evidence drawn from several studies on industry dynamics has allowed
the identification of some statistical regularities, which are often taken as stylised facts/stylised results on how
firms and industries evolve over time (for surveys see Caves, 1998; Dosi et al., 1997; Geroski, 1995). Such
statistical regularities include the following: the entry and exit of firms are both frequent phenomena, implying
high levels of firm turnover in most industries; a high number of new firms leave the market shortly after entry;
firm entry and exit are very often correlated, being often associated with similar determinants; entering and
exiting firms are typically smaller than the average incumbent (which means that the impact of entry and exit
on worker turnover tends to be lower than the impact on firm turnover); both the size and the age of firms have
a positive impact on their survival chances, and usually a negative impact on growth.
Are the dynamics of knowledge-based industries any different? – Ricardo Mamede, Daniel Mota e Manuel Mira Godinho
5
In this paper we propose to discuss the extent to which KBIs differ from other industries in what concerns
some of the stylised facts and regularities of industry dynamics just mentioned. In particular, we analyse the
patterns and the determinants of firm entry and post-entry performance (measured in terms of survival of new
firms), comparing KBIs groups with the remaining industries, using data for the Portuguese economy in the
second half of the 1990s.
The paper is organised as follows. In the following section, we present the data sources and propose our own
classification for KBIs (alternative to the one used by the OECD). The third section includes some relevant
statistics on entry and survival of new firms. In section 4, the models used in the paper are described. Section
5 presents results for industry entry rates and section 6 deals with the determinants of new firm survival.
Finally, section 7 concludes.
2. Data and the classification of KBIs
The work presented in this paper uses two main sources of data. The first one is the «Quadros de Pessoal»
(QP) database, which compiles information on employers and employees collected by the Portuguese Ministry
of Employment and Social Solidarity (MTSS) on a yearly basis. The survey that supports this database was
first carried out in 1982 (presently, the data available for research covers the period 1985-2005) and annual
reporting to this survey is compulsory for all firms employing paid labour in Portugal. The survey includes
questions related to the characteristics of both firms (e.g., total employment, industry classification, location,
legal status, ownership, number of plants, etc.) and their employees (gender, date of birth, educational
background, professional category, type of contract, etc.).
Both firms and workers are identified by their social security numbers, which in principle should allow following
them over time. This feature of the QP database makes it an extremely valuable source of data for conducting
analysis on both industry dynamics (see, for example, Cabral and Mata, 2003) and labour market dynamics
(e.g., Portugal and Cardoso, 2006). In practice, however, some problems may arise in the use of these data
for purposes of longitudinal analysis. On the one hand, data on workers’ characteristics were not collected in
1990 and in 2001, restricting the availability of continuous series to the periods 1985-1989, 1991-2000 and
2002-2005. On the other hand, there was a change in the industry classification system from 1994 to 1995,
which means that one can not build continuous series of data on industries without making some rather
arbitrary assumptions. Therefore, in this paper we will restrict the use of data from the QP database to the
period 1995-2000.
In order to enrich the information available at the industry level (namely, by adding information on revenues
and costs, which is absent form the QP dataset), we also draw on the «Inquérito às Empresas Harmonizado»
(IEH), an annual survey conducted by the Portuguese National Statistical Institute (INE). The IEH dataset
includes information on all firms with 100 or more employees and on a representative sample of firms with less
than 100 employees belonging to all industries, with the following exceptions: financial intermediation (ISIC
classes 65 to 67); public administration and defence, and compulsory social security (ISIC class 75); private
Are the dynamics of knowledge-based industries any different? – Ricardo Mamede, Daniel Mota e Manuel Mira Godinho
6
households with employed persons (ISIC class 95); and extra-territorial organizations and bodies (ISIC class
99).
A second group of industries was further excluded in our study, due either to data quality problems in the QP
dataset or to our choice to focus the analysis on essentially market-oriented activities. This second group
includes: agriculture, hunting and forestry (ISIC classes 1 and 2); fishing (ISIC class 5); mining and quarrying
(ISIC classes 10 to 14); electricity, gas and water supply (ISIC class 40); education services (ISIC class 80),
except driving schools and professional training; health services (ISIC class 80), except dental practice,
clinical tests, and veterinary activities; sewage and refuse disposal, sanitation and similar activities (ISIC class
90); activities of membership organizations (ISIC class 91); recreational, cultural and sporting activities (ISIC
class 92), except motion picture and video production, distribution, and projection; other service activities (ISIC
class 93), except Washing, and (dry-) cleaning of textile and fur products, hairdressing and other beauty
treatment, and funeral and related activities.
The list of industries that were retained includes 337 classes of an ISIC rev.3-equivalent classification system
disaggregated to 5 digits, comprising 386.510 firms (166.604 of which entered the market between 1995 and
2000).
Since our final aim is to compare the dynamics of KBIs and those of other industries, we need to establish
some criteria of «knowledge-baseness». Besides considering the OECD’s criteria of KBIs (which includes both
high-technology and medium-high-technology manufacturing industries, together with knowledge based-
services), we have put forward one alternative classification of KBIs (KBI-MMG, which we will compare with
KBI-OECD), taking advantage of the information available on the QP database on the employees’ educational
background. Thus, according to the KBI-MMG classification, an industry is considered as a KBI if it is among
the 10% of industries with the highest average proportion of employees holding a University degree (in the
period 1995-2000).
The use of this alternative criterion for the classification of KBIs is beneficial in at least two senses: first, while
the criteria used by the OECD to classify the knowledge intensity of manufacturing and services industries is
based on information drawn from several countries over different periods of time, our classification was built
on information about the firms which are actually under analysis, during the same period of observation;
second, since the concept of «knowledge-baseness» is far from being an established one, the use of two
different classification systems allows us to assess the extent to which the (dis)similarities between the
dynamics of KBIs and those of other industries depends on the way we define the former.
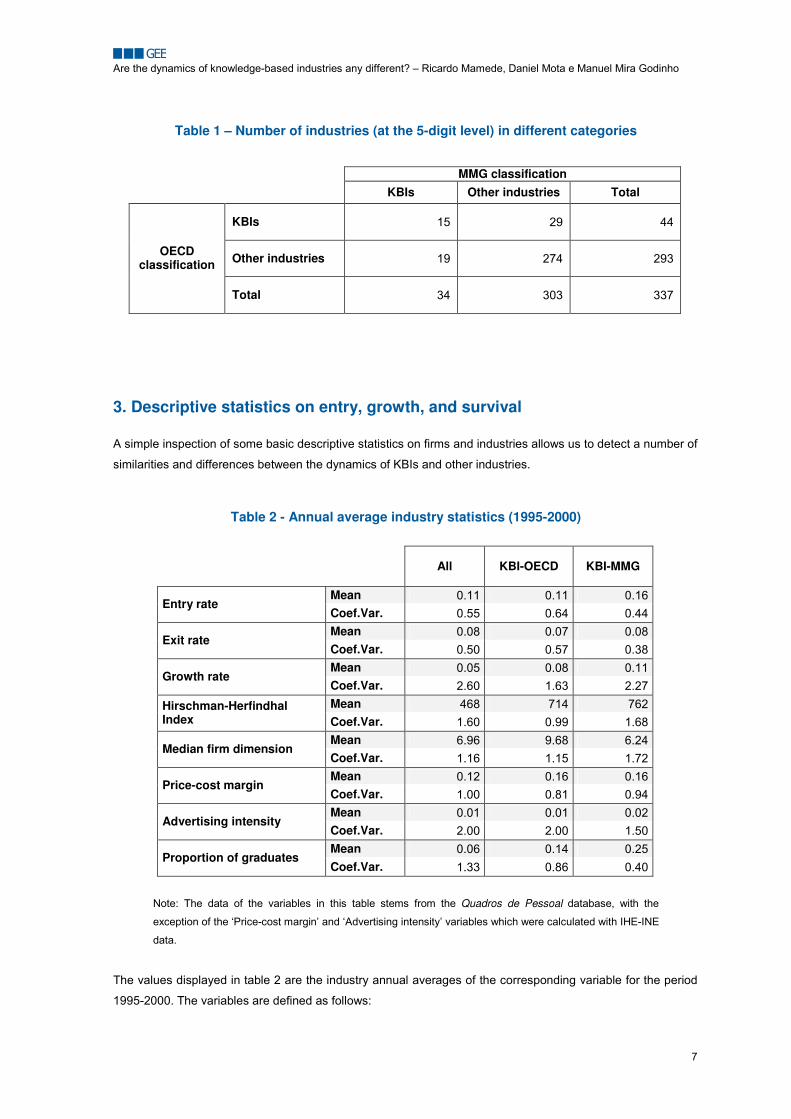
In table 1 we can see that the two ways of classifying KBIs – the one used by OECD and ours KBI-MMG –
overlap only partially.
Are the dynamics of knowledge-based industries any different? – Ricardo Mamede, Daniel Mota e Manuel Mira Godinho
7
Table 1 – Number of industries (at the 5-digit level) in different categories
MMG classification KBIs Other industries Total
KBIs 15 29 44
Other industries 19 274 293 OECD classification
Total 34 303 337
3. Descriptive statistics on entry, growth, and survival
A simple inspection of some basic descriptive statistics on firms and industries allows us to detect a number of
similarities and differences between the dynamics of KBIs and other industries.
Table 2 - Annual average industry statistics (1995-2000)
All KBI-OECD KBI-MMG
Mean 0.11 0.11 0.16 Entry rate
Coef.Var. 0.55 0.64 0.44 Mean 0.08 0.07 0.08
Exit rate Coef.Var. 0.50 0.57 0.38 Mean 0.05 0.08 0.11
Growth rate Coef.Var. 2.60 1.63 2.27 Mean 468 714 762 Hirschman-Herfindhal
Index Coef.Var. 1.60 0.99 1.68 Mean 6.96 9.68 6.24
Median firm dimension Coef.Var. 1.16 1.15 1.72 Mean 0.12 0.16 0.16
Price-cost margin Coef.Var. 1.00 0.81 0.94 Mean 0.01 0.01 0.02
Advertising intensity Coef.Var. 2.00 2.00 1.50 Mean 0.06 0.14 0.25
Proportion of graduates Coef.Var. 1.33 0.86 0.40
Note: The data of the variables in this table stems from the Quadros de Pessoal database, with the
exception of the ‘Price-cost margin’ and ‘Advertising intensity’ variables which were calculated with IHE-INE
data.
The values displayed in table 2 are the industry annual averages of the corresponding variable for the period
1995-2000. The variables are defined as follows:

Are the dynamics of knowledge-based industries any different? – Ricardo Mamede, Daniel Mota e Manuel Mira Godinho
8
� the entry rate in year t is the ratio of the number of firms that were created at t to the total number
incumbents in the same year;
� the exit rate is the ratio of the number of firms that ceased to exist after t to the total number
incumbents in that year;
� the growth rate is measured in terms of the relative change in the total number of employees in an
industry since the previous year1;
� the Hirschman-Herfindhal concentration index, as usual, is the sum of squares of the market shares
of every firm in each industry, with the market share of firm i being here measured as the proportion
of employees working for i in relation to the total number of employees in the industry;
� the median firm dimension refers to the distribution of firm sizes in terms of number of employees;
� the price-cost margin consists on the average industry ratio (R-C)/C (where R are total revenues and
C total costs, both for all firms) weighted by firm size;
� the advertising intensity is the industry average of the ratio of each firm’s total expenses with
advertising to its total revenues, weighted by firm size; and
� the proportion of graduates is measured as the industry average proportion of employees in each
firm which hold a university degree, weighted by firm size.
From the table above it is worth emphasising the following aspects:
(i) according to some dimensions, during the period under analysis, KBIs, regardless the way they are
defined, seem to behave in a fashion which is markedly different from the remaining industries –
this is particularly so in what concerns the growth rate, the price-cost margin, and the proportion of
graduates; while the latter is essentially a result of the way industries are classified, the fact that, on
average, KBIs grew faster and have higher price-cost margins during this period, confirms the idea
that these industries contributed strongly to growth and value added;
(ii) in some other aspects the behaviour of the KBI-OECD group is not similar to the behaviour of the
KBI-MMG group; in particular, the latter group shows higher entry rates (while the entry rate of KBI-
OECD industries is not distinct from the entry rates of all sectors together) and lower median
dimensions (while OECD’s KBIs seem to be composed of firms which are bigger than the
average);2
(iii) finally, in what concerns the coefficients of variation, the information displayed suggests that there
can be non-negligible differences between industries belonging to the same group of KBIs; this is
particularly so in what concerns the industries’ growth rate, median firm dimension, and advertising
intensity (suggesting that industries which are considered as KBIs according to a certain criteria
may be quite distinct in many respects).
1 The available data does not allow the use of any other proxy of industry growth at the level of sectoral desegregation we
are working. 2 The main reason for this differences reside on the fact that the proportion of services industries (which, typically, have
higher entry rates and lower median firm dimensions) is higher in the KBI-MMG than inthe KBI-OECD group.
Are the dynamics of knowledge-based industries any different? – Ricardo Mamede, Daniel Mota e Manuel Mira Godinho
9
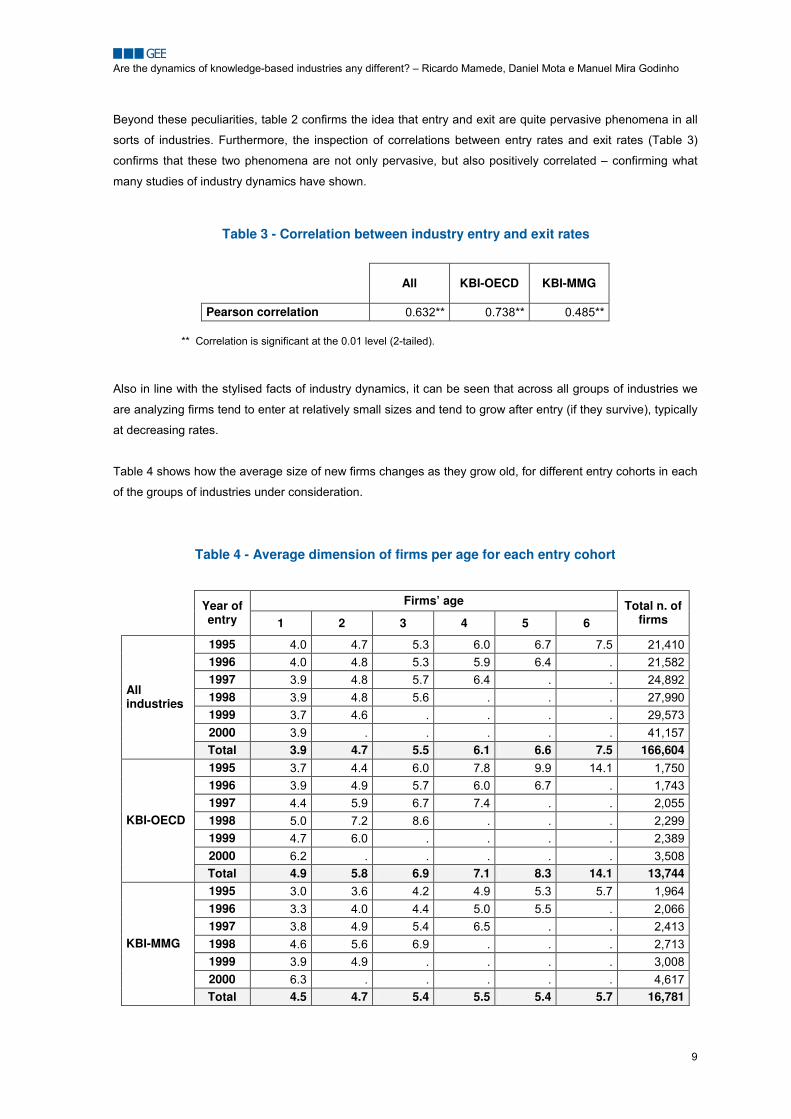
Beyond these peculiarities, table 2 confirms the idea that entry and exit are quite pervasive phenomena in all
sorts of industries. Furthermore, the inspection of correlations between entry rates and exit rates (Table 3)
confirms that these two phenomena are not only pervasive, but also positively correlated – confirming what
many studies of industry dynamics have shown.
Table 3 - Correlation between industry entry and exit rates
All KBI-OECD KBI-MMG
Pearson correlation 0.632** 0.738** 0.485** ** Correlation is significant at the 0.01 level (2-tailed).
Also in line with the stylised facts of industry dynamics, it can be seen that across all groups of industries we
are analyzing firms tend to enter at relatively small sizes and tend to grow after entry (if they survive), typically
at decreasing rates.
Table 4 shows how the average size of new firms changes as they grow old, for different entry cohorts in each
of the groups of industries under consideration.
Table 4 - Average dimension of firms per age for each entry cohort
Firms’ age
Year of entry 1 2 3 4 5 6
Total n. of firms
1995 4.0 4.7 5.3 6.0 6.7 7.5 21,410 1996 4.0 4.8 5.3 5.9 6.4 . 21,582 1997 3.9 4.8 5.7 6.4 . . 24,892 1998 3.9 4.8 5.6 . . . 27,990 1999 3.7 4.6 . . . . 29,573 2000 3.9 . . . . . 41,157
All industries
Total 3.9 4.7 5.5 6.1 6.6 7.5 166,604 1995 3.7 4.4 6.0 7.8 9.9 14.1 1,750 1996 3.9 4.9 5.7 6.0 6.7 . 1,743 1997 4.4 5.9 6.7 7.4 . . 2,055 1998 5.0 7.2 8.6 . . . 2,299 1999 4.7 6.0 . . . . 2,389 2000 6.2 . . . . . 3,508
KBI-OECD
Total 4.9 5.8 6.9 7.1 8.3 14.1 13,744 1995 3.0 3.6 4.2 4.9 5.3 5.7 1,964 1996 3.3 4.0 4.4 5.0 5.5 . 2,066 1997 3.8 4.9 5.4 6.5 . . 2,413 1998 4.6 5.6 6.9 . . . 2,713 1999 3.9 4.9 . . . . 3,008 2000 6.3 . . . . . 4,617
KBI-MMG
Total 4.5 4.7 5.4 5.5 5.4 5.7 16,781
Are the dynamics of knowledge-based industries any different? – Ricardo Mamede, Daniel Mota e Manuel Mira Godinho
10
Table 4 suggests that firms in KBIs industries tend to enter the market at higher sizes than firms in other
industries. It also suggests that the individual firms in the KBI-MMG group that entered the industries grew
slower than the rest of the firms during the period under analysis, particularly those in the KBI-OECD group.
Finally, further differences between KBIs and other industries can be detected by analysing the patterns of
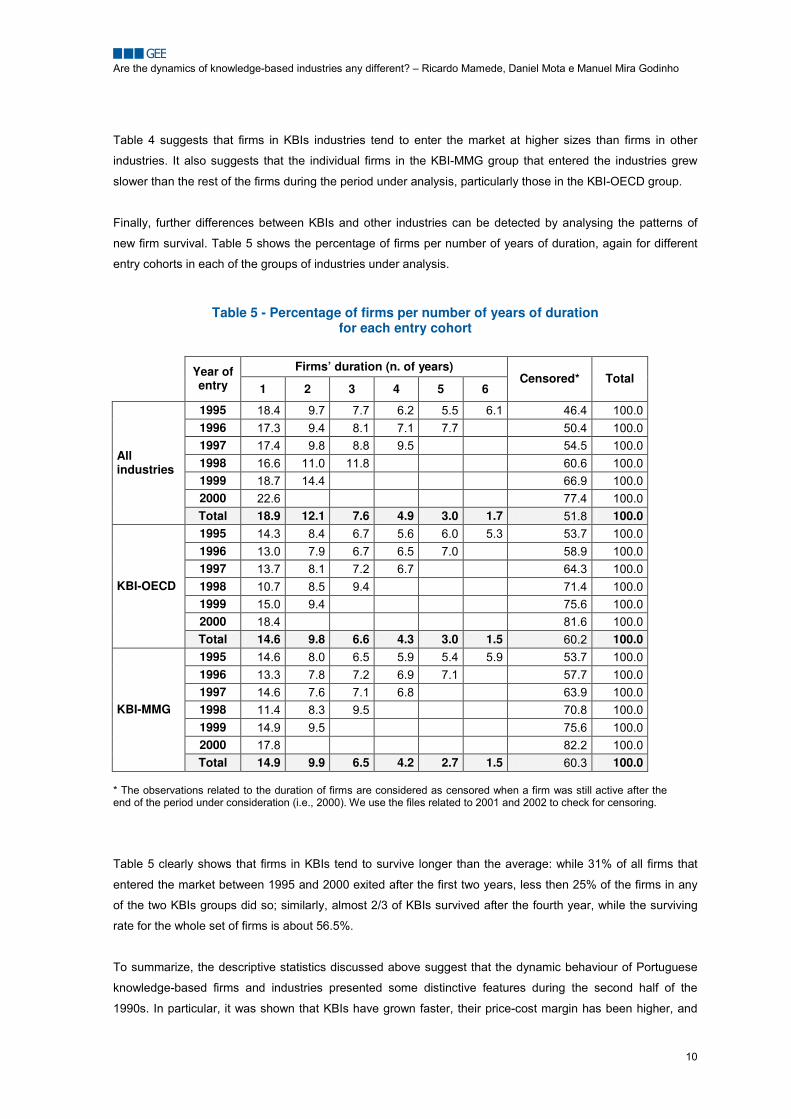
new firm survival. Table 5 shows the percentage of firms per number of years of duration, again for different
entry cohorts in each of the groups of industries under analysis.
Table 5 - Percentage of firms per number of years of duration for each entry cohort
Firms’ duration (n. of years) Year of
entry 1 2 3 4 5 6 Censored* Total
1995 18.4 9.7 7.7 6.2 5.5 6.1 46.4 100.0 1996 17.3 9.4 8.1 7.1 7.7 50.4 100.0 1997 17.4 9.8 8.8 9.5 54.5 100.0 1998 16.6 11.0 11.8 60.6 100.0 1999 18.7 14.4 66.9 100.0 2000 22.6 77.4 100.0
All industries
Total 18.9 12.1 7.6 4.9 3.0 1.7 51.8 100.0 1995 14.3 8.4 6.7 5.6 6.0 5.3 53.7 100.0 1996 13.0 7.9 6.7 6.5 7.0 58.9 100.0 1997 13.7 8.1 7.2 6.7 64.3 100.0 1998 10.7 8.5 9.4 71.4 100.0 1999 15.0 9.4 75.6 100.0 2000 18.4 81.6 100.0
KBI-OECD
Total 14.6 9.8 6.6 4.3 3.0 1.5 60.2 100.0 1995 14.6 8.0 6.5 5.9 5.4 5.9 53.7 100.0 1996 13.3 7.8 7.2 6.9 7.1 57.7 100.0 1997 14.6 7.6 7.1 6.8 63.9 100.0 1998 11.4 8.3 9.5 70.8 100.0 1999 14.9 9.5 75.6 100.0 2000 17.8 82.2 100.0
KBI-MMG
Total 14.9 9.9 6.5 4.2 2.7 1.5 60.3 100.0 * The observations related to the duration of firms are considered as censored when a firm was still active after the end of the period under consideration (i.e., 2000). We use the files related to 2001 and 2002 to check for censoring.
Table 5 clearly shows that firms in KBIs tend to survive longer than the average: while 31% of all firms that
entered the market between 1995 and 2000 exited after the first two years, less then 25% of the firms in any
of the two KBIs groups did so; similarly, almost 2/3 of KBIs survived after the fourth year, while the surviving
rate for the whole set of firms is about 56.5%.
To summarize, the descriptive statistics discussed above suggest that the dynamic behaviour of Portuguese
knowledge-based firms and industries presented some distinctive features during the second half of the
1990s. In particular, it was shown that KBIs have grown faster, their price-cost margin has been higher, and
Are the dynamics of knowledge-based industries any different? – Ricardo Mamede, Daniel Mota e Manuel Mira Godinho
11
firms within these industries have lived longer than the average. On the other hand, there seems to be some
differences between the two KBIs groups, namely in terms of entry rates.
In the following sections we try to understand to what extent such patterns are caused by different general
conditions and characteristics of firms/industries that are included in each group or, alternatively, to
differences in the factors that determine firm entry and firm survival in each industry type.
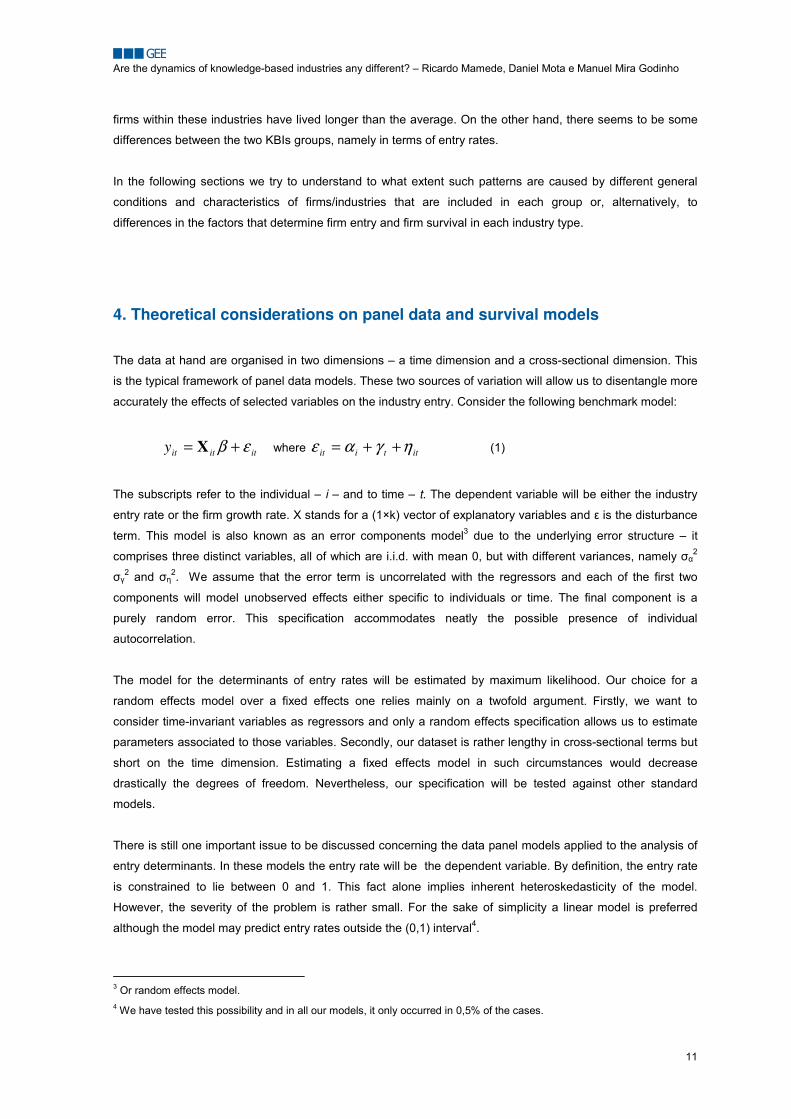
4. Theoretical considerations on panel data and survival models
The data at hand are organised in two dimensions – a time dimension and a cross-sectional dimension. This
is the typical framework of panel data models. These two sources of variation will allow us to disentangle more
accurately the effects of selected variables on the industry entry. Consider the following benchmark model:
ititity εβ += X where ittiit ηγαε ++= (1)
The subscripts refer to the individual – i – and to time – t. The dependent variable will be either the industry
entry rate or the firm growth rate. X stands for a (1×k) vector of explanatory variables and � is the disturbance
term. This model is also known as an error components model3 due to the underlying error structure – it
comprises three distinct variables, all of which are i.i.d. with mean 0, but with different variances, namely ��2
��2 and ��2. We assume that the error term is uncorrelated with the regressors and each of the first two
components will model unobserved effects either specific to individuals or time. The final component is a
purely random error. This specification accommodates neatly the possible presence of individual
autocorrelation.
The model for the determinants of entry rates will be estimated by maximum likelihood. Our choice for a
random effects model over a fixed effects one relies mainly on a twofold argument. Firstly, we want to
consider time-invariant variables as regressors and only a random effects specification allows us to estimate
parameters associated to those variables. Secondly, our dataset is rather lengthy in cross-sectional terms but
short on the time dimension. Estimating a fixed effects model in such circumstances would decrease
drastically the degrees of freedom. Nevertheless, our specification will be tested against other standard
models.
There is still one important issue to be discussed concerning the data panel models applied to the analysis of
entry determinants. In these models the entry rate will be the dependent variable. By definition, the entry rate
is constrained to lie between 0 and 1. This fact alone implies inherent heteroskedasticity of the model.
However, the severity of the problem is rather small. For the sake of simplicity a linear model is preferred
although the model may predict entry rates outside the (0,1) interval4.
3 Or random effects model. 4 We have tested this possibility and in all our models, it only occurred in 0,5% of the cases.
Are the dynamics of knowledge-based industries any different? – Ricardo Mamede, Daniel Mota e Manuel Mira Godinho
12
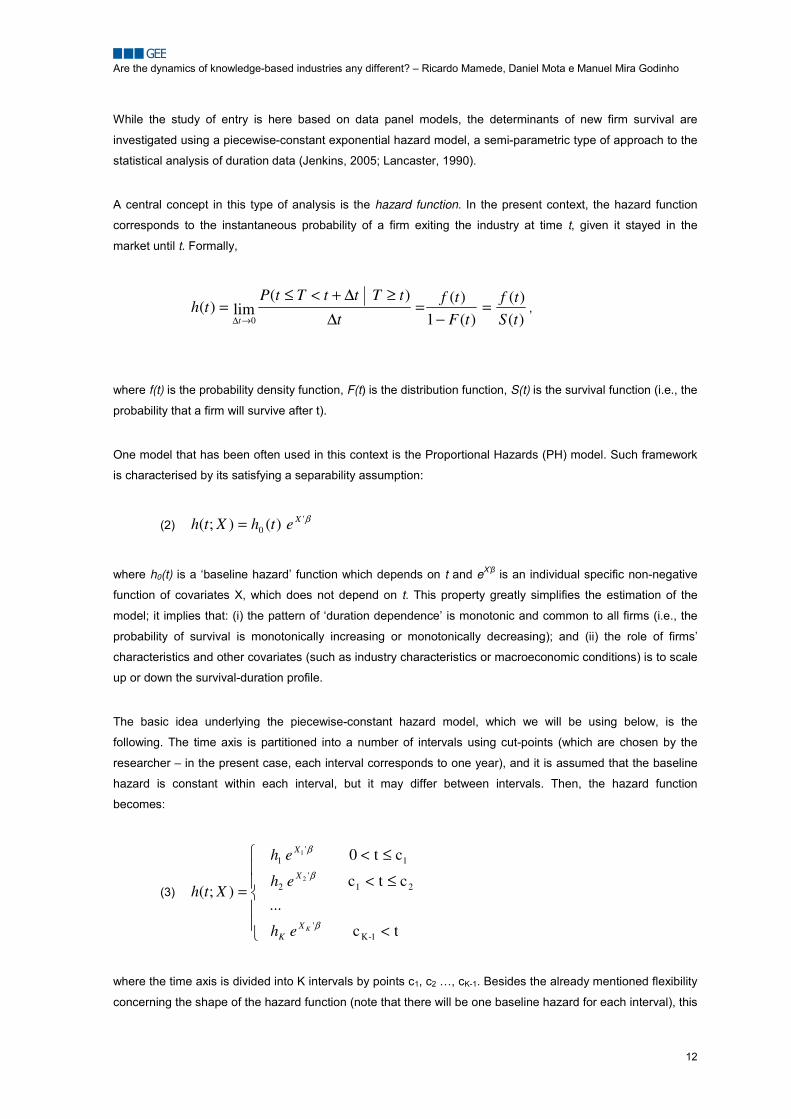
While the study of entry is here based on data panel models, the determinants of new firm survival are
investigated using a piecewise-constant exponential hazard model, a semi-parametric type of approach to the
statistical analysis of duration data (Jenkins, 2005; Lancaster, 1990).
A central concept in this type of analysis is the hazard function. In the present context, the hazard function
corresponds to the instantaneous probability of a firm exiting the industry at time t, given it stayed in the
market until t. Formally,
)()(
)(1)()(
lim)(0 tS
tftF
tft
tTttTtPth
t=
−=
∆≥∆+<≤
=→∆
,
where f(t) is the probability density function, F(t) is the distribution function, S(t) is the survival function (i.e., the
probability that a firm will survive after t).
One model that has been often used in this context is the Proportional Hazards (PH) model. Such framework
is characterised by its satisfying a separability assumption:
(2) β'0 )();( XethXth =
where h0(t) is a ‘baseline hazard’ function which depends on t and eX’� is an individual specific non-negative
function of covariates X, which does not depend on t. This property greatly simplifies the estimation of the
model; it implies that: (i) the pattern of ‘duration dependence’ is monotonic and common to all firms (i.e., the
probability of survival is monotonically increasing or monotonically decreasing); and (ii) the role of firms’
characteristics and other covariates (such as industry characteristics or macroeconomic conditions) is to scale
up or down the survival-duration profile.
The basic idea underlying the piecewise-constant hazard model, which we will be using below, is the
following. The time axis is partitioned into a number of intervals using cut-points (which are chosen by the
researcher – in the present case, each interval corresponds to one year), and it is assumed that the baseline
hazard is constant within each interval, but it may differ between intervals. Then, the hazard function
becomes:
(3)
��
�
��
�
�
<
≤<
≤<
=
tc
...
ctc
ct0
);(
1-K'
21'
2
1'
1
2
1
β
β
β
KXK
X
X
eh
eh
eh
Xth
where the time axis is divided into K intervals by points c1, c2 …, cK-1. Besides the already mentioned flexibility
concerning the shape of the hazard function (note that there will be one baseline hazard for each interval), this
Are the dynamics of knowledge-based industries any different? – Ricardo Mamede, Daniel Mota e Manuel Mira Godinho
13
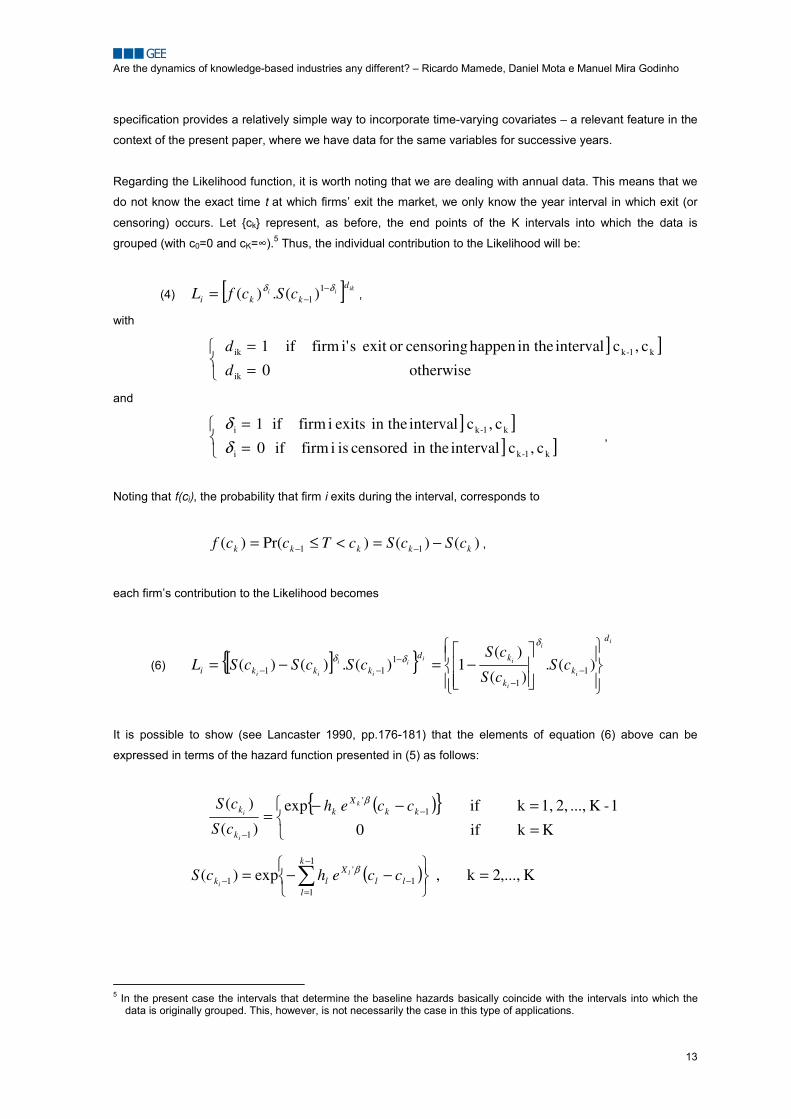
specification provides a relatively simple way to incorporate time-varying covariates – a relevant feature in the
context of the present paper, where we have data for the same variables for successive years.
Regarding the Likelihood function, it is worth noting that we are dealing with annual data. This means that we
do not know the exact time t at which firms’ exit the market, we only know the year interval in which exit (or
censoring) occurs. Let {ck} represent, as before, the end points of the K intervals into which the data is
grouped (with c0=0 and cK=�).5 Thus, the individual contribution to the Likelihood will be:
(4) [ ] ikiid
kki cScfL δδ −−= 11 )(.)( ,
with
] ]
otherwise 0
c ,c interval in thehappen censoringor exit si' firm if 1
ik
k1-kik
���
==
d
d
and
] ]] ]
c ,c interval in the censored is i firm if 0
c ,c interval in the exits i firm if 1
k1-ki
k1-ki
���
==
δδ
,
Noting that f(ci), the probability that firm i exits during the interval, corresponds to
)()()Pr()( 11 kkkkk cScScTccf −=<≤= −− ,
each firm’s contribution to the Likelihood becomes
(6) [ ]{ }i
i
i
i
iii
i
i
ii
d
kk
kd
kkki cScS
cScScScSL
��
��
�
��
��
�
��
���
−=−= −
−
−−− )(.
)(
)(1)(.)()( 1
1
111
δ
δδ
It is possible to show (see Lancaster 1990, pp.176-181) that the elements of equation (6) above can be
expressed in terms of the hazard function presented in (5) as follows:
( ){ }���
==−−
= −
− K k if 0
1-K ..., 2, 1,k if exp)(
)(1
'
1
kkX
k
k
k ccehcS
cS k
i
i
β
( ) K ,...,2k , exp)(1
11
'1 =
���
��� −−= �
−
=−−
k
lll
Xlk ccehcS l
i
β
5 In the present case the intervals that determine the baseline hazards basically coincide with the intervals into which the
data is originally grouped. This, however, is not necessarily the case in this type of applications.
Are the dynamics of knowledge-based industries any different? – Ricardo Mamede, Daniel Mota e Manuel Mira Godinho
14
5. Determinants of industry entry rates
In order to analyse the determinants of entry, we use a model which is inspired by the seminal paper by Orr
(1974). In general terms, we assume that the entry of new firms in a market is influenced by three groups of
factors: incentives to entry, entry barriers, and behaviour adopted by incumbents in order to prevent entry.
Both datasets available for the purpose of this study allow us to build approximate indicators for each of those
groups of factors. Thus, the following explanatory variables were used in the regressions6:
• Price-cost margin: it is considered as an incentive to entry, being used as a proxy for expected
profitability. We expect it to have a positive effect (if any) on entry rates.
• Industry growth: it is used as another proxy for expected profitability. We expect it to have a positive effect
on entry rates.
• Median firm dimension: it is used as a proxy for scale economies. It is expected to have a negative effect
on entry rates, since firms must enter at higher sizes if they are to avoid incurring higher average costs.
The barrier to entry stems from the need to raise more capital to start up given imperfections in the capital
markets.
• Advertising intensity: it is used as a proxy of product differentiation. It is expected to have a negative
effect on entry rates, since new firms must incur in additional advertising costs or lower revenues when
entering the market.
• Hirschman-Herfindhal (HH) index: higher concentration levels are expected to facilitate collusion among
the incumbents. This will make the entry of new firms harder.
The dependent variable in the regressions is the entry rate at the 5 digits industry level, computed as the
proportion of incumbent firms in each industry at period t which have entered the market in that same period.
Table 7 shows the bivariate correlations between the variables used in our regressions:
6 See section 3 above for a description of these variables.
Are the dynamics of knowledge-based industries any different? – Ricardo Mamede, Daniel Mota e Manuel Mira Godinho
15
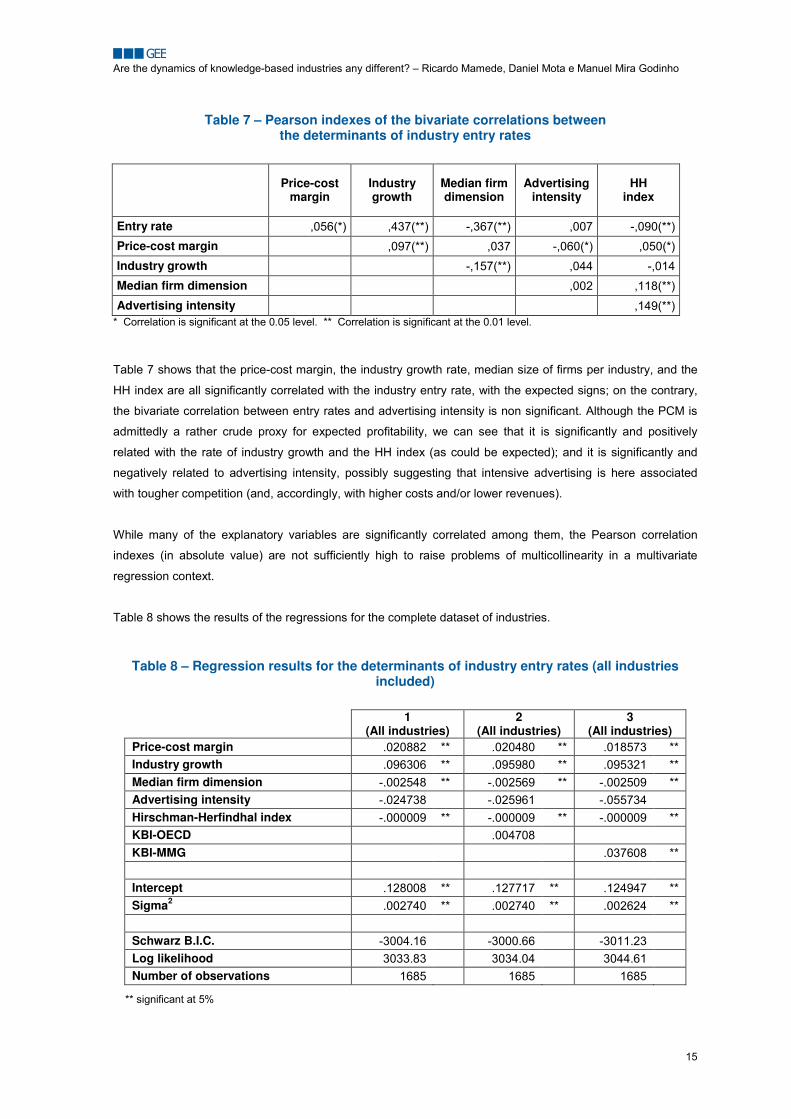
Table 7 – Pearson indexes of the bivariate correlations between the determinants of industry entry rates
Price-cost margin
Industry growth
Median firm dimension
Advertising intensity
HH index
Entry rate ,056(*) ,437(**) -,367(**) ,007 -,090(**) Price-cost margin ,097(**) ,037 -,060(*) ,050(*) Industry growth -,157(**) ,044 -,014 Median firm dimension ,002 ,118(**) Advertising intensity ,149(**)
* Correlation is significant at the 0.05 level. ** Correlation is significant at the 0.01 level.
Table 7 shows that the price-cost margin, the industry growth rate, median size of firms per industry, and the
HH index are all significantly correlated with the industry entry rate, with the expected signs; on the contrary,
the bivariate correlation between entry rates and advertising intensity is non significant. Although the PCM is
admittedly a rather crude proxy for expected profitability, we can see that it is significantly and positively
related with the rate of industry growth and the HH index (as could be expected); and it is significantly and
negatively related to advertising intensity, possibly suggesting that intensive advertising is here associated
with tougher competition (and, accordingly, with higher costs and/or lower revenues).
While many of the explanatory variables are significantly correlated among them, the Pearson correlation
indexes (in absolute value) are not sufficiently high to raise problems of multicollinearity in a multivariate
regression context.
Table 8 shows the results of the regressions for the complete dataset of industries.
Table 8 – Regression results for the determinants of industry entry rates (all industries included)
1 (All industries)
2 (All industries)
3 (All industries)
Price-cost margin .020882 ** .020480 ** .018573 ** Industry growth .096306 ** .095980 ** .095321 ** Median firm dimension -.002548 ** -.002569 ** -.002509 ** Advertising intensity -.024738 -.025961 -.055734 Hirschman-Herfindhal index -.000009 ** -.000009 ** -.000009 ** KBI-OECD .004708 KBI-MMG .037608 ** Intercept .128008 ** .127717 ** .124947 ** Sigma2 .002740 ** .002740 ** .002624 ** Schwarz B.I.C. -3004.16 -3000.66 -3011.23 Log likelihood 3033.83 3034.04 3044.61 Number of observations 1685 1685 1685
** significant at 5%
Are the dynamics of knowledge-based industries any different? – Ricardo Mamede, Daniel Mota e Manuel Mira Godinho
16
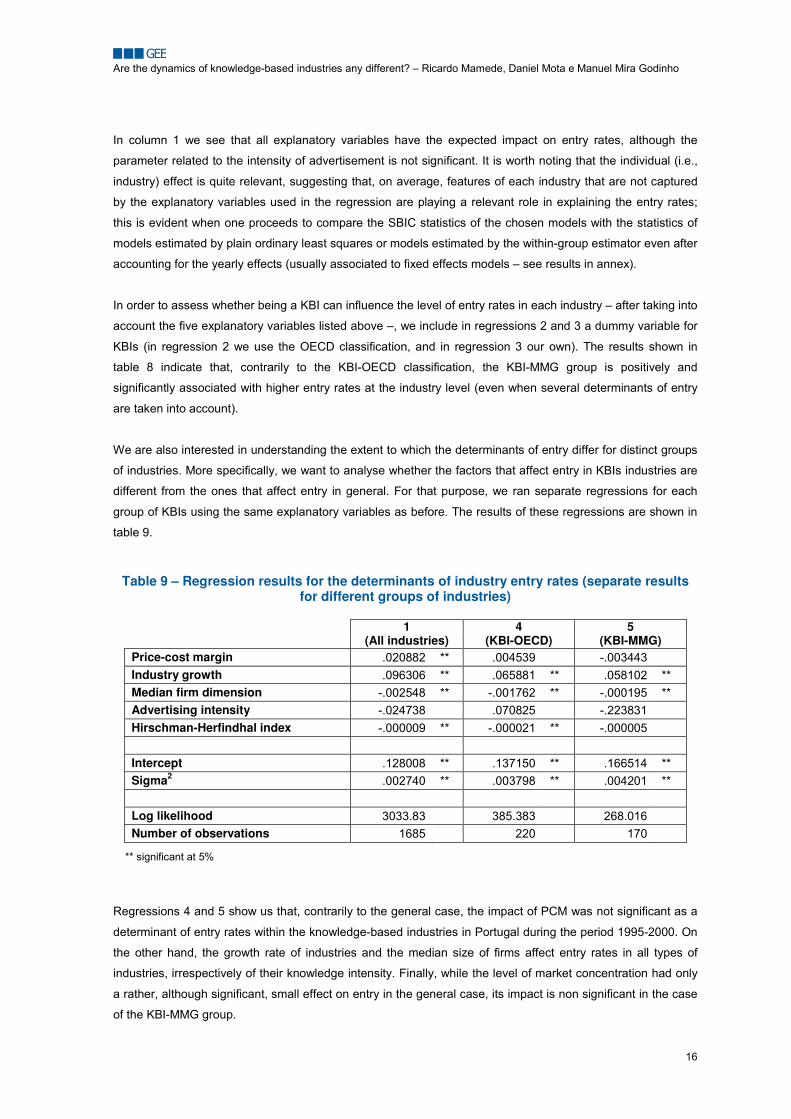
In column 1 we see that all explanatory variables have the expected impact on entry rates, although the
parameter related to the intensity of advertisement is not significant. It is worth noting that the individual (i.e.,
industry) effect is quite relevant, suggesting that, on average, features of each industry that are not captured
by the explanatory variables used in the regression are playing a relevant role in explaining the entry rates;
this is evident when one proceeds to compare the SBIC statistics of the chosen models with the statistics of
models estimated by plain ordinary least squares or models estimated by the within-group estimator even after
accounting for the yearly effects (usually associated to fixed effects models – see results in annex).
In order to assess whether being a KBI can influence the level of entry rates in each industry – after taking into
account the five explanatory variables listed above –, we include in regressions 2 and 3 a dummy variable for
KBIs (in regression 2 we use the OECD classification, and in regression 3 our own). The results shown in
table 8 indicate that, contrarily to the KBI-OECD classification, the KBI-MMG group is positively and
significantly associated with higher entry rates at the industry level (even when several determinants of entry
are taken into account).
We are also interested in understanding the extent to which the determinants of entry differ for distinct groups
of industries. More specifically, we want to analyse whether the factors that affect entry in KBIs industries are
different from the ones that affect entry in general. For that purpose, we ran separate regressions for each
group of KBIs using the same explanatory variables as before. The results of these regressions are shown in
table 9.
Table 9 – Regression results for the determinants of industry entry rates (separate results for different groups of industries)
1 (All industries)
4 (KBI-OECD)
5 (KBI-MMG)
Price-cost margin .020882 ** .004539 -.003443 Industry growth .096306 ** .065881 ** .058102 ** Median firm dimension -.002548 ** -.001762 ** -.000195 ** Advertising intensity -.024738 .070825 -.223831 Hirschman-Herfindhal index -.000009 ** -.000021 ** -.000005 Intercept .128008 ** .137150 ** .166514 ** Sigma2 .002740 ** .003798 ** .004201 ** Log likelihood 3033.83 385.383 268.016 Number of observations 1685 220 170
** significant at 5%
Regressions 4 and 5 show us that, contrarily to the general case, the impact of PCM was not significant as a
determinant of entry rates within the knowledge-based industries in Portugal during the period 1995-2000. On
the other hand, the growth rate of industries and the median size of firms affect entry rates in all types of
industries, irrespectively of their knowledge intensity. Finally, while the level of market concentration had only
a rather, although significant, small effect on entry in the general case, its impact is non significant in the case
of the KBI-MMG group.
Are the dynamics of knowledge-based industries any different? – Ricardo Mamede, Daniel Mota e Manuel Mira Godinho
17
We will leave the discussion of these results for the concluding section of the paper. Before that, we discuss in
the next section the determinants of firm survival.
6. Determinants of new firm survival
In the last two decades the studies on the determinants of new firm survival have proliferated. Firm survival
has been found to be robustly related with firm-specific variables such as size and age – which typically have
a negative impact on survival chances (e.g., Dunne et al., 1989; Mata and Portugal, 1994; Audretsch and
Mahmood, 1995; Wagner, 1999) – and less robustly related with other industry-specific and macroeconomic
variables.
The specific relation between survival and age of firms which is identified in the empirical exercises can be
very sensitive to the models used for estimations. As was pointed out in section 4 above, the Proportional
Hazards (PH) model is often used in studies on the determinants of new firm survival, largely due to the
simplicity of its estimation. However this model implicitly assumes that the pattern of ‘duration dependence’ is
monotonic, that is, that the probability of survival is monotonically increasing or monotonically decreasing with
firms’ age – which needs not be the case.
In fact, while there are reasons to believe that age makes firms less prone to failure – e.g., it may take time for
firms to discover the true worth of their competencies (as suggested by Jovanovic, 1982) or to develop
specific knowledge, trust and appropriate routines (as put forward by organisational ecologists; see Carroll
and Hannan, 2000) – it is not obvious that this relation has to be monotonic. In fact it can be argued that new
firms will stay in the market until they exhaust the initial resources they have gathered for the new venture.
This may imply that the probability of survival will decrease in the immediate years after entry, and increase
only after new firms have either succeeded in stabilising their cash-flows or, alternatively, exhausted their
start-up financial resources and exit the market. The model we use here, the piecewise-constant hazard
model, does not impose any specific form to the relation between survival and age, allowing therefore to
identify possible non-monotonic shapes of such relation.
In addition to age and size, we have included as an explanatory variable the proportion of graduates (as a
proxy of human capital). Furthermore, we have controlled for the annual growth rate of the industry each firm
belongs to, as well as for the annual GDP growth (in order to account for the influences of the general
economic climate upon firms’ survival chances).
The tables below present the results of the regressions, having the hazard rates as the dependent variable
(see section 4).
Are the dynamics of knowledge-based industries any different? – Ricardo Mamede, Daniel Mota e Manuel Mira Godinho
18
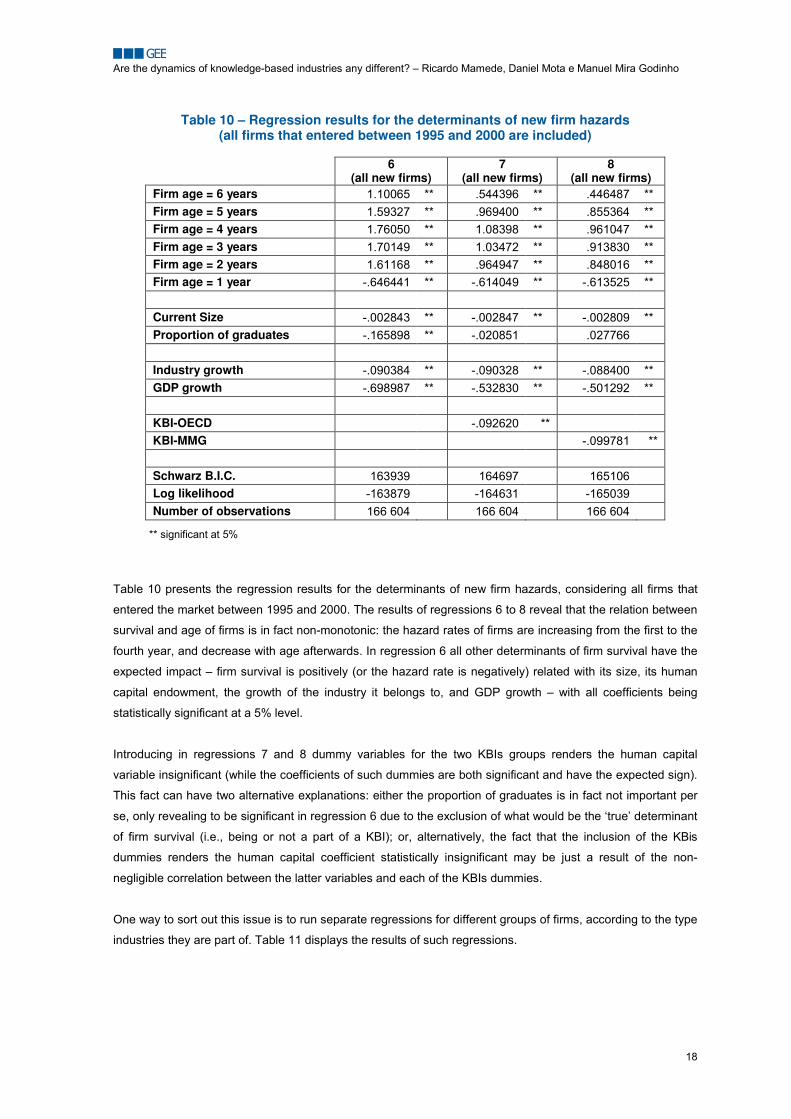
Table 10 – Regression results for the determinants of new firm hazards (all firms that entered between 1995 and 2000 are included)
6
(all new firms) 7
(all new firms) 8
(all new firms) Firm age = 6 years 1.10065 ** .544396 ** .446487 ** Firm age = 5 years 1.59327 ** .969400 ** .855364 ** Firm age = 4 years 1.76050 ** 1.08398 ** .961047 ** Firm age = 3 years 1.70149 ** 1.03472 ** .913830 ** Firm age = 2 years 1.61168 ** .964947 ** .848016 ** Firm age = 1 year -.646441 ** -.614049 ** -.613525 ** Current Size -.002843 ** -.002847 ** -.002809 ** Proportion of graduates -.165898 ** -.020851 .027766 Industry growth -.090384 ** -.090328 ** -.088400 ** GDP growth -.698987 ** -.532830 ** -.501292 ** KBI-OECD -.092620 ** KBI-MMG -.099781 ** Schwarz B.I.C. 163939 164697 165106 Log likelihood -163879 -164631 -165039 Number of observations 166 604 166 604 166 604
** significant at 5% Table 10 presents the regression results for the determinants of new firm hazards, considering all firms that
entered the market between 1995 and 2000. The results of regressions 6 to 8 reveal that the relation between
survival and age of firms is in fact non-monotonic: the hazard rates of firms are increasing from the first to the
fourth year, and decrease with age afterwards. In regression 6 all other determinants of firm survival have the
expected impact – firm survival is positively (or the hazard rate is negatively) related with its size, its human
capital endowment, the growth of the industry it belongs to, and GDP growth – with all coefficients being
statistically significant at a 5% level.
Introducing in regressions 7 and 8 dummy variables for the two KBIs groups renders the human capital
variable insignificant (while the coefficients of such dummies are both significant and have the expected sign).
This fact can have two alternative explanations: either the proportion of graduates is in fact not important per
se, only revealing to be significant in regression 6 due to the exclusion of what would be the ‘true’ determinant
of firm survival (i.e., being or not a part of a KBI); or, alternatively, the fact that the inclusion of the KBis
dummies renders the human capital coefficient statistically insignificant may be just a result of the non-
negligible correlation between the latter variables and each of the KBIs dummies.
One way to sort out this issue is to run separate regressions for different groups of firms, according to the type
industries they are part of. Table 11 displays the results of such regressions.
Are the dynamics of knowledge-based industries any different? – Ricardo Mamede, Daniel Mota e Manuel Mira Godinho
19
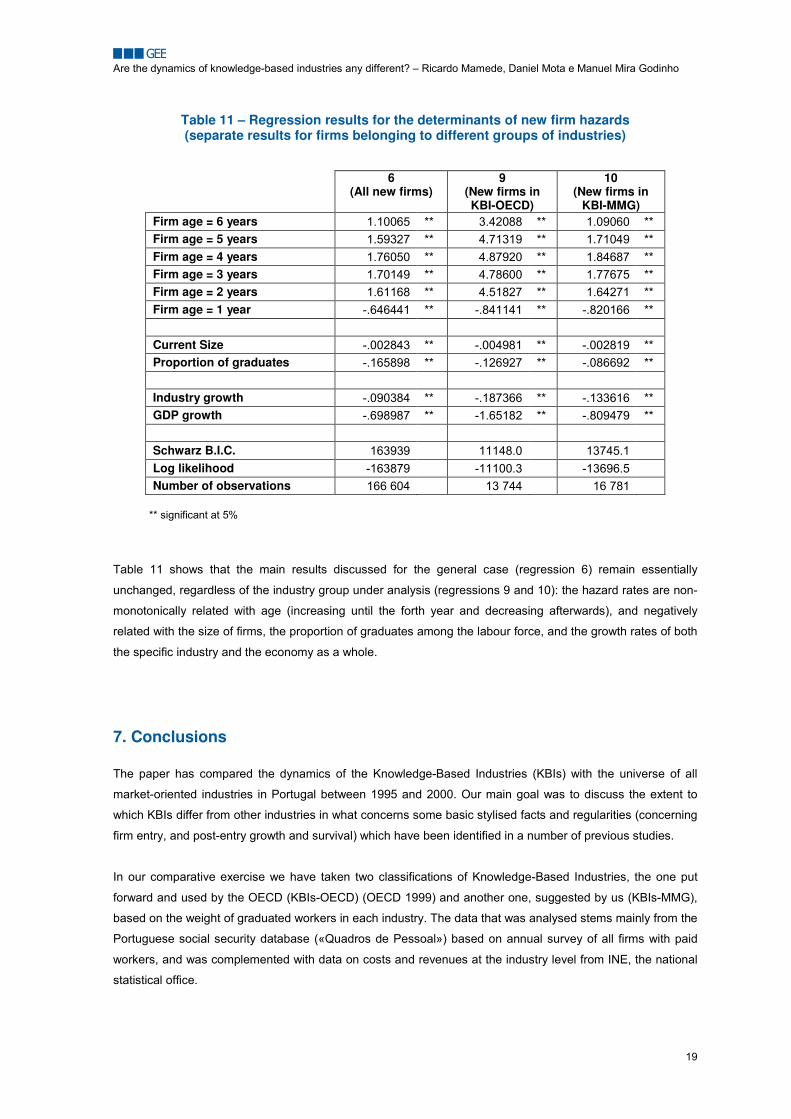
Table 11 – Regression results for the determinants of new firm hazards (separate results for firms belonging to different groups of industries)
6
(All new firms)
9 (New firms in KBI-OECD)
10 (New firms in
KBI-MMG) Firm age = 6 years 1.10065 ** 3.42088 ** 1.09060 ** Firm age = 5 years 1.59327 ** 4.71319 ** 1.71049 ** Firm age = 4 years 1.76050 ** 4.87920 ** 1.84687 ** Firm age = 3 years 1.70149 ** 4.78600 ** 1.77675 ** Firm age = 2 years 1.61168 ** 4.51827 ** 1.64271 ** Firm age = 1 year -.646441 ** -.841141 ** -.820166 ** Current Size -.002843 ** -.004981 ** -.002819 ** Proportion of graduates -.165898 ** -.126927 ** -.086692 ** Industry growth -.090384 ** -.187366 ** -.133616 ** GDP growth -.698987 ** -1.65182 ** -.809479 ** Schwarz B.I.C. 163939 11148.0 13745.1 Log likelihood -163879 -11100.3 -13696.5 Number of observations 166 604 13 744 16 781
** significant at 5%
Table 11 shows that the main results discussed for the general case (regression 6) remain essentially
unchanged, regardless of the industry group under analysis (regressions 9 and 10): the hazard rates are non-
monotonically related with age (increasing until the forth year and decreasing afterwards), and negatively
related with the size of firms, the proportion of graduates among the labour force, and the growth rates of both
the specific industry and the economy as a whole.
7. Conclusions
The paper has compared the dynamics of the Knowledge-Based Industries (KBIs) with the universe of all
market-oriented industries in Portugal between 1995 and 2000. Our main goal was to discuss the extent to
which KBIs differ from other industries in what concerns some basic stylised facts and regularities (concerning
firm entry, and post-entry growth and survival) which have been identified in a number of previous studies.
In our comparative exercise we have taken two classifications of Knowledge-Based Industries, the one put
forward and used by the OECD (KBIs-OECD) (OECD 1999) and another one, suggested by us (KBIs-MMG),
based on the weight of graduated workers in each industry. The data that was analysed stems mainly from the
Portuguese social security database («Quadros de Pessoal») based on annual survey of all firms with paid
workers, and was complemented with data on costs and revenues at the industry level from INE, the national
statistical office.
Are the dynamics of knowledge-based industries any different? – Ricardo Mamede, Daniel Mota e Manuel Mira Godinho
20
The descriptive analyses of the data have basically confirmed a number of well-known statistical regularities
concerning the evolution of firms and industries, namely: entry and exit are quite pervasive in all sorts of
industries; firms’ average size grows as firms grow older; and the proportion of firms leaving the market in the
first few years after entry is quite high.
In the same vein, the regression analyses have confirmed some stylised results, in particular:
� the entry of new firms responds positively to incentives (in particular to industry growth) and
negatively to barriers to entry (namely, the presence of economies of scale measured in terms of the
median dimension of firms in each industry); and
� the survival of new firms is positively related with size, even after controlling for human capital
endowment, industry growth, and GDP growth.
In what concerns the impact of age on firm survival, we have found a non-monotonic relation, with the hazard
rates of firms increasing up to the fourth year after entry and declining afterwards. While this result deviates
from the often found positive relation between age and survival of firms, this deviation may well be explained
by the fact that many previous studies on firm survival did not allow for a non-monotonic relation between the
two variables.
More relevant to the aim of this paper is the discussion of the specificities of KBIs in the domains just
mentioned. In fact we have found that KBIs (regardless of how they are classified) and the firms within them
show some signs of distinctiveness in their dynamics as compared to the general case. In particular, on
average:
� KBIs have higher growth rates;
� entry within the KBIs groups is less responsive to incentives (contrarily to the general case, the
impact of the PCM on entry is not significant; and the impact of industry growth, though significant, is
less expressive);
� KBIs firms have higher survival chances;
� the survival of firms belonging to KBIs is somewhat more dependent on industry growth than in the
general case.
These results go beyond confirming the idea that knowledge-based industries were fast growing industries in
the second half of the 1990s. They seem to suggest that the creation of firms in these industries is induced by
somewhat different factors than in other industries, a result with potentially relevant policy implications. In
particular, with the variables accounting for profitability expectations and entry rates not showing the same
pattern as for the general case, incentives-based policies (e.g., tax incentives for new technology based firms)
might be less effective in promoting entrepreneurship in these industries than in other cases (in other words,
the determinants of new firm creation are probably more related with the availability of relevant skills and
competences than with market incentives).
Are the dynamics of knowledge-based industries any different? – Ricardo Mamede, Daniel Mota e Manuel Mira Godinho
21
Those results also seem to suggest that the survival of firms in knowledge-based industries is more prone to
downturns in the business cycle, calling to the need to pay greater attention to the sustainability of new
knowledge-based enterprises when devising mechanisms to support such activities.
8. References
Audretsch, D. and T. Mahmood (1995). “New Firm Survival: New Results Using a Hazard Function.” Review of
Economics and Statistics 77(1): 97-103
Cabral, L. and Mata, J. (2003). “On the Evolution of the Firm Size Distribution: Facts and Theory”. American Economic Review 93(4): 1075-1090.
Caves, R (1998). “Industrial Organization and New Findings on the Turnover and Mobility of Firms.” Journal of Economic Literature 36:1947-82.
Carroll, G. and Hannan, M. (2000). The Demography of Corporations and Industries. Princeton: Princeton University Press.
Dosi, G., F. Malerba, O. Marsili, and L. Orsenigo (1997). “Industrial Structures and Dynamics: Evidence, Interpretations and Puzzles.” Industrial and Corporate Change 6(1):3-24.
Dunne, T., M. Roberts, and L. Samuelson (1989). “The Growth and Failure of US Manufacturing Plants.” Quarterly Journal of Economics 104(4):671-98.
Evans, D. (1987). “The Relationship Between Firm Growth, Size, and Age: Estimates for 100 Manufacturing Industries”. Journal of Industrial Economics 35(4): 567-581.
Geroski, P. (1995). “What Do We Know About Entry?”. International Journal of Industrial Organization 13:421-40.
Jenkins, S. (2004). Survival Analysis. Unpublished manuscript, Institute for Social and Economic Research, University of Essex, Colchester, UK.
Jovanovic, B. (1982). “Selection and the Evolution of Industry.” Econometrica 50(3): 649-70.
Lancaster, T. (1990). Econometric Analysis of Transition Data. Cambridge, MA: Cambridge University Press.
Mata, J. and P. Portugal (1994). “Life Duration of New Firms”. Journal of Industrial Economics 42(3): 227-245
OECD (1999). OECD Science, Technology and Industry Scoreboard : Benchmarking Knowledge-based Economies 1999. Paris: Organisation for Economic Co-operation and Development.
OECD (2005). OECD Science, Technology and Industry Scoreboard 2005. Paris: Organisation for Economic Co-operation and Development.
Orr, D. (1974). “The determinants of entry: a study of the Canadian manufacturing industries”. Review of Economics and Statistics 56(1): 58-66.
Portugal, P. and Cardoso, A.R. (2006). “Disentangling the Minimum Wage Puzzle: An Analysis of Worker Accessions and Separations”. Journal of the European Economic Association 4(5): 988-1013.
Wagner, J. (1999). “The Life History of Cohorts of Exits from German Manufacturing”. Small Business Economics 13: 71-79.
Are the dynamics of knowledge-based industries any different? – Ricardo Mamede, Daniel Mota e Manuel Mira Godinho
22
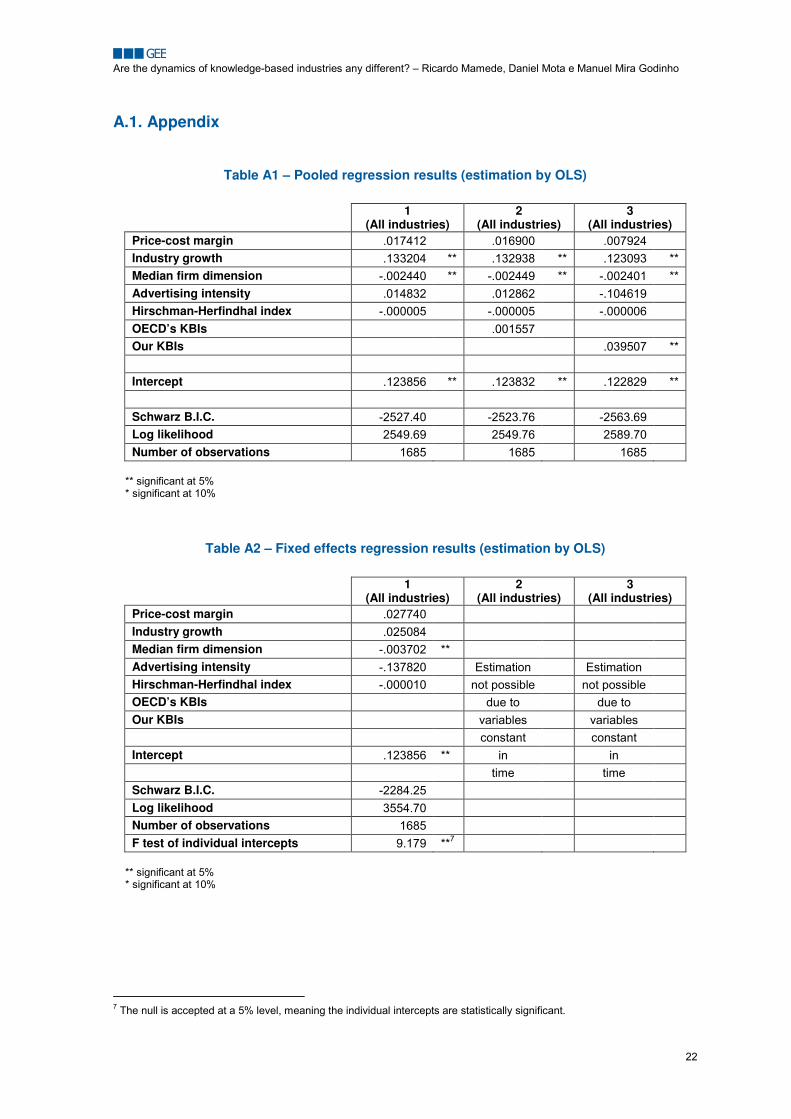
A.1. Appendix
Table A1 – Pooled regression results (estimation by OLS)
1 (All industries)
2 (All industries)
3 (All industries)
Price-cost margin .017412 .016900 .007924 Industry growth .133204 ** .132938 ** .123093 ** Median firm dimension -.002440 ** -.002449 ** -.002401 ** Advertising intensity .014832 .012862 -.104619 Hirschman-Herfindhal index -.000005 -.000005 -.000006 OECD’s KBIs .001557 Our KBIs .039507 ** Intercept .123856 ** .123832 ** .122829 ** Schwarz B.I.C. -2527.40 -2523.76 -2563.69 Log likelihood 2549.69 2549.76 2589.70 Number of observations 1685 1685 1685
** significant at 5% * significant at 10%
Table A2 – Fixed effects regression results (estimation by OLS)
1 (All industries)
2 (All industries)
3 (All industries)
Price-cost margin .027740 Industry growth .025084 Median firm dimension -.003702 ** Advertising intensity -.137820 Estimation Estimation Hirschman-Herfindhal index -.000010 not possible not possible OECD’s KBIs due to due to Our KBIs variables variables constant constant Intercept .123856 ** in in time time Schwarz B.I.C. -2284.25 Log likelihood 3554.70 Number of observations 1685 F test of individual intercepts 9.179 **7
** significant at 5% * significant at 10%
7 The null is accepted at a 5% level, meaning the individual intercepts are statistically significant.