
MMDS- Stanford 2008 Harmonic Analysis, diffusion geometries and Multi Scale organizations of data...
32
MMDS- Stanford 2008 Harmonic Analysis, diffusion geometries and Multi Scale organizations of data and matrices . R.R Coifman Department of Mathematics ,Yale University Joint work with: J.Bremer, P.Jones,S. Lafon, M. Maggioni, B. Nadler, F. Warner, Y. Keller, A. Singer, Y Shkolnisky, Y. Kevrekides,V.Rokhlin, S.W. Zucker.
-
Upload
marjorie-bradford -
Category
Documents
-
view
220 -
download
3
Transcript of MMDS- Stanford 2008 Harmonic Analysis, diffusion geometries and Multi Scale organizations of data...

MMDS- Stanford 2008 Harmonic Analysis, diffusion geometries and Multi Scale organizations of data and matrices .
R.R Coifman Department of Mathematics ,Yale University
Joint work with:J.Bremer, P.Jones,S. Lafon, M. Maggioni, B. Nadler, F. Warner, Y. Keller, A. Singer, Y Shkolnisky, Y. Kevrekides,V.Rokhlin, S.W. Zucker.

We elaborate on the idea that “The Network” encapsulates knowledge.
Inferential/diffusion geometries on digital data graphs, enable the organization and analysis of empirical data as well as "signal processing" of functions on data.
In particular we will describe various natural multiscale structures on data which enable automatic ontology and “language building” for abstract digital data. These developments extend geometries of spectral graph theory, kernel machines and other machine learning tools.

Digital data clouds can be organized through an affinity kernel A(x,y) where expert knowledge enters to build associations between documents. Such affinity is only robust for “nearest neighbors”.
Two basic approaches for organizing data
I. Hierarchical folder building and clustering , a bottom up approach which propagates or diffuses affinity between documents=points . Can be achieved through probabilistic model building and statistical/combinatorial “book keeping” on the data
II. A dimensional reduction approach which embeds the data in low dimensional Euclidean space , through the use of eigenvectors of the affinity kernel A (or related Matrix) followed by clustering and processing in that dimension.
These two approaches, seemingly different, can be shown to be mathematically equivalent through the introduction of multiscale “inferential folder” structures based on affinity diffusions.
The eigenvectors are global functions on the data which “integrate” precisely the local “infinitesimal” affinity geometry.
Conversely “wavelet like” functions defined by affinity folders enable efficient “informed embeddings” of the data in low dimensional spaces. (As well as an efficient synthesis of the eigenfunctions .)

Overview
• Eigenvector “magic”.
• Diffusion geometry , eigenvectors as an extension of Newtonian calculus.
• Multiscale geometry , localization of eigenvectors
folder geometries or automatic ontologies. (the Zygmund program)
• The analysis of operators ,or data matrices such as questionnaires .
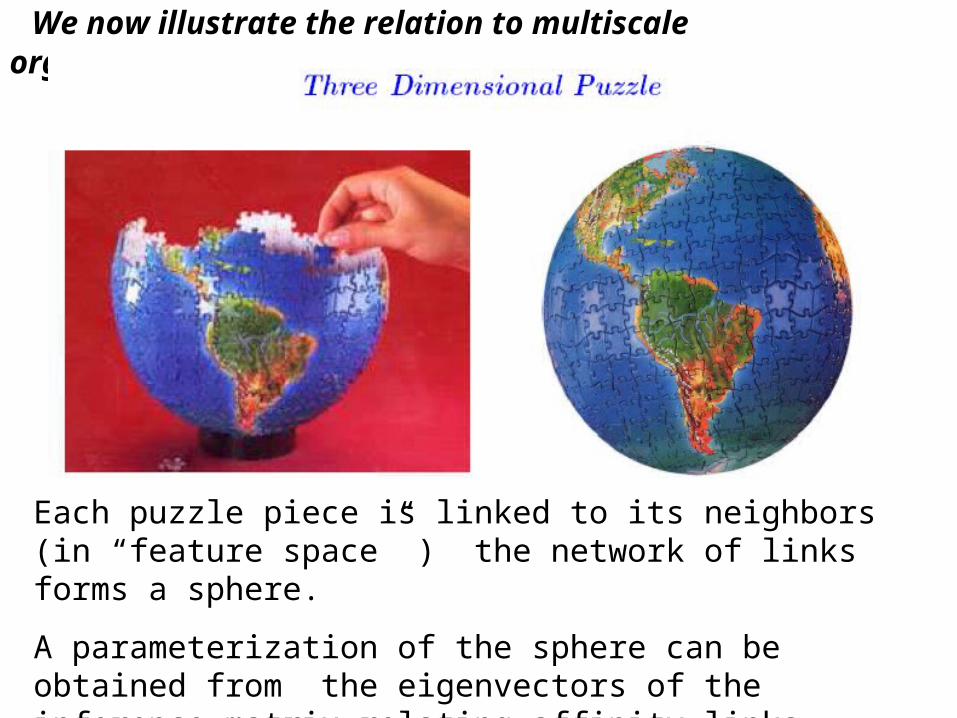
We now illustrate the relation to multiscale organization
Each puzzle piece is linked to its neighbors (in “feature space” ) the network of links forms a sphere.
A parameterization of the sphere can be obtained from the eigenvectors of the inference matrix relating affinity links between pieces (diffusion operator).

We illustrate the role of graph harmonic analysis to process We illustrate the role of graph harmonic analysis to process complex data such as images .complex data such as images .
Given an image, associate with each pixel p a vector v(p) Given an image, associate with each pixel p a vector v(p) of features . For example the 5x5 subimage centered at the of features . For example the 5x5 subimage centered at the pixel ,or any combination of features . Define a Markov pixel ,or any combination of features . Define a Markov matrix A as matrix A as
q
qpqvpv
qvpvA
)/)()(exp(
)/)()(exp(
2
2
,
We claim that the eigenvectors of this matrix We claim that the eigenvectors of this matrix contain all the geometric information concerning the contain all the geometric information concerning the structure of the image structure of the image

The image on the left is projected into the three dimensional space spanned by the eigenvectors 5 ,8 10 (red, green, blue) which are active on a chosen point on the scarf.
The image above is viewed as a data base of all sub images of size 5x5, natural structures are discovered through projections on various subspaces.

The First two eigenfunctions organize the small images which were provided in random order, in fact assembling the 3D puzzle.

Organizing audio segments extracted from a large data base of tracks

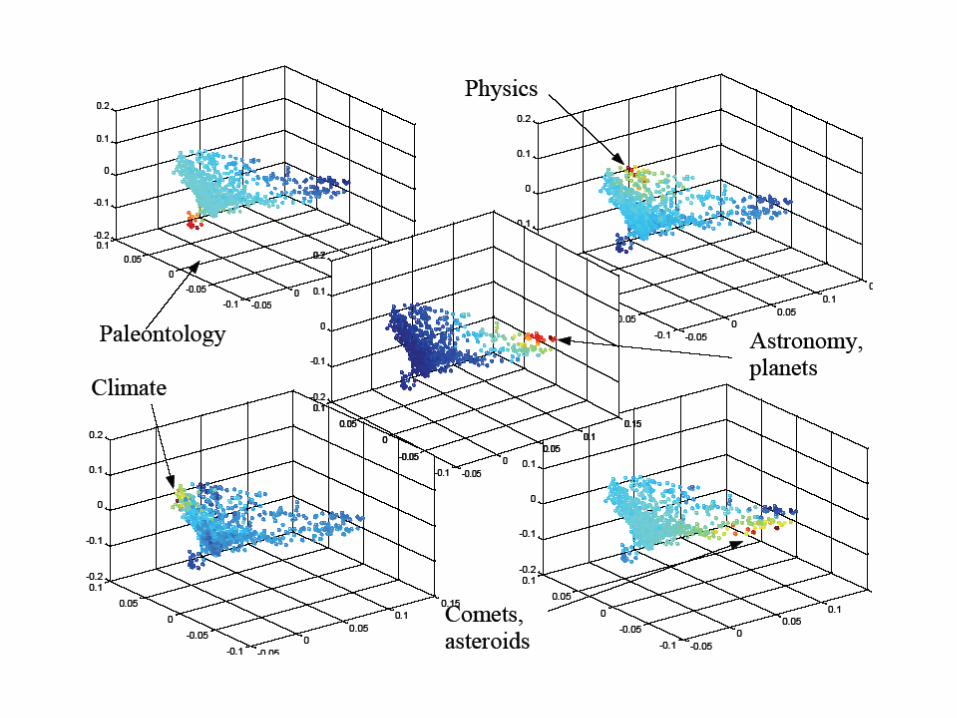
The topical clusters are typically “linear”

A simple way to understand the relation between eigenvectors and geometry is provided by The sensor network local to global positioning problem.
For each city in the US we know the distance to a few neighbors , how do we get the global position ?

,
, ,
Let P be the location of city (or sensor) i . From the
knowledge of the distance to a few neighbors P we
can easily calculate from local connections weights
so that :
P P where
i
j
i j
i i j j i jj i j
W
W W
1
Clearly both x and y coordinates (as well as 1)
are eigenvetors of the matrix W.
The matrix W is a local encapsulation of the
relation between cities.
i
Solution by A. Singer may 2007

Generalization of the fundamental theorem of calculus .
Assume that at each site you know the difference of
altitude between cities and some of their neighbours
we get the global function as the z eigenfunction of the
3 dimensional version .
Basically find the altitude function from its local increments.

We observe that given f we can easily solve the Poisson
equation (or any other "differential equation") on graphs
u=f, where ,
and A is any local averaging operator.
In fact let B= A+ A (I-A
I A
) with = , sgn( ),
It is easy to check that
Bu=u
and therefore the solution to the Poisson equation is
an eigenvector of B with eigenvalue 1.
ff
A f

Example of E Coli
Observed from random
angles .
The full three d picture is rebuild from knowledge of local angular distances using the center of mass method
A similar protein reconstruction from NMR enables to rebuild in a few seconds on a laptop a structure that currently takes hours on a supercomputer using conventional optimization.
reconstructions
Cryo-Microscopy
Application
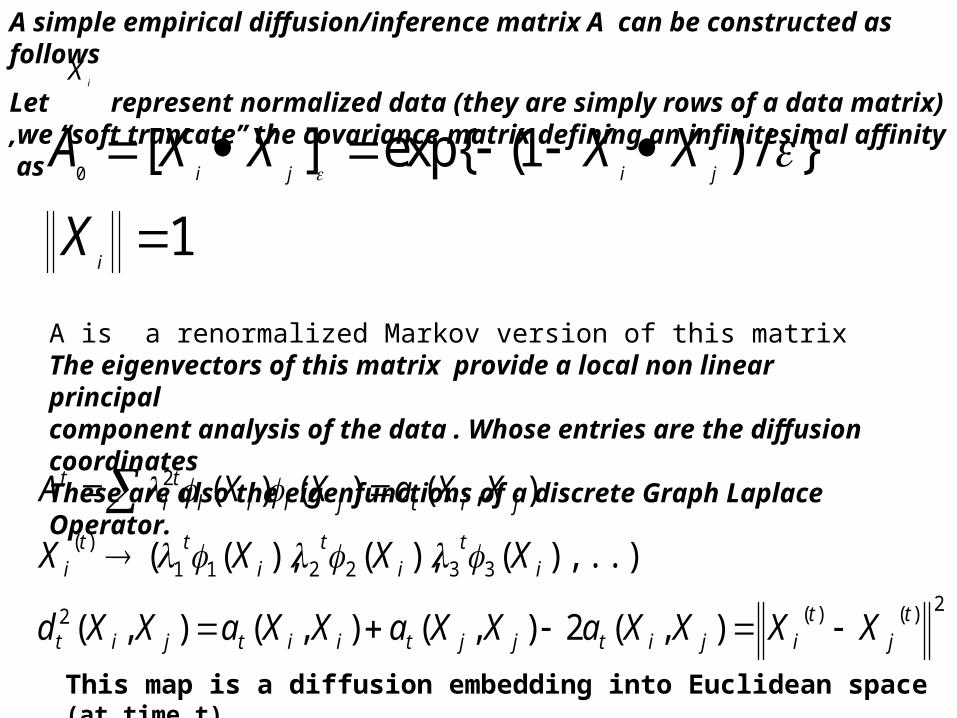
A simple empirical diffusion/inference matrix A can be constructed as follows
Let represent normalized data (they are simply rows of a data matrix) ,we “soft truncate” the covariance matrix defining an infinitesimal affinity as
0[ ] exp{ (1 ) / }
1
i j i j
i
A X X X X
X
A is a renormalized Markov version of this matrixThe eigenvectors of this matrix provide a local non linear principalcomponent analysis of the data . Whose entries are the diffusion coordinatesThese are also the eigenfunctions of a discrete Graph Laplace Operator.
2)()(2
332211)(
2
),(2),(),(),(
),..)(),(),((
),()()(
tj
tijitjjtiitjit
it
it
itt
i
jitjlilt
lt
XXXXaXXaXXaXXd
XXXX
XXaXXA
This map is a diffusion embedding into Euclidean space (at time t) .
iX

2
,
An alternative affinity matrix between points
exp( / )A i j
i j
i j
x x
Where the weights are selected so that A is Markov or similar to a Markov matrix defining a diffusion on the cloud of points .
ix

If we consider the spectrum of the various powers of the diffusion operator A we see that its numerical rank can drop dramatically.
This property enables both data filtering and multiscale analysis
0 5 10 15 20 25 30
0.1
0.2
0.3
0.4
0.5
0.6
0.7
0.8
0.9
1
(T2)
V0 V
1 V
2 V
3 ...
(T4)
(T8)
(T16)

Diffusions between A and B have to go through the bottleneck ,while C is easily reachable from B. The Markov matrix defining a diffusion could be given by a kernel , or by inference between neighboring nodes.
The diffusion distance accounts for preponderance of inference links . The shortest path between A and C is roughly the same as between B and C . The diffusion distance however is larger since diffusion occurs through a bottleneck.
Diffusion Geometry

The long term diffusion of heterogeneous material is remapped below . The left side has a higher proportion of heat conducting material ,thereby reducing the diffusion distance among points , the bottle neck increases that distance

The natural diffusion on the surface of the dumbbell is mapped out in the embedding . Observe that A is closer to B than to C ,and that the two lobes are well separated by the bottleneck.
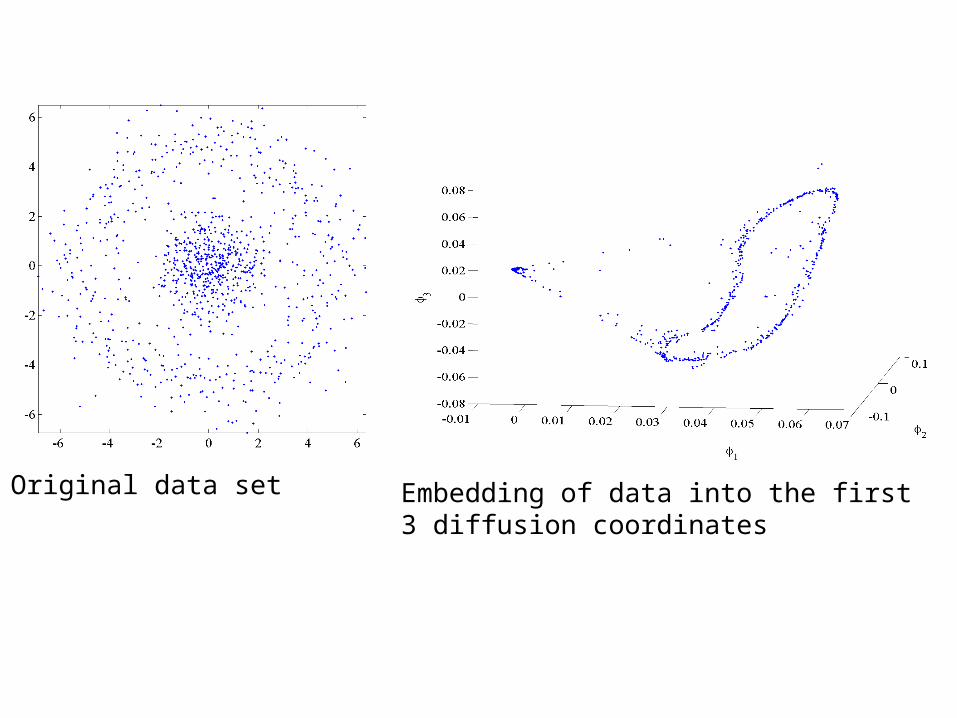
Original data set Embedding of data into the first3 diffusion coordinates

Here organization is achieved through ,eigenfunctions and wavelet constructions

Multiscale organization of Graphs.
We now describe a simple book keeping strategy to organize folders on a data graph. We follow the “puzzle strategy”We organize a graph into a hierarchy of graphs consisting of disjoint subsets at different time scales of diffusion. Let
,y andbetween x t scaleat distance theis
),(2),(),(),(
)(),())((A
operator diffusion theofpower t theof kernel theis ),( ei,
,graph on the t at timediffusion thebe ),(
2
1
1
yxayyaxxayxd
dyyfyxaxf
yxa
yxa
tttt
t
t

A very simple way to build a hierarchical multiscale structure is as follows.
Start with a disjoint partition of the graph into clusters of diameter between 1 and 2 relative in the diffusion distance with t=2. Consider the new graph formed by letting the elements of the partition be the vertices .Using the distance between sets and affinity between sets described above we repeat with t=4, until we end with one folder, and a tree of graphs ,each a coarse version of the preceding with its own temporally rescaled geometry (folder structure)
In the next image we see this organization as it applies to a random collection of 4 Gaussian clouds .

4 Gaussian Clouds
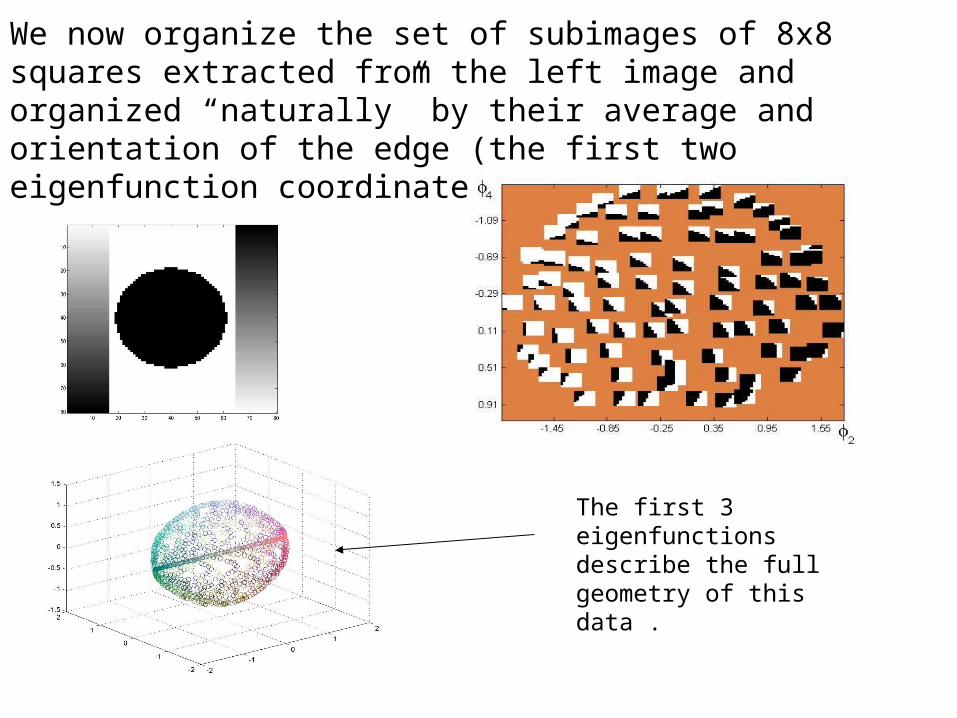
We now organize the set of subimages of 8x8 squares extracted from the left image and organized “naturally” by their average and orientation of the edge (the first two eigenfunction coordinates) .
The first 3 eigenfunctions describe the full geometry of this data .

The clusters of nearby points in the multiscale hierarchy ,corresponds ot features in the original image.
We described a calculus of digital data as a first step in addressing and setting up many of the issues mentioned above ,and much more, including multidimensional document rankings extending Google, information navigation, heterogeneous material modeling, multiscale complex structure organization etc.
Remarkably this can be achieved with algorithms which scale linearly with the number of samples.The methods described below are also known as nonlinear principal component analysis, kernel methods, support vector machines, spectral graph theory, and many more They are documented in literally hundreds of papers in various communities.A simple description of many of these ideas and more is given through diffusion geometries. ( see the July 2006 issue of Applied and Computational Harmonic Analysis).


