Mm3 project ppt group 1_section a
27
Submitted by Section – A group – 1 UM14001 ABHIJEET DASH UM14014 ANUPRAS JAIN UM14017 AYUSHI GILRA UM14042 PRITAM RANJAN ROUL UM14053 SUBHAM MEHRA UM14060 VIJENDRA KUMAR
-
Upload
abhijeet-dash -
Category
Marketing
-
view
30 -
download
2
Transcript of Mm3 project ppt group 1_section a

Submitted by
Section – A group – 1
UM14001 ABHIJEET DASH
UM14014 ANUPRAS JAIN
UM14017 AYUSHI GILRA
UM14042 PRITAM RANJAN ROUL
UM14053 SUBHAM MEHRA
UM14060 VIJENDRA KUMAR

Work-life Balance : Ironical isn’t it for a MBA student???
• This App performs 3 major functions
• Build a daily expected timeline that is customized according to
your choices
• Prepare a daily schedule syncing Gmail, WhatsApp, Intranet
notice board
• Gives a weekly report gauging your target achievement
based on time spent on all activities in the entire week.
Why should you install this app??
• Responds swiftly to changing circumstances throughout the day.
• Actively encourages a balance among work, home and play.
• Helps you prioritize your work

Profile Operating
System
Customizability Resolution
1 Windows Medium 1080p
2 Android Low 1080p
3 Android Medium 720p
4 iOS Medium 480p
5 Windows Low 480p
6 iOS Low 720p
7 iOS High 1080p
8 Android High 480p
9 Windows High 720p
Conjoint Profiles

4.80
4.85
4.90
4.95
5.00
5.05
5.10
5.15
5.20
5.25
0
50
100
150
200
250
300
350
400
Grp1 Grp2 Grp3 Grp4 Grp5 Grp6 Grp7 Grp8 Grp9 Grp10
Overall Rating
Count1 Count2 Count3 Count4 Count5 Count6 Count7 Mean
Univariate Analysis
0.00
1.00
2.00
3.00
4.00
5.00
6.00
0
50
100
150
200
250
300
350
400
Grp1 Grp2 Grp3 Grp4 Grp5 Grp6 Grp7 Grp8 Grp9 Grp10
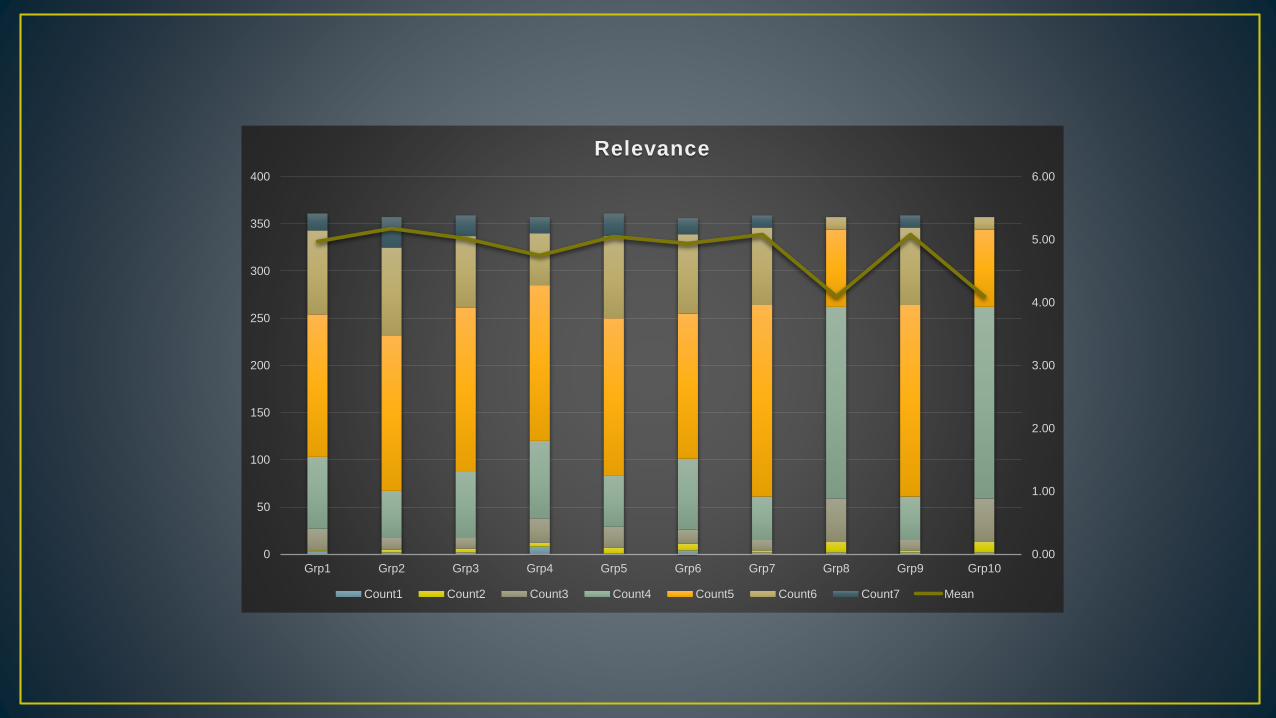
Relevance
Count1 Count2 Count3 Count4 Count5 Count6 Count7 Mean

4.60
4.65
4.70
4.75
4.80
4.85
4.90
4.95
5.00
5.05
0
50
100
150
200
250
300
350
400
Grp1 Grp2 Grp3 Grp4 Grp5 Grp6 Grp7 Grp8 Grp9 Grp10
Credibility
Count1 Count2 Count3 Count4 Count5 Count6 Count7 Mean

4.30
4.40
4.50
4.60
4.70
4.80
4.90
5.00
5.10
0
50
100
150
200
250
300
350
400
Grp1 Grp2 Grp3 Grp4 Grp5 Grp6 Grp7 Grp8 Grp9 Grp10
Uniqueness
Count1 Count2 Count3 Count4 Count5 Count6 Count7 Mean

4.00
4.20
4.40
4.60
4.80
5.00
5.20
0
50
100
150
200
250
300
350
400
Grp1 Grp2 Grp3 Grp4 Grp5 Grp6 Grp7 Grp8 Grp9 Grp10
Intention To Try
Count1 Count2 Count3 Count4 Count5 Count6 Count7 Mean

Model Summary
Model R
R
Square
Adjusted
R
Square
Std.
Error of
the
Estimate1 .418a .175 .167 .83736
a. Predictors: (Constant), Uniqueness,
Relevance, Credibility
Coefficients
Model
Unstandardized
Coefficients
Standardize
d
Coefficients
t Sig.B
Std.
Error Beta1 (Constant)
2.688 0.310 8.682 0.000
Relevance0.294 0.048 0.313 6.095 0.000
Credibility 0.144 0.041 0.184 3.512 0.001
Uniqueness
0.055 0.039 0.071 1.408 0.160
a. Dependent Variable: Overall Rating
So, the equation is –
OR = 2.688 + (Uniqueness*0.055) + (Credibility*0.144) +
(Relevance*0.294)
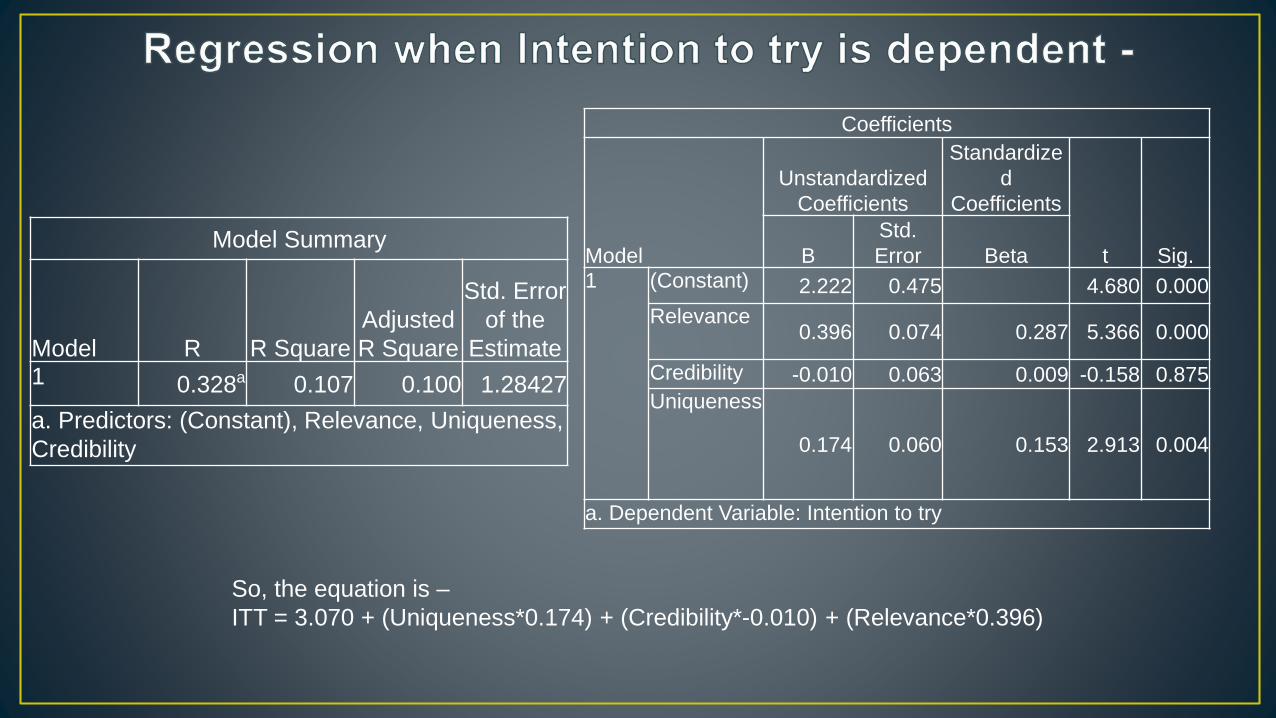
So, the equation is –
ITT = 3.070 + (Uniqueness*0.174) + (Credibility*-0.010) + (Relevance*0.396)
Model Summary
Model R R Square
Adjusted
R Square
Std. Error
of the
Estimate1 0.328a 0.107 0.100 1.28427
a. Predictors: (Constant), Relevance, Uniqueness,
Credibility
Coefficients
Model
Unstandardized
Coefficients
Standardize
d
Coefficients
t Sig.B
Std.
Error Beta1 (Constant) 2.222 0.475 4.680 0.000
Relevance 0.396 0.074 0.287 5.366 0.000
Credibility -0.010 0.063 0.009 -0.158 0.875
Uniqueness
0.174 0.060 0.153 2.913 0.004
a. Dependent Variable: Intention to try

intention to tryTotal
1.00 2.00 3.00 4.00 5.00 6.00 7.00
gender
1.00 5 6 13 38 76 41 29 221
2.00 2 3 6 17 38 26 14 108
3.00 0 1 0 0 0 0 0 1
4.00 0 0 0 1 1 0 0 2
6.00 0 0 0 1 0 1 0 2
Total 7 10 19 57 115 68 43 334
intention to tryTotal
1.00 2.00 3.00 4.00 5.00 6.00 7.00
btech/n
on
btech
1.00 4 8 14 48 98 55 34 261
2.00 0 2 6 4 12 10 7 41
3.00 0 0 0 1 0 0 0 1
5.00 0 0 0 1 0 1 0 2
Total 4 10 20 54 111 66 41 305
1 – Male
2 – Female
Others – Neglected
• Maximum no of
males and females
gave us the rating
above 5
1 – B.Tech
2 – Non B.Tech
Others – Neglected
• Engineers as well
as non engineers
found our app
suitable
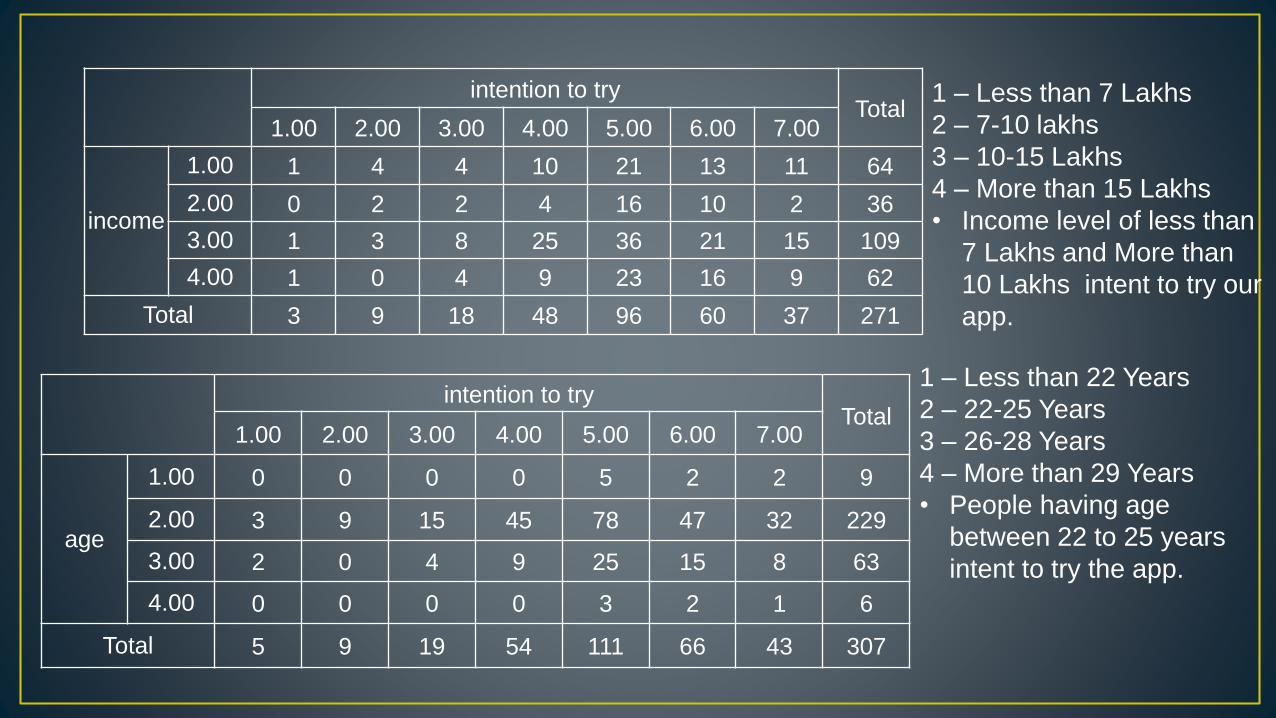
intention to tryTotal
1.00 2.00 3.00 4.00 5.00 6.00 7.00
income
1.00 1 4 4 10 21 13 11 64
2.00 0 2 2 4 16 10 2 36
3.00 1 3 8 25 36 21 15 109
4.00 1 0 4 9 23 16 9 62
Total 3 9 18 48 96 60 37 271
intention to tryTotal
1.00 2.00 3.00 4.00 5.00 6.00 7.00
age
1.00 0 0 0 0 5 2 2 9
2.00 3 9 15 45 78 47 32 229
3.00 2 0 4 9 25 15 8 63
4.00 0 0 0 0 3 2 1 6
Total 5 9 19 54 111 66 43 307
1 – Less than 7 Lakhs
2 – 7-10 lakhs
3 – 10-15 Lakhs
4 – More than 15 Lakhs
• Income level of less than
7 Lakhs and More than
10 Lakhs intent to try our
app.
1 – Less than 22 Years
2 – 22-25 Years
3 – 26-28 Years
4 – More than 29 Years
• People having age
between 22 to 25 years
intent to try the app.

intention to tryTotal
1.00 2.00 3.00 4.00 5.00 6.00 7.00
work ex
1.00 0 7 7 20 33 24 14 105
2.00 0 2 2 11 20 16 11 62
3.00 3 1 10 15 42 11 10 92
4.00 1 0 0 7 13 13 7 41
Total 4 10 19 53 108 64 42 300
1 – less than 12 months
2 – 12-24 months
3 – 24-36 months
4 – More than 36 months
• People with work experience less
than 12 months and 24-36 months
found our app worth trying.

Here are the facts about the responses –
• Out of 334 responses, 221 were male & 108 female.
• 261 are Engineers & 44 are others.
Age Group Frequency
Less than 22 9
22-25 229
26-28 63
More than 28 6
Work Experience (in
Months)
Frequency
Less than 12 105
12-24 62
24-36 92
More than 36 41
Household Income Frequency
Less than 7 Lakhs 64
7-10 Lakhs 36
10-15 Lakhs 109
More than 15 Lakhs 62
RegionNo of Respondents Belonging to
that region
East 170
West 27
North 54
South 22
Central 15

Utility and importance of features winner concept of Section A
The interpretation of results for Conjoint Analysis of Group 3 are-
Conjoint Analysis
Regression Eqn-
Preference = 4.75 – 0.11DP1+ 0.11DP2+ 0.13DL1 + 0.07DL2 + 0.11DA1+ 0.01DA2
PRICE Life Support Features Academic Support
Features
α60 – α20 = -0.11 αL2 – αL1 = 0.13 αA2 – αA1 = 0.11
α95 – α20 =0.11 αL3 – αL1 = 0.07 αA3 – αA1 = 0.01
α20 + α60 + α95=0 αL1 + αL2 + αL3=0 αA1 + αA2 + αA3=0
Equations for calculating part worth

LEVEL
ATTRIBUTE Level Description Utility ImportancePRICE 1 20 (Basic) ( P1) -0.111
0.48062 60 (Standard) (P2) 0.109
3 95 (Premium) 0.002
LIFE SUPPORT
FEATURES1 Insta services +Expense
Tracker (L1) 0.061630.282
2 NewsCenter (L2) 0.00600
3 Health and Fitness -0.06763
ACADEMIC
SUPPORT
FEATURES
1 Interview Preparation (A1) 0.069
0.2372 Academic & Committee
Planner (A2) -0.028
3 Insta services +Expense
Tracker -0.040
N=366*9 = 3294 data points
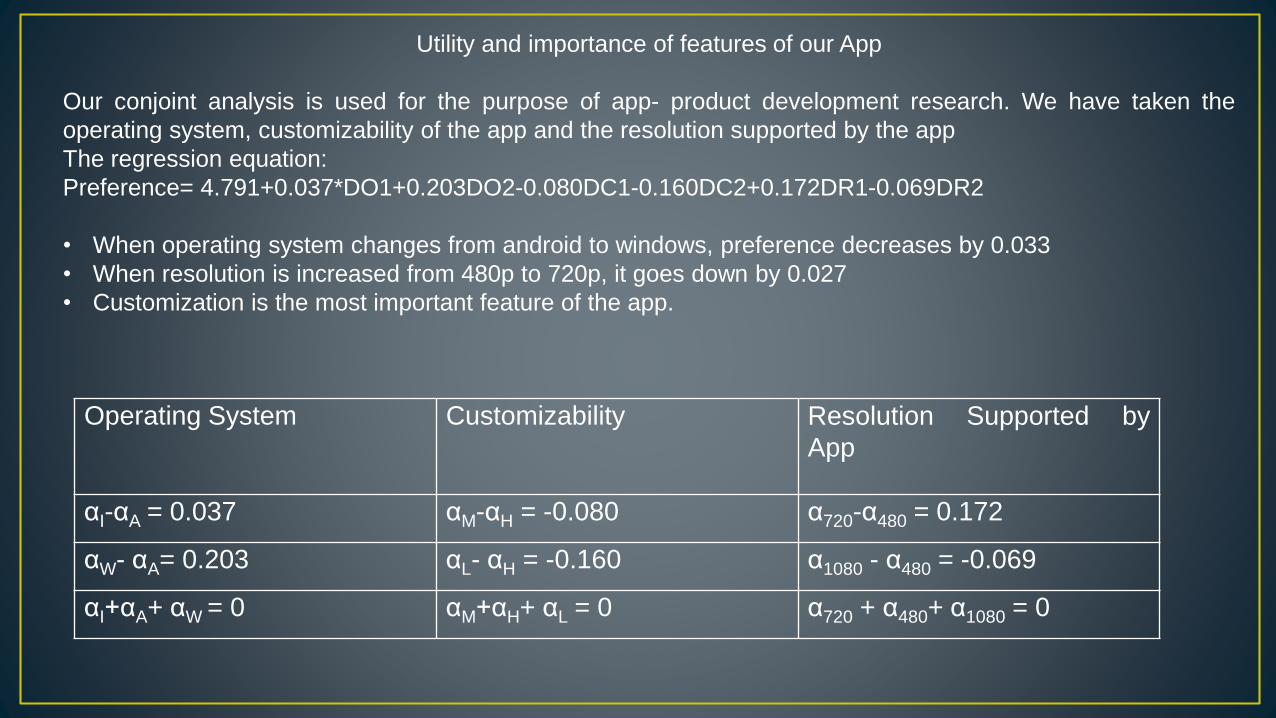
Utility and importance of features of our App
Our conjoint analysis is used for the purpose of app- product development research. We have taken the
operating system, customizability of the app and the resolution supported by the app
The regression equation:
Preference= 4.791+0.037*DO1+0.203DO2-0.080DC1-0.160DC2+0.172DR1-0.069DR2
• When operating system changes from android to windows, preference decreases by 0.033
• When resolution is increased from 480p to 720p, it goes down by 0.027
• Customization is the most important feature of the app.
Operating System Customizability Resolution Supported by
App
αI-αA = 0.037 αM-αH = -0.080 α720-α480 = 0.172
αW- αA= 0.203 αL- αH = -0.160 α1080 - α480 = -0.069
αI+αA+ αW = 0 αM+αH+ αL = 0 α720 + α480+ α1080 = 0

Levels
Attribute No. Description Utility Range Importance
Operating
System
1 Android -0.08 0.203 32.27%
2 iOS -0.043
3 Windows 0.123
Customizability 1 High 0.080 0.16 25.43%
2 Medium 0.000
3 Low -0.080
Resolution
Supported by
App
1 480p -0.051 0.266 42.28%
2 720p 0.146
3 1080p -0.12
Sum of part worth 0.629 100%
N=366*9 = 3294 data points

The following factors were identified and explained 65.62 % of variance –
• Factor 1 – Incomplete life without luxury (0.656), incomplete life without International Travel (0.712) and Exotic Food (0.650) . Factor name is Luxury
• Factor 2 – Spouse (0.559) , Social Work (0.780) , India’s Development (0.803). So the factor can be named as Networking.
• Factor 3 – Power (0.735), Success (0.820). So the factor can be named as success.
• Factor 4 – Work-life Balance (0.866), Enrich parent’s life (0.754). So this factor can be named as Importance
• Factor 5 – Small Cities (0.832), Career Opportunities in Mega Cities (0.895). So this factor can be named as Lifestyle.
*The brackets show the factor loadings for various variables in a factor.

Rotated Component Matrixa
Component
1 2 3 4 5
To me success means money. 0.820
To me success means that I need to become powerful. 0.735
Without Luxury life doesn’t have any meaning. 0.656
For me work-life balance is the most important thing in life. 0.866
It is important for me that I enrich my parents’ life. 0.754
I want to get all those things in life which I could not get
from my parents.
Without a Luxurious car life is incomplete.
My life will be incomplete if I don’t get a chance for
frequent international travel.0.712
Exotic food is a must for my life. 0.650
My spouse should add glamour to my life. 0.559
Without social work my life does not have any meaning. 0.780
My life will be incomplete if I do not get a chance to work
for India’s development0.803
I can not live in small cities. 0.832
Only Mega cities can give me ample career opportunities. 0.895

Number of Cases in each
Cluster
Cluster
1 173.000
2 95.000
3 57.000
4 33.000
Valid 358.000
Missing 6.000
Distances between Final Cluster Centers
Cluster 1 2 3 4
1 2.984 6.055 3.250
2 2.984 4.149 3.428
3 6.055 4.149 5.666
4 3.250 3.428 5.666
The following clusters were identified and the tables show cluster membership &
distance between cluster centres:

3 discriminant functions were observed with the following data –
Eigenvalues Wilks' Lambda
Function Eigenvalue% of
Variance
Cumulative
%
Canonical
Correlation
Test of
Function
(s)
Wilks'
Lambda
Chi-
squaredf Sig.
1 3.725a 86.4 86.4 0.888
1
through
30.126 728.843 15 .000
2 0.326a 7.6 93.9 0.496
2
through
30.598 181.453 8 .000
3 0.262a 6.1 100.0 0.455 3 0.733 81.951 3 .000
Wilk‘s lambda is low for 1st and 2nd function, so they contribute significantly to group differences.
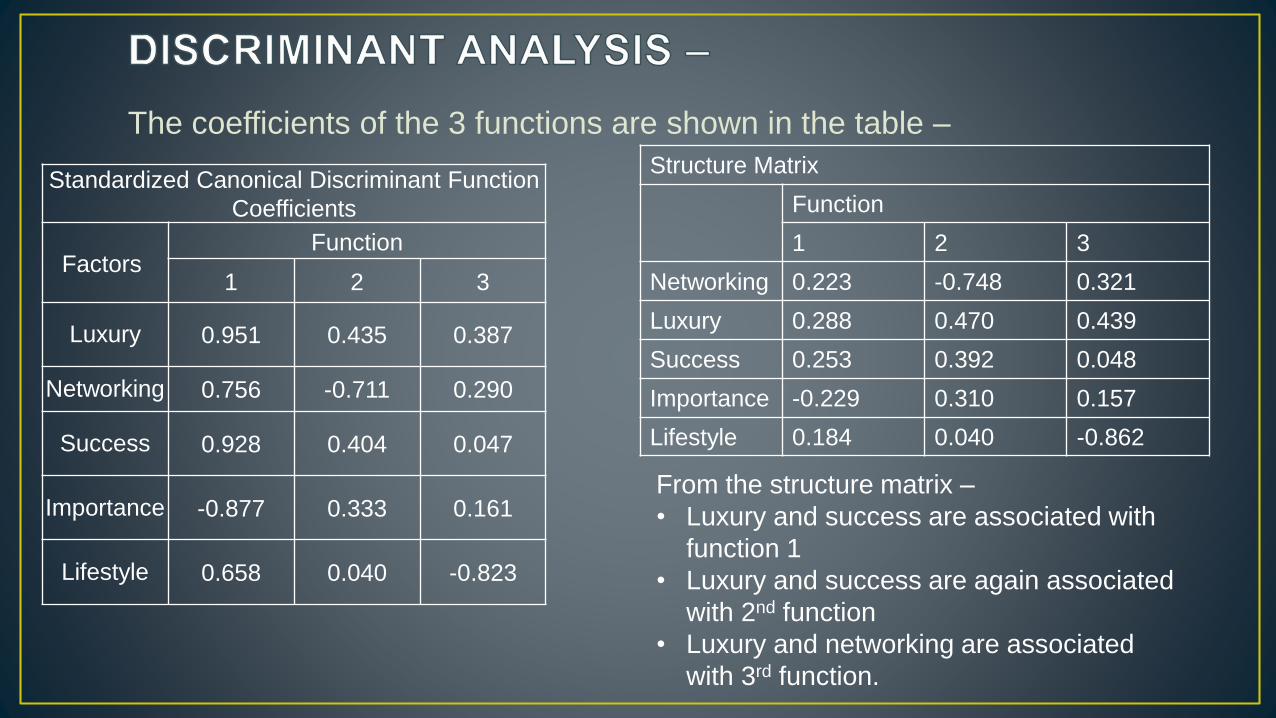
The coefficients of the 3 functions are shown in the table –
Standardized Canonical Discriminant Function
Coefficients
FactorsFunction
1 2 3
Luxury 0.951 0.435 0.387
Networking 0.756 -0.711 0.290
Success 0.928 0.404 0.047
Importance -0.877 0.333 0.161
Lifestyle 0.658 0.040 -0.823
Structure Matrix
Function
1 2 3
Networking 0.223 -0.748 0.321
Luxury 0.288 0.470 0.439
Success 0.253 0.392 0.048
Importance -0.229 0.310 0.157
Lifestyle 0.184 0.040 -0.862
From the structure matrix –
• Luxury and success are associated with
function 1
• Luxury and success are again associated
with 2nd function
• Luxury and networking are associated
with 3rd function.

Cluster
Number
of Case
Function
1 2 3
1 1.556 -0.096 -0.315
2 -0.845 0.836 0.325
3 -3.773 -0.548 -0.354
4 0.789 -0.959 1.329
Unstandardized canonical discriminant
functions evaluated at group means
The coefficients of discriminant functions at various cluster centres are shown in the
table below –
Inferences –
• Cluster 1 gives more emphasis on
function 1 as compared to others, i.e. the
respondents belonging to cluster one
favoured Luxury & Success.
• Cluster 2 has evaluated Luxury &
Success as most favourable.
• Cluster 3 has evaluated Luxury &
Networking as most favourable.
• Cluster 4 has favoured Luxury &
Networking.

Xquilibrio• Segmentation
• Based upon the conjoint analysis, price is the most significant attribute so we divide our market based
upon the buying power of the consumers into 2 offerings:-
• Standard
• Premium
• Then we segregate the customers based upon the perceived utility into 4 categories:-
• Scholars
• Health conscious students
• News seekers
• Committee members
• In order to cater to customers who want are both price and feature sensitive we would bundle them into
various Combo offers

• Target market
• MBA students of XIMB
• Appeal to different categories of students in a customizable way.ie. tweak the app based upon the type of
students we are targeting
• Involve famous personalities like youth icons so that customers identify themselves with the ambassadors.
• Positioning
• Project as a value added app
• Harness potential work life balance expectations
• Focus on price and quality

• 5 Factors were identified –
o Luxury
o Networking
o Success
o Importance
o Lifestyle
Cluster Size Favoured FactorsDiscrimina
nt Function
1 173 Luxury & Success Function 1
2 95 Luxury & Success Function 2
3 57 Luxury & Networking Function 3
4 33 Luxury & Networking Function 3
The target group, segmentation variables and
positioning strategies were clearly stated.