MM FEIS Appendix P Financial Analysis
103
Marbled Murrelet Long-Term Conservation Strategy FEIS Appendix P Page P-1 Appendix P Sustainable Harvest Draft Financial Analysis The full title of this document is Financial Analysis of Alternatives for Establishment of a Sustainable Harvest Level for Forested State Trust Lands in Western Washington (the financial analysis). This financial analysis includes fiscal year 2015 through 2024 projections of harvest volumes and 10-decade net present values for 38 scenarios. The scenarios include 36 combinations of marbled murrelet long-term conservation strategy alternatives presented in the Marbled Murrelet Long-term Conservation Strategy Revised Draft Environmental Impact Statement (RDEIS) (DNR 2018) and the arrearage harvest and riparian thinning options presented in Alternatives for Establishment of a Sustainable Harvest Level Draft Environmental Impact Statement (DEIS) (DNR 2016). The other two scenarios represent alternatives G and H from the marbled murrelet RDEIS, combined with the Board of Natural Resources’ preferred alternatives for arrearage harvest and riparian thinning. This financial analysis is in the process of being updated for the sustainable harvest final EIS (FEIS), expected in October 2019. Therefore, an update is not available for publication with the marbled murrelet FEIS, to which this document is an appendix.
Transcript of MM FEIS Appendix P Financial Analysis

Marbled Murrelet Long-Term Conservation Strategy FEIS Appendix P Page P-1
Appendix P
Sustainable Harvest Draft Financial Analysis The full title of this document is Financial Analysis of Alternatives for Establishment of a Sustainable
Harvest Level for Forested State Trust Lands in Western Washington (the financial analysis). This
financial analysis includes fiscal year 2015 through 2024 projections of harvest volumes and 10-decade
net present values for 38 scenarios. The scenarios include 36 combinations of marbled murrelet long-term
conservation strategy alternatives presented in the Marbled Murrelet Long-term Conservation Strategy
Revised Draft Environmental Impact Statement (RDEIS) (DNR 2018) and the arrearage harvest and
riparian thinning options presented in Alternatives for Establishment of a Sustainable Harvest Level Draft
Environmental Impact Statement (DEIS) (DNR 2016). The other two scenarios represent alternatives G
and H from the marbled murrelet RDEIS, combined with the Board of Natural Resources’ preferred
alternatives for arrearage harvest and riparian thinning.
This financial analysis is in the process of being updated for the sustainable harvest final EIS (FEIS),
expected in October 2019. Therefore, an update is not available for publication with the marbled murrelet
FEIS, to which this document is an appendix.

This page intentionally left blank.

N
A
T
U
R
A
L
N
A
T
U
R
A
L
N
A
T
U
R
A
L
N
A
T
U
R
A
L
N
A
T
U
R
A
L
N
A
T
U
R
A
L
N
A
T
U
R
A
L
N
A
T
U
R
A
L
N
A
T
U
R
A
L
N
A
T
U
R
A
L
N
A
T
U
R
A
L
N
A
T
U
R
A
L
N
A
T
U
R
A
L
N
A
T
U
R
A
L
N
A
T
U
R
A
L
N
A
T
U
R
A
L
N
A
T
U
R
A
L
N
A
T
U
R
A
L
N
A
T
U
R
A
L
N
A
T
U
R
A
L
N
A
T
U
R
A
L
N
A
T
U
R
A
L
N
A
T
U
R
A
L
N
A
T
U
R
A
L
N
A
T
U
R
A
L
N
A
T
U
R
A
L
N
A
T
U
R
A
L
N
A
T
U
R
A
L
N
A
T
U
R
A
L
N
A
T
U
R
A
L
N
A
T
U
R
A
L
N
A
T
U
R
A
L
N
A
T
U
R
A
L
N
A
T
U
R
A
L
N
A
T
U
R
A
L
N
A
T
U
R
A
L
N
A
T
U
R
A
L
N
A
T
U
R
A
L
N
A
T
U
R
A
L
N
A
T
U
R
A
L
N
A
T
U
R
A
L
N
A
T
U
R
A
L
N
A
T
U
R
A
L
N
A
T
U
R
A
L
N
A
T
U
R
A
L
N
A
T
U
R
A
L
N
A
T
U
R
A
L
N
A
T
U
R
A
L
N
A
T
U
R
A
L
N
A
T
U
R
A
L
N
A
T
U
R
A
L
N
A
T
U
R
A
L
N
A
T
U
R
A
L
N
A
T
U
R
A
L
N
A
T
U
R
A
L
N
A
T
U
R
A
L
N
A
T
U
R
A
L
N
A
T
U
R
A
L
R
E
S
O
U
R
C
E
S
Intr
oduc
tion
to M
onito
ring
R
E
S
O
U
R
C
E
S
Intr
od
uct
ion
to
Mo
nit
ori
ng
o
n L
and
s M
anag
ed U
nd
er t
he
Sta
te T
rust
Lan
ds
Hab
itat
Co
nse
rvat
ion
Pla
n
Mo
nit
ori
ng
Pro
gra
m D
evelo
pm
en
t
Feb
ruary
2017
Re
printin
g o
f a R
evis
ed
20
01
Fin
al P
lan
Intr
oduc
tion
to M
onito
ring
R
E
S
O
U
R
C
E
S
Intr
oduc
tion
to M
onito
ring
R
E
S
O
U
R
C
E
S
Intr
od
uct
ion
to
Mo
nit
ori
ng
o
n L
and
s M
anag
ed U
nd
er t
he
Sta
te T
rust
Lan
ds
Hab
itat
Co
nse
rvat
ion
Pla
n
Mo
nit
ori
ng
Pro
gra
m D
evelo
pm
en
t
Feb
ruary
2017
Re
printin
g o
f a R
evis
ed
20
01
Fin
al P
lan
Intr
od
uct
ion
to
Mo
nit
ori
ng
o
n L
and
s M
anag
ed U
nd
er t
he
Sta
te T
rust
Lan
ds
Hab
itat
Co
nse
rvat
ion
Pla
n
Mo
nit
ori
ng
Pro
gra
m D
evelo
pm
en
t
Feb
ruary
2017
Re
printin
g o
f a R
evis
ed
20
01
Fin
al P
lan
Intr
od
uct
ion
to
Mo
nit
ori
ng
o
n L
and
s M
anag
ed U
nd
er t
he
Sta
te T
rust
Lan
ds
Hab
itat
Co
nse
rvat
ion
Pla
n
Mo
nit
ori
ng
Pro
gra
m D
evelo
pm
en
t
Feb
ruary
2017
Re
printin
g o
f a R
evis
ed
20
01
Fin
al P
lan
Intr
oduc
tion
to M
onito
ring
R
E
S
O
U
R
C
E
S
Intr
oduc
tion
to M
onito
ring
R
E
S
O
U
R
C
E
S
Intr
od
uct
ion
to
Mo
nit
ori
ng
o
n L
and
s M
anag
ed U
nd
er t
he
Sta
te T
rust
Lan
ds
Hab
itat
Co
nse
rvat
ion
Pla
n
Mo
nit
ori
ng
Pro
gra
m D
evelo
pm
en
t
Feb
ruary
2017
Re
printin
g o
f a R
evis
ed
20
01
Fin
al P
lan
Intr
od
uct
ion
to
Mo
nit
ori
ng
o
n L
and
s M
anag
ed U
nd
er t
he
Sta
te T
rust
Lan
ds
Hab
itat
Co
nse
rvat
ion
Pla
n
Mo
nit
ori
ng
Pro
gra
m D
evelo
pm
en
t
Feb
ruary
2017
Re
printin
g o
f a R
evis
ed
20
01
Fin
al P
lan
Intr
od
uct
ion
to
Mo
nit
ori
ng
o
n L
and
s M
anag
ed U
nd
er t
he
Sta
te T
rust
Lan
ds
Hab
itat
Co
nse
rvat
ion
Pla
n
Mo
nit
ori
ng
Pro
gra
m D
evelo
pm
en
t
Feb
ruary
2017
Re
printin
g o
f a R
evis
ed
20
01
Fin
al P
lan
Intr
od
uct
ion
to
Mo
nit
ori
ng
o
n L
and
s M
anag
ed U
nd
er t
he
Sta
te T
rust
Lan
ds
Hab
itat
Co
nse
rvat
ion
Pla
n
Mo
nit
ori
ng
Pro
gra
m D
evelo
pm
en
t
Feb
ruary
2017
Re
printin
g o
f a R
evis
ed
20
01
Fin
al P
lan
Intr
od
uct
ion
to
Mo
nit
ori
ng
o
n L
and
s M
anag
ed U
nd
er t
he
Sta
te T
rust
Lan
ds
Hab
itat
Co
nse
rvat
ion
Pla
n
Mo
nit
ori
ng
Pro
gra
m D
evelo
pm
en
t
Feb
ruary
2017
Re
printin
g o
f a R
evis
ed
20
01
Fin
al P
lan
Intr
od
uct
ion
to
Mo
nit
ori
ng
o
n L
and
s M
anag
ed U
nd
er t
he
Sta
te T
rust
Lan
ds
Hab
itat
Co
nse
rvat
ion
Pla
n
Mo
nit
ori
ng
Pro
gra
m D
evelo
pm
en
t
Feb
ruary
2017
Financial Analysis of
Alternatives for Establishment of a Sustainable
Harvest Level for Forested State Trust Lands in
Western Washington
October 2018

This page intentionally left blank.

Financial Analysis of
Alternatives for Establishment of a
Sustainable Harvest Level for
Forested State Trust Lands in
Western Washington
October 2018
Prepared by
Washington State Department
of Natural Resources
Forest Resources Division

Washington State Department of Natural Resources Page ii
Table of Contents Introduction ................................................................................................................................................................... 1
Key Decisions ................................................................................................................................................................. 3
Marbled Murrelet Strategy Alternatives ................................................................................................................... 3
Arrearage Harvest Options ........................................................................................................................................ 3
Riparian Thinning Options ......................................................................................................................................... 4
Understanding This Analysis .......................................................................................................................................... 6
Analysis Area ............................................................................................................................................................. 6
Analysis Scope ........................................................................................................................................................... 6
Analysis Methods ...................................................................................................................................................... 7
Updates Since July 2017 Financial Analysis........................................................................................................... 7
Key Understandings ................................................................................................................................................... 9
Arrearage .............................................................................................................................................................. 9
Recent Timber Revenue and Volumes ................................................................................................................ 10
How Data are Presented ......................................................................................................................................... 11
Results ......................................................................................................................................................................... 13
Net Present Value .................................................................................................................................................... 13
In Western Washington ...................................................................................................................................... 13
By Trust and County ............................................................................................................................................ 16
Harvest Volume ....................................................................................................................................................... 20
In Western Washington ...................................................................................................................................... 20
By Trust and County ............................................................................................................................................ 28
Land Base Available for Production ......................................................................................................................... 33
Management Funds ................................................................................................................................................ 34
References ................................................................................................................................................................... 36
Appendix A. Model Updates – Sustainable harvest DEIS to July 2017 financial analysis .......................................... A-1
Appendix B. Fiscal Year 2011 Through 2018 Harvest Levels and Revenue ................................................................ B-1
Appendix C. Trust and County Level Results ............................................................................................................. C-1
Appendix D. Sustainable Harvest Unit Level Results ................................................................................................. D-1

Financial Analysis of Alternatives for Establishment of a Sustainable Harvest Level Page iii
List of Tables Table 1. Summary of Conservation Acres Proposed Under Each Alternative (alt.) ................................................... 3
Table 2. Effects of changes in model data and assumptions on planning decade volume and
10-decade net present value ....................................................................................................................... 8
Table 3. Actual Harvest in the Fiscal Year 2005 Through 2014 Planning Decade by Location and
Harvest Activity Type ................................................................................................................................. 10
Table 4. 10-decade Net Present Value of Each Scenario ($ billions) ....................................................................... 13
Table 5. Effect of the Scenarios on 10-decade Net Present Value for Each Trust ................................................... 16
Table 6. Effect of the Scenarios on 10-decade Net Present Value for Each County with State Forest
Transfer Trust Land .................................................................................................................................... 18
Table 7. 10-decade Net Present Value for State Forest Transfer Trust lands in
Skamania County ($ millions) .................................................................................................................... 19
Table 8. 10-decade Net Present Value for Common School and Indemnity Trust Lands ($ millions) ..................... 20
Table 9. Planning-decade Timber Harvest Volume of Each Scenario (MMBF/decade)........................................... 21
Table 10. Effect of the Scenarios on Planning Decade Harvest Volume for Each Trust ............................................ 24
Table 11. Effect of the Scenarios on Planning Decade Harvest Volume for Each County with
State Forest Transfer Trust Land................................................................................................................ 24
Table 12. Planning Decade Harvest Level for State Forest Transfer Trust lands in Wahkiakum County
(MMBF/decade) ......................................................................................................................................... 29
Table 13. Planning Decade Harvest Level for Scientific School Trust Lands (MMBF/decade) .................................. 30
Table 14. Planning Decade Harvest Level for State Forest Transfer Trust Lands in Jefferson County
(MMBF/decade) ......................................................................................................................................... 31
Table 15. Planning Decade Harvest Level for State Forest Transfer Trust Lands in Skamania County
(MMBF/decade) ......................................................................................................................................... 32
Table 16. Planning Decade Harvest Level for Common School and Indemnity Trust Lands (MMBF/decade) .......... 33
Table 17. Area Available for Harvest Activities in Western Washington................................................................... 34
Table 18. Management Funds in the Planning Decade ($ millions/year) .................................................................. 35

Washington State Department of Natural Resources Page iv
List of Figures Figure 1. Analysis Area for the Sustainable Harvest Level and Marbled Murrelet Strategy ....................................... 6
Figure 3. Example of a Table Showing Results for all 38 Scenarios Plus Comparison to Recent Harvest Level........ 12
Figure 3. 10-decade Net Present Value by Long-term Forest Cover area ................................................................ 15
Figure 4. 10-decade Harvest Levels Under Each Scenario ........................................................................................ 22
Figure 5. Planning decade Harvest Volume by Area of Long-term Forest Cover ..................................................... 23
Figure 6. Sustainable Harvest Level (solid bars) and Arrearage Harvest (hollow bars) in Western Washington
Under Three Arrearage Options Combined with Marbled Murrelet Strategy Alternative A and the 10
Percent Riparian Thinning Option ............................................................................................................. 26
Figure 7. Harvest Levels Under the Three Arrearage Options Combined With Marbled Murrelet Strategy
Alternative A and the 10 Percent Riparian Thinning Option ..................................................................... 27
Figure 8. Harvest Levels Under the Two Riparian Thinning Levels Combined With Marbled Murrelet Strategy
Alternative A and no Specific Level Arrearage Harvest Option ................................................................. 28
Acronyms DNR Washington State Department of Natural Resources
DEIS Draft Environmental Impact Statement
FY Fiscal Year
HCP State Trust Lands Habitat Conservation Plan
MMBF Million Board Feet
NAP Natural Area Preserve
NRCA Natural Resources Conservation Area
OESF Olympic Experimental State Forest
RCW Revised Code of Washington

Financial Analysis of Alternatives for Establishment of a Sustainable Harvest Level Page v
Preface This financial analysis is meant to update the Financial Analysis of Alternatives for Establishment of a
Sustainable Harvest Level for Forested State Trust Lands in Western Washington (released July 2017;
DNR 2017). Changes include the addition of new marbled murrelet long-term conservation strategy
alternatives, a new option for arrearage harvest volume, a new riparian thinning level, and updated data.
This analysis also uses a different discount rate than the previous analysis.
Conducting this financial analysis is part of being a prudent trust lands manager.
Acknowledgements Mike Buffo, Environmental Planner
Abu Nurullah, Ph.D., Senior Forest Analyst
Hannah Yourd, HCP Information and Certification Specialist
Heidi Tate, Environmental Planner

Washington State Department of Natural Resources Page vi
This page intentionally left blank.

Financial Analysis of Alternatives for Establishment of a Sustainable Harvest Level Page 1
Introduction The Washington State Department of Natural
Resources (DNR) is establishing a sustainable
harvest level for the fiscal year 2015 to 2024
planning decade for over 1.4 million acres of forested
state trust lands in western Washington (refer to Text
Box 1). The sustainable harvest level is defined in
Revised Code of Washington (RCW) 79.10.300(5) as
“the volume of timber scheduled for sale from state-
owned lands during a planning decade as calculated
by DNR and approved by the board.” Setting a level
is required by both DNR policy (DNR 2006) and
state law (RCW 79.10.320).
Selection of a sustainable harvest level for the
planning decade requires three key decisions by the
Board of Natural Resources (board):
Selection of an alternative for the long-term
marbled murrelet conservation strategy (marbled
murrelet strategy),
Selection of an option for harvesting the
arrearage from the 2005 through 2014 planning
decade, and
Selection of an option for thinning in riparian
areas.
For this analysis, DNR modeled 38 possible
combinations1 of these alternatives and options, each
of which will be referred to as a “scenario” in this
financial analysis (the model will be discussed later
in this analysis). The purpose of this analysis is to
provide financial projections to help the board
understand how each scenario affects DNR’s
1 There are 96 possible scenarios, but DNR modeled only 38. This report contains updated results for the 36 scenarios
presented in the financial analysis published in July 2017. Two new scenarios are added. These scenarios show are marbled
murrelet conservation strategy alternatives G and H paired with the board’s preferred alternatives for the arrearage harvest
and riparian thinning options. Only two scenarios were added so that the analysis could focus on the effects of the preferred
alternative compared to the original 36 scenarios.
This analysis refers to “state trust lands” or “trust
lands” to describe the following trusts defined
under state law and managed by DNR.
State Lands (RCW 79.02.010(14)): State lands
are the approximately 3 million acres of lands
granted to the territory of Washington by the
Omnibus Enabling Act of 1889 (25 U.S. Statutes
at Large, c. 180 p. 676) as a source of financial
support for named beneficiaries, primarily
public schools and colleges.
State Forest Lands (RCW 79.02.010(13)): DNR
manages two categories of State Forest Lands.
State Forest Transfer Lands were acquired by
21 counties in the 1920s and 1930s through tax
foreclosures and deeded to the state to be
managed as state trust lands. State Forest
Purchase Lands were either purchased by the
state or acquired as a gift and managed
similarly to State Lands.
Two other trusts are located within the analysis
area, covering significantly fewer acres:
Community College Forest Reserve (RCW
79.02.420): DNR manages more than 3,200
acres of forestlands for community colleges.
These lands are managed for sustained timber
production, but special consideration is given
to aesthetics, watershed protection, and
wildlife habitat.
King County Water Pollution Control Division
State Trust Lands: DNR manages more than
4,300 acres of state trust lands for King County
and its Wastewater Treatment Division. These
lands are managed for long-term forestry, the
same as other state trust lands.
Text Box 1. State Trust Lands

Washington State Department of Natural Resources Page 2
ability to meet its trust management obligations. This analysis addresses these obligations as follows:
The generation of revenue for trust beneficiaries
The fiduciary aspect of trust management requires DNR to manage state trust lands to produce
perpetual income for the beneficiaries (DNR 2006). To assess revenue generation, DNR provides
projections for net present value for each scenario. Net present value is a financial term referring to
the sum of both current and future cash flows. It is the cash inflow (revenue from timber sales) minus
cash outflow (costs of forest management). Future revenues and expenses are expressed in terms of
their equivalent in today’s dollars. All future revenues and expenses are discounted by 3 percent per
year back to the present date. The 10-decade net present value allows the scenarios to be compared
for their long-term revenue production potential.
Ability to generate revenue in perpetuity
A percentage of revenue from each timber sale is placed in a management account. In this analysis,
the funds placed into this account are referred to as “management funds.” Management funds are used
to cover the expenditures incurred in managing state trust lands.
A rise or drop in the harvest level will cause a corresponding rise or drop in management funds,
which would in turn affect DNR’s management. This analysis includes a qualitative analysis of
DNR’s ability to continue managing state trust lands under each scenario, given the scenario’s harvest
level and likely total management funds.
Impartiality with respect to current and future beneficiaries
As a trust lands manager, DNR must comply with the common law duties of a trustee. One of those
duties is to ensure intergenerational equity, meaning DNR cannot favor either present or future
beneficiaries over each other (DNR 2006). To assess this obligation, DNR reports harvest volumes by
decade under each scenario.
Maintaining the corpus of the trust
The corpus of the trust, or trust assets that are kept or used for the benefit of the beneficiaries, include
all state trust lands plus the funds in certain dedicated accounts and permanent funds associated with
the trusts (DNR 2006). Maintaining the corpus of the trust is part of prudent trust land management.
In the analysis area (discussed later in this analysis), the corpus of the trust includes forested state
trust lands that are available for both thinning and harvest, lands restricted to thinning only, and lands
that are not available for harvest or thinning. Lands that are available for both thinning and harvest
generate the most revenue for the trusts. Therefore, a change in the number of those acres may affect
the corpus of the trust. In this analysis, DNR considers the number of acres available for thinning and
harvest under each marbled murrelet strategy alternative.

Financial Analysis of Alternatives for Establishment of a Sustainable Harvest Level Page 3
Key Decisions Following is a description of the three key decisions now facing the board: the marbled murrelet strategy
alternatives, arrearage harvest options, and riparian thinning options.
Marbled Murrelet Strategy Alternatives
All eight marbled murrelet strategy alternatives are described in detail in the Revised Draft Environmental
Impact Statement on a Long-Term Conservation Strategy for the Marbled Murrelet (marbled murrelet
RDEIS, DNR 2018) and are included in this analysis. Table 1 lists each alternative and the conservation
acres (collectively referred to as long-term forest cover2) proposed under each.
Table 1. Summary of Conservation Acres Proposed Under Each Alternative (alt.)
Alt. A
(no
action) Alt. B Alt. C Alt. D Alt. E Alt. F Alt. G Alt. H
Acres of existing
conservation that
may provide benefits
to marbled murrelets
depending on forest
condition
567,000 567,000 567,000 567,000 567,000 567,000 567,000 567,000
Acres of additional,
marbled murrelet-
specific conservation3
33,000 9,000 50,000 51,000 55,000 176,000 76,000 43,000
Total approximate
acres of long-term
conservation (long-
term forest cover)
600,000 576,000 617,000 618,000 622,000 743,000 643,000 610,000
Arrearage Harvest Options
Arrearage occurs when the actual harvest volume is less than the sustainable harvest level set by the board
for a planning decade (refer to Chapter 2.1 of the Draft Environmental Impact Statement on Alternatives
for Establishment of a Sustainable Harvest Level for Forested State Trust Lands in Western Washington
[sustainable harvest DEIS, DNR 2016a] for more detail).
2 Lands managed to maintain forest cover (relatively closed canopy structure) for conservation. Long-term forest cover may have current marbled murrelet habitat or have the capability to develop into the types of structurally complex forest needed for marbled murrelet nesting. Refer to Appendix G of the marbled murrelet RDEIS (DNR 2018) for more information. 3 Acres reported here are those that do not overlap other existing conservation lands.

Washington State Department of Natural Resources Page 4
The options for arrearage harvest in this analysis come from recommendations from a board
subcommittee created to review arrearage from the fiscal year 2005 through 2014 planning decade, and
board direction on a sustainable harvest level preferred alternative selected at the November 2017 board
meeting. Four of the options were analyzed in the sustainable harvest DEIS. The board selected the
preferred alternative, which was not analyzed in the sustainable harvest DEIS, based on analysis in the
sustainable harvest DEIS, comments received on the DEIS, and stakeholder comments received at board
meetings. For each option, DNR specifies a harvest volume for each sustainable harvest unit; however,
DNR does not specify the specific areas in the unit from which the arrearage should be harvested. For
example, DNR did not require arrearage volume to come from riparian areas, even though thinning in
riparian areas was well below the volume projected for the fiscal year 2005 through 2014 planning
decade.
The arrearage options are to:
Harvest 702 MMBF proportionally from those sustainable harvest units with deficits over 5 years
(analyzed in sustainable harvest DEIS).
Harvest 462 MMBF proportionally from those sustainable harvest units with deficits over 10 years
(analyzed in sustainable harvest DEIS).
Harvest 462 MMBF proportionally from sustainable harvest units with deficits in 1 year, and then
harvest the remaining sustainable harvest level volume for the decade over the next 9 years. Under
this option, harvest would occur only in units with deficits in one year of the decade (analyzed in
sustainable harvest DEIS).
Set harvest levels without specifying arrearage quantity (analyzed in sustainable harvest DEIS).
Harvest 382 MMBF proportionally from those sustainable harvest units with deficits over 10 years
(preferred alternative).
The 702 MMBF arrearage volume is the total arrearage from all sustainable harvest units with deficits
from the fiscal year 2005 through 2014 planning decade. The 462 MMBF arrearage volume is the total
arrearage minus overages (harvested volume that exceeded the sustainable harvest level for a given
planning unit). The 382 MMBF arrearage volume is the total arrearage from all sustainable harvest unit
with deficits minus volume transacted through the Trust Land Transfer Program or reconveyed to a
county (Appendix A). For more information on the arrearage options with 702 or 462 MMBF of arrearage
volume, refer to the sustainable harvest DEIS.
Riparian Thinning Options
The board provided direction as to riparian thinning levels to be analyzed in the sustainable harvest DEIS.
These thinning levels apply to the five west-side Habitat Conservation Plan4 (HCP) planning units,
excluding the Olympic Experimental State Forest (OESF; Figure 1). These riparian harvest options are
4 State Trust Lands Habitat Conservation Plan (HCP), available at http://www.dnr.wa.gov/programs-and-services/forest-resources/habitat-conservation-state-trust-lands.

Financial Analysis of Alternatives for Establishment of a Sustainable Harvest Level Page 5
expressed as maximums levels rather than requirements. The model used for this analysis (refer to
“Analysis Methods” later in this document) calculates the riparian volume that best meets DNR’s
management objectives for riparian areas.
At the November 2017 board meeting, the board selected a preferred alternative for riparian thinning.
Unlike the alternatives analyzed in the sustainable harvest DEIS, the preferred alternative does not set a
specific level of thinning. Instead, the preferred alternative does not count riparian thinning in the forest
estate model toward the projections of the sustainable harvest level. During implementation, riparian
thinning can occur consistent with the 1997 HCP. Volume thinning in riparian areas will count toward the
implementation of the sustainable harvest level.
Under any riparian thinning option, any activities in riparian areas would be assessed at the operational
level for environmental and economic feasibility.
The riparian thinning options are:
Thin up to 10 percent of the total riparian area. Riparian areas in the five west-side planning units
cover 346,000 acres and are composed of stream, wetland, and wetland buffers. Buffers range from
100 to over 190 feet wide, depending on stream type or wetland size. This option would limit
thinning in riparian thinning areas to a maximum of 34,600 acres for the decade (analyzed in
sustainable harvest DEIS).
Thin an area less than or equal to 1 percent of the acres thinned or harvested in non-riparian
areas. For example, if DNR expected to harvest or thin 100,000 acres outside of riparian areas in the
five west-side planning units, a maximum of 1,000 riparian acres could be thinned during the decade
(analyzed in sustainable harvest DEIS).
Riparian volume not included when setting the sustainable harvest level.
No change in management of riparian areas is proposed for the OESF HCP planning unit. Thinning and
limited harvest can occur in riparian areas in the OESF under the OESF HCP Planning Unit Forest Land
Plan (DNR 2016b). For more information on the riparian thinning options, refer to the sustainable harvest
DEIS.

Washington State Department of Natural Resources Page 6
Understanding This Analysis
Analysis Area
The analysis area is all DNR-managed
forestlands in western Washington. Western
Washington is defined in this analysis as
lands in the Columbia, North Puget, OESF,
South Coast, South Puget, and Straights
HCP planning units. This area includes
approximately 1.4 million acres of DNR-
managed lands, which include state trust
lands as well as natural area preserves
(NAP) and natural resources conservation
areas (NRCA).
The marbled murrelet conservation strategy
will apply only to a subset of this area: all
DNR-managed lands within 55 miles of all
marine waters in western Washington (refer
to Figure 1).
Analysis Scope
Although there are other sources of revenue
on forested state trust lands in western
Washington, this analysis looks at the
financial impacts that may occur to the
trusts from projected timber harvest only.
DNR collects revenue from leases for
communication sites, non-timber forest
products such as salal, and other uses. In addition, some trusts include lands in eastern Washington, where
agricultural leases generate substantial revenue. DNR did not include these sources of revenue in this
analysis because they would be constant across all 38 scenarios. DNR also did not include other possible
sources of revenue, such as revenues from carbon sequestration, because they are outside the scope of the
sustainable harvest need and purpose (refer to Chapter 1.1 of the sustainable harvest DEIS), do not yet
have a market, or are speculative.
Setting a sustainable harvest level does not foreclose other revenue-generating activities. Decisions on
revenue from other sources, as well as decisions on when and where to harvest, are—and will continue to
be—made at the operational level, after considering what is in the best interests of the trusts and
following appropriate environmental review.
Figure 1. Analysis Area for the Sustainable Harvest Level and
Marbled Murrelet Strategy

Financial Analysis of Alternatives for Establishment of a Sustainable Harvest Level Page 7
Analysis Methods
This analysis uses data from a forest estate model. A forest estate model is a powerful, computer-based
tool that enables DNR to consider the entire land base at once to find efficient and effective ways to
achieve multiple objectives (refer to Appendix F of the sustainable harvest DEIS for more detail).
The forest estate model (model) used for this analysis was programmed to calculate the sustainable
harvest level associated with each scenario.5 The model results provide harvest levels for a 10-decade
period. The first decade in this period corresponds to fiscal years 2015 through 2024, also called the
planning decade, for which the board will set the sustainable harvest level. The model reports harvest
volume per decade, which for this analysis is broken out by sustainable harvest unit, trust, and individual
counties for the State Forest Transfer Trust.
The model was programmed to maximize the long-term value of timber harvest from state trust lands
while meeting all other management objectives. Specifically, the model maximized the 10-decade net
present value (refer to the sustainable harvest DEIS, Appendix F) of timber harvest. Maximizing net
present value is different from maximizing timber harvest volume. Maximizing volume produces a lower
net present value because the costs of harvesting the extra volume exceed the additional revenue from that
volume.6
The net present value numbers presented in this analysis take into account the economic assumptions
described in Appendix F of the sustainable harvest DEIS. These assumptions are based on average prices
and expenditures. Another assumption is that the management funds—which are used to cover
expenditures—are 25 percent of revenue from timber sales from State Forest Transfer lands and 31
percent of revenue from all other trusts. Although average prices, expenditures, and management funds
could vary in the future, DNR held them constant across all 10 decades in the model. Any change would
affect each scenario proportionately and would therefore not affect the relative differences between
scenarios.
Updates Since July 2017 Financial Analysis In response to public comments received during the sustainable harvest and marbled murrelet long-term
conservation strategy planning processes to date, and analysis by DNR staff, DNR has updated the data
and assumptions within the forest estate model used for the 2016 DEIS analysis. The following is a list
and short description of the updates:
Forest inventory data – updated to account for land transactions, recent and historic harvest
activities, and changes in areas identified as deferred in a local knowledge database (refer to
marbled murrelet long-term conservation strategy RDEIS Appendix O for more information).
5 The July 2017 financial analysis included two changes to the model from the version used in for the sustainable harvest DEIS. These changes were to the arrearage formulation and assumptions for northern spotted owl habitat. These changes are described in Appendix A. Additional changes between the July 2017 analysis and the current analysis can be found starting on this page. 6 An example of this was provided in the October 17, 2016 special board meeting. Meeting presentation available at http://file.dnr.wa.gov/publications/em_bc_bnr_shc_october2016special_presentation.pdf

Washington State Department of Natural Resources Page 8
Cover type changes – Cover types were revised such that three cover types covering relatively
small areas were incorporated in to larger cover types. The result is there are now three cover
types instead of six.
Timber price data – updated to include prices from fiscal years 2011-2018. Prices are updated
for the three cover types used in the current model. Prices are no longer defined for “saw” logs
and “chip and saw” logs. Instead, all grades are considered collectively in developing a single
price for each cover type for each region.
Management cost data – updated to include management costs from fiscal years 2012-2018
Timber yields – updated timber yields to better match actual growth patterns and current forest
inventory data. The revised yields generally show lower volumes in confer stands under 70 years
old and higher volumes in stands over 70 years old than the yields used in the July 2017 financial
analysis. Stands in the red alder cover type have generally lower yields in the revised yields.
Discount rate – the discount rate for future costs and revenue was updated from 2 percent to 3
percent following analysis of return rates of the Common School Permanent Fund
Northern spotted owl habitat management – modeling constrains on spotted owl habitat were
updated to better reflect the 1997 HCP northern spotted owl conservation strategy. Specifically,
harvest of spotted owl habitat is allowed in the first two decades of the modeling, if conditions set
forth in the northern spotted owl conservation strategy are met.
Olympic Experimental State Forest management – due to improved forest inventory and
changes to the modeling of northern spotted owl habitat management, a set of requirements
defining the maximum harvest and thinning areas in the Olympic Experimental State Forest were
removed as they no longer affected harvest levels.
These model changes result in changes to projected planning decade harvest levels and 10-decade net
present values. Table 2 summarizes the direction of change expected due to these changes.
Table 2. Effects of changes in model data and assumptions on planning decade volume and 10-decade net
present value
Change Effect on planning decade volume Effect on 10-decade net present value
Forest
inventory
data
Updates to the forest inventory resulted
in an increase in the acres available for
harvest. This increased the planning
decade harvest volume.
Updates to the forest inventory resulted
in an increase in the acres available for
harvest. This increased the 10-decade net
present value.
Timber price
data
Updates to the prices can shift volume
projections up or down depending on
species composition of stands within
each sustainable harvest unit and the
region the stands are in.
Updates to the prices resulted in lower
10-decade net present values as the
more accurate price calculations that
resulted from removing the “saw” and
“chip and saw” categories resulted in
slightly lower average prices

Financial Analysis of Alternatives for Establishment of a Sustainable Harvest Level Page 9
Management
cost data
Updated management costs differ only
slightly from costs previously used,
resulting in little change in harvest
volume.
Updated management costs differ only
slightly from costs previously used.
Resulting in little change in 10-decade
net present value.
Timber
yields
Updated yields result in increased
planning decade harvest volume.
Updated yields result in increased 10-
decade net present value.
Discount rate The updated discount rate increased
planning decade volumes and lowered
volumes in future decades.
The updated discount rate reduced 10-
decade net present value.
Northern
Spotted Owl
habitat
management
Updated spotted owl management
modeling constrains increase first decade
volume and removes the peak in harvest
volume previously expected in the third
decade.
Updated spotted owl management
modeling constrains increase 10-decade
net present value by shifting volume
earlier in the 10-decade period.
Olympic
Experimental
State Forest
management
The removal of the Olympic Experimental
State Forest management constraints
have no effect on harvest volume. The
changes removed constraints that were
no longer affecting harvest volumes.
The removal of the Olympic Experimental
State Forest management constraints
have no effect on10-decade net present
value since thee change did not affect
harvest volume.
Key Understandings
Arrearage As stated previously, there are two arrearage options for harvesting 462 MMBF:
Harvest 462 MMBF proportionally from those sustainable harvest units with deficits over 10 years.
Harvest 462 MMBF proportionally from sustainable harvest units with deficits in 1 year, and then
harvest the remaining sustainable harvest level volume for the decade over the next 9 years.
The model reports harvest volume in decades, not years. Therefore, the model’s output data for both of
these options would be the same. In the majority of this analysis, DNR therefore provided results for the
first option only (harvesting 462 MMBF over 10 years). However, DNR did consider the qualitative
differences between these two options. These differences are discussed in the results section.
This analysis assumes arrearage volumes will be available for harvest in the planning decade. However,
they may not be. For example, although not required, part of the arrearage may come from thinning in
riparian areas. Yet any thinning that occurs in riparian areas in the planning decade would be assessed at
the operational level for environmental and economic feasibility and may or may not occur. Note that
riparian thinning during the fiscal year 2005 through 2014 planning decade was less than projected (Table
2).

Washington State Department of Natural Resources Page 10
Table 3. Actual Harvest in the Fiscal Year 2005 Through 2014 Planning Decade by Location and Harvest Activity
Type
Harvest Thinning Total
MMBF
% of projected
volume MMBF % of projected
volume MMBF % of projected
volume
Riparian
lands 0 N/A 48 20% 48 12%
Non-riparian
lands 4,604 108% 386 45% 4,991 98%
Total 4,604 (104%) 434 (40%) 5,038 92%
Refer to Appendix C of the sustainable harvest DEIS for a more detailed discussion on the reasons for the
current arrearage.
Recent Timber Revenue and Volumes DNR tracks both the timber volume sold and the timber volume harvested. Sales contracts typically
require timber harvest to occur within two years of sale. As a result, timber is frequently harvested in a
different fiscal year than when it was sold. Most revenue is generated when timber is harvested.7
This being the case, this analysis uses the harvest volume from fiscal years 2011 through 2018 to
represent baseline conditions for comparison of model results for each scenario. This period best
represents current conditions because it was a time of financial stability, and because harvest volumes
were not affected by the following:
The ramp-up in volume associated with the last sustainable harvest calculation,8
Adjustments following the 2007 recalculation of the sustainable harvest level, or
The 2008 windstorm that affected southwest Washington.
In addition, by fiscal year 2011, department staffing levels had recovered from losses due to the economic
downturn in 2009.
7 A portion of the total revenue from a sale is collected as a deposit prior to harvest. 8 The ramp-up period occurred in 2005 and 2006. This was the adjustment in volume from the prior decade’s harvest level to the level set in 2004. This level was subsequently adjusted in 2007.

Financial Analysis of Alternatives for Establishment of a Sustainable Harvest Level Page 11
For fiscal years 2011 through 2018, harvest volume averaged 454.5 MMBF per year.9 Converting this
annual figure into a decadal level requires multiplying by ten. Therefore, harvesting an average 456
MMBF per year equates to 4,545 MMBF per decade. Appendix B contains the actual harvest volumes
from fiscal year 2011 through 2018 for each sustainable harvest unit, each trust, and the State Forest
Transfer Trust for each county. In the appendix, volumes are converted into volume per decade for
comparison with model results, along with revenue generated for each trust from harvest of this timber.
How Data are Presented
Since there are eight marbled murrelet strategy alternatives, four arrearage harvest options (excluding the
one year option, refer to “Arrearage” under “Key Understandings” earlier in this document), and three
riparian thinning options, there are 96 possible scenarios. DNR modeled 38 of these scenarios the cover
the range of possible results. Results for the 38 scenarios are shown together in tables in this document.
For 36 scenarios the marbled murrelet strategy alternatives in the left-hand column and the arrearage
harvest and riparian thinning options in right-hand columns (Figure 3). Scenarios including marbled
murrelet conservation strategy alternative G and H are in separate rows below the other 36 scenarios.
Tables are color coded to show the results for each scenario clearly. Cells with the lowest value are shown
in shades of orange and those with the highest values are shown in shades of blue. Cells with the same
value have the same color. When appropriate, some tables have an additional column on the far right
showing the recent harvest level for comparison. That column is shown in green.
Volume data are presented in millions of board feet (MMBF) per decade unless otherwise noted.
9 In this same period, sales volume was 468 MMBF per year.

Washington State Department of Natural Resources Page 12
Figure 3. Example of a Table Showing Results for all 38 Scenarios Plus Comparison to Recent Harvest Level
The cell with the red border is marbled murrelet strategy Alternative B with arrearage harvest of 702 MMBF and
thinning of up to 10 percent of the riparian area. Since it is dark blue, it had a higher value than cells show in
lighter shades of blue or shades of orange.
Marbled
murrelet
strategy
alternative
Arrearage harvest Decadal rate
based on FY
2011-2015
performance
702 MMBF 462 MMBF No specific level
Riparian thinning
10% 1% 10% 1% 10% 1% Amount
Alt. A Amount Amount Amount Amount Amount Amount
Alt. B Amount Amount Amount Amount Amount Amount
Alt. C Amount Amount Amount Amount Amount Amount
Alt. D Amount Amount Amount Amount Amount Amount
Alt. E Amount Amount Amount Amount Amount Amount
Alt. F Amount Amount Amount Amount Amount Amount
Alt. G – 382 MMBF arrearage volume – Riparian not included Amount
Alt. H – 382 MMBF arrearage volume – Riparian not included Amount

Financial Analysis of Alternatives for Establishment of a Sustainable Harvest Level Page 13
Results
Net Present Value
In Western Washington Under the different scenarios, the 10-decade net present value of timber harvest from state trust lands in
Western Washington ranged from $3.09 billion to $3.89 billion (Table 4).10
Table 4. 10-decade Net Present Value of Each Scenario ($ billions)
Marbled
murrelet
strategy
alternative
Arrearage harvest
702 MMBF 462 MMBF No specific level
Riparian thinning
10% 1% 10% 1% 10% 1%
Alt. A 3.74 3.64 3.74 3.64 3.74 3.64
Alt. B 3.89 3.79 3.89 3.79 3.89 3.79
Alt. C 3.69 3.60 3.69 3.60 3.69 3.59
Alt. D 3.69 3.59 3.69 3.59 3.69 3.59
Alt. E 3.67 3.57 3.67 3.57 3.67 3.57
Alt. F 3.18 3.09 3.18 3.09 3.18 3.09
Alt. G – 382 MMBF arrearage volume – Riparian not included 3.43
Alt. H – 382 MMBF arrearage volume – Riparian not included 3.59
10 The net present value numbers in this financial analysis are lower than those reported in the July 2017 financial analysis due to a change in the discount rate used in calculating these values. In this analysis, the discount rate is 3 percent per year, up from 2 percent in the earlier analysis. The present value of future revenue is reduced under a 3 percent discount rate compared to the 2 percent discount rate.

Washington State Department of Natural Resources Page 14
EFFECTS OF MARBLED MURRELET STRATEGY ALTERNATIVES ON NET PRESENT VALUE
The marbled murrelet strategy alternatives have a larger impact on 10-decade net present value than either
arrearage harvest or riparian thinning options.
Marbled murrelet strategy Alternative B produces the highest 10-decade net present value. Alternatives
A, and C through F have lower values in the follow order from highest to lowest value A, C, D, E, and,
finally, F. The 10-decade net present value of Alternative B is approximately $700 million (or roughly 18
percent) higher than Alternative F, with each paring of arrearage harvest and riparian thinning option.
Alternatives G and H are modeled under a scenario that that does not include riparian thinning in the
harvest level, resulting in lower 10-decade net present value. However, isolating the effect of the murrelet
long-term conservation strategy shows that Alternative H has a 10-decade net present value between
alternatives A and C, while Alternative G is between alternatives E and F.
The extent to which a trust or county may be impacted by the marbled murrelet strategy corresponds
mostly to the number of acres of long-term forest cover in each trust or county. Figure 3 shows that as the
number of acres of long-term forest cover increases, net present value decreases. Appendix C shows the
net present value for each trust and, for the State Forest Transfer Trust, for each county. Appendix D
shows the results by sustainable harvest unit.

Financial Analysis of Alternatives for Establishment of a Sustainable Harvest Level Page 15
Figure 3. 10-decade Net Present Value by Long-term Forest Cover area
From left to right, the columns of blue dots correspond to marbled murrelet strategy alternatives B, A, D, C, E, G,
and F. The red dots represent the alternatives analyzed in the sustainable harvest DEIS for potential environmental
impacts (excluding the No Action alternative). The orange dot is the Board of Natural Resources preferred
alternative.
EFFECTS OF ARREARAGE HARVEST OPTIONS ON NET PRESENT VALUE
Arrearage harvest has a much smaller effect on 10-decade net present value than the marbled murrelet
strategy. Arrearage harvest of 382 MMBF, 462 MMBF, and 702 MMBF of timber are both equivalent to
the volume typically harvested by DNR over approximately 10 months, 1, and 1.5 years respectively,
while 10-decade net present value spans 100 years of harvest.
All else being equal, net present value is up to $2 million higher for scenarios that include 702 MMBF of
arrearage harvest than for those without a specific arrearage harvest volume. This difference ($2 million)
is less than 0.1 percent of 10-decade net present value.
B
H
A
CD
E
F
G
3.00
3.25
3.50
3.75
4.00
550,000 575,000 600,000 625,000 650,000 675,000 700,000 725,000 750,000
Do
llars
(b
illio
ns)
Acres of long-term forest cover

Washington State Department of Natural Resources Page 16
EFFECTS OF RIPARIAN THINNING OPTIONS ON NET PRESENT VALUE
The effect of the riparian thinning level on 10-decade net present value is up to $101 million, or about 3
percent of the 10-decade net present value.
Scenarios that include the 10 percent riparian thinning option generate higher 10-decade net present
values and higher first decade volumes than scenarios that include the 1 percent thinning option.
The scenarios with alternatives G and H do not include any riparian volume the harvest level or the 10-
decade net present value. The result of this is lower 10-decade net present values than if riparian thinning
was included in the scenario.
By Trust and County
EFFECTS OF MARBLED MURRELET STRATEGY ALTERNATIVES ON NET PRESENT VALUE
The marbled murrelet strategy alternatives affect 10-decade net present values differently in the different
trusts and counties. For example:
For several trusts and counties, the 10-decade net present value is similar for alternatives A through E
but substantially lower for Alternative F. For example, for the Scientific School Trust, the 10-decade
net present value is at least 22 percent lower under Alternative F than the other alternatives (Table
5).11
For State Forest Transfer Trust lands in Wahkiakum County, the 10-decade net present value is up to
54 percent lower under Alternative F than under Alternative B (Table 6; refer to Appendix C for 10-
decade net present value and planning decade volumes for all trusts and counties).12
For other trusts, such as State Forest Transfer Trust lands in Jefferson County, the marbled murrelet
strategy alternatives have relatively little effect on 10-decade net present value (Table 6).13
Table 5. Effect of the Scenarios on 10-decade Net Present Value for Each Trust
Magnitude of change in 10-decade net present value as
a percent of maximum 10-decade net present value
Trust
Maximum 10-decade
net present value
($ millions)
Due to marbled
murrelet
conservation
Due to
arrearage
harvest
Due to riparian
thinning
Agriculture School Grant 84 18% 0% 4%
Capitol Building Grant 244 25% 0% 2%
CEP&RI 91 22% 0% 3%
11 A similar pattern occurs on the Common School and Indemnity Trust and the State Forest Transfer Trust in King, Lewis, Mason, Pierce, Skagit, Snohomish, and Whatcom counties. 12 A similar pattern occurs on the Capitol Grant, CEPRI and CEPR Transferred, Normal School, Scientific School, State Forest Purchase, and University trusts, and in the State Forest Transfer Trust in Clallam and Pacific counties. 13 A similar patter occurs on the Community College Forest Reserve and Water Pollution Control Division trusts, and State Forest Transfer Trust in Clark, Cowlitz, Grays Harbor, Jefferson, Kitsap, Skamania, and Thurston counties.

Financial Analysis of Alternatives for Establishment of a Sustainable Harvest Level Page 17
Magnitude of change in 10-decade net present value as
a percent of maximum 10-decade net present value
Trust
Maximum 10-decade
net present value
($ millions)
Due to marbled
murrelet
conservation
Due to
arrearage
harvest
Due to riparian
thinning
Common School and Indemnity
1,321 22% 0% 3%
Community College Forest Reserve
16 2% 0% 5%
Normal school 87 18% 0% 3%
Other 0 0% 0% 0%
Scientific School 172 22% 0% 4%
State Forest Purchase 289 7% 0% 3%
State Forest Transfer 1,474 14% 0% 2%
University Grant 98 44% 0% 2%
Water Pollution Control Division
18 3% 0% 0%

Washington State Department of Natural Resources Page 18
Table 6. Effect of the Scenarios on 10-decade Net Present Value for Each County with State Forest Transfer Trust
Land
Note: total differs from State Forest Transfer maximum 10-decade net present value in Table 5 due to rounding.
State Forest
Transfer Trust
Magnitude of change in 10-decade net present value as a
percent of maximum 10-decade net present value
County
Maximum 10-
decade net present
value
($ millions)
Due to marbled
murrelet
conservation
Due to arrearage
harvest
Due to riparian
thinning
Clallam 239 14% 0% 1%
Clark 50 0% 0% 3%
Cowlitz 25 1% 0% 4%
Grays Harbor 9 15% 1% 4%
Jefferson 48 5% 0% 2%
King 54 20% 0% 0%
Kitsap 15 1% 0% 2%
Lewis 144 17% 0% 3%
Mason 72 1% 0% 1%
Pacific 43 27% 0% 7%
Pierce 35 58% 0% 1%
Skagit 273 17% 0% 2%
Skamania 70 0% 0% 2%
Snohomish 200 11% 0% 2%
Thurston 80 4% 1% 4%
Wahkiakum 45 54% 1% 3%
Whatcom 74 29% 0% 1%

Financial Analysis of Alternatives for Establishment of a Sustainable Harvest Level Page 19
EFFECTS OF ARREARAGE HARVEST OPTIONS ON NET PRESENT VALUE
Similar to the results at the scale of western Washington, the effect of the arrearage harvest options is
small at the scale of individual trusts and counties. An example is the 10-decade net present value for
Skamania State Forest Transfer Trust lands. For the Skamania State Forest Transfer Trust lands, the
difference in 10-decade net present value under the 702 MMBF arrearage harvest option and the no
specific arrearage option is about than 0.2 percent (Table 7). Alternatives G and H have lower 10-decade
net present values than the other alternatives shown in Table 7 due to the riparian thinning option, not due
to the arrearage option.
Some counties do not have arrearage from the fiscal year 2005 through 2014 planning decade. In these
counties, the arrearage option has no effect on 10-decade net present value.
Table 7. 10-decade Net Present Value for State Forest Transfer Trust lands in Skamania County ($ millions)
Marbled
murrelet
strategy
alternative
Arrearage harvest
702 MMBF 462 MMBF No specific level
Riparian thinning
10% 1% 10% 1% 10% 1%
Alt. A 70 69 70 69 70 69
Alt. B 70 69 70 69 70 69
Alt. C 70 69 70 69 70 69
Alt. D 70 69 70 69 70 69
Alt. E 70 69 70 69 70 69
Alt. F 70 69 70 69 70 69
Alt. G – 382 MMBF arrearage volume – Riparian not included 65
Alt. H – 382 MMBF arrearage volume – Riparian not included 65
EFFECTS OF RIPARIAN THINNING OPTIONS ON NET PRESENT VALUE
Similar to the results at the scale of western Washington, the effect of riparian thinning options on 10-
decade net present value for the trusts and counties is larger than the effect of arrearage but much smaller
than the effect of the marbled murrelet conservation strategy alternatives. For example, for Common

Washington State Department of Natural Resources Page 20
School and Indemnity Trust lands the difference in 10-decade net present value is about 3 percent
between the riparian thinning options. This difference is similar in other trusts and counties (Table 8).
Table 8. 10-decade Net Present Value for Common School and Indemnity Trust Lands ($ millions)
Marbled
murrelet
strategy
alternative
Arrearage harvest
702 MMBF 462 MMBF No specific level
Riparian thinning
10% 1% 10% 1% 10% 1%
Alt. A 1,273 1,235 1,273 1,236 1,273 1,236
Alt. B 1,320 1,282 1,320 1,282 1,321 1,282
Alt. C 1,255 1,219 1,254 1,219 1,255 1,219
Alt. D 1,248 1,213 1,248 1,213 1,249 1,213
Alt. E 1,246 1,211 1,246 1,211 1,246 1,211
Alt. F 1,029 997 1,030 998 1,030 998
Alt. G – 382 MMBF arrearage volume – Riparian not included 1,135
Alt. H – 382 MMBF arrearage volume – Riparian not included 1,206
Harvest Volume
In Western Washington In western Washington, the planning decade timber harvest volume under the scenarios ranges from 3,868
MMBF to 5,430 MMBF (Table 9). The annual harvest level for each scenario varies depending on the
arrearage option (refer to “Effects of Arrearage Harvest Options on Harvest Volume”).
Over 10 decades, the decadal harvest level follows a general pattern of decreasing decadal harvest
volumes though decade 5 followed by increasing volumes (Figure 4).

Financial Analysis of Alternatives for Establishment of a Sustainable Harvest Level Page 21
Table 9. Planning-decade Timber Harvest Volume of Each Scenario (MMBF/decade)
Marbled
murrelet
strategy
alternative
Arrearage harvest
702 MMBF 462 MMBF No specific level
Riparian thinning
10% 1% 10% 1% 10% 1%
Alt. A 5,048 4,879 5,010 4,849 4,925 4,760
Alt. B 5,430 5,247 5,391 5,219 5,276 5,044
Alt. C 5,029 4,866 4,987 4,814 4,902 4,729
Alt. D 5,067 4,900 5,037 4,863 4,922 4,734
Alt. E 4,986 4,822 4,937 4,770 4,862 4,689
Alt. F 4,198 4,077 4,118 4,002 3,990 3,868
Alt. G – 382 MMBF arrearage volume – Riparian not included 4,499
Alt. H – 382 MMBF arrearage volume – Riparian not included 4,794

Washington State Department of Natural Resources Page 22
Figure 4. 10-decade Harvest Levels Under Each Scenario
Scenarios with the maximum, median, and minimum 10-decade net present values* are shown in blue, red, and
green, respectively; other scenarios are in gray.
* The scenario with the maximum net present value is the combination of marbled murrelet strategy Alternative B,
the 702 MMBF of arrearage harvest option, and the 10 percent riparian thinning option. The scenario with the
median net present value (18th highest of 36 scenarios) is the combination of marbled murrelet strategy
Alternative A, the 462 MMBF of arrearage harvest option, and the 1 percent riparian thinning option. The scenario
with the minimum net present value is the combination of marbled murrelet strategy Alternative F, the no specific
arrearage harvest option, and the 1 percent riparian thinning option.
EFFECTS OF MARBLED MURRELET STRATEGY ALTERNATIVES ON HARVEST VOLUME
Results for harvest volume are similar to those for net present value. Alternative B produces the highest
planning decade harvest volume, followed by alternatives A, C, D, E, and, finally, F. Alternative B
produces 1,200 MMBF (about 23 percent) more harvest volume in the planning decade than Alternative
F, regardless of arrearage harvest or riparian thinning option (Figure 5). The maximum effect of marbled
murrelet strategy alternatives on harvest volume moderate over time, but exceed 480 MMBF per decade.
Alternatives G and H are modeled under a scenario that that does not include riparian thinning in the
harvest level, resulting in planning decade harvest volumes. However, isolating the effect of the murrelet
long-term conservation strategy shows that Alternative H has a planning decade volume similar to
alternatives A, while Alternative G is between alternatives E and F.
0
1,000
2,000
3,000
4,000
5,000
6,000
1 2 3 4 5 6 7 8 9 10
MM
BF
Decade
Max NPV Median NPV Min NPV

Financial Analysis of Alternatives for Establishment of a Sustainable Harvest Level Page 23
As with 10-decade net present value, the effect of the marbled murrelet strategy alternatives on planning
decade harvest volumes differs by trust and county (Tables 10 and 11).
Figure 5. Planning decade Harvest Volume by Area of Long-term Forest Cover
From left to right, the columns of blue dots correspond to marbled murrelet strategy alternatives B, A, D, C, E, G
and F. From left to right, the columns of blue dots correspond to marbled murrelet strategy alternatives B, A, D, C,
E, G, and F. The red dots represent the alternatives analyzed in the sustainable harvest DEIS for potential
environmental impacts (excluding the No Action alternative). The orange dot is the Board of Natural Resources
preferred alternative.
B
H
A CD
E
F
G
3,500
4,000
4,500
5,000
5,500
6,000
550,000 575,000 600,000 625,000 650,000 675,000 700,000 725,000 750,000
MM
BF
Acres of long-term forest cover

Washington State Department of Natural Resources Page 24
Table 10. Effect of the Scenarios on Planning Decade Harvest Volume for Each Trust
Magnitude of change in planning decade
harvest volume as a percent of maximum
planning decade harvest volume
Trust
Maximum planning
decade harvest volume
(MMBF)
Due to marbled
murrelet
conservation
Due to
arrearage
harvest
Due to
riparian
thinning
Agriculture School Grant 136 26% 2% 8%
Capitol Building Grant 490 26% 2% 3%
CEP&RI 137 34% 2% 8%
Common School and Indemnity 1,722 28% 2% 3%
Community College Forest Reserve
13 58% 0% 0%
Normal school 105 25% 3% 2%
Other 0 0% 0% 0%
Scientific School 274 30% 1% 6%
State Forest Purchase 430 7% 5% 8%
State Forest Transfer 1,987 17% 3% 4%
University Grant 134 58% 5% 2%
Water Pollution Control Division 6 6% 0% 1%
Table 11. Effect of the Scenarios on Planning Decade Harvest Volume for Each County with State Forest Transfer
Trust Land
Note: The sum of maximum planning decade harvest volumes in Table 10 is different than the maximum planning
decade harvest volume shown in Table 9 for State Forest Transfer trust land. The reason, is that no single scenario
produces the maximum planning decade harvest volume in every county at once.
State Forest Transfer Trust
Magnitude of change in planning decade
harvest volume as a percent of maximum
planning decade harvest volume
County
Maximum planning
decade harvest volume
(MMBF)
Due to marbled
murrelet
conservation
Due to
arrearage
harvest
Due to
riparian
thinning
Clallam 426 16% 6% 1%
Clark 42 0% 0% 15%
Cowlitz 22 5% 0% 11%
Grays Harbor 9 20% 1% 6%
Jefferson 77 6% 0% 6%
King 80 19% 12% 2%
Kitsap 11 1% 0% 3%
Lewis 182 19% 0% 4%
Mason 87 1% 0% 0%
Pacific 53 35% 3% 9%
Pierce 44 59% 0% 1%
Skagit 322 22% 0% 3%
Skamania 120 6% 11% 11%

Financial Analysis of Alternatives for Establishment of a Sustainable Harvest Level Page 25
State Forest Transfer Trust
Magnitude of change in planning decade
harvest volume as a percent of maximum
planning decade harvest volume
County
Maximum planning
decade harvest volume
(MMBF)
Due to marbled
murrelet
conservation
Due to
arrearage
harvest
Due to
riparian
thinning
Snohomish 228 20% 2% 1%
Thurston 131 23% 8% 24%
Wahkiakum 73 59% 15% 4%
Whatcom 85 28% 10% 1%
EFFECTS OF ARREARAGE HARVEST OPTIONS ON HARVEST VOLUME
Scenarios that include 702 MMBF and 462 MMBF in arrearage harvest result in a slightly higher harvest
volume in the planning decade than scenarios with no specific arrearage options. Harvest levels for
scenarios with 702 MMBF of arrearage harvest are no more than 210 MMBF higher than scenarios with
the no specific arrearage option, when paired with the 10 percent thinning option. When paired with the 1
percent riparian thinning option, the difference is even smaller: 191 MMBF.
Arrearage would be straightforward if the volume that was not harvested during a previous decade was
available for harvest now. However, areas that were unavailable for harvest during the fiscal year 2005
through 2014 planning decade (for example, areas transferred out of trust status, and areas where DNR
restricted harvest to avoid foreclosing future options for marbled murrelet conservation) continue to be
unavailable for harvest during the 2015 through 2024 planning decade. For that reason, the model must
make up the arrearage by bringing harvests forward from decade 2. That, in turn, reduces harvest volumes
in decade 2. Figure 6 shows a slightly higher harvest level in the planning decade and a small reduction in
the harvest level in the second decade under the 702 and 462 MMBF arrearage harvest options. Over the
first three decades, scenarios that include 702 or 462 MMBF of arrearage harvest result in slightly less
total harvest volume than scenarios with no specific arrearage volume.
Alternatives G and H are paired only with 382 MMBF of arrearage volume. The effect of this arrearage
harvest volume on harvest levels is similar to the 462 MMBF arrearage option.

Washington State Department of Natural Resources Page 26
Figure 6. Sustainable Harvest Level (solid bars) and Arrearage Harvest (hollow bars) in Western Washington
Under Three Arrearage Options Combined with Marbled Murrelet Strategy Alternative A and the 10 Percent
Riparian Thinning Option
Scenarios that include arrearage harvest of 702 MMBF or 462 MMBF result in a greater change in
harvest levels between the first and second decades than scenarios with no specific arrearage volume
(Figure 6). Larger changes in harvest levels will require DNR to make larger changes in staffing levels.
After the second decade, harvest levels are similar for scenarios that differ only by arrearage harvest level
(Figure 7).
3,500
3,700
3,900
4,100
4,300
4,500
4,700
4,900
5,100
1 2 3
MM
BF
Decade
Arrearage harvest - 702 MMBF Arrearage harvest - 462 MMBF
No specific arrearage harvest
70
2 46
2

Financial Analysis of Alternatives for Establishment of a Sustainable Harvest Level Page 27
Figure 7. Harvest Levels Under the Three Arrearage Options Combined With Marbled Murrelet Strategy
Alternative A and the 10 Percent Riparian Thinning Option
The line for 462 MMBF of arrearage harvest nearly completely overlaps the line for 702 MMBF of arrearage
harvest.
Timing of Arrearage and Within-decade Variability
The arrearage harvest options differ in the timing of harvest of arrearage volume (Text Box 2). However,
under all options, DNR would harvest the specified arrearage volume by the end of the planning decade,
2024. As it is currently fiscal year 2019, and only five full fiscal years remain in the planning decade, the
options that specify the harvest of arrearage in five or ten years have the same effect on harvest levels in
the remaining years of the planning decade.
The option that specifies the harvest of arrearage volume in 1 year, however, would have a different
result. Under this option, harvest occurs only in sustainable harvest units with arrearage. As a result, for
one year no revenue would be generated on State Forest Transfer Trust lands that benefit Clark, Cowlitz,
Jefferson, Lewis, Mason, Pierce, Skagit, or Snohomish counties. This option would result in large swings
in harvest levels around the state, which may increase management expenditures, as explained previously.
For example, harvest volumes in the OESF would be about twice as high during that one year than in the
other years of the decade. Significant additional staff would be needed to set up and do compliance on
these additional sales. Staff would then need to be shifted to other regions to meet their subsequent
harvest levels. Also, additional costs would be incurred from temporarily high demand for seedlings,
staff, and contractors for planting.
The spike in volume offered for sale in one year also may depress revenue per volume sold: excess timber
supply on the market may suppress prices, and increased demand for logging crews may increase logging
costs for purchasers
0
1,000
2,000
3,000
4,000
5,000
6,000
1 2 3 4 5 6 7 8 9 10
MM
BF
Decade
Arrearage harvest - 702 MMBF Arrearage harvest - 462 MMBF
No specific arrearage harvest

Washington State Department of Natural Resources Page 28
EFFECTS OF RIPARIAN THINNING OPTIONS ON HARVEST VOLUME
Scenarios that include the 10-percent riparian thinning option result in between 121 and 232 MMBF more
harvest volume in the planning decade than the 1-percent thinning option, depending on marbled murrelet
strategy and arrearage option. Harvest levels over a 10-decade period are also highest under the 10-
percent riparian thinning option (Figure 8).
Alternative G and H are paired only with an option not to include riparian thinning volume in the
calculation of the harvest level. The result of this is a lower harvest volume for the planning decade and
over a 10-decade period. During implementation, thinning in riparian areas is expected to continue at a
level consistent with recent practice under the Riparian Forest Restoration Strategy and Olympic
Experimental State Forest HCP Unit Forest Land Plan. Volume from these activities will be counted
towards attainment of the sustainable harvest level.
Figure 8. Harvest Levels Under the Two Riparian Thinning Levels Combined With Marbled Murrelet Strategy
Alternative A and no Specific Level Arrearage Harvest Option
By Trust and County
EFFECTS OF MARBLED MURRELET STRATEGY ALTERNATIVES ON HARVEST VOLUME
Similar to 10-decade net present value, the effects of the scenarios on the planning decade harvest level
differ at the scale of the individual trusts, or counties for the State Forest Transfer Trust.
The marbled murrelet strategy alternatives affect the harvest level differently in the different trusts and
counties. For example, for State Forest Transfer Trust lands in Wahkiakum County, the harvest level
under marbled murrelet strategy Alternative F is 40 percent of the level under Alternative B, and half to
0
1,000
2,000
3,000
4,000
5,000
6,000
1 2 3 4 5 6 7 8 9 10
MM
BF
Decade
10% riparian thinning level 1% riparian thinning level

Financial Analysis of Alternatives for Establishment of a Sustainable Harvest Level Page 29
two thirds recent harvest levels (Table 13). Alternative H produces harvest volumes that approach
Alternative B levels.
The other patterns in the 10-decade net present value results appear in the first decade results. Some trusts
or counties are mainly affected by alternative F and G (Table 14), while other are largely unaffected
(Table 15).
Table 12. Planning Decade Harvest Level for State Forest Transfer Trust lands in Wahkiakum County
(MMBF/decade)
Marbled
murrelet
strategy
alternative
Arrearage harvest
Decadal rate
based on FY
2011-2018
performance
702 MMBF 462 MMBF No specific level
Riparian thinning
10% 1% 10% 1% 10% 1%
Alt. A 42 41 39 39 36 36 50
Alt. B 73 70 69 66 62 59
Alt. C 40 39 40 39 35 33
Alt. D 42 41 39 38 34 32
Alt. E 40 39 40 39 35 33
Alt. F 30 29 30 28 24 23
Alt. G – 382 MMBF arrearage volume – Riparian not included 31
Alt. H – 382 MMBF arrearage volume – Riparian not included 59

Washington State Department of Natural Resources Page 30
Table 13. Planning Decade Harvest Level for Scientific School Trust Lands (MMBF/decade)
Marbled
murrelet
strategy
alternative
Arrearage harvest
Decadal rate
based on FY
2011-2018
performance
702 MMBF 462 MMBF No specific level
Riparian thinning
10% 1% 10% 1% 10% 1%
Alt. A 260 246 261 244 257 243 257
Alt. B 274 258 273 259 270 249
Alt. C 263 246 260 247 260 246
Alt. D 261 247 266 248 262 249
Alt. E 260 247 260 244 260 247
Alt. F 192 178 192 176 189 178
Alt. G – 382 MMBF arrearage volume – Riparian not included 205
Alt. H – 382 MMBF arrearage volume – Riparian not included 241

Financial Analysis of Alternatives for Establishment of a Sustainable Harvest Level Page 31
Table 14. Planning Decade Harvest Level for State Forest Transfer Trust Lands in Jefferson County
(MMBF/decade)
Marbled
murrelet
strategy
alternative
Arrearage harvest
Decadal rate
based on FY
2011-2018
performance
702 MMBF 462 MMBF No specific level
Riparian thinning
10% 1% 10% 1% 10% 1%
Alt. A 72 69 73 69 73 69 62
Alt. B 77 73 77 73 77 73
Alt. C 77 73 77 73 77 73
Alt. D 77 73 77 73 77 73
Alt. E 77 73 77 73 77 73
Alt. F 76 73 76 73 76 73
Alt. G – 382 MMBF arrearage volume – Riparian not included 73
Alt. H – 382 MMBF arrearage volume – Riparian not included 73
EFFECTS OF ARREARAGE HARVEST OPTIONS ON HARVEST VOLUME
The effect of the arrearage harvest options on the planning decade harvest level is small but apparent
between the arrearage options, as exemplified by the harvest level for State Forest Transfer Trust lands in
Skamania County (Table 15). Alternatives G and H have lower planning decade harvest levels than the
other alternatives shown in Table 15 due to the riparian thinning option, not due to the arrearage option.

Washington State Department of Natural Resources Page 32
Table 15. Planning Decade Harvest Level for State Forest Transfer Trust Lands in Skamania County
(MMBF/decade)
Marbled
murrelet
strategy
alternative
Arrearage harvest
Decadal rate
based on FY
2011-2018
performance
702 MMBF 462 MMBF No specific level
Riparian thinning
10% 1% 10% 1% 10% 1%
Alt. A 116 107 116 107 107 103 54
Alt. B 120 107 118 107 107 103
Alt. C 120 107 118 107 107 103
Alt. D 120 107 118 107 107 103
Alt. E 120 107 117 107 107 103
Alt. F 113 107 107 107 103 103
Alt. G – 382 MMBF arrearage volume – Riparian not included 100
Alt. H – 382 MMBF arrearage volume – Riparian not included 101
EFFECTS OF RIPARIAN THINNING OPTIONS ON HARVEST VOLUME
The effect of the riparian harvest options is relatively small in most cases on the planning decade harvest
level at the trust and county level (Table 16). However, for State Forest Transfer Trust lands in Clark,
Cowlitz, Skamania, and Thurston counties the maximum change to planning decade harvest volumes due
to the riparian thinning option exceeds 10 percent of the decadal harvest level.

Financial Analysis of Alternatives for Establishment of a Sustainable Harvest Level Page 33
Table 16. Planning Decade Harvest Level for Common School and Indemnity Trust Lands (MMBF/decade)
Marbled
murrelet
strategy
alternative
Arrearage harvest
Decadal rate
based on FY
2011-2018
performance
702 MMBF 462 MMBF No specific level
Riparian thinning
10% 1% 10% 1% 10% 1%
Alt. A 1,586 1,530 1,579 1,531 1,571 1,510 1,193
Alt. B 1,722 1,672 1,714 1,669 1,689 1,593
Alt. C 1,576 1,534 1,582 1,530 1,562 1,519
Alt. D 1,591 1,540 1,585 1,538 1,560 1,493
Alt. E 1,562 1,521 1,564 1,521 1,555 1,507
Alt. F 1,241 1,184 1,199 1,156 1,154 1,113
Alt. G – 382 MMBF arrearage volume – Riparian not included 1,368
Alt. H – 382 MMBF arrearage volume – Riparian not included 1,484
Land Base Available for Production
The area available for harvest varies by marbled murrelet strategy alternative. Lands managed to maintain
long-term forest cover include areas where thinning can occur, and areas where thinning cannot occur,
such as northern spotted owl nest patches, marbled murrelet occupied sites, NRCAs, and NAPs.
Additional information about changes in land area available for production in each trust and county is
available in the marbled murrelet RDEIS in Chapters 3.11 and 4.11. Table 17 provides the number of
acres available for harvest under each alternative, since DNR generates the most revenue from these
acres.

Washington State Department of Natural Resources Page 34
Table 17. Area Available for Harvest Activities in Western Washington
Marbled murrelet strategy
alternative
Lands where only
thinning may occur or
that are deferred from
activity (acres)
Lands where thinning
and harvest may occur
(acres)
Total
(acres)14
Alt. A 686,000 779,000 1,465,000
Alt. B 678,000 787,000 1,465,000
Alt. C 706,000 759,000 1,465,000
Alt. D 709,000 756,000 1,465,000
Alt. E 710,000 755,000 1,465,000
Alt. F 819,000 646,000 1,465,000
Alt. G 725,000 740,000 1,465,000
Alt. H 701,000 764,000 1,465,000
Management Funds
As explained in the introduction to this analysis, management funds are used to cover expenditures
incurred in managing state trust lands. Expenditures can be broken into three categories: direct
expenditures associated with timber production such as timber sale setup, compliance, and marketing;
silvicultural expenditures such as site preparation, planting, vegetation management, pre-commercial
thinning, and surveys; and indirect expenditures of land management such as planning, inventory, right-
of-way management, legal support, and research.15
During the planning decade, management funds available to DNR under each scenario range from $40
million to $56 million per year (Table 18). The marbled murrelet strategy alternatives have the greatest
impact on management funds. Under Alternative F, funds are about $12 million per year less than under
Alternative B and $8 million to $11 million less than they were in the fiscal years 2011 through 2018
period.
As described in Appendix F of the sustainable harvest DEIS, indirect expenditures are likely to remain
constant over a range of harvest levels. Under marbled murrelet strategy Alternative F, indirect
14 Acres reported here are from the forest estate model. Acres differ from the total number of DNR-managed forested acres in western Washington by about 1 percent due to data limits of the forest estate model. Refer to sustainable harvest DEIS Appendix F for more information about these data limits. 15 For more information on indirect costs, refer to slide 25 of the May 2015 Board of Natural Resources presentation available at http://file.dnr.wa.gov/publications/em_bc_bnr_shc_may2016_presentation.pdf.

Financial Analysis of Alternatives for Establishment of a Sustainable Harvest Level Page 35
expenditures will either account for a much larger proportion of the total cost of harvesting timber than
under other alternatives, or these activities will be curtailed.
Table 18. Management Funds in the Planning Decade ($ millions/year)
Marbled
murrelet
strategy
alternative
Arrearage harvest
Decadal rate
based on FY
2011-2018
performance
702 MMBF 462 MMBF Rolled in
Riparian thinning
10% 1% 10% 1% 10% 1%
Alt. A 53 51 52 50 52 50 51
Alt. B 56 54 56 54 55 52
Alt. C 52 50 52 50 51 49
Alt. D 52 51 52 50 51 49
Alt. E 52 50 51 49 51 49
Alt. F 43 42 42 41 41 40
Alt. G – 382 MMBF arrearage volume – Riparian not included 47
Alt. H – 382 MMBF arrearage volume – Riparian not included 50

Washington State Department of Natural Resources Page 36
References Washington Department of Natural Resources. 2006. Policy for Sustainable Forests. Washington State
Department of Natural Resources, Olympia, Washington.
Washington Department of Natural Resources. 2016a. Draft Environmental Impact Statement on
Alternatives for Establishment of a Sustainable Harvest Level for Forested State Trust Lands in Western
Washington. Washington Department of Natural Resources, Olympia, Washington.
Washington Department of Natural Resources. 2016b. Olympic Experimental State Forest HCP Planning
Unit Forest Land Plan. Washington Department of Natural Resources, Olympia, Washington.
Washington Department of Natural Resources. 2017. Financial Analysis of Alternatives for Establishment
of a Sustainable Harvest Level for Forested State Trust Lands in Western Washington. Washington State
Department of Natural Resources, Olympia, Washington.
Washington Department of Natural Resources. 2018. Revised Draft Environmental Impact Statement for
the Marbled Murrelet Long-Term Conservation Strategy. Washington Department of Natural Resources,
Olympia, Washington.

Financial Analysis - Appendix A Model Updates Page A-1
Appendix A. Model Updates – Sustainable harvest DEIS to July 2017 financial analysis
Arrearage Table A-1 presents the portion of first decade harvest volumes for each sustainable harvest unit that is
specifically due to arrearage from the fiscal year 2005 through 2014 planning decade. The table includes
volumes for each arrearage harvest option with 702 MMBF or 462 MMBF. The table shows volumes
only for the sustainable harvest units in which arrearage occurred during the past decade. In sustainable
harvest units not listed, actual harvest met or exceeded the planned harvest level.
Table A-1. Projected Arrearage Harvest Volume for Each Sustainable Harvest Unit in Arrears in the Fiscal Year
2005 through 2014 Planning Decade Under Each Arrearage Option
Sustainable harvest unit
Arrearage harvest volume under 702 MMBF option
Arrearage harvest volume under 462 MMBF option*
Arrearage harvest volume under 382 MMBF option
Capitol 56 37 56
Clallam 25 16 25
Federal 347 229 45
King 16 10 16
OESF 200 132 200
Pacific 4 3 4
Skamania 19 13 19
Wahkiakum 17 11 17
Whatcom 18 12 0
* Values sum to 463 due to rounding

Washington State Department of Natural Resources Page A-2
This page intentionally left blank.

Financial Analysis - Appendix B Fiscal Year 2011 Through 2015 Harvest Levels and Revenue Page B-1
Appendix B. Fiscal Year 2011 Through 2018 Harvest Levels and Revenue This appendix reports net revenue distributed to the trusts in fiscal years 2011 through 2018. Data came
from DNR’s revenue tracking database, NaturE. Revenue numbers were adjusted to 2018 dollars using
the consumer price index (U.S. Bureau of Labor Statistics 2018).
Table B-1. Revenue by Sustainable Harvest Unit
Sustainable harvest unit
Harvest volume FY 2011–2018
(MMBF) Annual average
(MMBF)
Annual harvest converted into a decadal harvest
level (MMBF)
Capitol 327 41 409
Clallam 123 15 154
Clark 171 21 214
Cowlitz 53 7 66
Federal 1,482 185 1,853
Grays Harbor 2 0 3
Jefferson 50 6 62
King 45 6 56
Kitsap 16 2 19
Lewis 174 22 218
Mason 79 10 99
OESF 315 39 394
Pacific 46 6 58
Pierce 12 2 15
Skagit 262 33 328
Skamania 43 5 54
Snohomish 260 33 325
Thurston 42 5 53
Wahkiakum 40 5 50
Whatcom 93 12 116
Total 3,636 454 4,545

Washington State Department of Natural Resources Page B-2
Table B-2. Revenue by Trust
Sustainable harvest unit Trust(s)
Harvest volume FY
2011–2015 (MMBF)
Annual average (MMBF)
Annual harvest converted into
a decadal harvest level
(MMBF)
Annual net revenue FY 2011–2018
(2018 dollars in
million)
State Lands
Agricultural School Grant
91 11 114 $4
Capitol Building Grant
235 29 294 $7
CEP&RI (including
CEP&RI Transferred)
Grant
103 13 128
$4
Common School and Indemnity
954 119 1,193 $28
Normal School 64 8 80 $2
Scientific School 206 26 257 $6
University Grant (original
and transferred)
55 7 69
$1
State Forest Lands
State Forest Purchase Trust*
254 32 318 $6
State Forest Transfer Trust
1,656 207 2,070 $59
Other lands Community College Forest
Reserve
10 1 13
$0.4
Water Pollution Control Division
6 1 8 $0.2
Other <0.1 <0.1 <0.1 $<0.1
Total 3,636 454 4,545 $118 * Includes timber trust lands for University repayment and Forest Board repayment.
Table B-3. Revenue by county for State Forest Transfer Trust lands
County
Harvest volume FY 2011–2018
(MMBF) Annual average
(MMBF)
Annual harvest converted into a decadal harvest
level (MMBF)
Annual net revenue FY 2011–2018 (2018
dollars in million)
Clallam 222 28 278 $6
Clark 171 21 214 $6
Cowlitz 53 7 66 $2
Grays Harbor 11 1 13 $0.4
Jefferson 50 6 62 $2

Financial Analysis - Appendix B Fiscal Year 2011 Through 2015 Harvest Levels and Revenue Page B-3
County
Harvest volume FY 2011–2018
(MMBF) Annual average
(MMBF)
Annual harvest converted into a decadal harvest
level (MMBF)
Annual net revenue FY 2011–2018 (2018
dollars in million)
King 45 6 56 $2
Kitsap 16 2 19 $0.6
Lewis 174 22 218 $6
Mason 79 10 99 $4
Pacific 46 6 58 $1
Pierce 12 2 15 $0.4
Skagit 262 33 328 $10
Skamania 43 5 54 $1
Snohomish 260 33 325 $9
Thurston 79 10 99 $3
Wahkiakum 40 5 50 $1
Whatcom 93 12 116 $3
Total 1,656 207 2,070 $59
References U.S. Bureau of Labor Statistics. 2018. Consumer price index for all urban consumers: all items less food
and energy. Available at: https://research.stlouisfed.org. Accessed August 2, 2018.

Washington State Department of Natural Resources Page B-4
This page intentionally left blank.

Financial Analysis - Appendix C Trust and County Level Results Page C-1
Appendix C. Trust and County Level Results This appendix reports the fiscal year 2015 through 2024 planning decade projected volume and 10-decade
net present value under each scenario for each trust, and for the State Forest Transfer trust, for each
county. Planning decade volume is compared to the actual harvest volume from the fiscal year 2011
through 2018 planning period.
By Trust
Agricultural School Grant
Table C-1. Planning Decade Volume, Agricultural School Grant (MMBF/decade)
Marbled
murrelet
strategy
alternative
Arrearage harvest Decadal rate
based on FY
2011-2018
performance
702 MMBF 462 MMBF No specific level
Riparian thinning
10% 1% 10% 1% 10% 1%
Alt. A 131 121 131 120 125 118 114
Alt. B 136 125 136 125 134 122
Alt. C 133 122 132 122 131 120
Alt. D 132 121 131 120 129 117
Alt. E 132 121 131 121 129 118
Alt. F 101 95 101 93 101 92
Alt. G – 382 MMBF arrearage volume – Riparian not included 114
Alt. H – 382 MMBF arrearage volume – Riparian not included 117

Washington State Department of Natural Resources Page C-2
Table C-2. 10-decade Net Present Value, Agricultural School Grant ($ millions)
Marbled
murrelet
strategy
alternative
Arrearage harvest
702 MMBF 462 MMBF No specific level
Riparian thinning
10% 1% 10% 1% 10% 1%
Alt. A 83 79 83 79 83 79
Alt. B 84 81 84 81 84 81
Alt. C 83 79 83 79 83 79
Alt. D 82 79 82 79 82 79
Alt. E 82 79 82 79 82 79
Alt. F 69 65 69 65 69 65
Alt. G – 382 MMBF arrearage volume – Riparian not included 76
Alt. H – 382 MMBF arrearage volume – Riparian not included 77
Capitol Building Grant
Table C-3. Planning Decade Volume, Capitol Building Grant (MMBF/decade)
Marbled
murrelet
strategy
alternative
Arrearage harvest Decadal rate
based on FY
2011-2018
performance
702 MMBF 462 MMBF No specific level
Riparian thinning
10% 1% 10% 1% 10% 1%
Alt. A 453 439 453 438 450 429 294
Alt. B 490 476 490 479 481 465
Alt. C 448 435 449 434 442 429
Alt. D 455 439 455 442 446 431
Alt. E 444 431 444 431 441 429
Alt. F 362 358 359 345 341 331
Alt. G – 382 MMBF arrearage volume – Riparian not included 372
Alt. H – 382 MMBF arrearage volume – Riparian not included 413

Financial Analysis - Appendix C Trust and County Level Results Page C-3
Table C-4. 10-decade Net Present Value, Capitol Building Grant ($ millions)
Marbled
murrelet
strategy
alternative
Arrearage harvest
702 MMBF 462 MMBF No specific level
Riparian thinning
10% 1% 10% 1% 10% 1%
Alt. A 232 227 232 228 232 228
Alt. B 243 238 243 239 244 239
Alt. C 225 221 226 221 226 221
Alt. D 226 222 226 222 226 222
Alt. E 225 220 225 220 225 220
Alt. F 183 178 183 179 183 179
Alt. G – 382 MMBF arrearage volume – Riparian not included 206
Alt. H – 382 MMBF arrearage volume – Riparian not included 221
CEP&RI16 (including CEP&RI transferred)
Table C-5. Planning Decade Volume, CEP&RI (MMBF/decade)
Marbled
murrelet
strategy
alternative
Arrearage harvest Decadal rate
based on FY
2011-2018
performance
702 MMBF 462 MMBF No specific level
Riparian thinning
10% 1% 10% 1% 10% 1%
Alt. A 114 107 115 108 114 107 128
Alt. B 137 129 137 126 133 127
Alt. C 109 104 110 104 110 104
Alt. D 114 107 114 108 114 107
Alt. E 110 103 110 103 111 103
Alt. F 92 84 91 84 91 83
Alt. G – 382 MMBF arrearage volume – Riparian not included 100
Alt. H – 382 MMBF arrearage volume – Riparian not included 117
16 Charitable, Educational, Penal, and Reformatory Institutions Grant

Washington State Department of Natural Resources Page C-4
Table C-6. 10-decade Net Present Value, CEP&RI ($ millions)
Marbled
murrelet
strategy
alternative
Arrearage harvest
702 MMBF 462 MMBF No specific level
Riparian thinning
10% 1% 10% 1% 10% 1%
Alt. A 85 82 85 82 85 82
Alt. B 91 88 91 88 91 88
Alt. C 82 79 82 79 82 79
Alt. D 81 78 81 78 81 78
Alt. E 82 79 82 79 82 79
Alt. F 71 68 71 68 71 68
Alt. G – 382 MMBF arrearage volume – Riparian not included 78
Alt. H – 382 MMBF arrearage volume – Riparian not included 84
Common School and Indemnity
Table C-7. Planning Decade Volume, Common School and Indemnity (MMBF/decade)
Marbled
murrelet
strategy
alternative
Arrearage harvest Decadal rate
based on FY
2011-2018
performance
702 MMBF 462 MMBF No specific level
Riparian thinning
10% 1% 10% 1% 10% 1%
Alt. A 1,586 1,530 1,579 1,531 1,571 1,510 1,193
Alt. B 1,722 1,672 1,714 1,669 1,689 1,593
Alt. C 1,576 1,534 1,582 1,530 1,562 1,519
Alt. D 1,591 1,540 1,585 1,538 1,560 1,493
Alt. E 1,562 1,521 1,564 1,521 1,555 1,507
Alt. F 1,241 1,184 1,199 1,156 1,154 1,113
Alt. G – 382 MMBF arrearage volume – Riparian not included 1,368
Alt. H – 382 MMBF arrearage volume – Riparian not included 1,484

Financial Analysis - Appendix C Trust and County Level Results Page C-5
Table C-8. 10-decade Net Present Value, Common School and Indemnity ($ millions)
Marbled
murrelet
strategy
alternative
Arrearage harvest
702 MMBF 462 MMBF No specific level
Riparian thinning
10% 1% 10% 1% 10% 1%
Alt. A 1,273 1,235 1,273 1,236 1,273 1,236
Alt. B 1,320 1,282 1,320 1,282 1,321 1,282
Alt. C 1,255 1,219 1,254 1,219 1,255 1,219
Alt. D 1,248 1,213 1,248 1,213 1,249 1,213
Alt. E 1,246 1,211 1,246 1,211 1,246 1,211
Alt. F 1,029 997 1,030 998 1,030 998
Alt. G – 382 MMBF arrearage volume – Riparian not included 1,135
Alt. H – 382 MMBF arrearage volume – Riparian not included 1,206
Community College Forest Reserve
Table C-9. Planning Decade Volume, Community College Forest Reserve (MMBF/decade)
Marbled
murrelet
strategy
alternative
Arrearage harvest Decadal rate
based on FY
2011-2018
performance
702 MMBF 462 MMBF No specific level
Riparian thinning
10% 1% 10% 1% 10% 1%
Alt. A 13 13 13 13 13 13 13
Alt. B 13 13 13 13 13 13
Alt. C 13 13 13 13 13 12
Alt. D 13 13 13 13 13 12
Alt. E 13 13 13 13 13 12
Alt. F 5 12 5 12 5 13
Alt. G – 382 MMBF arrearage volume – Riparian not included 12
Alt. H – 382 MMBF arrearage volume – Riparian not included 12

Washington State Department of Natural Resources Page C-6
Table C-10. 10-decade Net Present Value, Community College Forest Reserve ($ millions)
Marbled
murrelet
strategy
alternative
Arrearage harvest
702 MMBF 462 MMBF No specific level
Riparian thinning
10% 1% 10% 1% 10% 1%
Alt. A 16 15 16 15 16 15
Alt. B 16 15 16 15 16 15
Alt. C 16 15 16 15 16 15
Alt. D 16 15 16 15 16 15
Alt. E 16 15 16 15 16 15
Alt. F 16 15 16 15 16 15
Alt. G – 382 MMBF arrearage volume – Riparian not included 15
Alt. H – 382 MMBF arrearage volume – Riparian not included 15
Normal School
Table C-11. Planning Decade Volume, Normal School (MMBF/decade)
Marbled
murrelet
strategy
alternative
Arrearage harvest Decadal rate
based on FY
2011-2018
performance
702 MMBF 462 MMBF No specific level
Riparian thinning
10% 1% 10% 1% 10% 1%
Alt. A 95 97 95 94 96 98 80
Alt. B 105 100 105 103 102 101
Alt. C 92 90 88 90 93 88
Alt. D 93 95 93 92 93 92
Alt. E 89 84 91 85 89 86
Alt. F 87 83 79 82 81 77
Alt. G – 382 MMBF arrearage volume – Riparian not included 89
Alt. H – 382 MMBF arrearage volume – Riparian not included 89

Financial Analysis - Appendix C Trust and County Level Results Page C-7
Table C-12. 10-decade Net Present Value, Normal School ($ millions)
Marbled
murrelet
strategy
alternative
Arrearage harvest
702 MMBF 462 MMBF No specific level
Riparian thinning
10% 1% 10% 1% 10% 1%
Alt. A 84 81 84 81 84 81
Alt. B 87 84 87 84 87 84
Alt. C 80 77 80 77 80 77
Alt. D 81 79 81 79 81 79
Alt. E 80 77 80 77 80 77
Alt. F 71 69 72 69 72 69
Alt. G – 382 MMBF arrearage volume – Riparian not included 75
Alt. H – 382 MMBF arrearage volume – Riparian not included 76
Scientific School
Table C-13. Planning Decade Volume, Scientific School (MMBF/decade)
Marbled
murrelet
strategy
alternative
Arrearage harvest Decadal rate
based on FY
2011-2018
performance
702 MMBF 462 MMBF No specific level
Riparian thinning
10% 1% 10% 1% 10% 1%
Alt. A 260 246 261 244 257 243 257
Alt. B 274 258 273 259 270 249
Alt. C 263 246 260 247 260 246
Alt. D 261 247 266 248 262 249
Alt. E 260 247 260 244 260 247
Alt. F 192 178 192 176 189 178
Alt. G – 382 MMBF arrearage volume – Riparian not included 205
Alt. H – 382 MMBF arrearage volume – Riparian not included 241

Washington State Department of Natural Resources Page C-8
Table C-14. 10-decade Net Present Value, Scientific School ($ millions)
Marbled
murrelet
strategy
alternative
Arrearage harvest
702 MMBF 462 MMBF No specific level
Riparian thinning
10% 1% 10% 1% 10% 1%
Alt. A 168 161 168 161 168 161
Alt. B 172 166 172 166 172 166
Alt. C 167 161 167 161 167 161
Alt. D 167 161 167 161 167 161
Alt. E 167 161 167 161 167 161
Alt. F 135 130 135 130 135 130
Alt. G – 382 MMBF arrearage volume – Riparian not included 148
Alt. H – 382 MMBF arrearage volume – Riparian not included 160
State Forest Purchase
Table C-15. Planning Decade Volume, State Forest Purchase (MMBF/decade)
Marbled
murrelet
strategy
alternative
Arrearage harvest Decadal rate
based on FY
2011-2018
performance
702 MMBF 462 MMBF No specific level
Riparian thinning
10% 1% 10% 1% 10% 1%
Alt. A 430 395 414 388 407 390 318
Alt. B 428 421 428 410 398 399
Alt. C 409 396 414 394 387 356
Alt. D 407 400 404 396 387 368
Alt. E 407 387 413 395 394 364
Alt. F 401 376 388 364 358 357
Alt. G – 382 MMBF arrearage volume – Riparian not included 380
Alt. H – 382 MMBF arrearage volume – Riparian not included 383

Financial Analysis - Appendix C Trust and County Level Results Page C-9
Table C-16. 10-decade Net Present Value, State Forest Purchase ($ millions)
Marbled
murrelet
strategy
alternative
Arrearage harvest
702 MMBF 462 MMBF No specific level
Riparian thinning
10% 1% 10% 1% 10% 1%
Alt. A 284 274 283 273 283 274
Alt. B 289 280 289 279 288 279
Alt. C 280 271 280 271 279 270
Alt. D 278 269 278 269 277 268
Alt. E 280 271 280 271 280 270
Alt. F 269 260 269 259 268 259
Alt. G – 382 MMBF arrearage volume – Riparian not included 265
Alt. H – 382 MMBF arrearage volume – Riparian not included 266
State Forest Transfer
Table C-17. Planning Decade Volume, State Forest Transfer (MMBF/decade)
Marbled
murrelet
strategy
alternative
Arrearage harvest Decadal rate
based on FY
2011-2018
performance
702 MMBF 462 MMBF No specific level
Riparian thinning
10% 1% 10% 1% 10% 1%
Alt. A 1,834 1,807 1,823 1,789 1,768 1,731 2,070
Alt. B 1,987 1,916 1,957 1,900 1,922 1,842
Alt. C 1,870 1,812 1,821 1,767 1,790 1,744
Alt. D 1,895 1,833 1,869 1,805 1,824 1,763
Alt. E 1,866 1,817 1,809 1,758 1,769 1,724
Alt. F 1,655 1,647 1,640 1,629 1,612 1,568
Alt. G – 382 MMBF arrearage volume – Riparian not included 1,758
Alt. H – 382 MMBF arrearage volume – Riparian not included 1,830

Washington State Department of Natural Resources Page C-10
Table C-18. 10-decade Net Present Value, State Forest Transfer ($ millions)
Marbled
murrelet
strategy
alternative
Arrearage harvest
702 MMBF 462 MMBF No specific level
Riparian thinning
10% 1% 10% 1% 10% 1%
Alt. A 1,410 1,381 1,410 1,381 1,410 1,380
Alt. B 1,474 1,444 1,474 1,444 1,473 1,442
Alt. C 1,408 1,378 1,408 1,378 1,407 1,378
Alt. D 1,415 1,386 1,415 1,386 1,414 1,385
Alt. E 1,401 1,372 1,401 1,372 1,401 1,372
Alt. F 1,265 1,240 1,266 1,240 1,266 1,239
Alt. G – 382 MMBF arrearage volume – Riparian not included 1,343
Alt. H – 382 MMBF arrearage volume – Riparian not included 1,391
University Grant (original and transferred)
Table C-19. Planning Decade Volume, University Grant (MMBF/decade)
Marbled
murrelet
strategy
alternative
Arrearage harvest Decadal rate
based on FY
2011-2018
performance
702 MMBF 462 MMBF No specific level
Riparian thinning
10% 1% 10% 1% 10% 1%
Alt. A 123 119 120 119 118 115 69
Alt. B 134 131 133 130 128 127
Alt. C 110 108 110 107 108 106
Alt. D 100 97 100 96 87 96
Alt. E 96 93 96 93 96 93
Alt. F 56 55 58 55 52 50
Alt. G – 382 MMBF arrearage volume – Riparian not included 94
Alt. H – 382 MMBF arrearage volume – Riparian not included 102

Financial Analysis - Appendix C Trust and County Level Results Page C-11
Table C-20. 10-decade Net Present Value, University Grant ($ millions)
Marbled
murrelet
strategy
alternative
Arrearage harvest
702 MMBF 462 MMBF No specific level
Riparian thinning
10% 1% 10% 1% 10% 1%
Alt. A 91 89 91 89 91 89
Alt. B 98 96 98 96 98 96
Alt. C 80 78 80 78 80 78
Alt. D 74 72 74 72 74 72
Alt. E 75 73 75 72 75 72
Alt. F 55 53 55 54 55 54
Alt. G – 382 MMBF arrearage volume – Riparian not included 71
Alt. H – 382 MMBF arrearage volume – Riparian not included 78
Water Pollution Control Division
Table C-21. Planning Decade Volume, Water Pollution Control Division (MMBF/decade)
Marbled
murrelet
strategy
alternative
Arrearage harvest Decadal rate
based on FY
2011-2018
performance
702 MMBF 462 MMBF No specific level
Riparian thinning
10% 1% 10% 1% 10% 1%
Alt. A 6 6 6 6 6 6 8
Alt. B 6 6 6 6 6 6
Alt. C 6 6 6 6 6 6
Alt. D 6 6 6 6 6 6
Alt. E 6 6 6 6 6 6
Alt. F 6 6 6 6 6 6
Alt. G – 382 MMBF arrearage volume – Riparian not included 6
Alt. H – 382 MMBF arrearage volume – Riparian not included 6

Washington State Department of Natural Resources Page C-12
Table C-22. 10-decade Net Present Value, Water Pollution Control Division ($ millions)
Marbled
murrelet
strategy
alternative
Arrearage harvest
702 MMBF 462 MMBF No specific level
Riparian thinning
10% 1% 10% 1% 10% 1%
Alt. A 18 18 18 18 18 18
Alt. B 18 18 18 18 18 18
Alt. C 17 17 17 17 17 17
Alt. D 18 18 18 18 18 18
Alt. E 17 17 17 17 17 17
Alt. F 18 18 18 18 18 17
Alt. G – 382 MMBF arrearage volume – Riparian not included 17
Alt. H – 382 MMBF arrearage volume – Riparian not included 18
Other17
Table C-23. Planning Decade Volume, Other (MMBF/decade)
Marbled
murrelet
strategy
alternative
Arrearage harvest Decadal rate
based on FY
2011-2018
performance
702 MMBF 462 MMBF No specific level
Riparian thinning
10% 1% 10% 1% 10% 1%
Alt. A 0 0 0 0 0 0 0.1
Alt. B 0 0 0 0 0 0
Alt. C 0 0 0 0 0 0
Alt. D 0 0 0 0 0 0
Alt. E 0 0 0 0 0 0
Alt. F 0 0 0 0 0 0
Alt. G – 382 MMBF arrearage volume – Riparian not included 0
Alt. H – 382 MMBF arrearage volume – Riparian not included 0
17 Includes transacted lands where DNR holds timber rights.

Financial Analysis - Appendix C Trust and County Level Results Page C-13
Table C-24. 10-decade Net Present Value, Other ($ millions)
Marbled
murrelet
strategy
alternative
Arrearage harvest
702 MMBF 462 MMBF No specific level
Riparian thinning
10% 1% 10% 1% 10% 1%
Alt. A 0 0 0 0 0 0
Alt. B 0 0 0 0 0 0
Alt. C 0 0 0 0 0 0
Alt. D 0 0 0 0 0 0
Alt. E 0 0 0 0 0 0
Alt. F 0 0 0 0 0 0
Alt. G – 382 MMBF arrearage volume – Riparian not included 0
Alt. H – 382 MMBF arrearage volume – Riparian not included 0
State Forest Transfer Trust by County
Clallam County
Table C-25. Planning Decade Volume, Clallam County (MMBF/decade)
Marbled
murrelet
strategy
alternative
Arrearage harvest Decadal rate
based on FY
2011-2018
performance
702 MMBF 462 MMBF No specific level
Riparian thinning
10% 1% 10% 1% 10% 1%
Alt. A 357 357 348 349 330 331 278
Alt. B 426 423 418 417 399 397
Alt. C 386 387 360 356 345 339
Alt. D 394 397 386 384 368 361
Alt. E 383 383 351 348 334 328
Alt. F 403 396 398 385 382 363
Alt. G – 382 MMBF arrearage volume – Riparian not included 366
Alt. H – 382 MMBF arrearage volume – Riparian not included 376

Washington State Department of Natural Resources Page C-14
Table C-26. 10-decade Net Present Value, Clallam County ($ millions)
Marbled
murrelet
strategy
alternative
Arrearage harvest
702 MMBF 462 MMBF No specific level
Riparian thinning
10% 1% 10% 1% 10% 1%
Alt. A 204 202 204 202 205 202
Alt. B 239 237 239 237 238 237
Alt. C 217 216 218 216 217 216
Alt. D 220 218 220 218 220 218
Alt. E 212 210 212 210 212 210
Alt. F 214 213 214 213 214 213
Alt. G – 382 MMBF arrearage volume – Riparian not included 203
Alt. H – 382 MMBF arrearage volume – Riparian not included 213
Clark County
Table C-27. Planning Decade Volume, Clark County (MMBF/decade)
Marbled
murrelet
strategy
alternative
Arrearage harvest Decadal rate
based on FY
2011-2018
performance
702 MMBF 462 MMBF No specific level
Riparian thinning
10% 1% 10% 1% 10% 1%
Alt. A 42 36 42 36 42 36 214
Alt. B 42 36 42 36 42 36
Alt. C 42 36 42 36 42 36
Alt. D 42 36 42 36 42 36
Alt. E 42 36 42 36 42 36
Alt. F 42 36 42 36 42 36
Alt. G – 382 MMBF arrearage volume – Riparian not included 36
Alt. H – 382 MMBF arrearage volume – Riparian not included 36

Financial Analysis - Appendix C Trust and County Level Results Page C-15
Table C-28. 10-decade Net Present Value, Clark County ($ millions)
Marbled
murrelet
strategy
alternative
Arrearage harvest
702 MMBF 462 MMBF No specific level
Riparian thinning
10% 1% 10% 1% 10% 1%
Alt. A 50 49 50 49 50 49
Alt. B 50 49 50 49 50 49
Alt. C 50 49 50 49 50 49
Alt. D 50 49 50 49 50 49
Alt. E 50 49 50 49 50 49
Alt. F 50 49 50 49 50 49
Alt. G – 382 MMBF arrearage volume – Riparian not included 48
Alt. H – 382 MMBF arrearage volume – Riparian not included 48
Cowlitz County
Table C-29. Planning Decade Volume, Cowlitz County (MMBF/decade)
Marbled
murrelet
strategy
alternative
Arrearage harvest Decadal rate
based on FY
2011-2018
performance
702 MMBF 462 MMBF No specific level
Riparian thinning
10% 1% 10% 1% 10% 1%
Alt. A 22 19 22 19 22 19 66
Alt. B 22 19 22 19 22 19
Alt. C 22 19 22 19 22 19
Alt. D 22 19 22 19 22 19
Alt. E 22 19 22 19 22 19
Alt. F 21 19 21 19 21 19
Alt. G – 382 MMBF arrearage volume – Riparian not included 19
Alt. H – 382 MMBF arrearage volume – Riparian not included 19

Washington State Department of Natural Resources Page C-16
Table C-30. 10-decade Net Present Value, Cowlitz County ($ millions)
Marbled
murrelet
strategy
alternative
Arrearage harvest
702 MMBF 462 MMBF No specific level
Riparian thinning
10% 1% 10% 1% 10% 1%
Alt. A 25 24 25 24 25 24
Alt. B 25 24 25 24 25 24
Alt. C 25 24 25 24 25 24
Alt. D 25 24 25 24 25 24
Alt. E 25 24 25 24 25 24
Alt. F 25 24 25 24 25 24
Alt. G – 382 MMBF arrearage volume – Riparian not included 24
Alt. H – 382 MMBF arrearage volume – Riparian not included 24
Grays Harbor County
Table C-31. Planning Decade Volume, Grays Harbor County (MMBF/decade)
Marbled
murrelet
strategy
alternative
Arrearage harvest Decadal rate
based on FY
2011-2018
performance
702 MMBF 462 MMBF No specific level
Riparian thinning
10% 1% 10% 1% 10% 1%
Alt. A 7 6 7 6 7 7 13
Alt. B 9 8 8 8 9 8
Alt. C 9 8 9 8 9 8
Alt. D 9 8 9 8 9 8
Alt. E 8 8 9 8 9 8
Alt. F 7 7 7 7 7 7
Alt. G – 382 MMBF arrearage volume – Riparian not included 8
Alt. H – 382 MMBF arrearage volume – Riparian not included 8

Financial Analysis - Appendix C Trust and County Level Results Page C-17
Table C-32. 10-decade Net Present Value, Grays Harbor County ($ millions)
Marbled
murrelet
strategy
alternative
Arrearage harvest
702 MMBF 462 MMBF No specific level
Riparian thinning
10% 1% 10% 1% 10% 1%
Alt. A 8 7 8 7 8 7
Alt. B 8 8 8 8 8 8
Alt. C 8 8 8 8 8 8
Alt. D 8 8 9 8 8 8
Alt. E 8 8 8 8 9 8
Alt. F 7 7 7 7 7 7
Alt. G – 382 MMBF arrearage volume – Riparian not included 8
Alt. H – 382 MMBF arrearage volume – Riparian not included 8
Jefferson County
Table C-33. Planning Decade Volume, Jefferson County (MMBF/decade)
Marbled
murrelet
strategy
alternative
Arrearage harvest Decadal rate
based on FY
2011-2018
performance
702 MMBF 462 MMBF No specific level
Riparian thinning
10% 1% 10% 1% 10% 1%
Alt. A 72 69 73 69 73 69 62
Alt. B 77 73 77 73 77 73
Alt. C 77 73 77 73 77 73
Alt. D 77 73 77 73 77 73
Alt. E 77 73 77 73 77 73
Alt. F 76 73 76 73 76 73
Alt. G – 382 MMBF arrearage volume – Riparian not included 73
Alt. H – 382 MMBF arrearage volume – Riparian not included 73

Washington State Department of Natural Resources Page C-18
Table C-34. 10-decade Net Present Value, Jefferson County ($ millions)
Marbled
murrelet
strategy
alternative
Arrearage harvest
702 MMBF 462 MMBF No specific level
Riparian thinning
10% 1% 10% 1% 10% 1%
Alt. A 46 45 46 45 46 45
Alt. B 48 47 48 47 48 47
Alt. C 48 47 48 47 48 47
Alt. D 48 47 48 47 48 47
Alt. E 48 47 48 47 48 47
Alt. F 48 47 48 47 48 47
Alt. G – 382 MMBF arrearage volume – Riparian not included 47
Alt. H – 382 MMBF arrearage volume – Riparian not included 47
King County
Table C-35. Planning Decade Volume, King County (MMBF/decade)
Marbled
murrelet
strategy
alternative
Arrearage harvest Decadal rate
based on FY
2011-2018
performance
702 MMBF 462 MMBF No specific level
Riparian thinning
10% 1% 10% 1% 10% 1%
Alt. A 78 80 75 76 69 71 56
Alt. B 79 80 75 77 70 71
Alt. C 78 79 74 76 68 70
Alt. D 79 80 75 77 70 71
Alt. E 78 79 74 76 68 70
Alt. F 61 65 59 62 55 56
Alt. G – 382 MMBF arrearage volume – Riparian not included 79
Alt. H – 382 MMBF arrearage volume – Riparian not included 80

Financial Analysis - Appendix C Trust and County Level Results Page C-19
Table C-36. 10-decade Net Present Value, King County ($ millions)
Marbled
murrelet
strategy
alternative
Arrearage harvest
702 MMBF 462 MMBF No specific level
Riparian thinning
10% 1% 10% 1% 10% 1%
Alt. A 54 53 54 53 53 53
Alt. B 54 54 54 54 54 53
Alt. C 53 53 53 53 53 53
Alt. D 54 54 54 54 54 53
Alt. E 53 53 53 53 53 53
Alt. F 43 43 43 43 43 43
Alt. G – 382 MMBF arrearage volume – Riparian not included 53
Alt. H – 382 MMBF arrearage volume – Riparian not included 53
Kitsap County
Table C-37. Planning Decade Volume, Kitsap County (MMBF/decade)
Marbled
murrelet
strategy
alternative
Arrearage harvest Decadal rate
based on FY
2011-2018
performance
702 MMBF 462 MMBF No specific level
Riparian thinning
10% 1% 10% 1% 10% 1%
Alt. A 11 11 11 11 11 11 19
Alt. B 11 11 11 11 11 11
Alt. C 11 11 11 11 11 11
Alt. D 11 11 11 11 11 11
Alt. E 11 11 11 11 11 11
Alt. F 11 11 11 11 11 11
Alt. G – 382 MMBF arrearage volume – Riparian not included 11
Alt. H – 382 MMBF arrearage volume – Riparian not included 11

Washington State Department of Natural Resources Page C-20
Table C-38. 10-decade Net Present Value, Kitsap County ($ millions)
Marbled
murrelet
strategy
alternative
Arrearage harvest
702 MMBF 462 MMBF No specific level
Riparian thinning
10% 1% 10% 1% 10% 1%
Alt. A 14 14 14 14 14 14
Alt. B 15 14 15 14 15 14
Alt. C 15 14 15 14 15 14
Alt. D 15 14 15 14 15 14
Alt. E 15 14 15 14 15 14
Alt. F 15 14 15 14 15 14
Alt. G – 382 MMBF arrearage volume – Riparian not included 14
Alt. H – 382 MMBF arrearage volume – Riparian not included 14
Lewis County
Table C-39. Planning Decade Volume, Lewis County (MMBF/decade)
Marbled
murrelet
strategy
alternative
Arrearage harvest Decadal rate
based on FY
2011-2018
performance
702 MMBF 462 MMBF No specific level
Riparian thinning
10% 1% 10% 1% 10% 1%
Alt. A 181 173 181 173 181 173 218
Alt. B 182 174 182 174 182 174
Alt. C 181 173 181 173 181 173
Alt. D 182 174 182 174 182 174
Alt. E 181 173 181 173 181 173
Alt. F 147 144 147 144 147 144
Alt. G – 382 MMBF arrearage volume – Riparian not included 172
Alt. H – 382 MMBF arrearage volume – Riparian not included 172

Financial Analysis - Appendix C Trust and County Level Results Page C-21
Table C-40. 10-decade Net Present Value, Lewis County ($ millions)
Marbled
murrelet
strategy
alternative
Arrearage harvest
702 MMBF 462 MMBF No specific level
Riparian thinning
10% 1% 10% 1% 10% 1%
Alt. A 143 138 143 138 143 138
Alt. B 144 139 144 139 144 139
Alt. C 143 138 143 138 143 138
Alt. D 144 139 144 139 144 139
Alt. E 143 138 143 138 143 138
Alt. F 120 115 120 115 120 115
Alt. G – 382 MMBF arrearage volume – Riparian not included 137
Alt. H – 382 MMBF arrearage volume – Riparian not included 138
Mason County
Table C-41. Planning Decade Volume, Mason County (MMBF/decade)
Marbled
murrelet
strategy
alternative
Arrearage harvest Decadal rate
based on FY
2011-2018
performance
702 MMBF 462 MMBF No specific level
Riparian thinning
10% 1% 10% 1% 10% 1%
Alt. A 86 87 86 87 86 87 99
Alt. B 87 87 87 87 87 87
Alt. C 86 87 86 87 86 87
Alt. D 87 87 87 87 87 87
Alt. E 86 87 86 87 86 87
Alt. F 86 87 86 87 86 87
Alt. G – 382 MMBF arrearage volume – Riparian not included 87
Alt. H – 382 MMBF arrearage volume – Riparian not included 87

Washington State Department of Natural Resources Page C-22
Table C-42. 10-decade Net Present Value, Mason County ($ millions)
Marbled
murrelet
strategy
alternative
Arrearage harvest
702 MMBF 462 MMBF No specific level
Riparian thinning
10% 1% 10% 1% 10% 1%
Alt. A 71 70 71 70 71 70
Alt. B 72 71 72 71 72 71
Alt. C 71 71 71 71 71 71
Alt. D 71 71 71 71 71 71
Alt. E 71 71 71 71 71 71
Alt. F 71 71 71 71 71 71
Alt. G – 382 MMBF arrearage volume – Riparian not included 71
Alt. H – 382 MMBF arrearage volume – Riparian not included 71
Pacific County
Table C-43. Planning Decade Volume, Pacific County (MMBF/decade)
Marbled
murrelet
strategy
alternative
Arrearage harvest Decadal rate
based on FY
2011-2018
performance
702 MMBF 462 MMBF No specific level
Riparian thinning
10% 1% 10% 1% 10% 1%
Alt. A 40 37 40 36 40 35 58
Alt. B 53 48 53 47 52 46
Alt. C 40 35 40 35 39 34
Alt. D 39 34 39 34 37 33
Alt. E 40 35 40 35 39 34
Alt. F 35 31 35 31 34 30
Alt. G – 382 MMBF arrearage volume – Riparian not included 34
Alt. H – 382 MMBF arrearage volume – Riparian not included 36

Financial Analysis - Appendix C Trust and County Level Results Page C-23
Table C-44. 10-decade Net Present Value, Pacific County ($ millions)
Marbled
murrelet
strategy
alternative
Arrearage harvest
702 MMBF 462 MMBF No specific level
Riparian thinning
10% 1% 10% 1% 10% 1%
Alt. A 36 33 36 33 36 33
Alt. B 43 40 43 40 43 40
Alt. C 35 32 35 32 35 32
Alt. D 33 31 33 31 33 31
Alt. E 35 32 35 32 35 32
Alt. F 31 29 31 29 31 29
Alt. G – 382 MMBF arrearage volume – Riparian not included 31
Alt. H – 382 MMBF arrearage volume – Riparian not included 32
Pierce County
Table C-45. Planning Decade Volume, Pierce County (MMBF/decade)
Marbled
murrelet
strategy
alternative
Arrearage harvest Decadal rate
based on FY
2011-2018
performance
702 MMBF 462 MMBF Rolled in
Riparian thinning
10% 1% 10% 1% 10% 1%
Alt. A 44 44 44 44 44 44 15
Alt. B 44 44 44 44 44 44
Alt. C 44 43 44 43 44 43
Alt. D 44 44 44 44 44 44
Alt. E 44 43 44 43 44 43
Alt. F 18 18 18 18 18 18
Alt. G – 382 MMBF arrearage volume – Riparian not included 43
Alt. H – 382 MMBF arrearage volume – Riparian not included 43

Washington State Department of Natural Resources Page C-24
Table C-46. 10-decade Net Present Value, Pierce County ($ millions)
Marbled
murrelet
strategy
alternative
Arrearage harvest
702 MMBF 462 MMBF No specific level
Riparian thinning
10% 1% 10% 1% 10% 1%
Alt. A 35 35 35 35 35 35
Alt. B 35 35 35 35 35 35
Alt. C 35 35 35 35 35 35
Alt. D 35 35 35 35 35 35
Alt. E 35 35 35 35 35 35
Alt. F 15 15 15 15 15 15
Alt. G – 382 MMBF arrearage volume – Riparian not included 35
Alt. H – 382 MMBF arrearage volume – Riparian not included 35
Skagit County
Table C-47. Planning Decade Volume, Skagit County (MMBF/decade)
Marbled
murrelet
strategy
alternative
Arrearage harvest Decadal rate
based on FY
2011-2018
performance
702 MMBF 462 MMBF No specific level
Riparian thinning
10% 1% 10% 1% 10% 1%
Alt. A 320 311 320 311 320 311 328
Alt. B 322 312 322 312 322 312
Alt. C 315 305 315 305 315 305
Alt. D 319 309 319 309 319 309
Alt. E 315 305 315 305 315 305
Alt. F 251 254 251 253 250 254
Alt. G – 382 MMBF arrearage volume – Riparian not included 301
Alt. H – 382 MMBF arrearage volume – Riparian not included 308

Financial Analysis - Appendix C Trust and County Level Results Page C-25
Table C-48. 10-decade Net Present Value, Skagit County ($ millions)
Marbled
murrelet
strategy
alternative
Arrearage harvest
702 MMBF 462 MMBF No specific level
Riparian thinning
10% 1% 10% 1% 10% 1%
Alt. A 272 267 272 267 272 267
Alt. B 273 268 273 268 273 268
Alt. C 268 263 268 263 268 263
Alt. D 271 265 271 265 271 265
Alt. E 268 263 268 263 268 263
Alt. F 227 222 227 222 227 222
Alt. G – 382 MMBF arrearage volume – Riparian not included 259
Alt. H – 382 MMBF arrearage volume – Riparian not included 265
Skamania County
Table C-49. Planning Decade Volume, Skamania County (MMBF/decade)
Marbled
murrelet
strategy
alternative
Arrearage harvest Decadal rate
based on FY
2011-2018
performance
702 MMBF 462 MMBF No specific level
Riparian thinning
10% 1% 10% 1% 10% 1%
Alt. A 116 107 116 107 107 103 54
Alt. B 120 107 118 107 107 103
Alt. C 120 107 118 107 107 103
Alt. D 120 107 118 107 107 103
Alt. E 120 107 117 107 107 103
Alt. F 113 107 107 107 103 103
Alt. G – 382 MMBF arrearage volume – Riparian not included 100
Alt. H – 382 MMBF arrearage volume – Riparian not included 101

Washington State Department of Natural Resources Page C-26
Table C-50. 10-decade Net Present Value, Skamania County ($ millions)
Marbled
murrelet
strategy
alternative
Arrearage harvest
702 MMBF 462 MMBF No specific level
Riparian thinning
10% 1% 10% 1% 10% 1%
Alt. A 70 69 70 69 70 69
Alt. B 70 69 70 69 70 69
Alt. C 70 69 70 69 70 69
Alt. D 70 69 70 69 70 69
Alt. E 70 69 70 69 70 69
Alt. F 70 69 70 69 70 69
Alt. G – 382 MMBF arrearage volume – Riparian not included 65
Alt. H – 382 MMBF arrearage volume – Riparian not included 65
Snohomish County
Table C-51. Planning Decade Volume, Snohomish County (MMBF/decade)
Marbled
murrelet
strategy
alternative
Arrearage harvest Decadal rate
based on FY
2011-2018
performance
702 MMBF 462 MMBF No specific level
Riparian thinning
10% 1% 10% 1% 10% 1%
Alt. A 221 226 222 226 223 226 325
Alt. B 224 226 225 226 228 225
Alt. C 216 217 217 217 218 217
Alt. D 218 219 219 219 221 218
Alt. E 216 218 217 217 218 217
Alt. F 182 193 182 193 183 193
Alt. G – 382 MMBF arrearage volume – Riparian not included 210
Alt. H – 382 MMBF arrearage volume – Riparian not included 223

Financial Analysis - Appendix C Trust and County Level Results Page C-27
Table C-52. 10-decade Net Present Value, Snohomish County ($ millions)
Marbled
murrelet
strategy
alternative
Arrearage harvest
702 MMBF 462 MMBF No specific level
Riparian thinning
10% 1% 10% 1% 10% 1%
Alt. A 200 196 200 196 200 196
Alt. B 200 196 200 196 200 196
Alt. C 194 190 194 190 194 190
Alt. D 194 190 194 190 194 190
Alt. E 194 190 194 190 194 190
Alt. F 178 175 178 175 178 175
Alt. G – 382 MMBF arrearage volume – Riparian not included 183
Alt. H – 382 MMBF arrearage volume – Riparian not included 193
Thurston County
Table C-53. Planning Decade Volume, Thurston County (MMBF/decade)
Marbled
murrelet
strategy
alternative
Arrearage harvest Decadal rate
based on FY
2011-2018
performance
702 MMBF 462 MMBF No specific level
Riparian thinning
10% 1% 10% 1% 10% 1%
Alt. A 112 119 116 119 101 96 99
Alt. B 130 112 121 113 131 99
Alt. C 129 116 113 108 123 124
Alt. D 129 112 122 107 123 112
Alt. E 130 125 113 108 114 116
Alt. F 112 116 113 116 121 99
Alt. G – 382 MMBF arrearage volume – Riparian not included 124
Alt. H – 382 MMBF arrearage volume – Riparian not included 124

Washington State Department of Natural Resources Page C-28
Table C-54. 10-decade Net Present Value, Thurston County ($ millions)
Marbled
murrelet
strategy
alternative
Arrearage harvest
702 MMBF 462 MMBF No specific level
Riparian thinning
10% 1% 10% 1% 10% 1%
Alt. A 77 75 77 75 77 74
Alt. B 79 77 79 77 80 76
Alt. C 79 77 79 76 79 77
Alt. D 80 77 79 77 79 77
Alt. E 79 77 79 76 79 77
Alt. F 79 77 79 77 79 76
Alt. G – 382 MMBF arrearage volume – Riparian not included 77
Alt. H – 382 MMBF arrearage volume – Riparian not included 77
Wahkiakum County
Table C-55. Planning Decade Volume, Wahkiakum County (MMBF/decade)
Marbled
murrelet
strategy
alternative
Arrearage harvest Decadal rate
based on FY
2011-2018
performance
702 MMBF 462 MMBF No specific level
Riparian thinning
10% 1% 10% 1% 10% 1%
Alt. A 42 41 39 39 36 36 50
Alt. B 73 70 69 66 62 59
Alt. C 40 39 40 39 35 33
Alt. D 42 41 39 38 34 32
Alt. E 40 39 40 39 35 33
Alt. F 30 29 30 28 24 23
Alt. G – 382 MMBF arrearage volume – Riparian not included 31
Alt. H – 382 MMBF arrearage volume – Riparian not included 59

Financial Analysis - Appendix C Trust and County Level Results Page C-29
Table C-56. 10-decade Net Present Value, Wahkiakum County ($ millions)
Marbled
murrelet
strategy
alternative
Arrearage harvest
702 MMBF 462 MMBF No specific level
Riparian thinning
10% 1% 10% 1% 10% 1%
Alt. A 31 30 31 30 31 30
Alt. B 45 44 45 44 45 43
Alt. C 27 26 27 26 27 26
Alt. D 26 26 26 26 26 25
Alt. E 27 26 27 26 27 26
Alt. F 21 20 21 20 21 20
Alt. G – 382 MMBF arrearage volume – Riparian not included 22
Alt. H – 382 MMBF arrearage volume – Riparian not included 36
Whatcom County
Table C-57. Planning Decade Volume, Whatcom County (MMBF/decade)
Marbled
murrelet
strategy
alternative
Arrearage harvest Decadal rate
based on FY
2011-2018
performance
702 MMBF 462 MMBF No specific level
Riparian thinning
10% 1% 10% 1% 10% 1%
Alt. A 83 85 80 81 75 75 116
Alt. B 84 85 82 83 76 77
Alt. C 73 76 71 74 67 67
Alt. D 79 82 78 78 71 72
Alt. E 72 75 70 73 66 66
Alt. F 59 61 57 59 52 52
Alt. G – 382 MMBF arrearage volume – Riparian not included 65
Alt. H – 382 MMBF arrearage volume – Riparian not included 75

Washington State Department of Natural Resources Page C-30
Table C-58. 10-decade Net Present Value, Whatcom County ($ millions)
Marbled
murrelet
strategy
alternative
Arrearage harvest
702 MMBF 462 MMBF No specific level
Riparian thinning
10% 1% 10% 1% 10% 1%
Alt. A 73 72 73 72 73 72
Alt. B 74 73 74 73 74 73
Alt. C 68 67 67 67 67 67
Alt. D 70 70 70 70 70 69
Alt. E 67 66 67 66 67 66
Alt. F 52 52 52 52 52 52
Alt. G – 382 MMBF arrearage volume – Riparian not included 64
Alt. H – 382 MMBF arrearage volume – Riparian not included 71

Financial Analysis - Appendix D Fiscal Year 2015 Through 2024 Planning Decade Annual Harvest Levels Page D-1
Appendix D. Sustainable Harvest Unit Level Results This appendix reports the planning decade volume and 10-decade net present value under each scenario
for each sustainable harvest unit (Figure D.1). Planning decade volume is compared to the actual harvest
volume from the fiscal year 2011 through 2018 period.
Figure D.1. Western Washington State Trust Lands Sustainable Harvest Units
(Individual units for State Forest Transfer Lands in each county are not shown separately).

Washington State Department of Natural Resources Page D-2
Federal
Table D-1. Planning Decade Volume, Federal Sustainable Harvest Unit (MMBF/decade)
Marbled
murrelet
strategy
alternative
Arrearage harvest Decadal rate
based on FY
2011-2018
performance
702 MMBF 462 MMBF No specific level
Riparian thinning
10% 1% 10% 1% 10% 1%
Alt. A 2,113 2,010 2,114 2,012 2,115 2,016 1,853
Alt. B 2,294 2,195 2,296 2,197 2,283 2,132
Alt. C 2,075 1,985 2,079 1,986 2,083 1,986
Alt. D 2,092 1,998 2,093 2,000 2,093 1,984
Alt. E 2,058 1,968 2,063 1,969 2,069 1,971
Alt. F 1,600 1,509 1,586 1,496 1,587 1,501
Alt. G – 382 MMBF arrearage volume – Riparian not included 1,776
Alt. H – 382 MMBF arrearage volume – Riparian not included 1,952
Table D-2. 10-decade Net Present Value, Federal Sustainable Harvest Unit ($ millions)
Marbled
murrelet
strategy
alternative
Arrearage harvest
702 MMBF 462 MMBF No specific level
Riparian thinning
10% 1% 10% 1% 10% 1%
Alt. A 1,660 1,602 1,660 1,602 1,660 1,602
Alt. B 1,716 1,657 1,716 1,657 1,716 1,657
Alt. C 1,615 1,561 1,615 1,561 1,616 1,561
Alt. D 1,608 1,553 1,608 1,553 1,608 1,553
Alt. E 1,607 1,553 1,608 1,553 1,608 1,553
Alt. F 1,337 1,288 1,337 1,288 1,337 1,288
Alt. G – 382 MMBF arrearage volume – Riparian not included 1,462
Alt. H – 382 MMBF arrearage volume – Riparian not included 1,555

Financial Analysis - Appendix D Fiscal Year 2015 Through 2024 Planning Decade Annual Harvest Levels Page D-3
OESF
Table D-3. Planning Decade Volume, OESF Sustainable Harvest Unit (MMBF/decade)
Marbled
murrelet
strategy
alternative
Arrearage harvest Decadal rate
based on FY
2011-2018
performance
702 MMBF 462 MMBF No specific level
Riparian thinning
10% 1% 10% 1% 10% 1%
Alt. A 829 832 814 826 782 784 394
Alt. B 896 897 884 895 841 842
Alt. C 812 820 790 791 758 760
Alt. D 828 836 822 824 766 768
Alt. E 799 805 770 776 745 747
Alt. F 664 676 627 638 549 555
Alt. G – 382 MMBF arrearage volume – Riparian not included 717
Alt. H – 382 MMBF arrearage volume – Riparian not included 771
Table D-4. 10-decade Net Present Value, OESF Sustainable Harvest Unit ($ millions)
Marbled
murrelet
strategy
alternative
Arrearage harvest
702 MMBF 462 MMBF No specific level
Riparian thinning
10% 1% 10% 1% 10% 1%
Alt. A 432 432 432 432 433 432
Alt. B 460 460 460 460 461 460
Alt. C 417 417 417 417 418 417
Alt. D 419 419 419 419 420 419
Alt. E 409 409 410 409 410 409
Alt. F 318 318 319 319 321 320
Alt. G – 382 MMBF arrearage volume – Riparian not included 377
Alt. H – 382 MMBF arrearage volume – Riparian not included 407

Washington State Department of Natural Resources Page D-4
Capitol State Forest
Table D-5. Planning Decade Volume, Capitol State Forest Sustainable Harvest Unit (MMBF/decade)
Marbled
murrelet
strategy
alternative
Arrearage harvest Decadal rate
based on FY
2011-2018
performance
702 MMBF 462 MMBF No specific level
Riparian thinning
10% 1% 10% 1% 10% 1%
Alt. A 515 481 503 470 479 448 409
Alt. B 526 493 514 482 491 459
Alt. C 526 493 514 482 491 459
Alt. D 526 493 514 482 491 459
Alt. E 526 493 514 482 491 459
Alt. F 526 492 513 481 491 457
Alt. G – 382 MMBF arrearage volume – Riparian not included 492
Alt. H – 382 MMBF arrearage volume – Riparian not included 492
Table D-6. 10-decade Net Present Value, Capitol State Forest Sustainable Harvest Unit ($ millions)
Marbled
murrelet
strategy
alternative
Arrearage harvest
702 MMBF 462 MMBF No specific level
Riparian thinning
10% 1% 10% 1% 10% 1%
Alt. A 384 370 384 369 383 369
Alt. B 392 377 391 377 390 376
Alt. C 392 377 391 377 390 376
Alt. D 392 377 391 377 390 376
Alt. E 392 377 391 377 390 376
Alt. F 391 377 391 377 390 376
Alt. G – 382 MMBF arrearage volume – Riparian not included 377
Alt. H – 382 MMBF arrearage volume – Riparian not included 377

Financial Analysis - Appendix D Fiscal Year 2015 Through 2024 Planning Decade Annual Harvest Levels Page D-5
Clallam
Table D-7. Planning Decade Volume, Clallam Sustainable Harvest Unit (MMBF/decade)
Marbled
murrelet
strategy
alternative
Arrearage harvest Decadal rate
based on FY
2011-2018
performance
702 MMBF 462 MMBF No specific level
Riparian thinning
10% 1% 10% 1% 10% 1%
Alt. A 208 205 203 200 194 191 154
Alt. B 266 262 261 257 251 248
Alt. C 244 241 239 235 229 225
Alt. D 234 230 229 225 219 215
Alt. E 233 229 227 224 218 214
Alt. F 251 247 246 242 237 232
Alt. G – 382 MMBF arrearage volume – Riparian not included 228
Alt. H – 382 MMBF arrearage volume – Riparian not included 232
Table D-8. 10-decade Net Present Value, Clallam Sustainable Harvest Unit ($ millions)
Marbled
murrelet
strategy
alternative
Arrearage harvest
702 MMBF 462 MMBF No specific level
Riparian thinning
10% 1% 10% 1% 10% 1%
Alt. A 124 122 124 122 123 122
Alt. B 155 154 155 154 155 153
Alt. C 143 142 143 141 142 141
Alt. D 138 137 138 137 138 136
Alt. E 137 136 137 136 137 136
Alt. F 146 145 146 145 146 145
Alt. G – 382 MMBF arrearage volume – Riparian not included 136
Alt. H – 382 MMBF arrearage volume – Riparian not included 138

Washington State Department of Natural Resources Page D-6
Clark
Table D-9. Planning Decade Volume, Clark Sustainable Harvest Unit (MMBF/decade)
Marbled
murrelet
strategy
alternative
Arrearage harvest Decadal rate
based on FY
2011-2018
performance
702 MMBF 462 MMBF No specific level
Riparian thinning
10% 1% 10% 1% 10% 1%
Alt. A 42 36 42 36 42 36 214
Alt. B 42 36 42 36 42 36
Alt. C 42 36 42 36 42 36
Alt. D 42 36 42 36 42 36
Alt. E 42 36 42 36 42 36
Alt. F 42 36 42 36 42 36
Alt. G – 382 MMBF arrearage volume – Riparian not included 36
Alt. H – 382 MMBF arrearage volume – Riparian not included 36
Table D-10. 10-decade Net Present Value, Clark Sustainable Harvest Unit ($ millions)
Marbled
murrelet
strategy
alternative
Arrearage harvest
702 MMBF 462 MMBF No specific level
Riparian thinning
10% 1% 10% 1% 10% 1%
Alt. A 50 49 50 49 50 49
Alt. B 50 49 50 49 50 49
Alt. C 50 49 50 49 50 49
Alt. D 50 49 50 49 50 49
Alt. E 50 49 50 49 50 49
Alt. F 50 49 50 49 50 49
Alt. G – 382 MMBF arrearage volume – Riparian not included 48
Alt. H – 382 MMBF arrearage volume – Riparian not included 48

Financial Analysis - Appendix D Fiscal Year 2015 Through 2024 Planning Decade Annual Harvest Levels Page D-7
Cowlitz
Table D-11. Planning Decade Volume, Cowlitz Sustainable Harvest Unit (MMBF/decade)
Marbled
murrelet
strategy
alternative
Arrearage harvest Decadal rate
based on FY
2011-2018
performance
702 MMBF 462 MMBF No specific level
Riparian thinning
10% 1% 10% 1% 10% 1%
Alt. A 22 19 22 19 22 19 66
Alt. B 22 19 22 19 22 19
Alt. C 22 19 22 19 22 19
Alt. D 22 19 22 19 22 19
Alt. E 22 19 22 19 22 19
Alt. F 21 19 21 19 21 19
Alt. G – 382 MMBF arrearage volume – Riparian not included 19
Alt. H – 382 MMBF arrearage volume – Riparian not included 19
Table D-12. 10-decade Net Present Value, Cowlitz Sustainable Harvest Unit ($ millions)
Marbled
murrelet
strategy
alternative
Arrearage harvest
702 MMBF 462 MMBF No specific level
Riparian thinning
10% 1% 10% 1% 10% 1%
Alt. A 25 24 25 24 25 24
Alt. B 25 24 25 24 25 24
Alt. C 25 24 25 24 25 24
Alt. D 25 24 25 24 25 24
Alt. E 25 24 25 24 25 24
Alt. F 25 24 25 24 25 24
Alt. G – 382 MMBF arrearage volume – Riparian not included 24
Alt. H – 382 MMBF arrearage volume – Riparian not included 24

Washington State Department of Natural Resources Page D-8
Grays Harbor
Table D-13. Planning Decade Volume, Grays Harbor Sustainable Harvest Unit (MMBF/decade)
Marbled
murrelet
strategy
alternative
Arrearage harvest Decadal rate
based on FY
2011-2018
performance
702 MMBF 462 MMBF No specific level
Riparian thinning
10% 1% 10% 1% 10% 1%
Alt. A 3 3 3 3 3 3 3
Alt. B 4 4 4 4 4 4
Alt. C 4 4 4 4 4 4
Alt. D 4 4 4 4 4 4
Alt. E 4 4 4 4 4 4
Alt. F 3 3 3 3 3 3
Alt. G – 382 MMBF arrearage volume – Riparian not included 4
Alt. H – 382 MMBF arrearage volume – Riparian not included 4
Table D-14. 10-decade Net Present Value, Grays Harbor Sustainable Harvest Unit ($ millions)
Marbled
murrelet
strategy
alternative
Arrearage harvest
702 MMBF 462 MMBF No specific level
Riparian thinning
10% 1% 10% 1% 10% 1%
Alt. A 3 3 3 3 3 3
Alt. B 3 3 3 3 3 3
Alt. C 3 3 3 3 3 3
Alt. D 3 3 3 3 3 3
Alt. E 3 3 3 3 3 3
Alt. F 2 2 2 2 2 2
Alt. G – 382 MMBF arrearage volume – Riparian not included 3
Alt. H – 382 MMBF arrearage volume – Riparian not included 3

Financial Analysis - Appendix D Fiscal Year 2015 Through 2024 Planning Decade Annual Harvest Levels Page D-9
Jefferson
Table D-15. Planning Decade Volume, Jefferson Sustainable Harvest Unit (MMBF/decade)
Marbled
murrelet
strategy
alternative
Arrearage harvest Decadal rate
based on FY
2011-2018
performance
702 MMBF 462 MMBF No specific level
Riparian thinning
10% 1% 10% 1% 10% 1%
Alt. A 72 69 73 69 73 69 62
Alt. B 77 73 77 73 77 73
Alt. C 77 73 77 73 77 73
Alt. D 77 73 77 73 77 73
Alt. E 77 73 77 73 77 73
Alt. F 76 73 76 73 76 73
Alt. G – 382 MMBF arrearage volume – Riparian not included 73
Alt. H – 382 MMBF arrearage volume – Riparian not included 73
Table D-16. 10-decade Net Present Value, Jefferson Sustainable Harvest Unit ($ millions)
Marbled
murrelet
strategy
alternative
Arrearage harvest
702 MMBF 462 MMBF No specific level
Riparian thinning
10% 1% 10% 1% 10% 1%
Alt. A 46 45 46 45 46 45
Alt. B 48 47 48 47 48 47
Alt. C 48 47 48 47 48 47
Alt. D 48 47 48 47 48 47
Alt. E 48 47 48 47 48 47
Alt. F 48 47 48 47 48 47
Alt. G – 382 MMBF arrearage volume – Riparian not included 47
Alt. H – 382 MMBF arrearage volume – Riparian not included 47

Washington State Department of Natural Resources Page D-10
King
Table D-17. Planning Decade Volume, King Sustainable Harvest Unit (MMBF/decade)
Marbled
murrelet
strategy
alternative
Arrearage harvest Decadal rate
based on FY
2011-2018
performance
702 MMBF 462 MMBF No specific level
Riparian thinning
10% 1% 10% 1% 10% 1%
Alt. A 78 80 75 76 69 71 56
Alt. B 79 80 75 77 70 71
Alt. C 78 79 74 76 68 70
Alt. D 79 80 75 77 70 71
Alt. E 78 79 74 76 68 70
Alt. F 61 65 59 62 55 56
Alt. G – 382 MMBF arrearage volume – Riparian not included 79
Alt. H – 382 MMBF arrearage volume – Riparian not included 80
Table D-18. 10-decade Net Present Value, King Sustainable Harvest Unit ($ millions)
Marbled
murrelet
strategy
alternative
Arrearage harvest
702 MMBF 462 MMBF No specific level
Riparian thinning
10% 1% 10% 1% 10% 1%
Alt. A 54 53 54 53 53 53
Alt. B 54 54 54 54 54 53
Alt. C 53 53 53 53 53 53
Alt. D 54 54 54 54 54 53
Alt. E 53 53 53 53 53 53
Alt. F 43 43 43 43 43 43
Alt. G – 382 MMBF arrearage volume – Riparian not included 53
Alt. H – 382 MMBF arrearage volume – Riparian not included 53

Financial Analysis - Appendix D Fiscal Year 2015 Through 2024 Planning Decade Annual Harvest Levels Page D-11
Kitsap
Table D-19. Planning Decade Volume, Kitsap Sustainable Harvest Unit (MMBF/decade)
Marbled
murrelet
strategy
alternative
Arrearage harvest Decadal rate
based on FY
2011-2018
performance
702 MMBF 462 MMBF No specific level
Riparian thinning
10% 1% 10% 1% 10% 1%
Alt. A 11 11 11 11 11 11 19
Alt. B 11 11 11 11 11 11
Alt. C 11 11 11 11 11 11
Alt. D 11 11 11 11 11 11
Alt. E 11 11 11 11 11 11
Alt. F 11 11 11 11 11 11
Alt. G – 382 MMBF arrearage volume – Riparian not included 11
Alt. H – 382 MMBF arrearage volume – Riparian not included 11
Table D-20. 10-decade Net Present Value, Kitsap Sustainable Harvest Unit ($ millions)
Marbled
murrelet
strategy
alternative
Arrearage harvest
702 MMBF 462 MMBF No specific level
Riparian thinning
10% 1% 10% 1% 10% 1%
Alt. A 14 14 14 14 14 14
Alt. B 15 14 15 14 15 14
Alt. C 15 14 15 14 15 14
Alt. D 15 14 15 14 15 14
Alt. E 15 14 15 14 15 14
Alt. F 15 14 15 14 15 14
Alt. G – 382 MMBF arrearage volume – Riparian not included 14
Alt. H – 382 MMBF arrearage volume – Riparian not included 14

Washington State Department of Natural Resources Page D-12
Lewis
Table D-21. Planning Decade Volume, Lewis Sustainable Harvest Unit (MMBF/decade)
Marbled
murrelet
strategy
alternative
Arrearage harvest Decadal rate
based on FY
2011-2018
performance
702 MMBF 462 MMBF No specific level
Riparian thinning
10% 1% 10% 1% 10% 1%
Alt. A 181 173 181 173 181 173 218
Alt. B 182 174 182 174 182 174
Alt. C 181 173 181 173 181 173
Alt. D 182 174 182 174 182 174
Alt. E 181 173 181 173 181 173
Alt. F 147 144 147 144 147 144
Alt. G – 382 MMBF arrearage volume – Riparian not included 172
Alt. H – 382 MMBF arrearage volume – Riparian not included 172
Table D-22. 10-decade Net Present Value, Lewis Sustainable Harvest Unit ($ millions)
Marbled
murrelet
strategy
alternative
Arrearage harvest
702 MMBF 462 MMBF No specific level
Riparian thinning
10% 1% 10% 1% 10% 1%
Alt. A 143 138 143 138 143 138
Alt. B 144 139 144 139 144 139
Alt. C 143 138 143 138 143 138
Alt. D 144 139 144 139 144 139
Alt. E 143 138 143 138 143 138
Alt. F 120 115 120 115 120 115
Alt. G – 382 MMBF arrearage volume – Riparian not included 137
Alt. H – 382 MMBF arrearage volume – Riparian not included 138

Financial Analysis - Appendix D Fiscal Year 2015 Through 2024 Planning Decade Annual Harvest Levels Page D-13
Mason
Table D-23. Planning Decade Volume, Mason Sustainable Harvest Unit (MMBF/decade)
Marbled
murrelet
strategy
alternative
Arrearage harvest Decadal rate
based on FY
2011-2018
performance
702 MMBF 462 MMBF No specific level
Riparian thinning
10% 1% 10% 1% 10% 1%
Alt. A 86 87 86 87 86 87 99
Alt. B 87 87 87 87 87 87
Alt. C 86 87 86 87 86 87
Alt. D 87 87 87 87 87 87
Alt. E 86 87 86 87 86 87
Alt. F 86 87 86 87 86 87
Alt. G – 382 MMBF arrearage volume – Riparian not included 87
Alt. H – 382 MMBF arrearage volume – Riparian not included 87
Table D-24. 10-decade Net Present Value, Mason Sustainable Harvest Unit ($ millions)
Marbled
murrelet
strategy
alternative
Arrearage harvest
702 MMBF 462 MMBF No specific level
Riparian thinning
10% 1% 10% 1% 10% 1%
Alt. A 71 70 71 70 71 70
Alt. B 72 71 72 71 72 71
Alt. C 71 71 71 71 71 71
Alt. D 71 71 71 71 71 71
Alt. E 71 71 71 71 71 71
Alt. F 71 71 71 71 71 71
Alt. G – 382 MMBF arrearage volume – Riparian not included 71
Alt. H – 382 MMBF arrearage volume – Riparian not included 71
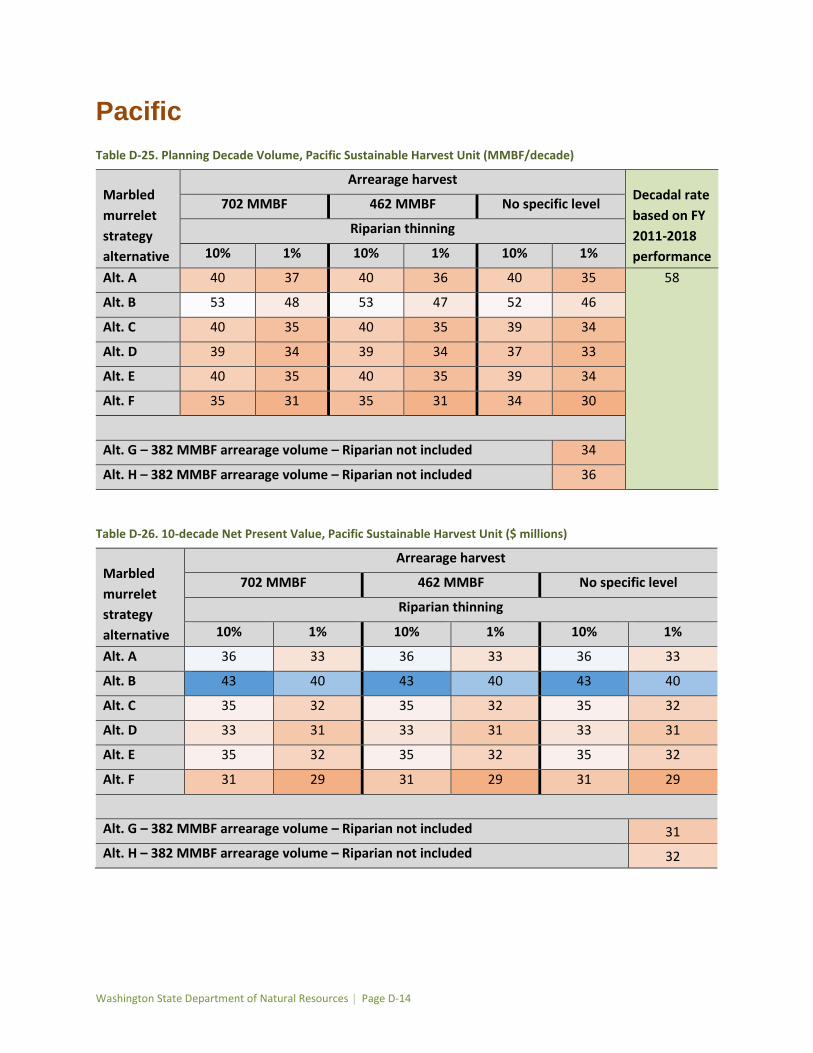
Washington State Department of Natural Resources Page D-14
Pacific
Table D-25. Planning Decade Volume, Pacific Sustainable Harvest Unit (MMBF/decade)
Marbled
murrelet
strategy
alternative
Arrearage harvest Decadal rate
based on FY
2011-2018
performance
702 MMBF 462 MMBF No specific level
Riparian thinning
10% 1% 10% 1% 10% 1%
Alt. A 40 37 40 36 40 35 58
Alt. B 53 48 53 47 52 46
Alt. C 40 35 40 35 39 34
Alt. D 39 34 39 34 37 33
Alt. E 40 35 40 35 39 34
Alt. F 35 31 35 31 34 30
Alt. G – 382 MMBF arrearage volume – Riparian not included 34
Alt. H – 382 MMBF arrearage volume – Riparian not included 36
Table D-26. 10-decade Net Present Value, Pacific Sustainable Harvest Unit ($ millions)
Marbled
murrelet
strategy
alternative
Arrearage harvest
702 MMBF 462 MMBF No specific level
Riparian thinning
10% 1% 10% 1% 10% 1%
Alt. A 36 33 36 33 36 33
Alt. B 43 40 43 40 43 40
Alt. C 35 32 35 32 35 32
Alt. D 33 31 33 31 33 31
Alt. E 35 32 35 32 35 32
Alt. F 31 29 31 29 31 29
Alt. G – 382 MMBF arrearage volume – Riparian not included 31
Alt. H – 382 MMBF arrearage volume – Riparian not included 32

Financial Analysis - Appendix D Fiscal Year 2015 Through 2024 Planning Decade Annual Harvest Levels Page D-15
Pierce
Table D-27. Planning Decade Volume, Pierce Sustainable Harvest Unit (MMBF/decade)
Marbled
murrelet
strategy
alternative
Arrearage harvest Decadal rate
based on FY
2011-2018
performance
702 MMBF 462 MMBF No specific level
Riparian thinning
10% 1% 10% 1% 10% 1%
Alt. A 44 44 44 44 44 44 15
Alt. B 44 44 44 44 44 44
Alt. C 44 43 44 43 44 43
Alt. D 44 44 44 44 44 44
Alt. E 44 43 44 43 44 43
Alt. F 18 18 18 18 18 18
Alt. G – 382 MMBF arrearage volume – Riparian not included 43
Alt. H – 382 MMBF arrearage volume – Riparian not included 43
Table D-28. 10-decade Net Present Value, Pierce Sustainable Harvest Unit ($ millions)
Marbled
murrelet
strategy
alternative
Arrearage harvest
702 MMBF 462 MMBF No specific level
Riparian thinning
10% 1% 10% 1% 10% 1%
Alt. A 35 35 35 35 35 35
Alt. B 35 35 35 35 35 35
Alt. C 35 35 35 35 35 35
Alt. D 35 35 35 35 35 35
Alt. E 35 35 35 35 35 35
Alt. F 15 15 15 15 15 15
Alt. G – 382 MMBF arrearage volume – Riparian not included 35
Alt. H – 382 MMBF arrearage volume – Riparian not included 35

Washington State Department of Natural Resources Page D-16
Skagit
Table D-29. Planning Decade Volume, Skagit Sustainable Harvest Unit (MMBF/decade)
Marbled
murrelet
strategy
alternative
Arrearage harvest Decadal rate
based on FY
2011-2018
performance
702 MMBF 462 MMBF No specific level
Riparian thinning
10% 1% 10% 1% 10% 1%
Alt. A 320 311 320 311 320 311 328
Alt. B 322 312 322 312 322 312
Alt. C 315 305 315 305 315 305
Alt. D 319 309 319 309 319 309
Alt. E 315 305 315 305 315 305
Alt. F 251 254 251 253 250 254
Alt. G – 382 MMBF arrearage volume – Riparian not included 301
Alt. H – 382 MMBF arrearage volume – Riparian not included 308
Table D-30. 10-decade Net Present Value, Skagit Sustainable Harvest Unit ($ millions)
Marbled
murrelet
strategy
alternative
Arrearage harvest
702 MMBF 462 MMBF No specific level
Riparian thinning
10% 1% 10% 1% 10% 1%
Alt. A 272 267 272 267 272 267
Alt. B 273 268 273 268 273 268
Alt. C 268 263 268 263 268 263
Alt. D 271 265 271 265 271 265
Alt. E 268 263 268 263 268 263
Alt. F 227 222 227 222 227 222
Alt. G – 382 MMBF arrearage volume – Riparian not included 259
Alt. H – 382 MMBF arrearage volume – Riparian not included 265

Financial Analysis - Appendix D Fiscal Year 2015 Through 2024 Planning Decade Annual Harvest Levels Page D-17
Skamania
Table D-31. Planning Decade Volume, Skamania Sustainable Harvest Unit (MMBF/decade)
Marbled
murrelet
strategy
alternative
Arrearage harvest Decadal rate
based on FY
2011-2018
performance
702 MMBF 462 MMBF No specific level
Riparian thinning
10% 1% 10% 1% 10% 1%
Alt. A 116 107 116 107 107 103 54
Alt. B 120 107 118 107 107 103
Alt. C 120 107 118 107 107 103
Alt. D 120 107 118 107 107 103
Alt. E 120 107 117 107 107 103
Alt. F 113 107 107 107 103 103
Alt. G – 382 MMBF arrearage volume – Riparian not included 100
Alt. H – 382 MMBF arrearage volume – Riparian not included 101
Table D-32. 10-decade Net Present Value, Skamania Sustainable Harvest Unit ($ millions)
Marbled
murrelet
strategy
alternative
Arrearage harvest
702 MMBF 462 MMBF No specific level
Riparian thinning
10% 1% 10% 1% 10% 1%
Alt. A 70 69 70 69 70 69
Alt. B 70 69 70 69 70 69
Alt. C 70 69 70 69 70 69
Alt. D 70 69 70 69 70 69
Alt. E 70 69 70 69 70 69
Alt. F 70 69 70 69 70 69
Alt. G – 382 MMBF arrearage volume – Riparian not included 65
Alt. H – 382 MMBF arrearage volume – Riparian not included 65

Washington State Department of Natural Resources Page D-18
Snohomish
Table D-33. Planning Decade Volume, Snohomish Sustainable Harvest Unit (MMBF/decade)
Marbled
murrelet
strategy
alternative
Arrearage harvest Decadal rate
based on FY
2011-2018
performance
702 MMBF 462 MMBF No specific level
Riparian thinning
10% 1% 10% 1% 10% 1%
Alt. A 221 226 222 226 223 226 325
Alt. B 224 226 225 226 228 225
Alt. C 216 217 217 217 218 217
Alt. D 218 219 219 219 221 218
Alt. E 216 218 217 217 218 217
Alt. F 182 193 182 193 183 193
Alt. G – 382 MMBF arrearage volume – Riparian not included 210
Alt. H – 382 MMBF arrearage volume – Riparian not included 223
Table D-34. 10-decade Net Present Value, Snohomish Sustainable Harvest Unit ($ millions)
Marbled
murrelet
strategy
alternative
Arrearage harvest
702 MMBF 462 MMBF No specific level
Riparian thinning
10% 1% 10% 1% 10% 1%
Alt. A 200 196 200 196 200 196
Alt. B 200 196 200 196 200 196
Alt. C 194 190 194 190 194 190
Alt. D 194 190 194 190 194 190
Alt. E 194 190 194 190 194 190
Alt. F 178 175 178 175 178 175
Alt. G – 382 MMBF arrearage volume – Riparian not included 183
Alt. H – 382 MMBF arrearage volume – Riparian not included 193

Financial Analysis - Appendix D Fiscal Year 2015 Through 2024 Planning Decade Annual Harvest Levels Page D-19
Thurston
Table D-35. Planning Decade Volume, Thurston Sustainable Harvest Unit (MMBF/decade)
Marbled
murrelet
strategy
alternative
Arrearage harvest Decadal rate
based on FY
2011-2018
performance
702 MMBF 462 MMBF No specific level
Riparian thinning
10% 1% 10% 1% 10% 1%
Alt. A 22 22 22 22 22 22 53
Alt. B 22 22 22 22 23 22
Alt. C 22 22 22 22 23 22
Alt. D 22 22 22 22 23 22
Alt. E 22 22 22 22 23 22
Alt. F 22 22 21 22 21 22
Alt. G – 382 MMBF arrearage volume – Riparian not included 22
Alt. H – 382 MMBF arrearage volume – Riparian not included 22
Table D-36. 10-decade Net Present Value, Thurston Sustainable Harvest Unit ($ millions)
Marbled
murrelet
strategy
alternative
Arrearage harvest
702 MMBF 462 MMBF No specific level
Riparian thinning
10% 1% 10% 1% 10% 1%
Alt. A 20 19 20 19 20 19
Alt. B 20 20 20 20 20 20
Alt. C 20 20 20 20 20 20
Alt. D 20 20 20 20 20 20
Alt. E 20 20 20 20 20 20
Alt. F 20 19 20 19 20 19
Alt. G – 382 MMBF arrearage volume – Riparian not included 20
Alt. H – 382 MMBF arrearage volume – Riparian not included 20

Washington State Department of Natural Resources Page D-20
Wahkiakum
Table D-37. Planning Decade Volume, Wahkiakum Sustainable Harvest Unit (MMBF/decade)
Marbled
murrelet
strategy
alternative
Arrearage harvest Decadal rate
based on FY
2011-2018
performance
702 MMBF 462 MMBF No specific level
Riparian thinning
10% 1% 10% 1% 10% 1%
Alt. A 42 41 39 39 36 36 50
Alt. B 73 70 69 66 62 59
Alt. C 40 39 40 39 35 33
Alt. D 42 41 39 38 34 32
Alt. E 40 39 40 39 35 33
Alt. F 30 29 30 28 24 23
Alt. G – 382 MMBF arrearage volume – Riparian not included 31
Alt. H – 382 MMBF arrearage volume – Riparian not included 59
Table D-38. 10-decade Net Present Value, Wahkiakum Sustainable Harvest Unit ($ millions)
Marbled
murrelet
strategy
alternative
Arrearage harvest
702 MMBF 462 MMBF No specific level
Riparian thinning
10% 1% 10% 1% 10% 1%
Alt. A 31 30 31 30 31 30
Alt. B 45 44 45 44 45 43
Alt. C 27 26 27 26 27 26
Alt. D 26 26 26 26 26 25
Alt. E 27 26 27 26 27 26
Alt. F 21 20 21 20 21 20
Alt. G – 382 MMBF arrearage volume – Riparian not included 22
Alt. H – 382 MMBF arrearage volume – Riparian not included 36

Financial Analysis - Appendix D Fiscal Year 2015 Through 2024 Planning Decade Annual Harvest Levels Page D-21
Whatcom
Table D-39. Planning Decade Volume, Whatcom Sustainable Harvest Unit (MMBF/decade)
Marbled
murrelet
strategy
alternative
Arrearage harvest Decadal rate
based on FY
2011-2018
performance
702 MMBF 462 MMBF No specific level
Riparian thinning
10% 1% 10% 1% 10% 1%
Alt. A 83 85 80 81 75 75 116
Alt. B 84 85 82 83 76 77
Alt. C 73 76 71 74 67 67
Alt. D 79 82 78 78 71 72
Alt. E 72 75 70 73 66 66
Alt. F 59 61 57 59 52 52
Alt. G – 382 MMBF arrearage volume – Riparian not included 65
Alt. H – 382 MMBF arrearage volume – Riparian not included 75
Table D-40. 10-decade Net Present Value, Whatcom Sustainable Harvest Unit ($ millions)
Marbled
murrelet
strategy
alternative
Arrearage harvest
702 MMBF 462 MMBF No specific level
Riparian thinning
10% 1% 10% 1% 10% 1%
Alt. A 73 72 73 72 73 72
Alt. B 74 73 74 73 74 73
Alt. C 68 67 67 67 67 67
Alt. D 70 70 70 70 70 69
Alt. E 67 66 67 66 67 66
Alt. F 52 52 52 52 52 52
Alt. G – 382 MMBF arrearage volume – Riparian not included 64
Alt. H – 382 MMBF arrearage volume – Riparian not included 71