ML072010411 - NRC
206
NUREG- 1807 Probabilistic Fracture Mechanics - Models, Parameters, and Uncertainty Treatment Used in FAVOR Version 04.1 U.S. Nuclear Regulatory Commission Office of Nuclear Regulatory Research Washington, DC 20555-0001
Transcript of ML072010411 - NRC

NUREG- 1807
Probabilistic FractureMechanics - Models,Parameters, and UncertaintyTreatment Used in FAVORVersion 04.1
U.S. Nuclear Regulatory CommissionOffice of Nuclear Regulatory ResearchWashington, DC 20555-0001
AVAILABILITY OF REFERENCE MATERIALSIN NRC PUBLICATIONS
T
NRC Reference Material
As of November 1999, you may electronically accessNUREG-series publications and other NRC records atNRC's Public Electronic Reading Room athttp://www.nrc.govlreading-rm.html.Publicly released records include, to name a few,NUREG-series publications; Federal Register notices;applicant, licensee, and vendor documents andcorrespondence; NRC correspondence and internalmemoranda; bulletins and information notices;inspection and investigative reports; licensee eventreports; and Commission papers and their attachments.
NRC publications in the NUREG series, NRCregulations, and Title 10, Energy, in the Code ofFederal Regulations may also be purchased from oneof these two sources.1. The Superintendent of Documents
U.S. Government Printing OfficeMail Stop SSOPWashington, DC 20402-0001Internet: bookstore.gpo.govTelephone: 202-512-1800Fax: 202-512-2250
2. The National Technical Information ServiceSpringfield, VA 22161-0002www.ntis.gov1-800-553-6847 or, locally, 703-605-6000
A single copy of each NRC draft report for comment isavailable free, to the extent of supply, upon writtenrequest as follows:Address: U.S. Nuclear Regulatory Commission
Office of AdministrationMail, Distribution and Messenger TeamWashington, DC 20555-0001
E-mail: DISTRIBUTIONd.nrc.govFacsimile: 301-415-2289
Some publications in the NUREG series that areposted at NRC's Web site addresshtto:llwww.nrc.aov/readina-rm/doc-collectionslnureas
Non-NRC Reference Material
Documents available from public and special technicallibraries include all open literature items, such asbooks, journal articles, and transactions, FederalRegister notices, Federal and State legislation, andcongressional reports. Such documents as theses,dissertations, foreign reports and translations, andnon-NRC conference proceedings may be purchasedfrom their sponsoring organization.
Copies of industry codes and standards used in asubstantive manner in the NRC regulatory process aremaintained at-
The NRC Technical LibraryTwo White Flint North11545 Rockville PikeRockville, MD 20852-2738
These standards are available in the library forreference use by the public. Codes and standards areusually copyrighted and may be purchased from theoriginating organization or, if they are AmericanNational Standards, from-
American National Standards Institute11 West 4 2nd StreetNew York, NY 10036-8002www.ansi.org212-642-4900
are updated periodically and may differ from the lastprinted version. Although references to material foundon a Web site bear the date the material was accessed,the material available on the date cited maysubsequently be removed from the site.
Legally binding regulatory requirements are statedonly in laws; NRC regulations; licenses, includingtechnical specifications; or orders, not inNUREG-series publications. The views expressedin contractor-prepared publications in this series arenot necessarily those of the NRC.
The NUREG series comprises (1) technical andadministrative reports and books prepared by thestaff (NUREG-XXXX) or agency contractors(NUREG/CR-XXXX), (2) proceedings ofconferences (NUREG/CP-XXXX), (3) reportsresulting from international agreements(NUREG/IA-XXXX), (4) brochures(NUREG/BR-XXXX), and (5) compilations of legaldecisions and orders of the Commission and Atomicand Safety Licensing Boards and of Directors'decisions under Section 2.206 of NRC's regulations(NUREG-0750).

NUREG-1807
Probabilistic FractureMechanics - Models,Parameters, and UncertaintyTreatment Used in FAVORVersion 04.1
Manuscript Completed: May 2006Date Published: June 2007
Prepared byM. EricksonKirk, B.R. Bass, T. Dickson,C. Pugh, T. Santos, P. Williams
Division of Fuel, Engineering and Radiological ResearchOffice of Nuclear Regulatory ResearchU.S. Nuclear Regulatory CommissionWashington, DC 20555-0001


ABSTRACT
During plant operation, the walls of reactor pressure vessels (RPVs) are exposed to neutron.radiation, resulting in localized embrittlement of the vessel steel and weld materials in the corearea. If an embrittled RPV had an existing flaw of critical size and certain severe systemtransientswere to occur, the flaw could very rapidly propagate through the vessel, resulting in athrough-wall crack and challenging the integrity of the RPV. The severe transients of concern,known as pressurized thermal shock (PTS), are characterized by a rapid cooling (i.e., thermalshock) of the internal RPV surface in combination with repressurization of the RPV.Advancements in our understanding and knowledge of materials behavior, our ability torealistically model plant systems and operational characteristics, and our ability to betterevaluate PTS transients to estimate loads on vessel walls led the U.S. Nuclear RegulatoryCommission (NRC) to realize that the earlier analysis, conducted in the course of developingthe PTS Rule in the 1980s, contained significant conservatisms.
This report, which describes the technical basis for the probabilistic fracture mechanics model, is one of aseries of 21 other documents detailing the results of the NRC study
iii

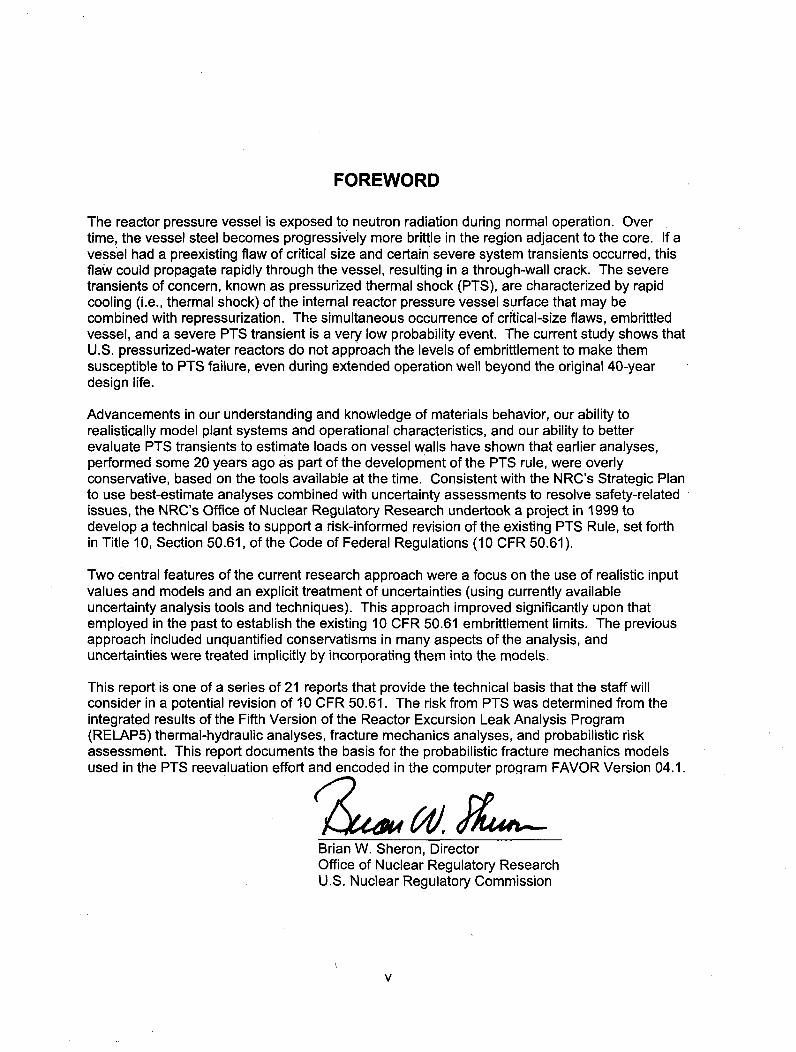
FOREWORD
The reactor pressure vessel is exposed to neutron radiation during normal operation. Overtime, the vessel steel becomes progressively more brittle in the region adjacent to the core. If avessel had a preexisting flaw of critical size and certain severe system transients occurred, thisflaw could propagate rapidly through the vessel, resulting in a through-wall crack. The severetransients of concern, known as pressurized thermal shock (PTS), are characterized by rapidcooling (i.e., thermal shock) of the internal reactor pressure vessel surface that may becombined with repressurization. The simultaneous occurrence of critical-size flaws, embrittledvessel, and a severe PTS transient is a very low probability event. The current study shows thatU.S. pressurized-water reactors do not approach the levels of embrittlement to make themsusceptible to PTS failure, even during extended operation well beyond the original 40-yeardesign life.
Advancements in our understanding and knowledge of materials behavior, our ability torealistically model plant systems and operational characteristics, and our ability to betterevaluate PTS transients to estimate loads on vessel walls have shown that earlier analyses,performed some 20 years ago as part of the development of the PTS rule, were overlyconservative, based on the tools available at the time. Consistent with the NRC's Strategic Planto use best-estimate analyses combined with uncertainty assessments to resolve safety-relatedissues, the NRC's Office of Nuclear Regulatory Research undertook a project in 1999 todevelop a technical basis to support a risk-informed revision of the existing PTS Rule, set forthin Title 10, Section 50.61, of the Code of Federal Regulations (10 CFR 50.61).
Two central features of the current research approach were a focus on the use of realistic inputvalues and models and an explicit treatment of uncertainties (using currently availableuncertainty analysis tools and techniques). This approach improved significantly upon thatemployed in the past to establish the existing 10 CFR 50.61 embrittlement limits. The previousapproach included unquantified conservatisms in many aspects of the analysis, anduncertainties were treated implicitly by incorporating them into the models.
This report is one of a series of 21 reports that provide the technical basis that the staff willconsider in a potential revision of 10 CFR 50.61. The risk from PTS was determined from theintegrated results of the Fifth Version of the Reactor Excursion Leak Analysis Program(RELAP5) thermal-hydraulic analyses, fracture mechanics analyses, and probabilistic riskassessment. This report documents the basis for the probabilistic fracture mechanics modelsused in the PTS reevaluation effort and encoded in the computer program FAVOR Version 04.1.
Brian W. Sheron, DirectorOffice of Nuclear Regulatory ResearchU.S. Nuclear Regulatory Commission
v


CONTENTS
ABSTRACT ............................................................................................................................... iiiFO REW O RD .............................................................................................................................. vCO NTENTS ............................................................................................................................. viiFIG URES .................................................................................................................................. ixTABLES .................................................................................................................................... xiiiEXECUTIVE SUM MARY ......................................................................................................... xiv1 INTRO DUCTIO N ................................................................................................ 1-11.1 Description of Pressurized Therm al Shock........................................................ 1-11.2 PTS Limits on the Licensable Life of a Commercial Pressurized-Water Reactor 1-11.3 Technical Factors Suggesting Conservatism of the Current Rule ....................... 1-21.4 PTS Reevaluation Project .................................................................................. 1-4
1.4.1 Restrictions on the Model ...................................................................................... 1-41.4.2 Overall Structure of the Model .............................................................................. 1-41.4.3 Uncertainty Treatm ent .......................................................................................... 1-81.4.4 Project Docum entation .......................................................................................... 1-9
2 OBJECTIVE, SCOPE, AND STRUCTURE OF THIS REPORT ........................... 2-13 FUNDAM ENTAL ASSUM PTIO NS ...................................................................... 3-13.1 Use of Linear Elastic Fracture M echanics .......................................................... 3-13.2 Assum ption of No Subcritical Crack G rowth ....................................................... 3-2
3.2.1 Caused by Environmental Mechanisms Acting on the Low Alloy Pressure VesselSteel .................................................................................................................. 3-2
3.2.2 Caused by Environmental Mechanisms Acting on the Austenitic Stainless SteelCladding ............................................................................................................ 3-3
3.2.3 Caused by Fatigue ................................................................................................ 3-33.3 Assumption that the Stainless Steel Cladding will not Fail as a Result of the LoadsApplied by PTS ....................................................................................................................... 3-43.4 Noncontribution of Flaws Deep in the Vessel Wall to Vessel Failure Probability 3-43.5 Noncontribution of Certain Transients to Vessel Failure Probability ................... 3-44 CRACK INITIATIO N M O DEL .............................................................................. 4-14.1 Applied Driving Force to Fracture ....................................................................... 4-1
4.1.1 LEFM Driving Force .............................................................................................. 4-14.1.2 W arm Prestress .................................................................................................... 4-5
4.2 Resistance to Crack Initiation in Cleavage ......................................................... 4-74.2.1 Index Temperature Approaches to Characterizing the Transition Fracture
Toughness of Ferritic Steels .............................................................................. 4-74.2.2 Unirradiated Index Temperature and Transition Temperature Models ................. 4-144.2.3 Index Tem perature Shift M odel ............................................................................ 4-374.2.4 Interface Model .................................................................................................... 4-51
5 THRO UG H-W ALL CRA CKING M O DEL .............................................................. 5-15.1 Crack Arrest Toughness M odel .......................................................................... 5-2
5.1.1 The Physics of Crack Arrest in Ferritic Steels ....................................................... 5-25.1.2 Proposed Model .................................................................................................... 5-5
5.2 Upper-Shelf Fracture Toughness M odel ............................................................ 5-105.2.1 Need for an Upper-Shelf M odel ........................................................................... 5-105.2.2 Characterization of Upper-Shelf Fracture Toughness Properties ......................... 5-11
vii

5.2.3 Strategies for Estimating Upper-Shelf Fracture Toughness Properties ................. 5-125.2.4 New Upper-Shelf Model Proposed by EricksonKirk .............................................. 5-135.2.5 Incorporation of the New Upper-Shelf Model into FAVOR .................................... 5-225.2.6 Summary of Model and Uncertainty Treatment ..................................................... 5-26
5.3 Material Property Gradient Model ................................... 5-265.3.1 Relationship between Crack Initiation and Crack Arrest Model ............................ 5-265.3.2 Through-Wall Composition Gradients for Welds ................................................... 5-31
6 R E FE R E N C E S ..................................................................................................... 6-1APPENDIX A LEFM VALIDITY ............................................................................................ A-1APPENDIX B WARM PRESTRESS VALIDITY ............................... B-1APPENDIX C PLANT-SPECIFIC MATERIAL VARIABLES USED IN FAVOR CALCULATIONS..................... ............................................................................................................................ C -1
APPENDIX D CHEMICAL COMPOSITION UNCERTAINTY DISTRIBUTIONS ................... D-1APPENDIX E DATA SOURCES FOR UPPER-SHELF TOUGHNESS CHARACTERIZATION(FRO M ERICKSO NKIRK 04b) ............................................................................................... E-1
viii

FIGURES
Figure 1-1 Proximity of currently operating PWRs to the 10 CFR 50.61 screening limit for PTS................................................................................................................................ 1 -3
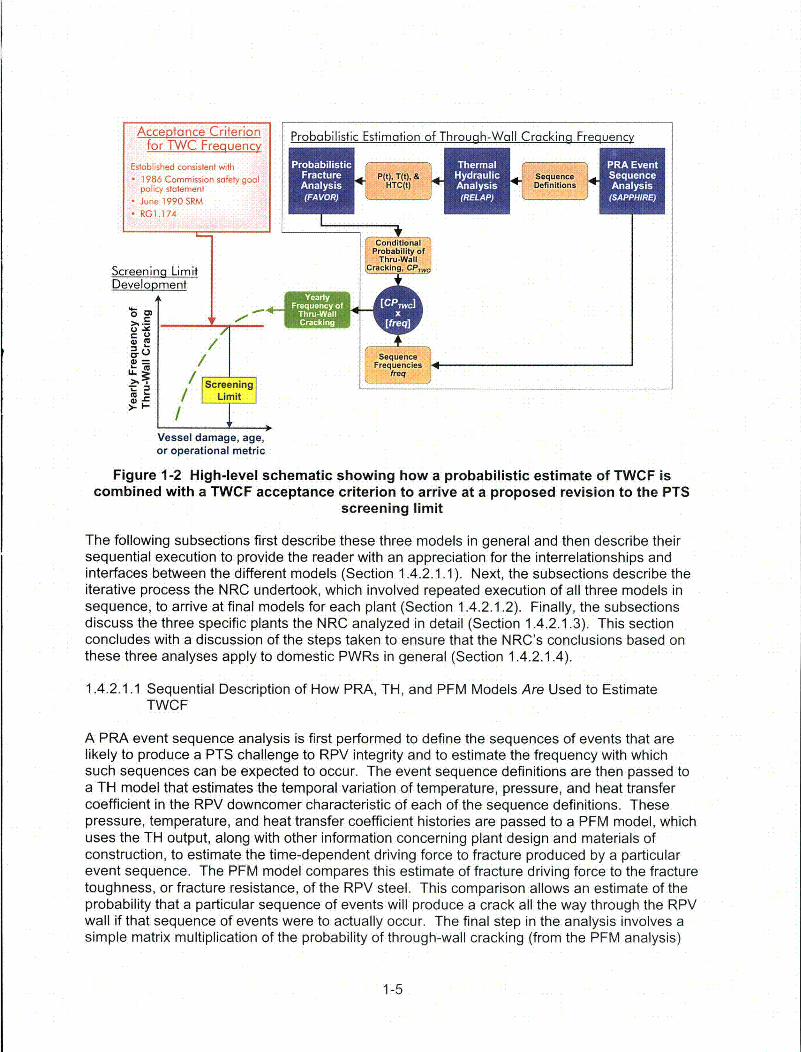
Figure 1-2 High-level schematic showing how a probabilistic estimate of TWCF is combinedwith a TWCF acceptance criterion to arrive at a proposed revision to the PTSscre e n ing lim it ......................................................................................................... 1-5
Figure 1-3 The three plants analyzed in detail in the PTS reevaluation effort .......................... 1-7Figure 1-4 Structure of reports documenting the PTS reevaluation effort ................................ 1-9Figure 2-1 Schematic illustration of overall model used in the PTS reevaluation project ......... 2-2Figure 3-1 Illustration of the magnitude of KAPPLIED values that contribute to the TWCF because
they have a CPI > 0. Top figure shows all KAPPLIED values with CPI > 0 overlaid onthe K1, transition curve from an analysis of Beaver Valley Unit 1 at 60 EFPYs.Bottom figure shows these same results expressed in the form of a cumulativedistribution function ................................................................................................. 3-3
Figure 3-2 Distribution of crack initiating depths generated ,by FAVOR Version 3.1 ................. 3-5Figure 4-1 Schematic illustration of the crack initiation model used in the PTS reevaluation
project .............................................. ....... 4-3Figure 4-2 Schematic illustration of the model of the applied driving force to fracture used in the
PTS reevaluation project ........................................................................................ 4-4Figure 4-3 Test vessels used in the ITV and PTSE test series (top) and in the TSE test series
(b o tto m ) ......................................................................................................... ........ 4 -5Figure 4-4 Illustration of the influence of crack depth on the variation of KAppLIED vs. time
resulting from an LBLOCA (Cheverton 85) ............................................................. 4-6Figure 4-5 Schematic diagram illustrating how the WPS effect could be active during a LOCA
depending on the combination of the transient and the position of the crack withinthe vesse l w a ll ............................................................................................... ....... 4 -7
Figure 4-6 Schematic illustration of the model of the crack initiation toughness used in the PTSreevaluation project ............................................................................................... 4-9
Figure 4-7 Illustration of the combined effects of mechanical stress and thermal energy on theability of atoms to jump between equilibrium lattice sites ..................................... 4-10
Figure 4-8 Illustration of the effect of product form on transition fracture toughness temperatured e pe nd e ncy ......................................................................................................... 4 -11
Figure 4-9 Illustration of the effect of radiation damage level on transition fracture toughnesstem perature dependency ...................................................................................... 4-11
Figure 4-10 Crack arrest transition curves for nine heats of RPV steel. The mean curve has thesame temperature dependence as the Master Curve for crack initiation data (i.e.,Kia =30+70.exp{0.019[T-TJa]} (Wallin 97)) ................................................................ 4-12
Figure 4-11 Comparison of Weibull shape parameters calculated from fracture toughness datawith 5/95 percent confidence bounds on the expected shape parameter of 4predicted by Wallin ..... .............................. ...... 4-13
Figure 4-12 Comparison of scatter in crack initiation data (left) and in crack arrest data (right).Note that these figures are to the same scale, and that the median/mean curveshave the same temperature dependence (i.e., 30 + 70. exp{o.019[T - TNom]}) .......... 4-14
Figure 4-13 Charpy V-notch impact test specimen ................................................................. 4-15Figure 4-14 Charpy V-notch energy transition curve ................................ 4-16Figure 4-15 Nil-ductility temperature test specimen ................................................................ 4-16
ix

Figure 4-16 Definition of the NDT temperature ....................................................................... 4-18Figure 4-17 Generalized failure analysis diagram as presented by Pellini and Puzak (Pellini 63)
.............................................................................................................................. 4 -1 8Figure 4-18 Construction of the CAT curve ............................................................................ 4-19Figure 4-19 KI, and K1a toughness values used to establish the ASME K1, and Kla curves ..... 4-21Figure 4-20 Diagram illustrating the different methods used currently to estimate a value of
RTNDT for an unirradiated RPV steel ..................................................................... 4-23Figure 4-21 The uniform variation of cleavage fracture toughness with temperature noted by
Wallin for (top) unirradiated RPV steels, (middle) irradiated RPV steels, and(bottom ) other ferritic steels .................................................................................. 4-26
Figure 4-22 Comparison of how RTNDT positions a transition toughness model (the KI, curve)relative to as-measured fracture toughness data (top) vs. how RTTo (defined from T,based on ASME Code Case N-629) positions the same transition toughness modelrelative to as-measured fracture toughness data (bottom) ................................... 4-27
Figure 4-23 Illustration of how the error in an RTNDT-based model of fracture toughnesstransition is determ ined ......................................................................................... 4-29
Figure 4-24 Cumulative distribution function showing the difference between T. and RTNDT.4-29Figure 4-25 Extended K1, fracture toughness database (ORNL/NRC/LTR-99/27) (Bowman 00)
of ASTM E399 valid data compared with adjusted ASME K1, curve (Nanstad 93)............................................................................................................................. -3 3
Figure 4-26 Illustration of the lower bounding methodology used to generate the uncertaintyterm (AR TLB) for R TND T(u) ....................................................................................... 4-33
Figure 4-27 (a) Illustration of ARTLB that quantifies both the epistemic uncertainty in RTNDT(U)
and the intentional bias in RTNDT(u) values. (b and c) Comparison of ARTLBadjustment with Master Curve-based (RTNDT-To) adjustment ............................... 4-34
Figure 4-28 K1, model proposed for use in the PTS reevaluation effort. In fitting the model tothe data, the Weibull shape parameter (c) was fixed at 4 while the minimum andmedian values (a and b, respectively) were defined based on the data ............... 4-35
Figure 4-29 Diagrammatic summary of the FAVOR crack initiation model showing therecommended models, input values, and uncertainty treatment. Nongeneric valuesof RTNDT(u) can be found in the RVID database; these values are also provided inAppendix C to this document for the PWRs studied in the PTS reevaluation effort................................................................................................................................ 4 -3 6
Figure 4-30 Index temperature shift model ............................................................................. 4-38Figure 4.31 Azimuthal variation of fluence on the inner diameter of the Oconee 1 vessel at the
axial location of the peak fluence .......................................................................... 4-39Figure 4.32 Axial variation of fluence on the inner diameter of the Oconee 1 vessel at the
azimuthal location of peak fluence ........................................................................ 4-39Figure 4-33 Comparison of 0.2 percent offset yield strength (sy) for nuclear RPV steels to the
Zerilli/Armstrong constitutive relation (line labeled "prediction") (Kirk 01a). Sy(mO isthe ambient-temperature yield strength ............................ 4-42
Figure 4-34 Eason embrittlement trend curve model .............................................................. 4-44Figure 4-35 Comparison of embrittlement shift uncertainties simulated by FAVOR (blue line
with X symbols) with the uncertainties in the experimental embrittlement shiftdatabase used by Eason to construct the model .................................................. 4-46
Figure 4-36 Relationship between the change in the fracture toughness index temperature(zlT,) and the increase in the room temperature yield strength produced byirradiation. The differences in the fit slopes are not statistically significant .......... 4-48
x

Figure 4-37 Relationship between the change in the 41J ft-lb CVN transition temperature(AT 41j) and the increase in the room temperature yield strength produced byirradiation. The differences in the fit slopes are statistically significant ................ 4-48
Figure 4-38 Illustration of how differences in USE can influence the 41J transition temperature.The USE given in the boxes for (U) unirradiated and (I) irradiated conditions are theaverages determined from the data used to calibrate the Charpy embrittlementm odel show n in Figure 4-34 .................................................................................. 4-4 9
Figure 4-39 Relationship between the change in the fracture toughness index temperature(AT,) and the change in the 30 ft-lb CVN transition temperature (AT41j) produced byirradiation. The differences in the fit slopes are statistically significant ................ 4-49
Figure 4-40 Relationship between CVN shift caused by irradiation (AT30) and the shift in thefracture toughness transition temperature caused by irradiation T, (AT,) for datasets limited to (a) 10 Kj, values or more, and (b) 15 Kj, values or more. Shadedregion shows the range of all the data from Figure 4-39 (all data determined with 6K j, values or m ore) ............................................................................................... 4-50
Figure 4-41 Illustration of how the uncertainty in predicted values of AT, is broadened whenuncertainty in the empirical AT, vs. AT3o relationship is included in the calculation................................................................................................................................. 4 -5 1
Figure 4-42 Diagrammatic summary of the FAVOR embrittlement model showing therecommended models, input values, and uncertainty treatment .......................... 4-52
Figure 5-1 FAVOR through-wall cracking model ...................................................................... 5-3Figure 5-2 Engineering stress vs. true plastic strain curves for various degrees of prior
hardening (thin vertical lines and curves) calculated from the Zerilli/Armstrong truestress vs. true plastic strain curve (thick curve) for ARMCO Iron ........................... 5-5
Figure 5-3 An illustration of the effect of strain rate increase on yield-strength elevation formaterials having different degrees of prior strain hardening ................................... 5-6
Figure 5-4 Data for RPV and other steels showing the separation between the crack arresttransition temperature (ART,,s, = 44.1 . exp[- 0.006. T0 ]) (Wallin 98b) ...................... 5-6
Figure 5-5 FAVOR KIa model based only on ASTM E1221 data .............................................. 5-8Figure 5-6 FAVOR KIa model based on ASTM E1221 data, wide-plate data, thermal shock
experiment data, and PTS experiment data ........................................................... 5-8Figure 5-7 Comparison of the temperature dependencies of the FAVOR KI, model, the two
FAVOR Kia models, and the Wallin Master Curve. Note that only median and meancurves are shown, and that the curves are only plotted over their calibrated range..
. . .......................................................................................................................... 5 -9Figure 5-8 Diagrammatic summary of the FAVOR crack arrest model showing the
recommended models, input values, and uncertainty treatment .......................... 5-10Figure 5-9 J1, data for U.S. RPV steels (converted to K-units) before and after irradiation ..... 5-11Figure 5-10 J-Aa data (filled and open circles) and fits and constructions prescribed by ASTM
S ta nda rd E 1820 .................................................................................................... 5-12Figure 5-11 Relationship between upper-shelf toughness measures and CVN USE for
irradiated and unirradiated RPV steels ................................................................. 5-13Figure 5-12 Transition and upper-shelf fracture toughness data for an A533B Steel (HSST
Plate 02, left) and for a Linde 80 weld (Midland nozzle course weld, right) indicatingthat RPV steels normally viewed as being different exhibit strikingly similartemperature dependency on the upper shelf ........................................................ 5-15
Figure 5-13 Relationship betweenfJI, and temperature for irradiated and unirradiated RPVste e ls .................................................................................................................... 5 -1 8
xi

Figure 5-14 Relationship between J/,and temperature for irradiated and unirradiated RPVsteels. Here the J1, values have been normalized relative to the average value of J1,at 288 0C (550 OF) ................................................................................................ 5-18
Figure 5-15 Schematic illustrating the relationship between transition and upper-shelftoughness and defining the value Tus as the intersection of the Wallin Master Curveand the upper-shelf Master Curve ....................................................................... 5-20
Figure 5-16 Relationship between Tus and T, reported in EricksonKirk 04b .......................... 5-21Figure 5-17 Data from Figure 5-16 augmented by data provided by Wallin ........................... 5-21Figure 5-18 Effect of number of Kjc and J1, data that underlie the To and Tus values on Figure 5-
17 on how well an individual Tus value agrees with the fit (Eq. 5-8) to all of the data................................................................................................................ .5............5 -25
Figure 5-19 (Top) Residuals of measured AJ10 values about the fit of Eq. 5-7, and (bottom)standard deviations fit to these data over discrete temperature ranges. Thestandard deviation values are plotted at the midpoint of the temperature range overwhich the standard deviation was calculated ........................................................ 5-27
Figure 5-20 Temperature dependency of J-R curve exponent m values for a number of nuclearR PV steels (M cG ow an 88) .................................................................................... 5-28
Figure 5-21 Schematic of the FAVOR Version 04.1 upper-shelf tearing model showing therecommended models, input values, and uncertainty treatment .......................... 5-30
Figure 5-22 Illustration of the proposed procedure to limit K1a values dependent upon the KI,value that started the sim ulation ........................................................................... 5-32
xii

TABLES
Table 4-1 Summary of Unirradiated RPV Materials Having Both RTNDT and T, Values Available............................................................................................................................... 4 -3 0
Table 4-2 Three Reference Transition Temperatures Defined Using the ORNL 99/27 K1,D ata b a se .............................................................................................................. 4 -3 1
Table 4-3 Summary of Generic RTNDT Values in the RVID Database ..................................... 4-31Table 4-4 Partitioning of Fluence Uncertainty (Values Based'on Expert Opinion) (Carew 01)...
............................................................................................................................... 4 -4 0Table 4-5 Independent Variables in Figure 4-34 ..................................................................... 4-44Table 5-1 Sources of Upper-Shelf Data for RPV Steels ......................................................... 5-15Table 5-2 Sources of Upper-Shelf Data for Other Ferritic and Tempered Martensitic Steels.5-15Table 5-3 Chemical Composition Information ......................................................................... 5-16Table 5-4 Strength and Upper-Shelf Energy- Information ........................................................ 5-17Table 5-5 Summary of Data Used in EricksonKirk 04b to Establish the'Relationship between T,
a nd T us ................................................................................................................. 5 -2 2Table 5-6 Layers of Uniform Copper Content Expected in RPV Welds .................................. 5-33
xiii

EXECUTIVE SUMMARY
This report is one of a series of reports that summarize the results of a 5-year project conductedby the U.S. Nuclear Regulatory Commission's (NRC) Office of Nuclear Regulatory Research.This study sought to develop a technical basis to support revision of Title 10, Section 50.61, ofthe Code of Federal Regulations (10 CFR 50.61), which is known as the pressurized thermalshock (PTS) rule and the associated PTS screening criteria in a manner consistent with currentNRC guidelines on risk-informed regulation. Figure ES-1 illustrates how this report fits into theoverall project documentation.
This Executive Summary begins with a description of PTS, how it might occur, and what thepotential consequences are for the vessel. A summary of the current regulatory approach toPTS follows, which leads directly to a discussion of the motivations for undertaking this project.This section concludes with a description of how the project was conducted. This introductorymaterial provides a context for the information presented in this report concerning the details ofthe probabilistic fracture mechanics (PFM) model.
Summary Report - NUREG-1806I ~T,
PFM TH PRA
.0
5.2
V
•• Poceures Unertanty & xoortmentell: EdcksonKrA, M.T,,t MI.,
trobab lade Fracture Mechanics:Models, Parameters, and UncertaintyTreatment Used In FAVOR Version 04.1,"NUREG-1 807.FAVOR
Thor Maue Wtilliams, P.T., et al.,"Fracture Analysis of Vessels - OakRidge. FAVOR v04.1, Computer Code:Theory and Implementation ofAlgorithms, Methods, andCorrelations," NUREGICR-6854.• AC"M nI: Dickson, T.L., at at.,'Fracture Analysis of Vessels - OakRidge, FAVOR v04.1, Computer Code:User's Guide," NUREGICR-6855.•L• : Mallk, S.N.M., "FAVORCode Versions 2.4 and 3.1Verification and Validation SummaryReport," NUREG-1795.
EFlawDistriution S monen, F.A., et aL,"A Generalzed Procedure for GeneratingFlew-Related Inputs for the FAVORCode," NUREGICR-6817, Rev. 1.
* TH ¶gj: Bessette, D., "ThermalHydraulic Analysis of PressurizedThermal Shock," NUREGI1809.
•RAPProcedures & Exoermetab-rFetcher, v.. tu.
IIOD3.2. G2mm( Assessmentfor Pressurized Thermal ShockApplications," NUREGICR-6857.
• Enemeta Bechnrs:R=ye, J.N,at. al., ina sport r a OSU APEX-CEIntegral Test Facility, NUREG/CR4S856.
• EnerrnetelBenhmaks:Roye, J.N.,
Slng Analysis for the SU APEX-CEIntegral Test Facility, NUREGICR-6731
- Unl19jnln: Chang, Y.H., et all.,"Thernal Hydraulic Uncertainty AnalysisIn Pressurized Thermal Shock RiskAssessment," University of Maryland.
KThis Report
- Procedures & Uncertainty: Whitehead, D.W.snd Kolaczkowski, AM., "PRA Proceduresand Uncertainty for PTS Analysis,"NUREGICR-859.
- Uncertainty Analsis Methodolorv: Slu, N.,"Uncertainty Analysis and PressurizedThermal Shock, An Opinion," USNRC, 1999.
-•UseslnsA: Dickson, T.L and Yin, S., "%M : Arcisrl, W.C., "RELAPS Supot S Pr: Whitehead, D.W., at al., "Beaver"lcronic Archival of the Results of a Hydraulic Analyses to Support alley S PRA.
Pressurized Thermal Shock Analyses for PTS Evaluations for the Oconee-1,Beaver Valley, Oconee, and Palisades Beaver Valley-i, and Palisades Nuclear aM" olsczkowski AM etaL OconeeReactor Pressure Vessels Generated with Power Plants," NUREGICR-6858. PT rAthe 04.1 version of FAVOR," SArcierl, W.C., .1 &L, - PJls~d: Whitehead, D.W., at al.,
S ORNIJNRCLTR-18. A M 3..2Gamma Results for
• nsMR v•d : ErioksonKirk, M.T., Palisades 1D Downcomer Snsitivity ternl nts:Kolaczkowski, A.M., at al.,udiesof the Study" SenIsvte so Events Contribution
isticn Fracture Mechanics Model Junge, M., "PTS to Pressurized Thermal Shock Risk"I~! Usdn FAVOR," NUREG-18011. CnltnvCek ugM,"T
ConsistencyEffort" _Whitehead, D•W., at al.,a n~of Plant-Specific PTS Risk
Results to Additional Plants"
Figure ES-1 Structure of reports documenting the PTS reevaluation effort
xiv

ES.1 Description of PTS
One potentially significant challenge to the structural integrity of the reactor pressure vessel(RPV) in a pressurized-water reactor (PWR) is posed by a PTS event in which rapid cooling ofthe downcomer occurs, possibly followed by repressurization. A number of abnormal eventsand postulated accidents have the potential to thermally shock the vessel (either with or withoutsignificant internal pressure); some of these include a pipe break in the primary pressure circuit,a stuck-open valve in the primary pressure circuit, and the break of the main steamline. Duringthese events, the water level drops because of the contraction produced by rapiddepressurization. In events involving a break in the primary pressure circuit system, the waterlevel drops further because of leakage from the break. Automatic systems and operators mustprovide makeup water in the primary system to prevent overheating of the fuel in the core. Themakeup water is much colder than that held in the primary system.
The temperature drop produced by rapid depressurization, coupled with the near-ambienttemperature of the makeup water, produces significant thermal stresses in the thick-sectionsteel wall of the RPV. For embrittled RPVs, these stresses could be high enough to initiate arunning crack that could propagate all the way through the vessel wall. Through-wall crackingof the RPV could precipitate core damage or, in rare cases, a large early release of radioactivematerial to the environment.
ES.2 Current PTS Regulations
As required by 10 CFR 50.61, licensees must monitor the embrittlement of their RPVs using asurveillance program qualified by Appendix H to 10 CFR Part 50. The results of surveillanceare used together with the formulae and tables in 10 CFR 50.61 to estimate the fracturetoughness transition temperature (RTNDT) of the steels in the vessel's beltline, as well as howthese transition temperatures increase because of irradiation damage throughout theoperational life of the vessel. For licensing purposes, 10 CFR 50.61 provides instructions onhow to use these estimates of the effect of irradiation damage on RTNDT to estimate the value ofRTNDTthat will occur at end of license (EOL), a value called RTpTs. In addition, 10 CFR50.61provides "screening limits," or maximum values of RTNDT, permitted during the operating life ofthe plant of +132 °C (+270 OF) for axial welds, plates, and forgings and +149 0C (+300 OF) forcircumferential welds. These screening limits correspond to a limit of 5x10⁻⁶ events/yr on theyearly probability of developing a through-wall crack (see Regulatory Guide (RG) 1.154, "Formatand Content of Plant-Specific Pressurized Thermal Shock Safety Analysis Reports forPressurized Water Reactors"). Should RTpTs exceed these screening limits, 10 CFR 50.61requires that the licensee either take actions to keep it below the screening limit (i.e., byimplementing "reasonably practicable" flux reductions to reduce the embrittlement rate or bydeembrittling the vessel by annealing (see RG 1.162, "Thermal Annealing of Reactor PressureVessel Steels") or perform a plant-specific analysis to demonstrate that operating the plantbeyond the 10 CFR 50.61 screening limit does not pose an undue risk to the public (see RG1.154, "Format and Content of Plant-Specific Pressurized Thermal Shock Safety AnalysisReports for Pressurized Water Reactors").
While no currently operating PWR has an RTpTs value that exceeds the 10 CFR 50.61screeninglimits before EOL, several plants are close to the limit (3 are within 10C (2 OF) while 10 are within11 OC (20 OF)). Those plants that are close to the limit are likely to exceed it during the 20-yearlicense renewal period that many operators are currently seeking. Moreover, some plants
xv

maintain their RTpTs values below the 10 CFR 50.61 screening limits by implementing fluxreduction (low-leakage cores; ultra-low leakage cores) and other fuel management strategiesthat can be economically deleterious in a deregulated marketplace. Thus, the 10 CFR 50.61screening limits can restrict the licensable and the economic lifetime of PWRs.
ES.3 Motivation for This Pioiect
It is now widely recognized that the state of knowledge and data limitations in the early 1980snecessitated a conservative treatment of several key parameters and models used in theprobabilistic calculations that provide the technical basis of the current PTS rule. The mostprominent of these conservatisms include the following:
the highly simplified treatment of plant transients (i.e., the very coarse grouping of manyoperational sequences (on the order of 105) into very few groups (approximately 10))necessitated by limitations in the computational resources needed to perform multiplethermal hydraulic (TH) calculations
* the lack of any significant credit for operator action
the characterization of fracture toughness using RTNDT, which has an intentionalconservative bias
the use of a flaw distribution that placed all of the flaws on the interior surface of theRPV, and, in general, contains larger flaws than those usually detected in service
the modeling approach that treated the RPV as if it were made entirely from the mostbrittle of its constituent materials (welds, plates, or forgings)
the modeling approach that assessed RPV embrittlement using the peak fluence overthe entire interior surface of the RPV
These factors indicate the high likelihood that the current 10 CFR 50.61 PTS screening limitsare unnecessarily conservative. Consequently, it was believed that a reexamination of thetechnical basis for these screening limits that is based on a modern understanding of all thefactors that influence PTS would most likely strongly justify a substantial relaxation of theselimits. For these reasons the NRC's Office of Nuclear Reactor Regulation undertook this projectwith the objective of developing the technical basis to support a risk-informed revision of thePTS rule and the associated PTS screening limit.
ES.4 Approach
As illustrated in Figure ES-2, there are three main models (shown as solid blue squares) that,together, allow an estimate of the yearly frequency of through-wall cracking in an RPV:
(1) a probabilistic risk assessment event sequence analysis(2) a thermal hydraulic analysis(3) a probabilistic fracture mechanics analysis
xvi
Probabilistic Estimation of Through-Wall Crackin-g Frequency
Probabiiii s cFracturelysis" ticna YS is(FA VOR)
ý'J
KTC(t)nlyiSequnceDeffinitions U
yiartivr:'FrequencyofThruMallCrackir!g
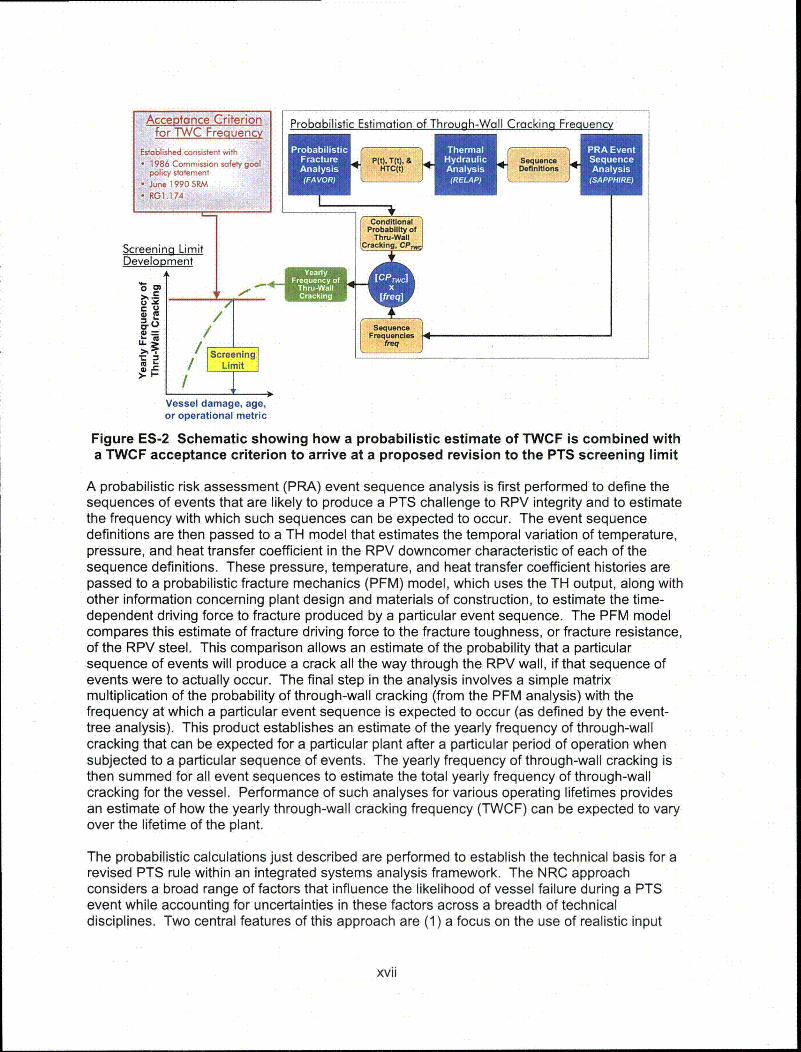
Figure ES-2 Schematic showing how a probabilistic estimate of TWCF is combined witha TWCF acceptance criterion to arrive at a proposed revision to the PTS screening limit
A probabilistic risk assessment (PRA) event sequence analysis is first performed to define thesequences of events that are likely to produce a PTS challenge to RPV integrity and to estimatethe frequency with which such sequences can be expected to occur. The event sequencedefinitions are then passed to a TH model that estimates the temporal variation of temperature,pressure, and heat transfer coefficient in the RPV downcomer characteristic of each of thesequence definitions. These pressure, temperature, and heat transfer coefficient histories arepassed to a probabilistic fracture mechanics (PFM) model, which uses the TH output, along withother information concerning plant design and materials of construction, to estimate the time-dependent driving force to fracture produced by a particular event sequence. The PFM modelcompares this estimate of fracture driving force to the fracture toughness, or fracture resistance,of the RPV steel. This comparison allows an estimate of the probability that a particularsequence of events will produce a crack all the way through the RPV wall, if that sequence ofevents were to actually occur. The final step in the analysis involves a simple matrixmultiplication of the probability of through-wall cracking (from the PFM analysis) with thefrequency at which a particular event sequence is expected to occur (as defined by the event-tree analysis). This product establishes an estimate of the yearly frequency of through-wallcracking that can be expected for a particular plant after a particular period of operation whensubjected to a particular sequence of events. The yearly frequency of through-wall cracking isthen summed for all event sequences to estimate the total yearly frequency of through-wallcracking for the vessel. Performance of such analyses for various operating lifetimes providesan estimate of how the yearly through-wall cracking frequency (TWCF) can be expected to varyover the lifetime of the plant.
The probabilistic calculations just described are performed to establish the technical basis for arevised PTS rule within an integrated systems analysis framework. The NRC approachconsiders a broad range of factors that influence the likelihood of vessel failure during a PTSevent while accounting for uncertainties in these factors across a breadth of technicaldisciplines. Two central features of this approach are (1) a focus on the use of realistic input
xvii

values and models (wherever possible), and (2) an explicit treatment of uncertainties (usingcurrently available uncertainty analysis tools and techniques). Thus, the NRC's currentapproach improves upon that employed in the development of SECY-82-465, which includedintentional and unquantified conservatisms in the many aspects of the analysis, and whichtreated uncertainties implicitly by incorporating them into the models.
ES.5 Key Findings
As discussed earlier, one of the technical motivations for this project is the understanding thatthe state of knowledge and data limitations in the early 1980s necessitated a conservativetreatment of several key parameters and models used in the probabilistic calculations thatprovide the technical basis of the current PTS rule. Some of the most substantiveconservatisms exist in the PFM model, which include the following:
the characterization of fracture toughness using RTNDT which has an intentionalconservative bias
the use of a flaw distribution that placed all of the flaws on the interior surface of theRPV, and that, in general, contained larger flaws than those usually detected in service
the modeling approach that treated the RPV as if it were made entirely from the mostbrittle of its constituent materials (welds, plates, or forgings)
the modeling approach that assessed RPV embrittlement using the peak fluence overthe entire interior surface of the RPV
These and other conservatisms motivated the NRC to fundamentally reexamine and restructurethe PFM model as this report summarizes. The major accomplishments of the improvementsmade to the PFM model are described in the following paragraphs.
* This report provides a thorough and systematic examination of all parts of the PFMmodel; it reveals many instances in which uncertainties were previously treated implicitlythrough the use of conservative models and parameter inputs. In the revised model(documented in this report) the NRC has, to the greatest extent possible, removed allsuch implicit treatments. Where conservative approaches are still part of the model(most often in areas in which adequate knowledge is lacking), they are explicitlyidentified.
This review has also identified the nature of uncertainties in the models and parametersthat collectively make up the PFM model (i.e., as being aleatory or epistemic) and toquantify them.
The PFM model consists of a crack initiation model, an embrittlement model, and athrough-wall cracking model. The major features of and improvements to the PFMmodel are as follows:
o Crack Initiation Model* This model included the removal, on average, of the large conservative bias in
the RTNDT transition temperature. This was achieved by recognizing that RTNDT
xviii

does not measure fracture toughness, and by adopting alternative metrics that domeasure fracture toughness.
* It also included separation of uncertainties in the crack initiation model into itsepistemic (resulting from of RTNDT) and its aleatory (resulting from the scatterinherent to ferritic steels) parts, allowing their separate and proper quantification.
o Embrittlement Model" Local variations in both fluence and material properties are recognized, an
improvement over the old representation in which the vessel was modeled asbeing comprised entirely of the most radiation-sensitive material exposed to thehighest fluence in the vessel.
" The damaging effect of radiation on the fracture toughness of ferritic steels isrepresented using a model with a functional form based on an understanding ofthe physical mechanisms responsible for irradiation damage. As such, the abilityof this model to extrapolate beyond the conditions for which it was calibrated issuperior to models used previously, which were predominantly empirical in origin.
o Through-Wall Cracking Model0 The through-wall cracking model recognizes the ability of ferritic steels to arrest
cleavage crack propagation at high applied driving forces.* As radiation damage increases, the cleavage crack initiation toughness of ferritic
steels will approach the cleavage crack arrest toughness. The through-wallcracking model now incorporates this feature, removing a feature from oldmodels that was physically unrealistic.
* The through-wall cracking model now recognizes and accounts for the possibilityof the RPV failing by ductile (rather than cleavage) mechanisms. Past modelsassumed that ductile failure was impossible and, in so doing, introducednonconservatisms into the model.
The PFM model includes the following features which must be viewed as conservative:o The model explicitly considers uncertainty in copper, in nickel, and in initial RTNDT.
However, it represents these uncertainties as being larger (a conservativerepresentation) than would be appropriate in any plant-specific application.
o The model used to represent the attenuation or radiation damage through thethickness of the RPV is conservative (i.e., the model predicts an increase intoughness through wall (from inner diameter to outer diameter) that is smaller thanthat revealed by experiments).
o Once a circumferential crack initiates, the model assumes that it will instantlypropagate 3600 around the vessel wall. Full circumferential propagation is highlyunlikely because of the azimuthal variation in fluence, which causes alternatingregions of more embrittled and less embrittled material to exist circumferentiallyaround the vessel wall. Thus, the NRC model tends to overestimate the extent ofcracking initiated from circumferentially oriented defects because it ignores thisnatural crack arrest mechanism.
o Once an axial flaw initiates, the model assumes that it will instantly become infinitelylong. In reality it will only propagate to the length of an axial shell course(approximately 8 to 12 feet), at which point it will encounter tougher material andarrest. Even though the length of a shell course is very long, finite length flaws tendto arrest more readily than do infinite length flaws because of systematic differencesin the through-wall variation of the crack driving force. Because of thisapproximation, the NRC model tends to overestimate the likelihood of through-wallcracking.
xix
o The experimental data upon which the flaw distribution is based modeled all detecteddefects as being crack-like, and therefore potentially deleterious to the fractureintegrity of the vessel. However, many of these defects are actually volumetric ratherthan planar, making them either benign or, at a minimum, much less of a challengeto the fracture integrity of the vessel. The NRC model thus overestimates theseriousness of the defect population in RPV materials, which leads to overlypessimistic assessments of the fracture resistance of the vessel.
xx

1 INTRODUCTION
1.1 Description of Pressurized Thermal Shock
One potentially significant challenge to the structural integrity of the reactor pressure vessel(RPV) in a pressurized-water reactor (PWR) is posed by a pressurized thermal shock (PTS)event in which rapid cooling of the downcomer occurs, possibly followed by'repressurization. Anumber of abnormal events and postulated accidents have the potential to thermally shock thevessel (either with or without significant internal pressure); some of these include a pipe break inthe primary pressure circuit, a stuck-open valve in the primary pressure circuit, and the break ofthe main steamline. During these events, the water level drops because of the contractionproduced by rapid depressurization. In events involving a break in the primary pressure circuitsystem, the water level drops further because of leakage from the break. Automatic systemsand operators must provide makeup water in the primary system to prevent the fuel in the corefrom overheating. The makeup water is much colder than that held in the primary system.
The temperature drop produced by rapid depressurization, coupled with the near-ambienttemperature of the makeup water, produces significant thermal stresses in the thick-sectionsteel wall of the RPV. For embrittled RPVs, these stresses could be high enough to initiate arunning crack that could propagate all the way through the vessel wall. Through-wall crackingof the RPV could precipitate core damage or, in rare cases, a large early release of radioactivematerial to the environment.
1.2 PTS Limits on the Licensable Life of a Commercial Pressurized-WaterReactor
In the early 1980s attention was focused on the possibility that PTS events could challenge theintegrity of the RPV wall for two reasons:
(1) Operational experience suggested that overcooling events, while not common, did in factoccur.
(2) The results of in-reactor materials surveillance programs suggested that the steels usedin RPV construction were prone to loss of toughness over time as the result of neutronirradiation-induced embrittlement.
This possibility of accident loading combined with degraded material conditions motivatedinvestigations to assess the risk of vessel failure posed by PTS in order to establish theoperational limits needed to ensure that the likelihood of RPV failures caused by PTS transientsremained sufficiently low. These efforts led to the publication of a document (SECY-82-465)that provided the technical basis for subsequent development of what has come to be known asthe "PTS rule" (Title 10, Section 50.61, of the Code of Federal Regulations (10 CFR 50.61)).
According to 10 CFR 50.61, licensees must monitor the embrittlement of their RPVs using asurveillance program qualified by Appendix H to 10 CFR Part 50. The results of surveillanceare used together with the formulae and tables in 10 CFR 50.61 to estimate the fracture
1-1
toughness transition temperature (RTNDTt) of the steels in the vessel's beltline, as well as how,these transition temperatures increase because of irradiation damage throughout theoperational life of the vessel. For licensing purposes, 10 CFR 50.61 provides instructions onhow to use such estimates of the effect of irradiation damage on RTNDTtO estimate the value ofRTNDT that will occur at end of license (EOL), a value called RTpTs. In addition, 10 CFR 50.61provides screening limits, or maximum values of RTNDT, permitted during the operating life of theplant of +132 °C (+270 °F) for axial welds, plates, and forgings and +149 °C (+300 OF) forcircumferential welds. These screening limits correspond to a limit of 5x1 06 events/yr on theyearly probability of developing a through-wall crack (see Regulatory Guide (RG) 1.154, "Formatand Content of Plant-Specific Pressurized Thermal Shock Safety Analysis Reports forPressurized Water Reactors"). Should RTpTs exceed these screening limits, 10 CFR 50.61requires that the licensee either take actions to keep it below the screening limit (i.e., byimplementing "reasonably practicable" flux reductions to reduce the embrittlement rate or by de-embrittling the vessel by annealing (see RG 1.162, "Thermal Annealing of Reactor PressureVessel Steels") or perform a plant-specific analysis to demonstrate that operating the plantbeyond the 10 CFR 50.61 screening limit does not pose an undue risk to the public (see RG1.154, "Format and Content of Plant-Specific Pressurized Thermal Shock Safety AnalysisReports for Pressurized Water Reactors").
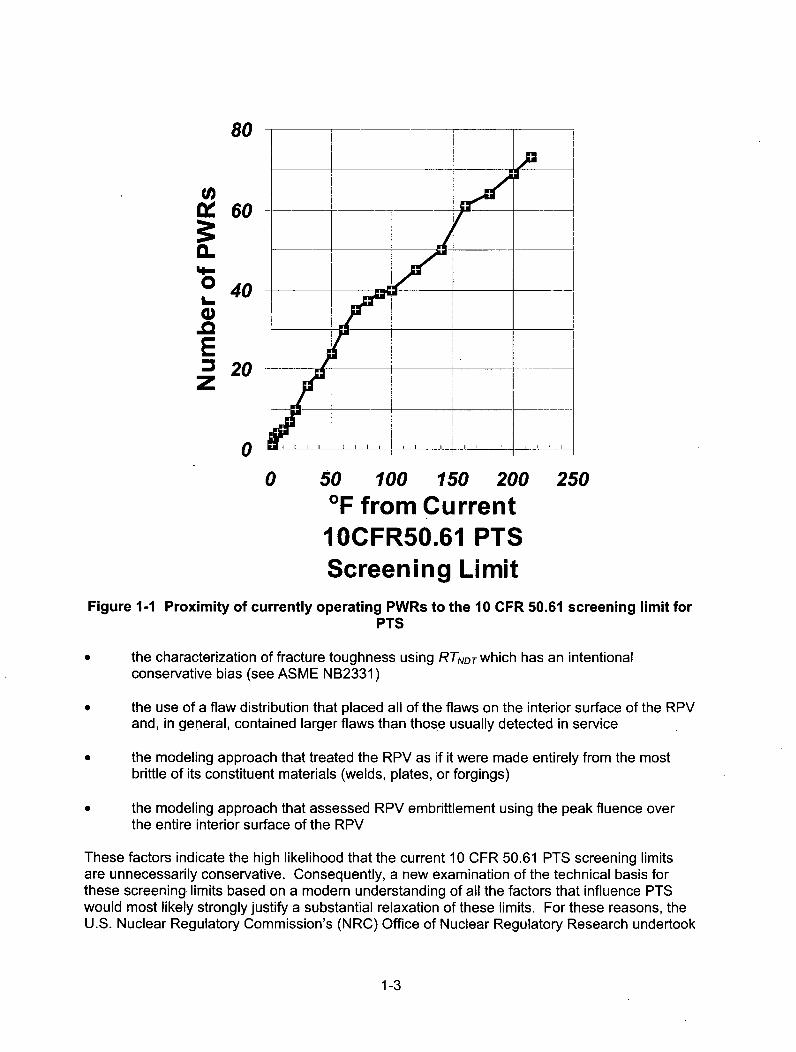
While no currently operating PWR has an RTpTs value that exceeds the 10 CFR 50.61screeninglimit before EOL, several plants are close to the limit (3 are within 1 °C (2 OF) while 10 are within11 'C (20 °F); see Figure 1-1). Those plants that are close to the limit are likely to exceed itduring the 20-year license renewal period that many operators are currently seeking. Moreover,some plants maintain their RTpTs values below the 10 CFR 50.61 screening limits byimplementing flux reduction (low-leakage cores; ultra-low leakage cores) and other fuelmanagement strategies that can be economically deleterious in a deregulated marketplace.Thus, the 10 CFR 50.61 screening limits can restrict the licensable and the economic lifetime ofPWRs. As detailed in the next section, there is considerable reason to believe that theserestrictions are not necessary to ensure public safety and, in fact, place an unnecessary burdenon licensees.
1.3 Technical Factors Suggesting Conservatism of the Current Rule
It is now widely recognized that the state of knowledge and data limitations in the early 1980snecessitated a conservative treatment of several key parameters and models used in theprobabilistic calculations that provide the technical basis (see SECY-82-465) of the current PTSrule (10 CFR 50.61). The most prominent of these conservatisms include the following:
the highly simplified treatment of plant transients (i.e., the very coarse grouping of manyoperational sequences (on the order of 105) into very few groups (approximately 10))necessitated by limitations in the computational resources needed to perform multiplethermal hydraulic calculations
the lack of any significant credit for operator action
t The RTNDT index temperature was intended to correlate with the fracture toughness transition
temperature of the material. Fracture toughness, and how it is reduced by neutron irradiationembrittlement, is a key parameter controlling the resistance of the RPV to any loading challenge. For amore detailed description of RTNDT (in specific) and fracture toughness (in general) see EricksonKirk 10-03.
1-2
80i
I _ _
4- I
60 1
0 40
20
F II
0 ....
0 50 100 150 200 250OF from Current1OCFR50.61 PTSScreening Limit
Figure 1-1 Proximity of currently operating PWRs to the 10 CFR 50.61 screening limit forPTS
0 the characterization of fracture toughness using RTNDT which has an intentionalconservative bias (see ASME NB2331)
* the use of a flaw distribution that placed all of the flaws on the interior surface of the RPVand, in general, contained larger flaws than those usually detected in service
* the modeling approach that treated the RPV as if it were made entirely from the mostbrittle of its constituent materials (welds, plates, or forgings)
* the modeling approach that assessed RPV embrittlement using the peak fluence overthe entire interior surface of the RPV
These factors indicate the high likelihood that the current 10 CFR 50.61 PTS screening limitsare unnecessarily conservative. Consequently, a new examination of the technical basis forthese screening limits based on a modern understanding of all the factors that influence PTSwould most likely strongly justify a substantial relaxation of these limits. For these reasons, theU.S. Nuclear Regulatory Commission's (NRC) Office of Nuclear Regulatory Research undertook
1-3

this project with the objective of developing the technical basis to support revision of the PTSrule and the associated PTS screening limit.
1.4 PTS Reevaluation Project
This section describes the PTS reevaluation project, which the NRC Office of NuclearRegulatory Research initiated in 1999. It discusses restrictions placed on the model used toestimate PTS risk, the overall structure of the model, how the model addressed uncertainties,and how the this and other reports document the results of the project.
1.4.1 Restrictions on the Model
The desired outcome of this research effort is the establishment of the technical basis for a newPTS screening limit. To enable all commercial operators of PWRs to assess the state of theirRPV relative to such a new criterion, without the need to make new material propertymeasurements, the fracture toughness properties of the RPV steels need to be estimated usingonly information that is currently available (i.e., RTNDT values, upper-shelf energy values, andthe chemical composition of the beltline materials). All of this information is summarized in theNRC Reactor Vessel Integrity Database (RVID2).
1.4.2 Overall Structure of the Model
The NRC's overall model involves three major components, which are illustrated (along withtheir interactions), in Figure 1-2:
(1) The first component, probabilistic evaluation of through-wall cracking frequency (TWCF),involves estimating the frequency of through-wall cracking as a result of a PTS eventgiven the operating, design, and material conditions in a particular plant.
(2) The second component, acceptance criterion for TWCF, involves establishing a value ofreactor vessel failure frequency (RVFF) consistent with current guidance on risk-informed decisionmaking.
(3) The third component, screening limit development, involves comparing the results of thetwo preceding steps to determine if some simple, materials-based screening limit forPTS can be established. Conceptually, plants falling below the screening limit would bedeemed adequately resistant to a PTS challenge and would not require further analysis.Conversely, more detailed, plant-specific analysis would be needed to assess the safetyof a plant's operation beyond the screening limit.
The following subsections describe each of these components.
1.4.2.1 Component 1-Probabilistic Estimation of Through-Wall Cracking Frequency
As illustrated in Figure 1-2, there are three main models (shown as solid blue squares) thattogether allow an estimate of the yearly frequency of through-wall cracking in an RPV:
(1) a probabilistic risk assessment (PRA) event sequence analysis(2) a TH analysis(3) a probabilistic fracture mechanics (PFM) analysis
1-4
Acceptance Criterion Probabilistic Estimation of Through-Wall Cracking Frequencyfor TWC Frequency I ý
Established consistent with* 1986 Commission safety goal
policy statement* June 1990 SRM* RG1.174
Screening LimitDevelopment
or operational metric
II P(t), TO.&HTc(t)
I Thermal
HydraulicAnalysis
(RELAP) I
SequenceDefinitions U
F *egirtyI Frequency ofI Thru.YvallL 1119 , A
4
L
Figure 1-2 High-level schematic showing how a probabilistic estimate of TWCF iscombined with a TWCF acceptance criterion to arrive at a proposed revision to the PTS
screening limit
The following subsections first describe these three models in general and then describe theirsequential execution to provide the reader with an appreciation for the interrelationships andinterfaces between the different models (Section 1.4.2.1.1). Next, the subsections describe theiterative process the NRC undertook, which involved repeated execution of all three models insequence, to arrive at final models for each plant (Section 1.4.2.1.2). Finally, the subsectionsdiscuss the three specific plants the NRC analyzed in detail (Section 1.4.2.1.3). This sectionconcludes with a discussion of the steps taken to ensure that the NRC's conclusions based onthese three analyses apply to domestic PWRs in general (Section 1.4.2.1.4).
1.4.2.1.1 Sequential Description of How PRA, TH, and PFM Models Are Used to EstimateTWCF
A PRA event sequence analysis is first performed to define the sequences of events that arelikely to produce a PTS challenge to RPV integrity and to estimate the frequency with whichsuch sequences can be expected to occur. The event sequence definitions are then passed toa TH model that estimates the temporal variation of temperature, pressure, and heat transfercoefficient in the RPV downcomer characteristic of each of the sequence definitions. Thesepressure, temperature, and heat transfer coefficient histories are passed to a PFM model, whichuses the TH output, along with other information concerning plant design and materials ofconstruction, to estimate the time-dependent driving force to fracture produced by a particularevent sequence. The PFM model compares this estimate of fracture driving force to the fracturetoughness, or fracture resistance, of the RPV steel. This comparison allows an estimate of theprobability that a particular sequence of events will produce a crack all the way through the RPVwall if that sequence of events were to actually occur. The final step in the analysis involves asimple matrix multiplication of the probability of through-wall cracking (from the PFM analysis)
1-5

with the frequency at which a particular event sequence is expected to occur (as defined by theevent-tree analysis). This product establishes an estimate of the yearly frequency of through-wall cracking that can be expected for a particular plant after a particular period of operationwhen subjected to a particular sequence of events. The yearly frequency of through-wallcracking is then summed for all event sequences to estimate the total yearly frequency ofthrough-wall cracking for the vessel. Performance of such analyses for various operatinglifetimes provides an estimate of how the yearly TWCF can be expected to vary over the lifetimeof the plant.
1.4.2.1.2 Iterative Process Used to Establish Plant-Specific Models
The set of transients used to represent a particular plant are identified using a PRA event-treeapproach, in which many thousands of different initiating event sequences are "binned" togetherinto groups of transients believed to produce similar TH outcomes. Judgments regarding whattransients to put into what bin were guided by such characteristics as similarity of break size andsimilarity of operator action, resulting in bins such as "medium break primary system loss-of-coolant accidents (LOCAs)" and "main steamline breaks". From each of the tens or hundreds ofindividual event sequences in each bin, the NRC selected a single sequence and programmed itinto the TH code RELAP to define the variation of pressure, temperature, and heat transfercoefficient vs. time. These TH transient definitions were then passed to the PFM code FAVOR,which estimated the conditional probability of through-wall cracking (CPTWC) for each transient.When multiplied by the initiating event frequency estimates estimated in the PRA analysis,these CPTWC become TWCF values, which, when rank-ordered, estimate the degree to whicheach bin contributes to the total TWCF of the vessel. At this stage many bins are found tocontribute very little or nothing at all to the TWCF, and so receive little further scrutiny.However, some bins invariably dominate the TWCF estimate. These bins are then furthersubdivided by partitioning the initiating event frequency of the bin, and by selecting a THtransient to represent each part of the original bin. FAVOR is then used to analyze this refinedmodel,, and the bins that provide significant contributions to TWCF are again examined. Thisprocess of bin partitioning, and the selection of a TH transient to represent each newlypartitioned bin, continues until the total estimated TWCF for the plant no longer changessignificantly.
1.4.2.1.3 Plant-Specific Analyses Performed
In this project, the NRC performed detailed calculations for three operating PWRs (Oconee Unit1, Beaver Valley Unit 1, and Palisades; see Figure 1-3). Together the three plants sample awide range of design and construction methods, and they contain some of the most embrittledRPVs in the current operating fleet.
1.4.2.1.4 Generalization to all Domestic PWRs
Because the objective of this project is to develop a revision to the PTS screening limitexpressed in 10 CFR 50.61 that applies in general to all PWRs, the NRC must understand towhat extent these three plant-specific analyses adequately address (in either a representative orin a bounding sense) the range of conditions experienced by domestic PWRs in general. TheNRC performed the following actions to achieve this goal:
1-6
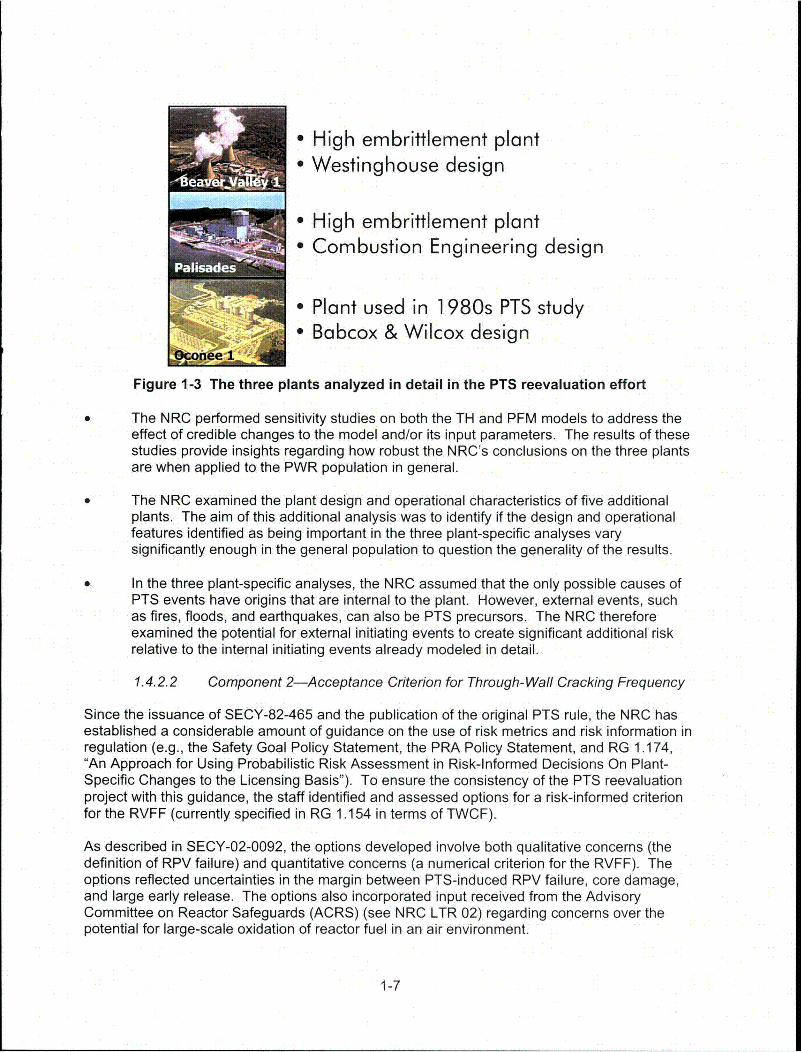
* High embrittlement plant* Westinghouse design
* High embrittlement plante Combustion Engineering design
* Plant used in 1980s PTS study• Babcox & Wilcox design
Figure 1-3 The three plants analyzed in detail in the PTS reevaluation effort
The NRC performed sensitivity studies on both the TH and PFM models to address theeffect of credible changes to the model and/or its input parameters. The results of thesestudies provide insights regarding how robust the NRC's conclusions on the three plantsare when applied to the PWR population in general.
The NRC examined the plant design and operational characteristics of five additionalplants. The aim of this additional analysis was to identify if the design and operationalfeatures identified as being important in the three plant-specific analyses varysignificantly enough in the general population to question the generality of the results.
In the three plant-specific analyses, the NRC assumed that the only possible causes ofPTS events have origins that are internal to the plant. However, external events, suchas fires, floods, and earthquakes, can also be PTS precursors. The NRC thereforeexamined the potential for external initiating events to create significant additional riskrelative to the internal initiating events already modeled in detail.
1.4.2.2 Component 2-Acceptance Criterion for Through-Wall Cracking Frequency
Since the issuance of SECY-82-465 and the publication of the original PTS rule, the NRC hasestablished a considerable amount of guidance on the use of risk metrics and risk information inregulation (e.g., the Safety Goal Policy Statement, the PRA Policy Statement, and RG 1.174,"An Approach for Using Probabilistic Risk Assessment in Risk-Informed Decisions On Plant-Specific Changes to the Licensing Basis"). To ensure the consistency of the PTS reevaluationproject with this guidance, the staff identified and assessed options for a risk-informed criterionfor the RVFF (currently specified in RG 1.154 in terms of TWCF).
As described in SECY-02-0092, the options developed involve both qualitative concerns (thedefinition of RPV failure) and quantitative concerns (a numerical criterion for the RVFF). Theoptions reflected uncertainties in the margin between PTS-induced RPV failure, core damage,and large early release. The options also incorporated input received from the AdvisoryCommittee on Reactor Safeguards (ACRS) (see NRC LTR 02) regarding concerns over thepotential for large-scale oxidation of reactor fuel in an air environment.
1-7

The NRC's assessment of the options involved the identification of technical issues unique tothe PTS accident scenario development, the development of an accident progression event treeto structure consideration of the issues, the performance of a scoping study of the issue ofcontainment performance during PTS accidents, and the review of the options in light of thisinformation. The scoping study involved collecting and evaluating available information,performing a few limited-scope TH and structural calculations, and a semiquantitative analysisof the likelihood of various accident progression scenarios.
1.4.2.3 Component 3-Screening Limit Development
As illustrated schematically in Figure 1-2 (lower left corner), a screening limit for PTS can beestablished based on a simple comparison of estimates of the RVFF as a function of anappropriate measure of RPV embrittlement with the RVFF acceptance criterion (or RVFF*).Beyond the work needed to establish both the RVFF vs. embrittlement curve and RVFF* values,it is also necessary to establish a suitable vessel damage metric that, ideally, allows differentconditions in different materials at different plants to be normalized. From a practicalstandpoint, "suitable" implies that the metric needs to be based only on information regardingplant operation and materials that is readily available.
1.4.3 Uncertainty Treatment
At the outset of this project in 1999, the NRC staff reviewed the Agency's existing approach forPRA modeling, focusing on how uncertainties should be treated, how they were propagatedthrough the PRA, TH, and PFM models, and how that approach compared with the NRC'sguidelines on work supporting risk-informed regulation (see Siu 99). This review established ageneral framework for model development and uncertainty treatment, which the followingparagraphs summarize.
This project performed probabilistic calculations to establish the technical basis for a revisedPTS rule within an integrated systems analysis framework (see Woods 01). The NRC approachconsiders a broad range of factors that influence the likelihood of vessel failure during a PTSevent while accounting for uncertainties in these factors across a breadth of technical disciplines(see Siu 99). Two central features of this approach are (1) a focus on the use of realistic inputvalues and models (wherever possible), and (2) an explicit treatment of uncertainties (usingcurrently available uncertainty analysis tools and techniques). Thus, the current approachimproves upon that employed in the development of SECY-82-465, which included intentionaland unquantified conservatisms in the many aspects of the analysis, and which treateduncertainties implicitly by incorporating them into the models (RTNDT, for example).
The NRC's probabilistic models distinguish between two types of uncertainties, aleatory andepistemic. Aleatory uncertainties result from the randomness inherent to a physical or humanprocess, whereas epistemic uncertainties are caused by a limitation in the current state ofknowledge (or understanding) of that process. A practical way to distinguish between aleatoryand epistemic uncertainties is that epistemic uncertainties can, in principle, be reduced by anincreased state of knowledge. Conversely, because aleatory uncertainties result fromrandomness at a level below which a particular process is modeled, they are fundamentallyirreducible. The distinction between aleatory and epistemic uncertainties is an important part ofthe PTS analysis because different mathematical and/or modeling procedures are used torepresent these differentuncertainty types.
1-8
1.4.4 Project Documentation
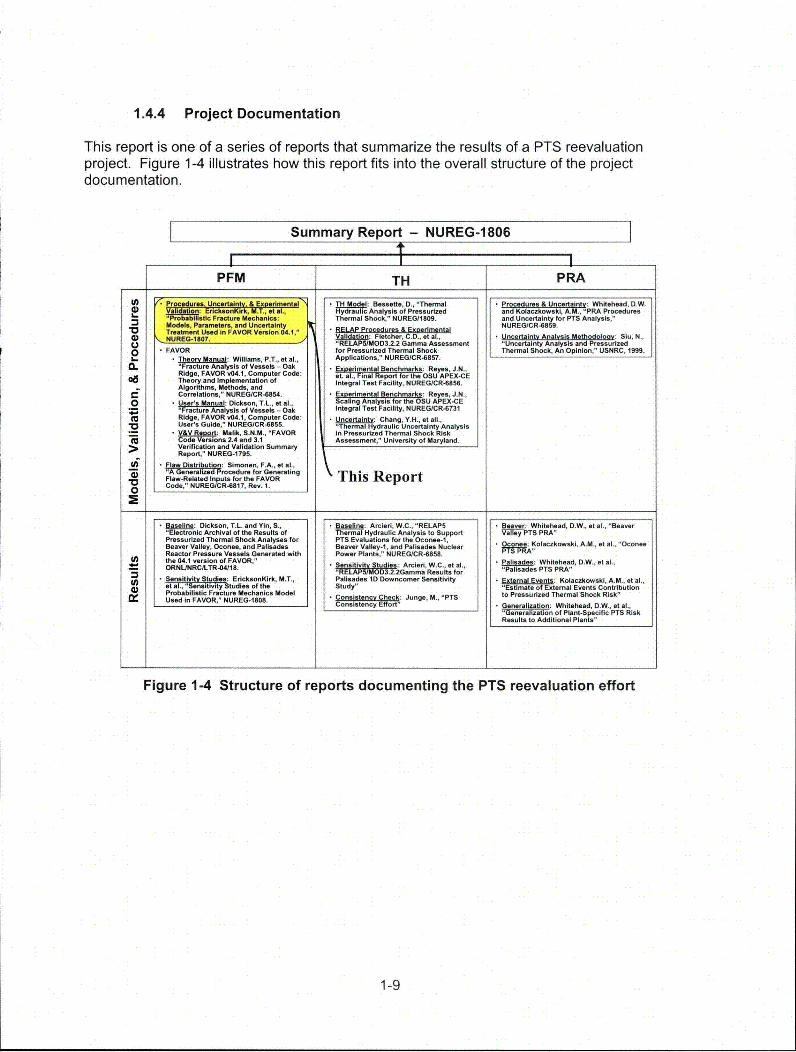
This report is one of a series of reports that summarize the results of a PTS reevaluationproject. Figure 1-4 illustrates how this report fits into the overall structure of the projectdocumentation.
Summary Report - NUREG-1806NUE-10
I I
PFM TH PRA
0
08CF.2
Vden:Erickolu(nrkl 6.T at al.,
"Probebi tic Fracture Mechanics:Models, Parameters, and UncertaintyTreatment Used In FAVOR Version 04.1,"NUREG-1807.
FAVOR,TL•Manua Williams, P1T.0 t 5.,"Fracture Analysis of Vessels - OakRidge, FAVOR v04.1, Computer Code:Theory and Implementation ofAlgorithms, Methods, andCorrelations," NUREG/CR-6854.
V" n : DIckson. TL., st al.,FractursAntalysis of Vessels - Oak
Ridge, FAVOR v04.1, Computer Code:User's Guide," NUREG/CR-6855.
Malik, S.N.M., "FAVORC ns 2.4 and 3.1Verlifcation and Validation SummaryReport," NUREG-1795.
•Faw Distibution: Simonen, FA., at al.,"A Generalized Procedure for GeneratingFlaw-Related Inputs for the FAVORCode," NUREGICR-6817, Rev. 1.
.ThMgel: Bessette, D., "ThermalHydraulic Analysis of PressurizedThermal Shock," NUREG/1809.
RELAP Procedures & Exserlmental: Fletcher, C.D., at el.,
"REAP OD3.2.2 Gamma Assessmentfor Pressurized Thermal ShockApplications," NUREGICR-6857.
Sg5 J !oe irnts enchmarks: Reyes, J.N.,La., Finl R for the OSU APEX-CE
Integral Test Facility, NUREGICR-6856.
gg EnoieentsLgBnchmarks: Reyes, J.N.,Scaling Analysis for the OSU APEX-CEIntegral Test Facility, NUREG/CR-6731
Sca : Chang, Y.H., stall.,Thermal Hydraulic Uncertainty Analysis
In Pressurized Thermal Shock RiskAssessment," University of Maryland.
KThis Report
- Procedures & Uncertainty: Whitehead, D.W.and K-a-owskl, A.M., "PRA Proceduresand Uncertainty for PTS Analysis,"NUREG/CR-6859.
- Uncertainty Analysis Methodoloov: Siu, N.,"Uncertainty Analysis and PressurizedThermal Shock, An Opinion," USNRC, 1909.
- 2 ,: Dickson, T.L and Yin, S., Baseines: Arcisri, W.C., "RELAPS VA ly Whitehead, OW., at al., "Beaver"Electronic Archival of the Results of Thermal Hydraulic Analysis to Support Valy TS PRA"Pressurized Thermal Shock Analyses for PTS Evaluations for the Oconel-1,Beaver Valley, Ocones, and Palisades Beaver Valley-I, and Palisades NuclearReactor Pressure Vessels Generated with Power Plants," NUREG/CR-6858.
W/) the 04.1 version of FAVOR," - Palisades: Whitehead, D.W., at al.,4 ORNLJNRC/LTR-418. Gamma Results for "Palisades PTS PRA"
t i • : EricksonKirk, M.T., Palisades ID Downcomer Sensitivity "tsnam etst Kolaczkowski, A.M., at al.,eta., ens tivty tudles of the Study" ernal Events ContributionProbabilistic Fracture Mechanics Model • onsistencCCk: JungeM., "PTS to Pressurized Thermal Shock Risk"Used in FAVOR," NUREG-St.10.gnitc d
Consistency Eorton' M.,: Whitehead, O.W., at el.,"Geeraiaton of Plant-Specific PTS RiskResults to Additional Plants"
Figure 1-4 Structure of reports documenting the PTS reevaluation effort
1-9


2 OBJECTIVE, SCOPE, AND STRUCTURE OF THISREPORT
This report describes the models and the parameters that make up the probabilistic fracturemechanics (PFM) model that has been implemented in FAVOR Version 04.1 (see Williams 04).Additionally, this report describes how uncertainties in these models and parameter inputs aretreated. Figure 1-2 illustrates where PFM fits, together with a probabilistic risk assessment(PRA) and a thermal hydraulic (TH) analysis, within the overall model used to estimate thethrough-wall cracking frequency (and its uncertainty). Figure 2-1 provides a more detaileddepiction. of the interaction of the PFM model (large shaded boxes) with the PRA and THmodels (unshaded boxes), and of the PFM model itself.
The PFM model contains the following three main parts:
(1) a flaw distribution model (the uppermost of the large shaded boxes in Figure 2-1)(2) a crack initiation model (the middle of the large shaded boxes in Figure 2-1)(3) a through-wall cracking model (the lowest of the large shaded boxes in Figure 2-1)
As illustrated in Figure 2-1, each of these models is itself a complex assemblage of submodelsand parameter inputs. The flaw distribution model and the treatment of uncertainties in the flawdistribution model is the subject of a companion report (see Simonen 03) and will not bediscussed herein.
This report begins with a description of the fundamental assumptions underlying the U.S.Nuclear Regulatory Commission's (NRC) modeling approach (see Chapter 3). A detaileddescription of the crack initiation model (with uncertainty treatment) and of the through-wallcracking model (with uncertainty treatment) follows; see Chapters 4 and 5, respectively.
2-1

F--
I 'I-Thru-Wall ICracking iModel L--L i
2-1 Schematic illustration of overall model used in the PTS reevaluation project
2-2

3 FUNDAMENTAL ASSUMPTIONS
The appropriateness of the probabilistic fracture mechanics (PFM) analysis performed byFAVOR to assess pressurized thermal shock (PTS) rests on the validity of the following fourfundamental assumptions:
(1) The U.S. Nuclear Regulatory Commission (NRC) assumes, in general, that linear elasticfracture mechanics (LEFM) is an appropriate methodology to use in assessing thestructural integrity of reactor pressure vessels (RPVs) subjected to PTS loadings, and,specifically, that FAVOR predictions of the fracture response of RPVs in response toPTS loading are accurate.
(2) The NRC assumes that the effects of crack growth by subcritical mechanisms (i.e.,environmentally assisted cracking and/or fatigue) is negligible, and consequently theflaw population of interest is that associated with initial vessel fabrication.
(3) The NRC assumes that the fracture toughness of the stainless steel cladding isadequately high, and remains adequately high even after irradiation, that there is nopossibility of failure of the cladding due to the loading imposed by PTS transients.
(4) The NRC assumes that stresses occur in sufficiently low locations in the vessel wall(between 3/8.twaii from the vessel inside diameter and the outside diameter) that theprobability of failure associated with postulated defects in this region does not need to becalculated because it is zero.
(5) The NRC assumes that if a particular transient does not achieve a temperature in thedowncomer below 204 IC (400 IF), then it does not contribute to the vessel failureprobability.
The following subsections discuss the appropriateness of each of these assumptions.
3.1 Use of Linear Elastic Fracture Mechanics
One fundamental assumption the NRC made in constructing the PFM model is that a linearelastic stress analysis of the vessel, and a consequent fracture integrity assessment using thetechniques of LEFM, is accurate. Evidence supporting the appropriateness of this assumptionis available in the following two areas:
(1) Appendix A summarizes the results of studies aimed at experimentally validating theappropriateness of LEFM techniques when assessing the integrity of nuclear pressurevessels under thermal shock and PTS experiments. The results of three series ofexperiments that Oak Ridge National Laboratory performed in the 1970s and 1980s onscaled pressure vessels demonstrate the accuracy of LEFM techniques in theseapplications.
3-1

(2) One of the fundamental requirements for LEFM "validity" is that the dimensions of theplastic zone at the tip of a loaded crack be very small as compared to the dimensions ofthe crack being assessed and the dimensions of the structure in which the crack resides(see Rolfe). Under these conditions, the errors introduced by plastic flow (which is notaccounted for within LEFM theories) are acceptably small. To assess plastic zone sizescharacteristic of the PTS problem, the NRC had the PFM code FAVOR report all of theapplied driving force to fracture (KAPPLIED) values from an analysis of Beaver Valley Unit 1at 60 effective full-power years (EFPYs) that contribute to the through-wall crackingfrequency (TWCF) (i.e., that have a conditional probability of crack initiation greater than0). The top graph in Figure 3-1 shows these KAPPLIED values overlaid on the KI, transitioncurve, while the bottom figure shows these same values expressed in the form of acumulative distribution function. The lower figure indicates that 90 percent of the KAPPLIED
values that contribute to the TWCF estimate lie between 22-39 MPa'im (20-35 ksibin).Using these stress intensity factor values, together with Irwin's equation for the plasticzone size under plane-strain conditions (see Rolfe), indicates that the plastic zone radiicharacteristic of PTS loading range from approximately 0.8-3.3 mm (0.03-0.13 in.),depending on the value of KAPPLIED (here taken to range from 22-39 MPaqm (20-35ksibin)) and the value of the yield strengths (here taken to be 483 MPa (70 ksi) onaverage for unirradiated materials and 621 MPa (90 ksi) on average for irradiatedmaterials). These values of plastic zone radii are certainly small as compared to thethickness of a pressurized-water reactor (PWR) vessel, indicating the appropriateness ofLEFM techniques. Moreover, it can be noted that as the vessel ages, irradiationdamage causes the yield strength to increase. Thus, as vessels approach end of life(EOL) and extended EOL conditions, LEFM techniques become, if anything, moreappropriate.
3.2 Assumption of No Subcritical Crack Growth
3.2.1 Caused by Environmental Mechanisms Acting on the Low Alloy PressureVessel Steel
Stress-corrosion cracking (SCC) requires the presence of an aggressive environment, asusceptible material, and a significant tensile stress. If these three requirements are met andSCC can occur, the growth of intrinsic surface flaws in a material is possible. Because anaccurate PTS calculation for the low-alloy steel (LAS) pressure vessel should address realisticflaw sizes, in principle, the potential for crack growth in the reactor vessel resulting from SCCneeds to be analyzed. However, for the reasons detailed the following paragraphs, SCC of LASin PWR environments is highly unlikely and, therefore, appropriately assumed not to occur forthe purposes of the FAVOR calculations reported herein.
The first line of defense against SCC of LAS is the cladding that covers much of the LASsurface area of the reactor vessel and main coolant lines. This prevents the environment fromcontacting the LAS, and therefore obviates any possibility of SCC of the pressure boundary.Additionally, several test programs have been conducted over the last three decades, all ofwhich show that in normal PWR or boiling-water reactor (BWR) operating environments, SCC inLAS cannot occur. The electrochemical potential (often called the free corrosion potential)controls SCC of LAS in the reactor coolant environment. The oxygen concentration in thecoolant is the main variable that controls the LAS electrochemical potential. During normaloperation of a PWR, the oxygen concentration is below 5 parts per billion (ppb). Theelectrochemical potential of LAS in this environment would not reach the value necessary to
3-2
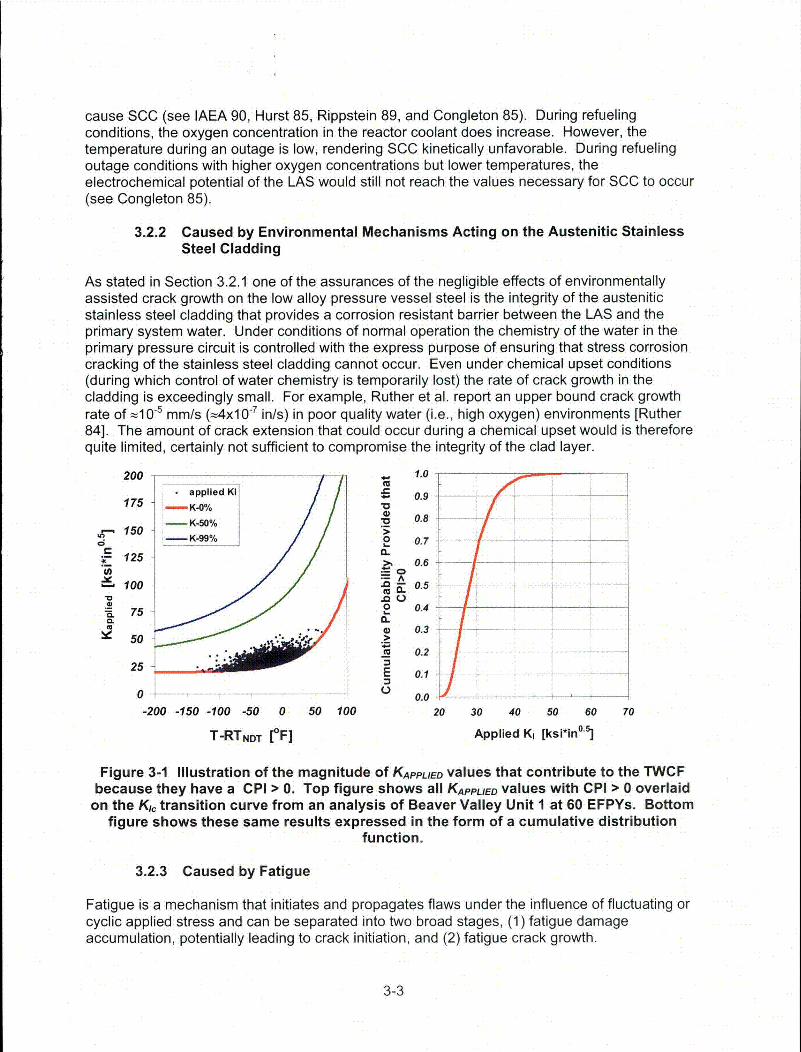
cause SCC (see IAEA 90, Hurst 85, Rippstein 89, and Congleton 85). During refuelingconditions, the oxygen concentration in the reactor coolant does increase. However, thetemperature during an outage is low, rendering SCC kinetically unfavorable. During refuelingoutage conditions with higher oxygen concentrations but lower temperatures, theelectrochemical potential of the LAS would still not reach the values necessary for SCC to occur(see Congleton 85).
3.2.2 Caused by Environmental Mechanisms Acting on the Austenitic StainlessSteel Cladding
As stated in Section 3.2.1 one of the assurances of the negligible effects of environmentallyassisted crack growth on the low alloy pressure vessel steel is the integrity of the austeniticstainless steel cladding that provides a corrosion resistant barrier between the LAS and theprimary system water. Under conditions of normal operation the chemistry of the water in theprimary pressure circuit is controlled with the express purpose of ensuring that stress corrosioncracking of the stainless steel cladding cannot occur. Even under chemical upset conditions(during which control of water chemistry is temporarily lost) the rate of crack growth in thecladding is exceedingly small. For example, Ruther et al. report an upper bound crack growthrate of -105 mm/s (--4x10⁻⁷ in/s) in poor quality water (i.e., high oxygen) environments [Ruther84]. The amount of crack extension that could occur during a chemical upset would is thereforequite limited, certainly not sufficient to compromise the integrity of the clad layer.
200 1.0 ,
1 appliedKI 0.90.175 -K-0% "
i K-50% f 0.8' 150 ">- K-99% 0 0.7
a- 125 0.6
100 ! 0.5
75 2 0.4. 50 A,.. " ,
.0.2
25 E 0.10 0.0
-200 -150 -100 -50 0 50 100 20 30 40 50 60 70
T-RTNDT [CF] Applied K, [ksi*ino°]
Figure 3-1 Illustration of the magnitude of KAPPLIED values that contribute to the TWCFbecause they have a CPI > 0. Top figure shows all KAPPLIED values with CPI > 0 overlaid
on the K1, transition curve from an analysis of Beaver Valley Unit 1 at 60 EFPYs. Bottomfigure shows these same results expressed in the form of a cumulative distribution
function.
3.2.3 Caused by Fatigue
Fatigue is a mechanism that initiates and propagates flaws under the influence of fluctuating orcyclic applied stress and can be separated into two broad stages, (1) fatigue damageaccumulation, potentially leading to crack initiation, and (2) fatigue crack growth.
3-3

Fatigue is influenced by variables that include mean stress, stress range, environmentalconditions, and surface roughness and temperature. Thermal fatigue can also occur as thermalstresses develop when a material is heated or cooled. Generally, fatigue failures occur atstresses having a maximum value less than the yield strength of the material. The process offatigue damage accumulation, crack initiation, and crack growth is closely related to thephenomenon of slip resulting from static shear stress. Following a period of fatigue damageaccumulation, crack initiation will occur by the progressive development and linking up ofintrusions along slip bands or grain boundaries. Growth of these initiated cracks includesfracture deformation sequences, plastic blunting followed by resharpening of the crack tip, andalternate slip processes.
The PWR vessel is specifically designed so that all of its components satisfy the fatigue designrequirements of the American Society of Mechanical Engineer (ASME) Code Section III, orequivalent. Several studies have shown that the 60-year anticipated fatigue "usage" of thevessel beltline region resulting from normal plant operations, including plant heatup/cooldownand design-basis transients, is low, such that fatigue-initiated cracks will not occur. Similarly,fatigue loading of the vessel is considered insufficient to result in propagation of any existingfabrication defects (see EPRI 94, Kasza 96, and Kahleel 00).
3.3 Assumption that the Stainless Steel Cladding will not Fail as a Result of theLoads Applied by PTS
Stainless steel, even in the clad form, typically exhibits initiation fracture resistance (JI, and J-R)values that far exceed those of the ferritic steels from which the wall of the RPV is made (see[Bass 04] for cladding data, and see Section 5.2.2 for ferritic steel data). This is especially truefor the levels of embrittlement at which vessel failure becomes a (small) probability because, atthe fluences characteristic of the vessel inner diameter location, the fracture toughness of ferriticsteels can be considerably degraded by neutron damage while the fracture toughness ofaustenitic stainless steels are essentially unaffected by these same levels of irradiation damage[Chopra 05]. This high toughness of the stainless steel cladding coupled with the smallcharacteristic size of defects found in the cladding [Simonen 04] justifies the assumption that thestainless steel cladding will not fail as a result of the loads applied by PTS.
3.4 Noncontribution of Flaws Deep in the Vessel Wall to Vessel FailureProbability
The FAVOR flaws simulated to exist further than 3 18"tWALL from the inner diameter surface areeliminated, a priori, from further analysis. This screening criterion is justified based ondeterministic fracture mechanics analyses which demonstrate that for the embrittlement andloading conditions characteristic of PTS, such flaws have zero probability of crack initiation. Asillustrated in Figure 3-2, in practice crack initiation almost always occurs from flaws that havingtheir inner crack tip located within 0.2"tWALL of the inner diameter, further substantiating theappropriateness of eliminating cracks deeper than 3 18"tWALL from further analysis.
3.5 Noncontribution of Certain Transients to Vessel Failure Probability
When running a plant-specific analysis using FAVOR, the NRC only calculates the conditionalprobability of through-wall cracking (CPTWC) for thermal hydraulic (TH) transients that reach aminimum temperature at or below 204 °C (400 OF). Experience and deterministic calculations
3-4

justify this a priori elimination of transients, and demonstrate that such transients lack adequateseverity to have nonzero values of CPTWC, even for very large flaws and for very large degreesof embrittlement. Additionally, the results of the NRC's plant-specific analyses (see Chapter 8of EricksonKirk 04a) show that a minimum transient temperature of 178 0C (352 OF) must bereached before CPTWC rises above zero, validating that the elimination of transients withminimum temperatures above 204 0C (400 OF) does not influence the results in any way.
88 * Beaver Valley at 200 EFPY.
4 4oPalisaest Watl 500 cnesEfrmI
FiiA
0
0
0.000 0.125 0.250 0.375
Percent Wall Thickness from ID
Figure 3-2 Distribution of crack initiating depths generated by FAVOR Version 3.1
3-5

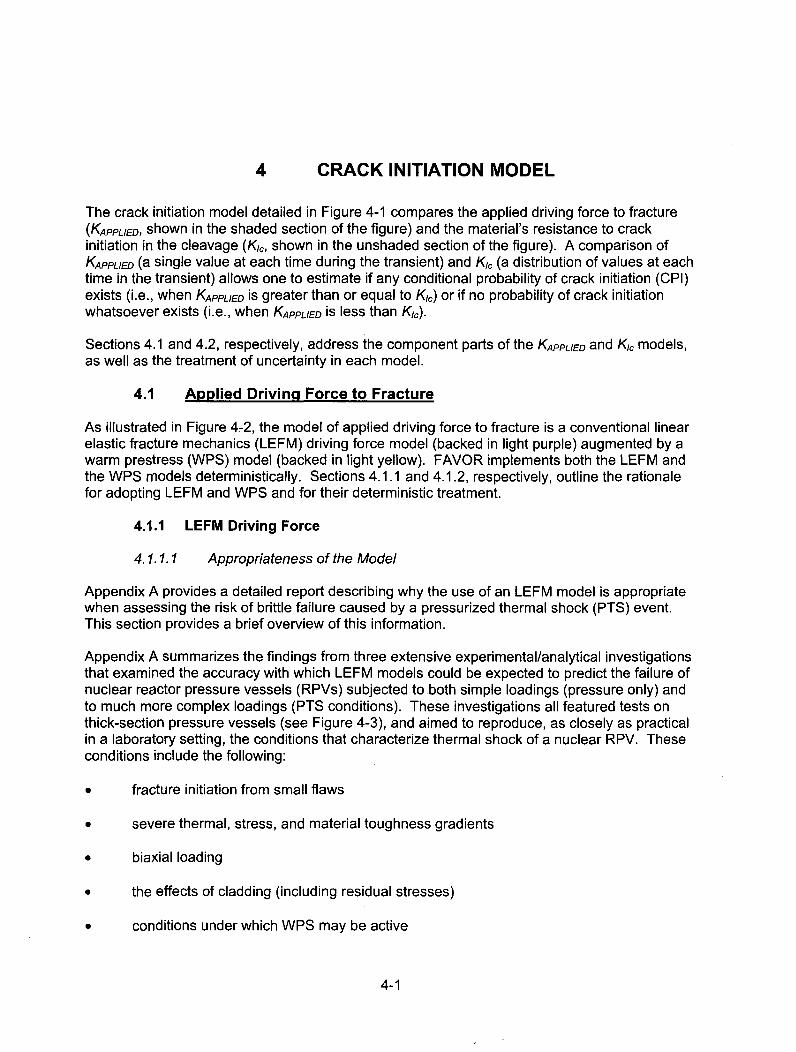
4 CRACK INITIATION MODEL
The crack initiation model detailed in Figure 4-1 compares the applied driving force to fracture(KAppLIED, shown in the shaded section of the figure) and the material's resistance to crackinitiation in the cleavage (Kl,, shown in the unshaded section of the figure). A comparison ofKAPpLIED (a single value at each time during the transient) and KI, (a distribution of values at eachtime in the transient) allows one to estimate if any conditional probability of crack initiation (CPI)exists (i.e., when KAPPLIED is greater than or equal to Kl,) or if no probability of crack initiationwhatsoever exists (i.e., when KAPPLED is less than K1,).
Sections 4.1 and 4.2, respectively, address the component parts of the KAPPLIED and Kc models,
as well as the treatment of uncertainty in each model.
4.1 Applied Driving Force to Fracture
As illustrated in Figure 4-2, the model of applied driving force to fracture is a conventional linearelastic fracture mechanics (LEFM) driving force model (backed in light purple) augmented by awarm prestress (WPS) model (backed in light yellow). FAVOR implements both the LEFM andthe WPS models deterministically. Sections 4.1.1 and 4.1.2, respectively, outline the rationalefor adopting LEFM and WPS and for their deterministic treatment.
4.1.1 LEFM Driving Force
4.1.1.1 Appropriateness of the Model
Appendix A provides a detailed report describing why the use of an LEFM model is appropriatewhen assessing the risk of brittle failure caused by a pressurized thermal shock (PTS) event.This section provides a brief overview of this information.
Appendix A summarizes the findings from three extensive experimental/analytical investigationsthat examined the accuracy with which LEFM models could be expected to predict the failure ofnuclear reactor pressure vessels (RPVs) subjected to .both simple loadings (pressure only) andto much more complex loadings (PTS conditions). These investigations all featured tests onthick-section pressure vessels (see Figure 4-3), and aimed to reproduce, as closely as practicalin a laboratory setting, the conditions that characterize thermal shock of a nuclear RPV. Theseconditions include the following:
0 fracture initiation from small flaws
0 severe thermal, stress, and material toughness gradients
* biaxial loading
* the effects of cladding (including residual stresses)
* conditions under which WPS may be active
4-1

combined stress and toughness gradient conditions that can promote crack initiation,arrest, reinitiation, and rearrest all during the same transient
the possibility of the conversion of the fracture mode from cleavage to ductile and backagain all during the same thermal hydraulic (TH) transient, resulting from these variousgradients
The three test series were as follows:
(1) The first series of tests were 10 intermediate test vessels (ITVs), 3 with cracks locatedat a cylindrical nozzle and 7 with cracks remote from any geometric discontinuities.These tests were aimed at investigating the ability of LEFM to predict the fractureresponse of thick-section vessels containing relatively deep flaws (20-83 percent of the6-in. thick vessel wall) at test temperatures ranging from lower shelf to upper shelf.Tests included a variety of nuclear grade RPV plates, forgings, and weldments.
(2) The second series of tests were eight thermal shock experiments (TSEs). Theseexperiments investigated the behavior of surface cracks under thermal shock conditionssimilar to those that would be encountered during a large-break loss-of-coolant accident(LBLOCA) (i.e., a rapid cooldown in the absence of internal pressure).
(3) The third series of tests included two experiments that subjected ITV specimens toconcurrent pressure and thermal transients. These pressurized thermal shockexperiments (PTSEs) simulated the effects of a rapid cooldown transient combined withsignificant internal pressure. Thus, these experiments simulated TH conditionscharacteristic of smaller break loss-of-coolant accidents (LOCAs).
These investigations support the following conclusions:
ITV experiments
- The LEFM analyses very closely predicted actual fracture pressures for thick-wallpressure vessels.
- Methods for calculating fracture toughness from small specimens weresuccessfully used in applications of fracture analysis of thick, flawed vessels.
* thermal shock experiments
- Multiple initiation-arrest events with deep penetration into the vessel wall werepredicted and observed.
- Surface flaws that were initially short and shallow were predicted and observedto grow considerably in length before increasing significantly in depth.
- WPS limited crack extension through the wall under LOCA conditions.
- Small-specimen fracture mechanics data successfully predicted the fracturebehavior of thick pressure vessels
4-2

AlI
ICRACKTIMPERTUREISHIFT
- - --
UFORCEIAEDODEEL
•[• l TEMPERATURE MODEL I
Figure 4-1 Schematic illustration of the crack initiation model used in the PTSreevaluation project
4-3
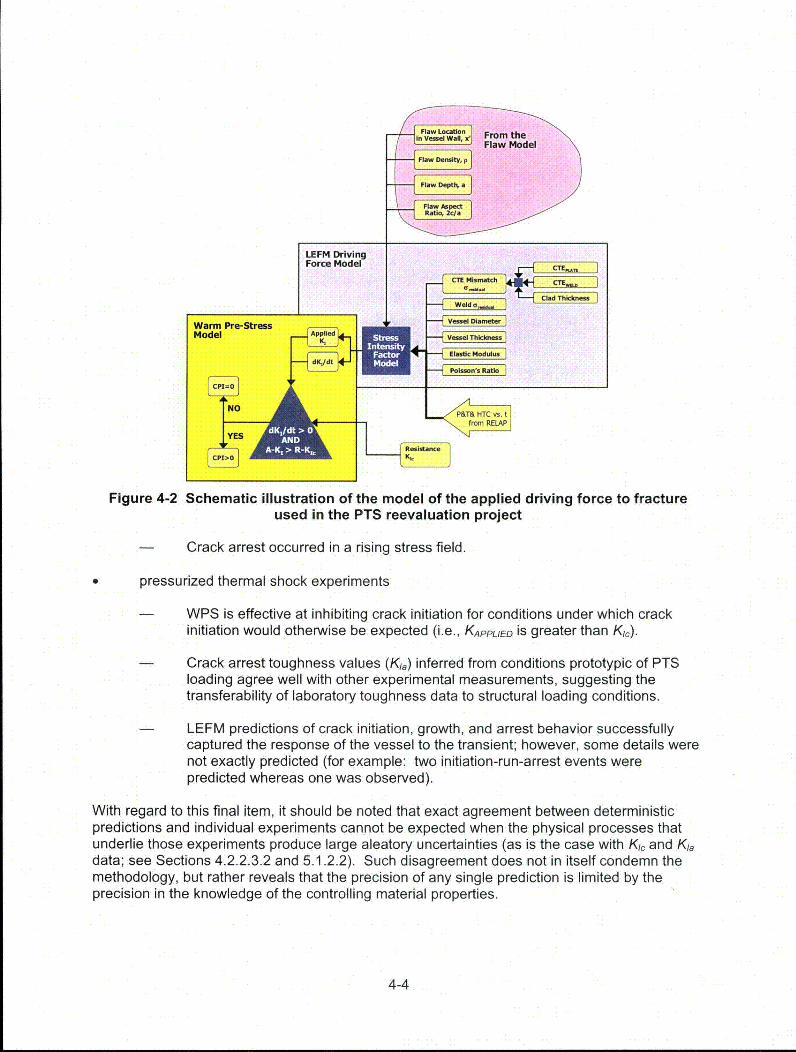
Figure 4-2 Schematic illustration of the model of the applied driving force to fractureused in the PTS reevaluation project
- Crack arrest occurred in a rising stress field.
pressurized thermal shock experiments
- WPS is effective at inhibiting crack initiation for conditions under which crackinitiation would otherwise be expected (i.e., KAPPLIED is greater than KI,).
- Crack arrest toughness values (Kia) inferred from conditions prototypic of PTSloading agree well with other experimental measurements, suggesting thetransferability of laboratory toughness data to structural loading conditions.
- LEFM predictions of crack initiation, growth, and arrest behavior successfullycaptured the response of the vessel to the transient; however, some details werenot exactly predicted (for example: two initiation-run-arrest events werepredicted whereas one was observed).
With regard to this final item, it should be noted that exact agreement between deterministicpredictions and individual experiments cannot be expected when the physical processes thatunderlie those experiments produce large aleatory uncertainties (as is the case with KI, and KIadata; see Sections 4.2.2.3.2 and 5.1.2.2). Such disagreement does not in itself condemn themethodology, but rather reveals that the precision of any single prediction is limited by theprecision in the knowledge of the controlling material properties.
4-4
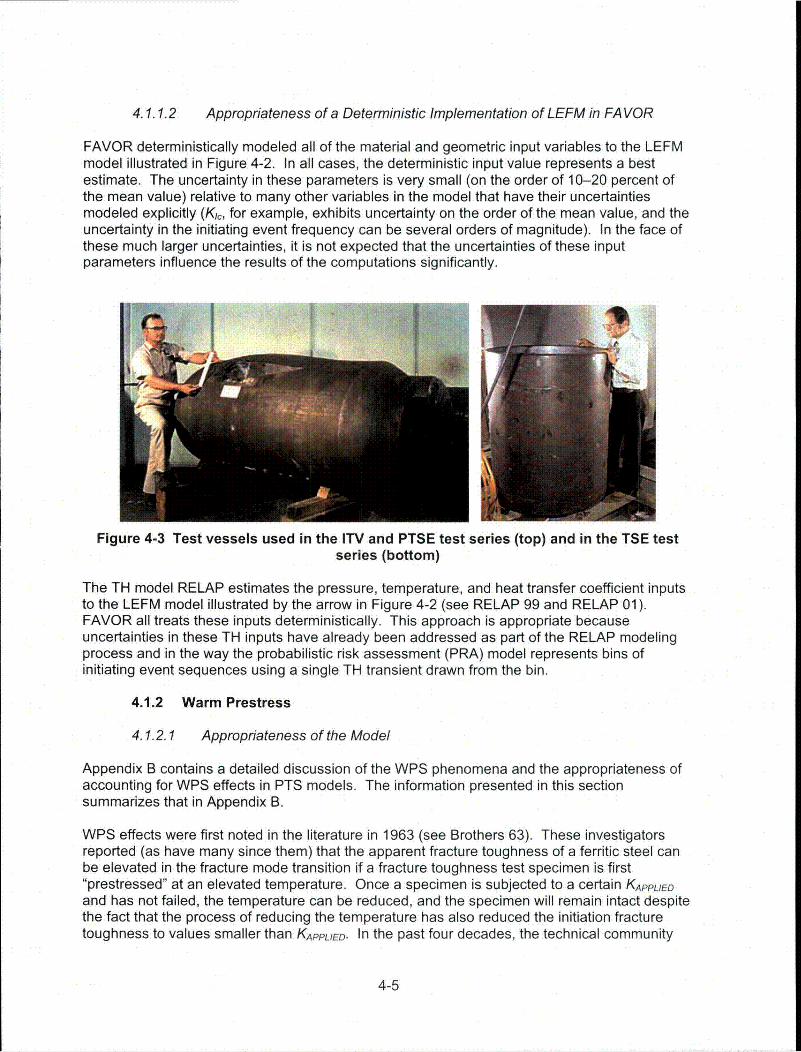
4.1.1.2 Appropriateness of a Deterministic Implementation of LEFM in FAVOR
FAVOR deterministically modeled all of the material and geometric input variables to the LEFMmodel illustrated in Figure 4-2. In all cases, the deterministic input value represents a bestestimate. The uncertainty in these parameters is very small (on the order of 10-20 percent ofthe mean value) relative to many other variables in the model that have their uncertaintiesmodeled explicitly (Kic, for example, exhibits uncertainty on the order of the mean value, and theuncertainty in the initiating event frequency can be several orders of magnitude). In the face ofthese much larger uncertainties, it is not expected that the uncertainties of these inputparameters influence the results of the computations significantly.
Figure 4-3 Test vessels used in the ITV and PTSE test series (top) and in the TSE testseries (bottom)
The TH model RELAP estimates the pressure, temperature, and heat transfer coefficient inputsto the LEFM model illustrated by the arrow in Figure 4-2 (see RELAP 99 and RELAP 01).FAVOR all treats these inputs deterministically. This approach is appropriate becauseuncertainties in these TH inputs have already been addressed as part of the RELAP modelingprocess and in the way the probabilistic risk assessment (PRA) model represents bins ofinitiating event sequences using a single TH transient drawn from the bin.
4.1.2 Warm Prestress
4.1.2.1 Appropriateness of the Model
Appendix B contains a detailed discussion of the WPS phenomena and the appropriateness ofaccounting for WPS effects in PTS models. The information presented in this sectionsummarizes that in Appendix B.
WPS effects were first noted in the literature in 1963 (see Brothers 63). These investigatorsreported (as have many since them) that the apparent fracture toughness of a ferritic steel canbe elevated in the fracture mode transition if a fracture toughness test specimen is first"prestressed" at an elevated temperature. Once a specimen is subjected to a certain KAPPLIED
and has not failed, the temperature can be reduced, and the specimen will remain intact despitethe fact that the process of reducing the temperature has also reduced the initiation fracturetoughness to values smaller than KAPPLIED. In the past four decades, the technical community
4-5
has identified, researched thoroughly, and agreed upon the physical mechanisms responsiblefor WPS.
As illustrated in Figure 4-4, KAPPLIED first increases and then decreases as LOCA transientsproceed, with the time of peak KAPPLIED varying, depending on both the severity of the transientand the location of the crack in the vessel wall. It is the latter part of the transient when KAPPLIED
decreases with time that is of interest in the context of WPS. If the KAPPLIED value generated bya LOCA were to enter the temperature-dependent distribution of initiation fracture toughnessvalues during the falling portion of the transient, then the WPS phenomenon suggests that crackinitiation will not occur even though KAPPLIED exceeds the initiation fracture toughness of thematerial (see Figure 4-5).
In the past, probabilistic calculations performed in the United States to assess the challenge toRPV integrity posed by PTS events have not included WPS as part of the probabilistic fracturemechanics (PFM) model (see SECY-82-465, ORNL 85a, ORNL 85b, and ORNL 86), in spite ofbroad consensus in the technical community that WPS is a real phenomena having a soundphysical basis. Idealizations in both the TH and PRA models prompted the exclusion of WPSfrom PFM models. As a consequence of these idealizations it was possible that the modelscould incorrectly represent a situation when WPS would not occur as a situation in which itcould occur, which is a non-conservative error. The information in Appendix B demonstratesthat the much more detailed PRA and TH models adopted as part of this PTS reevaluation efforteliminate this concern, now making inclusion of WPS appropriate.
ORNI-DWGI85-439B ETD
2.
TIME I...)
Figure 4-4 Illustration of the influence of crack depth on the variation of KAPPLIED VS. timeresulting from an LBLOCA (Cheverton 85)
4.1.2.2 Appropriateness of a Deterministic Implementation of WPS in FAVOR
Factors affecting the WPS model include only the crack driving force (KAPPLIED) and the fracturetoughness (Kl,). These models, and the appropriate treatment of uncertainty in each, appear
4-6

elsewhere in this report (see Sections 4.1.1 and 4.2). An independent treatment of uncertaintyin the WPS model is therefore not necessary.
Min. KI,
Kapplied
Mi Icin. K1cI No WPS
Pop time P time
Figure 4-5 Schematic diagram illustrating how the WPS effect could be active during aLOCA depending on the combination of the transient and the position of the crack within
the vessel wall
4.2 Resistance to Crack Initiation in Cleavage
As illustrated in Figure 4-6, the model of the resistance of a ferritic RPV steel to crack initiationin cleavage includes four major components:
(1) an unirradiated index temperature model(2) a toughness transition model(3) an index temperature shift model(4) an interface model
As suggested by these names, the idea of using an index temperature approach to thecharacterization of ferritic steel fracture toughness and irradiation damage is central to the U.S.Nuclear Regulatory Commission's (NRC) computational approach. Therefore, Section 4.2.1presents the evidence supporting an index temperature characterization. Section 4.2.2 usesthis information to construct both the unirradiated index temperature model and the toughnesstransition model. This is followed by Section 4.2.3, which addresses the index temperature shiftmodel, and by Section 4.2.4, which addresses the interface model.
4.2.1 Index Temperature Approaches to Characterizing the Transition FractureToughness of Ferritic Steels
The use of index temperature approaches to characterize the transition fracture (cleavagefracture toughness) properties of ferritic steels pervades the literature, dating back to the late1940s. Qualitative uses of index temperature approaches derive from the observation of atemperature at which the steel transitions from brittle behavior (at lower temperatures) to ductilebehavior (at higher temperatures). These approaches have been applied to characterize thefracture performance of both laboratory specimens (e.g., the Charpy V-notch (CVN) specimen(see ASTM E23), the nil ductility transition (NDT) specimen (see ASTM E208)), as well as full-scale structures (e.g., liberty ships (see Pellini 76)).
More recently, index temperatures have been incorporated into characterizations of fracturetoughness, such as the ASME Kc and KIa curves, which use the fracture toughness transition
4-7
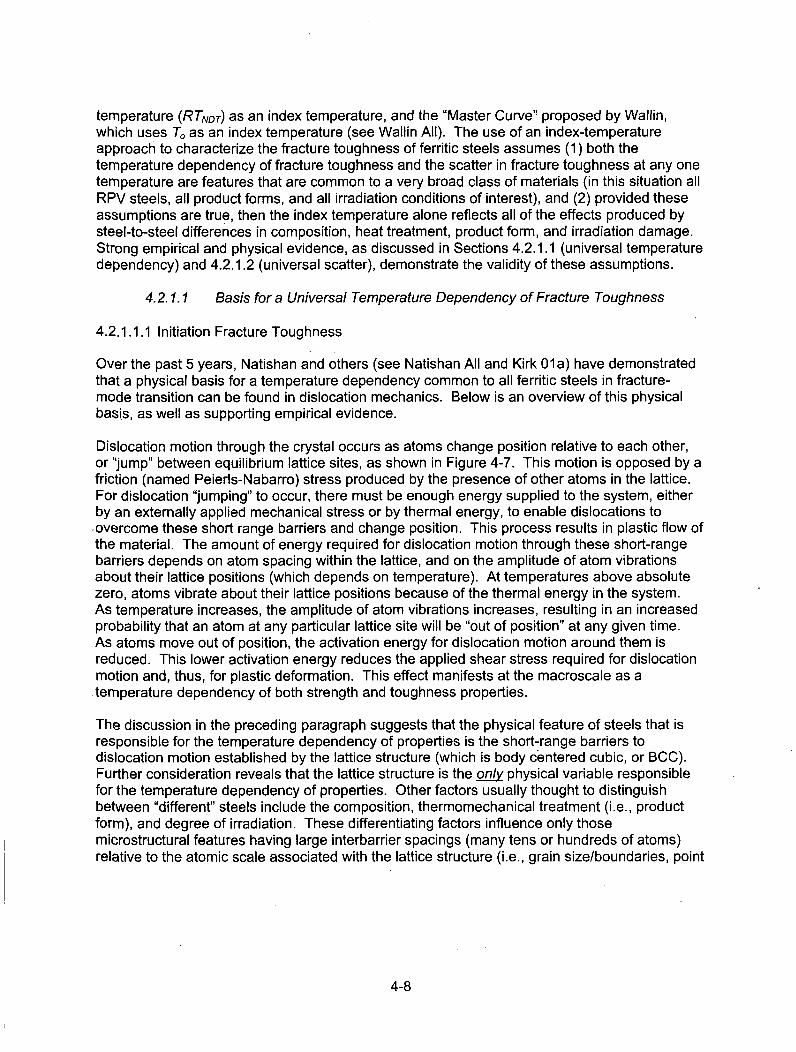
temperature (RTNDT) as an index temperature, and the "Master Curve" proposed by Wallin,which uses T, as an index temperature (see Wallin All). The use of an index-temperatureapproach to characterize the fracture toughness of ferritic steels assumes (1) both thetemperature dependency of fracture toughness and the scatter in fracture toughness at any onetemperature are features that are common to a very broad class of materials (in this situation allRPV steels, all product forms, and all irradiation conditions of interest), and (2) provided theseassumptions are true, then the index temperature alone reflects all of the effects produced bysteel-to-steel differences in composition, heat treatment, product form, and irradiation damage.Strong empirical and physical evidence, as discussed in Sections 4.2.1.1 (universal temperaturedependency) and 4.2.1.2 (universal scatter), demonstrate the validity of these assumptions.
4.2.1.1 Basis for a Universal Temperature Dependency of Fracture Toughness
4.2.1.1.1 Initiation Fracture Toughness
Over the past 5 years, Natishan and others (see Natishan All and Kirk 01 a) have demonstratedthat a physical basis for a temperature dependency common to all ferritic steels in fracture-mode transition can be found in dislocation mechanics. Below is an overview of this physicalbasis, as well as supporting empirical evidence.
Dislocation motion through the crystal occurs as atoms change position relative to each other,or "jump" between equilibrium lattice sites, as shown in Figure 4-7. This motion is opposed by afriction (named Peierls-Nabarro) stress produced by the presence of other atoms in the lattice.For dislocation "jumping" to occur, there must be enough energy supplied to the system, eitherby an externally applied mechanical stress or by thermal energy, to enable dislocations to
.overcome these short range barriers and change position. This process results in plastic flow ofthe material. The amount of energy required for dislocation motion through these short-rangebarriers depends on atom spacing within the lattice, and on the amplitude of atom vibrationsabout their lattice positions (which depends on temperature). At temperatures above absolutezero, atoms vibrate about their lattice positions because of the thermal energy in the system.As temperature increases, the amplitude of atom vibrations increases, resulting in an increasedprobability that an atom at any particular lattice site will be "out of position" at any given time.As atoms move out of position, the activation energy for dislocation motion around them isreduced. This lower activation energy reduces the applied shear stress required for dislocationmotion and, thus, for plastic deformation. This effect manifests at the macroscale as atemperature dependency of both strength and toughness properties.
The discussion in the preceding paragraph suggests that the physical feature of steels that isresponsible for the temperature dependency of properties is the short-range barriers todislocation motion established by the lattice structure (which is body centered cubic, or BCC).Further consideration reveals that the lattice structure is the onl/ physical variable responsiblefor the temperature dependency of properties. Other factors usually thought to distinguishbetween "different" steels include the composition, thermomechanical treatment (i.e., productform), and degree of irradiation. These differentiating factors influence only thosemicrostructural features having large interbarrier spacings (many tens or hundreds of atoms)relative to the atomic scale associated with the lattice structure (i.e., grain size/boundaries, point
4-8

I RqGel. Cak.
* GlobalD Fluence
U ncerta inty
I
[--CF _J At Flaw
Uncetainy ALocalFlAence
IUI INTERFACEUR SHF 6D=
TUncertainty
Ir I MODEL i
Ras ~ ~ I.~o I /Ui" 1 DIDN
Figure 4-6 Schematic illustration of the model of the crack initiation toughness used inthe PTS reevaluation project
4-9
III

defects, inclusions, precipitates, and dislocation substructures). Factors that produce onlychanges in large interbarrier spacings cannot influence on the temperature dependency ofmechanical properties because the magnitude of lattice atom vibration that is influenced bytemperature is not sufficient to affect the ease with which dislocations can travel around barriershaving interatomic spacings larger than the atoms themselves. Thus, the myriad of factorsnormally thought of as differentiating steels from each other (e.g., composition,thermomechanical treatment, and irradiation) are not expected to have any influence on thetemperature dependency of toughness in fracture mode transition; instead, they are seen toaffect only the transition index temperature.
The work of Natishan et al. summarized in the preceding paragraphs demonstrates physical abasis for the expectation that all BCC materials should exhibit an identical temperaturedependency, and that factors such as chemical composition, thermomechanical processing(product form), and level of irradiation damage should have no influence on this item. Empiricalassessments employing large databases of both RPV steels and other ferritic steels (see Wallin89, Sokolov 96, and Kirk 98) have validated these expectations. By way of example, Figure 4-8and Figure 4-9 demonstrate the insignificance of both product form and radiation damage levelin establishing the temperature dependency of fracture toughness, in agreement with thetheoretical basis put forth by Natishan and co-workers.
Externally appliedmechanical stress
Externally appliedmechanical stress
Lattice vibration due tothermal energy
Figure 4-7 Illustration of the combined effects of mechanical stress and thermal energyon the ability of atoms to jump between equilibrium lattice sites
4.2.1.1.2 Arrest Fracture Toughness
Crack arrest occurs when dislocations can move faster than the crack propagates, whichcauses crack tip blunting and, thereby, arrest. Dislocation mobility therefore controls the abilityof a ferritic steel to arrest a running cleavage crack, and thus its crack arrest toughness. Theatomic lattice structure is the only feature of the material that controls the temperature-dependence of the material properties that are controlled by dislocation motion. Consequently,as was the case for crack initiation toughness, the temperature dependency of crack arresttoughness depends only on the short-range barriers to dislocation motion established by theBCC lattice structure. Other features that vary with steel composition, heat treatment, andirradiation include grain size/boundaries, point defects, inclusions, precipitates, and dislocationsubstructures. These features all influence dislocation motion, and thereby both strength andtoughness, but their large interbarrier spacing relative to the atomic scale associated with thelattice structure makes these effects completely athermal. This understanding suggests that themyriad of metallurgical factors that can influence absolute strength and toughness values, andthereby the transition temperature, exert no control over the temperature dependency of arresttoughness in fracture mode transition. Additionally, since KI, and Kla both depend on the abilityof the material to absorb energy by means of dislocation motion, KI, and KIa are both expectedto exhibit a similar temperature dependence (see Kirk 02a). As was the case with crackinitiation toughness, available empirical evidence demonstrates that the crack arrest toughness
4-10

600
I-
Unirradiated RPV Steels
500 (3.120 E1921 Valid K , V.al.u)
o Forging
400 o WeldA Plate
300 ..... 99% Upper Tolerence Bound
-00Median
1% Lower Tolerence Bound
*0A
13
a
200
100
0
-300 -200 -100 0 100 200
T- To [OF]
Figure 4-8 Illustration of the effect of product form on transition fracture toughnesstemperature dependency
Soo
400
300
'2 200
W
100
0.300
500
!Unirradgatd O rU dls d.T. fro .75F- 50j-~ 4~
3,
O2.
00
00
00
00 00
00-
0- -
-300 .200 -100 0 100
T-To [*F]
-200 .100 0
T-T. [rF]
200100 300 200 300
400
300
200
10--t00
500
OnUrad. dOTolron100.50
0
0 0
DTO. fr- 250F - 400FX-- 400
300
200
C-Fd100
O
O0
0-
100 200 300 -300 100 200 300-300 -200 .100 0
T-T. [rF]
.200 -100
T-T. ('F]
Figure 4-9 Illustration of the effect of radiation damage level on transition fracturetoughness temperature dependency
4-11

250
2 a=18% N 72WVTr=-13 0C
200 72W Irr. T• =+76°C
r-"A 73WTrQ=-14 0C
E 150' 73WIrr. T -. =+70'C
e, PTSE1 T=+1080C)
~0100 . PTSE 2 T w.=+70 °C
0 15X2MVOAT ,,=+170C
95% A° 18X2MWA T •=+47°C
V HSST02T(JA=+24°C
0•-150 -100 -50 0 50
T-Tlia [°C]
Figure 4-10 Crack arrest transition curves for nine heats of RPV steel. The mean curvehas the same temperature dependence as the Master Curve for crack initiation data (i.e.,
Kia =30+70.exp{o.o19[T-Tra]} (Wallin 97))
of many different ferritic steels can be described by a common temperature dependency
(see Wallin 97), as shown in Figure 4-10.
4.2.1.2 Basis for a Universal Scatter in Fracture Toughness
4.2.1.2.1 Initiation Fracture Toughness
Cleavage cracks initiate when the dislocations accumulated at noncoherent particles or otherbarriers to dislocation motion (e.g., carbides, grain boundaries, and twin boundaries) generatesufficient strain to elevate the local stress at the barrier above that needed to fracture the barrieror cause its decohesion from the matrix. These barriers are distributed in a random fashionthroughout the BCC iron lattice. The interaction of these randomly distributed barriers with thevarying stress field along the crack front gives rise to the experimentally observed scatter intoughness data.
In order for fracture to occur by cleavage, high stress triaxiality is necessary to inhibit crack-tipblunting by dislocation motion. Thus, for cleavage to occur, the stress fields must be in a stateof small-scale yielding (SSY). High triaxiality occurs under SSY conditions because the crack-tip stress field is not affected by the specimen boundaries. This means that dislocations arefully contained within a finite volume at the crack tip and cannot escape to blunt the crack ordissipate energy. Under SSY conditions, the volume in which dislocations are moving can bedescribed relative only to the length L=(K/cry)2, making the total volume of the plastic fractureprocess zone proportional to L2_B, or (substituting for L) proportional to K,4. Since the probabilityof failure by cleavage is the complement of the joint probability of nonfailure of all the volumeelements sampled by the crack-tip stress fields, the probability of failure must scale in proportionto the plastically deformed volume and, consequently, in proportion to K14. Thus, the scatter in
4-12
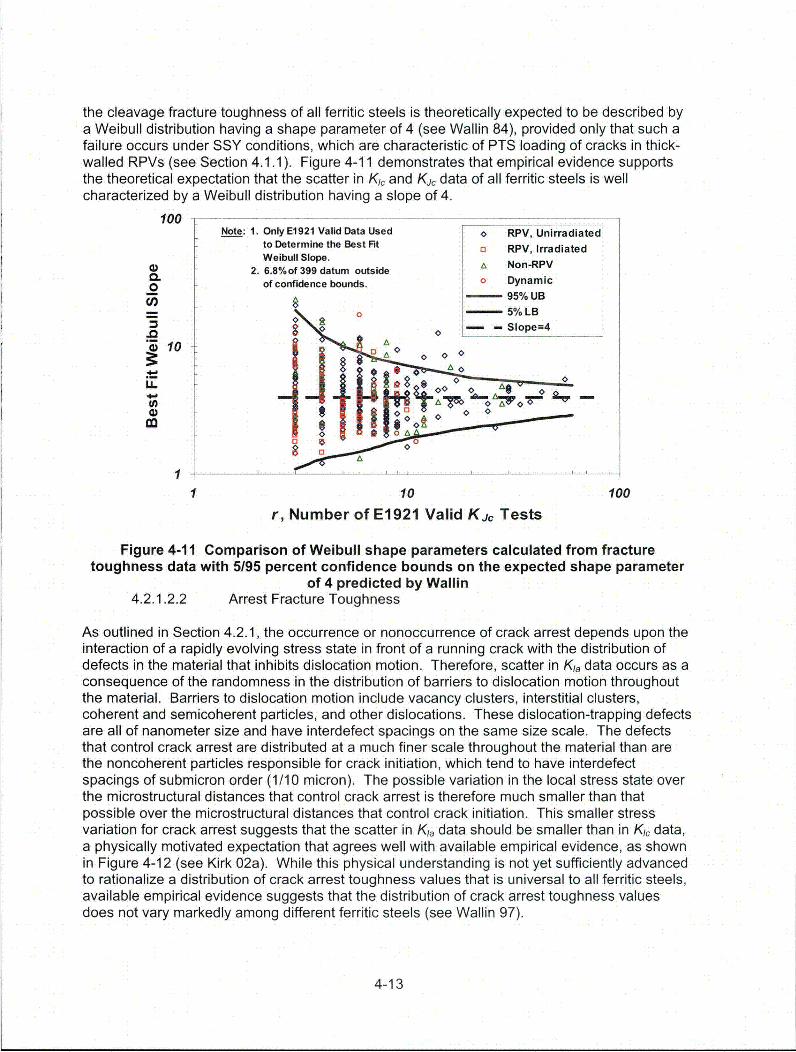
the cleavage fracture toughness of all ferritic steels is theoretically expected to be described bya Weibull distribution having a shape parameter of 4 (see Wallin 84), provided only that such afailure occurs under SSY conditions, which are characteristic of PTS loading of cracks in thick-walled RPVs (see Section 4.1.1). Figure 4-11 demonstrates that empirical evidence supportsthe theoretical expectation that the scatter in Kc and Kj, data of all ferritic steels is wellcharacterized by a Weibull distribution having a slope of 4.
10 0 . . . . . .. . . ..Note: 1. Only El921 Valid Data Used o RPV, Unirradiated
to Determine the Best Rt a RPV, IrradiatedWeibull Slope.
2. 6.8%of 399 datum outside 0 Non-RPV0 of confidence bounds. o Dynamic
O -- 95% UB
o - 5%LB
0- -, Slope=4
10 0A0
" -
1 10 100
r, Number of E1921 Valid Kj, Tests
Figure 4-11 Comparison of Weibull shape parameters calculated from fracturetoughness data with 5/95 percent confidence bounds on the expected shape parameter
of 4 predicted by Wallin4.2.1.2.2 Arrest Fracture Toughness
As outlined in Section 4.2.1, the occurrence or nonoccurrence of crack arrest depends upon theinteraction of a rapidly evolving stress state in front of a running crack with the distribution ofdefects in the material that inhibits dislocation motion. Therefore, scatter in KIa data occurs as aconsequence of the randomness in the distribution of barriers to dislocation motion throughoutthe material. Barriers to dislocation motion include vacancy clusters, interstitial clusters,coherent and semicoherent particles, and other dislocations. These dislocation-trapping defectsare all of nanometer size and have interdefect spacings on the same size scale. The defectsthat control crack arrest are distributed at a much finer scale throughout the material than arethe noncoherent particles responsible for crack initiation, which tend to have interdefectspacings of submicron order (1/10 micron). The possible variation in the local stress state overthe microstructural distances that control crack arrest is therefore much smaller than thatpossible over the microstructural distances that control crack initiation. This smaller stressvariation for crack arrest suggests that the scatter in K1, data should be smaller than in K1, data,a physically motivated expectation that agrees well with available empirical evidence, as shownin Figure 4-12 (see Kirk 02a). While this physical understanding is not yet sufficiently advancedto rationalize a distribution of crack arrest toughness values that is universal to all ferritic steels,available empirical evidence suggests that the distribution of crack arrest toughness valuesdoes not vary markedly among different ferritic steels (see Wallin 97).
4-13

4.2.2 Unirradiated Index Temperature and Transition Temperature Models
This section discusses models for unirradiated index temperatures and associated toughnesstransition models. Discussions of these two major parts of the crack initiation model are linkedbecause index temperatures can only be discussed in the context of the characterization oftransition fracture toughness from which they are derived. This discussion includes the RTNDT
model (see Section 4.2.2.1) as well as a best-estimate model enabled by the understandingsdetailed in Section 4.2.1 (see Section 4.2.2.2). Section 4.2.2.3 concludes with a description ofhow the NRC uses the best-estimate model together with RTNDT to develop index temperatureand toughness transition models for FAVOR, based on RTNDT. Section 4.2.2.3 also includes adiscussion of the classification and quantification of uncertainty associated with these FAVORmodels.
250 250
0 LEFM Valid
200- 5%.LB 2W a=18%- Median0
-95% UB 0
5 50550 0 . 0
-150 -100 -50 0 50-150 _1oo -50 0 50 -5 10 -0 0 5
T-To [-C] T-T10a [°C]Figure 4-12 Comparison of scatter in crack initiation data (left) and in crack arrest data(right). Note that these figures are to the same scale, and that the median/mean curves
have the same temperature dependence (i.e., 30 + 70. exp{0.019[T - TN,})
4.2.2.1 Current Model for Index Temperature (RTNDT)
RTNDT is the index temperature used to position the American Society of Mechanical Engineers(ASME) KI, and K1a curves. However, as Section 4.2.2.1.1 describes, the development and useof RTNDT can be traced back to studies of brittle fractures in ship steels, considerably predatingits use by ASME to characterize nuclear RPV steels. Section 4.2.2.1.2 goes on to describeprocedures for RTNOT estimation that have been developed specifically for the characterizationof nuclear RPV steels.
4.2.2.1.1 Historical Origins of RTNDT
Section 4.2.1 demonstrated that the physical processes responsible for cleavage fractureinitiation and arrest in ferritic steels make it possible to characterize the complete crack initiationand crack arrest transition fracture toughness behavior based only on an index temperature thatlocates the crack initiation transition curve on the temperature axis. While the physicalunderstanding supporting the theoretical appropriateness of this approach has emerged only
4-14
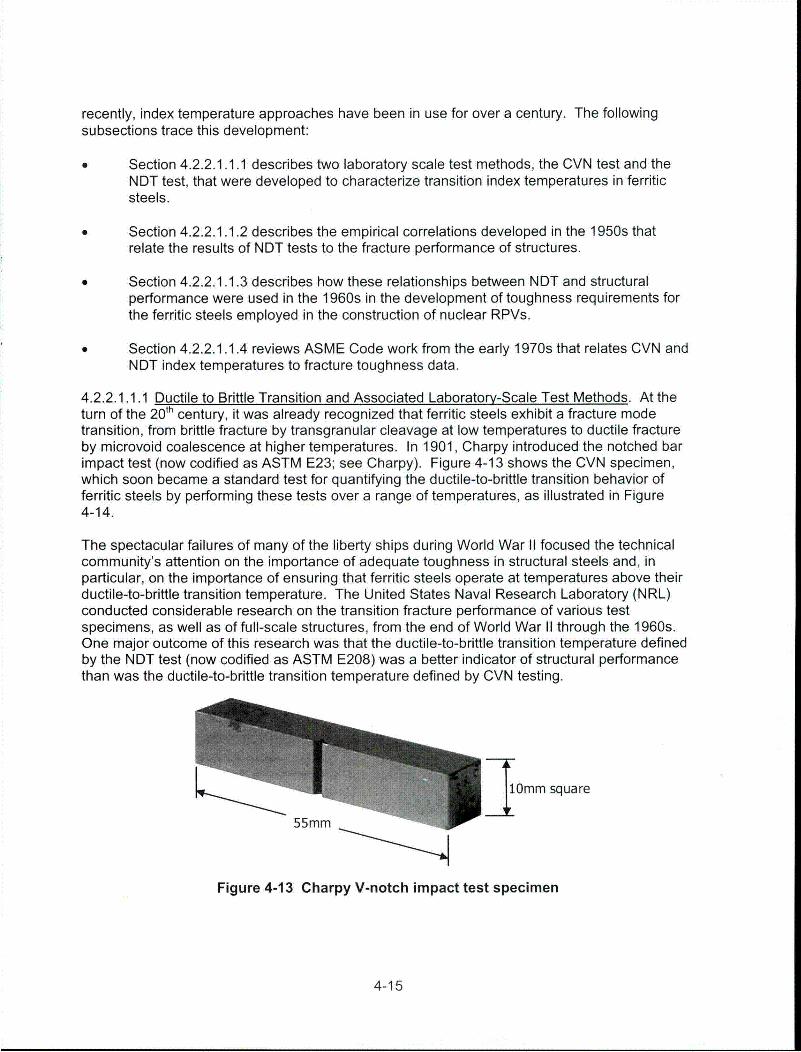
recently, index temperature approaches have been in use for over a century. The followingsubsections trace this development:
0 Section 4.2.2.1.1.1 describes two laboratory scale test methods, the CVN test and theNDT test, that were developed to characterize transition index temperatures in ferriticsteels.
* Section 4.2.2.1.1.2 describes the empirical correlations developed in the 1950s thatrelate the results of NDT tests to the fracture performance of structures.
* Section 4.2.2.1.1.3 describes how these relationships between NDT and structuralperformance were used in the 1960s in the development of toughness requirements forthe ferritic steels employed in the construction of nuclear RPVs.
& Section 4.2.2.1.1.4 reviews ASME Code work from the early 1970s that relates CVN andNDT index temperatures to fracture toughness data.
4.2.2.1.1.1 Ductile to Brittle Transition and Associated Laboratory-Scale Test Methods. At theturn of the 2 0 th century, it was already recognized that ferritic steels exhibit a fracture modetransition, from brittle fracture by transgranular cleavage at low temperatures to ductile fractureby microvoid coalescence at higher temperatures. In 1901, Charpy introduced the notched barimpact test (now codified as ASTM E23; see Charpy). Figure 4-13 shows the CVN specimen,which soon became a standard test for quantifying the ductile-to-brittle transition behavior offerritic steels by performing these tests over a range of temperatures, as illustrated in Figure4-14.
The spectacular failures of many of the liberty ships during World War II focused the technicalcommunity's attention on the importance of adequate toughness in structural steels and, inparticular, on the importance of ensuring that ferritic steels operate at temperatures above theirductile-to-brittle transition temperature. The United States Naval Research Laboratory (NRL)conducted considerable research on the transition fracture performance of various testspecimens, as well as of full-scale structures, from the end of World War II through the 1960s.One major outcome of this research was that the ductile-to-brittle transition temperature definedby the NDT test (now codified as ASTM E208) was a better indicator of structural performancethan was the ductile-to-brittle transition temperature defined by CVN testing.
dOmm square
55mm
Figure 4-13 Charpy V-notch impact test specimen
4-15

A
LM01
=)a'
TemperatureFigure 4-14 Charpy V-notch energy transition curve
Sawcut notch
5-in.
Figure 4-15 Nil-ductility temperature test specimen
The NDT test specimen, illustrated in Figure 4-15, features a notched brittle weld beaddeposited on a 51 x 127 mm (2 x 5-in.) sample of steel that is 15.9 mm (5/8-in). thick. The NDTtest involves impacting the unwelded side of the specimen with a falling weight and, as aconsequence, bending the specimen by a fixed amount until the specimen hits a pair ofmechanical stops. Performance of NDT tests over a range of temperatures (see Figure 4-16)
4-16

defines the lowest temperature of no-break performance, which ASTM E208 defines as the NDTtemperature (TNDT).
4.2.2.1.1.2 Relationships between the NDT Temperature and Structural Performance. Asmentioned in Section 4.2.2.1.1.1, the NRL team led by W.S. Pellini also performed extensivestudies aimed at correlating TNDT to the fracture performance of flawed steel structures, or ofmuch larger specimens that were viewed as being representative of structures. The "failureanalysis diagram" (FAD) illustrated in Figure 4-17 summarizes the result of these studies. TheFAD, which is based on extensive quantities of fracture test data, service experience, and nosmall amount of "engineering judgment," illustrates the combined effects of flaw size, stresslevel, and temperature on the ability of ferritic steels to resist both crack initiation and crackarrest. For example, if one reads across the line at a stress level of 3/4-yield (labeled with an A-B-C-D on Figure 4-17), the diagram suggests that at temperatures below TNDT (point "A" and tothe left) an 203 mm (8-in.) long crack will initiate fracture. However, at temperatures above TNDT
progressively larger cracks are necessary to cause crack initiation because of the increase infracture toughness that occurs with temperature. At TNDT +15 0C (+27 OF) (point "B"), a 305 mm(12-in.)-long crack is necessary to initiate fracture at 3/4-yield; at TNDT +22 0C (+40 OF) (point"C"), a 610 mm (24-in.)-Iong crack is necessary; and at temperatures above TNDT + 26 0C (+47OF) (point "D" and to the right), cracks, irrespective of their size, cannot initiate in cleavage at anapplied nominal stress of 3/4-yield because this is the location of the crack arrest transition(CAT) curve. As illustrated in Figure 4-18, the CAT curve was established as a conservativeupper bound to the temperatures required for crack arrest in wide steel plates held at constanttemperatures and loaded to a constant remote stress. Section 4.2.2.1.1.3 discusses this CATcurve further because it provided the basis for the transition temperature and operationalrequirements initially established for commercial nuclear RPVs.
4.2.2.1.1.3 Use of the NDT CAT Curve in Establishinq the Toughness Required of NuclearRPV Steels. The early prototype and first generation commercial nuclear power plants weredesigned to ASME Code Sections I, "Rules for Construction of Boilers," or VIII, "Rules forConstruction of Pressure Vessels," neither of which (at the time) placed toughness requirementson the steels used in vessel construction. Consequently, supplemental toughness requirementswere developed. The first edition of Section III of the ASME Code, "Rules for Construction ofNuclear Facility Components," was published in 1963. This edition specified the lowest servicetemperature of the nuclear RPV as TNDT +33 0C (+60 OF); Figure 4-17 reveals the origin of thisrequirement. At TNDT +33 0C (+60 OF) the CAT curve passes through the yield stress level.Thus the ASME Section III requirement for a minimum operating temperature of TNDT +33 0C
(+60 OF) suggests that any flaws that remain in the vessel after fabrication cannot initiate(irrespective of their size) as long as the applied stresses remain below yield, as they weredesigned to dot. On August 27, 1967, the predecessor of the NRC, the Atomic EnergyCommission (AEC), issued a requirement that all beltline materials have a TNDT of -12 °C (10 OF)or less. When combined with the ASME Section III requirement for a minimum operatingtemperature of TNDT + 33 0C (+60 OF) and the empirical basis of Pellini's CAT curve, the August27, 1967, AEC TNDT requirement suggests that, at least at the beginning of life, a nuclear RPVcould be fully pressurized at the ambient temperature without a risk of brittle failure.
The 1963 ASME Section III toughness requirements considered neither the effects of accident loadingnor the effects of irradiation embrittlement (other than implicitly through the use of generallyconservative design principles).
4-17

Break: Crackcompletely severstension surface ofspecimen.
No-Break: Fracture(darkened region) doesnot extend to the sidesof the specimen
+ IF *ATemperature
NDT is the lowest- temperature of "no-
break" performance
Figure 4-16 Definition of the NDT temperature
TEMP. -
Figure 4-17 Generalized failure analysis diagram as presented by Pellini and Puzak(Pellini 63)
4-18

Yield
"3 Wide Plate Wide Plate4) G) Failures Arrests
II II +@ + 0
(A(D
00
+ 0
0Temperatureabove TNDT
Figure 4-18 Construction of the CAT curve
4.2.2.1.1.4 Definition of RTNDT from CVN and NDT Data, and Its Use to Locate K_1 and K,Transition Curves. In February 1971, the Pressure Vessel Research Council (PVRC) formed atask group to develop recommended toughness requirements for the ferritic materials in nuclearRPVs. In August of that same year, the task group delivered its recommendation to both ASMEand the AEC. This recommendation was published in 1972 as Welding Research CouncilBulletin 175 (see WRC175). The task group developed two curves as lower-boundrepresentations of all of the LEFM-valid crack initiation toughness (K,.) and crack arresttoughness (Kla) data available at the time (these curves appear along with the data from whichthey were derived in Figure 4-19):
Eq. 4-1 K, = 33.2 + 2.806- exp[0.02 . (T - RTVoT + 100)]K, = 26.78+ 1.223. exp[0.0145. (T- RTVDT +160)]
where
RTNDT is (now) defined per ASME NB-2331 as RT,DT = MAX•T•{,, T,,,, -60},TNDT is the nil-ductility temperature determined by testing NDT specimens per ASTM E208,
andT35,50 is the transition temperature at which Charpy-V notch (CVN) specimens tested per
ASTM E23 exhibit at least 35 mills lateral expansion and 50 ft-lb absorbed energy§.
Eq. 4-1 expresses stress intensity factor (K) values in units of ksilin and temperature values inunits of OF.
§ The task group actually proposed a slightly different Charpy requirement, albeit one of similar intent.The Charpy requirement given is consistent with the current definition of RTNDT.
4-19

4.2.2.1.2 Procedures for RTNDT Estimation
Both Title 10, Section 50.61, of the Code of Federal Regulations (10 CFR 50.61) andAppendix G to 10 CFR Part 50 require an estimate of RTNDT for each steel in the beltline regionof the reactor. This section focuses attention only on the estimation of RTNDT in the unirradiatedcondition, or RTNDT(u), because the effects of irradiation on index temperature shift appear inSection 4.2.3.
According to current regulations, there are three different methods of estimating RTNDT(u), asillustrated in Figure 4-20. The selection of which method to use is based on the informationavailable. If both NDT and CVN data are available, the ASME NB-2331 method is used (seeSections 4.2.2.1.1.4 and 4.2.2.1.2.1). The two alternative methods are referred to as the MTEB5.2 method and the generic method. The NRC developed these alternative methods during andshortly following the development of the technical basis for the current PTS rule to addresssituations in which sufficient CVN and NDT data were not available to estimate RTNDT(u)according to ASME NB-2331. As will become apparent in the following discussion, thesedifferent methods of estimating RTNDT(u) do not ensure the same degree of overestimation of thetrue fracture toughness transition temperature as is characteristic of ASME NB-2331 RTNDT(u)
values.
The following sections summarize the preferred and the two alternative methods of RTNDT(u)
estimation.
4.2.2.1.2.1 ASME NB-2331--Preferred Method. The RTNDT is defined per ASME NB-2331 asfollows:
Eq. 4-2 R TNDT = MAX {TNoD I TT I ,o -60}
where
TNDT is the nil-ductility temperature determined by testing NDT specimens per ASTM E208and
T35,50 is the transition temperature at which CVN specimens tested per ASTM E23 exhibit atleast 35 mills lateral expansion and 50 ft-lbs absorbed energy.
In WRC-175, the task group cited the following reasons for basing RTNDTOn both NDT and CVNdata
(1) The use of both NDT and CVN tests gives protection against the possibility of errors inconducting the tests or the reporting of test results.
(2) The CVN requirements are expressed, in part, in terms of lateral expansion because thisprovides protection from variation in yield strength from initial heat treatment and thechange in yield strength produced by irradiation.
This list of four items is a direct quotation from WRC-1 75 with the exception that some nomenclaturehas been changed to ensure consistency with that used herein.
4-20

K c (MPa-m 1 12 ) EPRI NP-710-SR Database200
ASME K Curve150 -Ic
0.
100 B 3
00
50 vQ .
ASME KIc Curve (extended)
0 I , ,I,,,I
-250 -200 -150 -100 -50 0 50 100
(T .RTNDT) (0 C) o6,27,oo.K1pt
Kia (MPa-m 11)200C . . . . . . L . .EPRI NP-710-SR Database
HSST 02 Plate: 50 data points
150
CP 0
O8 o o c
100o
8
50 0 0
•'"ASME Kaa 0
-100 -50 0 50 100
(T-RT NDT ( 0 C) 06/27/00.K3 ptw
Figure 4-19 Kc and Kia toughness values used to establish the ASME K1, and Ki. curves
(3) The requirement of 0.9 mm (35 mills) lateral expansion and 68 J (50 ft-lbs) at TNDT+ 330C (60 OF), throughout the life of the component provides assurance of adequate fracture
toughness at upper-shelf temperatures.
(4) The CVN test at TNDT+ 33 0C (60 OF) serves to weed out nontypical materials such asthose that might have low transition temperature but abnormally low energies on theupper shelf.
It can again be noted that the frequent use of the temperature TNDT + 33 0C (60 OF) finds itsorigins in the Pellini CAT curve (see Figure 4-17).
4-21

4.2.2.1.2.2 MTEB 5.2-Alternative Method (for Plates and Forgings).
If only Charpy test data are available, the reference temperature value can be any one of a widearray of different index temperatures (e.g., T1 00, Tupper shelf, 16 0C (60 OF), T30, -18 °C (0 OF),T45, and T35/50 + 11 0C (20 OF)). As illustrated in Figure 4-20, the particular index temperatureused depends on both the material type and the amount of data available. This myriad of indextemperature measures for different materials and situations addresses all situations of limiteddata for plate and forging materials known to exist in 1981 (see NRC MTEB 5.2). BecauseMTEB 5.2 was developed as an alternative to the preferred ASME NB-2331 method, it isbelieved that all of these alternative index temperatures are more conservative than (i.e., higherthan) an ASME NB-2331 RTNDT(u) value. Indeed, the authors of Enclosure A to SECY-82-465characterize MTEB 5.2 RTNDT(u) values as being "not very satisfactory, because they areoverconservative in some cases" (see SECY-82-465).
4.2.2.1.2.3 Generic-Alternative Method (for Welds). I
4.2.2.1.2.4
If no heat-specific material test data are available, a reference temperature value is determinedbased on the flux type of the weld material of interest. These "generic" RTNDT(u) values arethe means of the populations of RTNDT(u) values measured according to ASME NB-2331 fordifferent weld flux types. As defined in 10 CFR 50.61, generic RTNDT values can be either-49 0C (-56 OF) for welds made with Linde 1092, Linde 0124, and Linde 0091 fluxes, or -18 °C(0 OF) for welds made with Linde 80 fluxtt.
The non-Linde 80 value was established as the average of a data set of 92 RTNDT(u)
measurements provided by Combustion Engineering for Linde 1092, Linde 0124, and Linde0091 welds. More limited information available at the time for Linde 80 welds (25 RTNDT(u)
measurements) was averaged to obtain the -18 0C (0 °F) value. Subsequently, the NRC staffapproved a generic value of -21 °C (-5 OF) for Linde 80 welds.
4.2.2.2 Best-Estimate Model
Since the ASME Code K1, and Kia curves are located using RTNDT, which is not determined fromfracture toughness data but rather from CVN and NDT data, there is no assurance that K1, andKja curves positioned using RTNDT according to Eq. 4-1 will be located consistently with respectto actual fracture toughness (KI, and Kia) data for each and every heat of steel. Indeed, thedefinition of RTNDT (see Eq. 4-2) suggests that consistent positioning relative to fracturetoughness data is not an inherent characteristic of the RTNDT model. To characterize andquantify the uncertainties in the initiation fracture toughness model (i.e., in both RTNDT and K0),it is necessary to define the current best estimate of the fracture toughness transition behaviorand compare this estimate to the RTNDT / K1, characterization. This section defines the currentbest-estimate model. It then compares this best estimate to the RTND1T/KIC characterization inSection 4.2.2.3.
Earlier discussion of index temperature approaches to initiation fracture toughnesscharacterization (see Section 4.2.1) described the current best physical understanding of themechanisms responsible for cleavage fracture in the transition regime. This physical basis
11 Other generic RTNDT(u) values that have been established as a result of individual licensing actions;they are not reviewed in this report.
4-22

supports a temperature dependency of, and scatter in, initiation fracture toughness that isuniversal to all ferritic steels. Overwhelming empirical evidence testifies that these physicalexpectations manifest in reality (see Figure 4-8 and Figure 4-9). Currently, the Master Curveand its associated transition temperature, T,, provide the best mathematical representation ofthese trends.
Wallin, working in collaboration with Sarrio and Torronen, began to publish papers that wouldbecome the basis for what is now referred to as the "Master Curve" as part of his doctoralresearch work in 1984 (see Wallin, all citations). This work includes (1) a statistical model ofcleavage fracture, and (2) a temperature dependency of fracture toughness common to allferritic steels, in agreement with the physical expectations detailed in Section 4.2.1.Mathematically, these features are expressed as follows:
Relationship Types
0 Equation, Exact
0 Equation, wl Uncertainty
* Choice
A Comparison
[-FcjntrolRTNEr = MAX TNDTcv (35,50) -60° F
Figure 4-20 Diagram illustrating the different methods used currently to estimate a valueof RTNDT for an unirradiated RPV steel
4-23

Eq. 4-3 KJ(median) = 27.30 + 63.71 exp[0.0106(T - Tj)]
Ep =I -exp B K(, -18.20)41Eq.4-4 f=l-B-, •-K-- 18.20) {Eq. 4-3 describes the temperature (T, in OF) dependency of the median fracture toughness(KJc(median), in ksi/in). In this equation, temperature is normalized to the index temperature T0,which is defined as the temperature at which the median toughness of a fracture specimenhaving the reference thickness (B0, which is defined to be 25.4 mm (1-in.) is 100 MPaqm (91.01ksi4in). Eq. 4-4 provides the three-parameter Weibull distribution that describes the distributionof toughness values about this median at all temperatures in transition. Of these threeparameters, two are fixed-(1) the shape parameter is fixed at 4 and (2) the minimum value isset to 18.18 ksi/in. The parameter K,, which corresponds to a 63.2 percent probability offailure, is determined by fracture toughness testing as described by American Society forTesting and Materials (ASTM) Standard E1921. K, and KJc(median) are related as follows:
Eq. 4-5 KAc,,di,,) = 0.9124(Ko - 18.20)+ 18.20
Figure 4-21 overlays Eq. 4-3 and Eq. 4-4 on cleavage fracture toughness data for a wide varietyof ferritic steels, demonstrating the excellent agreement of the Wallin Master Curve model withexperimental observations.
4.2.2.3 Model Used in FAVOR and Treatment of Uncertainties
Having described the physics underlying cleavage fractures (Section 4.2.1), the RTNDT model(Section 4.2.2.1), and a best-estimate model (Section 4.2.2.2), the following sections willpropose a model for use in FAVOR, and will both classify and quantify the uncertaintiesassociated with this model.
Figure 4-22 illustrates that, as a consequence of its physical basis and its definition, Toconsistently positions a model (in this case the ASME KI, curve) relative to fracture toughnessdata in a way that RTNDT cannot (because RTNDT is not a measure of fracture toughness).Information of this type can be used to classify and quantify both the uncertainty in RTNDT andthe uncertainty in K1,.
The following sections discuss both the classification and quantification of uncertainty in the
RTNDTIKIc, first for RTNDT (see Section 4.2.2.3.1) and then for KI, (see Section 4.2.2.3.2).
4.2.2.3.1 Index Temperature, RTNDT
4.2.2.3.1.1 Uncertainty Classification. As discussed in Section 4.2.2.1.2, uncertainty arises inRTNDT values for a number of reasons:
(1) the conservative bias inherent to the ASME NB-2331 definition of RTNDT
4-24

(2) the myriad of methods (i.e., ASME NB-2331, generic, and MTEB 5.2) and transitiontemperatures (e.g., TNDT, Tcv 3515o, T30, T45, Tloo) used to define RTNDT
(3) the limited data sets used to define generic RTNDT values and to assess theappropriateness of the various transition temperatures used in RTNDT definitions
(4) the lack of prescription in the test methods (NDT and CVN) used to develop theproperties that define RTNDT, and the fact that neither the NDT nor the CVN test methodactually measures a material property (making NDT and CVN data depend heavily onspecimen geometry, preparation, and test method)
(5) material variability
Of these sources of uncertainty, the first four clearly reflect uncertainty brought about by alimited state of knowledge, and so are epistemic in nature. Only uncertainty resulting frommaterial variability can be regarded as irreducible (aleatory). However, this information alone isinsufficient to determine if the uncertainty in RTNDT is primarily aleatory or epistemic. To makethis distinction, one must compare the RTNDT index temperature to the index temperatureassociated with the best-estimate model for crack initiation toughness (To). As detailed inSection 4.2.2.2, this best-estimate model is supported by strong physical insights, whichdemonstrate that the trends the empirical data are expected, and more importantly are expectedto apply to the range of material and irradiation conditions characteristic of PWR service. This,combined with the fact that T, is estimated directly from fracture toughness data, and so, bydefinition, must relate to the same location on the transition temperature curve of every material,suggests that the epistemic uncertainty sources that plague RTNDT do not influence To. Becausethe uncertainty in the best-estimate transition temperature is expected to be primarily aleatory, acomparison of T, and RTNDT values can be used to quantify the epistemic uncertaintyassociated with RTNDT.
4.2.2.3.1.2 Uncertainty Quantification. Section 4.2.2.2 identified the Wallin Master Curve as thebest-estimate model of initiation fracture toughness for ferritic steels. Because of the direct linkbetween the Master Curve and the Master Curve transition temperature (To), T, is the bestestimate currently available of the transition fracture toughness of RPV steels, both before and-after irradiation. Consequently, To is used to quantify the epistemic uncertainty associated withRTNDT. The following sections first develop a Master Curve-based procedure for uncertaintyquantification, and then modify this procedure to make it consistent with the constraint imposedon the PTS reevaluation effort that all models of fracture toughness and fracture toughnessuncertainty be consistent with the principles of LEFM.
4.2.2.3.1.2.1 Master Curve Procedure. To account for the epistemic uncertainties in RTNDT, onemust quantify how far away from the measured fracture toughness data RTNDT positions amodel of fracture toughness, as illustrated in Figure 4-23. As detailed previously, the MasterCurve transition temperature, To, best represents the true fracture toughness transitiontemperature. By definition, T6 represents the same point on the transition curve for every ferriticsteel (i.e., the temperature at which the median fracture toughness of a 1 -in.-thick specimen is90.9 ksi/in). Thus, T, must correspond to the position of fracture toughness data, rather thansome model of the data located based on information other than fracture toughness, as is thecase with RTNDT -based models.
4-25
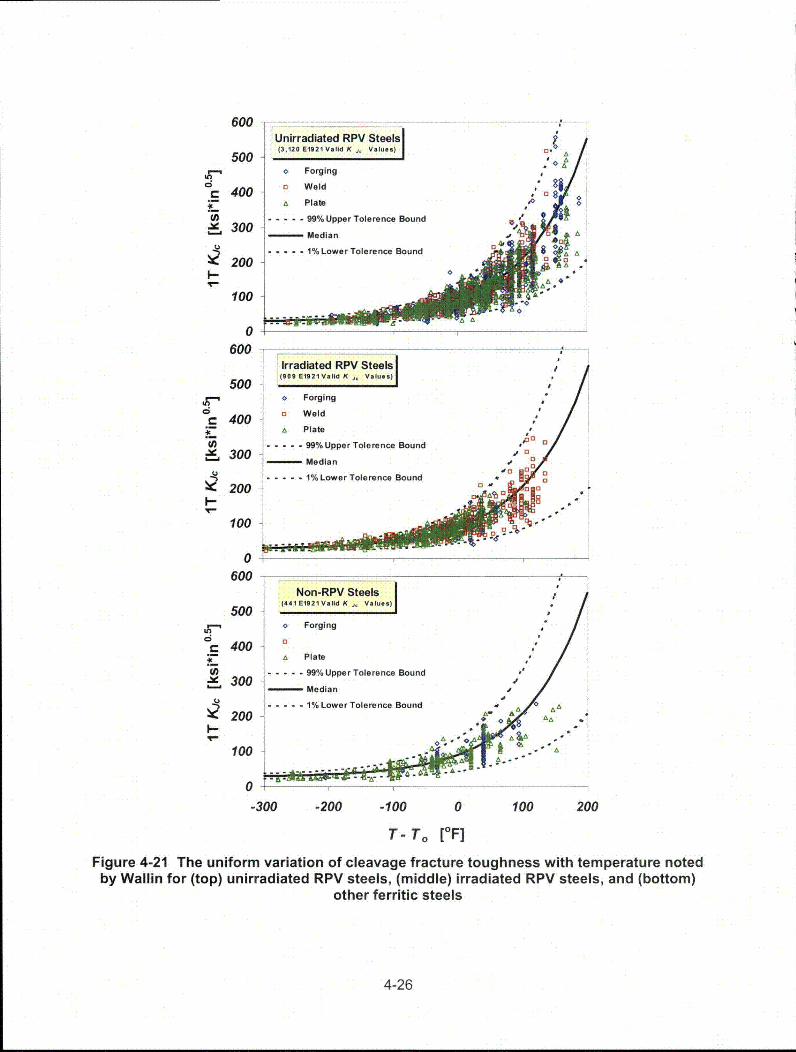
600 -1--- - ------ -- - -- -
Unirradiated RPV Steels
500 (3,120 E1921 Val d K , V...s)u.A
o Forging A
a 4 Weld=:400 .A Plate . a$
- - - - - a99% Upper Tolerence Bound "S300
20 -- -- 1% Lower Tolerence Bound a04,A A
200 •.
100
0600 . :
Irradiated RPV Steels5O0 (009 E1921V.l8d K , Vlu.s)l
o ForgingCS 0 Weld" 400 We
A Plate
-) ..... 99% Upper Tolerence Bound aS300aa3O ... Median 0;!
S1% Lower Tolerence Bound a I200 a aI-- ,
100 C13-
0 , ,
600Non-RPV Steels
500 (441 E1921 Valid K ,° Valu..)
o Forging
0 400 0
A Plate
-A ..... 99% Upper Tolerence Bound *
• 300 SMedian JI
200 ..... 1% Lower Tolerence Bound ,A 6AA
100
0
A
-300 -200 -100 0 100 200
T- To [OF]
Figure 4-21 The uniform variation of cleavage fracture toughness with temperature notedby Wallin for (top) unirradiated RPV steels, (middle) irradiated RPV steels, and (bottom)
other ferritic steels
4-26
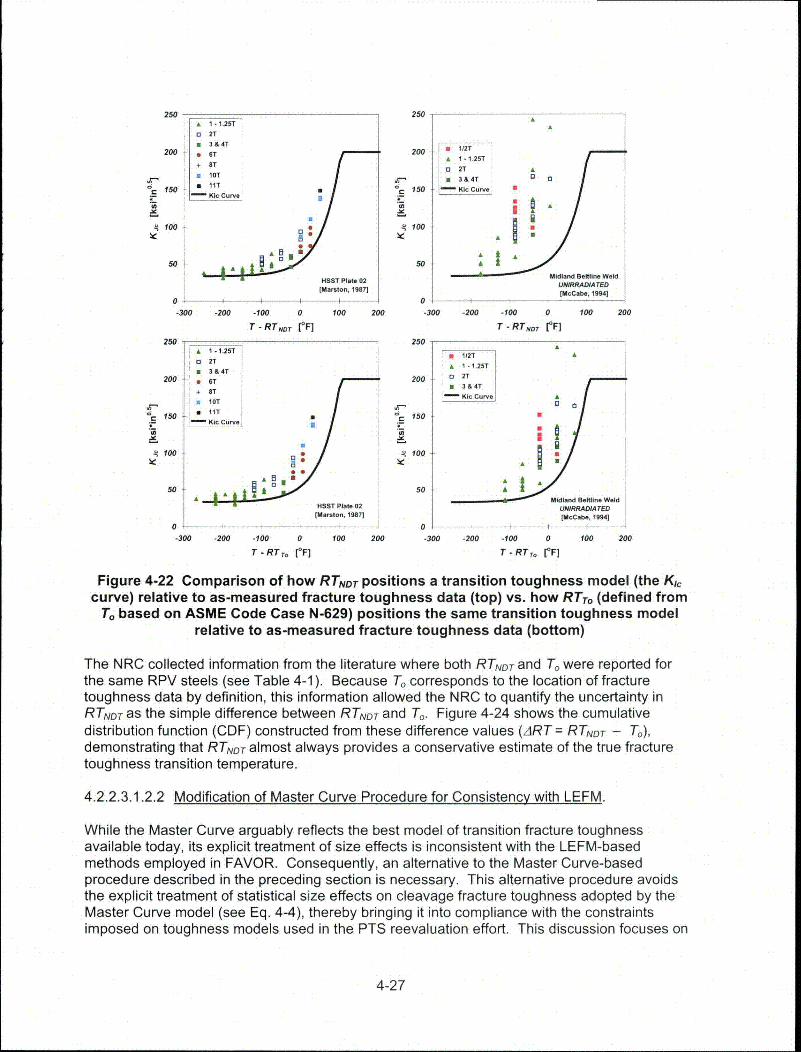
250 25025020 S 1- 1.25TA
a 2T
2 0 6T 200 112T
2T+i8T 2T[] 10T
a• i 1T 17 1.50 3&4T
-, 150 :- / 0 1i0 CI,.
HSST Plma te0 NRAI E
--000 -1005 A
0
250- 50£
A A
HOST Plate02 Midland Beline Weld(Mareor,, 987]UNIRRADIA TED
[McCabe, 1994]0 i i 4-0 - --
-300 -200 -100 0 100 200 -300 -200 -100 0 100 200
T -RTNO)T [oF] T -RTNDT CF]
250 - 250A 1- 1.25T12
S 11..25T
200 a 3 &A 200 o 2T
+ S Kic CuPa0 Aa lOT C! a
[ n 150 "ClT 150-Kic Curne
3 0100 1 300
oo 5 0oAA Midland Beatline Weld
HOST Plate092 UNIRRADIA TED[Msrston, 19871 (Mtca beo .19941
0 - 0 1- -
-300 -200 -100 0 100 200 -300 -200 -100 0 100 200
T -RTr. [~'F] T-.RTTO [*F]
Figure 4-22 Comparison of how RTNDTDpositions a transition toughness model (the Kg,curve) relative to as-measured fracture toughness data (top) vs. how RTT (defined from
T, based on ASME Code Case N-629) positions the same transition toughness modelrelative to as-measured fracture toughness data (bottom)
The NRC collected information from the literature where both RTNDitand T were reported forthe same RPV steels (see Table 4-1). Because T. corresponds to the location of fracturetoughness data by definition, this information allowed the NRC to quantify the uncertainty inRTNDTas the simple difference between RTNDT and T Figure 4-24 shows the cumulativedistribution function (CDF) constructed from these difference values (ART= RTNDT - T"),demonstrating that RTNDT almost always provides a conservative estimate of the true fracturetoughness transition temperature.
4.2.2.3.1.2.2 Modification of Master Curve Procedure for Consistency with LEFM.
While the Master Curve arguably reflects the best model of transition fracture toughnessavailable today, its explicit treatment of size effects is inconsistent with the LEFM-basedmethods employed in FAVOR. Consequently, an alternative to the Master Curve-basedprocedure described in the preceding section is necessary. This alternative procedure avoidsthe explicit treatment of statistical size effects on cleavage fracture toughness adopted by theMaster Curve model (see Eq. 4-4), thereby bringing it into compliance with the constraintsimposed on toughness models used in the PTS reevaluation effort. This discussion focuses on
4-27

the use of this procedure with the extended K1c fracture toughness database developed by OakRidge National Laboratory (ORNL) (see Bowman 00). The section concludes with acomparison of these two characterizations of epistemic uncertainty.
To avoid explicit treatment of size effects (Eq. 4-4), a procedure is developed that quantifies thebias, or epistemic uncertainty, in an RTNDT -based fracture toughness model relative to KI,values that satisfy the ASTM E 399 plane-strain validity criteria. This procedure is applied to adatabase of 254 KI, values (see Bowman 00). Figure 4-25 depicts these data as a function ofthe normalized temperature T-RTNDT, along with the ASME Ki, curve and an adjusted lower-bounding KI, curve (see Nanstad 93). As illustrated in Figure 4-26, a temperature shift, ARTLB,
was determined for each of the 18 heats of RPV steel in this database by treating the adjustedlower-bounding Kt, curve in Figure 4-25 as a 1-percent quantile curve and determining thetemperature shift needed to make this curve coincident with the lowest KI, value for the heat ofsteel under consideration. This procedure is similar to the Master Curve-based procedurediscussed in Section 4.2.2.3.1.2.1 insofar as measured fracture toughness data are regarded asthe "truth" that the index temperature needs to represent, but it avoids an explicit treatment ofsize effects adopted by the Master Curve by relying on only LEFM-valid KI, values whendefining quantifying epistemic uncertainty. Table 4-2 lists the ARTLB value for each of the 18heats of steel in the ORNL 99/27 database.
Figure 4-27 provides a CDF determined from these ARTLB values, with the Weibull parametersof the CDF calculated using the Method of Moments point-estimators.
Eq. 4-6 ARTLB = -40.02 + 124.88[-ln(1 -p)]0. 5,
This CDF quantifies the epistemic uncertainty in RTNDT in a manner fully consistent with theconstraints placed on toughness models used in the PTS reevaluation effort. Figure 4-27(c)also compares this quantification of epistemic uncertainty with that based on the Master Curve.This comparison illustrates that an implicit treatment of size effects produces an epistemicuncertainty quantification that lies between the Master Curve-based CDFs for 1T and 4Tspecimens, a placement that provides some sense of the average size of the fracture toughnessspecimens used in the definition of ARTLB.
The adjustment to RTNDT quantified by Figure 4-27 is based on the difference between RTNDT
values estimated using ASME NB-2331 procedures and LEFM-valid fracture toughness data.Consequently, in addition to the uncertainty associated with using RTNDT to model the truefracture toughness transition temperature of the material (i.e., the difference between RTNDT andthe LEFM-valid data), the CDF in Figure 4-27 quantifies the combined uncertainty attributable toall of the sources at and to the right of node 11 on Figure 4-20, including the following:
* uncertainty in the ASME NB-2331 definition of RTNDT
* uncertainty arising from material nonhomogeneity* uncertainty in the CVN and NDT testing methodologies
Therefore, the CDF in Figure 4-27 represents the total epistemic uncertainty in RTNDT.
However, all RTNDT values were not determined by the ASME NB-2331 method used togenerate the data that support the dRTLB adjustment factor. As discussed in Section 4.2.2.1.2and illustrated in Figure 4-20, RTNDT values are also determined using the MTEB 5.2 andgeneric methods. The use of the RTNDT adjustment in Figure 4-27 to quantify the epistemicuncertainties in the MTEB 5.2 and generic RTNDT values is appropriate for the following reasons:
4-28

150
J7
C;
.
100
50, ,Uncertainty
in RTNDT
relative todata
-200 -100 0 100 200 300
Temperature [OF]
Figure 4-23 Illustration of how the error in an RTNDrbased model of fracture toughnesstransition is determined
100%
0 Forging
Rl Plate
AWeld
ZMZý71 0cl
AB
0
C.)
80%
60%
40%
20%
-50 0 50 100 150 200
ART = RTNDT - To [OF]Figure 4-24 Cumulative distribution function showing the difference
between T, and RTNDT
4-29

Table 4-1 Summary of Unirradiated RPV MaterialsHaving Both RTNDT and T, Values Available
Author Year Product Spec Material To [OF] RTNDT RTNDT -ToForm Designation [OF] [OF]
Iwadate, T. 1983 A508 CI. 3 -54 -13 41Marston, T.U. 1978 A508 CI. 2 -6 65 71Marston, T.U. 1978 Forging A508 CI. 2 -60 51 111VanDerSluys, W.A. 1994 A508 CI. 3 -154 -22 132Marston, T.U. 1978 A508 Cl. 2 -124 50 174McGowan, J.J. 1988 A533B CI. 1 HSST 02 -8 0 8Marston, T.U. 1978 A533B CI. 1 HSST02 -17 0 17Marston, T.U. 1978 A533B CI. 1 HSST 01 -2 20 22Ahlf, Jurgen 1989 A533B CI. 1 HSST 03 -21 20 41Onizawa, Kunio 1999 A533B Cl. 1 -99 -31 68
Ishino, S. 1988 Generic Plate -81 -13 68
CEOG 1998 A533B CI. 1 -85 -15 70Link, Richard 1997 Plate A533B CI. 1 HSST 14A -70 10 80McCabe, D.E. 1992 A533B CI. 1 HSST 13A -110 -9.4 100Onizawa, Kunio 1999 A533B CI. 1 -152 -49 103
Ishino, S. 1988 Generic Plate -131 -22 109
CEOG 1998 A533B CI. 1 -133 5 138Marston, T.U. 1978 A533B Cl. 1 -74 65 139Morland, E 1990 A533B CI. 1 -142 5 147Ingham, T. 1989 A533B CI. 1 -154 5 159Ishino, S. 1988 -39 -58 -19Ishino, S. 1988 -98 -76 22CEOG 1998 -126 -80 46Ramstad, R.K. 1992 HSST 73W -78 -29.2 48
McCabe, D.E. 1994 Midland Nozzle -32 27 59
Ramstad, R.K. 1992 HSST 72W -70 -9.4 60CEOG 1998 -138 -60 78CEOG 1998 Weld -136 -50 86Williams. 1998 Kewaunee 1P3571 -144 -50 94
McCabe, D.E. 1994 Midland Beltline -70 27 97
Marston, T.U. 1978 -105 0 105CEOG 1998 -139 -20 119CEOG 1998 -157 -30 127CEOG 1998 -186 -50 136CEOG 1998 -189 -50 139Williams, J. 1998 1 -203 -50 153
4-30

Table 4-2 Three Reference Transition Temperatures DefinedUsing the ORNL 99127 KI, Database
Property Material Product Sample Reference Temperatures Uncert. TermsSet ID Description Form Size RTNDT(u)(1) To (2) RTLB () RTNDT(u) - ARTLB
TON (OF) (OF) (°F (°F) (OF)
1 HSST.1 weld 8 0'.- -105i-64*3 105 64.32 A533 Cl. 1 weld 8 0 -57 10.9 57 -10.93 HSST'01. plate 17 20 -1 : -77.8 21 97.84 HSST03 plate 9 20 31 -71.5 -11 91.55 A533C: C1'. plate 13 65 -74 -121.4 139, 186.46 HSST02 plate 69 0 -17 -2.1 17 2.17 IA533B. weld 10 -45 -151 -187.2 106 142.28 A533B weld/HAZ 6 0 -132 -162.4 132 162.49 A508 CI. 2 forging 12 50 -124 -97.6 174 147.610 A508 Cl. 2 forging 9 51 -60 0.9 111 50.111 A508C1:-2 forging 10 65 -55 10.4 120 54.612 HSSI 72W weld 12 -9.4 -70 -15.4 60.6 613 HSSI.73W weld 10 -29.2 -78 -67.6 48.8 38.414 HSST 13A plate 43 -9.4 -109 -42.6 99.6 33.215 . A508 Cl. 3 forging 6 -13 -46 -11.3 33 -1.716 Midland Nozzle weld 6 52 NA -37.4 NA 89.417 Midland Beltline weld 2 23 NA -58.9 NA 81.918 Plate 02 4th Irr. plate 4 0 NA -62.3 NA 62.3
(1) Bowman, K.O. and P.T. Williams, "Technical Basis for Statistical Models of Extended KI, and KlaFracture Toughness Databases for RPV Steels," ORNL/NRC/LTR-99/27, Oak Ridge NationalLaboratory, February 2000
(2) Kirk, M., et al., "Bias and Precision of To Values Determined Using ASTM Standard E 1921-97 forNuclear Reactor Pressure Vessel Steels," Effects of Radiation on Materials: 19 th InternationalSymposium, ASTM STP 1366, M.L. Hamilton, et al., eds., American Society for Testing and Materials,West Conshohocken, PA, pp. 143-161, 2000.
(3) Unpublished calculations by J.G. Merkle, August 7, 2000.
Table 4-3 Summary of Generic RTNDT Values in the RVID DatabaseGeneric RTNDT Value
Material Group (mean) (OF) Standard Deviation (0F)CE Welds -56 17
B&W Welds -5 17B&W Plates 1 26.9
B&W Forgings 3 31Weld WF-25 -7 20.6
4-31

The MTEB 5.2 method was developed to produce RTNDT values conservative to (i.e.,higher than) the ASME NB-2331 RTNDT values. Indeed, the authors of Enclosure A toSECY-82-465 characterize MTEB 5.2 RTNDT(u) values as "not very satisfactory, becausethey are overconservative in some cases" (see SECY-82-465). Thus, use of the CDF inFigure 4-27 will underestimate the epistemic uncertainties in a MTEB 5.2 RTNDT value (aconservative treatment). Sufficient evidence does not currently exist to establish aprocedure that can be used to account for this additional conservatism.
Generic RTNDT values in the Reactor Vessel Integrity Database (RVID) representaverages of ASME NB-2331 RTNDT values. However, the CDF of Figure 4-27 wasdeveloped based on bounding (i.e., ASME NB-2331) RTNDT values, so its direct use tocorrect for the epistemic uncertainties associated with the generic RTNDT values found inRVID is not appropriate. In this situation, a step is necessary to recover from the genericRTNDT value one of the bounding values from which it was derived before using Eq. 4-6to estimate the epistemic uncertainty in this RTNDT value. Because the generic RTNDT
values represent averages of ASME NB-2331 RTNDT values (i.e., bounding values),estimating a bounding RTNDT value from a generic one is a simple matter of randomlyselecting an RTNDT value from a normal distribution having the same mean and standarddeviation as the data set originally used to establish the generic RTNDT value. Table 4-3summarizes the generic RTNDT values currently found in the RVID database.
4.2.2.3.2 Crack Initiation Toughness
4.2.2.3.2.1 Uncertainty Classification. The distribution of noncoherent particles throughout theBCC iron lattice alone establishes the scatter in K1, data (see Natishan 99a). It is possible, atleast in principle, to know if a noncoherent particle exists at a particular point in the matrix. Thismight suggest an epistemic nature to K1, scatter, were it not for the fact that KI, does not exist asa point property. A KI, value always has a size scale associated with it, which is the plasticallydeformed volume. Upon loading, the presence of the crack elevates the stress state along theentire length of the crack front to the point that dislocations begin to move in the surroundingvolume of material, which contains a distribution of barriers to their motion (e.g., noncoherentparticles, grain boundaries, and twin boundaries). Sufficient accumulation of dislocations at abarrier can elevate the local stress state sufficiently to initiate a crack in the barrier, and, if thecriteria for fracture are satisfied, propagate the crack through the entire surrounding testspecimen or structure. Thus, the existence of a particular dislocation barrier at a particularlocation does not control K,0. Rather, KI, is controlled by the distribution of these barriersthroughout the lattice, and how this distribution interacts with the distribution of elevatedstresses along the crack front. Because the distribution of these barriers throughout the latticeis random and occurs at a size scale below that considered by the K1, model of toughness, theuncertainty in KI, data is irreducible. For this reason, FAVOR models the uncertainty in Kc asaleatory.
4.2.2.3.2.2 Uncertainty Quantification. Use of RTNDT as a temperature-indexing parameterintroduces epistemic uncertainty into models of KI, scatter when these models are derivedempirically from experimental databases that include multiple heats of steel having differentRTNDT values. Thus, a purely empirical derivation of K1, models and uncertainty measuresproduces a mixture of aleatory and epistemic uncertainties. Proper mathematical treatment ofmixed uncertainties is not currently possible using PRA techniques, suggesting the need for adifferent approach to uncertainty quantification.
4-32

K, (ksi-in"1 ) ORNL 99/27 Database7MX
150
100
50
-500 -400 -300 -200 -100 0 100 200
(TRTNDT ) (OF) 0831f20OK3 Pt.
Figure 4-25 Extended Kic fracture toughness database (ORNL/NRC/LTR-99127)(Bowman 00) of ASTM E399 valid data compared with adjusted ASME Kc curve
(Nanstad 93)
76
7s ARTL8 21°
7, 7 Adjusted Loser.DoundASME K Curve
~73HSST Plate 02 l~l Data 73 1 " e l u
72150 72 1 percentile curve
A =2272C: ART = 2.1, AF 30•• 2=,I2
too ... .. -I /(T-RT,.,) (OF)
so
0-100 -200 -100 0 100 200
(T-RT ..T) (OF) .
Figure 4-26 Illustration of the lower bounding methodology used to generate theuncertainty term (ARTLB) for RTNDT(u)
4-33

CDF for Lower-Bounding Model1" bull Distrrbubon n-
Location Parameter. a = -40.02 F ".Scale Parameter. b = 124 88 " 'F-.
,e, 0.8 Shape Parameter. c 1 96 -
0.6* ~ Median Rank Estimate
t IS,.4' N= 18 materials
P • • l -exp[-( (.\RT-aybb J ]
SART =a+b[ I -In(1- P)]V
%60 0 60 100 150 200 260
ARTepjar.ec (°F) ° %' K2P'
(a)
IC._Z P I - exp[ - ((RT-a)b) ] - I
- 0 RT = a + b[-In(1 -IP)]' ARTLc At P =0.5; 0.""
• - To'.RTa =.14.4"F /7 / ,
" 1
//P
AR Ra + bN (1T) ---1T
0. RT ~0. A R T4 T,./-RT RT1.* T°
* -
t; LB en
S= / -S
~~~ 0.0.6
E E
(J 50 0 50 10 150 -!l00 -50 0 50 100 150 200 250
AR~u, (RT o- To) (0F) o0,IC,oI, ARTLB, (RTINoT -To ) (°irj°""
NDT 0 0
(b) (c)
Figure 4-27 (a) Illustration of ARTLB that quantifies both the epistemic uncertainty in
RTNDT(U) and the intentional bias in RTNDT(U,) values. (b and ¢) Comparison of .IRTLB
adjustment with Master Curve-based (RTNDT-To) adjustment.
As summarized in Section 4.2.2.2, a physical understanding of cleavage fractures demonstrates
that the uncertainty (scatter) in K1• data is expected to follow a Weibull distribution, having a
shape parameter of 4 and some finite lower bound value. This distribution was therefore
assumed when fitting a data set of 254 LEFM-valid Kc values from 18 heats of RPV steel to
establish the temperature dependence of Kc relative to the normalized temperature T-RTLB (see
Figure 4-26 for RTLB definition and Table 4-2 for RTLB values). Figure 4-28 illustrates this best-
fit model, which describes the aleatory uncertainty in K, 0. Mathematically, this K, 0 model is as
follows:
Eq. 4-7 K 1 A(AT) = aK, (AT) + bK, (AT)[-In(I - p)]'/ .... for 0 •_ P <I
whereK, 0 is in ks[ilin,
4-34

AT is (T-RTLB), in 'F, andP is the fracture probability.
aK, (AT) = 19.35 + 8.335exp[0.02254(AT)] [ksi itn.]
bK, (AT) =15.61 +50.132exp[0.008(AT)] [ksi/in. ]
CK, = 4
- 250°F £ AT £ +50'F
4.2.2.4 Summary of Model and Uncertainty Treatment
Figure 4-29 combines the diagrammatic representation of the unirradiated index temperatureand the crack initiation toughness transition models taken from Figure 4-6 with the specificmodels and input values recommended for use in the preceding sections. Uncertainties enterthe model in the following places:
When a generic (mean) value of RTNDT(u) is used, the epistemic uncertainty in this valueis simulated by drawing a value from a standard normal distribution having the standarddeviations given in Table 4-3. This sampled value is added to or subtracted from thegeneric RTNDT(u) value (also given in Table 4-3) to obtain the RTNDT(u) value used byFAVOR for a particular simulation run.The intentional conservative bias in RTNDT(u) is accounted for by sampling from thecumulative distribution function given in Figure 4-27(a). This sampled value (ARTepiste,,c)is then subtracted from RTNDT(u) to obtain a best-estimate value of the unirradiated indextemperature for a particular simulation run.Figure 4-28 depicts the aleatory uncertainty in K1, and its variation with temperature.This K/,distribution is propagated throughout the rest of the model during eachsimulation run.
C
(a)-100 0 100 20C
05115101.K1 ptw(TRLB)( )
Figure 4-28 KI, model proposed for use in the PTS reevaluation effort. In fitting themodel to the data, the Weibull shape parameter (c) was fixed at 4 while the minimum and
median values (a and b, respectively) were defined based on the data.
4-35
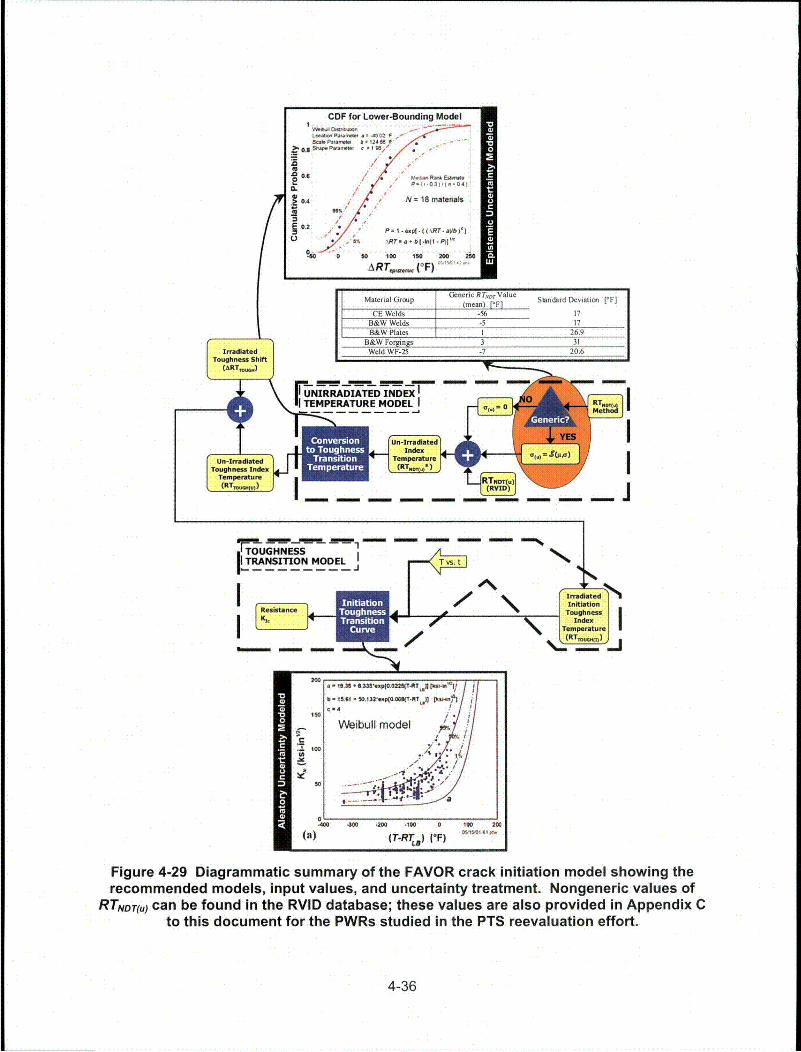
I
TOUGHNESSTRANSITION MODEL
Figure 4-29 Diagrammatic summary of the FAVOR crack initiation model showing therecommended models, input values, and uncertainty treatment. Nongeneric values of
RTNDT(u) can be found in the RVID database; these values are also provided in Appendix Cto this document for the PWRs studied in the PTS reevaluation effort.
4-36

4.2.3 Index Temperature Shift Model
This section describes the model that FAVOR uses to estimate the shift in the toughness indextemperature produced by irradiation. This model, illustrated in Figure 4-30, includes thefollowing three submodels:
(1) A fluence and attenuation model estimates the degree to which the fluence on the innerdiameter of the RPV reduces through the RPV wall. Inner diameter fluences arepredicted using the procedures of Regulatory Guide (RG) 1.190, "Calculational andDosimetry Methods for Determining Pressure Vessel Neutron Fluence," which aredescribed in detail elsewhere (see RG 1.190).
(2) Another model estimates the degree to which the Charpy V-notch 30 ft-lb transitiontemperature (,AT 3o) increases because of irradiation damage, and the effect of bothcompositional and exposure variables on the degree of shift expected. This step(estimating the Charpy shift as a precursor to estimating the toughness shift) isnecessary because at the current time insufficient experimental information exists frompower reactor surveillance programs to support estimation of toughness shift directlyfrom compositional and exposure variables.
(3) A third model converts the shift in Charpy transition temperature to an estimate of theshift in toughness transition temperature necessary to position the fracture toughnesstransition curve of the irradiated material.
The following sections discuss the treatment of fluence uncertainty and the attenuation model.They also include information on the physical mechanisms responsible for irradiation damage offerritic RPV steels that is needed to support the discussions of both the Charpy shift model andthe toughness shift conversion model that follows. This section concludes with a summary ofthe model used in FAVOR and the uncertainty treatment associated with this model.
4.2.3.1 Fluence and Attenuation Model
4.2.3.1.1 Fluence Model
As illustrated in Figure 4-30, the fluence and attenuation model begins with an estimate of theazimuthal and axial variation of fluence on the inner diameter of the RPV (see Figure 4.31 andFigure 4.32 for example results). Neutron fluence transport calculations based on RG 1.190provide these estimates. The calculations were performed in (r, 0) and (r, z) geometry using theDORT (see DORT) discrete ordinates transport code and the BUGLE-93 (see BUGLE) 47-neutron group ENDF/B-VI nuclear cross sections and fission spectra. The calculationsemployed an S8 angular quadrature set, and a P3 Legendre expansion represented thescattering cross sections.
The calculational models extended radially from the core out to the primary (concrete) biologicalshield and over an axial height from 1 foot below to 1 foot above the active fuel. The modelretained the octant core symmetry and represented a 450 azimuthal sector of the geometry.The calculations included a detailed representation of the core/internals/vessel materials andgeometry based on plant-specific information provided by the licensee and/or fuel vendor. Themodels incorporated the dimensions and region-specific material compositions of the core,barrel, thermal shield, vessel, and biological shield. The downcomer water density wasdetermined using the inlet and outlet coolant temperatures and system pressure.
4-37
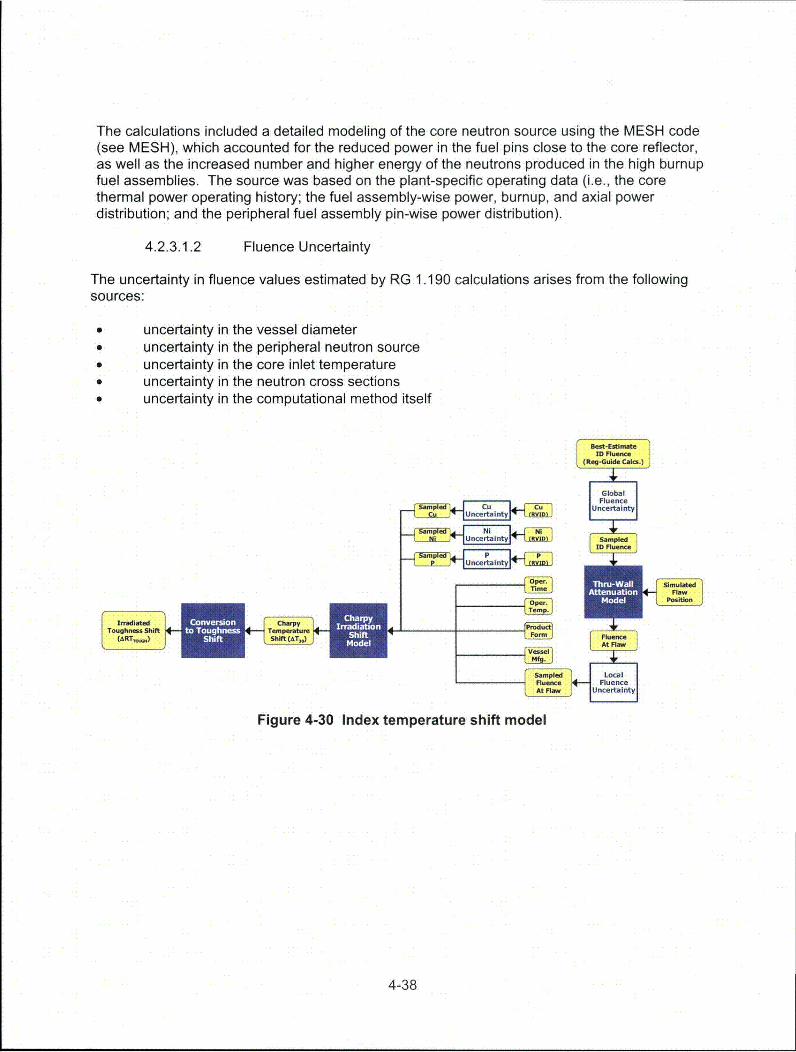
The calculations included a detailed modeling of the core neutron source using the MESH code(see MESH), which accounted for the reduced power in the fuel pins close to the core reflector,as well as the increased number and higher energy of the neutrons produced in the high burnupfuel assemblies. The source was based on the plant-specific operating data (i.e., the corethermal power operating history; the fuel assembly-wise power, burnup, and axial powerdistribution; and the peripheral fuel assembly pin-wise power distribution).
4.2.3.1.2 Fluence Uncertainty
The uncertainty in fluence values estimated by RG 1.190 calculations arises from the followingsources:
* uncertainty in the vessel diameter* uncertainty in the peripheral neutron source0 uncertainty in the core inlet temperature0 uncertainty in the neutron cross sections0 uncertainty in the computational method itself
SIrradloWteToughnes Shift(ART-) I, U
Figure 4-30 Index temperature shift model
4-38

11.0
10.0-a,E
0
S)
CDU)
U-
-40 EFPY
32 EFPY
9.0-1
8.0-1
7 .0-
- - -
6.0 1I10
I I20
I I30
I I400
Degrees
Figure 4.31 Azimuthal variation of fluence on the inner diameter of the Oconee 1 vesselat the axial location of the peak fluence
E
C.)Z5C:
b0
CDL)
12.0
10.0-
8.0-
6.0-
4.0-
2.0-
Axial Height (cm)
Figure 4.32 Axial variation of fluence on the inner diameter of the Oconee 1 vessel at theazimuthal location of peak fluence
These uncertainties manifest themselves at two different levels. All of the uncertainties listedcan result in differences between the actual inside diameter fluence and the RG 1.190 estimatethat are roughly equal over the entire vessel. However, some uncertainty sources (such asperipheral neutron source) can vary from location to location over the vessel wall. To modelthese effects, the FAVOR code includes simulation of fluence uncertainty in two places:
4-39
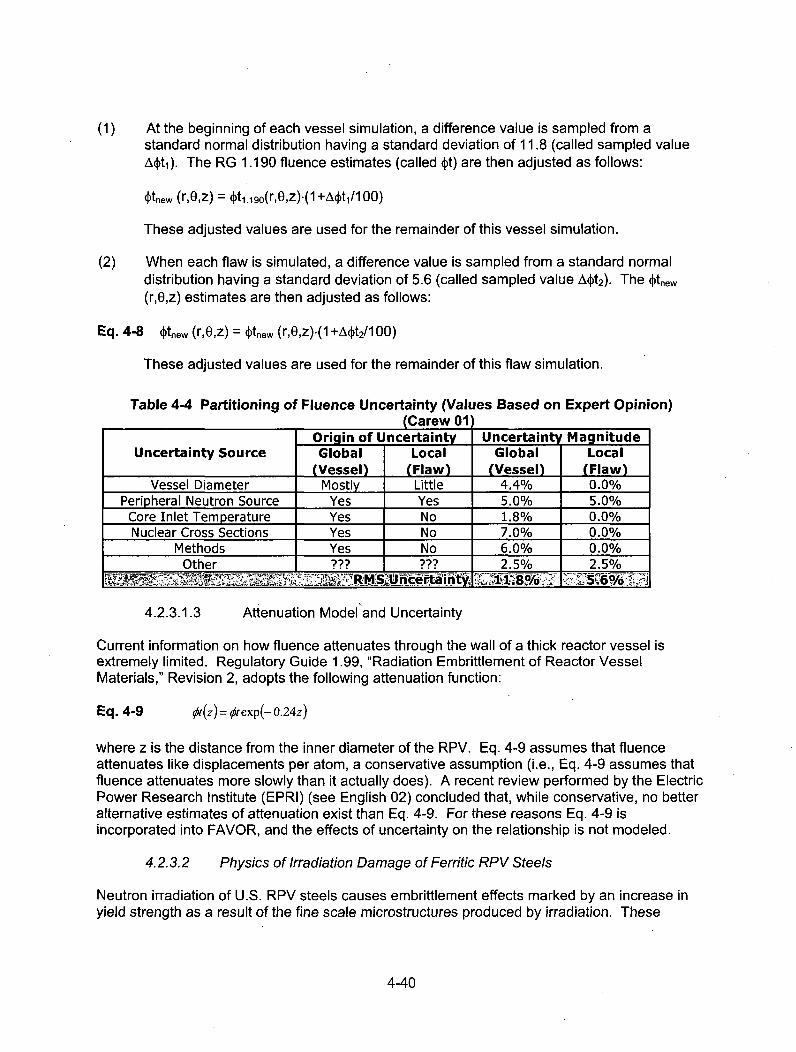
(1) At the beginning of each vessel simulation, a difference value is sampled from astandard normal distribution having a standard deviation of 11.8 (called sampled valueA~t1). The RG 1.190 fluence estimates (called 4it) are then adjusted as follows:
4itnew (r,0,z) = ýt1.19o(r,0,z).(1 +A~t1/1 00)
These adjusted values are used for the remainder of this vessel simulation.
(2) When each flaw is simulated, a difference value is sampled from a standard normaldistribution having a standard deviation of 5.6 (called sampled value AWt2). The (tnew
(r,0,z) estimates are then adjusted as follows:
Eq. 4-8 1tnew (r,0,z) = tew (r,0,z).(l+Aht 2/100)
These adjusted values are used for the remainder of this flaw simulation.
Table 4-4 Partitioning of Fluence Uncertainty (Values Based on Expert Opinion)(Carew 01)
Origin of ncertainty Uncertainty MagnitudeUncertainty Source Global Local Global Local
,___(Vessel) (Flaw) (Vessel) (Flaw)Vessel Diameter Mostly Little 4.4% 0.0%
Peripheral Neutron Source Yes Yes 5.0% 5.0%Core Inlet Temperature Yes No 1.8% 0.0%Nuclear Cross Sections Yes No 7.0% 0.0%
Methods Yes No 6.0% 0.0%Other ??? ??? 2.5% 2.5%
4.2.3.1.3 Attenuation Model'and Uncertainty
Current information on how fluence attenuates through the wall of a thick reactor vessel isextremely limited. Regulatory Guide 1.99, "Radiation Embrittlement of Reactor VesselMaterials," Revision 2, adopts the following attenuation function:
Eq. 4-9 Ot(z) = Otexp(- 0.24z)
where z is the distance from the inner diameter of the RPV. Eq. 4-9 assumes that fluenceattenuates like displacements per atom, a conservative assumption (i.e., Eq. 4-9 assumes thatfluence attenuates more slowly than it actually does). A recent review performed by the ElectricPower Research Institute (EPRI) (see English 02) concluded that, while conservative, no betteralternative estimates of attenuation exist than Eq. 4-9. For these reasons Eq. 4-9 isincorporated into FAVOR, and the effects of uncertainty on the relationship is not modeled.
4.2.3.2 Physics of Irradiation Damage of Ferritic RPV Steels
Neutron irradiation of U.S. RPV steels causes embrittlement effects marked by an increase inyield strength as a result of the fine scale microstructures produced by irradiation. These
4-40

microstructures obstruct dislocation motion, thereby increasing the stress required to movedislocations past these obstacles. The following three mechanisms produce these obstacles:
(1) matrix hardening resulting from irradiation-produced point defect clusters and dislocationloops
(2) age hardening caused by irradiation-enhanced formation of copper-rich precipitates
(3) grain boundary segregation of embrittling elements such as phosphorustt
Details of the two hardening forms of embrittlement are as follows:
(1) Matrix hardening. Matrix damage develops continuously during irradiation, producinghardening that has a square root dependence on fluence. Matrix damage can bedivided into two components, unstable matrix defects (UMD) and stable matrix defects(SMD). UMDs are formed at relatively low fluence, and consist of small vacancy orinterstitial clusters, complexed with solutes such as phosphorus and produced indisplacement cascades. Increasing flux causes increasing hardening resulting fromthese defects, but they occur relatively independent of alloy composition. In low-copperalloys at low fluence and high flux UMD is the dominant source of hardening. However,in high-copper steels, these defects delay the copper-rich precipitate contribution tohardening by reducing the efficiency of radiation-enhanced diffusion. Stable matrixfeatures form at high fluence and include nanovoids and more highly complexedclusters. These defects cause hardening that increases with the square root ofexposure and is especially important at high fluences.
(2) Age hardening. Radiation accelerates the precipitation of copper held in solid solution,forming copper-rich precipitates that inhibit dislocation motion and, thereby, harden thematerial. This hardening rises to a peak value and is then unaffected by subsequentirradiation because no copper remains in solid solution to precipitate out and causedamage. The magnitude of this peak depends on the amount of copper initially insolution, and thereby available for subsequent precipitation. Postweld heat treatment(PWHT) performed before the RPV is placed into service can also precipitate copper,removing its ability to cause further damage during irradiation. Thus, different materialsare expected to have different peak hardening values because of differing preservicethermal treatments. Additionally, the presence of nickel in the alloy further enhances itsage-hardening capacity. Nickel precipitates together with copper, forming larger second-phase particles that present greater impediments to dislocation motion and therebyproduce a greater hardening effect.
t Irradiation can produce grain boundary segregation of tramp elements such as phosphorus. Thisleads to a nonhardening form of embrittlement (i.e., one that elevates the toughness transitiontemperature without increasing the yield strength). A broad technical consensus supports the notionthat the steels in U.S. nuclear RPVs have sufficiently low impurity levels that nonhardeningembrittlement is not expected. As the focus of this analysis is U.S. RPV steels, the physicalunderstanding described in this section is appropriate only when hardening forms of embrittlementdominate. Application of these models to steels having higher impurity contents (e.g., VVER steels) isnot appropriate.
4-41

The microstructures produced by both matrix and age hardening provide only long-rangebarriers to dislocation motion in BCC metals. The spacing of these irradiation-produced barriersoccurs on a size scale many times larger than the lattice spacing of the atoms. Because thelattice spacing controls the temperature dependence of both the flow and toughness properties,the following effects of irradiation damage can be expected on a physical basis (see Natishan01):
* Irradiation will increase the yield strength at all temperatures; it will not change thetemperature dependency of the yield strength.
0 Irradiation will shift the cleavage fracture toughness transition curve along thetemperature axis; it will not change the temperature dependency of the cleavage fracturetoughness.
Both of these physical expectations are supported by ample empirical evidence. Figure 4-9already presented data showing that the physically anticipated effects of irradiation on cleavagefracture toughness manifest in reality (see Natishan 01). Similarly, data showing the physicallyanticipated effects of irradiation on yield strength are also available (see Figure 4-33 and Kirk01a).
0L
U,
600
450
300
150
0
-150
-300-200 -100 0 100 200 300 400
Temperature rC]
Figure 4-33 Comparison of 0.2 percent offset yield strength (sy) for nuclear RPV steels tothe Zerilli/Armstrong constitutive relation (line labeled "prediction") (Kirk 01a). Sy(ret is
the ambient-temperature yield strength.
4.2.3.3 Charpy Irradiation Shift Model
4.2.3.3.1 Model Selected
The most comprehensive models available today concerning the effects of neutron irradiationon the mechanical properties of ferritic RPV steels relate basic compositional and irradiationvariables to the shift in CVN energy transition temperature (4T30), rather than to shifts in the
4-42
toughness transition temperature. This focus on AT30 results from the historical practice ofmeasuring Charpy shift as part of RPV surveillance programs, making the great preponderanceof the data available for calibrating irradiation-effects model Charpy data, rather than fracturetoughness data. Thus, while Charpy specimens do not measure fracture toughness, and whileCharpy data exhibit trends that are not physically justifiable (i.e., irradiation changes thetemperature dependency of Charpy energy, and Charpy shifts exhibit a dependence on productform), matters of expedience dictate the use of Charpy-based irradiation-shift models (with asubsequent conversion of Charpy shift to toughness shift). This section discusses the Charpy-shift model adopted for FAVOR, reserving discussion of the conversion of Charpy shift totoughness shift for the following section.
The Charpy embrittlement model adopted for FAVOR follows that proposed by Eason (seeEason 03). Figure 4-34 illustrates the algebraic form of this model, along with the calibrationdata set (all available data from U.S. power reactor surveillance programs docketed with theNRC by 1999), and Table 4-5 provides the units for the independent variables. While thenumerical coefficients in this model were determined by nonlinear least squares fitting to thesedata, the model is physically motivated in the sense that the algebraic forms selected for fittingderive, in many cases, from the following physical understanding of the physics of irradiationdamage (see Section 4.2.3.1.3):
different (additive) terms to reflect the different nature of the physical contributions ofmatrix hardening ("A" term) and age hardening ("B" term) described in Section 4.2.3.1.3
in the matrix hardening (A) term:
- a (nearly) square root dependency on fluence- a dependency on phosphorus and an independence from other embrittling
elements
in the age hardening (B).term:
- a threshold copper level below which no age hardening occurs, leaving thematrix hardening term to completely dominate the irradiation response for low-copper alloys
- saturation in age hardening at high copper levels that, through the use of fluxtype as an indicator variable, corresponds to differences in PWHT practice
- a synergistic effect between copper and nickel that leads to greater hardening
Eason's equation also includes a number of features that rely more heavily on either anempirical understanding of irradiation effects, or on a recently emerging physical understanding,including the following items:
* a synergistic effect of flux and time* a product form dependency (including an 'effect of vessel manufacturer)* a purely time-dependent effect
4-43

200
u. 150
I"-
"o 100
Eo 50z
Fluence [n/cm2]
A T0 - Aex (19310 1(I + I IlOPX•,)°-46° + B(1 + 2.40Ni'1211°)f(Cu)g(ot) + BiasAT 30 =Aexp1( T, +460)
where
8.86x10⁻¹⁷, welds 1A = 9.30x10⁻¹⁷ , forgings ,
12.7x10- 7, plates
FO, Cu:<_0.072wt%f(Cu) = {(Cu - 0.072)0.65 9, Cu > 0.072 wt%f
C'uma = {0.25, for welds with Linde 80 or Linde 00WC~mx•0.305, for everything else
230, welds
B 132, forgings206, plates in CE vessels
156, other plates
g(1I+ tanhF log(Ot + 4.579xl 012t, )-18.265j22 L 0.713
IBias = 0, t, < 97000 h
B 9.4,t > 97000h}
Figure 4-34 Eason embrittlement trend curve model
Table 4-5 Inde endent Variables in Figure 4-34
Variable Description Range (Calibration) Median Units
Cu Copper content 0.01-0.42 0.133 wt%
Ni Nickel content 0.044-1.26 0.6 wt%
P Phosphorus content 0.003-0.031 0.011 wt%
Ot Neutron fluence 9.26xl0 1 5-1.07xl 020 8.66xl 018 n/cm2, E>IMeV
t_ Exposure time 5556-158,840 38,025 Hours
T: Coolant temperature 522- 570 545 TF
4-44

The ASTM recently adopted a new Charpy irradiation-shift model as part of ASTM StandardGuide E900-02. The ASTM model omits the last three features incorporated by the Easonmodel. The effect of these model differences on the value of through-wall cracking frequency(TWCF) estimated by FAVOR is addressed in a separate report on sensitivity studies (seeEricksonKirk 04c).
4.2.3.3.2 Uncertainty Treatment
The comparison of "normalized" AT30 values§§ to the prediction of Eason's model shown inFigure 4-34 demonstrates that there is considerable scatter about the mean predicted value,even for the data used to develop the model. The following two sources of uncertaintycontribute to the observed scatter:
(1) how well the mathematical form of the Charpy embrittlement model representsthe physical processes of irradiation damage
(2) how accurately and consistently the data set used to calibrate the embrittlement trendcurve represent the data (i.e., AT30 data, chemical composition data, and fluence data)
Both of these uncertainties relate to a lack of knowledge, and so both are (primarily) epistemicin nature. FAVOR does not model the first uncertainty because no other available model(ASTM E900-02 or otherwise) exhibits appreciably less uncertainty. Thus, there is noindependent metric of truth relative to which this uncertainty could be quantified (and therebymodeled).
The second source of uncertainty (uncertainty in the measured values and distributions of theinput parameters to the Charpy embrittlement relationship) represents the major source ofuncertainty that can be quantified and therefore modeled in FAVOR. As reflected in Figure4-30, the NRC uncertainty model involves using the copper, nickel, and phosphorous valuestaken from RVID (see Appendix C) to center generic copper, nickel, and phosphorousdistributions that are developed in Appendix D, as well as a Monte Carlo process to drawindividual samples from these distributions. These individual samples of copper, nickel,phosphorous, and fluence (see Section 4.2.3.1 for a discussion of the treatment of fluenceuncertainties) are then propagated through FAVOR in a particular simulation run.
It should be noted that the FAVOR procedure does not also simulate the uncertainty in theCharpy embrittlement model shown on Figure 4-34. This approach is appropriate because theuncertainty in the embrittlement shift model arises from uncertainties in the input variables to theembrittlement shift model (i.e., copper content, nickel content, phosphorus content, and fluence)which are sampled in FAVOR. This is demonstrated by the results in Figure 4-35, which weregenerated as follows:
(1) Median values were assigned to all of the input variables to the Eason embrittlementshift equation (except for fluence).
§§ "Normalized" AT30 values are the measured AT3o values normalized to median values of theindependent variables (see Table 4-5) to simulate the appearance of data as if all AT30 values weredetermined from tests conducted under the same conditions.
4-45

(2) The FAVOR uncertainty distributions on copper, nickel, phosphorus, and fluence weresampled about these medians for fluence medians ranging from 0.25x1 019 to 5x1 019n/cm 2.
(3) At each different fluence value, 1000 sets of copper, nickel, phosphorous, and fluencedata were simulated. Each set was used to estimate a value of embrittlement shift usingthe Eason embrittlement model. The standard deviation of these 1000 embrittlementshift estimates was calculated and plotted in Figure 4-35.
The uncertainties simulated by FAVOR agree well with the uncertainties in the embrittlementshift data used by Eason to develop the model. The lower uncertainties associated with lowerfluence values results from FAVOR setting to zero simulations of embrittlement shift that arenegative, which is physically unrealistic.
25 -..
20 x x x -x
x
20
i-X-Standard deviation of simulated
C
embrittlement shift values
() -- Standard deviation of Eason5 model for welds
- Standard deviation of Easonmodel for plates
0
0 1 2 3 4 5
Fluence 1019 [n/cm2]
Figure 4-35 Comparison of embrittlement shift uncertainties simulated by FAVOR (blueline with X symbols) with the uncertainties in the experimental embrittlement shift
database used by Eason to construct the model
This information confirms the appropriateness of this approach to uncertainty simulation for themodel. Simulation of both the embrittlement shift model uncertainties and the uncertainties inthe input variables would produce a model that simulated a greater magnitude of uncertainty inembrittlement shift than is observed in test data.
4-46
4.2.3.4 Conversion of Charpy Shift to Toughness Shift
4.2.3.4.1 Model Selected
The understanding of the mechanisms of irradiation damage summarized in Section 4.2.3.1.3suggests that the increase in the room temperature yield strength (Asis) produced by irradiationprovides a physically motivated quantification of the degree of irradiation damage imparted to aferritic steel. Measured values of Asys therefore include the complex irradiation mechanics thatthe empirically derived embrittlement trend curves attempt to capture. Figure 4-36 and Figure4-37 therefore examine the relationships of both AT, and AT41j to Asys using available empiricaldata. The linear trend clearly evident in both of these figures is consistent with the ideaintroduced in Section 4.2.3.1.3 that the contributions of both matrix and age-hardeningembrittlement can be captured as an addition to the athermal part of the flow stress. Furtherexamination of these data reveals that a product-form dependence not evident in the transitionfracture toughness data (i.e., in ATo) appears when transition is described using Charpy data(i.e., AT41j). This dependency, which also appears in the AT41j Charpy embrittlement model(see Figure 4-34), is not expected on physical grounds. Differences in thermomechanicalprocessing related to the product form that clearly influence absolute transition temperaturesplay no role in transition temperature shift values because the physical basis for product-formeffects influences unirradiated and irradiated transition temperature values equally, resulting intheir cancellation when transition temperature shifts are calculated. Thus, the trends exhibitedby the AT, data in Figure 4-36 are anticipated physically, while the trends exhibited by the AT 41jin Figure 4-37 are not.
Some rationalization of product form-dependent AT41ivalues can be obtained from a moredetailed examination of CVN data. While the shape of the fracture toughness transition curve(i.e., the Master Curve) is invariant with irradiation and product form (see Wallin and Natishan),the shape of the CVN transition curve is not. As illustrated in Figure 4-38, this results in a 41Jtransition temperature being defined at different locations on the CVN transition curve fordifferent product forms (specifically, after irradiation 41J is considerably closer to the upper-shelfenergy (USE) for welds than it is for either plates or forgings). As the USE approaches the 41 Jlevel, the CVN transition curve lays over, which results in a progressively greater degree of CVNtransition temperature shift for the same irradiation and chemistry conditions. While simplified,this explanation rationalizes the existence of product form dependencies in AT41i, but not in AT,.Additionally, the explanation successfully ranks welds, plates, and forgings in terms of theamount of CVN transition temperature shift that can be expected for a fixed severity ofirradiation damage (fixed Asy,).
When the AT, data from Figure 4-36 are plotted against the corresponding AT41j values fromFigure 4-37, a product from dependent correlation results as a direct consequence of theproduct-form dependencies in AT41j just discussed (see Figure 4-39). These data show that ata fixed value of AT41j, progressively greater AT0 shifts are expected from (in order) welds, thenplates, and then forgings, specifically as follows:
Eq. 4-10 ATo =a. AT3 o
4-47
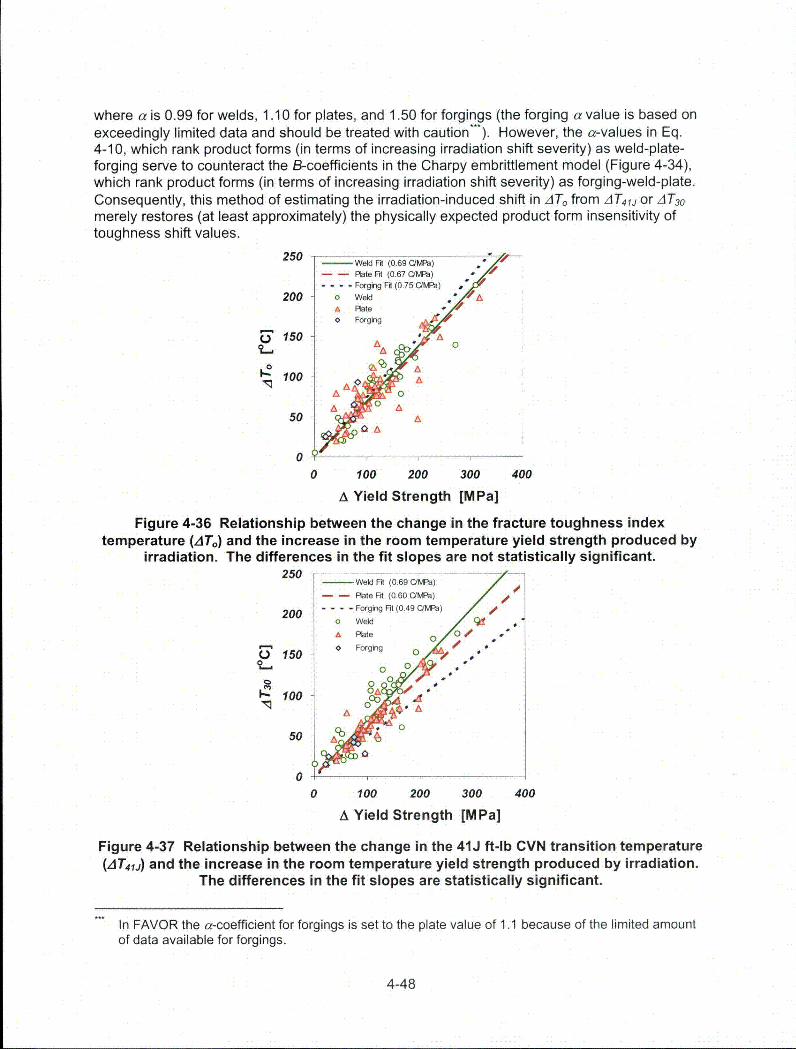
where a is 0.99 for welds, 1.10 for plates, and 1.50 for forgings (the forging a value is based onexceedingly limited data and should be treated with caution**). However, the a-values in Eq.4-10, which rank product forms (in terms of increasing irradiation shift severity) as weld-plate-forging serve to counteract the B-coefficients in the Charpy embrittlement model (Figure 4-34),which rank product forms (in terms of increasing irradiation shift severity) as forging-weld-plate.Consequently, this method of estimating the irradiation-induced shift in AT, from AT 41j or AT30merely restores (at least approximately) the physically expected product form insensitivity oftoughness shift values.
250 Weld FR (0.69 C/MPa)- Rate Fit (0.67 C/N,'P) *, r
....- Forging Fit (0.75 Ct~'a)
200 o weld *"A Rate F 7
0 Forging ,,,'E 15o A A
F A
2• 00 &o weldA
50 A
50 AA
A Yield Strength [MPa]
Figure 4-36 Relationship between the change in the fracture toughness indextemperature (AT7") and the increase in the room temperature yield strength produced by
irradiation. The differences in the fit slopes are not statistically significant.
250 A__
25 Weld Fit (0.69 C/MvPa)-
- Rate Fit (0.60 C'MNa)-0 .... Forging Fit (0049 C 3Pa)
0 Weld S n [aF Rate chn n t
15 Forging #a •0 1500 •
00•
50
0 100 200 300 400A Yield Strength [MPa]
Figure 4-37 Relationship between the change in the 41J ft-lb CVN transition temperature(AlT 41 j) and the increase in the room temperature yield strength produced by irradiation.
The differences in the fit slopes are statistically significant.
In FAVOR the a-coefficient for forgings is set to the plate value of 1.1 because of the limited amountof data available for forgings.
4-48

Forgings] I Plat I we
1: 184
**
CLUz
I I
IIII
U:I 168
.7--.
. . .
U 1
. /.;:10
I)01 )P
Figure 4-38 Illustration of how differences in USE can influence the 41J transitiontemperature. The USE given in the boxes for (U) unirradiated and (I) irradiated conditions
are the averages determined from the data used to calibrate the Charpy embrittlementmodel shown in Figure 4-34.
250
200 ,
E5150 A
A-AA - Weld Fit (Slope=0.99)
A - - Rate Fit (Slope=1.10)- - - - Forging Fit (Slope=1.50)50 0 Weld
A A Rate0 ~Forgings
0 -- -- l - -111 _ _ _ _ _ T0 50 100 150 200 250
A T3o [°C]
Figure 4-39 Relationship between the change in the fracture toughness indextemperature (ATo) and the change in the 30 ft-lb CVN transition temperature (4T41j)
produced by irradiation. The differences in the fit slopes are statistically significant.
4.2.3.4.2 Uncertainty Treatment
FAVOR represents the model for conversion to toughness shift (Eq. 4-10 and Figure 4-39) asbeing without uncertainty for the following reasons:
(1) When attention is restricted to the better-defined values of AT, and AT30, considerablyless scatter is seen in the relationship (see Figure 4-40), suggesting that the uncertaintyshown in Figure 4-39 depends much more on measurement uncertainty than uncertaintyin the physical processes underlying the relationship.
4-49

(2) It is well established from experimental evidence that the variability in AT, and AT30 areof approximately equal magnitude. However, as illustrated in Figure 4-41, incorporatingthe variability in the AT, vs. AT30 experimental relationship produces a considerable (andunrealistic) broadening in the range of predicted ATo values.
400 ........ 400O Weld OWeld
A Plate A Plate300 Forgin•j Io 300 o For in
ALL U-
200 '200
'A ~ 0 'A 0
100 100'0 0
Q ) 0
0~ 00 100 200 300 400 0 100 200 300 400
AT30 [OF] AT30 [OF]
(a) (b)
Figure 4-40 Relationship between CVN shift caused by irradiation (AT3,) and the shift inthe fracture toughness transition temperature caused by irradiation T, (AT,) for data setslimited to (a) 10 Ki, values or more, and (b) 15 K., values or more. Shaded region showsthe range of all the data from Figure 4-39 (all data determined with 6 Kj, values or more).
4.2.3.5 Summary of Model and Uncertainty Treatment
Figure 4-33 combines the diagrammatic representation of the index temperature shift modeltaken from Figure 4-30 with the specific models and input values the preceding sectionsrecommend for use. Uncertainties are accounted for in the index temperature shift model in thefollowing two places:
* Fluence uncertainty is modeled (see Section 4.2.3.1.2).
Uncertainty in chemical composition is modeled (see Appendix D). Also, it is importantto point out that narrower uncertainty distributions are sampled the second (and third,and fourth, etc.) time a flaw is simulated to reside in a particular subregion in a particularvessel than are sampled the first time a flaw is simulated to reside in a particularsubregion. This approach reflects the idea that composition does not vary as much oversmall volumes of material as it does over large volumes of material, an idea supportedby experimental evidence.
Of equal importance, Figure 4-33 reflects the idea that in three places the index temperatureshift model should not include the following uncertainties:
4-50

AT.*=a+b.AT30
'J"0iAT3°
Figure 4-41 Illustration of how the uncertainty in predicted values of AT, is broadenedwhen uncertainty in the empirical AT, vs. AT30 relationship is included in the calculation
FAVOR represents all of the above uncertainties as being epistemic. Thus, individual values ofthe uncertain variables are used throughout a simulation run, after which they are resampled.
Uncertainties are not included in the fluence attenuation model because the model isconservative, and no alternative model exists that could be used either (1) in its place, or(2) to assess its conservatism.
Uncertainties are not included in the Charpy irradiation shift model because the apparentuncertainties in the model have already been accounted for in the process of simulatingthe uncertainties in the compositional variables and in fluence. Including uncertainties inthe Charpy irradiation shift model would therefore result in an inappropriate doublecounting of uncertainties, and consequent simulation of Charpy shift values that aremore uncertain than reflected by available empirical evidence.
Uncertainties are not included in the model that converts Charpy shift to toughness shiftbecause doing so would result in a simulation of toughness shift values that are moreuncertain than those reflected by available empirical evidence.
4.2.4 Interface Model
In a destructive examination of flaws in RPV welds, Simonen reported that virtually all flaws innuclear-grade welds (95 percent or greater) are found on the fusion line between the weldmetal and the adjacent base metal (plate or forging). The FAVOR crack initiation modelassumes that the fracture toughness transition reference temperature that characterizes thematerial at the crack tip is the maximum of fracture toughness transition reference temperatureof the plate material that exists on one side of the flaw and the weld material that exists on theother. This model assumes that if a crack propagates it will do so preferentially through themost brittle material available. This model is implemented without uncertainty.
4-51

0
=. 4,
4)c
o.
4.
0~ 0
U..
0)Er
5 THROUGH-WALL CRACKING MODELThe model of through-wall cracking adopted for FAVOR compares the applied driving force tofracture and the material's resistance to further cracking to estimate the conditional probability ofthrough-wall cracking. The model of the applied driving force to fracture is the same as thelinear elastic fracture mechanics (LEFM) model used for the crack initiation calculation (seeSection 4.1.1). In estimating the material's resistance to further cracking, the U.S. NuclearRegulatory Commission (NRC) admits the possibility, after crack arrest, of reinitiation in either abrittle mode, which is controlled by the KIc/RTNDT model discussed in Chapter 4, or in a ductilemode, which is controlled by the material's J1, and J-R curve propertiesift.
As illustrated in Figure 5-1, the through-wall cracking model is composed of the following parts:
* a fracture driving force model* a fracture resistance model, which includes:
- the assumption that upon crack initiation the crack immediately grows along theinner diameter surface of the vessel to a length that greatly exceeds its through-wall depth
- a model that describes the gradient of material properties through the vessel wallthickness
- a crack arrest model
- a ductile tearing model
Several aspects of these models have been discussed previously:
* The fracture driving force model used in this analysis is identical to the LEFM model, aswas used for the crack initiation calculation (see Section 4.1.1 ).
The index temperature shift model discussed in Section 4.2.3 forms part of the crackarrest model.
Appendix A summarizes the experimental observations justifying the assumption thatupon crack initiation the crack immediately grows along the inner diameter surface of thevessel to a length that greatly exceeds its through-wall depth.
For a discussion of these aspects of the through-wall cracking model the reader should refer tothe relevant sections of this report. The remainder of this chapter concerns the following topics:
* Section 5.1describes the crack arrest toughness model.
ttt Inclusion of ductile fracture properties in a probabilistic pressurized thermal shock (PTS) model is adeparture from previous calculations, which considered only brittle fracture properties [SECY-82-465,ORNL 85a, ORNL 85b, ORNL.86]. Section 5.2 discusses the need to consider tearing on the uppershelf as a potential failure mode in PTS calculations.
5-1

* Section 5.2 describes the upper-shelf ductile tearing model.* Section 5.3 describes the material property gradient model.
5.1 Crack Arrest Toughness Model
5.1.1 The Physics of Crack Arrest in Ferritic Steels
The information presented in Section 4.2.1 included a description of the physics of cleavagefracture in ferritic steels, and established the physical basis for both a temperature dependencyand a scatter in crack arrest toughness that is universal to all ferritic steels. These physicalexpectations will factor into the proposed model for FAVOR, which Section 5.1.2 describes. Inaddition to temperature dependency and scatter, the crack arrest model should also reflect therelationship between crack initiation and crack arrest index temperatures. The remainder of thissection describes the physical basis for such a relationship.
Wagenhofer and Natishan (see Wagenhofer 01) contend that a universal hardening curve existsfor all ferritic steels. This section summarizes this idea, and then develops a physical model forthe relationship between the crack arrest and crack initiation transition index temperatures usingthe universal hardening curve proposed by Wagenhofer and Natishan as a basis.
The following Zerilli-Armstrong description of the flow curve for BCC materials explains therelationships between the various parameters involved (see Zerilli 87):
Eq. 5-1 -z, = o- + Ce" (a)
o =c. + Be-5 (b)
Co =o + (c),6=,8o,- A ln,, (d)
Here, K, n, c0, B, k, ,8o and ,81 are material constants, 0G is the increment of true stress resulting
from coherent and semicoherent obstacles to dislocation motion (vacancies, interstitials, andsmall precipitates), e is the true strain, ý is the true strain rate, and d is the grain size. Focusingattention on the work-hardening term (2 nd term on right side of Eq. 5-1 (a)), the notion that allferritic steels follow a universal hardening curve (i.e., the same strain-hardening rate, n, valuefor all ferritic steels) follows directly from the well-established experimental observation that as ametal is hardened, subsequent tensile tests will reveal greater yield strengths, but the overalltrue stress-strain curve will always overlay the unhardened curve. This behavior cannot occurunless the hardened specimen exhibits the same strain-hardening rate as the unhardenedspecimen does after an equivalent amount of tensile strain. This observation also leads to aninvariance of the true stress at maximum load for most hardening mechanisms.
In Eq. 5-1, Zerilli and Armstrong adopt n=0.5, following Taylor's derivation of the stressnecessary to keep a uniform distribution of edge dislocations in equilibrium (see Taylor 34).This square root relationship between stress and strain arises because the uniform dislocationdistribution forces the distance between the dislocations to be equal to the inverse square rootof the dislocation density. Despite criticisms that this theory is too simplistic, it does a good jobof representing the large deformation behavior of a number of materials (see Meyers 99).
5-2
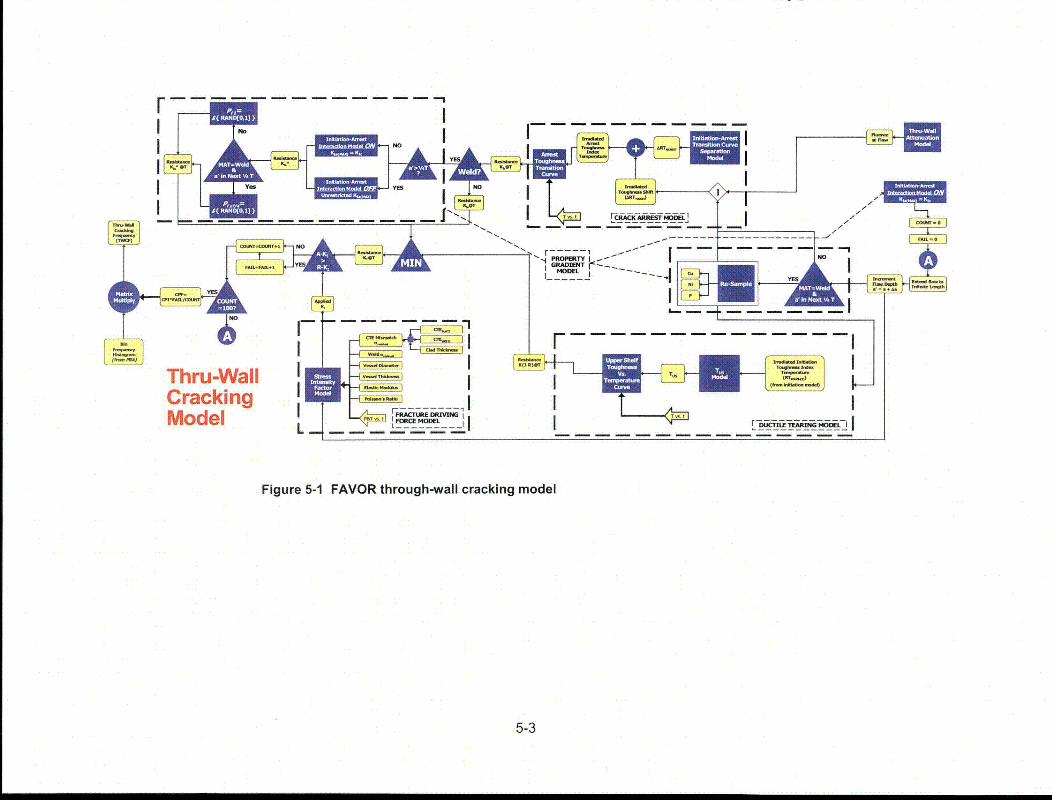
--------------
MovV
YM
U
I- - r m *-r-I
Figure 5-1 FAVOR through-wall cracking model
5-3

To summarize, for Eq. 5-1 to properly describe the physical behavior of metals that have beenhardened to some degree, the strain hardening rate, n, must be constant, and a value of n equalto 0.5 is expected on theoretical grounds. The stress values for a particular steel having aparticular degree of prior hardening can be determined by modifying Eq. 5-1(a) as follows (seeDatsco 66):
Eq. 5-2 a, = a-, + cf(-77+i
where eo is a constant that quantifies the degree of prior hardening.
Figure 5-2 illustrates the effect of prior hardening on ARMCO Iron (see Zerilli 87) using Eq. 5-1.The thin solid lines are the engineering stress vs. true plastic strain curves for various amountsof prior hardening (various so in Eq. 5-2). These are calculated from Eq. 5-1 (thick solid line)using the familiar relationships:
Eq. 5-3 a,, = S(1 + e) (a)s = ln(l + e) (b)
Here S and e are engineering stress and strain, respectively. Various amounts of priorhardening are represented as initial tensile strains (thin vertical lines on Figure 5-2). Themaximum load condition is as follows:
Eq. 5-4 d =ds
This is represented on Figure 5-2 by the dotted line.
These ideas provide the basis for a physical model of the relationship between crack arrest andthe crack initiation transition temperature reported by Wallin, as shown in Figure 5-4 (see Wallin98a). At the time of crack arrest, the material experiences a high rate of loading. This loading-rate elevation above the quasi-static conditions associated with crack initiation causes anelevation in the activation energy required to move dislocations past trapping obstacles, andthus results in an increase in apparent yield stress of the material in a manner similar to theyield stress elevation produced by prior strain illustrated in Figure 5-2. Figure 5-3 uses the ideaof a universal hardening curve for all ferritic steels to illustrate why the elevation in prior straincaused by the elevated loading rate associated with crack arrest (defined as As%) produces aprogressively diminishing elevation in the yield strength as the degree of strain caused by priorhardening (6.) increases. Since increases in transition temperature scale with increases in yieldstrength (see Kirk 01 b), this understanding suggests a physical basis for the empirical trendreported by Wallin of a progressively diminishing separation between the crack initiation andcrack arrest transition curves for higher transition temperature steels. Moreover, the invarianceof the true stress at maximum load that follows directly from the notion of a universal hardeningcurve suggests that, in the limit of very high strength ferritic materials, the crack initiation andcrack arrest transition curves should approach each other (i.e., TKIa is approximately equal toTo), a trend also reflected by available empirical evidence (see Figure 5-4).
5-4

ARMCO Iron300 n
max load condition
.100 i
0i
0 0.1 0.2 0.3 0.4
True Plastic Strain
Figure 5-2 Engineering stress vs. true plastic strain curves for various degrees of priorhardening (thin vertical lines and curves) calculated from the Zerilli/Armstrong true
stress vs. true plastic strain curve (thick curve) for ARMCO Iron
5.1.2 Proposed Model
5.1.2.1 Kia Index Temperature
As suggested by Wallin (and illustrated in Figure 4-10), the NRC adopted TKIa as a consistentcrack arrest index temperature. Because TK/a is defined as the temperature at which the meancrack arrest toughness is equal to 100 MPa'Im, it must always correspond to the location of thecrack arrest toughness transition data.
.5.1.2.2 Temperature Dependency of Kia
Section 4.2.1 argued, on physical grounds, that all ferritic steels should share a commontemperature dependency of Kia. Wallin has argued empirically that K1, data follow the sametrends as the crack initiation toughness data (i.e., they follow the Master Curve; see Wallin 97).Kirk and Natishan present a physical argument for a slight difference between the temperaturedependency of crack arrest and crack initiation toughness as a consequence of the differentloading rates associated with the two different events (initiation vs. arrest) (see Kirk 02).
For FAVOR, the NRC developed empirical fits to crack arrest data indexed to TKia. Two crack-arrest transition models were developed, one fit to only E1221 Kia data (see Figure 5-5) and onefit to both E1221 data, as well as to wide-plate data, thermal shock data, and PTS data (seeFigure 5-6). Over the temperature ranges where the models overlap, the fits are similar. Thesecond model (Figure 5-6) is used in calculations that support the PTS reevaluation effort. Thehigh K1i/high arrest temperature data reflected in this model are necessary to properlycharacterize the behavior of cracks as they approach the outer diameter of the reactor pressurevessel (RPV).
5-5
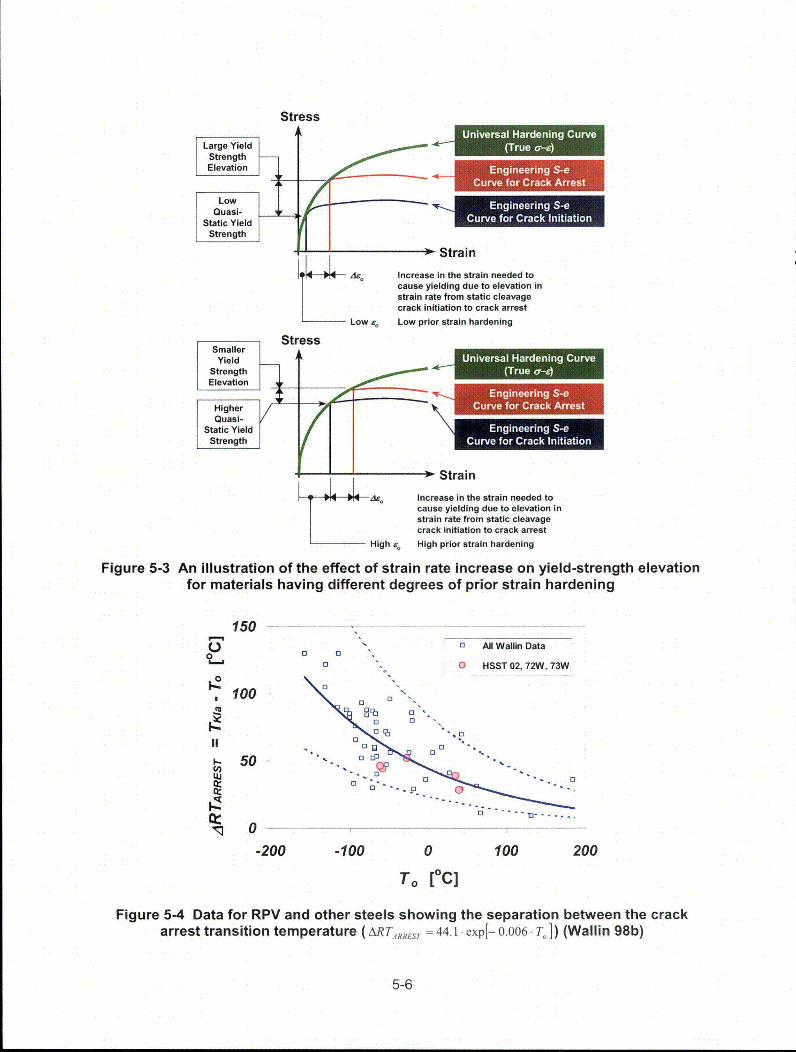
StressUniversal Hardening Curve
(True a-z)
Engineering S-eve for Crack Arrest
U -CuriEngineering S-e
N Curve for Crack Initiation
- Strain
Increase in the strain needed tocause yielding due to elevation instrain rate from static cleavagecrack initiation to crack arrest
Low prior strain hardening
Universal Hardening Curve(True a-z)
Engineering S-eCurve for Crack Arrest
Engineering S-eCurve for Crack Initiation
' Strain
Mo Increase in the strain needed tocause yielding due to elevation instrain rate from static cleavagecrack initiation to crack arrest
High s. High prior strain hardening
Figure 5-3 An illustration of the effect of strain rate increase on yield-strength elevationfor materials having different degrees of prior strain hardening
150(• 0 All Wallin Data
0o 0 HSST 02,72W, 73W
100 0
Co350 0 *.D
~~00
-200 -100 0 100 200
To [°C]
Figure 5-4 Data for RPV and other steels showing the separation between the crackarrest transition temperature (ARTRRES--T =44.1i-exp[- 0.006. To]) (Wallin 98b)
5-6

Figure 5-7 compares the temperature dependencies of the FAVOR KI, model, the two FAVORKia models, and the Wallin Master Curve. The temperature dependency of all these models isquite similar, in agreement with expectations premised on physical considerations.
5.1.2.3 Relationship of KI, and Kia Transition Curves
The NRC adopted the relationship illustrated in Figure 5-4 to define the temperature separationbetween the crack initiation toughness and the crack arrest toughness transition curves.However, this relationship cannot be used directly because the index temperature adopted inthe KI, model of Eq. 4-7 uses RTLB as the index temperature, rather than T,. The similarity ofthe To- and RTLB -based cumulative distribution functions (CDFs) depicted in Figure 4-27 wastherefore used to relate RTLB to To. Figure 4-27(b) suggests that, on average,
Eq. 5-5 T0 = RTLB - 14.4 (in -F)
Substituting Eq. 5-5 into the relationship shown on Figure 5-4 gives the following:
Eq. 5-6 ARTARsT =_ 44.1. exp{- O.O06(RTLB - 14.4 - 32)/1.8}
Eq. 5-6 now describes the separation between a KI, curve (indexed to RTLB) and a KIa curve(indexed to TKIa). The uncertainty on this estimate is described by a log-normal distributionhaving an estimated standard deviation of 0.39.
5.1.2.4 Model Summary, Uncertainty Classification, and Treatment
Uncertainties occur in two places in the crack arrest model-(1) in the positioning of the crackarrest transition curve relative to the crack initiation transition curve (Figure 5-4), and (2) in thescatter in the crack arrest toughness data about the mean transition curve (Figure 5-5 andFigure 5-6). Figure 5-8 shows these submodels overlaid on the flow diagram for the crackarrest model. The following paragraphs discuss the uncertainty treatment for each submodel.
The scatter on Figure 5-4 represents the statistical error in determining both To and TKIa, whichscales in proportion to 1/n where n is the number of fracture toughness specimens tested (seeASTM E1921). This information suggests that the uncertainty in ARTARRESTon Figure 5-4 isreducible, making it epistemic in nature. Therefore, FAVOR selects individual values ofARTARREST from the distribution shown in Figure 5-4 for each simulation run at the RTLB value ofinterest.
From the physical model of cleavage crack arrest toughness described in Section 4.2.1, oneconcludes that the occurrence or nonoccurrence of crack arrest depends upon the interaction ofa rapidly evolving stress state in front of a running crack with the distribution of defects in thematerial that inhibit dislocation motion. The barriers to dislocation motion include vacancyclusters, interstitial clusters, coherent and semicoherent particles, and other dislocations. Thesebarriers are all of nanometer size and have interdefect spacings on the same size scale.Scatter in KIa data therefore occurs as a consequence of the randomness in the distribution ofbarriers to dislocation motion throughout the material. Because the distribution of these barriersthroughout the lattice is random, and the conditions for arrest must be satisfied over a significantportion of the advancing crack front for arrest to occur, the uncertainty in Kia data is irreducible.For this reason the uncertainty in Kia is treated as aleatory. FAVOR achieves an aleatoryrepresentation of Kia uncertainty by executing the through-wall cracking model 100 times for
5-7

each time step at which the crack initiation model estimates a nonzero conditional probability ofcrack initiation (CPI). Each of these 100 trials is a single, deterministic crack-arrest calculation,and each calculation is performed at a Kia toughness that is a different, randomly selectedpercentile of the uncertainty distributions illustrated in Figure 5-5 and Figure 5-6. The fraction ofthese 100 trials for which through-wall cracking is predicted provides an estimate of thepercentage of CPI that is manifested in the conditional probability of vessel failure (CPF).
0
U
HSST 02 RTr 24.9 5C (76.8 TF)72W RTA,,ýI = 9.9 -C (49.8 -F)
73WRT A,_f=1.2 C(34.1"F)250
C'4
(U
200
150
100
lognormalCyln(KIa) =0.18
99%
95%
50%
5%
1%
50
-300 -200
Figure 5-5 FAVOR Kl, mn700
HSST PI600 72W
* 73Wi Midland'
W WP-1500 * WP-2
-100 0
(T'RTArrest) (OF)100 200
07130WOK3 ptw
odel based only on ASTM E1221 data
C 400
300
200
100
(T-RTArest) (F) 06/3/2003 K8 ptw
Figure 5-6 FAVOR KI. model based on ASTM E1221 data, wide-plate data, thermal shockexperiment data, and PTS experiment data
5-8

600 .o - KIc Model (Figure
3-28) /500
"o---K•aModel toE1921L. Data Only (Figure
400 4-5)(I)(- ---- KIa Model to E1921
& Structural Data
300 (Figure 4-6)
- -Wallin Master /
200 i_ -I
. 100
16.LL 0
-250 -150 -50 50 150 250
T - Reference Temperature [°F]
Figure 5-7 Comparison of the temperature dependencies of the FAVOR Kj, model, thetwo FAVOR Kia models, and the Wallin Master Curve. Note that only median and mean
curves are shown, and that the curves are only plotted over their calibrated range.
5-9
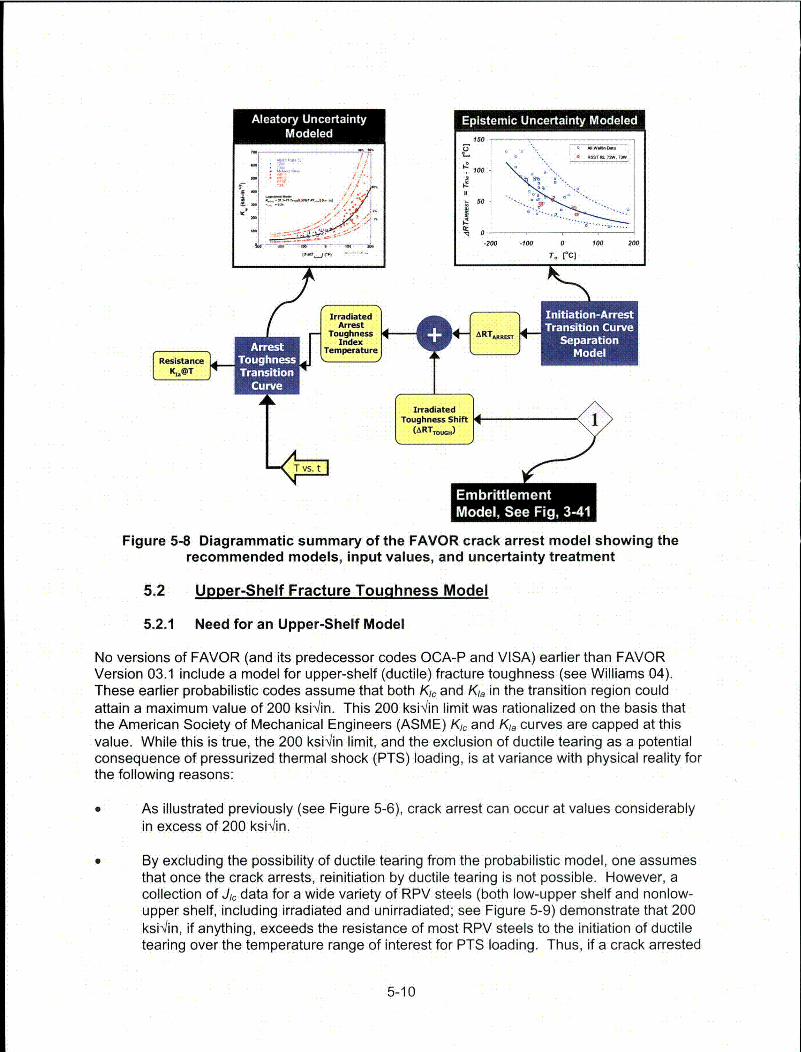
Aleatory UncertaintyModeled
I
L*ite i Unerait Moee - 5*
~3.
I-.
I-
50-
100 =.
0
-200 -100 0 100 200
ResistanceKOT iim Initiation-Arrest
Transition CurveSeparation
Model
-Em bi-t~lemeo de 1S eeFi,34
Figure 5-8 Diagrammatic summary of the FAVOR crack arrest model showing therecommended models, input values, and uncertainty treatment
5.2 Upper-Shelf Fracture Toughness Model
5.2.1 Need for an Upper-Shelf Model
No versions of FAVOR (and its predecessor codes OCA-P and VISA) earlier than FAVORVersion 03.1 include a model for upper-shelf (ductile) fracture toughness (see Williams 04).These earlier probabilistic codes assume that both KI, and Ka in the transition region couldattain a maximum value of 200 ksi'iin. This 200 ksi-/in limit was rationalized on the basis thatthe American Society of Mechanical Engineers (ASME) KI, and K1, curves are capped at thisvalue. While this is true, the 200 ksi•iin limit, and the exclusion of ductile tearing as a potentialconsequence of pressurized thermal shock (PTS) loading, is at variance with physical reality forthe following reasons:
* As illustrated previously (see Figure 5-6), crack arrest can occur at values considerablyin excess of 200 ksirin.
0 By excluding the possibility of ductile tearing from the probabilistic model, one assumesthat once the crack arrests, reinitiation by ductile tearing is not possible. However, acollection of J1, data for a wide variety of RPV steels (both low-upper shelf and nonlow-upper shelf, including irradiated and unirradiated; see Figure 5-9) demonstrate that 200ksibin, if anything, exceeds the resistance of most RPV steels to the initiation of ductiletearing over the temperature range of interest for PTS loading. Thus, if a crack arrested
5-10

at a KAPPLIED value of 200 ksi•!in or above, some amount of ductile tearing would almostcertainly follow.
For these reasons, ignoring the possibility of ductile crack initiation and tearing is both physicallyunrealistic and, potentially, nonconservative. Consequently, the NRC has incorporated a modelof ductile crack initiation and tearing into this version of FAVOR. The following sectionsdescribe this model.
6 0 0 . . .. . . . . .. .0 Un-Irradiated
Ili 500oCD A Irradiated
I 400
, 300
.& 200 0
100 1 00_ ! o
-100 0 100 200 300 400 500 600
Termperature [OF]
Figure 5-9 Jj, data for U.S. RPV steels (converted to K-units) before and after irradiation5.2.2 Characterization of Upper-Shelf Fracture Toughness Properties
In ferritic steels crack initiation occurs when there is sufficient stress and strain to initiate andgrow microvoids in the material to a macroscopic size. Once crack initiation occurs, the crackextends as these microvoids continue to initiate and grow in the high stress/strain fields aheadof the crack tip and, eventually, coalesce into the main crack. This ductile crack growthbehavior is characterized using a J-R curve determined according to the American Society forTesting and Materials (ASTM) Standard E-1 820, or other similar procedures. Figure 5-10illustrates schematically the results of a J-R curve test (the open and filled circles) and showshow the initiation fracture toughness (Jc) and the ductile tearing resistance (Tmat and n) aredefined from these experimental data. These characterizations are described in greater detailbelow:
Initiation Fracture Toughness (J•j). The current version of ASTM El 820 defines J1, asthe value of J at the intersection of the 0.2 mm offset line (offset parallel to the bluntingline) and a fit to the experimental J-Aa data of the form J=CAan. Only J-Aa pairsbetween the 0.15 and 1.5 mm exclusion lines are used to develop this fit.
Tearing Resistance (T,at and n). The resistance to ductile tearing after crack initiationhas been characterized in two (closely related) ways over the years, using Tmat (which isthe normalized linear slope of all the J-Aa data between the 0.15 and 1.5 mm exclusionlines), and using n, which is the exponent of the function used in the determination of Jc.
5-11
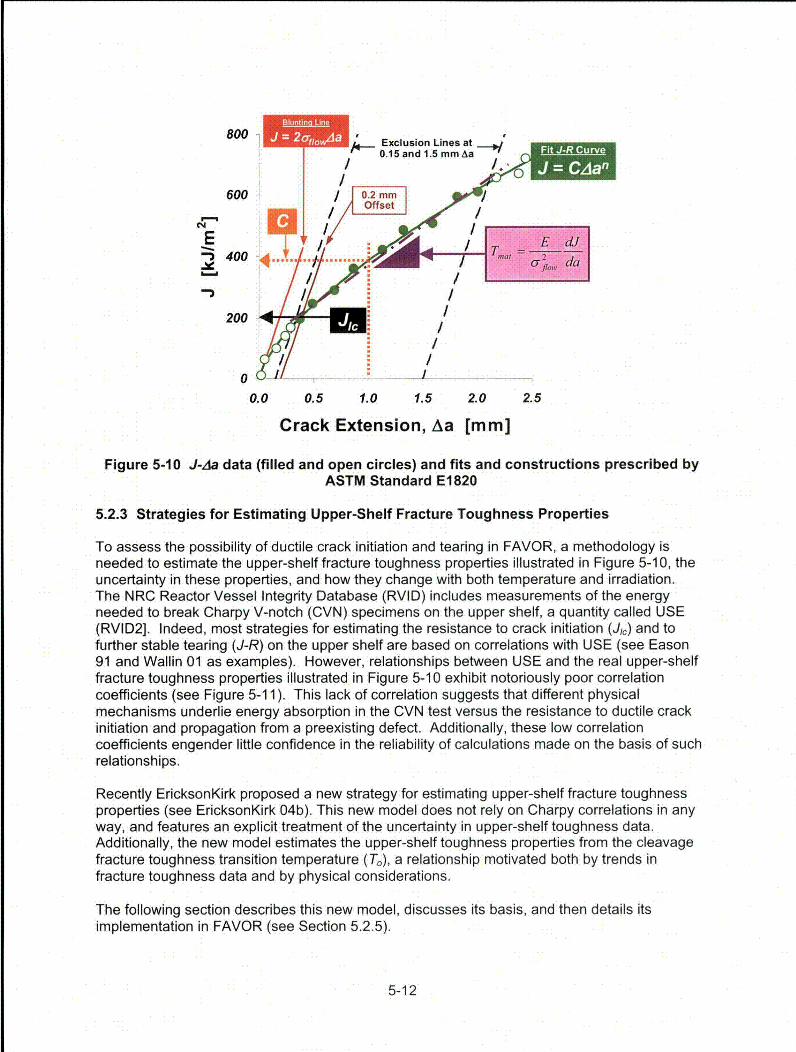
800Fit J-R Cuive
j =
600 1 / 0.2 mm I •
n 400 •.....
JJ ...... .. ... . . .. .. .,200
0.0 0.5 1.0 1.5 2.0 2.5
Crack Extension, Aa [mm]
Figure 5-10 J-4a data (filled and open circles) and fits and constructions prescribed by
ASTM Standard E1820
5.2.3 Strategies for Estimating Upper-Shelf Fracture Toughness Properties
To assess the possibility of ductile crack initiation and tearing in FAVOR, a methodology isneeded to estimate the upper-shelf fracture toughness properties illustrated in Figure 5-10, theuncertainty in these properties, and how they change with both temperature and irradiation.The NRC Reactor Vessel Integrity Database (RVID) includes measurements of the energyneeded to break Charpy V-notch (CVN) specimens on the upper shelf, a quantity called USE(RVID2]. Indeed, most strategies for estimating the resistance to crack initiation (JG) and tofurther stable tearing (J-R) on the upper shelf are based on correlations with USE (see Eason91 and Wallin 01 as examples). However, relationships between USE and the real upper-shelffracture toughness properties illustrated in Figure 5-10 exhibit notoriously poor correlationcoefficients (see Figure 5-11). This lack of correlation suggests that different physicalmechanisms underlie energy absorption in the CVN test versus the resistance to ductile crackinitiation and propagation from a preexisting defect. Additionally, these low correlationcoefficients engender little confidence in the reliability of calculations made on the basis of suchrelationships.
Recently EricksonKirk proposed a new strategy for estimating upper-shelf fracture toughnessproperties (see EricksonKirk 04b). This new model does not rely on Charpy correlations in anyway, and features an explicit treatment of the uncertainty in upper-shelf toughness data.Additionally, the new model estimates the upper-shelf toughness properties from the cleavagefracture toughness transition temperature (To), a relationship motivated both by trends infracture toughness data and by physical considerations.
The following section describes this new model, discusses its basis, and then details itsimplementation in FAVOR (see Section 5.2.5).
5-12

200
Li.00LO)
EI-
LL00LO
'.2
150
100
50
0
250
* Un-Irradiated* Irradiated
+ All- Linear (All)
y = 0.5721x + 3.9389R2 = 0.3123
A
*A ~
* 00°
AA
200 H
150 -
100 -
y = 0.5784x + 70.855
R2 = 0.4835A
50
* Un-IrradiatedA Irradiated
SAMl- Linear (All)
0
0 50 100 150 200
Average Upper Shelf CVE [ft-lbs]
Figure 5-11 Relationship between upper-shelf toughness measures and CVN USE forirradiated and unirradiated RPV steels
5.2.4 New Upper-Shelf Model Proposed by EricksonKirk
In work recently completed under Electric Power Research Institute (EPRI) sponsorship,EricksonKirk proposed a model of upper-shelf toughness that does not rely on correlations withCVN properties (see EricksonKirk 04b). The following subsections describe both the empiricaland physical bases for this model. This information, which is largely copied directly fromEricksonKirk 04b, has been included with EPRI's permission.
5.2.4.1 Empirical Basis
5.2.4.1.1 Database
The data in Figure 5-12 demonstrate that RPV steels often viewed as being different (i.e., platevs. weld, irradiated vs. unirradiated, or low upper-shelf materials) exhibit a strikingly similar
5-13

temperature dependency on the upper shelf, suggesting the possibility for developing a generalmodel of fracture toughness behavior on the upper shelf. To investigate this possibility,EricksonKirk compiled a database of nearly 400 ductile fracture toughness data records fornuclear RPV steels that show the effects of both temperature and radiation damage from theliterature sources listed in Table 5-1. Additionally, the literature sources listed in
Table 5-2 provide 85 ductile fracture toughness data records for other ferritic steels, as well asfor a tempered martensitic steel. In addition to fracture toughness data, these sources alsoprovide information concerning chemical composition and product form (see Table 5-3),strength, and CVN USE (see Table 5-4). This database includes ferritic RPV steels having awide range of CVN USE inclusive of both low upper-shelf materials, as well as the hightoughness, low-copper plate materials characteristic of modern steelmaking practice.Examination of the information in Table 5-3 and Table 5-4 reveals that this database covers awide range of both chemical composition (copper from 0.04 to 0.42 weight percent; nickel from0.1 to 0.7 weight percent) and radiation exposure (fluences up to 2.06x1 019 n/cm2 ).
5.2.4.1.2 Temperature Dependency of J1,
The common upper-shelf temperature dependency of J1, exhibited by different steels (seeFigure 5-12) motivates an examination of the temperature dependency of J1, for all of the steelsin the database (see Figure 5-13). While these J1, values exhibit some trends with temperature,it is also clear that different steels can have considerably different toughness levels at the sametemperature. To focus attention strictly on the temperature dependency of J1, the material-condition-specific toughness level is removed from the data as follows:
Calculate the average of the measured values of J1, at 288 °C (550 OF) for each materialcondition (a unique combination of material composition and radiation exposure definesa material condition).
Calculate the difference between average J1, at 288 0C (550 °F) (JP, 288) and eachmeasured value of J1, in the database.
The use of 288 0C (550 °F) as the normalization temperature is completely arbitrary. The valueof 288 °C (550 °F) was selected strictly because J1, measurements are most commonly reportedat this temperature for nuclear RPV steels (288 0C (550 °F) is the nominal operatingtemperature of a pressurized-water reactor (PWR)). Thus, normalization at 288 0C (550 °F)admitted the largest quantity of data for further analysis. Figure 5-14 demonstrates that thisnormalization removes a considerable degree of the scatter from the data that results frommaterial-condition-specific toughness levels. Furthermore, Figure 5-14 reveals a temperaturedependency of J1, that is the same for a wide range of material conditions. Specifically, all of theferritic steels exhibit the same temperature dependency irrespective of product form, chemicalcomposition, irradiation level, strength level, or strengthening mechanism. Only HY-80 (atempered martensitic steel) fails to exhibit this common temperature dependency, suggestingthat the upper-shelf temperature dependence is only influenced by the crystal structure of thematerial.
5-14

300-
250 -
E 200-
2 150
ýe 100-I-
Plate 02 0S0 Un-lrr: Cleavage
* Un-lrr: DuctileSIrr: Cleavage
A Irr: Ductile
MidlandNozzle
0 Un-lrr: Cleavage
o Un-lrr: Ductile4 lIrr: Cleavage
a Irr: Ductile0
0% A
A
A
AAA
0
A
08
0$
o
SAAA
AA
A
0
50 ý
0
-100 0 100 200 300 100 0 100 200 300
Test Temperature [C] Test Temperature [C]
Figure 5-12 Transition and upper-shelf fracture toughness data for an A533B Steel(HSST Plate 02, left) and for a Linde 80 weld (Midland nozzle course weld, right)
indicating that RPV steels normally viewed as being different exhibit strikingly similartemperature dependency on the upper shelf
T~qhIq r%_1 Amn-&vc nf I Innmr-Qh, If flo~p fnr POV QtaqIo
pMaterals.I Seven welds designated 61W through 67W 70Midland beltline and nozzle course welds 71Plate 02 and four welds designated 68W through 71W 72Two welds designated W8A and W9A 73Characterization of the PTSE-2 plate material 74JAERI Plates A & B 75Note. References in this table are given in Appendix E.
Table 5-2 Sources of Upper-Shelf Data for Other Ferritic and Tempered MartensiticSteels
One ASTM-A710 plate and one HY-80 plate 76Two ASTM-A710 plates and eight HSLA-100 plates 77Two ASTM-A710 plates 78One ASTM-A710 plate 79Note. References in this table are given in Appendix E.
5-15

71 Midland Linde 80Beltline I 0.0831 1.6071 0.017
0.014
0.OOE 0.622
0.04
0.1
0.671
0.574
0.5•
0.41
0.14
0.256
0.003
0.006
71 Midland Linde 80 0.083 1.604 0.01 0.007 0.605 0.11 0.57 0.3 0.29 0.008Nozzle
73 W8A Linde 80 0.083 1.33 0.011 0.01 0.77 0.12 0.59 0.47 0.3 0.00373 W9A Linde 0091 0.19 1.24 0.01 0.008 0.2 0.1 0. 0.49 0.3972 68W Linde 0091 0.1 1.38 0.00 0.00 0.16 0.0 0.13 0.6 0.0 0.00772 69W Linde 0091 0.14 1.19 0.01 0.00 0.19 0.0 0.1 0.54 0.1 0.00572 70W Linde 0124 0.1 1.48 0.011 0.011 0.44 0.13 0.63 0.4 0.056 0.00472 71W Linde 80 0.1 1.58 0.011 0.011 0.54 0.12 0.63 0.45 0.046 0.00570 Linde 80
61W btwn 0.09 1.48 0.0 0.014 0.57 0.16 0.63 0.3 0.2 0.005A533B 1
70 62W Linde 80 0083 1.51 0.1 0.007 0.59 0.1 0.53 0.37 0.21 0.01____ _____btwn A508 ___ ______ __ __ __
70 63W Linde80 0098 1.65 0.01 0.011 0.63 0.09 0.68 0.42 0.299 0.011btwn A508
70 64W Linde 80 0085 1.59 0.01 0.015 0.52 0.092 0.66 0.42 0.35 0.007btwn A508
70 65W Linde 80 0.08 1.45 0.015 0.015 0.48 0.088 0.597 0.385 0.215 0.006_____ ______btwn A508
70 Linde 80
70 66W tinde80 0.09d 1.63 0.018 0.009 0.54 0.105 0.595 0.4 0.42 0.009
btwn A50870 Linde 80
70 67W tindeO80 0.082 1.44 0.011 0.012 0.5 0.089 0.59 0.39 0.265 0.007
btwn A508
74 PTSE2 N/A 0.13 0.40 0.009 0.018 0.19 2.25 0.11 0.94 0.08Post
75 Onizawa A
Japanse N/A 0.11 1.30 0.015ý 0.010 0.30 0.17 0.68 0.53 0.16Plate .ind
75 Onizawa A-Late 80s N/A 0.19 1.43 0.004 0.001 0.19 0.13 0.6 0.50 0.0Japanese
PlateNote. References in this table are given in Appendix E.
5-16

Plate
72 Plate 02 1.77 613 751 12374 PTSE2 Post 0 469 621 6275 Onizawa A 0 469 614 15075 l0nizawa B 0 462 600 20771 VMidland Beltline Linde 80 0 407 586 88
Weld
71 Midland Beltline Linde 80 1 646 747 8071 Midland Nozzle Linde 80 0 545 655 87
71 Midland Nozzle Linde 80 1 701 792 68
73 W8A Linde 80 0 481 604 7973 N8A Linde 80 1.57 658 751 5473 N8A Linde 80 2.065 668 749 4973 N9A Linde 0091 0 564 659 15673 N9A Linde 0091 1.42 709 785 114
73 N9A Linde 0091 2.065 726 799 10C72 Weld 68W Linde 0091 0 553 641 199
72 Weld 68W Linde 0091 1.35 564 645 218
72 Weld 69W Linde 0091 0 638 722 199
72 Weld 69W Linde 0091 1.22 711 784 19E72 Weld 70W Linde 0124 0 478 594 10C72 Weld 70W Linde 0124 1.65 534 649 98
72 Weld 71W Linde 80 0 469 599 11C72 Weld 71W Linde 80 1.65 539 649 121
70 61W 0 480 626 8470 61W 1.24 600 722 7C70 62W 0 473 5901 9-
70 62W 1.36 615 702 8C70 63W 0 488 600 87
70 63W 1.19 625 710 68
70 64W 0 469 600 10C70 64W 0.68 579 696 7E70 65W 0 448 572 10E70 65W 0.7 572 662 7._70 66W 0 531 655 7E70 66W 0.94 641 745 5E
70 67W 0 462 607 10170 167W 0.8ý 579 69(
Note. References in this table are given in Appendix E.
5-17

En.
1500
1250
1000
750
500
* Un-Irradiated* Irradiatedo Gudas HY-80o Gudas A710•jCzyryca HSLA-100a Czyryca A710
000
riIý4 03 13" <9* ~4
250
020
250-150 -50 50 150
Temperature [°C]Figure 5-13 Relationship between Jj, and temperature for irradiated and unirradiated RPV
steels
1250
1000
co"
CM)
750
500
250 -
o Un-Irradiated* IrradiatedE3 Czyryca HSLA-100u Czyryca A710o GudasA710o Gudas HY-80-Z-A*2.09
- - - - 2.5% Confidence---- 97.5% Confidence
0
-250 - .-150 -50 50 150 250
Temperature [°C]Figure 5-14 Relationship between J1, and temperature for irradiated and unirradiated RPV
steels. Here the Ji, values have been normalized relative to the average value of Jc at288 -C (550 -F).
The fit to the normalized J1, data on Figure 5-14 is as follows:
Eq. 5-7 J, (T') - Ji, (28 C) =2.09{C, exp[r] - aý
r= [- C2 (T +273.15) + C,(T +273.15). 1n(ý)]
5-18

where Tre= 288 °C (or 561K), C1 = 1033 MPa, C2 = 0.00698/K, C3 = 0.000415/K, & = 0.0004/s,and c-ref = 3.33 MPa. This fit is of the same functional form as the dislocation-based model forflow behavior adopted by Zerilli and Armstrong (see Zerilli 87). This correspondence suggests aphysical basis for the consistent trend; Section 5.2.4.2 will discuss this in more detail.
5.2.4.1.3 Relationship Between Fracture Toughness in the Transition and Fracture Toughnesson the Upper Shelf
Identifying this common temperature dependency permits the use of the J1, database togetherwith the Master Curve for transition fracture toughness proposed by Wallin (see Eq. 4-3) toidentify a temperature above which upper-shelf behavior would be expected. As illustrated inFigure 5-15, fitting a Master Curve through Ki, data and fitting Eq. 5-7 through Jj, data definesthe temperature at which the curves intersect, which is labeled Tus. Like To, Tus is defined in asomewhat arbitrary fashion. Tus carries with it no particular physical interpretation (it is not, forexample, the temperature above which cleavage fracture cannot occur). However, defining Tususing identified temperature dependencies in transition and on the upper shelf that are commonto a broad range of steels offers the advantage of reduced ambiguity and, therefore, improvedaccuracy in the Tus index temperature definition.
Figure 5-16 shows the variation of Tus with T, for the steels listed in Table 5-5. The data on thisplot include both irradiated and unirradiated nuclear RPV steels (including plates and weldsmade using several flux types, including so-called "low upper-shelf' welds), as well as thehigher-strength, high toughness, copper-precipitation-hardened steels ASTM A710 and HSLA-100 used in surface ship fabrication. The data on Figure 5-16 exhibit a consistent trend over T,values spanning nearly 300 °C (540 *F). Dr. Kim Wallin of VTT in Finland has corroborated thistrend and provided the additional data shown in Figure 5-17. Dr. Wallin's data add morematerials to the database (VVER (in Russian, vodo-vodianyj energeticheskij reactor, or watermoderated, water cooled power reactor) steels and a ferritic stainless steel) and expand therange of T, values covered by the Tus relationship to nearly 400 'C (720 'F). The fit to thecomplete database (both that reported in EricksonKirk 04b and that provided by Wallin) is asfollows:
Eq. 5-8 Ts =50.1+0.794T, , T, and Tus in 0C
The consistency of this trend across such a wide range of ferritic steels strongly suggests anunderlying physical basis for the relationship between upper-shelf behavior and transitionbehavior (i.e., materials exhibiting higher transition temperatures behavior will also exhibit lowerupper-shelf fracture toughness). Section 5.2.4.2 suggests a physical basis for this trend (seeEricksonKirk 04b), while Section 5.2.5 utilizes this trend to develop a model for FAVOR whichcouples transition fracture toughness and upper-shelf fracture toughness using Eq. 5-7.
5.2.4.2 Physical Basis
Limited information has been written regarding a relationship between transition and upper-shelftoughness behavior. EricksonKirk 04b proposes the following explanation of a physical basisfor the observed trends in the data.
5-19

AUpper ShelfMaster Curve (Eq. 1)k. (mean curve)
U,
4) Wallin's Master Curve(median curve)
= )
0
a 100 MPa4m
LI.
U.
Temperature
Figure 5-15 Schematic illustrating the relationship between transition and upper-shelftoughness and defining the value Tus as the intersection of the Wallin Master Curve and
the upper-shelf Master Curve
The equation used to describe the temperature dependence of the upper-shelf fracturetoughness behavior, Eq. 5-7, follows the same temperature dependence as that shown by Zerilliand Armstrong (ZA) to describe the flow properties of ferritic steels (see Zerrili 87). This iswholly expected since the upper-shelf behavior is defined by the temperature dependence ofdislocation movement through the lattice. As temperature increases, lattice atom vibrationamplitude increases, reducing the barriers to dislocation motion presented by the lattice atoms.As with transition toughness, this translates to a toughness temperature dependence that isclosely related to that proposed by ZA for the flow stress. But while the transition toughnessincreases with increasing dislocation mobility, the upper-shelf toughness decreases becausedislocation structures remain more homogeneous, allowing large amounts of plastic strain withlittle hardening at lower energies.
The fact that both transition and upper-shelf toughness behavior can be predicted from thesame parameter (To) again lies within an understanding of the relationship of toughness to flowstress. Both are a measure of resistance of a material to crack extension or to dislocationmotion. Furthermore, they are inversely related by the fact that cleavage fracture occurs whendislocations stop moving, while ductile fracture occurs when dislocations continue to movethrough the matrix to grow holes in the material. Therefore, the cleavage fracture toughness issimply a measure of the cessation of ductile behavior in the material. Transition behaviormeasures the energy absorbed by dislocation motion prior to accumulating at a microstructuralnonhomogeneity, while upper-shelf behavior measures the energy absorbed when dislocationmotion does not stop, but continues to final material separation. Because cleavage crackingstops at temperatures above which ductile hole growth begins, the two parameters should beclosely related, and they should exhibit an inverse temperature dependence with each other.
The temperature dependence of the two curves is thus expected to be based on thetemperature dependence of dislocation motion through the lattice atoms, which, as shown byZA, remains the same throughout the temperature region in which dislocations move. Indeed,both curves have been shown to exhibit a ZA-predicted temperature relationship (see Natishan01, EricksonKirk 04b). The only metallurgical parameters that will affect the temperaturedependence of dislocation motion within BCC materials is the lattice atom structure itself, as
5-20
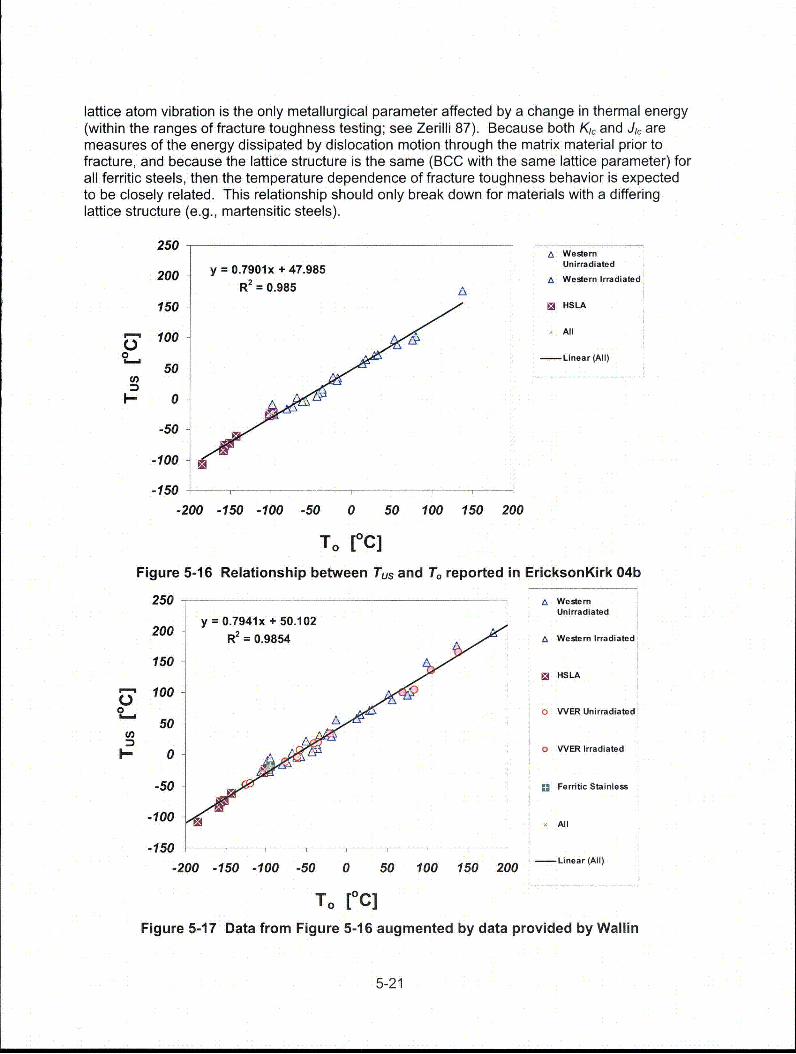
lattice atom vibration is the only metallurgical parameter affected by a change in thermal energy(within the ranges of fracture toughness testing; see Zerilli 87). Because both KI, and J1, aremeasures of the energy dissipated by dislocation motion through the matrix material prior tofracture, and because the lattice structure is the same (BCC with the same lattice parameter) forall ferritic steels, then the temperature dependence of fracture toughness behavior is expectedto be closely related. This relationship should only break down for materials with a differinglattice structure (e.g., martensitic steels).
250
200
150
100
50
0
y = 0.7901x + 47.9852R = 0.985 A•
A WesternUnirradiated
A Western Irradiated
[ HSLA
All
-Linear (All)0
L.,
U)
-50
-100
-150
-200 -150 -100 -50 0 50 100 150 200
To [0C]Figure 5-16 Relationship between Tus and T, reported in EricksonKirk 04b
250
200
150
100
50
0
0
I--
A WesternUnirradiated
A Western Irradiated
13 HSLA
o VVER Unirradiated
o VVER Irradiated
[ Ferritic Stainless
All
-Linear (All)
-50
.100-
-150 -
-200
F -1 50 150
-150 -100 -50 0 50 100 150 200
T, [°C]Figure 5-17 Data from Figure 5-16 augmented by data provided by Wallin
5-21

Table 5-5 Summary of Data Used in EricksonKirk 04b to Establish the Relationshipbetween T. and T,,m
S-I Mialana beln UInae ou U - -0071 Midland Nozzle Linde 80 0 A-36 2672 Plate 02 A533B 0 -25 4672 68W Linde 0091 0 -95 -1.072 69W Linde 0091 0 -17 5172 70W Linde 0124 0 -61 1372 71W Linde 80 0 -41 2680 ks-01 Linde 80 0 -23 4173 /8A Linde 80 0 -42 2073 /9A Linde 0091 0 -72 375 JAERI Plate A Like A533B 0 -67 875 JAERI Plate B Like A533B 0 -98 -376 A710 - GGO Plate -98 -2078 HSLA-100, GLG-1 Plate -152 -6878 HSLA-100, GLF-1.25 Plate -143 -5678 HSLA-100, GKO-2 Plate -102 -2578 A710 - GAW Plate -159 -8279 A710 - GFF Plate -185 -10379 A710 - GGN Plate -97 -2078 HSLA-100, GLC-1 Plate -157 -7078 HSLA-100, GKN-1.25 Plate -101 -2171 Midland Belt Linde 80 1E+19 29 7671 Midland Nozzle Linde 80 1E+19 57 9372 Plate 02 A533B 1.77E+19 53 11372 68W Linde 0091 1.35E+19 -80 072 69W Linde 0091 1.22E+19 17 8172 70W Linde 0124 1.65E+19 -36 3372 71W Linde 80 1.65E+19 -18 4780 ks-01 Linde 80 8.OOE+18 137 18273 W8A Linde 80 1.5E+19 80 11973 W8A Linde 80 2.1E+19 76 1173 W9A Linde 0091 1.5E+ 19 13 7573 W9A Linde 0091 2.11E+19 32 89
5.2.5 Incorporation of the New Upper-Shelf Model into FAVOR
The model developed in EricksonKirk 04b provides both a temperature dependency for upper-shelf fracture toughness and a means to locate the upper shelf relative to the transition fractureindex temperature, T.. To provide a complete model of fracture toughness on the upper shelffor use in FAVOR, the following four additional items are needed:
5-22

(1) a mathematical description of how upper-shelf fracture toughness is estimated only fromT, (this merely involves algebraic manipulation of equations already presented and isincluded for completeness)
(2) a discussion of the origin of the uncertainty in the Tus vs. To model (Eq. 5-8)
(3) a description of the scatter in JI, on the upper shelf
(4) a characterization of the J-R curve to account for stable tearing
The following four sections present these items in order.
5.2.5. 1 Procedure to Establish the Temperature Variation of Fracture Toughness for BothTransition and Upper Shelf Using Only To
A model of ferritic steel toughness that accounts for fracture mode transition behavior, upper-shelf behavior, and the interaction between these two different fracture modes can beconstructed based on Wallin's Master Curve (Eq. 4-3), the Tus vs. T, relationship (Eq. 5-8), andthe upper-shelf Master Curve (Eq. 5-7). Using these equations it is possible, as described in thesteps below, to estimate the complete variation of initiation fracture toughness with temperaturein both the transition regime and on the upper shelf based only on a measurement of To. Thisdescription repeats equations used elsewhere in the interest of clarity.
(1) Estimate To using ASTM E1921.
(2) Convert Wallin's Master Curve to J units:
J- = {30+70'exp(0.019(T-T))}2(1-v2)E
where E={207200-57.1.T} Tis in °C, Eis in MPa, and v = 0.3.
(3) Calculate Tus using the T, value from step 1.
Tus = 50.1 + 0.794To, (temperature in °C)
(4) Calculate J, using the equation in step 2 at Tus from step 3. Call this value Jq(us).
(5) Calculate AJI, at Tus using the following equation. Call this value AJIC(us).
AJ,,. - J,_J282 = 2.09{C. exp[]-o-,,f}, rv=[-C 2(T+273.15)+C 3(T+273.15).ln(,')]
whereTref = 288 °C (or 561K),C1 = 1033 MPa,C2 = 0.00698/K,C3 = 0.000415/K,g" = 0.0004/s, andOuef = 3.33 MPa.
5-23

(6) Let JADJUST = {JC(us)-AJIC(us)} using Jc(us) from step 4 and AJlc(us) from step 5.
(7) The variation of the mean value of Jtc with temperature can now be estimated as follows:
J,= 2.09{C,.exp[r]-O-f}+JADjVST, = [-C 2(T+273.15)+C 3 (T+273.15).ln(b)]
The equivalence of the median value of J, and the mean value of J1c at Tus is enforcedby the value of JADJUST calculated in step 6. Conversion of this equation to K-units canbe made by using the conventional relationship between J and K in plane strain:
J.EKj, = 1_U-
The FAVOR theory manual discusses how this procedure is adapted to be compatible with theinitiation fracture toughness index temperature used in FAVOR Version 04.1 (RTLS) (seeWilliams 04).
5.2.5.2 Uncertainty in the T, vs. Tus Relationship
The standard deviation of the fit represented by Eq. 5-8 is 8 °C (15 OF). It is possible to assessthe origin of this 8 °C (15 OF) uncertainty by examining how the residual between each (Tus, To)data point and the best fit of Eq. 5-8 depends (or not) on the number of Kjc and J1c values usedto estimate To and Tus, as follows:
* If the origin of the uncertainty about the best fit represented by Eq. 5-8 is error inaccurately resolving the measured values of To and Tus because of limited experimentalKj, and J,, data, then the residual between each (Tus, To) data point and the best fit ofEq. 5-8 will become smaller as the number of Kj, and Jc values used to estimate To andTus increases.
* If the origin of the uncertainty about the best fit represented by Eq. 5-8 arises because ofmaterial-dependent differences in.the Tus vs. To relationship, then the residual betweeneach (Tus, TO) data point and the best fit of Eq. 5-8 will be independent of the number ofKj, and Jc values used to estimate To and Tus.
The information in Figure 5-18 exhibits the trend expected from experimental error in accuratelyresolving the measured values of To and Tus, suggesting that the relationship between transitionfracture toughness and upper-shelf fracture toughness shown in Figure 5-17, and quantified byEq. 5-8, can be regarded as a best estimate, applicable to a very broad class of materials.Simulation in FAVOR of the uncertainty in Eq. 5-8 is therefore inappropriate because therelationship is not expected to vary from material to material.
5.2.5.3 Scatter in Jc Data
Establishing the scatter bands about Eq. 5-7, as shown in Figure 5-14, began by calculating thedifference between each measured AJc value in the database and the AJj, value predicted bythe fit (Eq. 5-7). Figure 5-19 shows the variation of these AJc residuals with temperature. Theresiduals were then divided into various bins having finite temperature ranges, and the standarddeviation of the residuals was calculated in each bin. Figure 5-19 also shows the variation of-
5-24

these standard deviations with temperature. The fit to the standard deviation values shown inFigure 5-19, together with Eq. 5-7, establish the scatter bands shown in Figure 5-14.
The FAVOR theory manual discusses the implementation of this information into FAVORVersion 04.1 (see Williams 04).
5.2.5.4 Estimation of the J-R Curve Tearing Parameter, m
To assess the ability of the RPV to sustain crack propagation by ductile tearing, an estimate ofthe J-R curve tearing parameter, m, is needed (see Figure 5-10). This parameter is notfrequently reported in the literature. Indeed, of the literature data summarized in Table 5-1through Table 5-5, only one citation (McGowan 88) reports this information. Figure 5-20 showsthe McGowan data. The FAVOR theory manual discusses the incorporation of this informationinto FAVOR Version 4.1 (see Williams 04).
30
U 200
l10
0'- 0w
LL -10
.20
-30 I10
2200 30
Number of Jjc Datum
30
'•20 -0
100L. 0UJ
U. -10
1-. -20
-30 --0 -20 600 40 80
Number of Kjc Datum
Figure 5-18 Effect of number of Kj, and Jj, data that underlie the T, and Tus values onFigure 5-17 on how well an individual Tus value agrees with the fit (Eq. 5-8) to all of the
data
5-25

5.2.6 Summary of Model and Uncertainty Treatment
Sections 5.2.4 and 5.2.5 established the various relationships necessary to build a probabilisticupper-shelf tearing model for FAVOR. This section summarizes this model, with reference toFigure 5-21.
Based on the value of the irradiated initiation fracture toughness index temperature, a value ofTus is estimated using Eq. 5-8. The uncertainty in the irradiated initiation fracture toughnessindex temperature was already simulated (see discussion of Figure 4-29 and Figure 4-42) andso does not need to be resimulated. The uncertainty Eq. 5-8 is small and, more importantly,results from the inability to accurately resolve the relationship using experimental data setsrather than from material-dependent differences in the underlying relationship (see discussion inSection 5.2.5.2). For these reasons, the uncertainty Eq. 5-8 is not simulated.
The value of Tus is used, along with the procedure detailed in Section 5.2.5.1, to estimate thevariation of J1, with temperature. Information in Sections 5.2.5.3 and 5.2.5.4 describes andquantifies the aleatory uncertainties in J1, and in the J-R curve exponent m, respectively.FAVOR simulates these aleatory uncertainties.
5.3 Material Property Gradient Model
The material property gradient model includes two parts, (1) a relationship between crackinitiation and crack arrest toughness (see Section 5.3.1), and (2) a relationship for welds thatdescribes how the chemical composition varies through the thickness of the vessel wall (seeSection 5.3.2).
5.3.1 Relationship between Crack Initiation and Crack Arrest Model
When performing a probabilistic fracture calculation, cracks may initiate, arrest, and reinitiate inthe same simulation run. Consequently, a relationship is needed between KI, and Kia data forthe same material. Certainly the information in Figure 5-4 is needed because this specifies thetemperature separation between the KI, and Kia curves. However, mathematical simulation ofcrack initiation, arrest, and subsequent reinitiation also requires the following information:
The arrest calculation requires the knowledge of whether permissible values of Kla areinfluenced in any way by the value of KI, at which the crack initiated.
The reinitiation calculation requires the knowledge of whether the permissible values ofKI, are influenced in any way by the value of KIa at which the crack arrested.
The following sections address these questions.
5.3.1.1 Influence of Kic on Subsequent Kia Values
Crack arrest toughness is undefined at values above the crack initiation toughness because thefact that the crack has initiated means that arrest was not possible. Thus, the value of crackinitiation toughness (k1,) establishes the maximum allowable Kia for temperature at which crackinitiation occurred (i'). As the crack propagates deeper into the vessel wall, the temperatureincreases above f for PTS loadings, so restricting the maximum allowable Kia to k,1 is no
5-26
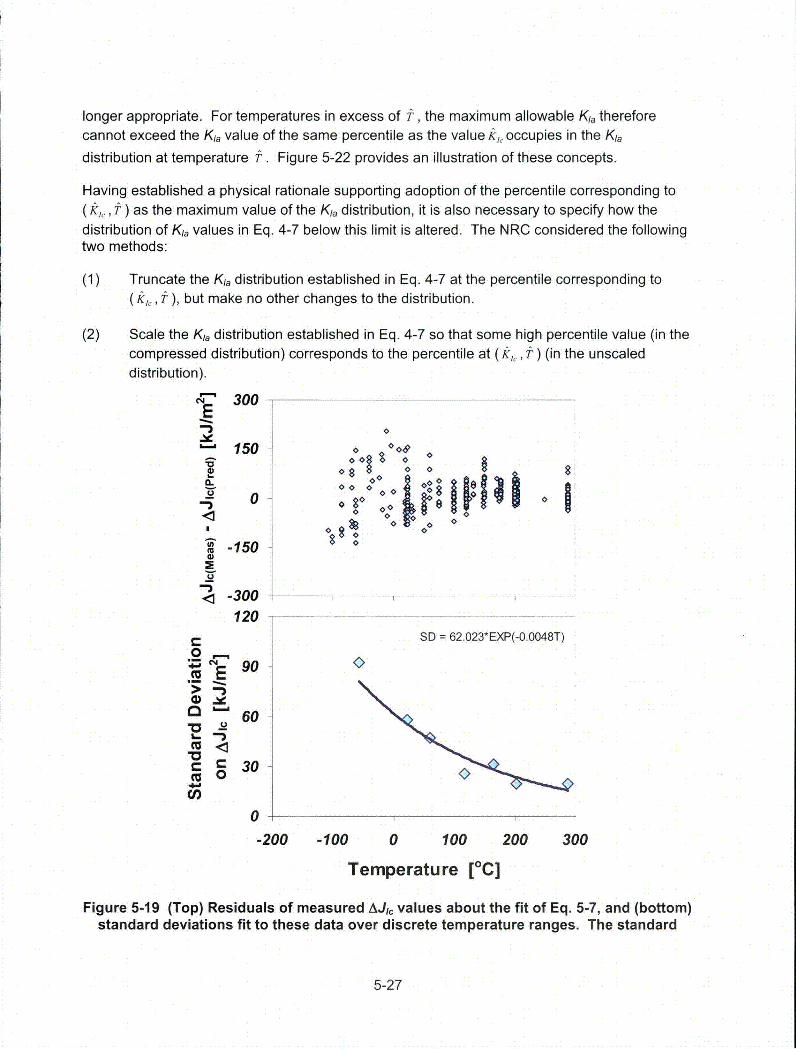
longer appropriate. For temperatures in excess of 1, the maximum allowable Kla thereforecannot exceed the Kia value of the same percentile as the value k,• occupies in the Ka
distribution at temperature 1. Figure 5-22 provides an illustration of these concepts.
Having established a physical rationale supporting adoption of the percentile corresponding to(/k, t) as the maximum value of the Kia distribution, it is also necessary to specify how thedistribution of Kla values in Eq. 4-7 below this limit is altered. The NRC considered the followingtwo methods:
(1) Truncate the Kia distribution established in Eq. 4-7 at the percentile corresponding to(k,, t ), but make no other changes to the distribution.
(2) Scale the KIa distribution established in Eq. 4-7 so that some high percentile value (in thecompressed distribution) corresponds to the percentile at (kk, ) (in the unscaleddistribution).
U,
.".
CM
U)E
300
150
0
-150
-300120
0*0 0 1 0
o
8
0
10C-
(U
SD = 62.023*EXP(-0.0048T)
E
-0
90
60
30
0'
-200 -100 0 100 200 300
Temperature [°C]
Figure 5-19 (Top) Residuals of measured AJI, values about the fit of Eq. 5-7, and (bottom)standard deviations fit to these data over discrete temperature ranges. The standard
5-27

deviation values are plotted at the midpoint of the temperature range over which thestandard deviation was calculated.
1.0
0.8 ,A [A
0 0.6
E 0.4 -
*Plate 02 Unirradlated *Plate 02 Irradiated0.2 A68W UnIrradiated A68W Irradiated
@69W Unlrradlated 0 69W Irradiated
370W Unirradiated El 70W Irradiated
071W Unirradlated +71W Irradiated
0.0 1. --------- .
-100 0 100 200 300
Temperature [°C]
Figure 5-20 Temperature dependency of J-R curve exponent m values for a number ofnuclear RPV steels (McGowan 88)
In the absence of any physical insight to suggest the technical superiority of one method overthe other, FAVOR adopted method 2 for the purpose of computational efficiency.
5.3.1.2 Influence of Kia on Subsequent KI, Values
Crack initiation toughness is undefined at values below the crack arrest toughness because thefact that the crack has arrested means that it could no longer propagate. This idea is supportedby the experimental observation that the crack arrest toughness transition curve always fallsbelow the crack initiation toughness transition curve. This physical argument establishes thevalue of crack arrest toughness (k, ) as the minimum allowable KI, for the temperature at whichcrack arrest occurred, f . As the transient continues after crack arrest, the temperature at thearrest location falls below T. Consequently, restricting the minimum allowable Kc to kh, is nolonger appropriate. Therefore, for temperatures below ý, the minimum allowable K1, thereforecannot exceed the Kla value of the same percentile as the value ki, occupies in the Kia
distribution at temperature T.
The argument presented in the preceding paragraph establishes the physically admissiblebounds on the Kc distribution presuming that a value of KIa is known for the material. WereFAVOR modeling crack arrest probabilistically, these bounds would establish the limits of the Ki,distribution. However, FAVOR simulates the aleatory uncertainty in crack arrest data toughnessusing a Monte Carlo approach in which a large number of deterministic crack arrest analysesare performed to estimate what fraction of the flaws that initiate can be expected to extendthrough the wall and fail the vessel. In this context, the only consistent choice for K,0 whenchecking for crack reinitiation is the K,0 value having the same percentile as the K,0 value that
5-28

initiated the crack originally. This value of KI, falls within the physically admissible bounds onthe KI, distribution because of the restrictions placed on the Kl, distribution in Section 5.3.1.1.
5-29

Aleatory Uncertainty Modeled
Uncerta4~inty Moee E'l~**1[4 lsewhere
In alad~ D,"~Trougtwm Ilugex
TenWeraure
(rohm InhIfaionc model)
Not Appropriate to Model Uncertainty(see t_0
250
y = 0.7941x + 50.102200 R' = 0.9854
150
- 100
s, o
50I,- 0
-50
-100
-150
-200 -150 -100 -50 0 50 100 150 200
T. [°C]
Figure 5-21 Schematic of the FAVOR Version 04.1 upper-shelf tearing model showing therecommended models, input values, and uncertainty treatment
5-30
5.3.2 Through-Wall Composition Gradients for Welds
In the early years of nuclear RPV construction in the United States, it was commonmanufacturing practice to copper coat the welding wires used in RPV fabrication to inhibitcorrosion. By the early 1970s, the damaging effects of copper on a steel's resistance toirradiation damage was recognized, and so the practice of copper coating was abandoned.However, all of the early production vessels, those that now lie closest to the PTS screeninglimits, were fabricated with copper-coated weld wires*tt. The copper coating process was notwell controlled, which led to varying amounts of copper being deposited on different spools ofwelding wire. As a consequence of the limited size of these spools and the large volume ofweld metal needed to make a PWR weld, it was generally not possible to complete the weldingof either the axial seams or the girth welds using a single spool of wire. Evidence of this can beseen in through-thickness compositional surveys (see CEOG). Thus, in order to appropriatelymodel the fracture resistance of the welds in these early vessels, it is important that FAVORaccount for the effects of variations in copper content through the thickness of an RPV weld.
Using the following information, one can estimate the number of layers in an RPV weld that caneach be expected to have a consistent copper content because the weld metal in the layer wasdeposited all from the same spool of weld wire:
(1) the vessel wall thickness
(2) the vessel diameter
(3) the dimensions of the weld prep
(4) the amount of wire in a single spool
(5) details of the welding process, including whether tandem or single-wire feed was usedand information regarding the welding sequence (i.e., how may welds were madesimultaneously)
Table 5-6 summarizes this information for the welds in the four plants being modeled, and usesit to estimate (in the last column) the number of distinct layers in these RPV welds. The numberof layers was determined by dividing Two by tWALL, rounding to the nearest integer, and adding 1.Rounding off and adding 1 accounts for the use of less-than-full spools of welding wire at thebeginning of fabrication.
The information in Table 5-6 demonstrates that RPV welds can be composed of between twoand eight weld layers, each having (potentially) different copper contents. In view of the factthat the calculations in Table 5-6 are merely estimates, and in the interest of computationalease, FAVOR models all welds as having four layers.
To simulate the effect of distinct weld layers on vessel integrity, the following procedure is usedin FAVOR:
(1) Divide the vessel thickness evenly into four weld layers.
t The three plants being analyzed as part of the PTS reevaluation effort were all early productionvessels, and so were all manufactured using copper-coated weld wire.
5-31

(2) During the course of a crack arrest analysis (see Section 5.1.2), crack propagation issimulated through the vessel wall. When the crack tip passes into a new weld layer,determine new values of chemistry (copper, nickel, and phosphorus) using the meanand standard deviation values associated with the weld region in which the crack islocated (formulas in Appendix D describe the distributions of copper, nickel, andphosphorous).
(3) Determine a new value of irradiation shift using these new composition values and theprocedure detailed in Appendix D.
(4) Because the steel in the new weld layer has different material properties than that in thepreceding weld layer, eliminate all restrictions on the KI, and/or Kia distributionestablished based on initiation and arrest events that occurred in the preceding layer(see Section 5.3.1 ) because the physical rationale that justified these restrictions appliesonly to the material in which crack initiation and/or crack arrest occurred.
(0Co-
T- RTNDT
4,
(0(0W
M
C-4
T- RTNDT
Figure 5-22 Illustration of the proposed procedure to limit K1a values dependent upon theKi, value that started the simulation
5-32

Table 5-6 Layers of Uniform Copper Content Expected in RPV Welds
T I Likely# WldsFull Spool Numberlo
a#Welds # of Vessel Weld Weld Weld Layer Number ofMade T Arcs, Thick., Length, Width, ThicknessrLayers in
Plant One Time, NARC tWALL [in] L [in.] W [in.] Th [in.]es the RPV______ WlNWELD , NWL
Intermediate 3 2 96.00 1.4375 4.25 3Axial
Palisades Lower Axial 3 2 8.5 92.72 1.4375 4.40 3
All 1 1 553.71 1.3125 1.21 8Circumferential
Intermediate 3 2 96.75 1.375 4.41 3;Axial
CalvertAxaClvert Lower Axial 3 2 8.625 97.38 1.375 4.38 3Cliffs 1 ___
AllCircumferential 1 1 553.90 1.25 1.27 8
Intermediate 2 2 100.63 1.375 6.36 2AxialBeaver
Valley Lower Axial 2 2 7.875 100.63 1.375 6.36 2Allle_ Circumferential 1 1 505.60 1.25 1.39 7
Intermediate 2 1 30.00 1.625 12.64 2Axial
Oconee1 Lower & Upper 2 1 8.44 73.19 1.625 5.18 3Axial
_ Ji 1 1 536.40 1.625 1.41 7Circumferential
Formulas: p=O.2841bs/in 3
VCo0L = WCOIL / P
TW -VCL NARC
W EN W E L . W
NWL = ROUND(TwL /tWALL) + 1
5-33

6 REFERENCES
10 CFR 50.61
Appendix H to10 CFR Part 50
ASME NB2331
ASTM E23
ASTM E185
ASTM E208
ASTM E399
ASTM E900
ASTM E1221
ASTM E1921
Bass 04
Bowman 00
Brothers 63
U.S. Code of Federal Regulations, Section 50.61, "FractureToughness Requirements for Protection Against Pressurized ThermalShock Events," Title 10, "Energy."U.S. Code of Federal Regulations, Part 50, Appendix H,
"Reactor Vessel Material Surveillance Program Requirements, Title10, "Energy."American Society of Mechanical Engineers, "1998 ASME Boiler andPressure Vessel Code, Rules for Construction of Nuclear PowerPlants, Division 1, Subsection NB, Class 1 Components," ASME NB-2331.American Society for Testing and Materials, "Standard Test Methodsfor Notched Bar Impact Testing of Metallic Materials," ASTM E23,1998.American Society for Testing and Materials, "Standard Practice forConducting Surveillance Tests for Light-Water Cooled Nuclear PowerReactor Vessels," ASTM E185-94, 1998.American Society for Testing and Materials, "Standard Test Methodfor Conducting Drop-Weight Test to Determine Nil-Ductility TransitionTemperature of Ferritic Steels," ASTM E208, 1998.
American Society for Testing and Materials, "Test Method for Plane-Strain Fracture Toughness Testing of Metallic Materials," ASTM E399,1998.American Society for Testing and Materials, "Standard Guide forPredicting Radiation-Induced Transition Temperature Shift in ReactorVessel Materials, E706 (IIF)," ASTM E900-02, 2002.
American Society for Testing and Materials, "Standard Test Methodfor Plane-Strain Crack-Arrest Fracture Toughness, Kie, of FerriticSteels," ASTM E1221-96, 1996.
American Society for Testing and Materials, "Test Method forDetermination of Reference Temperature, T0, for Ferritic Steels in theTransition Range," ASTM E1921-02, 2002.Bass, B.R., et al., "Experimental Program for Investigating theInfluence of Cladding Defects on Burst Pressure," ORNL/NRC/LTR-04/13, NRC Adams Number ML042660206, 2004.
Bowman, K.O. and P.T. Williams, "Technical Basis for StatisticalModels of Extended K1, and KIa Fracture Toughness Databases forRPV Steels," ORNL/NRC/LTR-99/27, Oak Ridge National Laboratory,February, 2000.Brothers, A.J. and S. Yukawa, "The Effect of Warm Prestressing onNotch Fracture Strength," Journal of Basic Engineering, p. 97, March1963.
6-1

BUGLE
Carew 01Charpy
Cheverton 85a
Cheverton 85b
Chopra 05
Congleton 85
Datsco 87
DORT
Eason 91
Eason 98
Eason 03
EPRI 94
EricksonKirk 04a
EricksonKirk 04b
Iskander, S.K., R.D. Cheverton, and D.G. Ball, OCA-I, A Code forIngersoll 95 (Flu2) Ingersoll, D.T., J.E. White, R.Q. Wright, H.T.Hunter, C.O. Slater, N.M. Greene, R.E. MacFarlane, and R.W.Roussin, "Production and Testing of the VITAMIN-B6 Fine-Group andthe BUGLE-93 Broad-Group Neutron/Photon Cross-section LibrariesDerived from ENDF/B-VI Nuclear Data," ORNL-6795, NUREG/CR-6214, January 1995.
Private communication.Charpy, M.G., "Note sur r'Essai des Metaux a la Flexion par Choc deBarreaux Entailles," Soc. Ing. Francais, p. 848, June 1901.Cheverton, R.D., et al., "Pressure Vessel Fracture Studies Pertainingto the PWR Thermal-Shock Issue: Experiments TSE-5, TSE-5A, andTSE-6," ORNL-6163, NUREG/CR-4249, Oak Ridge NationalLaboratory, June 1985.Cheverton, R.D., et al., "Pressure Vessel Fracture Studies Pertainingto the PWR Thermal-Shock Issue: Experiment TSE-7," ORNL-6177,NUREG/CR-4303, Oak Ridge National Laboratory, August 1985.Chopra, O.K., et al., "Crack Growth Rates of Irradiated AusteniticStainless Steel Weld Heat Affected Zone in BWR Environments,"NUREG/CR-xxxx, in publication.Congleton, J., T. Shoji, and R.N. Parkins, "The Stress CorrosionCracking of Reactor Pressure Vessel Steel in High TemperatureWater," Corrosion Science Vol. 25, No. 8/9, 1985.Datsco, J., "Material Properties and .Manufacturing Processes," pp.18-20, John Wiley & Sons, Inc., New York, 1966."DORT, Two-Dimensional Discrete Ordinates Transport Code," RSICComputer Code Collection, CCC-484, Oak Ridge National Laboratory,1988.Eason, E.D., J.E. Wright, and E.E. Nelson, "Multivariable Modeling ofPressure Vessel and Piping J-R Data," U.S. Nuclear RegulatoryCommission, NUREG/CR-5729, April 1991.Eason, E.D., J.E. Wright, and G.R. Odette, "Improved EmbrittlementCorrelations for Reactor Pressure Vessel Steels," U.S. NuclearRegulatory Commission, NUREG/CR-6551, 1998.Kirk, M.T., et al., "Updated Embrittlement Trend Curve for ReactorPressure Vessel Steels," Transactions of the 17th InternationalConference on Structural Mechanics in Reactor Technology (SMiRT17), Prague, Czech Republic, August 17-22, 2003.Electric Power Research Institute, "PWR Reactor Pressure VesselLicense Renewal Industry Report," Rev. 1, EPRI Report TR-103837,July 1994.EricksonKirk, M., et al., "Technical Basis for Revision of thePressurized Thermal Shock (PTS) Screening Limit in the PTS Rule(10 CFR 50.61): Summary Report," U.S. Nuclear RegulatoryCommission, NUREG-1806.EricksonKirk, M.A., "Materials Reliability Program: ImplementationStrategy for Master Curve Reference Temperature, T, (MRP-101),"
6-2
EricksonKirk 04c
English 02
Hurst 85
IAEA 90
Kasza 96
Khaleel 00
Kirk 98
Kirk 01a
Kirk 01 b
Kirk 02a
McCabe
McGowan 88
MESH
Electric Power Research Institute, Palo Alto, California, and U.S.Department of Energy, Washington, D.C., 2004. 1009543.EricksonKirk, M., et al., "Sensitivity Studies of the ProbabilisticFracture Mechanics Model Used in FAVOR," U.S. Nuclear RegulatoryCommission, NUREG-1808. 2007English, C. and W. Server, "Attenuation in US RPV Steels-MRP-56,"Electric Power Research Institute, June 2002.Hurst, P., et al., "Slow Strain Rate Stress Corrosion Tests on A508-111and A533B Steel in De-lonized and PWR Water at 563K," CorrosionScience, Vol. 25, No. 8/9, 1985.Proceedings of the Third International Atomic Energy AgencySpecialists' Meeting on Subcritical Crack Growth, "Stress CorrosionCracking of Pressure Vessel Steel in PWR Primary WaterEnvironments," U.S. Nuclear Regulatory Commission, Moscow, May14-17,1990.Kasza, K.E., et al., "Nuclear Plant Generic Aging Lessons Learned(GALL)," U.S. Nuclear Regulatory Commission, NUREG/CR-6490,October 1996.Khaleel, M.A., et al., "Fatigue Analysis of Components for 60-YearPlant Life," U.S. Nuclear Regulatory Commission, NUREG/CR-6674,June 2000.Kirk, M., et al., "Empirical Validation Of The Master Curve ForIrradiated And Unirradiated Reactor Pressure Vessel Steels,"Proceedings of the 1998 ASME/JSME Pressure Vessel and PipingSymposium, San Diego, California, July 26-30, 1998.Kirk, M.T., M.E. Natishan, and M. Wagenhofer, "Microstructural Limitsof Applicability of the Master Curve," 3 2nd Volume, ASTM STP-1406,R. Chona, ed., American Society for Testing and Materials,Philadelphia, PA 2001.Kirk, M., and M.E. Natishan, "Shift in Toughness TransitionTemperature Due to Irradiation: AT, vs. AT 41j, A Comparison andRationalization of Differences," Proceedings of the IAEA SpecialistsMeeting on Master Curve Technology, Prague, Czech Republic,September 2001.Kirk, M.T., M.E. Natishan, and M. Wagenhofer, "A Physics-BasedModel for the Crack Arrest Toughness of Ferritic Steels," Fatigue andFracture Mechanics, 3 3 rd Volume, ASTM STP-1417, W.G. Reuter,and R.S. Piascik, eds., American Society for Testing and Materials,West Conshohocken, Pennsylvania, 2002.McCabe, D.E., et al., "Evaluation of WE-70 Weld Metal from theMidland Unit 1 Reactor Vessel," U.S. Nuclear RegulatoryCommission, NUREG/CR-5736, November 2002.McGowan, et al., "Characterization of Irradiated Current-PracticeWelds and A533 Grade B Class 1 Plate for Nuclear Pressure VesselService," U.S. Nuclear Regulatory Commission, NUREG/CR-4880,1988."MESH-A Code for Determining the DORT Fixed Neutron Source,"Memorandum, M.D. Zentner to J.F. Carew, BNL, August 25, 1981.
6-3

Meyers 99
Nanstad 93
Natishan 98
Natishan 99a
Natishan 99b
Natishan 01
NRC MEMO 82
NRC MTEB 5.2
NRC LTR 02
ORNL 85a
ORNL 85b
ORNL 86
Pellini 63
Pellini 76
Meyers, M.A and K.K. Chawla, "Mechanical Behavior of Materials,"Prentice Hall, Upper Saddle River, New Jersey, 1999.Nanstad, R.K., J.A. Keeney, and D.E. McCabe, "Preliminary Reviewof the Bases for the KI, Curve in the ASME Code," ORNL/NRC/LTR-93/15, Oak Ridge National Laboratory, Oak Ridge, Tennessee, 1993.Natishan, M.E. and M. Kirk, "A Micro-mechanical Evaluation of theMaster Curve," Fatigue and Fracture Mechanics, 3 0th Volume, ASTMSTP-1360, K. Jerina and P. Paris, eds., American Society for Testingand Materials, 1998.Natishan, M.E., M. Wagenhoefer, and M.T. Kirk, "DislocationMechanics Basis and Stress State Dependency of the Master Curve,"Fracture Mechanics, 3 1st Symposium, ASTM STP 1389, K. Jerina andJ. Gahallger, eds., American Society for Testing and Materials, 1999.
Natishan, M.E. and M. Kirk, "A Physical Basis for the Master Curve,"Proceedings of the 1999 American Society of Mechanical EngineersPressure Vessel and Piping Conference, American Society ofMechanical Engineers, July 1999.Natishan, M.E., "Materials Reliability Program (MRP) Establishing aPhysically Based, Predictive Model for Fracture Toughness TransitionBehavior of Ferritic Steels (MRP-53)," Electric Power ResearchInstitute, Palo Alto, California, 2001. 1003077.Memorandum from M. Vagans to S. Hanauer (DST/NRR), August 30,1982.METB 5-2, Branch Technical Position, "Fracture ToughnessRequirements," Rev. 1, July 1981.Memorandum from Thadani to Collins on "Transmittal of TechnicalWork to Support Possible Rulemaking on a Risk-Informed Alternativeto 10 CFR 50.46/GDC 35," July 31, 2002. (ADAMS Accession No.ML022120660)Oak Ridge National Laboratory, "Pressurized Thermal ShockEvaluation of the Calvert Cliffs Unit 1 Nuclear Power Plant,"NUREG/CR-4022, ORNL/TM-9408, for the U.S. Nuclear RegulatoryCommission, September 1985.Oak Ridge National Laboratory, "Pressurized Thermal ShockEvaluation of the H.B. Robinson Unit 2 Nuclear Power Plant,"NUREG/CR-4183, ORNL/TM-9567, for the U.S. Nuclear RegulatoryCommission, September 1985.Oak Ridge National Laboratory, "Preliminary Development of anIntegrated Approach to the Evaluation of Pressurized Thermal Shockas Applied to the Oconee Unit 1 Nuclear Power Plant," NUREG/CR-3770, ORNL/TM-9176, for the U.S. Nuclear Regulatory Commission,May 1986.
Pellini, W.S. and P.P. Puzak, "Fracture Analysis Diagram Proceduresfor the Fracture-Safe Engineering Design of Steel Structures,"Welding Research Council Bulletin 88, May 1963.
Pellini, W.S., "Principals of Structural Engineering Technology,"United States Office of Naval Research, Library of CongressCatalogue Number 76-50534, 1976.
6-4
RG 1.174
RG 1.99
RELAP 99
RELAP 01
Rippstein 89
RPVDATA
RVID2
RG 1.154
RG 1.162
RG 1.190
Rolfe
SECY-82-465
SECY-02-0092
Simonen 04
Siu 99
Sokolov 96
Taylor 34
Wagenhofer 01
U.S. Nuclear Regulatory Commission, "Format and Content of Plant-Specific Pressurized Thermal Shock Safety Analysis Reports forPressurized Water Reactors," Regulatory Guide 1.174, 1998.USNRC Regulatory Guide 1.99, Revision 2, "Radiation Embrittlementof Reactor Vessel Materials," May 1988.
RELAP5/MOD3 Code Manual, Volume IV: Models and Correlations,June 1999.RELAP5/MOD3.3 Code Manual-Volume III, "DevelopmentalAssessment Problems," December 2001.Rippstein, K. and H. Kaesche, "The Stress Corrosion Cracking of aReactor Pressure Vessel Steel in High Temperature Water at HighFlow Rates" Corrosion Science, Vol. 29, No. 5, 1989.
Griesbach, T.J., and J.F. Williams, "User's Guide to RPVDATA,Reactor Vessel Materials Database," Westinghouse Energy SystemsBusiness Unit, WCAP-14616, 1996.U.S. Nuclear Regulatory Commission Reactor Vessel IntegrityDatabase, Version 2.1.1, July 6, 2000.U.S. Nuclear Regulatory Commission, "Format and Content of Plant-Specific Pressurized Thermal Shock Safety Analysis Reports forPressurized Water Reactors," Regulatory Guide 1.154, 1987.
U.S. Nuclear Regulatory Commission, "Thermal Annealing of ReactorPressure Vessel Steels," Regulatory Guide 1.162.
U.S. Nuclear Regulatory Commission, "Calculational and DosimetryMethods for Determining Pressure Vessel Neutron Fluence,"Regulatory Guide 1.190, March 2001.Rolfe, S.T. and J.T. Barsom, Fracture and Fatigue Control inStructures: Applications of Fracture Mechanics, Second Edition,Prentice-Hall, 1987.U.S. Nuclear Regulatory Commission, "Pressurized Thermal Shock,"Commission Paper SECY-82-465, November 23, 1982.U.S. Nuclear Regulatory Commission, "Status Report: Risk Metricsand Criteria for Pressurized Thermal Shock," Commission PaperSECY-02-0092, May 30, 2002.Simonen, F.A., et al., "A Generalized Procedure for Generating FlawRelated Inputs for the FAVOR Code," U.S. Nuclear RegulatoryCommission, NUREG/CR-6817, Rev. 1."Uncertainty Analysis and Pressurized Thermal Shock, An Opinion,"U.S. Nuclear Regulatory Commission, 1999. (ADAMS Accession No.ML992710066)Sokolov, M.A. and R.K. Nanstad, "Comparison of Irradiation InducedShifts of Kic and Charpy Impact Toughness for Reactor PressureVessel Steels," ASTM STP-1325, American Society of Testing andMaterials, 1996.Taylor, G.I., "The Mechanism of Plastic Deformation of Crystals,"Proc. Roy. Soc., Vol. A145, pp. 362-404,1934.Wagenhofer, M. and M.E. Natishan, "A Micromechanical Model forPredicting Fracture Toughness of Steels in the Transition Region,"
6-5

Wallin 84a
Wallin 84b
Wallin 84c
Wallin 84d
Wallin 91
Wallin 93a
Wallin 93b
Wallin 97b
Wallin 98
Wallin 98b
Wallin 01
WRC 175
Williams 04
Woods 01
33 'd Volume, ASTM STP-1417, Reuter and Piascik, eds., AmericanSociety for Testing and Materials, Philadelphia, Pennsylvania, 2002.Wallin, K., T. Saario, and K. Tdrrbnen, "Statistical Model for CarbideInduced Brittle Fracture in Steel," Metal Science, Vol. 18, pp. 13-16,January 1984.Wallin, K., et al., "Mechanism-Based Statistical Evaluation of theASME Reference Fracture Toughness Curve," 5th InternationalConference on Pressure Vessel Technology, Vol. II, "Materials andManufacturing," San Francisco, California, American Society ofMechanical Engineers, 1984.Wallin, K., "The Scatter in Kc Results," Engineering FractureMechanics, 19(6), pp. 1085-1.093, 1984.Wallin, K., "The Size Effect in KI, Results," Engineering FractureMechanics, 22, pp. 149-163, 1985.Wallin, K., "Statistical Modelling of Fracture in the Ductile to BrittleTransition Region," Defect Assessment in Components-Fundamentals and Applications, G. Blauel and K.H. Schwalbe, eds.,ESIS/EGF9, pp. 415-445, 1991.Wallin, K., "Irradiation Damage Effects on the Fracture ToughnessTransition Curve Shape for Reactor Vessel Steels," Int. J. Pres. Ves.& Piping, 55, pp. 61-79,1993.Wallin, K., "Statistical Aspects of Constraint with Emphasis on Testingand Analysis of Laboratory Specimens in the Transition Region,"Constraint Effects in Fracture, ASTM STP-1171, E.M. Hackett, K.H.Schwalbe, and R.H. Dodds, eds., American Society for Testing andMaterials, 1993.Wallin, K., "Loading Rate Effect on the Master Curve T,," Paper IIW-X-1403-97, 1997.Wallin, K., "Master Curve Analysis of Ductile to Brittle Region FractureToughness Round Robin Data: The 'EURO' Fracture ToughnessCurve," VTT Manufacturing Technology, VTT Publication 367, 1998.Wallin, K., and R. Rintamaa, "Master Curve Based CorrelationBetween Static Initiation Toughness Kio and Crack Arrest ToughnessKia," Proceedings of the 24th MPA-Seminar, Stuttgart, October 8-9,1998.Wallin, K., "Low-cost J-R curve estimation based on CVN upper shelfenergy," Fatigue and Fracture of Engineering Materials andStructures, 24, pp. 537-549, 2001.PVRC Ad Hoc Group on Toughness Requirements, "PVRCRecommendations on Toughness Requirements for FerriticMaterials," Welding Research Council Bulletin No. 175, August 1972.Williams, P.T. and T.L. Dickson, "Fracture Analysis of Vessels-OakRidge, FAVOR v04.1, Computer Code: Theory and Implementation ofAlgorithms, Methods, and Correlations," U.S. Nuclear RegulatoryCommission, NUREG/CR-6854.Woods, R., et al., "Selection of Pressurized Thermal Shock Transientsto Include in PTS Risk Analysis," IJPVP, 78, pp. 179-183, 2001.
6-6

Zerilli 87 Zerilli, F.J., and R.W. Armstrong, "Dislocation-Mechanics-BasedConstitutive Relations for Material Dynamics Calculations," J. Appl.Phys., Vol. 65, No. 5, pp. 1816-1825, March 1987.
6-7


APPENDIX ALEFM VALIDITY
ORNL/NRC/LTR-03/1 1, Pugh, C.E. and Bass, B.R., "Results from Large-scale FractureExperiments and Validation of Linear Elastic Fracture Mechanics for Use in PTS Analyses,"June 2003.
A-1


ORNL/NRC/LTR-03/11
Results from Large-scale Fracture Experiments and Validationof Linear Elastic Fracture Mechanics for Use in PTS Analyses
C. E. PughOak Ridge Structural Assessments, Inc.
Knoxville, Tennessee
B. R. BassOak Ridge National Laboratory
Oak Ridge, Tennessee
Date Published - June 2003
Prepared forU. S. Nuclear Regulatory CommissionOffice of Nuclear Regulatory Research
Under Interagency Agreement DOE 1886-N653-3YNRC JCN No. Y6533
Prepared byOAK RIDGE NATIONAL LABORATORY
Oak Ridge, Tennessee 37831-8056Managed and Operated by
UT-Battelle, LLCFor the
U. S. DEPARTMENT OF ENERGYUnder Contract No. DE-AC05-00OR22725


CONTENTS
LIST OF FIGURES .......................................................................................... A-4
LIST OF TABLES .......................................................................................... A-6
ABSTRACT ........................................................... A-7
INTRODUCTION ......................................................................................... A-7
INTERMEDIATE TEST VESSEL (ITV) EXPERIM ENTS .......................................... A-9
THERMAL-SHOCK EXPERIMENTS ................................................................. A-15
PRESSURIZED THERMAL-SHOCK EXPERIMENTS ............................................ A-23
CONCLUSIONS FROM LARGE-SCALE EXPERIENTS ........................................... A-32
REFERENCES ............................................................................................ A-32
A-3

LIST OF FIGURES
A-2.1 Schematic of ITV-7 test vessel. Dimensions were the same for eachITV vessel, while the specifics of the flaw region and test material variedfrom test to test . ............................................................................ A -9
A-2.2 Test temperatures superimposed on a Charpy curve illustrate relativecondition of the twelve ITV experiments. Fracture surfaces are alsocharacterized for each test ................................................................ A-1I
A-2.3 ITV-2 vessel was tested under high pressure and at a temperature (32°F) low inthe Charpy transition region; fracture was by fast cleavage propagation ............ A-12
A-2.4 ITV-6 vessel was tested under pressure and at a temperature (190'F) wellabove onset of Charpy upper shelf; fracture was by ductile shear .................. A-12
A-2.5 ITV-1 vessel was tested under pressure and at a temperature (130°F) high inthe Charpy transition region; fracture was mixed cleavage and ductilebehavior ................................................................................... .. A -13
A-2.6 Load factors for six large-scale ITV experiments [Pf/Pd = fracture pressure todesign pressure ratio) and (Pd/PLEFM = fracture pressure to LEFM predicted pressurepressure ratio)] .............................................................................. A -14
A-3.1 Typical instantaneous temperature, stress, fluence, stress-intensity factor, and
fracture-toughness distributions through wall of PWR vessel during LBLOCA.....A-17
A-3.2 Critical-crack-depth curves for PWR vessel during LBLOCA ......................... A-17
A-3.3 Schematic of ORNL's thermal shock test facility used for TSE-5, 5A, 6, and 7.....A-19
A-3.4 TSE test cylinder like those used in TSE-5, -5A, -6, and -7 ............................. A-20
A-3.5 Cross section of TSE-5 test cylinder showing the three long crackjumps that occurred during the thermal shock ............................................. A-20
A-3.6 Comparison of Kic data from TSE cylinder tests and laboratory specimens ...... A-22
A-3.7 Comparison of Kia data from TSE cylinder tests and laboratory specimens ...... A-22
A-4.1 Geometry of PTSE-1 test vessel ............................................................. A-25
A-4.2 Test vessel being lowered into outer containment vessel at HSSTP T S test facility ............................................................................... A -25
A-4
A 4.3 Essential features of the simple WPS cycle: (a) loading transient;(b) coordination of transient crack driving force with fracture toughnessto induce sim ple W PS conditions . ...................................................... A-26
A-4.4 Idealized crack driving force transient for PTSE-1 ...................................... A-27
A-4.5 Pressure transients for PTSE-1A, -IB, and -IC ......................................... A-28
A-4.6 Results of OCA analyses of PTSE- I transients based on measuredtemperature, pressure, flaw depth, and time of the crack jump ........................ A-28
A-4.7 Comparison of curves representing small-specimen KIc and Kia data withASME Section XI curves and results of PTSE-1 experiment ......................... A-30
A-4.8 Result of FAVOR re-analyses of PTSE- 1 experiment: (a) predictions basedon small-specimen data; (b) interpretation based on measured temperature,pressure, flaw depth, and time of the crack jump ...................................... A-31
A-4.9 Comparison of PTSE- 1 arrest-toughness results with those for wide-plateand thermal-shock experiments, as well as with ASME Section XI curve ........... A-31
A-5
LIST OF TABLES
A-2.1 ITV test sequence and test parameters ................................................ A-10
A-2.2 List of detailed reports on individual ITV experiments ................................ A-11
A-2.3 Results from six ITV experiments using specimens without nozzles .................. A- 14
A-4.1 Geometric parameters of the PTSE- 1 vessel ................................................ A-25
A-4.2 Conditions for PTSE-lA. -1B, and -1C transients ......................................... A-27
A-6

Results from Large-Scale Fracture Experiments and Validation of LinearElastic Fracture Mechanics for Use in PTS Analyses
C. E. Pugh and B. R. Bass
ABSTRACT
This is one in a series of reports which document the up-to-date technologies whichcontribute to the technical bases of the U.S. Nuclear Regulatory Commission'scurrent evaluation of its rule for safety-regulation reactor pressure vessels (RPVs) incommercial light-water power reactors (LWRs) when exposed to pressurizedthermal-shock (PTS) conditions. This report documents results from a largenumber of large-scale vessel experiments that have been conducted to revealcharacteristics of fracture behavior of thick-wall pressure vessels under conditionspertinent to PTS scenarios. Those test results are discussed in terms of validatingthe applicability of linear elastic fracture mechanics (LEFM) to PTS analyses. Thisdiscussion is particularly important because the probabilistic fracture mechanicscode used in the NRC evaluations is based on the use of LEFM models.
1. Introduction
The importance of structural integrity of RPVs has been recognized by all stakeholders from the
beginning of the nuclear power enterprise in the U.S. Correspondingly, the NRC and the Atomic
Energy Commission (AEC) before it have maintained a strong research program to evaluate and
improve the technology available for use in RPV integrity assessments. The NRC/AEC research
efforts have been continuous and integrated with those of other stakeholders in the nuclear power
enterprise. Those efforts began in the mid 1960s, and in the case of materials and structures
technology, validation of the applicability of fracture mechanics methods to RPV analyses has
been of utmost importance. One measure of the importance of the advancements that have been
made is the fact that many ASTM standards (e.g. E-1820 for fracture-toughness measurement
and E-1221 for crack-arrest test procedures) and much of the fracture mechanics methodology in
Sections III and XI of the ASME Boiler and Pressure Vessel Code are derived from results of
this research.
A-7

It has also been broadly understood that PTS events can present complex challenges to the
structural integrity of an RPV. The NRC/AEC research efforts have methodically and
sequentially addressed the various technical factors that influence loadings, material properties,
and RPV response under credible scenarios including PTS situations. Therefore, the technology
employed today in PTS analysis tools is the result of the progress made over these past decades.
This includes the methods employed in the NRC's current efforts to evaluate and potentially
revise the PTS rule in 1OCFR50.
Within the NRC efforts, the FAVOR computer code is used to perform probabilistic fracture
calculations for RPVs exposed to credible PTS scenarios. Although the FAVOR code performs
probabilistic analyses, the fracture mechanics computations are made up of many deterministic
analyses. The following paragraphs summarize important aspects of the NRC research that has
contributed to validating the applicability of linear-elastic fracture mechanics (LEFM) to RPV
analyses. The activities discussed were carried out at the Oak Ridge National Laboratory
(ORNL) under the NRC-sponsored Heavy-Section Steel Technology (HSST) program. A
comprehensive summary of the overall efforts of the HSST program's research through the mid
1980s is given by (Whitman 86).
The integrated experimental/analytical studies of RPV behavior made use of specimens whose
sizes have ranged from small to large. The studies of the fracture behavior of large-scale
specimens are summarized in this report, and they included three distinct phases of experiments
that used thick-wall cylindrical specimens. Those phases sequentially addressed vessels exposed
to (1) pressure loads, (2) thermal transient loads, and (3) concurrent pressure and thermal
transients, and have been historically referred to as Intermediate Test Vessel (ITV) experiments,
Thermal-Shock Experiments (TSEs), and Pressurized Thermal-Shock Experiments (PTSEs).
Each of these three phases is discussed below in terms of fracture behavior and their roles in
validating the applicability of LEFM to RPV analyses. A total of 22 thick-wall cylinder tests
made up these phases, and they were carried out from the early 1970s to the mid 1980s.
A-8.

2. Intermediate Test Vessel (ITV) Experiments
The ITV experiments were planned in the early 1970s and conducted over the following ten years to
demonstrate the fracture behavior of thick-wall vessels in the transition range between frangible and
ductile fracture behavior, to verify methods of analysis that could be used to predict the observed
behavior, and to examine conservatism in the then current ASME design rules for RPVs. The JTV
specimens were pressure vessels that had a 6-in. wall thickness, an outer diameter of 39 in., and a test
section length of 54 in. Each ITV was designed and fabricated consistent with the then current edition of
the ASME Boiler and Pressure Code, and each had an internal design pressure equal to 9,600 psi. After
fabrication, ORNL intentionally flawed the vessels with cracks of prescribed geometries and tested them
to failure under internal pressure. ORNL analyses and extensive peer review determined that the 6-in.
thickness would produce adequate constraint for fracture analysis validation experiments, and that the
constraint and stress states would be representative of those which could occur in a full-scale RPV.
Ten ITV vessels were procured, and three were fabricated with cylindrical nozzles having features typical
of light-water reactor vessel penetrations. As an example, Figure A-2.1 shows a schematic of the vessel
that was used in test ITV-7. Each ITV test vessel had the same dimensions except for the test area (flaw
geometry).
ORNL-OW 70- 3$R
HEAD AIV ACCESS NOZZLE
54.9.• TEST
AREA
27f.
G••6 .- TH"C WALL
•-SUPPORfT STFAUCTUK•
Fig. A-2.1. Schematic of ITV-7 test vessel. Dimensions were the same for each ITV vessel while thespecifics of the flaw region and test material varied from test to test.
A total of 12 tests were performed on nine intermediate vessels over a period of 10 years. (One of the
nozzle vessels remains untested.) Some of the vessels were used in more than one experiment by
A-9

replacing the test section with different test materials. Preparation of the tests involved a great deal of
engineering development and planning to deliberately fail the vessels within a given range of internal
pressures and with high priority given to test safety. Table A-2.1 lists the test dates, materials, test
temperatures, flaw sizes, and material toughness values.
Table A-2.1. ITV test sequence and test parameters
Vessel Test Flaw Flaw Test Fracture TestNo. Date Depth Length Temp. Toughness Material(in.) (in.) (OF) (ksi.4in.) Material1 6/30/72 2.56 8.25 130 311 A508-22 9/28/72 2.53 8.30 32 184 A508-23 11/8/72 2.11 8.50 130 325 Weld4 12/20/72 3.00 8.25 75 160 Weld6 7/7/73 1.87 5.25 190 369 Weld5 2/13/74 1.20 Nozzle 190 241 A508-27 6/19/74 5.30 18.6 196 301 A533-B9 8/28/74 1.20 Nozzle 75 150-275 A508-2
7A 6/18/76 5.30 18.6 196 301 A533-B7B 7/14/77 5.30 18.6 196 199-329 Weld HAZ8 7/26/78 2.50 8.10 -11 90 Weld
8A 8/11/82 2.75 11.0 300 200 LUS Weld
The 12 tests involved cases where the test region was RPV base metal and others where it was weld
metal. The test temperatures traversed the Charpy energy curve from the low transition region to well
above onset of the upper shelf region. Accordingly, the fracture behavior ranged from brittle fast fracture
to total ductile tearing, respectively. This is illustrated in Fig. A-2.2 which shows each test positioned on
a Charpy curve. The figure also indicates the nature of fracture observed in these tests.
A-10

Z
v-2 -FlatV-9 (N) -Mix, d
V-8 Leak - Flat F ractureFULLY DUCTILE
TRANSITION PPER-SHELF
TEMPERATURE
Fig. A-2.2. Test temperatures superimposed on a Charpy curve illustrate relative condition of the twelveITV experiments. Fracture surfaces are also characterized for each test.
The first test, ITV- 1, was performed to show that gross yielding of the vessel wall could be achieved with
a large flaw present when the vessel was operating in the upper-shelf regime of toughness. The sequence
of tests that followed covered the complete range of fracture failure behavior in relevant materials with
varying flaw sizes to include complex stress states and residual stress effects. Table A-2.2 lists the
detailed reports that were prepared for each ITV test.
Table A-2.2. List of detailed reports on individual ITV experiments
ITV Test Number Report Reference Report Number
ITV- 1 and -2 (Derby 74) ORNL-44895
ITV-3, -4, and -5 (Bryan 75) ORNL-44895
ITV-5 and -6 (Merkle 77) ORNL/NUREG-7
ITV-7 (Merkle 76) ORNL/NUREG-1
NUREG/CR-0309ITV-7B (Bryan 78a) NLREG-58)
(ORNL/NUREG-58)
NUREG/CR-0675ITV-8 (Bryan 78) NUREG-38)
(ORNL/NUREG-38)NUREG/CR-4760
ITV-8A (Bryan 87b) (ORNL-61(ORNL-6187)
ITV-7A (Bryan 78b) ORNL/NUREG-9
A-1I

The range of observed fracture behavior is illustrated by the posttest conditions of test vessels ITV-2 and
ITV-6, which are shown in Figs. A-2.3 and A-2.4. Because the temperature for ITV-2 was low in the
Charpy transition range (just above NDT) and that for ITV-6 was well above onset of Charpy upper-shelf
region, the fracture modes are fully cleavage fast fracture and fully ductile shear, respectively. This range
of fracture modes for the thick sections is consistent with fracture behavior observed from tests of smaller
laboratory specimens.
Fig. A-2.3. ITV-2 vessel was tested under high pressure and at a temperature (32*F) low in the Charpytransition region; fracture was by fast cleavage propagation.
Fig. A-2.4. ITV-6 test vessel was tested under pressure and at a temperature (190'F) well above onset ofCharpy upper shelf; fracture was by ductile shear.
As was the case with each ITV vessel, the ITV-2 vessel contained a fabricated flaw, and because it had a
test temperature (32°F) low in the Charpy transition range, it fractured by fast cleavage propagation. It
A-12
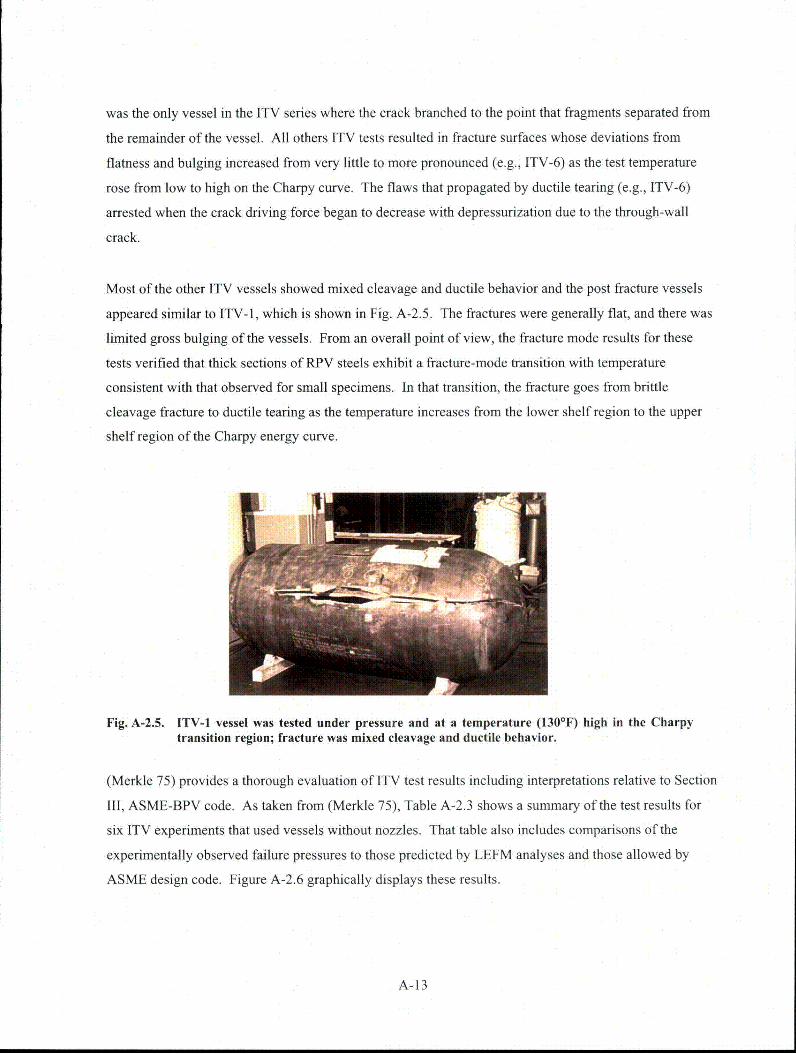
was the only vessel in the ITV series where the crack branched to the point that fragments separated from
the remainder of the vessel. All others ITV tests resulted in fracture surfaces whose deviations from
flatness and bulging increased from very little to more pronounced (e.g., ITV-6) as the test temperature
rose from low to high on the Charpy curve. The flaws that propagated by ductile tearing (e.g., ITV-6)
arrested when the crack driving force began to decrease with depressurization due to the through-wall
crack.
Most of the other ITV vessels showed mixed cleavage and ductile behavior and the post fracture vessels
appeared similar to ITV-1, which is shown in Fig. A-2.5. The fractures were generally flat, and there was
limited gross bulging of the vessels. From an overall point of view, the fracture mode results for these
tests verified that thick sections of RPV steels exhibit a fracture-mode transition with temperature
consistent with that observed for small specimens. In that transition, the fracture goes from brittle
cleavage fracture to ductile tearing as the temperature increases from the lower shelf region to the upper
shelf region of the Charpy energy curve.
Fig. A-2.5. ITV-1 vessel was tested under pressure and at a temperature (130*F) high in the Charpytransition region; fracture was mixed cleavage and ductile behavior.
(Merkle 75) provides a thorough evaluation of ITV test results including interpretations relative to Section
III, ASME-BPV code. As taken from (Merkle 75), Table A-2.3 shows a summary of the test results for
six ITV experiments that used vessels without nozzles. That table also includes comparisons of the
experimentally observed failure pressures to those predicted by LEFM analyses and those allowed by
ASME design code. Figure A-2.6 graphically displays these results.
A-13

Table A-2.3. Results from six ITV experiments using specimens without nozzles
ITV Pf Pd PLEFM Load Factor Load Factor
Test No. Max. Test ASME Design Predicted Max. Pf/PLEFM Pf/PdPressure (ksi) Pressure (ksi) Pressure (ksi)
2 27.9 9.6 27.4 1.018 2.87
4 26.5 9.6 26.2 1.012 2.73
1 28.8 9.6 27.5 1.047 2.96
3 31.0 9.6 27.5 1.127 3.19
6 31.9 9.6 27.5 1.160 3.28
7 21.4 9.6 20.8 1.029 2.20
The data in Tables A-2.2 and A-2.3 show that (in addition to temperature) flaw size and stress
concentrations have strong influences on the conditions at failure. This is illustrated by comparing the
results of tests ITV-6 and ITV-7. These experiments were conducted at similar temperatures, but ITV-7
had a much deeper flaw (a = 5.3 in.) than did ITV-6 (a = 1.87 in.). Correspondingly, ITV-7 had a lower
failure pressure. However, one of the principal objectives of ITV-7 experiment was to demonstrate
whether or not a vessel with a very deep flaw could sustain pressures in excess of the design pressure
prior to crack initiation. Table A-2.3 and Fig. A-2.6 show that even with the very deep flaw ITV-7
sustained more than two times the design pressure before fracture occurred. Overall, Table A-2.3 and
Fig. A-2.6 show that each of the other ITV vessels without nozzles did not exhibit fracture until the
applied pressure exceeded the design pressure by a factor of about three [i.e., (PW/Pd) ; 3].
[TV TEST SPECIMEN NUMBER
Fig. A-2.6. Load factors for six large-scale ITV experiments [(Pf/Pd = fracture pressure to designpressure ratio) and (Pd/PLEFM = fracture pressure to LEFM predicted pressure ratio)].
Each ITV experiment was analyzed using methods based on LEFM. Table A-2.3 tabulates the failure
pressures predicted by LEFM methods (PLEFM) for the ITV vessels without nozzles, and these values are
A-14

seen to be very close to Pf, the test pressures when fracture occurred. This was the case even for ITV-7,
which had the very deep flaw. The importance of this excellent agreement is highlighted by the fact that
these tests involved such a variety of RPV materials, flaw sizes, and test temperatures. The LEFM
analyses made use of fracture and other properties determined from small laboratory specimens made of
the respective test materials. Thus, in addition to demonstrating the applicability of LEFM to thick wall
pressure vessels, the ITV tests also demonstrated transferability of information from small specimens to
large vessels. (Although they are not included in Table A-2.3, the actual failure pressures for the vessels
with nozzles were also well predicted by LEFM methods. It is known that flaws at nozzle comers
experience only limited constraint, and, they consequently exhibit an equivalent high toughness
behavior.)
While these experiments demonstrated the very good agreement between LEFM methods predictions and
failure pressures for thick-wall vessels, they also provided opportunities to compare loading conditions
allowed by the ASME code with actual failure conditions of those pressure vessels. (Merkle 75)
conducted a methodical study that illustrated the conservatism in LEFM methodology even when it was
assumed that a flaw might exist with depth equal to the maximum allowed by Section XI, ASME BPV
code. In that case, (Merkle 75) showed that the vessel would still experience gross yielding prior to
reaching fracture initiation.
In summary, the principal observations and conclusions made from the ITV tests include: (1) the
transitional character of fracture-failure was verified for thick-section structures, (2) analyses based on
LEFM very closely predicted actual fracture pressures for these thick-wall pressure vessels, (3) flawed
vessels fractured at pressure levels significantly greater than the operating pressure allowed under the
ASME Code, (4) methods for calculating fracture toughness from small specimens were successfully used
in applications of fracture analysis of thick flawed vessels, and (5) the vessels were observed to generally
sustain loads three times their design pressure, thus confirming the existence of margins of safety.
3. Thermal-Shock Experiments
The second phase of HSST large-scale fracture experiments was carried out between 1975 and 1983 and
was made up of a set of eight thermal-shock experiments (TSEs) that used thick cylinders made of RPV
steel. The purpose of these experiments was to investigate the behavior of surface cracks under thermal-
shock conditions similar to those that in principle would be encountered during a large-break loss of
coolant accident (LBLOCA). It was known that the injection of cold water by the emergency core
cooling system into a hot reactor vessel after a LOCA could produce conditions under which a preexisting
A-15

flaw might suddenly extend as a result of the low temperature and high thermal stresses. The propensity
for such an occurrence is strongly dependent on the degree of degradation in fracture toughness the vessel
wall may undergo from radiation damage and the temperature of the cooling water.
The HSST program addressed this issue to ensure that material properties and methods of analysis were
developed to a degree that vessel integrity could be accurately assessed throughout the projected vessel
lifetime. As the TSE experiments were being planned, ORNL recognized that fracture mechanics
analysis for thermal-shock conditions involves several features that had not been adequately examined
experimentally at that time. These features included biaxial stresses, steep gradients in stress and
toughness through the wall, variations in these parameters with time, crack arrest in a rising K, field, and
warm prestressing (WPS).
To aid in the definition of the TSEs, Fig. A-3.1 was constructed to illustrate through-wall conditions that
would exist at a point in time during a thermal shock that would correspond to a LBLOCA. If a flaw of
depth "a" were to exist on the inner surface of the vessel of wall thickness "w", the high thermally-
induced tensile stress will result in a significant stress-intensity factor at the tip of the flaw. The
combined effect of this high K, and low fracture toughness in the inner-surface region may result in
propagation of the flaw. However, the steep positive gradient in the fracture toughness provides a
mechanism for crack arrest. Figure A-3.1 includes KI, K1c, and K1a curves for this situation and shows
that both shallow and deep flaws can initiate. A shallow flaw, which is more likely to exist as an initial
flaw, can initiate and propagate through a significant distance before arresting. The deep flaws may be
the result of an earlier initiation-arrest event, and at the time shown in this figure, will experience an
additional initiation and arrest event.
A-16

1.0 I
300(
8 ,oo
0
0.8
r 0.6
- 0.2
- 0
Fig. A-3. 1. Typical instantaneous temperature, stress, fluence, stress-intensity factor, and fracture-toughnessdistributions through wall of PWR vessel during LBLOCA.
ORNL (Cheverton 85a and b) constructed critical-crack-depth curves like those shown in Fig. A-3.2 as an
aid in designing and interpreting the TSEs. This type of display shows the predicted behavior of a surface-
breaking flaw (of depth a in wall of thickness w) during a specified transient by plotting the crack depths
corresponding to initiation and arrest events (KI = KI, and K1 = KIa). Multiple crack run-arrest events are
shown in this example computation.
Fig. A-3.2. Critical-crack-depth curves for PWR vessel during LBLOCA.
A-17

These curves illustrate that flaws of different depth could initiate at the same time into the transient and
arrest at the same depth. They also illustrate that LEFM analyses predict that a given initial flaw can
experience multiple run-arrest events. Similar to observations from Fig. A-3. 1, Fig. A-3.2 illustrates that
deep flaws that are subject to initiation may exist because it was a preexisting flaw or because it was
created by a shallow flaw experiencing earlier run-arrest events. It is also seen that growth of a deep flaw
can result in relatively long jumps.
It was also recognized that warm prestressing (WPS) was capable of preventing reinitiation at depths less
than the final arrest depth indicated by Fig. A-3.2. The WPS concept means that a flaw will not initiate
when K, is decreasing with time even though KI may reach or exceed K1c. Under thermal-shock loading,
a deep flaw can conceivably experience it maximum KI value at a time before the crack tip temperature
has decreased enough to make K, > K1c. During the thermal shock, K, for a given crack depth increases
and then begins to decrease with the temperature gradient. However, K1I continues to decrease as long as
the temperature continues to decrease. The curve in Fig. A-3.2 labeled K, = (Ki)max shows the times at
which K, reaches a maximum for various crack depths. Thus, for times less than indicated by this curve,
K1 is always increasing, and for greater times, K, is always decreasing. If WPS is effective, then crack
initiation would be limited to times to the left of this curve. Another feature of the WPS effect would be
that if K, were to later begin to increase (e.g. due to repressurization), the material would exhibit an
apparent elevated fracture toughness for temperatures below that for which KIc is approximately equal to
the previously experienced (KI)max.
All these observations contributed to the design of the TSE experiments. The TSE series included
scenarios that involved both long and short crack jumps, as well as cases to examine fracture behavior
where multiple crack initiation-arrest events would occur and potentially experience intervention by WPS
effects. Eight TSE experiments were carried out in two phases that used different specimens and test
conditions as summarized below.
The first four TSEs were conducted from September 1975 to January 1977 and used hollow cylindrical
specimens fabricated from the trepanned cores taken from the ITV forgings (A508 class-2 steel). These
tests are discussed in detail by (Cheverton 76 and 77). The test system used chilled water or water-
alcohol mixtures (-23°C) to produce thermal stresses in the heated (288°C) test specimens containing a
long internal surface flaw. These test cylinders had an OD of 530 mm (21 in.) and an ID of 240 mm (9.5
in.), and they were 910mm (36 in.) in length. The flaws were shallow with a depth of either 1 1mm (0.42
in.) or 19 mm (.75 in.). As discussed by (Cheverton 76 and 77), the fracture results from these
A-18

experiments were in good agreement with predictions based on the LEFM analyses that made use of
properties obtained from small laboratory specimens. However, because of the specimen stiffness, deep
crack penetrations could not be achieved. Therefore, from August 1979 to May 1983, the second set of
four experiments (TSE-5, 5A, 6, and 7) was performed with larger specimens in which deeper crack
advance could occur from greater bending, as would be the case in a PWR vessel.
Detailed reports covering this second set of TSE tests are given by (Cheverton 85a and b). The larger
cylinders used for these tests were made of A508, Class 2 steel, and had an OD of 991mm (39 in.), ID of
682 mm (27 in.), and length of 1220 mm (48 in.). They were given a quench and temper heat treatment
that led to higher (and more conventional) fracture toughness values than was the case for the first four
TSE specimens (quench only heat treatment). Thus, a facility that could provide a more severe thermal
shock was required for this second set of TSEs. Figure A-3.3 shows a schematic of the liquid nitrogen
facility that was constructed at ORNL for testing these larger specimens.
PNEUMVATC CYLINDER
Fig. A-3.3. Schematic of ORNL's thermal shock test facility used for TSE-5, 5A, 6, and 7.
Figure A-3.4 shows a TSE test cylinder prior to its instrumentation and installation into the TSE test
facility. The heated (96°C) cylinders contained inner surface flaws and were submerged into the liquid
nitrogen tank (-196°C) to chill their inner surface to produce the desired temperatures and stresses at the
crack tips. The test cylinders for TSE-5, 5A, and 6 contained long surface flaws with depths a = 16, 11,
and 7.6 mm, respectively, while the TSE-7 specimen contained a finite length flaw that was 37 mm long
and 14 mm deep.
A-19

Fig. A-3.4. TSE test cylinder like those used in TSE-5, -5A, -6, and -7.
TSE-5 experienced a series of three initiation/arrest events with deep penetration (to 80 percent of the
wall) of the two dimensional flaw. The occurrence of the three events was entirely consistent with
predictions based on LEFM analyses that included the generation of critical crack depth curves [see
(Cheverton 85a)]. The analyses predicted a final crack depth of a/w = 0.50 to 0.70 depending upon the
effective of WPS effects. Figure A-3.5 shows a posttest cross section of the TSE-5 cylinder that clearly
shows the three phases of crack jumps that occurred in this test and led to a final (a/w) of 0.8. Thus, the
LEFM analyses predicted well the nature and magnitude of the fracture behavior under this thermal-shock
loading.
Fig. A-3.5. Cross section of TSE-5 test cylinder showing the three long crack jumps that occurred during thethermal shock.
A-20
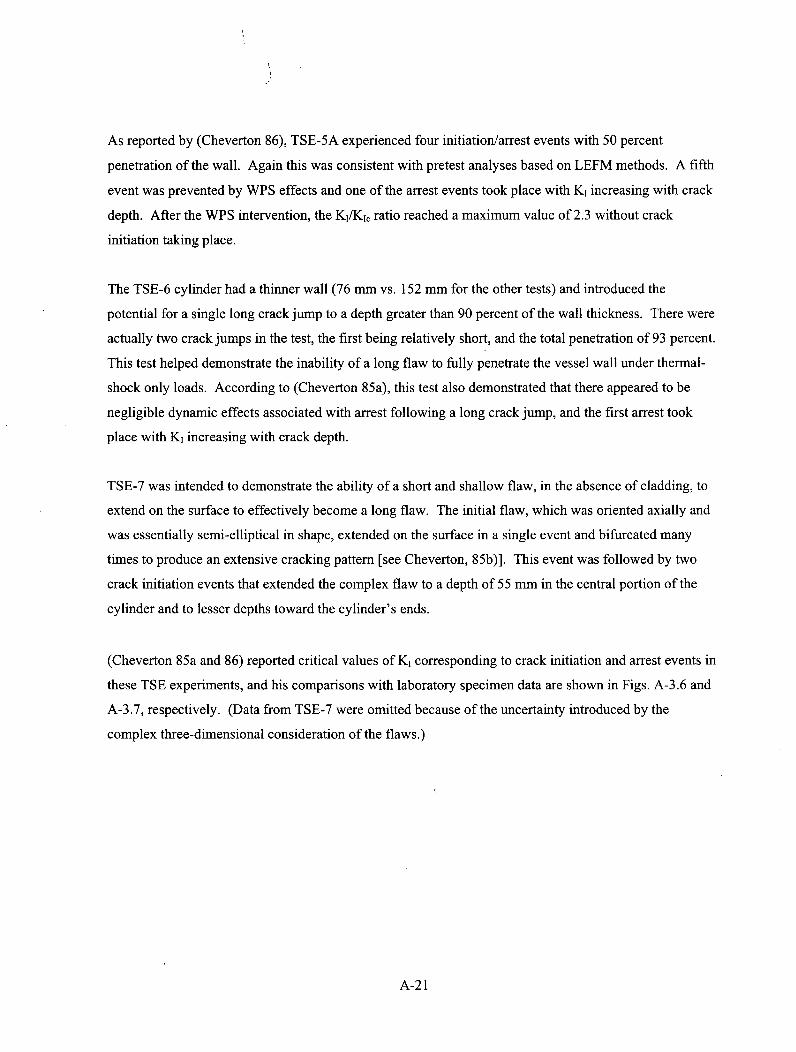
As reported by (Cheverton 86), TSE-5A experienced four initiation/arrest events with 50 percent
penetration of the wall. Again this was consistent with pretest analyses based on LEFM methods. A fifth
event was prevented by WPS effects and one of the arrest events took place with KI increasing with crack
depth. After the WPS intervention, the K1/KI, ratio reached a maximum value of 2.3 without crack
initiation taking place.
The TSE-6 cylinder had a thinner wall (76 mm vs. 152 mm for the other tests) and introduced the
potential for a single long crack jump to a depth greater than 90 percent of the wall thickness. There were
actually two crack jumps in the test, the first being relatively short, and the total penetration of 93 percent.
This test helped demonstrate the inability of a long flaw to fully penetrate the vessel wall under thermal-
shock only loads. According to (Cheverton 85a), this test also demonstrated that there appeared to be
negligible dynamic effects associated with arrest following a long crack jump, and the first arrest took
place with K1 increasing with crack depth.
TSE-7 was intended to demonstrate the ability of a short and shallow flaw, in the absence of cladding, to
extend on the surface to effectively become a long flaw. The initial flaw, which was oriented axially and
was essentially semi-elliptical in shape, extended on the surface in a single event and bifurcated many
times to produce an extensive cracking pattern [see Cheverton, 85b)]. This event was followed by two
crack initiation events that extended the complex flaw to a depth of 55 mm in the central portion of the
cylinder and to lesser depths toward the cylinder's ends.
(Cheverton 85a and 86) reported critical values of KI corresponding to crack initiation and arrest events in
these TSE experiments, and his comparisons with laboratory specimen data are shown in Figs. A-3.6 and
A-3.7, respectively. (Data from TSE-7 were omitted because of the uncertainty introduced by the
complex three-dimensional consideration of the flaws.)
A-21
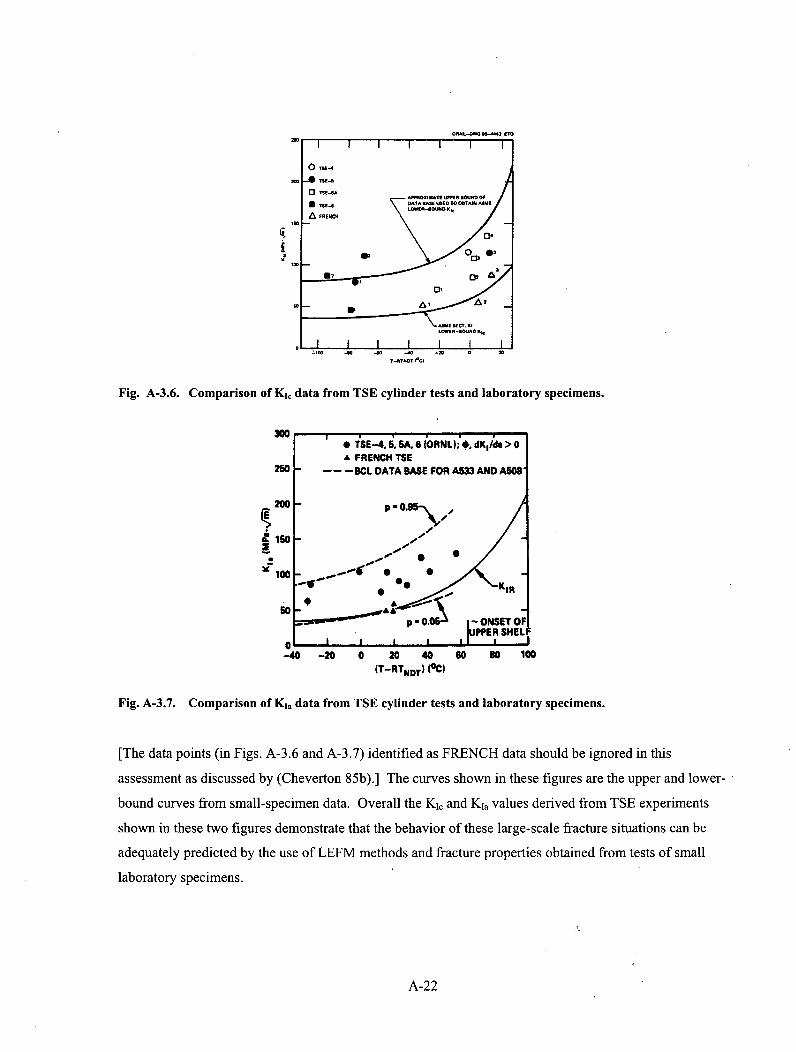
-, I
-,- .4 -DCLDAT BAS o FOR 3ADA
200--*T.T P \<
U 02Fig. A-3.6. Comparison of Kia data from TSE cylinder tests and laboratory specimens.
300 • 10iSE-4. 5. SA, 6 (ORNL); *. dKo/d& > 0
A FRENCH TSE250 ---- -- 1BCL DATA BASE FOR AM3 AND ASN8
20-P . 0.95-• /
ISO I"
100 .... , • • /,
p O0.0T" ONSET OFUE'R SHELI
0 IF ... I-40 -20 0 20 410 60 so 100
(T-RTNDT) (OC)
Fig. A-3.7. Comparison of Kna data from TSE cylinder tests and laboratory specimens.
[The data points (in Figs. A-3.6 and A-3.7) identified as FRENCH data should be ignored in this
assessment as discussed by (Cheverton 85b).] The curves shown in these figures are the upper and lower-
bound curves from small-specimen data. Overall the Ki, and Kla values derived from TSE experiments
shown in these two figures demonstrate that the behavior of these large-scale fracture situations can be
adequately predicted by the use of LEFM methods and fracture properties obtained from tests of small
laboratory specimens.
A-22
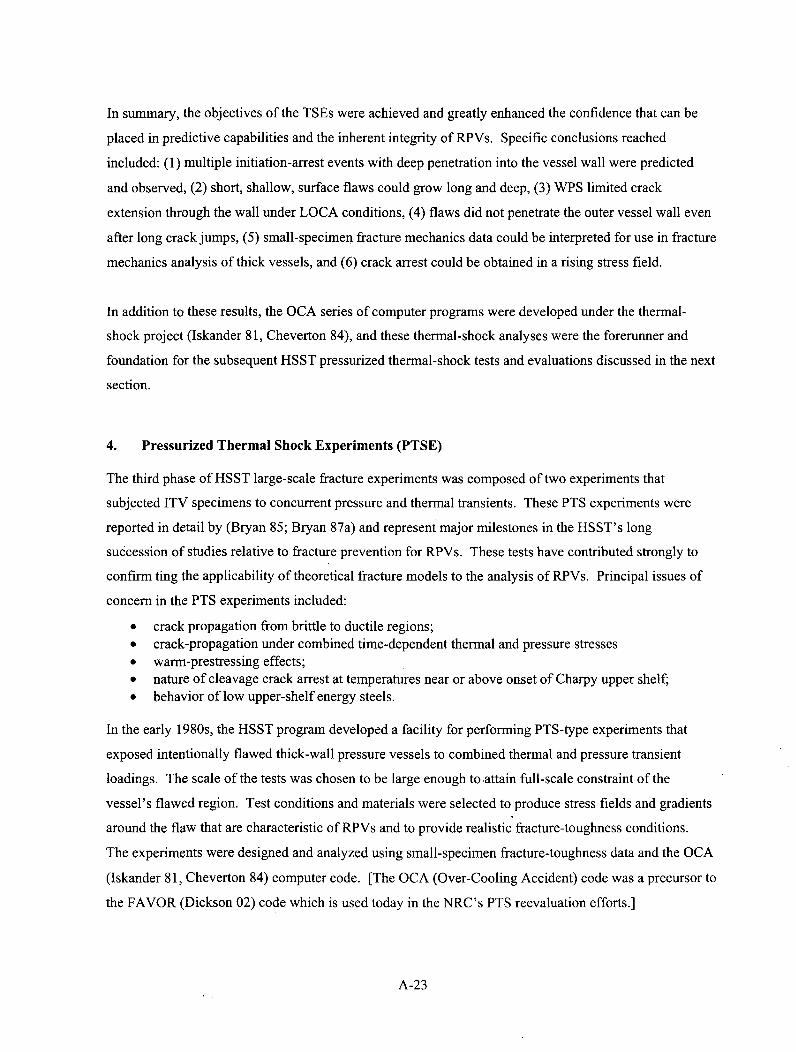
In summary, the objectives of the TSEs were achieved and greatly enhanced the confidence that can be
placed in predictive capabilities and the inherent integrity of RPVs. Specific conclusions reached
included: (1) multiple initiation-arrest events with deep penetration into the vessel wall were predicted
and observed, (2) short, shallow, surface flaws could grow long and deep, (3) WPS limited crack
extension through the wall under LOCA conditions, (4) flaws did not penetrate the outer vessel wall even
after long crack jumps, (5) small-specimen fracture mechanics data could be interpreted for use in fracture
mechanics analysis of thick vessels, and (6) crack arrest could be obtained in a rising stress field.
In addition to these results, the OCA series of computer programs were developed under the thermal-
shock project (Iskander 81, Cheverton 84), and these thermal-shock analyses were the forerunner and
foundation for the subsequent HSST pressurized thermal-shock tests and evaluations discussed in the next
section.
4. Pressurized Thermal Shock Experiments (PTSE)
The third phase of HSST large-scale fracture experiments was composed of two experiments that
subjected ITV specimens to concurrent pressure and thermal transients. These PTS experiments were
reported in detail by (Bryan 85; Bryan 87a) and represent major milestones in the HSST's long
succession of studies relative to fracture prevention for RPVs. These tests have contributed strongly to
confirm ting the applicability of theoretical fracture models to the analysis of RPVs. Principal issues of
concern in the PTS experiments included:
* crack propagation from brittle to ductile regions;" crack-propagation under combined time-dependent thermal and pressure stresses* warm-prestressing effects;* nature of cleavage crack arrest at temperatures near or above onset of Charpy upper shelf,* behavior of low upper-shelf energy steels.
In the early 1980s, the HSST program developed a facility for performing PTS-type experiments that
exposed intentionally flawed thick-wall pressure vessels to combined thermal and pressure transient
loadings. The scale of the tests was chosen to be large enough to.attain full-scale constraint of the
vessel's flawed region. Test conditions and materials were selected to produce stress fields and gradients
around the flaw that are characteristic of RPVs and to provide realistic fracture-toughness conditions.
The experiments were designed and analyzed using small-specimen fracture-toughness data and the OCA
(Iskander 81, Cheverton 84) computer code. [The OCA (Over-Cooling Accident) code was a precursor to
the FAVOR (Dickson 02) code which is used today in the NRC's PTS reevaluation efforts.]
A-23

In this report, the focus is on the first PTS experiment performed, i.e., PTSE-1 (Bryan 85). That
experiment incorporated a surface crack that was long, sharp and shallow, as assumed in regulatory
assessments at the time of the test. The material properties were typical of those for an RPV subjected to
moderate neutron embrittlement of the wall. Analytical studies confirmed that the stress levels and
gradients around the outside surface flaw in the test vessel provide an acceptable approximation of those
occurring in an RPV with a flaw on the inner surface during a postulated PTS event. Recently, the PTSE-
1 experiment was re-analyzed using version 02.2 of FAVOR (Dickson 02). Results of that re-analysis,
presented in a following section, provide confirmation that cleavage-crack behavior in large-scale thick-
walled pressure vessels is reasonably well described by LEFM methodology as embodied in the FAVOR
code.
The geometry and dimensions of the ITV are shown in Fig. A-4.1 and in Table A-4. 1. A longitudinal
plug of specially tempered SA508, Class 2 steel was welded into the ITV V8-A vessel. A sharp outer-
surface flaw (1-m-long) was implanted into the plug by cracking a shallow electron-beam weld under the
influence of hydrogen charging. Extensive instrumentation was applied to the vessel to provide direct
measurements of crack-mouth opening displacement, temperature profiles through the wall, and internal
pressure during the transient. The flawed and instrumented vessel was inserted into an outer vessel,
which was electrically heated to bring the vessel to the desired uniform initial temperature of about
290 0C. (Figure A-4.2 depicts an ITV being lowered into the outer containment vessel at the HSST test
facility). The outer vessel also served as a shroud for the PTS transient. A thermal transient was initiated
by suddenly injecting chilled water or a methanol-water mixture into the annulus between the test vessel
and the outer vessel. The annulus between the two vessels was designed to permit coolant velocities that
would produce the appropriate convective heat transfer from the outer surface of the test vessel for a
period of about 10 min. Internal pressurization of the test vessel was controlled independently by a
system capable of pressures up to about 100 MPa.
A-24

m
_L46
wad MM~
AN muue In mml
Fig. A-4.1. Geometry of PTSE-1 test vessel.
Table A-4.1. Geometric Parameters of the PTSE-1 vessel
Parameter Value
Inside radius, mm 343
Wall thickness (w), mm 147.6
Flaw length, mm 1000
Flaw depth (a), mm 12.2
a/w 0.083
Fig. A-4.2. Test vessel being lowered into outer containment vessel at HSST PTS test facility.
A-25
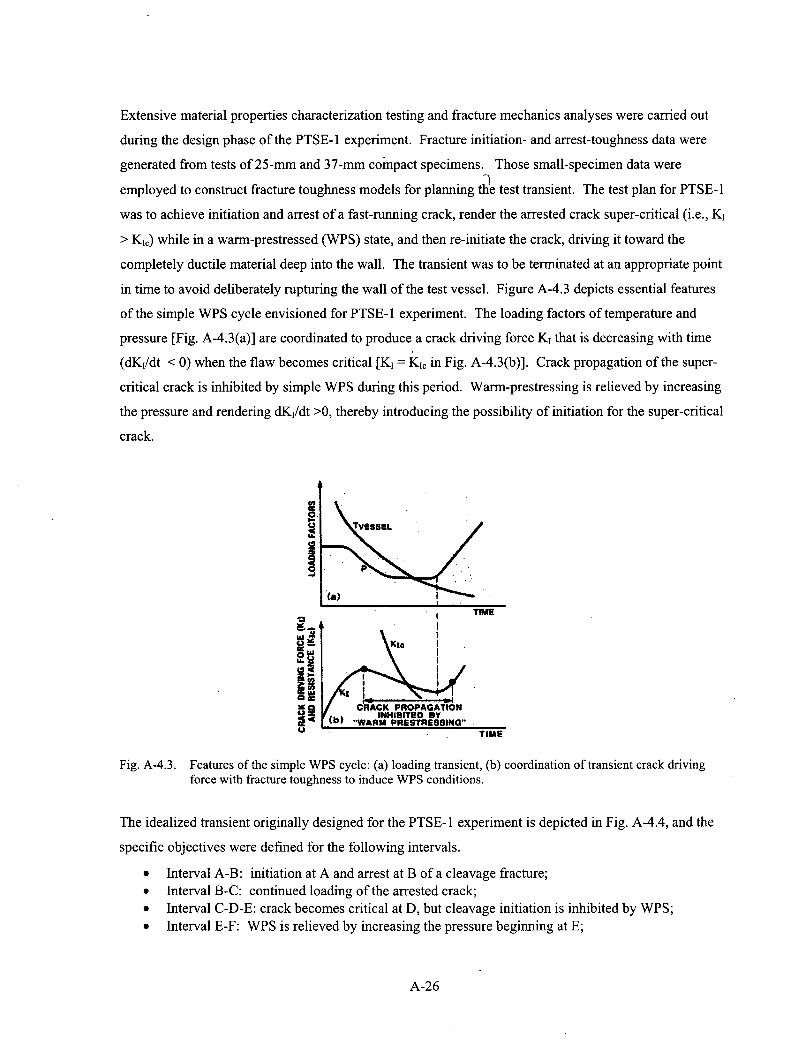
Extensive material properties characterization testing and fracture mechanics analyses were carried out
during the design phase of the PTSE-1 experiment. Fracture initiation- and arrest-toughness data were
generated from tests of 25-mm and 37-mm compact specimens. Those small-specimen data were
employed to construct fracture toughness models for planning the test transient. The test plan for PTSE-i
was to achieve initiation and arrest of a fast-running crack, render the arrested crack super-critical (i.e., KI
> K1,) while in a warm-prestressed (WPS) state, and then re-initiate the crack, driving it toward the
completely ductile material deep into the wall. The transient was to be terminated at an appropriate point
in time to avoid deliberately rupturing the wall of the test vessel. Figure A-4.3 depicts essential features
of the simple WPS cycle envisioned for PTSE- 1 experiment. The loading factors of temperature and
pressure [Fig. A-4.3(a)] are coordinated to produce a crack driving force KI that is decreasing with time
(dK,/dt < 0) when the flaw becomes critical [KI = K1. in Fig. A-4.3(b)]. Crack propagation of the super-
critical crack is inhibited by simple WPS during this period. Warm-prestressing is relieved by increasing
the pressure and rendering dKi/dt >0, thereby introducing the possibility of initiation for the super-critical
crack.
NTIME
I! (b)TIME
Fig. A-4.3. Features of the simple WPS cycle: (a) loading transient, (b) coordination of transient crack drivingforce with fracture toughness to induce WPS conditions.
The idealized transient originally designed for the PTSE-1 experiment is depicted in Fig. A-4.4, and the
specific objectives were defined for the following intervals.
* Interval A-B: initiation at A and arrest at B of a cleavage fracture;* Interval B-C: continued loading of the arrested crack;* Interval C-D-E: crack becomes critical at D, but cleavage initiation is inhibited by WPS;* Interval E-F: WPS is relieved by increasing the pressure beginning at E;
A-26
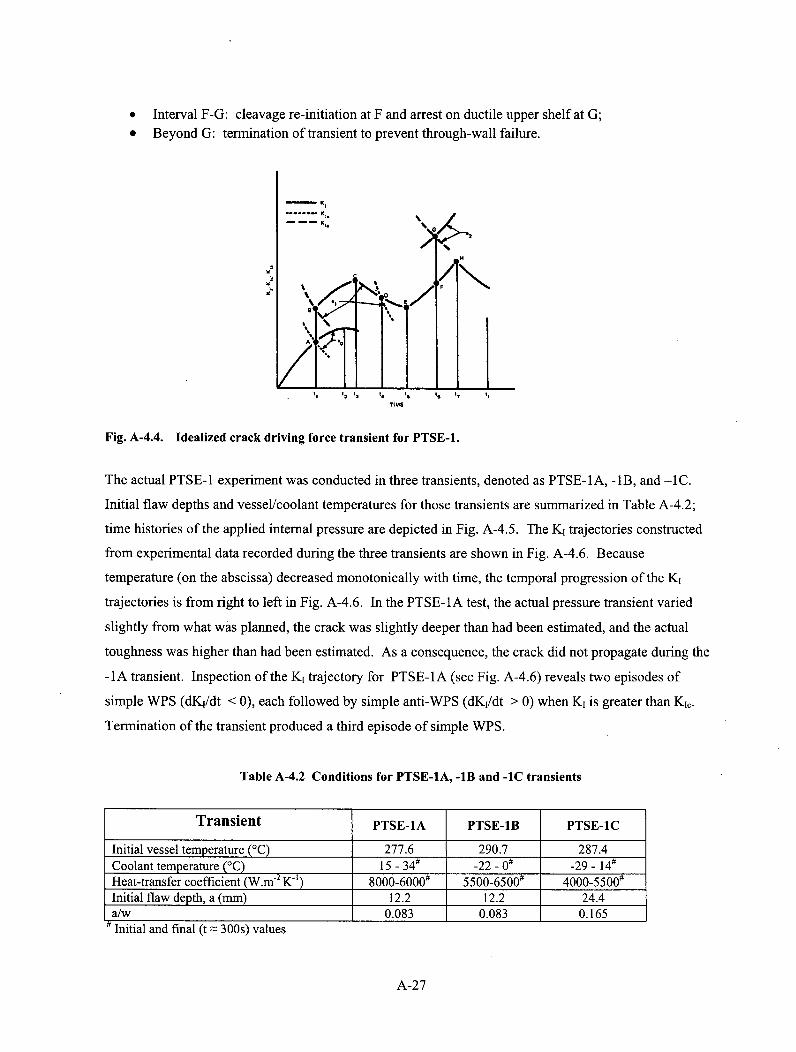
0
0
Interval F-G: cleavage re-initiation at F and arrest on ductile upper shelf at G;Beyond G: termination of transient to prevent through-wall failure.
4
TIME
Fig. A-4.4. Idealized crack driving force transient for PTSE-1.
The actual PTSE-1 experiment was conducted in three transients, denoted as PTSE-1A, - 1B, and -1C.
Initial flaw depths and vessel/coolant temperatures for those transients are summarized in Table A-4.2;
time histories of the applied internal pressure are depicted in Fig. A-4.5. The K, trajectories constructed
from experimental data recorded during the three transients are shown in Fig. A-4.6. Because
temperature (on the abscissa) decreased monotonically with time, the temporal progression of the KI
trajectories is from right to left in Fig. A-4.6. In the PTSE-1A test, the actual pressure transient varied
slightly from what was planned, the crack was slightly deeper than had been estimated, and the actual
toughness was higher than had been estimated. As a consequence, the crack did not propagate during the
-lA transient. Inspection of the K, trajectory for PTSE-1A (see Fig. A-4.6) reveals two episodes of
simple WPS (dK1/dt < 0), each followed by simple anti-WPS (dK,/dt > 0) when K, is greater than K1,.
Termination of the transient produced a third episode of simple WPS.
Table A-4.2 Conditions for PTSE-IA, -1B and -IC transients
Transient PTSE-1A PTSE-IB PTSE-IC
Initial vessel temperature ('C) 277.6 290.7 287.4Coolant temperature (°C) 15 - 34# -22 - 0' -29 - 14#Heat-transfer coefficient (W.m 2 Kl) 8000-6000 5500-6500" 4000-5500"Initial flaw depth, a (mm) 12.2 12.2 24.4a/w 0.083 0.083 0.165Initial and final (t z 300s) values
A-27

TIME FROM START OF THERMAL TRANSIENT 10
Fig. A-4.5. Pressure transients for PTSE-1A, -IB, and -1C.
OANL.-OW0 84-4160 ETD
'00
.300
150
50 100 1W0 2W0 260CRACK-TIP TEMPERATURE PC)
300
Fig. A-4.6. Results of OCA analyses of PTSE-1 transients based on measured temperature, pressure,flaw depth, and time of the crack jump.
Plans for the PTSE-IB and -IC transients were based on evidence from test -lA that the vessel had
greater toughness than first estimated and that to overcome WPS, a higher K1 value would have to be
attained. Thus, a small adjustment was made to the fracture-toughness curve used in pretest analyses,
lower coolant temperatures were selected for the thermal transient, and a transient utilizing higher
pressure was defined. A two-step pressure transient was not performed during the -11B test because a
second pressure increase of useful magnitude was not achievable with the pressurization system. The -1 B
transient produced a crack jump to a depth of 24.4 mm. The conditions of initiation and arrest are shown
in Fig. A-4.6. The arrested crack was subjected to a WPS event in the -1B transient. The third transient,
A-28
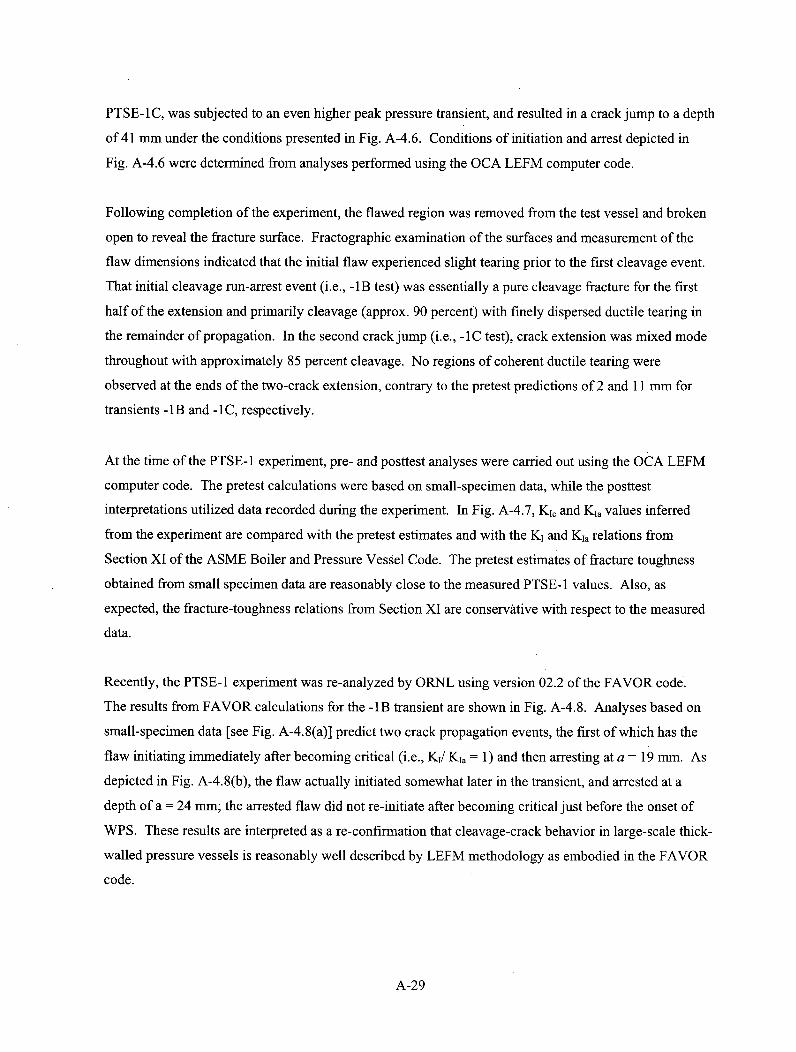
PTSE-1 C, was subjected to an even higher peak pressure transient, and resulted in a crack jump to a depth
of 41 mm under the conditions presented in Fig. A-4.6. Conditions of initiation and arrest depicted in
Fig. A-4.6 were determined from analyses performed using the OCA LEFM computer code.
Following completion of the experiment, the flawed region was removed from the test vessel and broken
open to reveal the fracture surface. Fractographic examination of the surfaces and measurement of the
flaw dimensions indicated that the initial flaw experienced slight tearing prior to the first cleavage event.
That initial cleavage run-arrest event (i.e., -1 B test) was essentially a pure cleavage fracture for the first
half of the extension and primarily cleavage (approx. 90 percent) with finely dispersed ductile tearing in
the remainder of propagation. In the second crack jump (i.e., -1C test), crack extension was mixed mode
throughout with approximately 85 percent cleavage. No regions of coherent ductile tearing were
observed at the ends of the two-crack extension, contrary to the pretest predictions of 2 and 11 mm for
transients -1B and -1C, respectively.
At the time of the PTSE-1 experiment, pre- and posttest analyses were carried out using the OCA LEFM
computer code. The pretest calculations were based on small-specimen data, while the posttest
interpretations utilized data recorded during the experiment. In Fig. A-4.7, Kic and KI, values inferred
from the experiment are compared with the pretest estimates and with the K, and Kia relations from
Section XI of the ASME Boiler and Pressure Vessel Code. The pretest estimates of fracture toughness
obtained from small specimen data are reasonably close to the measured PTSE-1 values. Also, as
expected, the fracture-toughness relations from Section XI are conservative with respect to the measured
data.
Recently, the PTSE-1 experiment was re-analyzed by ORNL using version 02.2 of the FAVOR code.
The results from FAVOR calculations for the -lB transient are shown in Fig. A-4.8. Analyses based on
small-specimen data [see Fig. A-4.8(a)] predict two crack propagation events, the first of which has the
flaw initiating immediately after becoming critical (i.e., Kt/ Kta = 1) and then arresting at a = 19 mm. As
depicted in Fig. A-4.8(b), the flaw actually initiated somewhat later in the transient, and arrested at a
depth of a = 24 mm; the arrested flaw did not re-initiate after becoming critical just before the onset of
WPS. These results are interpreted as a re-confirmation that cleavage-crack behavior in large-scale thick-
walled pressure vessels is reasonably well described by LEFM methodology as embodied in the FAVOR
code.
A-29

so 100 150 200TEMPERATURE (60
Fig. A-4.7. Comparison of curves representing small-specimen K[, and K1. data with ASME Section XIcurves and results of PTSE-I experiment.
Arrest-toughness values measured in the experiment were substantially above the 220 MPa 'lm cutoff
implied in ASME Section XI. Furthermore, Fig. A-4.9 illustrates that the PTSE-1 arrest data are
consistent with (1) arrest measurements made in an international set of experiments that include wide-
plate and thermal shock tests and (2) the ASME Section XI KIR curve. The highest arrest value recorded
in PTSE-I occurred at a temperature approximately 30' K above the onset of the Charpy upper shelf.
These results imply that the methods of LEFM are useful in fracture evaluations of vessels at high Charpy
upper-shelf temperatures.
300
250
ECL 200
- 150
•r 1- 0o
50
50 100 ISO 200 250
Crack Tip Temperature (C)
300
(a)
A-30
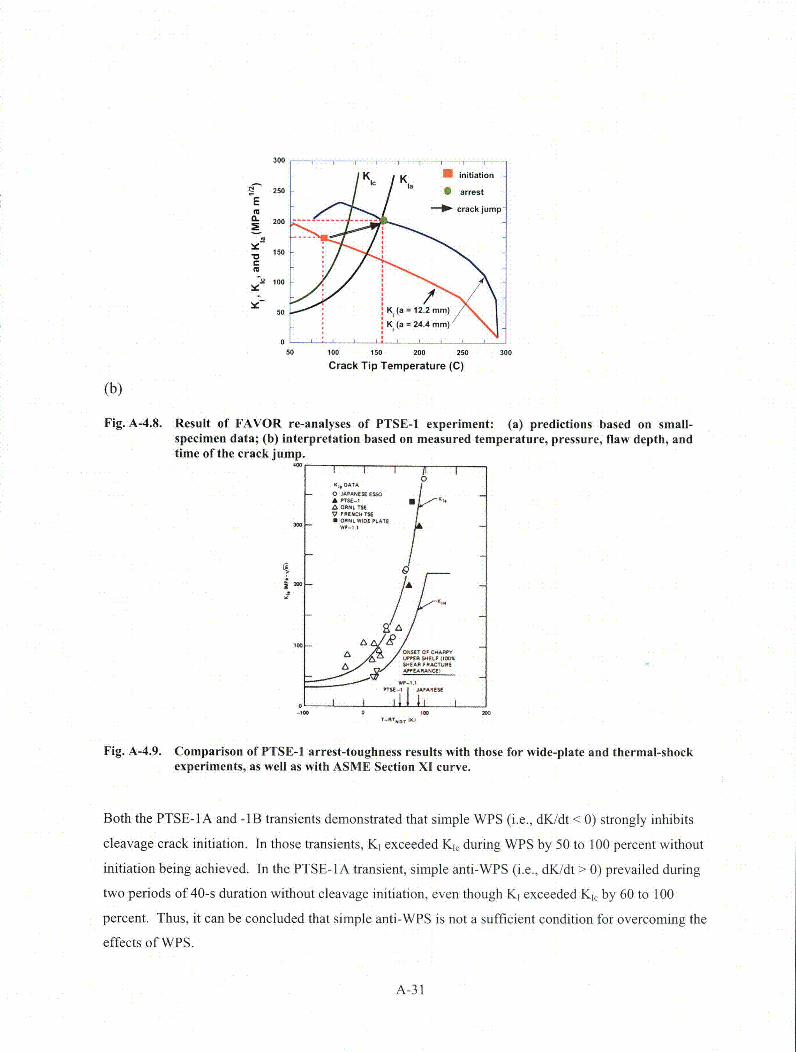
300
250 "a arrest
( *• crack jump-
Crak Tp Tmpeatreac (C)
CL 200 ------- .---
(b)O
1 0 0
S KI (a 12.2 mm)_ Ki (a =24.4 mm)
0so 100 1SO 200 250 300
Crack Tip Temperature (C)
(b)
Fig. A-4.8. Result of FAVOR re-analyses of PTSE-1 experiment: (a) predictions based on small-
specimen data; (b) interpretation based on measured temperature, pressure, flaw depth, and
time of the crack jump.
Kl DATA
- J A•, P A N E SE E S SO
A PTSE -, 0 K,a ORNL. "iE
F7V ENCl TSE300 - • OWSL WIOE PLATE
A A
100 'ONSEATOF CHARYLIPPER SHELF 1100%S*E" FRACTURE
T-ON"T
OF -A
Fig. A-4.9. Comparison of PTSE-I arrest-toughness results with those for wide-plate and thermal-shock
experiments, as well as with ASM~E Section XI curve.
Both the PTSE-lA and -lB transients demonstrated that simple WPS (i.e., dK/dt < 0) strongly inhibits
cleavage crack initiation. In those transients, K 1 exceeded K 1• during WPS by 50 to 100 percent without
initiation being achieved. In the PTSE-1A transient, simple anti-WPS (i.e., dK/dt > 0) prevailed during
two periods of 40-s duration without cleavage initiation, even though K 1 exceeded K 1• by 60 to 100
percent. Thus, it can be concluded that simple anti-WPS is not a sufficient condition for overcoming the
effects of WPS.
A-31
5. Conclusions Based on Large-Scale Experiments
Accomplishments and conclusions supported by results from large-scale HSST experiments (i.e., ITVs,
TSEs, and PTSEs) conducted over the past 30-plus years include the following points:
" The fracture behavior observed in large-scale tests for temperatures in the transition range was
consistent with the implications of small-specimen data,
* The cleavage-fracture behavior observed in each of the three phases of experiments was well
described by LEFM methodology as embodied in OCA/FAVOR computer codes,
* WPS inhibited cleavage-fracture initiation in these experiments where (dKi /dt < 0), and
" Simple anti-WPS (dKi/dt >0) was not a sufficient condition for overcoming the effects of WPS.
6. References
Bryan 75 Bryan, R. H. et al., Test of 6-inch-Thick Pressure Vessels, Series 2: Intermediate TestVessels V-3, V-4, and V-6, Report ORNL-5059, Oak Ridge National Laboratory,November 1975.
Bryan 78a Bryan, R. H. et al., Test of 6-Inch-Thick Pressure Vessels. Series 3: Intermediate TestVessel V-7B, Report NUREG/CR-0309 (ORNL/NUREG-38), Oak Ridge NationalLaboratory, October 1978.
Bryan 78b Bryan, R. H. et al., Test of 6-Inch-Thick Pressure Vessels. Series 3: Intermediate TestVessel V- 7A Under Sustained Loading, Report ORNL/NUREG-9, Oak Ridge NationalLaboratory, February 1978.
Bryan 79 Bryan, R. H. et al., Test of 6-Inch-Thick Pressure Vessels, Series 3: Intermediate TestVessel V-8, Report NUREG/CR-0675 (ORNL/NUREG-58), Oak Ridge NationalLaboratory, December 1979.
Bryan 85 Bryan, R. H. et al., Pressurized Thermal Shock Test of 6-in. -Thick Pressure Vessels.PTSE-1: Investigation of Warm-Prestressing and Upper-ShelfArrest, ReportNUREG/CR-4106 (ORNL-6135), Oak Ridge National Laboratory, April 1985.
Bryan 87a Bryan, R. H. et al., Pressurized Thermal Shock Test of 6-in.-Thick Pressure Vessels.PTSE-2: Investigation of Low-Tearing Resistance and Warm-Prestressing, ReportNUREG/CR-4888 (ORNL-6377), Oak Ridge National Laboratory, April 1987.
Bryan 87b Bryan, R. H. et al., Test of 6-Inch-Thick Pressure Vessels. Series 3. Intermediate TestVessel V-8A Tearing Behavior of Low Upper-Shelf Material, Report NUREG/CR-4760(ORNL-6187), Oak Ridge National Laboratory, May 1987.
Cheverton 76 Cheverton, R. D., Pressure Vessel Fracture Studies Pertaining to a PWR LOCA-ECCThermal Shock: Experiments TSE-1 and TSE-2, Report ORNL/NUREG/TM-3 1, OakRidge National Laboratory, September 1976.
A-32

Cheverton 77
Cheverton 84
Cheverton 85a
Cheverton 85b
Cheverton 86
Derby 74
Dickson 02
Iskander 81
Merkle 75
Merkle 76
Merkle 77
Whitman 86
Cheverton, R. D. and Bolt, S. E., Pressure Vessel Fracture Studies Pertaining to aPWR LOCA-ECC Thermal Shock: Experiments TSE-3 and TSE-4 and Update of TSE-1 and TSE-2 Analysis, Report ORNL/NUREG-22, Oak Ridge National Laboratory,December 1977.
Cheverton, R. D. and Ball, D. G., A Deterministic and Probabilistic FractureMechanics Code for Applications to Pressure Vessels, Report NUREG/CR-3618(ORNL-5991), Oak Ridge National Laboratory, May 1984.
Cheverton, R. D. et al., Pressure Vessel Fracture Studies Pertaining to the PWRThermal-Shock Issue: Experiments TSE-5, TSE-5A, and TSE-6, NUREG/CR-4249(ORNL-6163), Oak Ridge National Laboratory, June 1985.
Cheverton, R. D. et al., Pressure Vessel Fracture Studies Pertaining to the PWRThermal-Shock Issue: Experiment TSE- 7, Report NUREG/CR-4303 (ORNL-6177),Oak Ridge National Laboratory, August 1985.
Cheverton, R. D., Iskander, S. K., and Ball, D. G., "Review of Pressurized-Water-Reactor-Related Thermal Shock Studies," pp.752-766 in Fracture Mechanics:Nineteenth Symposium, ASTM 969, Ed. Thomas A. Cruse, July 1986.
Derby, R. W. et al., Test of 6-Inch-Thick Pressure Vessels. Series 1: Intermediate TestVessels V-1 and V-2, Report ORNL-4895, Oak Ridge National Laboratory, February1974.
Dickson, T. L. et al., "Status of the United States Nuclear Regulatory CommissionPressurized Thermal Shock Rule Re-Evaluation Project," Proceeding ofICONEIO,Paper ICONE10-22656, International Conference on Nuclear Engineering, Arlington,Virginia, April 14-18, 2002.
Iskander, S. K., Cheverton, R. D. and Ball, D. G., OCA-L A Code for Calculating theBehavior of Flaws on the Inner Surface of a Pressure Vessel, Report ORNL/NUREG-84, Oak Ridge National Laboratory, August 1981.
Merkle, J. G., An Evaluation of the HSST Program Intermediate Pressure Vessel Testsin Terms ofLight- Water-Reactor Pressure Vessel Safety, Report ORNL-TM-5090, OakRidge National Laboratory, November 1975.
Merkle, J. G. et al., Test of 6-Inch-Thick Pressure Vessels. Series 3: Intermediate TestVessel V-7, Report ORNL/NUREG-1, Oak Ridge National Laboratory, August 1976.
Merkle, J. G. et al., Test of 6-Inch-Thick Pressure Vessels. Series 4: Intermediate TestVessels V-5 and V-6, with Inside Nozzle Corner Cracks, Report ORNL/NUREG-7, OakRidge National Laboratory, August 1977.
Whitman, G. D., Historical Summary of the Heavy-Section Steel Technology Programand Some Related Activities in Light- Water Reactor Pressure Vessel Safety Research,Report NUREG/CR-4489 (ORNL-6259), Oak Ridge National Laboratory, March 1986.
A-33


APPENDIX BWARM PRESTRESS VALIDITY
Kirk, M., "Inclusion Of Warm Pre-Stress Effects In Probabilistic Fracture Mechanics CalculationsPerformed To Assess The Risk Of RPV Failure Produced By Pressurized Thermal ShockEvents: An Opinion," 2002.
B-i

INCLUSION OF WARM PRE-STRESS EFFECTS IN PROBABILISTICFRACTURE MECHANICS CALCULATIONS PERFORMED TO ASSESS THERISK OF RPV FAILURE PRODUCED BY PRESSURIZED THERMAL SHOCKEVENTS: AN OPINION
MARK KIRKtSenior Materials EngineerUnited States Nuclear Regulatory CommissionOffice of Nuclear Regulatory ResearchRockville, MD, 20852, USAmtk(@nrc.gov
Abstract: The United States Nuclear Regulatory Commission and the commercialnuclear power industry in the United States (operating under the auspices of theElectric Power Research Institute) are in the process of re-evaluating the technicalbasis of current statutory requirements for the fracture toughness needed by a nuclearreactor pressure vessel to maintain its structural integrity during a pressurized thermalshock (PTS) event. These requirements, currently codified as I OCFR§50.61, state that
the RTNDT transition temperature must remain less than 270 'F (132 9C) for axial weldsand plates, and 300 'F (149 'Q) for circumferential welds for the plant to continue inroutine licensed operation. These requirements are based on an analysis performed inthe early 1980s that contained a number of conservatisms, conservatisms whose re-examination is now appropriate in light of the following factors: technicaldevelopments in the areas of probabilistic risk assessment, thermal hydraulics, andfracture mechanics; the current regulatory focus on minimizing overall plant risk; andthe economic factors resulting from energy price deregulation in the United States. Inthis paper we assess the technical basis for including warm pre-stress (WPS) effects inthe probabilistic fracture mechanics calculations being performed as part of the PTSrule re-evaluation. The information presented herein demonstrates that inclusion ofWPS effects in these calculations is consistent with both theoretical expectations andavailable experimental evidence and is, therefore, appropriate.
Keywords: Warm pre-stress, pressurized thermal shock, nuclear reactor,probabilistic fracture mechanics.
The views expressed herein represent those of the author and are not an official position of the USNRC.
B-2

1. Background
Warm pre-stress (WPS) effects were first noted in the literature in 1963 [1]. Theseinvestigators reported (as have many since them) that the apparent fracture toughness ofa ferritic steel can be elevated in the fracture mode transition regime if the specimen isfirst "pre-stressed" at an elevated temperature. Once a specimen is subjected to acertain Kapplied and has not failed, the temperature can be reduced and the specimen willremain intact despite the fact that the process of reducing the temperature has alsoreduced the initiation fracture toughness (Kl, or KjI) to values smaller than Kapplied. Inthe past four decades, three mechanisms have been identified as producing (to differentextents in different situations) the WPS phenomena [2-4]:
1. Pre-loading at an elevated temperature work hardens the material ahead of thecrack tip. The increase of yield strength produced by decreasing the temperature"immobilizes" the dislocations in this plastic zone [5-6]. Consequently,additional applied load is needed for additional plastic flow (and, consequently,fracture) to occur at the lower temperature.
2. Pre-loading at an elevated temperature blunts the crack tip, reducing thegeometric stress concentration and making subsequent fracture more difficult.
3. If un-loading occurs between the WPS temperature and the reduced temperatureresidual compressive stresses are generated ahead of the crack tip. The loadapplied at the lower temperature must first overcome these residual compressivestresses before the loading can produce additional material damage and,consequently, fracture.
A loss of coolant accident (LOCA) poses a potentially significant challenge to thestructural integrity of a nuclear reactor pressure vessel (RPV). During a LOCA,operators must quickly replace the water lost through the breach in the primary systemwith much colder water held in external tanks to prevent exposure of the reactivematerials in the core. The temperature differential between the nominally ambienttemperature emergency coolant water and the operating temperature of a pressurizedwater reactor (AT = 290'F - 20'C = 270'C) produces significant thermal stresses in thethick section steel wall of the RPV. These stresses would load cracks in the vessel wall,potentially generating Kapplied values that exceed the toughness of the RPV material. Asillustrated in Figure 1.1, Kappljed first increases and then decreases as these transientsprogress, with the time of peak Kapplied varying depending on both the severity of thetransient and the location of the crack in the vessel wall. It is the latter part of thetransient when Kapplied decreases with time that is of interest within the context of WPS.If the Kapplied value generated by a LOCA were to enter the temperature dependentdistribution of initiation fracture toughness values during the falling portion of thetransient then the WPS phenomena suggests that crack initiation will not occur eventhough Kapplied exceeds the initiation fracture toughness of the material (see Figure 1.2).
To date, probabilistic calculations performed in the United States to assess thechallenge to RPV integrity posed by pressurized thermal shock events have notincluded WPS as part of the PFM model [7-9] for two reasons:
B-3
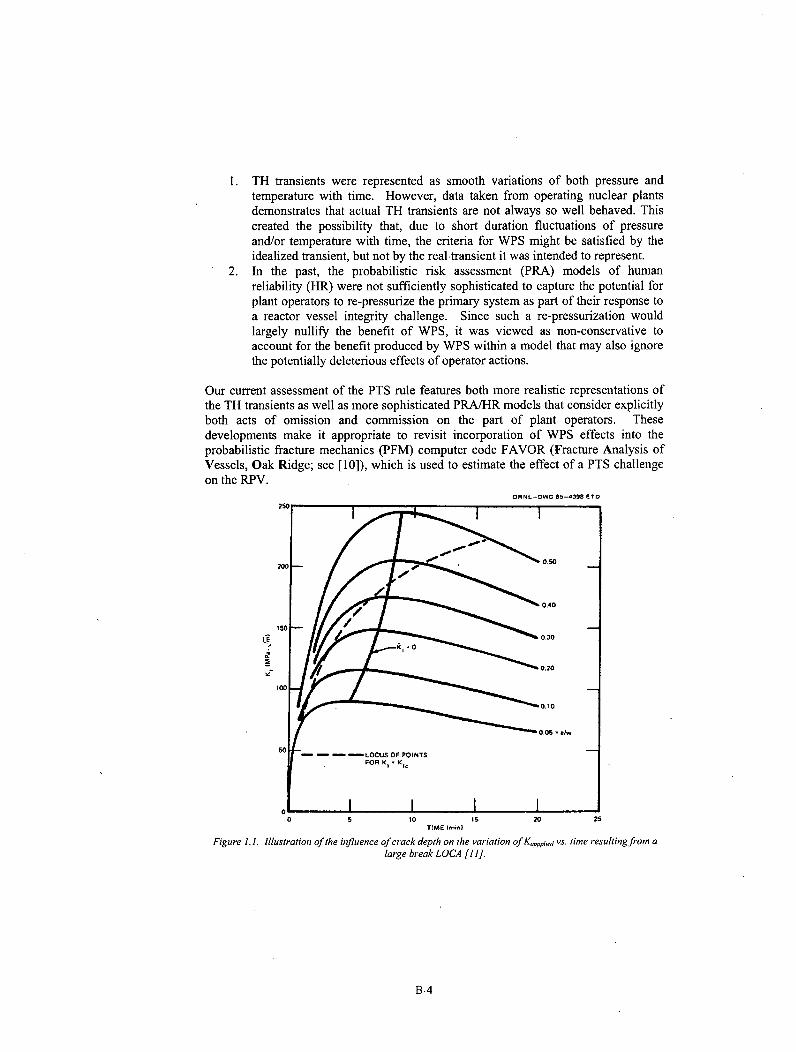
I. TH transients were represented as smooth variations of both pressure andtemperature with time. However, data taken from operating nuclear plantsdemonstrates that actual TH transients are not always so well behaved. Thiscreated the possibility that, due to short duration fluctuations of pressureand/or temperature with time, the criteria for WPS might be satisfied by theidealized transient, but not by the realtransient it was intended to represent.
2. In the past, the probabilistic risk assessment (PRA) models of humanreliability (HR) were not sufficiently sophisticated to capture the potential forplant operators to re-pressurize the primary system as part of their response toa reactor vessel integrity challenge. Since such a re-pressurization wouldlargely nullify the benefit of WPS, it was viewed as non-conservative toaccount for the benefit produced by WPS within a model that may also ignorethe potentially deleterious effects of operator actions.
Our current assessment of the PTS rule features both more realistic representations ofthe TH transients as well as more sophisticated PRA/HR models that consider explicitlyboth acts of omission and commission on the part of plant operators. Thesedevelopments make it appropriate to revisit incorporation of WPS effects into theprobabilistic fracture mechanics (PFM) computer code FAVOR (Fracture Analysis ofVessels, Oak Ridge; see [10]), which is used to estimate the effect of a PTS challengeon the RPV.
ORNL-DWG 85-4398 ETD
.0 5 10 15 20 25TIME Ir.a)
Figure 1.1. Illustration of the influence of crack depth on the variation of g ppplid vs. time resulting from alarge break LOCA [1I].
B-4
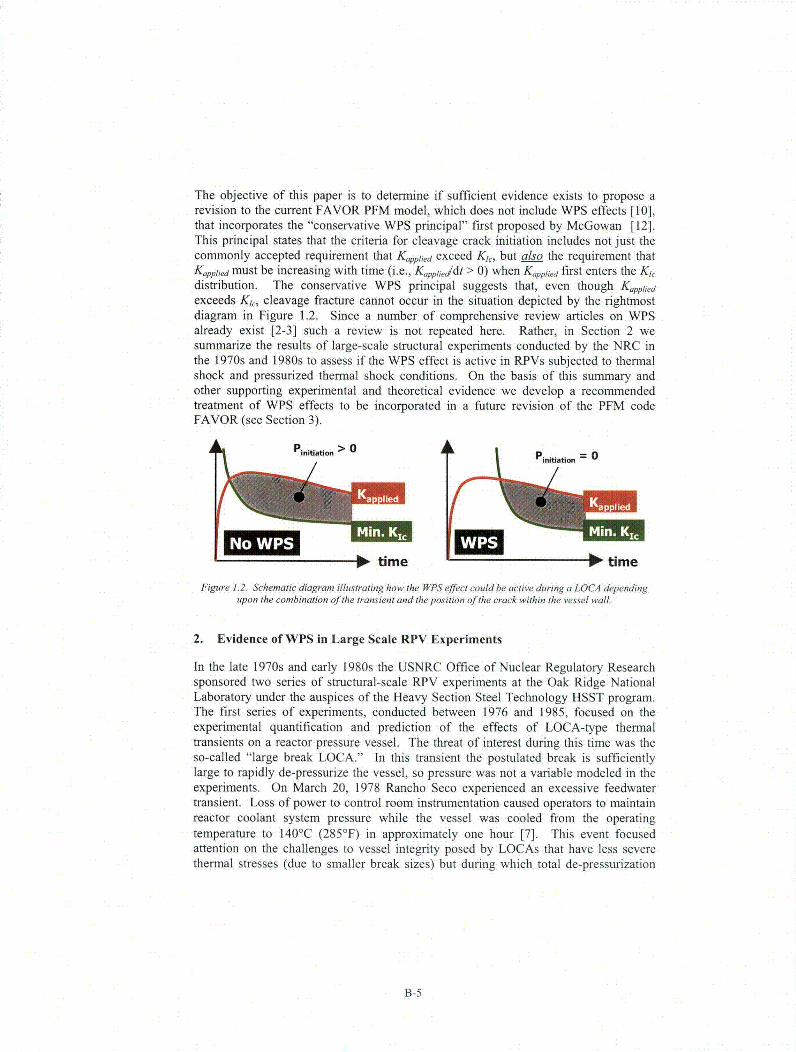
The objective of this paper is to determine if sufficient evidence exists to propose arevision to the current FAVOR PFM model, which does not include WPS effects [10],that incorporates the "conservative WPS principal" first proposed by McGowan [12].This principal states that the criteria for cleavage crack initiation includes not just thecommonly accepted requirement that Kapplied exceed K1 ,, but also the requirement thatK,,ppied must be increasing with time (i.e., Kapp/iedtd1 > 0) when KappIied first enters the K1Cdistribution. The conservative WPS principal suggests that, even though Kappliedexceeds K1,, cleavage fracture cannot occur in the situation depicted by the rightmostdiagram in Figure 1.2. Since a number of comprehensive review articles on WPSalready exist [2-3] such a review is not repeated here. Rather, in Section 2 wesummarize the results of large-scale structural experiments conducted by the NRC inthe 1970s and 1980s to assess if the WPS effect is active in RPVs subjected to thermalshock and pressurized thermal shock conditions. On the basis of this summary andother supporting experimental and theoretical evidence we develop a recommendedtreatment of WPS effects to be incorporated in a future revision of the PFM codeFAVOR (see Section 3).
:initiatioo > 0 o=
(WII No WPS I
I P time 1 01 time
Figure 1.2. Schematic diagram illustrating how the WPS effect could be active during a LOCA dependingupon the combination of the transient and the position of the crack within the vessel wall.
2. Evidence of WPS in Large Scale RPV Experiments
In the late 1970s and early 1980s the USNRC Office of Nuclear Regulatory Researchsponsored two series of structural-scale RPV experiments at the Oak Ridge NationalLaboratory under the auspices of the Heavy Section Steel Technology HSST program.The first series of experiments, conducted between 1976 and 1985, focused on theexperimental quantification and prediction of the effects of LOCA-type thermaltransients on a reactor pressure vessel. The threat of interest during this time was theso-called "large break LOCA." In this transient the postulated break is sufficientlylarge to rapidly de-pressurize the vessel, so pressure was not a variable modeled in theexperiments. On March 20, 1978 Rancho Seco experienced an excessive feedwatertransient. Loss of power to control room instrumentation caused operators to maintainreactor coolant system pressure while the vessel was cooled from the operatingtemperature to 140'C (285°F) in approximately one hour [7]. This event focusedattention on the challenges to vessel integrity posed by LOCAs that have less severethermal stresses (due to smaller break sizes) but during which total de-pressurization
B-5
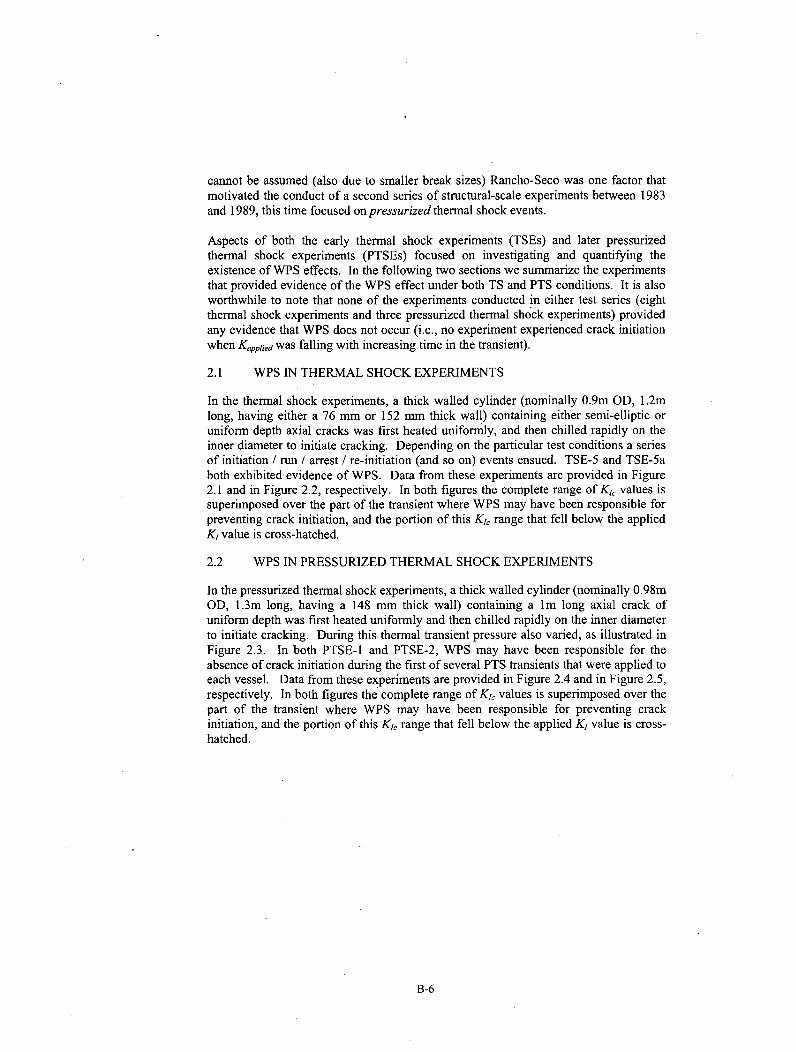
cannot be assumed (also due to smaller break sizes) Rancho-Seco was one factor thatmotivated the conduct of a second series of structural-scale experiments between 1983and 1989, this time focused on pressurized thermal shock events.
Aspects of both the early thermal shock experiments (TSEs) and later pressurizedthermal shock experiments (PTSEs) focused on investigating and quantifying theexistence of WPS effects. In the following two sections we summarize the experimentsthat provided evidence of the WPS effect under both TS and PTS conditions. It is alsoworthwhile to note that none of the experiments conducted in either test series (eightthermal shock experiments and three pressurized thermal shock experiments) providedany evidence that WPS does not occur (i.e., no experiment experienced crack initiationwhen Kapplied was falling with increasing time in the transient).
2.1 WPS IN THERMAL SHOCK EXPERIMENTS
In the thermal shock experiments, a thick walled cylinder (nominally 0.9m OD, 1.2mlong, having either a 76 mm or 152 mm thick wall) containing either semi-elliptic oruniform depth axial cracks was first heated uniformly, and then chilled rapidly on theinner diameter to initiate cracking. Depending on the particular test conditions a seriesof initiation / run / arrest / re-initiation (and so on) events ensued. TSE-5 and TSE-5aboth exhibited evidence of WPS. Data from these experiments are provided in Figure2.1 and in Figure 2.2, respectively. In both figures the complete range of K1, values issuperimposed over the part of the transient where WPS may have been responsible forpreventing crack initiation, and the portion of this Ki, range that fell below the appliedKI value is cross-hatched.
2.2 WPS IN PRESSURIZED THERMAL SHOCK EXPERIMENTS
In the pressurized thermal shock experiments, a thick walled cylinder (nominally 0.98mOD, 1.3m long, having a 148 mm thick wall) containing a lm long axial crack ofuniform depth was first heated uniformly and then chilled rapidly on the inner diameterto initiate cracking. During this thermal transient pressure also varied, as illustrated inFigure 2.3. In both PTSE-1 and PTSE-2, WPS may have been responsible for theabsence of crack initiation during the first of several PTS transients that were applied toeach vessel. Data from these experiments are provided in Figure 2.4 and in Figure 2.5,respectively. In both figures the complete range of K1, values is superimposed over thepart of the transient where WPS may have been responsible for preventing crackinitiation, and the portion of this K1, range that fell below the applied K1 value is cross-hatched.
B-6

200
EIL
200
150
100.
50
1 5 0
100
5o
Time [seconds]
Figure 2.1. Variation of Kp ,,,,,,, and KI, with time in TSE-5 showing evidence of a potential WPS effectbeginning at 1400 seconds [11].
200-
160-
9- 120-
E
2 80-
40-
0-
160
120
.X
I" 80
40
0
0 100 200 300 400 500 600
Time [seconds]
Figure 2.2. Variation of K,,,,,,i and K,, with time in TSE-5A showing evidence ofa potential WPS ef./ect
beginning at ý360 seconds [11].
B-7
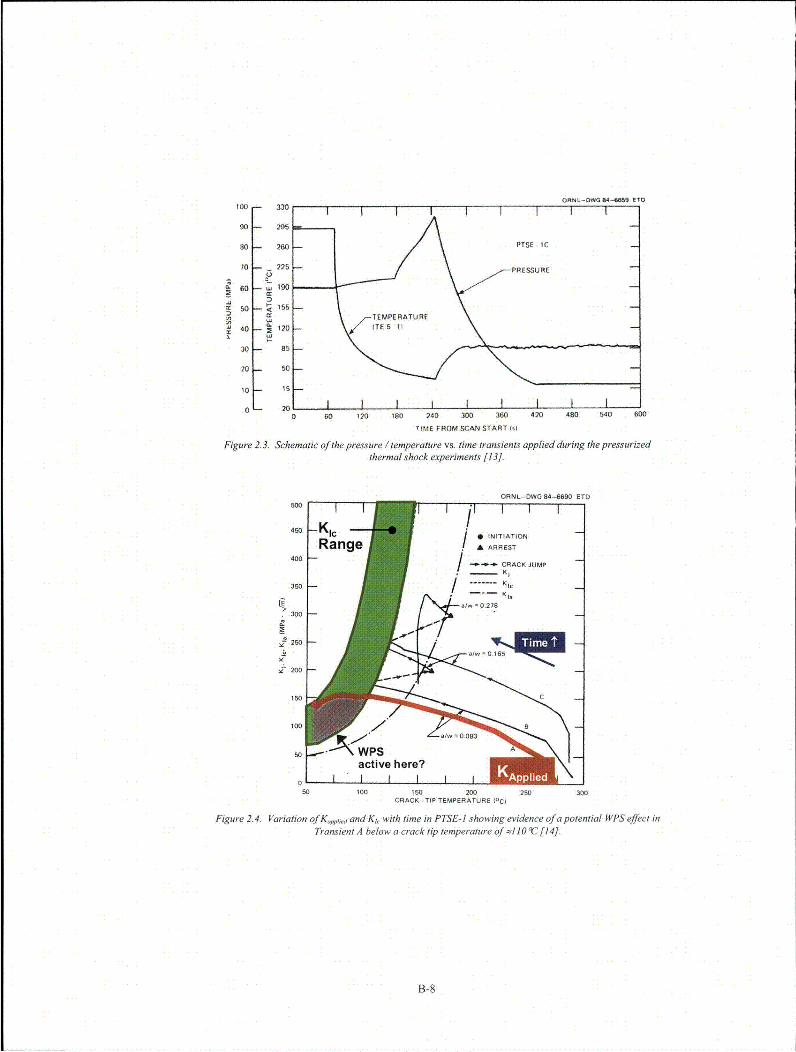
90-- 295 •
80 - 260 "PTSE 1C
10 - 225 PESR~PRESSURE
cc •TEMPERATURE40 -- 1E 20 -(TE 5 11
10 15 -
0 0 I I0 60 120 180 240 300 360 420 480 540 600
TIME FROM SCAN START W0
Figure 2.3. Schematic of the pressure / temperature vs. time transients applied during the pressurizedthermal shock experiments [13].
ORNL-DWG 84-6690 ETD
450 -Kic I AORange I : ,,TiA5TIONRange ARREST
400 -• -, CRACK JUMP
350 - ------- Kc
I>300 "300
- C150• •
100 B aw= ,8
soWPSAactive here?
50 100 150 200 250 300CRACK -TIP TEMPERATURE (Oc)
Figure2.4. Variation of Kppli,, and Kic with time in PTSE-l showing evidence of a potential WPS effect inTransient A below a crack tip temperature of 4110 1C [14].
B-8
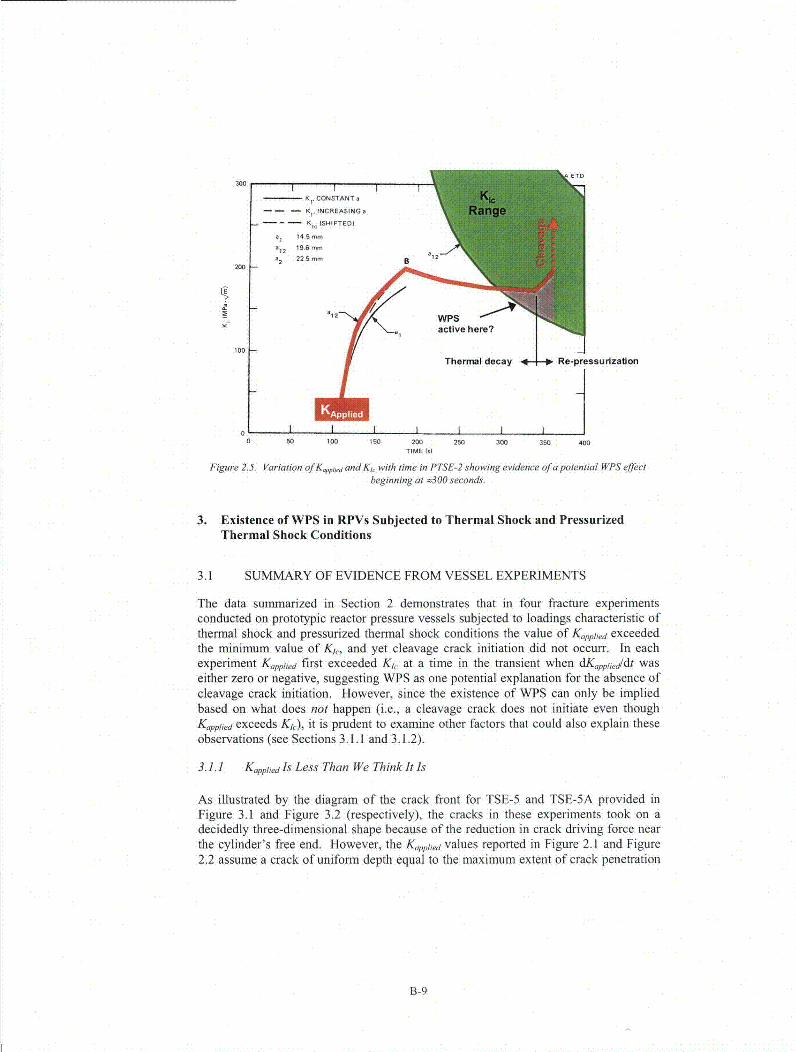
TO
300I I
K CONSTANT a
- - - KK, INCREASING a
- - - K, (SHIFTED)
a1 14.5 mm
'12 19.6 -a2 225 mm Bn12"
200
a, active here?
100
Thermal decay Re-pressurization
00 50 100 150 200 250 300 350 400
TIME W,)
Figure2.5. Variation of K&,,pi,, and KI, with time in PTSE-2 showing evidence of a potential WPS effectbeginning at o300 seconds.
3. Existence of WPS in RPVs Subjected to Thermal Shock and PressurizedThermal Shock Conditions
3.1 SUMMARY OF EVIDENCE FROM VESSEL EXPERIMENTS
The data summarized in Section 2 demonstrates that in four fracture experimentsconducted on prototypic reactor pressure vessels subjected to loadings characteristic ofthermal shock and pressurized thermal shock conditions the value of Kapplied exceededthe minimum value of K.,, and yet cleavage crack initiation did not occurr. In eachexperiment Kapp/ied first exceeded K1,. at a time in the transient when dKapplied/dt waseither zero or negative, suggesting WPS as one potential explanation for the absence ofcleavage crack initiation. However, since the existence of WPS can only be impliedbased on what does not happen (i.e., a cleavage crack does not initiate even thoughKapplied exceeds K1,), it is prudent to examine other factors that could also explain theseobservations (see Sections 3.1.1 and 3.1.2).
3.1.1 Kapplied Is Less Than We Think It Is
As illustrated by the diagram of the crack front for TSE-5 and TSE-5A provided inFigure 3.1 and Figure 3.2 (respectively), the cracks in these experiments took on adecidedly three-dimensional shape because of the reduction in crack driving force nearthe cylinder's free end. However, the Kpplid values reported in Figure 2.1 and Figure2.2 assume a crack of uniform depth equal to the maximum extent of crack penetration
B-9

into the vessel wall. Relative to this approximation, the correct Kapplied for the non-uniform depth crack front is lower, suggesting that the crack may not have initiated inthese experiments simply because Kapplied never exceeded K1,. The impact of thisuncertainty on conclusions regarding the existence of WPS in the four structuralexperiments is as follows:
* TSE-5: Because of the small degree by which Kpplied exceeded K1, (see Figure2.1), it is possible that the Kapplied for the actual (non-uniform depth) crack(shown in Figure 3.1) may not have exceeded K1,. Thus, some doubt regardingthe demonstration of WPS during TSE-5 exists.
" TSE-5A: Uncertainties in Kapplied are not believed to alter the conclusion thatWPS was responsible for the lack of crack initiation in TSE-5A after 360seconds for two reasons. First, after 180 seconds the crack penetrated to itsmaximum depth over a length of nearly 0.5m, suggesting that deviationsbetween the Kapplied values for the crack as it existed in the vessel and theapproximate Kapplied values (estimated by assuming a uniform depth crack ofinfinite extent) should be small. Furthermore, Kapplid exceeded the maximumof the KI, distribution before the end of the transient, suggesting that (were itnot for WPS) cleavage crack initiation should have certainly occurred, yet itdid not.
* PTSE-1&2: In both of the pressurized thermal shock experiments WPS mayhave occurred during the first transient. The crack depth during this transientwas the pre-test crack depth, making the uniform depth / infinite extentassumptions made in the calculation of Kppl.id appropriate.
ORML-OWG 79--17163 ETD
# INITIAL FLAW* FIRST ARREST LUT MEASUREMENTS* SECOND ARREST DURING TSE-50 THIRD ARRESTo UT MEASUREMENT OF FINAL
CRACK FRONT IPOSTTEST)O VISUAL INSPECTION OF CRACK
CROSS SECTION'-UPPR EN r--NTENDED INITIAL
ECRACK FRONTINNER SURFACE LOWER
0 f 1 '0.0. A 0.10 0 0 - 0.2
so -- 0.3
Y 0.4
, o 0.6
*00 0.9
UITER SURFACE9
0 200 400 600 800 1000 1200AXIAL POSITION (rnmI
Figure 3.1. Crack profilefrom TSE-5 [11].
B-10
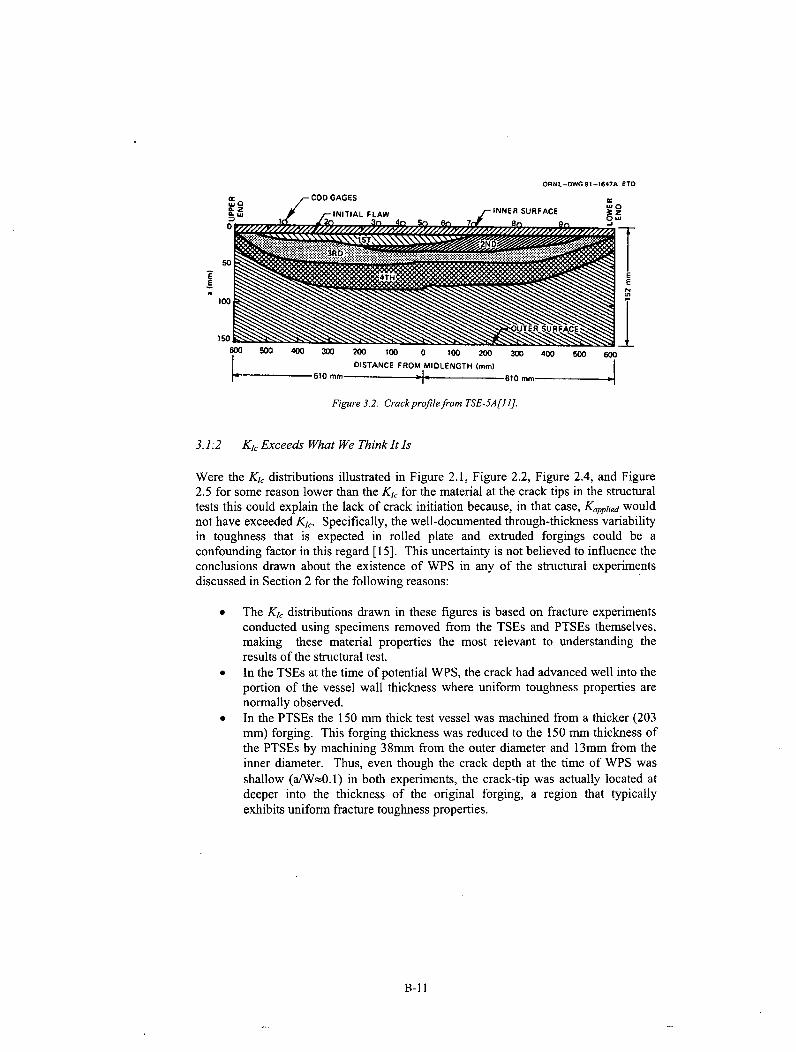
ORNL-OWG 81-1647A ETD
COD GAGES
A. I
600 500 400 300 200 100 0 100 200 300 400 500 600DISTANCE FROM MIOLENGTH (mm)
610 mm i. 610 mm l
Figure 3.2. Crack profilefrom TSE-5A[I 1].
3.k12 K1c Exceeds What We Think It Is
Were the K1 c distributions illustrated in Figure 2.1, Figure 2.2, Figure 2.4, and Figure2.5 for some reason lower than the K1 c for the material at the crack tips in the structuraltests this could explain the lack of crack initiation because, in that case, Kapplied wouldnot have exceeded Kic. Specifically, the well-documented through-thickness variabilityin toughness that is expected in rolled plate and extruded forgings could be aconfounding factor in this regard [15]. This uncertainty is not believed to influence theconclusions drawn about the existence of WPS in any of the structural experimentsdiscussed in Section 2 for the following reasons:
* The K1 c distributions drawn in these figures is based on fracture experimentsconducted using specimens removed from the TSEs and PTSEs themselves,making these material properties the most relevant to understanding theresults of the structural test.
" In the TSEs at the time of potential WPS, the crack had advanced well into theportion of the vessel wall thickness where uniform toughness properties arenormally observed.
* In the PTSEs the 150 mm thick test vessel was machined from a thicker (203mm) forging. This forging thickness was reduced to the 150 mm thickness ofthe PTSEs by machining 38mm from the outer diameter and 13mm from theinner diameter. Thus, even though the crack depth at the time of WPS wasshallow (a/W=0.1) in both experiments, the crack-tip was actually located atdeeper into the thickness of the original forging, a region that typicallyexhibits uniform fracture toughness properties.
B-II

3.1.3 Summary
Even taking into account the various factors described in this Section, there is littledoubt that WPS was responsible for the non-initiation of a cleavage crack in both TSE-5a and in PSTE-1 owing to the considerable degree to which Kapplied exceeded K1, ineach experiment. While TSE-5 and PTSE-2 both suggest the possibility of WPS, theconclusion that WPS was the factor responsible for lack of cleavage crack initiationmust, with all factors considered (see Sections 3.1.1 and 3.1.2), be made somewhatmore equivocally.
While these results are heartening, they do not by themselves provide an adequatetechnical basis to justify inclusion of WPS in the FAVOR code. Evidence supportingWPS therefore needs to be drawn from other sources (e.g., experimental evidenceobtained from specimen tests, and from the theoretical understanding of the WPSphenomena itself: see Section 3.2). Additionally, it is important to recognize that noneof these experiments (nor any other experiments conducted to date on either vessels orfracture specimens) have been performed using irradiated materials. Since the aim ofthis paper is identification of a WPS model that can be applied to irradiated materials,this will be discussed in Section 3.2 as well.
3.2 SUMMARY OF OTHER EVIDENCE
3.2.1 Experimental
Since experiments on fracture toughness specimens can be conducted moreeconomically than prototypic vessel experiments, such results more comprehensivelyquantify all of the factors relevant to WPS than has been possible using the vesselexperiments reported in Section 2. Quoting from a review of warm pre-stressingstudies reported by Pickles and Cowan in the International Journal of Pressure Vesselsand Piping [3],
Many experiments have. been made on simple fracture toughnessspecimens to demonstrate that the {WPS} phenomenon exists and, almostwithout exception, beneficial effects have been found. For cases whereno unloading is involved, no reported instance has been found of aspecimen failing at low temperature following warm pre-stress withoutaddition offurther load above the warm pre-stress load; this is the casedespite the fact that the warm pre-stress load could be well above theload to achieve the low temperature {minimum} Kic.
Since the no-unloading case represents the upper-bound to dKapplidI/dt < 0 (i.e.,dKappliedldt = 0), the experimental evidence provides strong testament to theappropriateness of the "conservative warm-prestressing" principal *expressed byMcGowan that is being considered here for inclusions in a future version of FAVOR[12]. However, since no WPS experiments have been conducted on irradiated
B-12
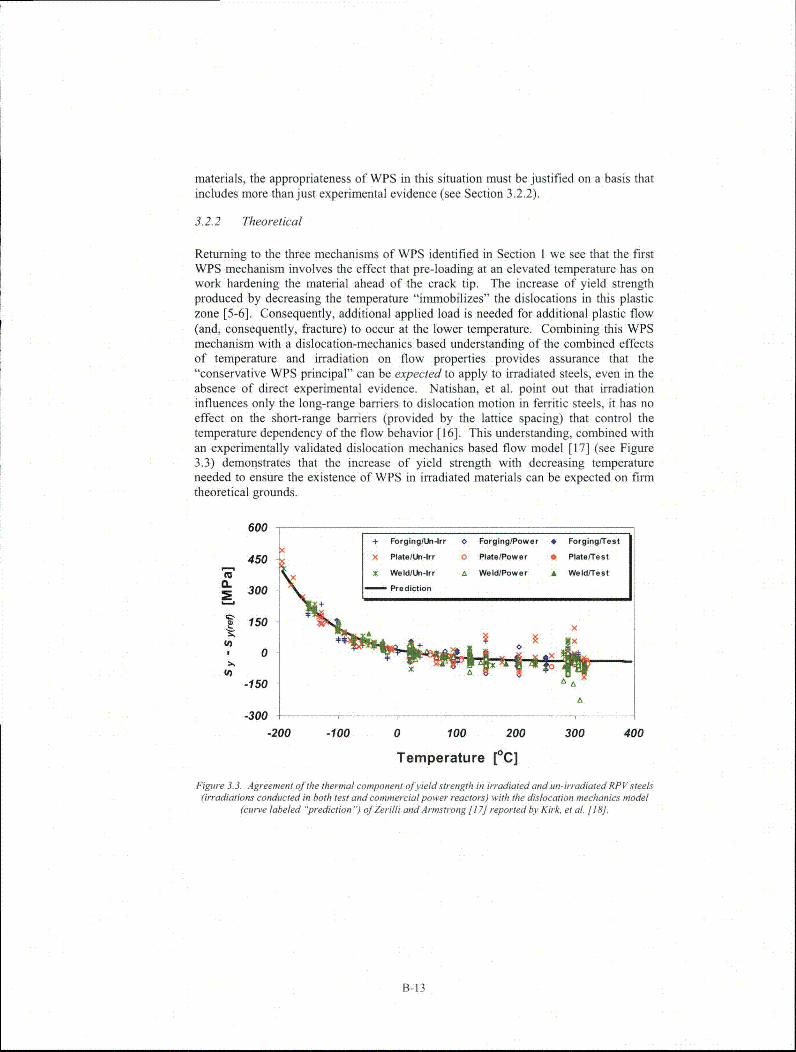
materials, the appropriateness of WPS in this situation must be justified on a basis thatincludes more than just experimental evidence (see Section 3.2.2).
3.2.2 Theoretical
Returning to the three mechanisms of WPS identified in Section 1 we see that the firstWPS mechanism involves the effect that pre-loading at an elevated temperature has onwork hardening the material ahead of the crack tip. The increase of yield strengthproduced by decreasing the temperature "immobilizes" the dislocations in this plasticzone [5-6]. Consequently, additional applied load is needed for additional plastic flow(and, consequently, fracture) to occur at the lower temperature. Combining this WPSmechanism with a dislocation-mechanics based understanding of the combined effectsof temperature and irradiation on flow properties provides assurance that the"conservative WPS principal" can be expected to apply to irradiated steels, even in theabsence of direct experimental evidence. Natishan, et al. point out that irradiationinfluences only the long-range barriers to dislocation motion in ferritic steels, it has noeffect on the short-range barriers (provided by the lattice spacing) that control thetemperature dependency of the flow behavior [16]. This understanding, combined withan experimentally validated dislocation mechanics based flow model [17] (see Figure3.3) demonstrates that the increase of yield strength with decreasing temperatureneeded to ensure the existence of WPS in irradiated materials can be expected on firmtheoretical grounds.
600 ______________________+ ForglngtUn-lrr * Forging/Power * Forging/Test
450 •x Plate/Un-lrr 0 Plate/Power * Plate/Test
)K Weld/Un-lrr a Weld/Power A Weld/TestS300
Prediction
1501 + 0. x
0
-150 AA
-300-200 -100 0 100 200 300 400
Temperature [°C]
Figure 3.3. Agreement of the thermal component of yield strength in irradiated and un-irradiated RP V steels(irradiations conducted in both test and commercial power reactors) with the dislocation mechanics model
(curve labeled "prediction ) of Zerilli and Armstrong [17] reported by Kirk. et al. [18].
B-13
3.3 RECOMMENDATIONS FOR FAVOR CALCULATIONS
Based on the information provided herein, it is justified to include the "conservativeWPS principal" in the probabilistic fracture mechanics code FAVOR. Specifically, theconditional probability of crack initiation (CPI) can be non-zero only if both of thefollowing conditions are met:
Condition 1. Kapplied Ž! Kl,(,i,). The time when this condition is first satisfied isdesignated twps
Condition 2. dKappieddt > 0 when Condition I is first satisfied (i.e., at twps).
If Conditions 1 and 2 are never both satisfied during the course of a transient then eitherthe crack driving force has never exceeded the minimum value of fracture toughness or,even though it has, WPS has occurred. In either case the CPI is, by definition, zero.However, should the following two conditions also both be met at some time after twps:
Condition A. Kappnied at the current temperature/time exceeds the KCcmi,) value attws, and
Condition B. dKappljiddt > 0 at this same temperature/time.
then CPI can exceed zero because a significant re-pressurization has occurred. In thiscase all benefits of WPS are lost, and CPI is calculated accordingly.
These checks for WPS will be made during both calculations made to assess if a crackwill initiate from a pre-existing defect, and during calculations made to assess if anarrested crack will re-initiate at some later time in the transient. Because the flawdistributions used in these calculations contain mostly small flaws that are placed closeto the inner radius of the RPV [19] we expect that the influence of WPS on preventingfirst initiations to be minimal. However, a considerably greater effect of WPS isanticipated in preventing re-initiations from cracks that have arrested at depths deeperinto the vessel wall.
4. References
[1] Brothers, A.J. and Yukawa, S., "The Effect of Warm Prestressing on NotchFracture Strength," Journal of basic Engineering, March 1963, p. 97.
[2] Nichols, R. W., 1968, "The Use of Overstressing Techniques to Reduce the Riskof Subsequent Brittle Fracture: Parts 1 and 2," British Welding Journal.
[3] Pickles, B.W. and Cowan, A., 1983, "A Review of Warm Prestressing Studies,"Int. J. Pres. Ves. & Piping, 14, 95-131
[4] Chen, J.H., Wang, V.B., Wang, G.Z., and Chen, X., 2001, "Mechanism of Effectsof Warm Prestressing on Apparent Toughness of Precracked Specimens of HSLASteels," Engineering Fracture Mechanics, 68, 1669-1689
B- 14

[5] Chell,G.C., 1979, "A Theory of Warm Prestressing: Experimental Validation andthe Implications for Elastic-Plastic Failure Criteria," CERL Lab NoteRD/L/N78/79.
[6] Chell, G.C., 1980, "Some Fracture Mechanics Application of Warm Prestressingto Pressure Vessels," 4 th International Conference on Pressure Vessel Technology,Paper C22/80, London.
[7] SECY-82-465, 1982, United States Nuclear Regulatory Commission.
[8] D. L. Selby, et al., 1985, Martin Marietta Energy Systems Inc., Oak RidgeNational Lab., Pressurized-Thermal-Shock Evaluation of the Calvert Cliffs Unit 1Nuclear Power Plant, NUREG/CR-4022 (ORNL/TM-9408).
[9] D.L. Selby, et al., 1985, Martin Marietta Energy Systems Inc., Oak RidgeNational Lab., Pressurized-Thermal-Shock Evaluation of the H.B. RobinsonNuclear Power Plant, NUREG/CR-4183 (ORNL/TM-9567).
[10] Williams, P. and Dickson, T., 2001, "Fracture Analysis of Vessels - Oak Ridge,FAVOR v01.0, Computer Code: Theory and Implementation of Algorithms,Methods, and Correlations, NUREG/CR-????, in review.
[11] Cheverton, R.D., et al., 1985, "Pressure Vessel Fracture Studies Pertaining to thePWR Thermal-Shock Issue: Experiments TSE-5, TSE-5A, and TSE-6," UnitedStates Nuclear Regulatory Commission, Washington, DC, NUREG/CR-4249.
[12] McGowan, J.J., 1978, "An assessment of the Beneficial Effects of WarmPrestressing on the Fracture Properties of Nuclear Reactor Vessels Under SevereThermal Shock," Westinghouse Electric Company, WCAP-9178.
[13] Bryan, R.H., et al., 1985, "Pressurized-Thermal-Shock Test of 6-in.-ThickPressure Vessels. PTSE-I: Investigation of Warm Prestressing and Upper-ShelfArrest," United States Nuclear Regulatory Commission, Washington, DC,NUREG/CR-4106.
[14] Bryan, R.H., et al., 1987, "Pressurized-Thermal-Shock Test of 6-in.-ThickPressure Vessels. PTSE-I: Investigation of Low Tearing Resistance and WarmPrestressing," United States Nuclear Regulatory Commission, Washington, DC,NUREG/CR-4888.
[15] Viehrig, H.-W., Boehmert, J., and Dzugan, J., 2002, "Some Issues By Using theMaster Curve Concept," Nuclear Engineering and Design, 212 115-124.
[16] Natishan, M.E., Wagenhoefer, M., and Kirk, M.T., 1999, "Dislocation MechanicsBasis and Stress State Dependency of the Master Curve," Fracture Mechanics,31Js Symposium, ASTM STP 1389, K. Jerina and J. Gahallger, Eds., AmericanSociety for Testing and Materials.
[17] Zerilli, F. J. and R. W. Armstrong, 1987, "Dislocation-mechanics-basedconstitutive relations for material dynamics calculations," J. Appl. Physics, Vol.61, No. 5, 1.
[18] Kirk, M.T., Natishan, M.E., M. Wagenhofer, 2001, "Microstructural Limits ofApplicability of the Master Curve," Fracture Mechanics, 32"d Volume, ASTM
B-15
STP-1406, R. Chona, Ed., American Society for Testing and Materials,Philadelphia, PA.
[19] Simonen, F., Schuster, G, Doctor, S., and Dickson, T., 2002, "Distributions ofFabrication Flaws in Ractore Pressure Vessels for Structural IntegrityEvaluations," Proceedings of the ASME Pressure Vessel and Piping Conference,Vancouver, British Columbia.
[20] T. J. Bums, et al., 1986, Martin Marietta Energy Systems Inc., Oak RidgeNational Lab., Preliminary Development of an Integrated Approach to theEvaluation of Pressurized- Thermal-Shock as Applied to the Oconee Unit 1Nuclear Power Plant, NUREG/CR-3770 (ORNL/TM-9176).
B-16

APPENDIX CPLANT-SPECIFIC MATERIAL VARIABLES USED IN FAVOR CALCULATIONS
I IT[T. ' l-
9084C4381-2 INTERMEDIATE SHELL B6607-2 84.3 MTEB 5-2 731 0 0.14 0.62 0.011
PLATEC6293-2 ILOWER SHELL B7203-2 78.8 !MTEB 5-2 20 0 j 0.14j 0.57j 0.0151 84
C6317-1 LOWER SHELL B6903-1 72.7 MTEB 5-2 271 0 0.2 0.54 0.01 80
LINDE 1092 WELD 305414 LOWER SHELL AXIAL WELD 20-714 75.3 Generic -56 17 0.337 0.609 0.0121 98305424 INTER SHELL AXIAL WELD 19-714 79.9 Generic -561 17 0.273 0.629 0.013 112
LINDE 0091 WELD 90136 CIRC WELD 11-714 76.1 Generic -561 17 0.269 0.07 0.013 144
AHR54
FORGING ZV2861) LOWER NOZZLE BELT (4) B&W Generic 3 31 0.16 0.65 0.006 109
C2197-2 INTERMEDIATE SHELL (4) B&W Generic 1 26.9 0.151 0.5 0.008 81
C2800-1 LOWER SHELL (4) B&W Generic 1 26.9 0.11 0.63 0.012 81PLATE C2800-2 LOWER SHELL 69.9. B&W Generic 1 26.9 0.11 0.63 0.012 119
C3265-1 UPPER SHELL 75.8 B&W Generic 1 26.9 0.1 0.5 0.015 108
C3278-1 UPPER SHELL (4) B&W Generic 1 26.9 0.12 0.6 0.01 81
1P0962 INTERMEDIATE SHELL AXIAL WELDS 79.4 B&W Generic -5 19.7 0.21 0.64 0.025 70SA-1 073
299L-44 INT./UPPER SHL CIRC WELD (4) B&W Generic -7 20.6 0.34 0.68 (3) 81(OUTSIDE 39%) WF-25
61782 NOZZLE BELT/INT. SHELL CIRC (4) B&W Generic -5 19.7 0.23 0.52 0.011 807 WELD SA-1135 ( & r1 0 . 1
71249 INT./UPPER SHL CIRC WELD (INSIDE 76.4 ASME NB-2331 10 0 0.23 0.59 0.021 67LINDE 80 WELD 761%) SA-1229
72445 UPPER/LOWER SHELL CIRO WELD (4) B&W Generic -5 19.7 0.22 0.54 0.016 65SA-1 585 __ ____ ___
8T1762 LOWER SHELL AXIAL WELDS SA- 75.5 B&W Generic -5 19.7 0.19 0.57 0.017 701430
8T1762 UPPER SHELL AXIAL WELDS SA-1493 (4) B&W Generic -5 19.7 0.19 0.57 0.017 70
8T1762 LOWER SHELL AXIAL WELDS SA- 75.5 B&W Generic -5 19.7 0.19 0.57 0.017 701426
C-1

I ITD()[F
C-1 279 D-3803-1 74.7 ASME NB-2331 -5 0 0.24 0.511 0.00O 102
C-1 308A ID-3804-1 (4) ]ASME NB-2331 1 01 0 1 0.19[ 0.481 0.016 72C-1 308B D-3804-2 (4) MTEB 5-2 -30 0 0.19 0.51 0.01E 76
LINDE 0124 WELD 27204 CIRC. WELD 9-112 76.9 Generic -56 17 0.203 1.018 0.013 98348009 LOWER SHELL AXIAL WELD 3-112A/C 76.1 Generic -56 17 0.192 0.98 (3) 111W5214 LOWER SHELL AXIAL WELDS 3- 72.9 Generic -56 17 0.213 1.01 0.019 118
LINDE 1092 WELD AXA112AWC{
W5214 INTERMEDIATE SHELL AXIAL WELDS 72.9 Generic -56 17 0.213 1.01 0.019 1182)-112 A/CI
Notes:
(1) Information taken directly from the July 2000 release of the U.S. Nuclear Regulatory Commission's (NRC) Reactor VesselIntegrity (RVID2) database.
(2) These composition values are as reported in RVID2. In FAVOR calculations, these values should be treated as the centraltendency of the copper, nickel, and phosphorus distributions detailed in Appendix D.
(3) No values of phosphorus are recorded in RVID2 for these heats. A generic value of 0.012 should be used, which is the mean of826 phosphorus values taken from the surveillance database used by Eason, et al. to calibrate the embrittlement trend curve.
(4) No values strength measurements are available in PREP4 for these heats (see PREP). A value of 77 ksi should be used, whichis the mean of other flow strength values reported in this appendix.
References:
RVID2PREP
U.S. Nuclear Regulatory Commission Reactor Vessel Integrity Database, Version 2.1.1, July 6, 2000.
PREP4: Power Reactor Embrittlement Program, Version 1.0," EPRI, Palo Alto, CA: 1996. SW-106276.
C-2

APPENDIX DCHEMICAL COMPOSITION UNCERTAINTY DISTRIBUTIONS
While there is considerable information available concerning the composition of the steels usedin U.S. nuclear reactor pressure vessel (RPV) construction (see RVID; RPVDATA), the heats forwhich sufficient information exists and which can be used to estimate the statistical distributionof the chemical composition are considerably more limited. However, such information isrequired as input to the probabilistic fracture mechanics (PFM) code FAVOR in order to assessthe effects of material variability on the probability of vessel failure. This appendix reviewsavailable data sets in which multiple composition measurements have been made on the sameheat of steel. These data are then used to derive generic distributions for copper, nickel, andphosphorus. FAVOR assumes these distributions will apply to all RPV steels.
An RPV is divided into different regions, each corresponding to a unique heat of steel, be it of aweld, a plate, or a forging. Figure D-1 illustrates these various regions. In the FAVOR analysis,each region is further divided into subregions of approximately constant fluence (based on thefluence maps provided by Brookhaven National Laboratory), with each subregion having anapproximately constant value of fluence within it. The average amounts of copper, nickel, andphosphorus for each of these regions is based on the information in the RVID database, and issummarized in Appendix C. This appendix employs available data to estimate the distribution ofchemical composition about these best-estimate values.
To appropriately model the uncertainty in chemical composition, composition variability isdefined at two different levels:
(1) The possible composition variability within a region is defined based on multiplemeasurements taken from various locations within a heat of steel (see Section D.1).
(2) Regarding variability within a subregion, in any given RPV, FAVOR simulates theexistence of thousands of flaws. It is therefore possible that two (or more) of these flawswill be simulated to exist within the same subregion. The greatest physical separationthat these multiple flaws could have from each other is on the order of 3 in., because (1)once a flaw is placed within a subregion, its location is specified only by its locationthrough the wall thickness, (2) flaws are simulated to exist only in the inner 3/8-T of thevessel wall, and (3) pressurized-water reactor (PWR) vessel walls tend to be about 8 in.thick. Thus, for subregions, the possible composition variability is defined based onmultiple measurements made close together, as detailed in Section D.2.
D.1 Variability Within a Region
D.1.1 Welds
D. 1.1.1 Copper and Nickel
The raw data used to quantify the variability of copper and nickel within a particular weld regionwas obtained from reports published by the Combustion Engineering Owners Group (CEOG)
D-1

and the Babcock & Wilcox Nuclear Owners Group (B&WOG) that organize individualmeasurements of chemical composition in terms of the hierarchy illustrated in Figure D-2 (seeCEOG). Within each heat of material, data may be available for several different weld-pieces.A weld-piece is a separately identifiable weld, such as a nozzle dropout, a surveillance weld,and a weld-qualification block. For each weld-piece, some number of independentmeasurements of chemical composition is made. This appendix reports mean and standarddeviation values at the heat level. These parameters are defined according to the following foursteps:
(1) Identify all of the independent measurements and weld-pieces associated with aparticular weld-wire heat.
(2) Determine the mean copper, nickel, and phosphorus value for each weld-piece as theaverage of all of the independent measurements for that weld-piece.
(3) Determine the mean copper, nickel, and phosphorus value for the heat as the average ofall of the weld-piece means (calculated in step 2).
(4) Determine the standard deviation of copper, nickel, and phosphorus values for the heatas the standard deviation of all of the weld-piece means (calculated in step 2).
Regions
AxialWeld
*" Plate
CircumferentialWeld
Sub-Regions
Figure D-1 Designation of material regions and subregionsin an unwrapped view of an RPV
This procedure weights the data from each weld-piece equally regardless of the number ofindependent measurements made on that weld-piece. Table D-1 and Table D-2 provide thedata for copper and nickel, respectively. Statistical representations of these data are providedin Figure D-3 and Figure D-4. These fits are as follows:
For copper, the best estimate on the standard deviation (cicu) is 0.167 of the meancopper value taken from Appendix C (i.e., o-a,, =0.167.•c,, ). The distribution of acu about
D-2

this best estimate is a normal distribution. Values of the standard deviation on ac, areas follows:
°',• =M/N 0.167}
A~=IHN { JPcuO.O185}L "3.09023 'u '0 18
This distribution is illustrated in Figure D-3. In FAVOR the standard deviation on copperfor a particular heat should be simulated by drawing randomly from the distributionillustrated in Figure D-3. The standard deviation depends on the heat mean coppervalue, as illustrated in the figure.
For nickel, the best estimate on the standard deviation (CYN) is 0.029, and is independentof the mean nickel value taken from Appendix C. The distribution of O'Ni about this bestestimate is a normal distribution. The standard deviation on GNI is 0.0165. Figure D-7illustrates this distribution, truncated at the 5th and 95th percent quantiles§§§. In FAVOR,the standard deviation on nickel for a particular heat should be simulated by drawingrandomly from the distribution illustrated in Figure D-3. This standard deviation isindependent of the heat mean nickel value, as illustrated in the figure.
It may also be pointed out that the uncertainties on Cu and Ni represented in Figure D-3 andFigure D-4 (respectively) agree with the summary information on chemical compositionuncertainty reported in a comprehensive survey of chemical variability in A533B plate publishedin the mid 1970s [Kawasaki 74, Kunitake 75].
a Heat
contains...
~Jce ~ e J ,,",iece 3 Piece_7 .... Pe
I which, inturn,may include.-00-00000 ......... 0
many individual measurementsof chemical composition.
Figure D-2 Hierarchy for composition measurements
§ Here 5/95 percent truncation limits are selected rather than the 1/99 percent values used in theremainder of the document to avoid simulation of negative values of standard deviation.
D-3
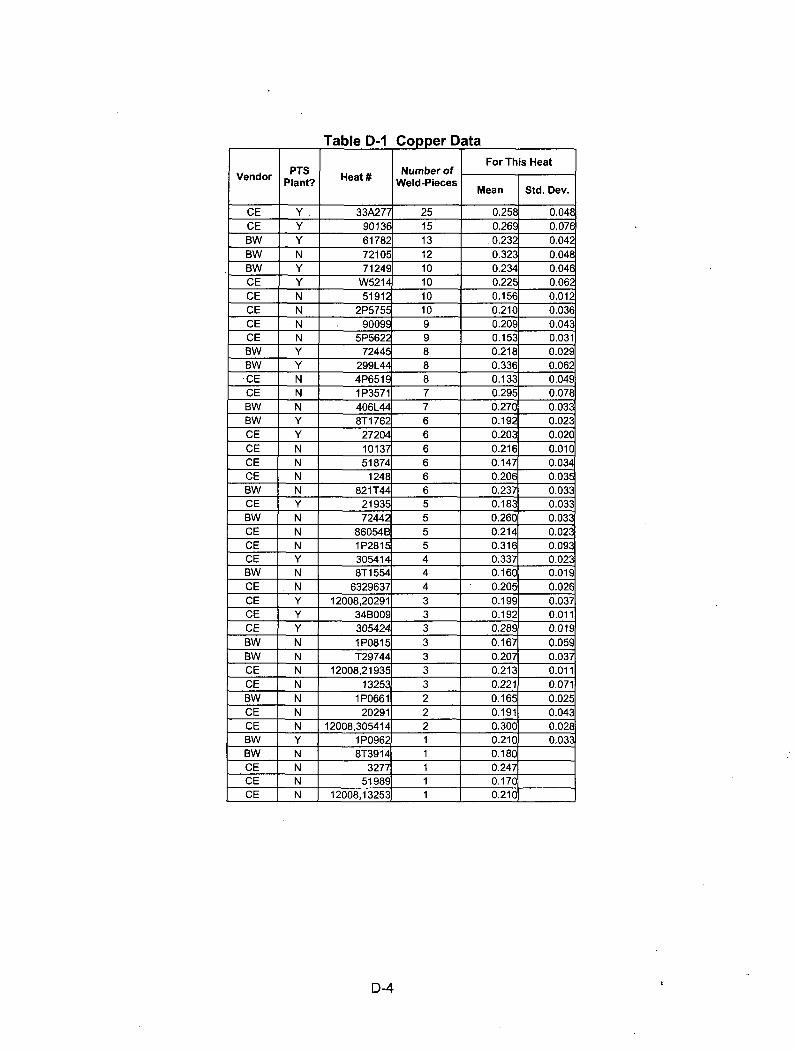
Table D-1 Copper DataFor This Heat
PTS Number ofPlant? Weld-Pieces Mean Std. Dev.
CE Y . 33A277 25 0.258 0.048CE Y 90136 15 0.269 0.076BW Y 61782 13 .0.232 0.042BW N 72105 12 0.323 0.048BW Y 71249 10 0.234 0.046CE Y W5214 10 0.225 0.062CE N 51912 10 0.156 0.01CE N 2P5755 10 0.210 0.036CE N 90099 9 0.209 0.043CE N 5P5622 9 0.153 0.031BW Y 72445 8 0.218 0.0229BW Y 299L44 8 0.336 0.062
.CE N 4P6519 8 0.133 0.049CE N 1 P3571 7 0.295 0.07BW N 406L44 7 0.270 0.03,ABW Y 8T1762 6 0.192 0.023CE Y 27204 6 0.203 0.020CE N 10137 6 0.216 0.010CE N 51874 6 0.147 0.034CE N 1248 6 0.206 0.03,BW N 821 T44 6 0.237 0.033CE Y 21935 5 0.183 0.033BW N 72442 5 0.260 0.033CE N 86054B 5 0.214 0.023CE N 1 P2815 5 0.316 0.093CE Y 305414 4 0.337 0.029BW N 8T1554 4 0.160 0.019CE N 6329637 4 0.205 0.026CE Y 12008,20291 3 0.199 0.037CE Y 34B009 3 0.192 0.011CE Y 305424 3 0.289 0.01BW N 1P0815 3 0.167 0.059BW N T29744 3 0.207 0.03CE N 12008,21935 3 0.213 0.011CE N 13253 3 0.221 0.071BW N 1P0661 2 0.165 0.025CE N 20291 2 0.191 0.043CE N 12008,305414 2 0.300 0.028BW Y 1P0962 1 0.210 0.03BW N 8T3914 1 0.180CE N 3277 1 0.247CE N 51989 1 0.170CE N 12008,13253 1 0.210
D-4
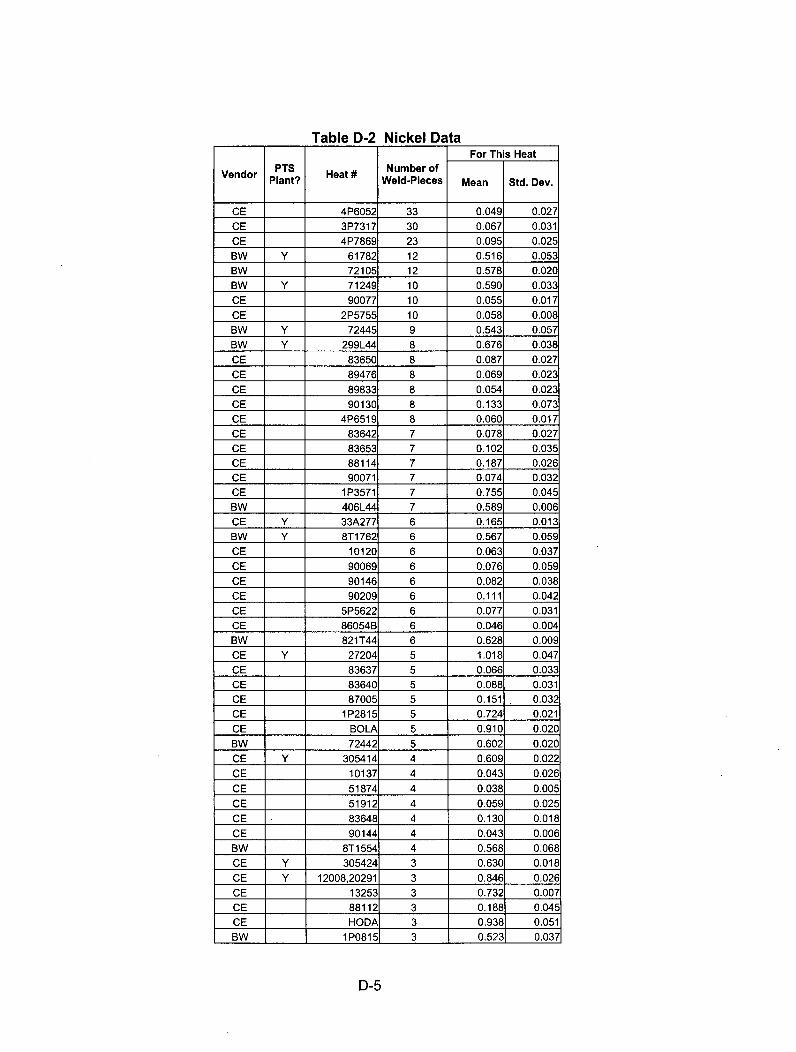
Table D-2 Nickel DataFor This Heat
Vendor PTS Heat X Number ofPlant? Weld-Pieces Mean Std. Dev.
CE 4P6052 33 0.049 0.027
CE 3P7317 30 0.067 0.031CE 4P7869 23 0.095 0.025BW Y 61782 12 0.516 0.053BW 72105 12 0.578 0.020
BW Y 71249 10 0.590 0.033CE 90077 10 0.055 0.017
CE 2P5755 10 0.058 0.008
BW Y 72445 9 0.543 0.057BW Y 299L44 8 0.676 0.038CE 83650 8 0.087 0.027CE 89476 8 0.069 0.023
CE 89833 8 0.054 0.023CE 90130 8 0.133 0.073CE 4P6519 8 0.060 0.017CE 83642 7 0.078 0.027CE 83653 7 0.102 0.035CE 88114 7 0.187 0.026CE 90071 7 0.074 0.032
CE 1P3571 7 0.755 0.045BW 406L44 7 0.589 0.006CE Y 33A277 6 0.165 0.013BW Y 8T1762 6 0.567 0.059
CE 10120 6 0.063 0.037CE 90069 6 0.076 0.059CE 90146 6 0.082 0.038
CE 90209 6 0.111 0.042CE 5P5622 6 0.077 0.031CE 86054B 6 0.046 0.004BW 821T44 6 0.628 0.009
CE Y 27204 5 1.018 0.047CE 83637 5 0.066 0.033CE 83640 5 0.088 0.031CE 87005 5 0.151 0.032CE 1 P2815 5 0.724 0.021
CE BOLA 5 0.910 0.020BW 72442 5 0.602 0.020
CE Y 305414 4 0.609 0.022
CE 10137 4 0.043 0.026CE 51874 4 0.038 0.005CE 51912 4 0.059 0.025
CE 83648 4 0.130 0.018
CE 90144 4 0.043 0.006BW 8T1554 4 0.568 0.068
CE Y 305424 3 0.630 0.018CE Y 12008,20291 3 0.846 0.026CE 13253 3 0.732 0.007CE 88112 3 0.188 0.045CE HODA 3 0.938 0.051BW 1 P0815 3 0.523 0.037
D-5

For This Heat
Vendor PTS Heat # Number ofPlant? Weld-Pieces Mean Std. Dev.
BW T29744 3 0.653 0.017
CE Y 21935 2 0.704 0.034
CE Y 90136 2 0.070 0.000
CE 12420 2 1.023 0.033
CE 12008,305414 2 0.765 0.035
CE 12008/27204 2 0.980 0.000
BW 1P0661 2 0.640 0.010
BW 8T3914 2 0.625 0.035
BW Y 1 P0962 1 0.640
CE 9565 1 0.080
CE 20291 1 0.737
CE 51989 1 0.165
CE 12008,13253 1 0.083
CE 12008,21935 1 0.867
CE 12008/305424 1 0.810
CE 1 P2809 1 0.770
CE 39B196 1 1.200
CE-Ni+ 1248 4 1.073 0.142
CE-Ni+ 1248/661h577 2 1.105 0.021
CE-Ni+ Y 34B009 3 0.888 0.299
CE-Ni+ Y W5214 12 1.025 0.137
0.12
0
C ,U 0.090• 4)
0.06
0.06
.0-
0.00
0.0 0.1 0.2 0.3 0.4
Heat Mean Copper
Figure D-3 Copper variability within a region for welds
D-6
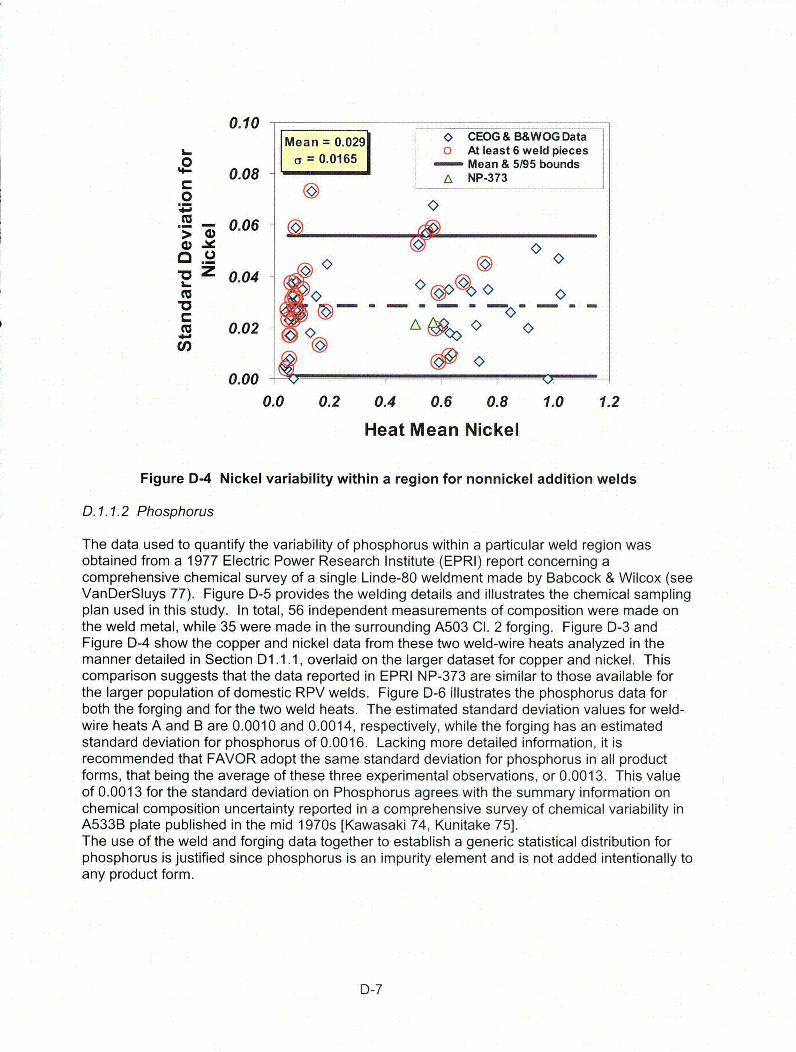
0.10Mean = 0.029 0 CEOG& B&WOG Data
0I 0 At least 6 weld pieces0,,- Mean & 5f95 bounds
S 0.08 NP-373
0.06 ___
K> K
M 0.04 4)0.02 A 0
ci, ©0.00 - 9 I V
0.0 0.2 0.4 0.6 0.8 1.0 1.2
Heat Mean Nickel
Figure D-4 Nickel variability within a region for nonnickel addition welds
D. 1.1.2 Phosphorus
The data used to quantify the variability of phosphorus within a particular weld region wasobtained from a 1977 Electric Power Research Institute (EPRI) report concerning acomprehensive chemical survey of a single Linde-80 weldment made by Babcock & Wilcox (seeVanDerSluys 77). Figure D-5 provides the welding details and illustrates the chemical samplingplan used in this study. In total, 56 independent measurements of composition were made onthe weld metal, while 35 were made in the surrounding A503 Cl. 2 forging. Figure D-3 andFigure D-4 show the copper and nickel data from these two weld-wire heats analyzed in themanner detailed in Section D1.1.1, overlaid on the larger dataset for copper and nickel. Thiscomparison suggests that the data reported in EPRI NP-373 are similar to those available forthe larger population of domestic RPV welds. Figure D-6 illustrates the phosphorus data forboth the forging and for the two weld heats. The estimated standard deviation values for weld-wire heats A and B are 0.0010 and 0.0014, respectively, while the forging has an estimatedstandard deviation for phosphorus of 0.0016. Lacking more detailed information, it isrecommended that FAVOR adopt the same standard deviation for phosphorus in all productforms, that being the average of these three experimental observations, or 0.0013. This valueof 0.0013 for the standard deviation on Phosphorus agrees with the summary information onchemical composition uncertainty reported in a comprehensive survey of chemical variability inA533B plate published in the mid 1970s [Kawasaki 74, Kunitake 75].The use of the weld and forging data together to establish a generic statistical distribution forphosphorus is justified since phosphorus is an impurity element and is not added intentionally toany product form.
D-7
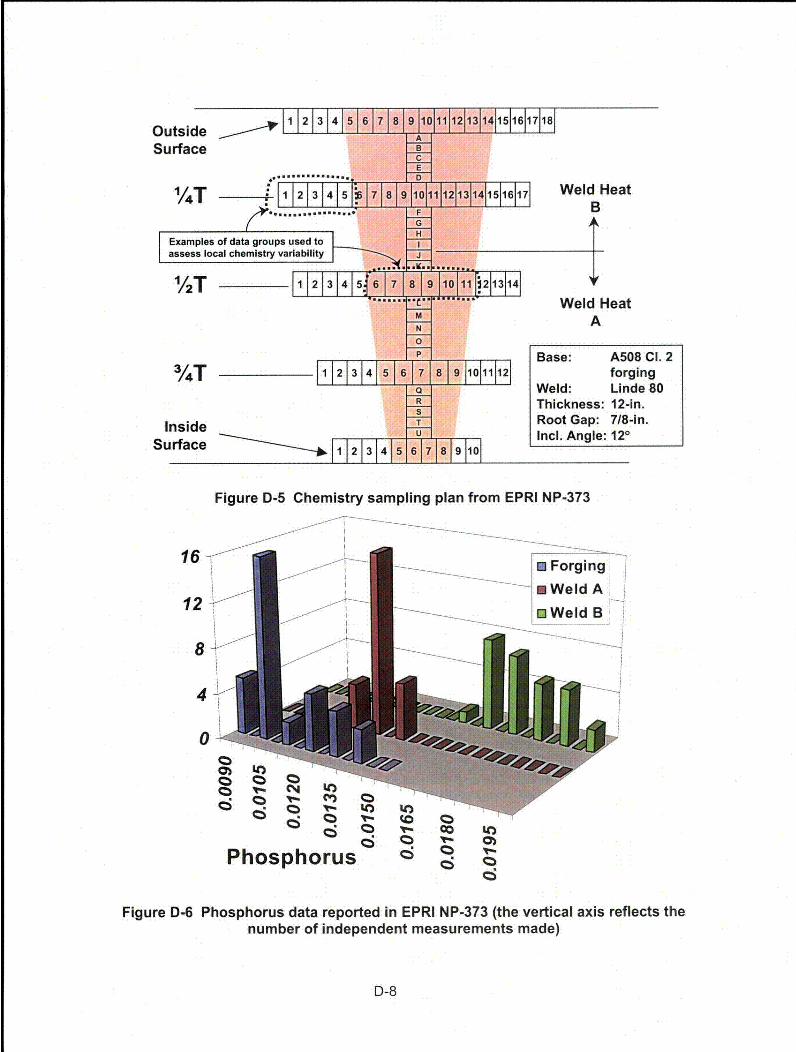
COutside F5 F67i
Surface
.......1/4T --- 1 M2 1 ") 71
Examples of data groups used to
assess local chemistry variability
%hT
InsideSurface P 1723 41
Weld HeatIBWeld Heat
A
Base: A508 CI. 2forging
Weld: Linde 80Thickness: 12-in.Root Gap: 7/8-in.Incl. Angle: 120
Figure D-5 Chemistry sampling plan from EPRI NP-373
16-
12
8
4
0
PhosphorusIC
'0 -~
'-S C~ I~
~ ~a- a,c; ~
0
Figure D-6 Phosphorus data reported in EPRI NP-373 (the vertical axis reflects thenumber of independent measurements made)
D-8
D.1.2 Plates and Forgings
The data reported in EPRI NP-373 is the most detailed chemical survey of a domesticproduction RPV weldment that the U.S. Nuclear Regulatory Commission staff has been able tolocate. For this reason, the distributions of nickel and copper determined from the 35composition measurements made in the forging are used to assess the statistical distributionsthat should be assumed for copper, nickel, and phosphorus for both plates and forgings. FigureD-7 and Figure D-8 summarize the copper and nickel data, respectively (the phosphorus datawere presented previously in Figure D-6). Based on these data, the following distributions arerecommended for use in FAVOR to represent the chemical composition variability in all plateand forging regions:
* for copper, normal with a standard deviation of 0.0073* for nickel, normal with a standard deviation of 0.0244* for phosphorus, normal with a standard deviation of 0.0013 (see Section D.1.1.2)
D.2 Variability within a Subregion
To quantify the variability in copper, nickel, and phosphorus that could be expected to occurshould FAVOR simulate more than one flaw to exist within the same subregion, data sets wereassembled from the literature in which multiple measurements of chemistry were made closetogether (i.e., within the area covered by a few square inches). The following data sources wereidentified:
CE-NPSD-944--Five measurements of weld chemistry (copper and nickel) were madeat the 1/4-T location on eight different samples of weld, these samples having beenremoved from a total of seven weld wire heats.
EPRI NP-371-As illustrated in Figure D-5, many groupings of chemistry measurementstaken from this comprehensive study of chemistry can be used to assess the localvariability of plate and weld chemistry.
In order to use all of these data together, the mean values of copper, nickel, and phosphoruswere first calculated for each local grouping. The deviation of each weld measurement from thislocal mean was then calculated, and a normal distribution fit to the deviation values to quantifythe local variability in chemistry. Table D-3 summarizes these standard deviations, while FigureD-9 provides histograms of the underlying data. Should FAVOR simulate multiple flaws to existwithin the same subregion, normal distributions having the standard deviations from Table D-3should be sampled, and this sampled value added to the previously simulated mean values ofchemistry for that subregion.
D.3 References
CEOG Combustion Engineering Owners Group, "Fracture ToughnessCharacterization of C-E RPV Materials," Draft Report, Rev. 0, CENSPD-1118, 1998.
Kawasaki 74 Kawasaki, M. and Fujimura, T., "The Present State of ManufacturingLight Water Reactor Pressure Vessels in Japan (Part 1. HeavySection RPV Steels)," Japan Atomic Energy Research Institute ReportJAERI-M-5809, July 1974.
D-9

Kunitake 75
RPVDATA
RVID2
VanDerSluys 77
Kunitake, H., et al., "Manufacture and Properties of Heavy SectionSteel Plates for Nuclear Reactor Pressure Vessels," Nippon SteelCorporation, Nippon Steel Technical Report Overseas No. 7,November 1975.Griesbach, T.J., and J.F. Williams, "User's Guide to RPVDATA,Reactor Vessel Materials Database," Westinghouse Energy SystemsBusiness Unit, WCAP-14616, 1996.U.S. Nuclear Regulatory Commission Reactor Vessel IntegrityDatabase, Version 2.1.1, July 6, 2000.VanDerSluys, W.A., Seeley, R.R., and Schwabe, J.E., "AnInvestigation of Mechanical Properties and Chemistry within a ThickMnMoNi Submerged Arc Weldment," Electric Power ResearchInstitute Report, EPRI NP-373, February 1977.
D-10

16
12 -
U
"• 8C,4)L.
LLHj I4Lo (N (N
Copper
Figure D-7 Copper data reported in EPRI NP-373 for an A508 Cl. 2 forging (the verticalaxis reflects the number of independent measurements made)
16
12
g 8a,4)U-L L 4
fLO to LO LO tLO L LOl WIQ ) LO ) LO Lwit o I0N. CO ~0) Q V- (N C~V) V It)Ito t LO I t o It )I (0 to to (0 (0 (0
Nickel
Figure D-8 Nickel data reported in EPRI NP-373 for an A508 CI. 2 forging (the vertical axisreflects the number of independent measurements made)
D-11

Table D-3 Standard Deviations to Quantify Local Variabilityo WFor Plates andFor Welds FrigForgings
Copper 0.0131 0.0035Nickel 0.0119 0.0124
Phosphorus 0.0008 0.0005
30 .
25 Copper - Plate and Forging
30 tco
25 Cpe
20
15 -
10
5-
0
20 -ý
-Welds
_ 1.In ,I.1.
15 t10 +
5-
0
OA + ,% 0 0@ A
30
25
20
15
10
5
0
Nickel - Plates and Forgings
'. I, I_
P.• . P. P" 11b , . . .
3 0 . . . . . . . . . . . . .
25 -Nickel - Welds
20-
10-
5 1 l
30
25 Phosphorus - Plates and Forgings
20
15
10 .5 I0 ._uE
30
25
20-
15
Phosphorus - Welds
5010
0 Al
•, , o o'o*o•& 0
Figure D-9 Local chemistry variability histogram
D-12
APPENDIX EDATA SOURCES FOR UPPER-SHELF TOUGHNESSCHARACTERIZATION (FROM ERICKSONKIRK 04b)
70. Hiser, A.L., et al., "J-R Curve Characterization of Irradiated Low Upper Shelf Welds,"USNRC, NUREG/CR-3506, 1984.
71. McCabe, D.E., "Evaluation of WF-70 Weld Metal from the Midland-1 Reactor Vessel,"USNRC, NUREG/CR-5736, 2000.
72. McGowan, J.J., et al., "Characterization of Irradiated Current Practice Welds and A533Grade B Class 1 Plate for Nuclear Pressure Vessel Service," USNRC, NUREG/CR-4880,1988.
73. Hawthorne, J.R., et al., "Investigations of Irradiation-Anneal-Reirradiation (IAR)Properties Trends of RPV Welds: Phase 2 Final Report," US-NRC, NUREG-CR/5492,1990.
74. Bryan, R.H., et al., "Pressrized Thermal Shock Test of 6-in. Thick Pressure Vessels.PTSE-2: Investigation of Low Tearing Resistance and Warm Prestressing," USNRC,NUREG/CR-4888, 1987
75. Onizawa, K. and Suzuki, M., "Comparison of Transition Temperature Shifts BetweenStatic Fracture Toughness and Charpy-v Impact Properties Due to Irradiation and Post-Irradiation Annealing for Japanese A533B-1 Steels," Effects of Radiation on Materials:2 0 th International Symposium, ASTM STP 1405, S. T. Rosinski, M. L. Grossbeck, T. R.Allen, and A. S. Kumar, Eds., American Society for Testing and Materials, WestConshohocken, PA, 2002.
76. Gudas, John P., "Micromechanics of Fracture and Crack Arrest in Two High StrengthSteels," DTNSRDC/SME-87-20, 1987.
77. Czyryca, E.J., et al., "Fracture Toughness of HSLA-100, HSLA-80, and ASTM A710Steel Plate," DTRC-SME-88/64, 1990.
78. Kirk, M.T., "Applicability of ASTM A710 Grade A Class 3 (HSLA-80) Steel for use asCrack Arrestors," DTNSRDC/SME-87-54, 1987.
79. Natishan, MarjorieAnn Erickson, "Mechanisms of Strength and Toughness in aMicroalloyed, Percipitation Hardened Steel," DTRC/SME-88-81, 1988.
80. M. A. Sokolov, R. K. Nanstad, I. Remec, C. A. Baldwin, and R. L. Swain, "FractureToughness of an Irradiated, Highly Embrittled Reactor Pressure Vessel Weld,"ORNL/TM-2002/293.
E-1

NRC FORM 335 U.S. NUCLEAR REGULATORY COMMISSION 1. REPORT NUMBER(2-89) (Assigned by NRC, Add Vol., Supp.. Rev.,
NRCM 1102, BIBLIOGRAPHIC DATA SHEET and Addendum Numbers, if anv.13201,3202 (See instructions on the reverse)
NUREG- 1807
2. TITLE AND SUBTITLE
Probabilistic Fracture Mechanics-Models, Parameters, and Uncertainty Treatment Used in 3. DATE REPORT PUBLISHED
FAVOR Version 04.1 MONTH YEAR
June 20074. FIN OR GRANT NUMBER
5. AUTHOR(S) 6. TYPE OF REPORT
M. EricksonKirk, B.R. Bass, T. Dickson, C. Pugh, T. Santos, P. Williams Technical
7. PERIOD COVERED (Inclusive Dates)
6-99 to 6-068. PERFORMING ORGANIZATION - NAME AND ADDRESS (If NRC, provide Division, Office or Region, U.S. Nuclear Regulatory Commission, and mailing address; if contractor,
provide name and mailing address.)
Division of Fuel, Engineering, and Radiological ResearchOffice of Nuclear Regulatory ResearchU. S. Nuclear Regulatory CommissionWashington, DC 2055-0001
9. SPONSORING ORGANIZATION - NAME AND ADDRESS (If NRC, type "Same as above"; if contractor, provide NRC Division, Office or Region, U.S. Nuclear Regulatory, Commission,and mailing address.)
Division of Fuel, Engineering, and Radiological ResearchOffice of Nuclear Regulatory ResearchU. S. Nuclear Regulatory CommissionWashington, DC 2055-0001
10. SUPPLEMENTARY NOTES
1 1. ABSTRACT (200 words or less)
During plant operation, the walls of reactor pressure vessels (RPVs) are exposed to neutron radiation, resulting in localizedembrittlement of the vessel steel and weld materials in the core area. If an embrittled RPV had an existing flaw of critical size andcertain severe system transients were to occur, the flaw could very rapidly propagate through the vessel, resulting in a through-wallcrack and challenging the integrity of the RPV. The severe transients of concern, known as pressurized thermal shock (PTS), arecharacterized by a rapid cooling (i.e., thermal shock) of the internal RPV surface in combination with repressurization of the RPV.Advancements in our understanding and knowledge of materials behavior, our ability to realistically model plant systems andoperational characteristics, and our ability to better evaluate PTS transients to estimate loads on vessel walls led the U.S. NuclearRegulatory Commission (NRC) to realize that the earlier analysis, conducted in the course of developing the PTS Rule in the 1980s,contained significant conservatisms.
This report, which describes the technical basis for the probabilistic fracture mechanics model, is one of a series of 21 otherdocuments detailing the results of the NRC study.
12. KEY WORDS/DESCRIPTORS (List words or phrases that will assist researchers in locating the report.) 13. AVAILABILITY STATEMENT
unlimitedpressurized thermal shock, probabilistic fracture mechanics, reactor pressure vessels; 14. SECURITY CLASSIFICATION
(This Page)
pressurized water reactor unclassified(This Report)
unclassified
15. NUMBER OF PAGES
16. PRICE
NRC FORM 335 (2-89)

Federal Recycling Program


NUREG-1807 PROBABILISTIC FRACTURE MECHANICS - MODELS, PARAMETERS, ANDUNCERTAINTY TREATMENT USED IN FAVOR VERSION 04.1
JUNE 2007
UNITED STATESNUCLEAR REGULATORY COMMISSION
WASHINGTON, DC 20555-0001
OFFICIAL BUSINESS