Mixergy/004/VR/NPL - European Commission · [email protected] 1.5 Verification Process...
21
Mixergy/004/VR/NPL VERIFICATION REPORT Mixergy/004/VR/NPL Mixergy Tank Prepared By: National Physical Laboratory Prepared for proposer: Mixergy Limited Status: Final Date: 8 December 2016
Transcript of Mixergy/004/VR/NPL - European Commission · [email protected] 1.5 Verification Process...
Mixergy/004/VR/NPL
VERIFICATION REPORT Mixergy/004/VR/NPL
Mixergy Tank
Prepared By: National Physical Laboratory Prepared for proposer: Mixergy Limited Status: Final Date: 8 December 2016
Mixergy/004/VR/NPL
Date signed: 8 December 2016
London, United Kingdom
Mixergy/004/VR/NPL
TABLE OF CONTENTS 1 INTRODUCTION ............................................................................................................................. 2
1.1 Name of technology ............................................................................................................ 2
1.2 Name and contact of proposer .......................................................................................... 2
1.3 Name of Verification Body and responsible of verification ........................................ 2
1.4 Organisation of verification including experts, and verification process ............... 2
1.5 Verification Process ............................................................................................................ 3
1.6 Deviations from the verification protocol ...................................................................... 3
2 DESCRIPTION OF THE TECHNOLOGY ......................................................................................... 4
2.1 Summary of description of the technology .................................................................... 4
2.2 Intended application (matrix, purpose, technologies and technical conditions) .. 5
2.2.1 Matrix ................................................................................................................................ 5
2.2.2 Purpose ............................................................................................................................. 6
2.3 Associated environmental emissions and/or impacts ................................................ 6
2.4 Verification parameters definition .................................................................................. 6
2.4.1 Performance parameters .............................................................................................. 6
2.4.2 Operational parameters ................................................................................................ 7
2.4.3 Environmental parameters ........................................................................................... 7
3 EXISTING DATA ............................................................................................................................. 7
3.1 Accepted existing data ....................................................................................................... 7
4 EVALUATION ................................................................................................................................. 8
4.1 Calculation of performance parameters ........................................................................ 8
4.1.1 Increase in useable hot water yield for Mixergy tank c.f. standard tank when
both heated to the same initial temperature ........................................................................ 8
4.1.2 Volume of useable hot water delivered from 75 litre Mixergy tank ..................... 8
4.2 Evaluation of test quality ................................................................................................... 8
4.2.1 Control data ...................................................................................................................... 8
4.2.2 Data Management ......................................................................................................... 14
4.2.3 Record Keeping ............................................................................................................. 14
4.2.4 Audits ............................................................................................................................... 14
4.2.5 Deviations ....................................................................................................................... 14
4.3 Verification results (verified performance claim) ..................................................... 14
4.3.1 Performance parameters ............................................................................................ 14
4.3.2 Operational parameters .............................................................................................. 16
4.3.3 Environmental parameters ......................................................................................... 16
4.4 Recommendations for the Statement of Verification ................................................ 17
Mixergy/004/VR/NPL
1
5 QUALITY ASSURANCE ................................................................................................................. 17
6 REFERENCES ............................................................................................................................... 18
List of Figures Figure 1: Variation of hot water demand, electricity consumption and timing of peak versus off peak
hours ....................................................................................................................................................... 4
Figure 2: Variation of UK electricity carbon intensity throughout the year and throughout particular
days in the year ....................................................................................................................................... 5
Figure 3: Image of the Mixergy tank ....................................................................................................... 5
Figure 4: (Left) Platinum reference thermometer and (right) calibration bath used to provide
reference temperature ........................................................................................................................... 9
Figure 5: Calibrated electronic scales purchased for the purposes of the test ...................................... 9
Figure 6: The changing weight of the scales over time during three independent draw tests
conducted at 15 l/min ........................................................................................................................... 10
Figure 7: Reference timing device used to deduce timing uncertainty ................................................ 11
Figure 8: Energy logger ......................................................................................................................... 11
Figure 9: Sensitivity of useable volume calculations as a function of measurement time step. .......... 13
Figure 10: Useable volume per litres installed final results .................................................................. 15
Figure 11: Ambient temperatures recorded during each test .............................................................. 16
Table 1: Overview of the verification process under the EU ETV Pilot Programme ............................... 3
Table 2: List of performance parameters and their values ..................................................................... 7
Table 3: List of operational parameters and their values ....................................................................... 7
Table 4: Sensitivity of results to numerical method (Mixergy tank) ..................................................... 12
Table 5: Useable volume results delivered for Mixergy tank ............................................................... 15
Table 6: Useable volume results delivered for standard tank .............................................................. 15
Table 7: Energy logged prior to test (kWh) results to within +/- 0.015 kWh ........................................ 16
Table 8: Peak temperature of base of cylinder (°C) prior to test (+/- 1 °C) .......................................... 16
Table 9: Breakdown of responsibility between the organisations involved with the verification ....... 17
Equation 1: Calculation of the useable volume of hot water delivered from the hot water tank ......... 8
Equation 2: Calculation of the normalised useable mass of hot water delivered from the hot water
tank normalised to the tank’s capacity ................................................................................................... 8
Equation 3: Development of worst case error bars for useable volume measurement ...................... 12
Equation 4: Heat losses associated with a hot water tank ................................................................... 13
Appendix 1: Quick scan …………………………………………………………………………………………………………………..19 Appendix 2: Proposal ……………………………………………………………………………………………………………………...30 Appendix 3: Specific verification protocol ……………………………………………………………………………………….40 Appendix 4: Test report …………………………………………………………………………………………………………………..60 Appendix 5: Audit report …………………………………………………………………………………………………………………83
Mixergy/004/VR/NPL
2
1 INTRODUCTION This report compiles the relevant documents included in the verification process for the Mixergy Tank,
which has been carried out under the framework of the European Union (EU) Environmental
Technology Verification (EU-ETV) pilot programme.
1.1 Name of technology
The Mixergy Tank is a hot water tank that makes use of a novel inlet diffuser and angled heating
element scheme to increase the utilisation of stored water within a domestic hot water tank, created
by Mixergy Limited.
1.2 Name and contact of proposer
Name: Peter Armstrong Address: Mixergy Limited
2 Canal View Wharf Farm Eynsham Road Cassington Oxfordshire OX29 4DB UK
Tel: +44 7830 840 311 Email: [email protected]
1.3 Name of Verification Body and responsible of verification
Name: National Physical Laboratory Address: Hampton Road
Teddington Middlesex TW11 0LW UK
Tel: +44 20 8943 6964 Verification Expert: Paul Miller Verification Expert: Emma Richardson Email: [email protected] Email: [email protected]
1.4 Organisation of verification including experts, and verification process
The verification was coordinated and managed by NPL, which has been accredited to the requirements
of ISO/IEC 17020:2012 for an inspection body type A. Tests were undertaken at Newark Copper
Cylinders Ltd by Peter Armstrong (Mixergy Ltd), Ren Kang (Mixergy Ltd) and Mark Smith (Newark
Copper Cylinders Ltd).
Internal and external technical experts were assigned to provide an independent review of the
planning, conducting and reporting of the verification process.

Mixergy/004/VR/NPL
3
Internal Technical Expert: Dave Lowe, Senior Research Scientist, Temperature & Humidity, NPL, e-mail: [email protected]
External Technical Expert: Marc Zanchetta, Consultant, GasDynamics Ltd, e-mail: [email protected]
1.5 Verification Process
Stage Responsibility Document
Preliminary phase Verification Body
Quick Scan
Contract/Proposal
Specific Verification Protocol
Testing phase Test Body Test Plan
Test Report
Verification phase Verification Body Verification Report
Statement of Verification
Table 1: Overview of the verification process under the EU ETV Pilot Programme
Quality assurance was undertaken by all technical experts involved in the verification process (see
section 5). The Statement of Verification will be issued by NPL following a two week review period of
the Verification Report. The Statement will be registered by the European Commission and published
on their website at the following link: http://iet.jrc.ec.europa.eu/etv/
1.6 Deviations from the verification protocol
Specific Verification Protocol (SVP) 3.2 (please see Appendix 3) states the header tank was
held at 20 °C ± 2 °C rather than 18.0 °C ± 0.5 °C (please see Appendix 4: Test Report 3.4 (point
2) and Table 3 below).
SVP 4.1 states the room temperature where the tests would be carried out would be 20 °C ±
2 °C. The actual temperature during testing was 19 °C ± 3 °C.
SVP 4.3 states the data management would meet the requirements of ISO17025. The audit
identified that “Evidence of testing of both the data acquisition software and the data analysis
software is required (Section 5.4.7 of EN ISO/IEC 17025:2005)”.
SVP 4.4.1 states that the top temperature for calibration of the sensors (type-T
thermocouples) would be 80 °C, but was 60 °C (Test Report A2.1.2).
Mixergy/004/VR/NPL
4
2 DESCRIPTION OF THE TECHNOLOGY
2.1 Summary of description of the technology
The Mixergy tank makes use of a novel inlet diffuser and angled heating element scheme to increase
the utilisation of stored water within a domestic hot water tank. The inlet arrangement reduces mixing
to increase the amount of hot water that can be recovered from a given pre-heated tank volume.
An indirect benefit, not verified by this work package, is that this performance enhancement enables
the tank to make better use of off-peak tariffs, for instance during the night for an Economy 7 tariff.
The objective of an electric hot water tank in many power systems is to heat up during times when
energy is cheap and is being produced at a low carbon intensity. For instance, in the UK, the average
carbon intensity of electricity production is in the range of 10 % to 28 % lower during off-peak hours.
Consequently, systems are configured to automatically turn on during off-peak periods to exploit low
carbon intensity and low electricity prices.
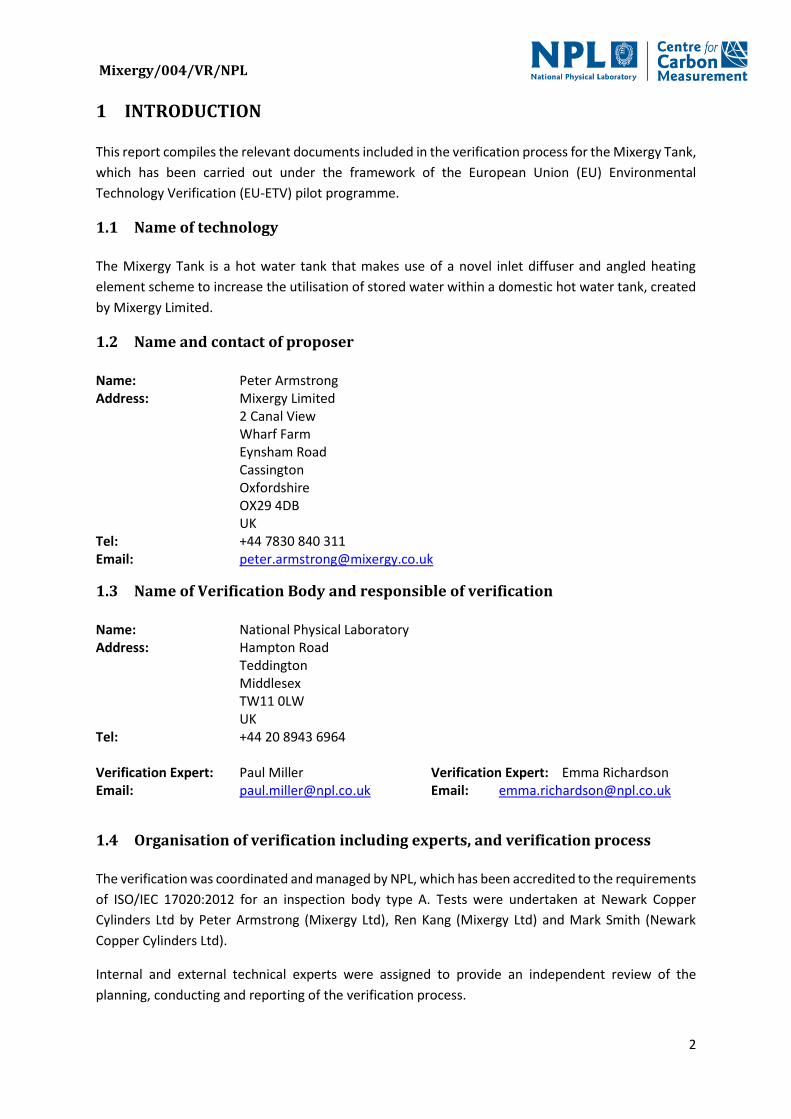
However, if the tank runs out of hot water during peak periods, electricity must be consumed when
the carbon intensity is high, leading to excessive carbon emissions. Figure 1 illustrates the typical
demand pattern for hot water throughout the day against UK electricity demand with annotations
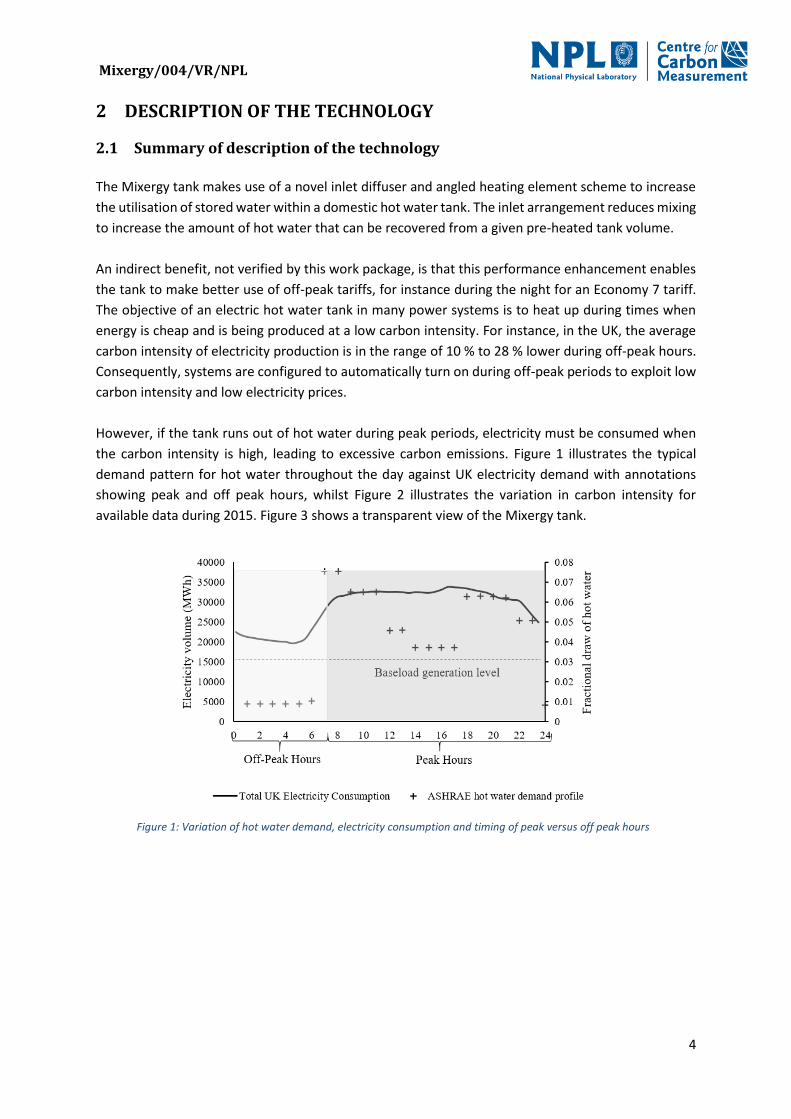
showing peak and off peak hours, whilst Figure 2 illustrates the variation in carbon intensity for
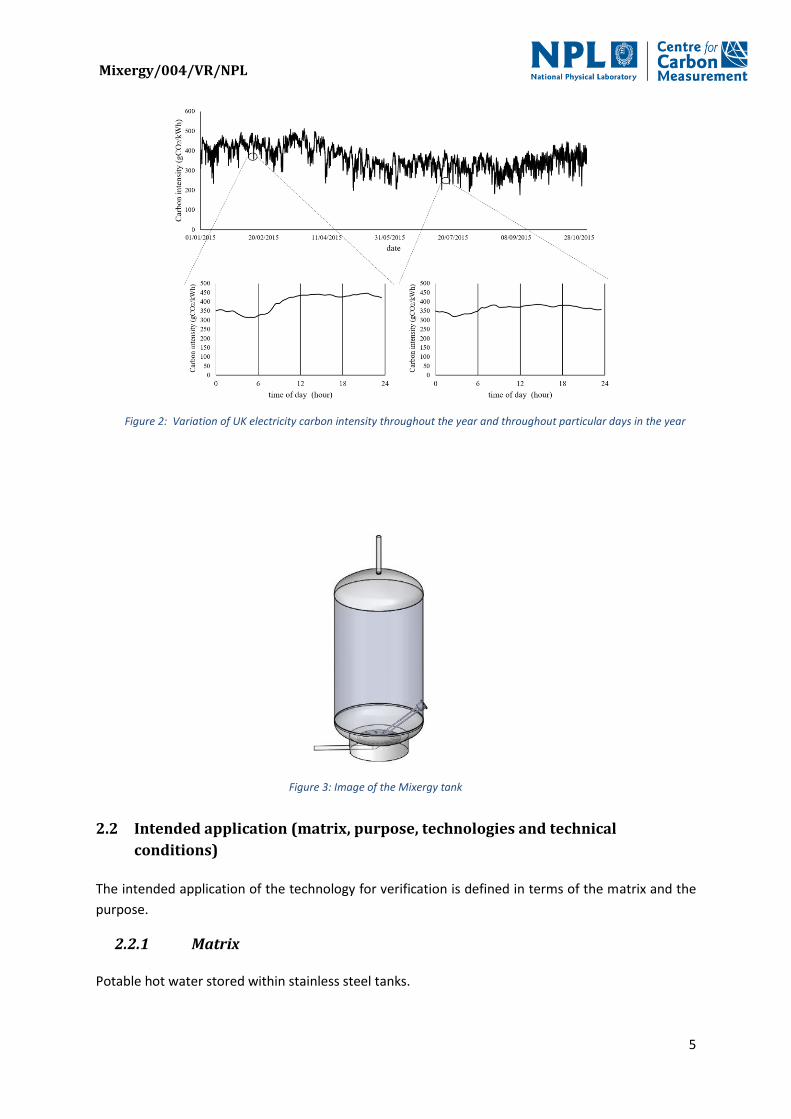
available data during 2015. Figure 3 shows a transparent view of the Mixergy tank.
Figure 1: Variation of hot water demand, electricity consumption and timing of peak versus off peak hours
Mixergy/004/VR/NPL
5
2.2 Intended application (matrix, purpose, technologies and technical
conditions)
The intended application of the technology for verification is defined in terms of the matrix and the
purpose.
2.2.1 Matrix
Potable hot water stored within stainless steel tanks.
Figure 2: Variation of UK electricity carbon intensity throughout the year and throughout particular days in the year
Figure 3: Image of the Mixergy tank
Mixergy/004/VR/NPL
6
2.2.2 Purpose
The purpose of the technology is to deliver more useful hot water per unit of pre-heated installed volume. The hot water from the tank is used for domestic applications such as bathing, showering and cleaning. To determine whether the technology has fulfilled this purpose, the volume of hot water delivered over a range of flow rates was measured and compared to a standard tank design with equivalent volume. Here, standard tank means one conforming to British Standard BS 699:1984. Prior to testing, both the Mixergy and standard tanks were heated to the same temperature set point associated with their respective thermostats.
2.3 Associated environmental emissions and/or impacts
Compared to a standard 75 litre hot water tank, the Mixergy system claims to deliver 15 % to 30 %
more useable hot water from the same installed volume, heated to an initial temperature of 60 °C, at
a minimum threshold delivery temperature of 43 °C. The improved performance enables several
potential benefits:
When using a standard 75 litre hot water tank, the Mixergy design is able to deliver more
useable hot water from a fully heated tank. This reduces the requirement for additional
heating of the water to maintain a useable temperature.
Alternatively, by delivering more hot water than a standard configuration, a smaller tank
volume can be specified for a given application leading to a reduction in standing heat losses.
In addition, off-peak energy can be used to deliver more hot water with a reduced risk that
energy will be required during peak times to boost the temperature. Within the UK, there are
several examples of this type of time-use tariff e.g. overnight, for instance schemes referred
to as Economy 7 or Economy 10.
2.4 Verification parameters definition
This section will examine the different verification parameters of the technology.
2.4.1 Performance parameters
The amount of hot water is defined by considering the water volume that could be delivered from the tank outlet at 43 °C when mixed with cold mains water at the same temperature as the tank’s inlet. This mixed temperature was chosen since it reflects the maximum setting associated with common thermostatic mixing valves [1] and is commonly accepted as a safe value for useable hot water for domestic purposes. The following performance claims were made in the SVP (Table 2 and Table 3):
A. An increase in useable hot water yield per unit installed tank volume up to 30 % across flow
rates of 2 to 15 l/min, from a 75 litre tank.
B. The 75 litre Mixergy test tank can deliver up to 120 litres of useable hot water compared to
90 litres of useable hot water from a standard 75 litre tank (equivalent to an increase of circa
33 %).
Mixergy/004/VR/NPL
7
The Mixergy tank is able to deliver more litres of useable hot water per unit installed volume compared
to a conventional tank, designed according to British Standards, where the useable temperature is
43 °C.
2.4.2 Operational parameters
Operational parameters relate to the technical conditions of the intended application (Table 3):
2.4.3 Environmental parameters
Other than the performance parameters, no additional environmental parameters will be measured.
3 EXISTING DATA
3.1 Accepted existing data
No existing data has been accepted for the verification of the Mixergy tank. However, note that
because of the iterative nature of the SVP, test measurements were carried out before the final agreed
version of the SVP and before the formal test plan was submitted to NPL.
1 The tank temperature is measured above the immersion heater, where convective mixing means the water is at uniform temperature, and a thermometer will read a temperature representative of the immersion heater thermostat setting [3].
PARAMETER CLAIMED VALUE
Increase in useable hot water yield for Mixergy
tank c.f. standard tank when both heated to
the same initial temperature
15 % > < 30 %
Volume of useable hot water delivered from
75 litre Mixergy tank
120 litres (at 15 l/min)
Table 2: List of performance parameters and their values
PARAMETER VALUE
Domestic water tank volume 75 litres
Cold water input 20 °C +/- 2 °C
Heated water (immersion heater) 60 °C +/- 0.5 °C
Threshold temperature range 43 °C
Flow rate range 2 to 15 l / min
Energy required to heat test tanks to 60 °C 1 3.4 kWh
Table 3: List of operational parameters and their values
Mixergy/004/VR/NPL
8
4 EVALUATION
4.1 Calculation of performance parameters
On completion of the test, the following calculation was performed:
𝑉�� = �� ∫ (1 +𝑇𝑜𝑢𝑡 − 𝑇𝑢
𝑇𝑢 − 𝑇𝑖𝑛)
𝑡𝑠
0
𝑑𝑡
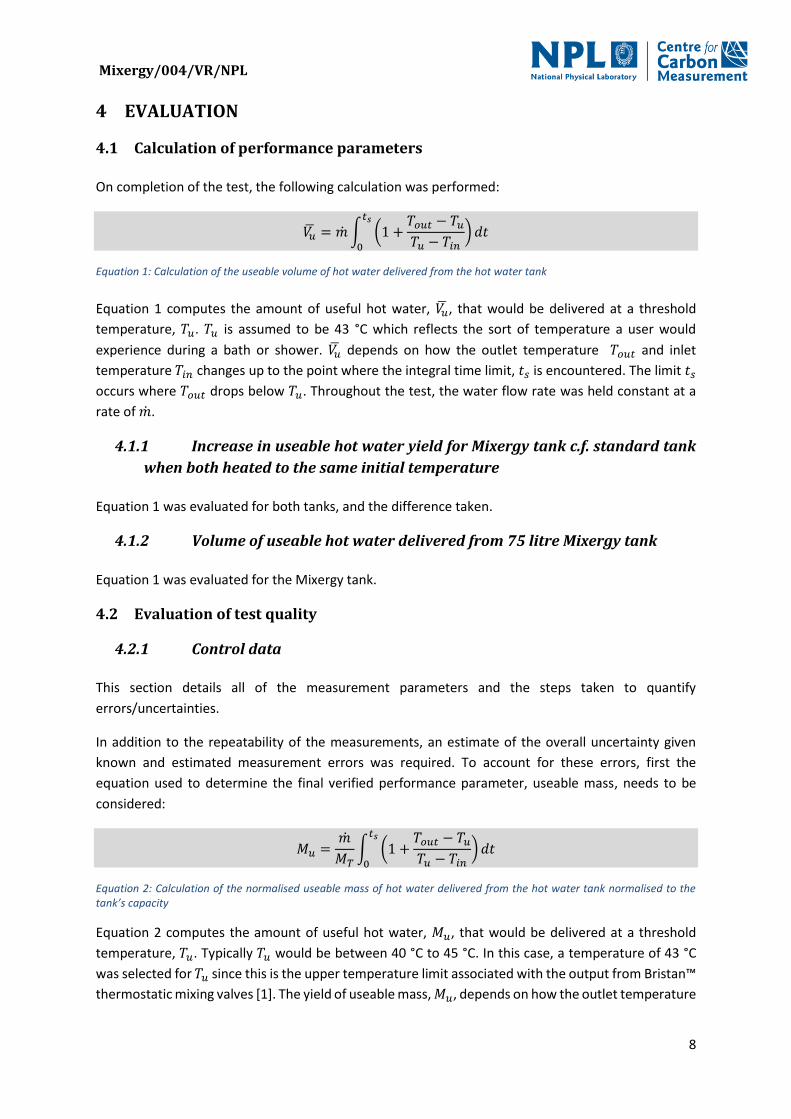
Equation 1: Calculation of the useable volume of hot water delivered from the hot water tank
Equation 1 computes the amount of useful hot water, 𝑉��, that would be delivered at a threshold
temperature, 𝑇𝑢. 𝑇𝑢 is assumed to be 43 °C which reflects the sort of temperature a user would
experience during a bath or shower. 𝑉�� depends on how the outlet temperature 𝑇𝑜𝑢𝑡 and inlet
temperature 𝑇𝑖𝑛 changes up to the point where the integral time limit, 𝑡𝑠 is encountered. The limit 𝑡𝑠
occurs where 𝑇𝑜𝑢𝑡 drops below 𝑇𝑢. Throughout the test, the water flow rate was held constant at a
rate of ��.
4.1.1 Increase in useable hot water yield for Mixergy tank c.f. standard tank
when both heated to the same initial temperature
Equation 1 was evaluated for both tanks, and the difference taken.
4.1.2 Volume of useable hot water delivered from 75 litre Mixergy tank
Equation 1 was evaluated for the Mixergy tank.
4.2 Evaluation of test quality
4.2.1 Control data
This section details all of the measurement parameters and the steps taken to quantify
errors/uncertainties.
In addition to the repeatability of the measurements, an estimate of the overall uncertainty given
known and estimated measurement errors was required. To account for these errors, first the
equation used to determine the final verified performance parameter, useable mass, needs to be
considered:
𝑀𝑢 =��
𝑀𝑇∫ (1 +
𝑇𝑜𝑢𝑡 − 𝑇𝑢
𝑇𝑢 − 𝑇𝑖𝑛)
𝑡𝑠
0
𝑑𝑡
Equation 2: Calculation of the normalised useable mass of hot water delivered from the hot water tank normalised to the tank’s capacity
Equation 2 computes the amount of useful hot water, 𝑀𝑢, that would be delivered at a threshold
temperature, 𝑇𝑢. Typically 𝑇𝑢 would be between 40 °C to 45 °C. In this case, a temperature of 43 °C
was selected for 𝑇𝑢 since this is the upper temperature limit associated with the output from Bristan™
thermostatic mixing valves [1]. The yield of useable mass, 𝑀𝑢, depends on how the outlet temperature
Mixergy/004/VR/NPL
9
𝑇𝑜𝑢𝑡 and inlet temperature 𝑇𝑖𝑛 changes up to the point where the integral time limit, 𝑡𝑠 is
encountered. The limit 𝑡𝑠 occurs where 𝑇𝑜𝑢𝑡 drops below 𝑇𝑢. Throughout the test, the water flow rate
was held constant at a rate of ��. The capacity of the tank, around which the results are normalised,
is expressed as 𝑀𝑇.
To understand how measurement errors associated with all of the above parameters affects the
overall uncertainty around 𝑀𝑢, each parameter was considered in turn:
Temperature
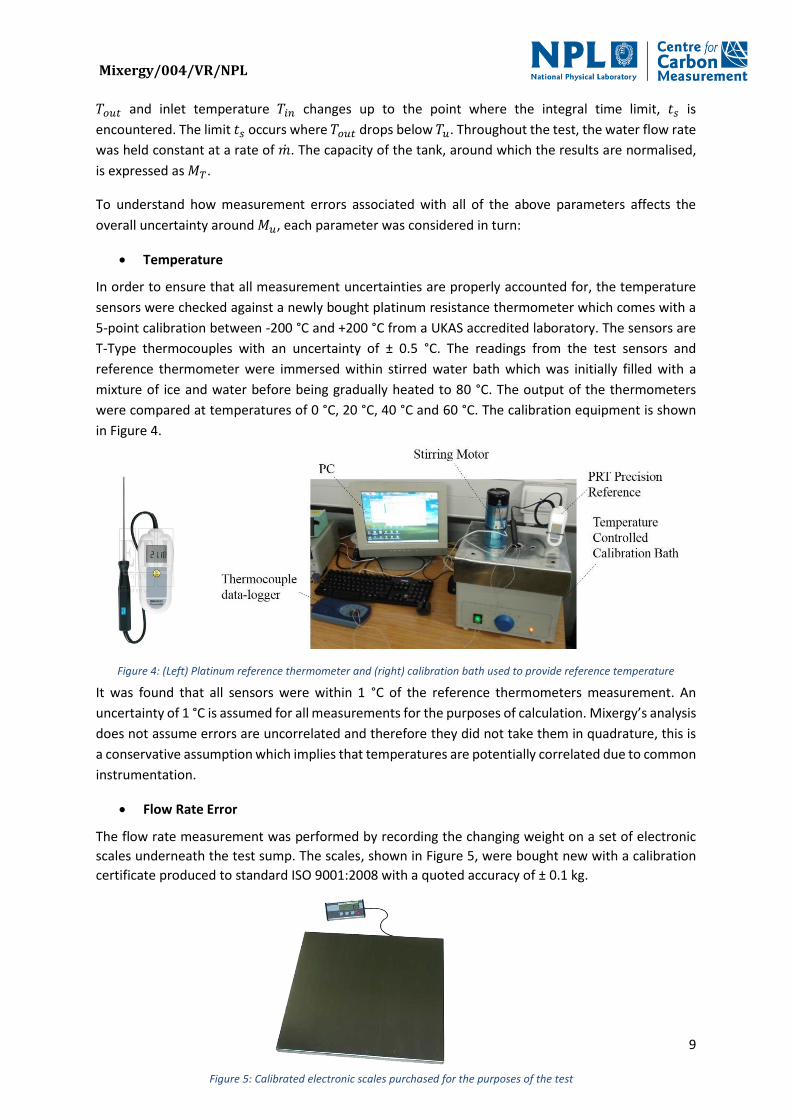
In order to ensure that all measurement uncertainties are properly accounted for, the temperature
sensors were checked against a newly bought platinum resistance thermometer which comes with a
5-point calibration between -200 °C and +200 °C from a UKAS accredited laboratory. The sensors are
T-Type thermocouples with an uncertainty of ± 0.5 °C. The readings from the test sensors and
reference thermometer were immersed within stirred water bath which was initially filled with a
mixture of ice and water before being gradually heated to 80 °C. The output of the thermometers
were compared at temperatures of 0 °C, 20 °C, 40 °C and 60 °C. The calibration equipment is shown
in Figure 4.
It was found that all sensors were within 1 °C of the reference thermometers measurement. An
uncertainty of 1 °C is assumed for all measurements for the purposes of calculation. Mixergy’s analysis
does not assume errors are uncorrelated and therefore they did not take them in quadrature, this is
a conservative assumption which implies that temperatures are potentially correlated due to common
instrumentation.
Flow Rate Error
The flow rate measurement was performed by recording the changing weight on a set of electronic
scales underneath the test sump. The scales, shown in Figure 5, were bought new with a calibration
certificate produced to standard ISO 9001:2008 with a quoted accuracy of ± 0.1 kg.
Figure 5: Calibrated electronic scales purchased for the purposes of the test
Figure 4: (Left) Platinum reference thermometer and (right) calibration bath used to provide reference temperature

Mixergy/004/VR/NPL
10
The flow rate measurement process involved computing the gradient of the electronic scale’s output
over time. This is illustrated by Figure 6, where the raw weight data is plotted with a linear curve fit
and associated equation for three independent draw tests conducted at 15 l/min.
Figure 6: The changing weight of the scales over time during three independent draw tests conducted at 15 l/min
The raw data in Figure 6 was sampled at 100 ms intervals and has had linear functions regressed to it
to determine the slope and linearity using the ‘R² test’. As can be seen, the fit is very close and the
gradient (in kg/sec) is to within 3 decimal places for each test. Given that the timing error (see next
section) is negligible, it is assumed that the flow rate error measurement is entirely down to the
resolution of the scales (± 0.1 kg). During each test, the scales were logged as they registered a change
in mass of between approximately 20 kg and 100 kg. Therefore, a worst case range of between 19.9 kg
and 100.1 kg, and 20.1 kg and 99.9 kg; or a mass of 79.8 kg to 80.2 kg was assumed. At 15 l/min, this
mass would be delivered in approximately 320 seconds leading to a flow rate of (0.25 ±
0.000625) kg/sec. Throughout the tests, Mixergy assumed a flow rate uncertainty of ± 0.001 kg/sec as
a conservative estimate.
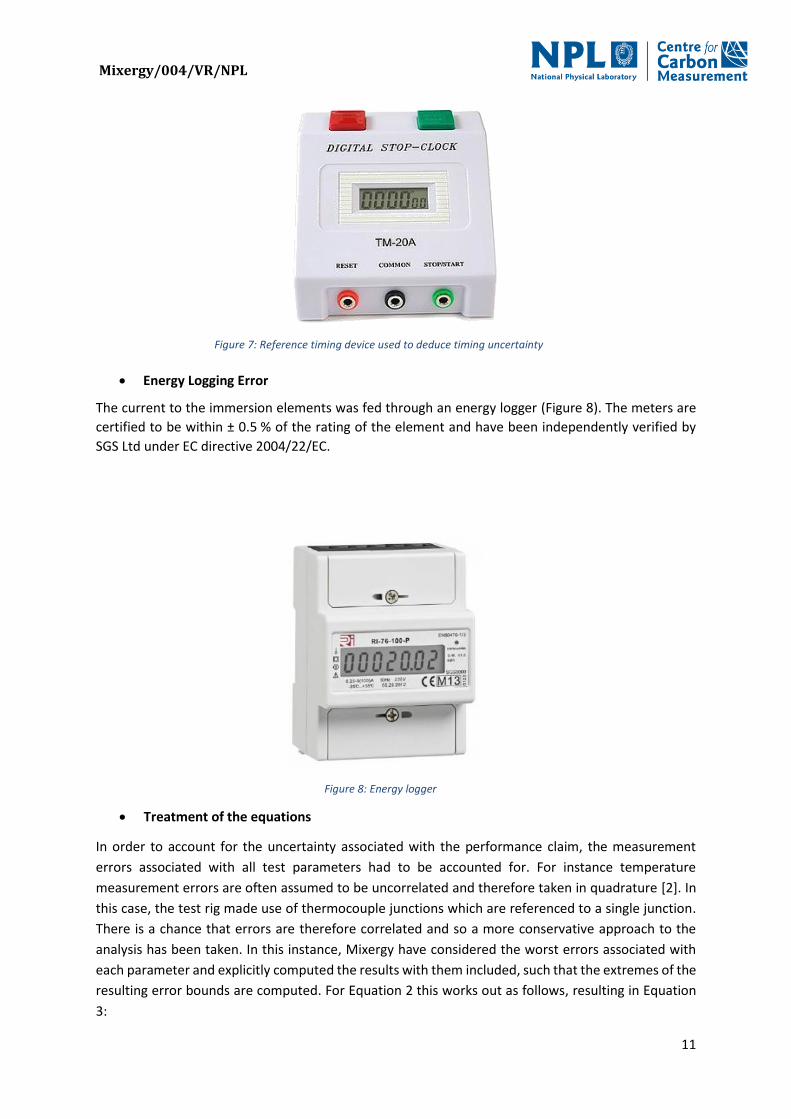
Timing Error
The flow rate uncertainty assumed that the timing errors were negligible, this was verified using a
digital time reference (Figure 7) which was bought new and calibrated according to ISO17025 by a
UKAS accredited facility. The timer was triggered manually against software time recordings to verify
that any discrepancy with true time was negligible.
Mixergy/004/VR/NPL
11
Energy Logging Error
The current to the immersion elements was fed through an energy logger (Figure 8). The meters are
certified to be within ± 0.5 % of the rating of the element and have been independently verified by
SGS Ltd under EC directive 2004/22/EC.
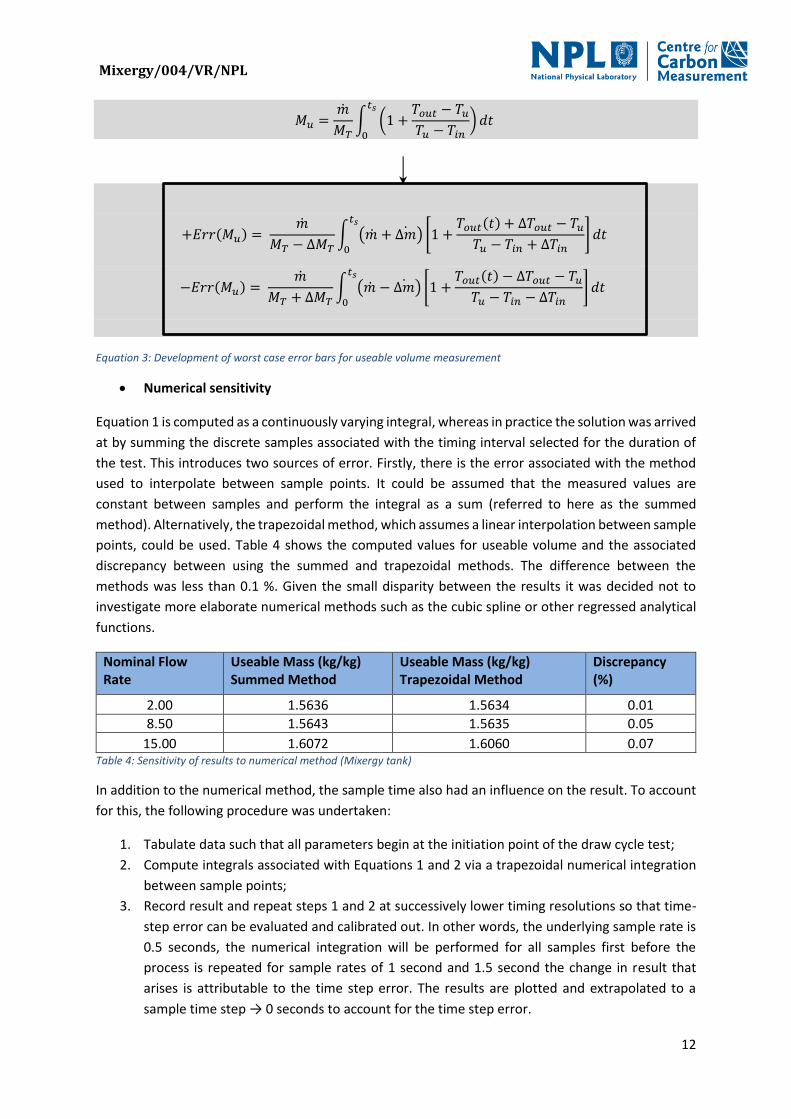
Treatment of the equations
In order to account for the uncertainty associated with the performance claim, the measurement
errors associated with all test parameters had to be accounted for. For instance temperature
measurement errors are often assumed to be uncorrelated and therefore taken in quadrature [2]. In
this case, the test rig made use of thermocouple junctions which are referenced to a single junction.
There is a chance that errors are therefore correlated and so a more conservative approach to the
analysis has been taken. In this instance, Mixergy have considered the worst errors associated with
each parameter and explicitly computed the results with them included, such that the extremes of the
resulting error bounds are computed. For Equation 2 this works out as follows, resulting in Equation
3:
Figure 7: Reference timing device used to deduce timing uncertainty
Figure 8: Energy logger
Mixergy/004/VR/NPL
12
𝑀𝑢 =𝑚
𝑀𝑇
∫ (1 +
𝑇𝑜𝑢𝑡 − 𝑇𝑢
𝑇𝑢 − 𝑇𝑖𝑛)
𝑡𝑠
0
𝑑𝑡
+𝐸𝑟𝑟(𝑀𝑢) = 𝑚
𝑀𝑇 − ∆𝑀𝑇
∫ (�� + ∆��) [1 +
𝑇𝑜𝑢𝑡(𝑡) + ∆𝑇𝑜𝑢𝑡 − 𝑇𝑢
𝑇𝑢 − 𝑇𝑖𝑛 + ∆𝑇𝑖𝑛]
𝑡𝑠
0
𝑑𝑡
−𝐸𝑟𝑟(𝑀𝑢) = 𝑚
𝑀𝑇 + ∆𝑀𝑇
∫ (�� − ∆��) [1 +
𝑇𝑜𝑢𝑡(𝑡) − ∆𝑇𝑜𝑢𝑡 − 𝑇𝑢
𝑇𝑢 − 𝑇𝑖𝑛 − ∆𝑇𝑖𝑛]
𝑡𝑠
0
𝑑𝑡
Equation 3: Development of worst case error bars for useable volume measurement
Numerical sensitivity
Equation 1 is computed as a continuously varying integral, whereas in practice the solution was arrived
at by summing the discrete samples associated with the timing interval selected for the duration of
the test. This introduces two sources of error. Firstly, there is the error associated with the method
used to interpolate between sample points. It could be assumed that the measured values are
constant between samples and perform the integral as a sum (referred to here as the summed
method). Alternatively, the trapezoidal method, which assumes a linear interpolation between sample
points, could be used. Table 4 shows the computed values for useable volume and the associated
discrepancy between using the summed and trapezoidal methods. The difference between the
methods was less than 0.1 %. Given the small disparity between the results it was decided not to
investigate more elaborate numerical methods such as the cubic spline or other regressed analytical
functions.
Nominal Flow Rate
Useable Mass (kg/kg) Summed Method
Useable Mass (kg/kg) Trapezoidal Method
Discrepancy (%)
2.00 1.5636 1.5634 0.01
8.50 1.5643 1.5635 0.05
15.00 1.6072 1.6060 0.07 Table 4: Sensitivity of results to numerical method (Mixergy tank)
In addition to the numerical method, the sample time also had an influence on the result. To account
for this, the following procedure was undertaken:
1. Tabulate data such that all parameters begin at the initiation point of the draw cycle test;
2. Compute integrals associated with Equations 1 and 2 via a trapezoidal numerical integration
between sample points;
3. Record result and repeat steps 1 and 2 at successively lower timing resolutions so that time-
step error can be evaluated and calibrated out. In other words, the underlying sample rate is
0.5 seconds, the numerical integration will be performed for all samples first before the
process is repeated for sample rates of 1 second and 1.5 second the change in result that
arises is attributable to the time step error. The results are plotted and extrapolated to a
sample time step → 0 seconds to account for the time step error.
Mixergy/004/VR/NPL
13
This procedure was applied to a test conducted on the standard tank during a draw test at a target
flow rate of 15 l/min.
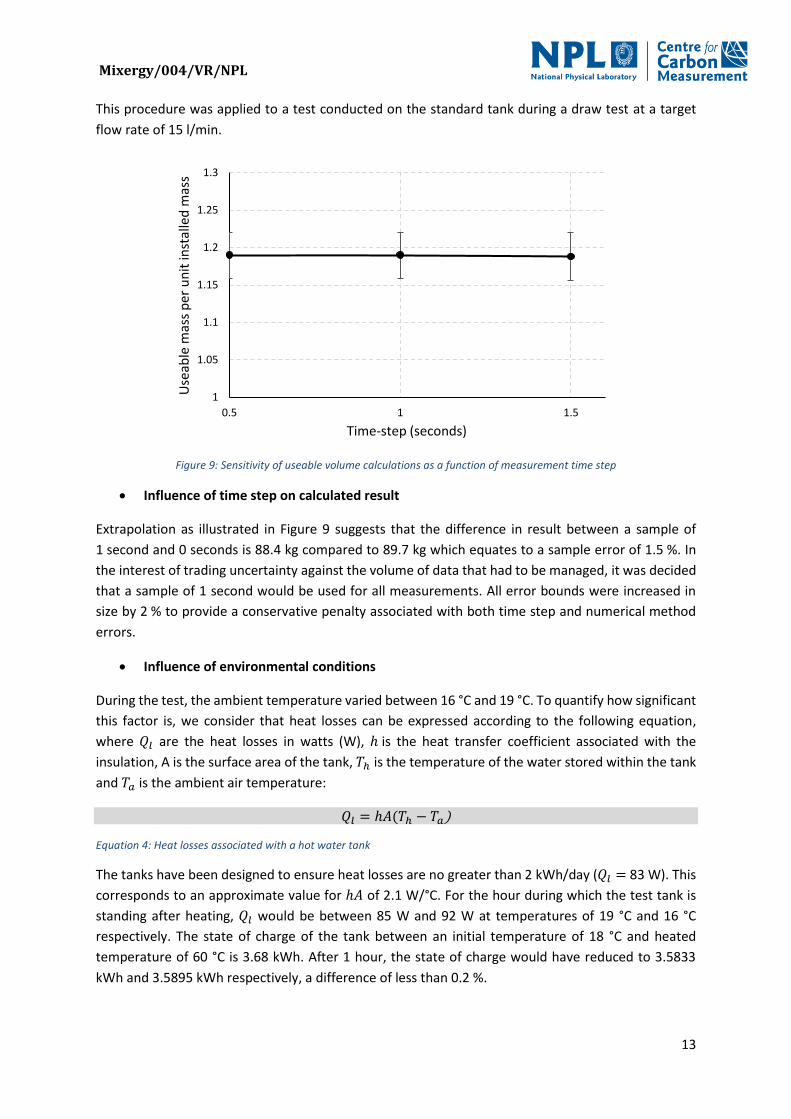
Figure 9: Sensitivity of useable volume calculations as a function of measurement time step
Influence of time step on calculated result
Extrapolation as illustrated in Figure 9 suggests that the difference in result between a sample of
1 second and 0 seconds is 88.4 kg compared to 89.7 kg which equates to a sample error of 1.5 %. In
the interest of trading uncertainty against the volume of data that had to be managed, it was decided
that a sample of 1 second would be used for all measurements. All error bounds were increased in
size by 2 % to provide a conservative penalty associated with both time step and numerical method
errors.
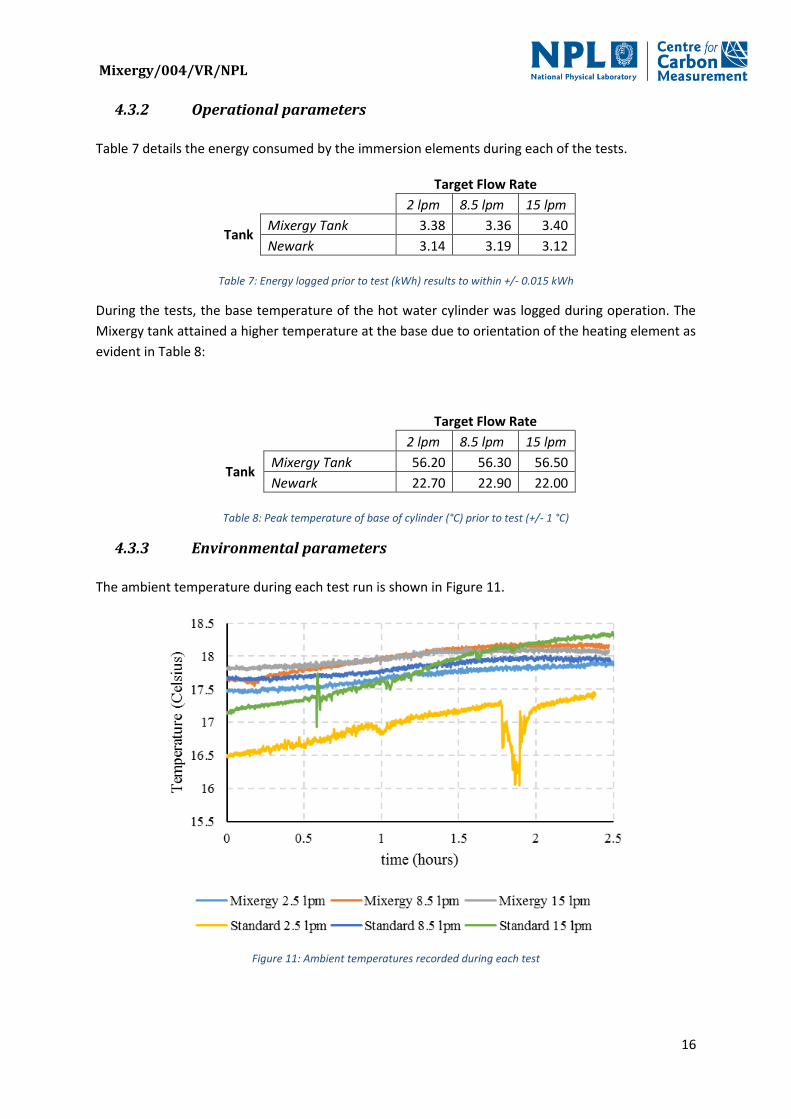
Influence of environmental conditions
During the test, the ambient temperature varied between 16 °C and 19 °C. To quantify how significant
this factor is, we consider that heat losses can be expressed according to the following equation,
where 𝑄𝑙 are the heat losses in watts (W), ℎ is the heat transfer coefficient associated with the
insulation, A is the surface area of the tank, 𝑇ℎ is the temperature of the water stored within the tank
and 𝑇𝑎 is the ambient air temperature:
𝑄𝑙 = ℎ𝐴(𝑇ℎ − 𝑇𝑎)
Equation 4: Heat losses associated with a hot water tank
The tanks have been designed to ensure heat losses are no greater than 2 kWh/day (𝑄𝑙 = 83 W). This
corresponds to an approximate value for ℎ𝐴 of 2.1 W/°C. For the hour during which the test tank is
standing after heating, 𝑄𝑙 would be between 85 W and 92 W at temperatures of 19 °C and 16 °C
respectively. The state of charge of the tank between an initial temperature of 18 °C and heated
temperature of 60 °C is 3.68 kWh. After 1 hour, the state of charge would have reduced to 3.5833
kWh and 3.5895 kWh respectively, a difference of less than 0.2 %.
1
1.05
1.1
1.15
1.2
1.25
1.3
0.5 1 1.5
Use
able
mas
s p
er u
nit
inst
alle
d m
ass
Time-step (seconds)
Mixergy/004/VR/NPL
14
Summary of stated uncertainty
In summary, the reported uncertainties are derived via explicit computation of the results assuming
worst case correlated errors, as illustrated by Equation 3. Repetition of the experiments found that
results could be consistently reproduced whilst a time step of 1 second was considered to be adequate
along with the use of a trapezoidal integration method.
4.2.2 Data Management
All data was compiled from the host PC into a dated spreadsheet on completion of each test. Data was
hosted on a shared folder system to ensure multiple back-ups were distributed across personnel
computers.
4.2.3 Record Keeping
Records of tests conducted are kept in the test room laboratory.
4.2.4 Audits
An audit was carried out by Helen McEvoy (Senior Research Scientist, Temperature and Humidity
Standards, NPL) on 17 August 2016. The outcome of that audit can be seen in Appendix 5 (Audit
report).
4.2.5 Deviations
Please see section 1.6.
4.3 Verification results (verified performance claim)
The results described below have been audited. The audit reported:
In general the test facility, test methodology, data analysis process and staff training/
competence are fit for purpose and meet those requirements of ISO17025 which are
applicable for this test process.
The test procedure and the test results obtained to date, and which are presented in the Test
Report, are sufficient to confirm the validity of the methodology and the ‘proof of concept’ of
the Mixergy design of tank.
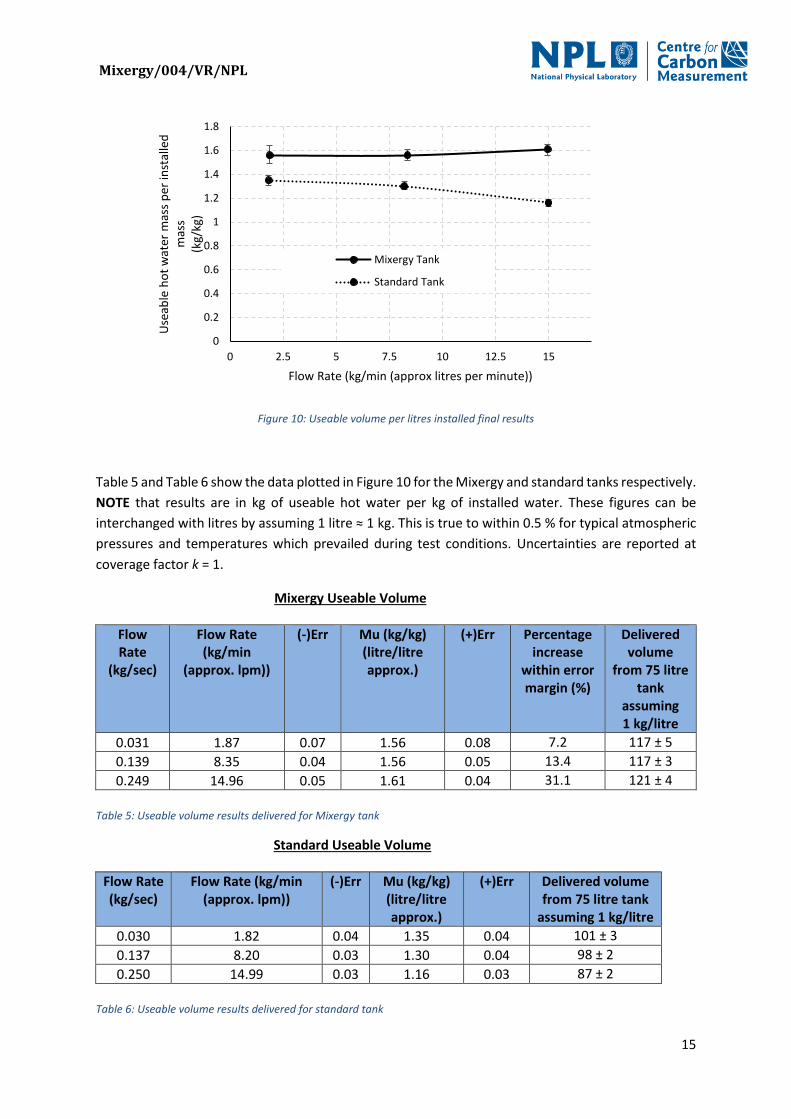
4.3.1 Performance parameters
The Mixergy tank was able to deliver between 7.2 % and 31.1 % more useable hot water per installed
volume of water across flow rates of 1.9 l/min to 15 l/min as compared to the claimed values in Table
2. This is illustrated in Figure 10 which shows the measured values which are annotated with their
associated error bounds. The derivation of the error bounds are discussed in 4.2 and Appendix A2.1.2
of the Test Report.
Mixergy/004/VR/NPL
15
Figure 10: Useable volume per litres installed final results
Table 5 and Table 6 show the data plotted in Figure 10 for the Mixergy and standard tanks respectively.
NOTE that results are in kg of useable hot water per kg of installed water. These figures can be
interchanged with litres by assuming 1 litre ≈ 1 kg. This is true to within 0.5 % for typical atmospheric
pressures and temperatures which prevailed during test conditions. Uncertainties are reported at
coverage factor k = 1.
Mixergy Useable Volume
Flow Rate
(kg/sec)
Flow Rate (kg/min
(approx. lpm))
(-)Err Mu (kg/kg) (litre/litre approx.)
(+)Err Percentage increase
within error margin (%)
Delivered volume
from 75 litre tank
assuming 1 kg/litre
0.031 1.87 0.07 1.56 0.08 7.2 117 ± 5
0.139 8.35 0.04 1.56 0.05 13.4 117 ± 3
0.249 14.96 0.05 1.61 0.04 31.1 121 ± 4
Table 5: Useable volume results delivered for Mixergy tank
Standard Useable Volume
Flow Rate (kg/sec)
Flow Rate (kg/min (approx. lpm))
(-)Err Mu (kg/kg) (litre/litre approx.)
(+)Err Delivered volume from 75 litre tank
assuming 1 kg/litre
0.030 1.82 0.04 1.35 0.04 101 ± 3
0.137 8.20 0.03 1.30 0.04 98 ± 2
0.250 14.99 0.03 1.16 0.03 87 ± 2
Table 6: Useable volume results delivered for standard tank
0
0.2
0.4
0.6
0.8
1
1.2
1.4
1.6
1.8
0 2.5 5 7.5 10 12.5 15
Use
able
ho
t w
ater
mas
s p
er in
stal
led
m
ass
(kg/
kg)
Flow Rate (kg/min (approx litres per minute))
Mixergy Tank
Standard Tank
Mixergy/004/VR/NPL
16
4.3.2 Operational parameters
Table 7 details the energy consumed by the immersion elements during each of the tests.
Target Flow Rate
2 lpm 8.5 lpm 15 lpm
Tank Mixergy Tank 3.38 3.36 3.40
Newark 3.14 3.19 3.12
Table 7: Energy logged prior to test (kWh) results to within +/- 0.015 kWh
During the tests, the base temperature of the hot water cylinder was logged during operation. The
Mixergy tank attained a higher temperature at the base due to orientation of the heating element as
evident in Table 8:
Target Flow Rate
2 lpm 8.5 lpm 15 lpm
Tank Mixergy Tank 56.20 56.30 56.50
Newark 22.70 22.90 22.00
Table 8: Peak temperature of base of cylinder (°C) prior to test (+/- 1 °C)
4.3.3 Environmental parameters
The ambient temperature during each test run is shown in Figure 11.
Figure 11: Ambient temperatures recorded during each test
Mixergy/004/VR/NPL
17
4.4 Recommendations for the Statement of Verification
The Mixergy tank with a control thermometer installed as described can deliver more hot water for a
75 litre installed volume, at the level of up to 30 % given in the performance claim. Some of this is due
to more initial heat input, and at low flow rate all the benefit is from increased storage density. At
higher flow rates there is additional benefit from the reduction of mixing. The Mixergy tank with a
volume of 75 litres delivered 120 litres of hot water at the threshold 43 °C compared to 90 litres
delivered by a tank built to British Standards.
Therefore, NPL deem the deviations from the SVP outlined in section 1.6 to be acceptable and the
claims 2.4.1(A) and 2.4.1(B) that were made in the SVP have been met.
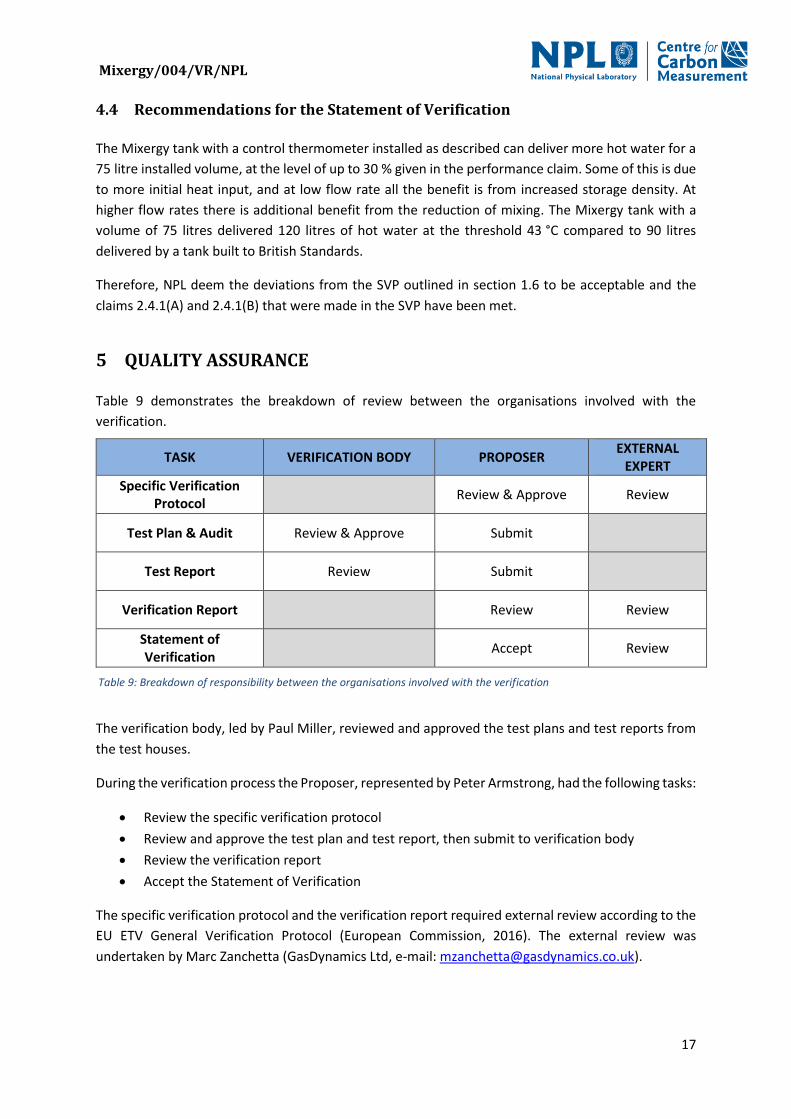
5 QUALITY ASSURANCE Table 9 demonstrates the breakdown of review between the organisations involved with the
verification.
The verification body, led by Paul Miller, reviewed and approved the test plans and test reports from
the test houses.
During the verification process the Proposer, represented by Peter Armstrong, had the following tasks:
Review the specific verification protocol
Review and approve the test plan and test report, then submit to verification body
Review the verification report
Accept the Statement of Verification
The specific verification protocol and the verification report required external review according to the
EU ETV General Verification Protocol (European Commission, 2016). The external review was
undertaken by Marc Zanchetta (GasDynamics Ltd, e-mail: [email protected]).
TASK VERIFICATION BODY PROPOSER EXTERNAL
EXPERT
Specific Verification Protocol
Review & Approve Review
Test Plan & Audit Review & Approve Submit
Test Report Review Submit
Verification Report Review Review
Statement of Verification
Accept Review
Table 9: Breakdown of responsibility between the organisations involved with the verification

Mixergy/004/VR/NPL
18
6 REFERENCES
[1] Bristan, “Datasheet on: Deck mounted bath filler with thermostatic shower control fitting
instructions & contents list,” Tamworth, 2015.
[2] J. R. Taylor, “Independent verus dependent measurements,” in An Introduction to Error Analysis,
2nd ed., Colorado, University Science Books, 1997, p. 45–79.
[3] P. M. Armstrong, M. Uapipatanakul, I. Thompson, D. Ager and M. McCulloch, “Thermal and
sanitary performance of domestic hot water cylinders: Conflicting requirements,” Applied
Energy, vol. 131, p. 171–179, 2014.