Mitsui & Co. (U.S.A.), Inc....Mitsui USA as well as Mitsui Japan are general trading companies (Sogo...
45
Mitsui & Co. (U.S.A.), Inc. Financial Statements as of and for the Years Ended March 31, 2020 and 2019, and Independent Auditors’ Report
Transcript of Mitsui & Co. (U.S.A.), Inc....Mitsui USA as well as Mitsui Japan are general trading companies (Sogo...
Mitsui & Co. (U.S.A.), Inc.
Financial Statements as of and for the Years Ended March 31, 2020 and 2019, and
Independent Auditors’ Report
Mitsui & Co. (U.S.A.), Inc.
Financial Statements as of and for the Years Ended March 31, 2020 and 2019, and
Independent Auditors’ Report
Table of Contents
Independent Auditors’ Report ................................................................................................................................... 1 Statements of Financial Position ................................................................................................................................ 2 Statements of Comprehensive Income ....................................................................................................................... 3 Statements of Changes in Equity ................................................................................................................................ 4 Statements of Cash Flows ........................................................................................................................................... 5 Notes to Financial Statements: Note 1 – Reporting Entity ............................................................................................................................................ 6 Note 2 – Basis of Financial Statements and Summary of Significant Accounting Policies......................................... 6 Note 3 – Investments in Subsidiaries and Associates ................................................................................................ 14 Note 4 – Financial Instruments and Related Matters ................................................................................................. 16 Note 5 – Receivables and Related Allowances ......................................................................................................... 20 Note 6 – Leases......................................................................................................................................................... 21 Note 7 – Property, Plant, and Equipment .................................................................................................................. 23 Note 8 – Financial Liabilities ................................................................................................................................... 24 Note 9 – Employee Benefits ..................................................................................................................................... 26 Note 10 – Accumulated Other Comprehensive Income (Loss) .................................................................................. 30 Note 11 – Revenue ..................................................................................................................................................... 30 Note 12 – Selling, General, and Administrative Expenses ......................................................................................... 31 Note 13 – Income Taxes ............................................................................................................................................. 31 Note 14 – Fair Value Measurement ............................................................................................................................ 33 Note 15 – Contingent Liabilities ................................................................................................................................. 37 Note 16 – Related Party Transactions ......................................................................................................................... 38 Note 17 – Ultimate Parent and Controlling Party ....................................................................................................... 40 Note 18 – Authorization of Issuance of Financial Statements .................................................................................... 40

(This page has been left blank intentionally.)
1
INDEPENDENT AUDITORS’ REPORT To the Board of Directors of Mitsui & Co. (U.S.A.), Inc.: We have audited the accompanying financial statements of Mitsui & Co. (U.S.A.), Inc. (the ‘‘Company’’) (an ultimate wholly-owned subsidiary of Mitsui & Co., Ltd.), which comprise the statements of financial position as of March 31, 2020 and 2019, and the related statements of comprehensive income, changes in equity, and cash flows for the years then ended, and the related notes to the financial statements. Management’s Responsibility for the Financial Statements Management is responsible for the preparation and fair presentation of these financial statements in accordance with International Financial Reporting Standards as issued by the International Accounting Standards Board; this includes the design, implementation, and maintenance of internal control relevant to the preparation and fair presentation of financial statements that are free from material misstatement, whether due to fraud or error. Auditors’ Responsibility Our responsibility is to express an opinion on these financial statements based on our audits. We conducted our audits in accordance with auditing standards generally accepted in the United States of America. Those standards require that we plan and perform the audit to obtain reasonable assurance about whether the financial statements are free from material misstatement. An audit involves performing procedures to obtain audit evidence about the amounts and disclosures in the financial statements. The procedures selected depend on the auditor’s judgment, including the assessment of the risks of material misstatement of the financial statements, whether due to fraud or error. In making those risk assessments, the auditor considers internal control relevant to the Company’s preparation and fair presentation of the financial statements in order to design audit procedures that are appropriate in the circumstances, but not for the purpose of expressing an opinion on the effectiveness of the Company’s internal control. Accordingly, we express no such opinion. An audit also includes evaluating the appropriateness of accounting policies used and the reasonableness of significant accounting estimates made by management, as well as evaluating the overall presentation of the financial statements. We believe that the audit evidence we have obtained is sufficient and appropriate to provide a basis for our audit opinion. Opinion In our opinion, the financial statements referred to above present fairly, in all material respects, the financial position of Mitsui & Co. (U.S.A.), Inc. as of March 31, 2020 and 2019, and the results of its operations and its cash flows for the years then ended, in accordance with International Financial Reporting Standards as issued by the International Accounting Standards Board. Emphasis of Matter As discussed in Note 16 to the financial statements, the Company has extensive transactions with Mitsui & Co., Ltd. and its affiliates. Accordingly, the accompanying financial statements may not be indicative of the financial position, the results of its operations, or its cash flows which would have been attained by the Company if it had operated without such affiliations. Our opinion is not modified with respect to this matter.
New York, NY June 11, 2020
2
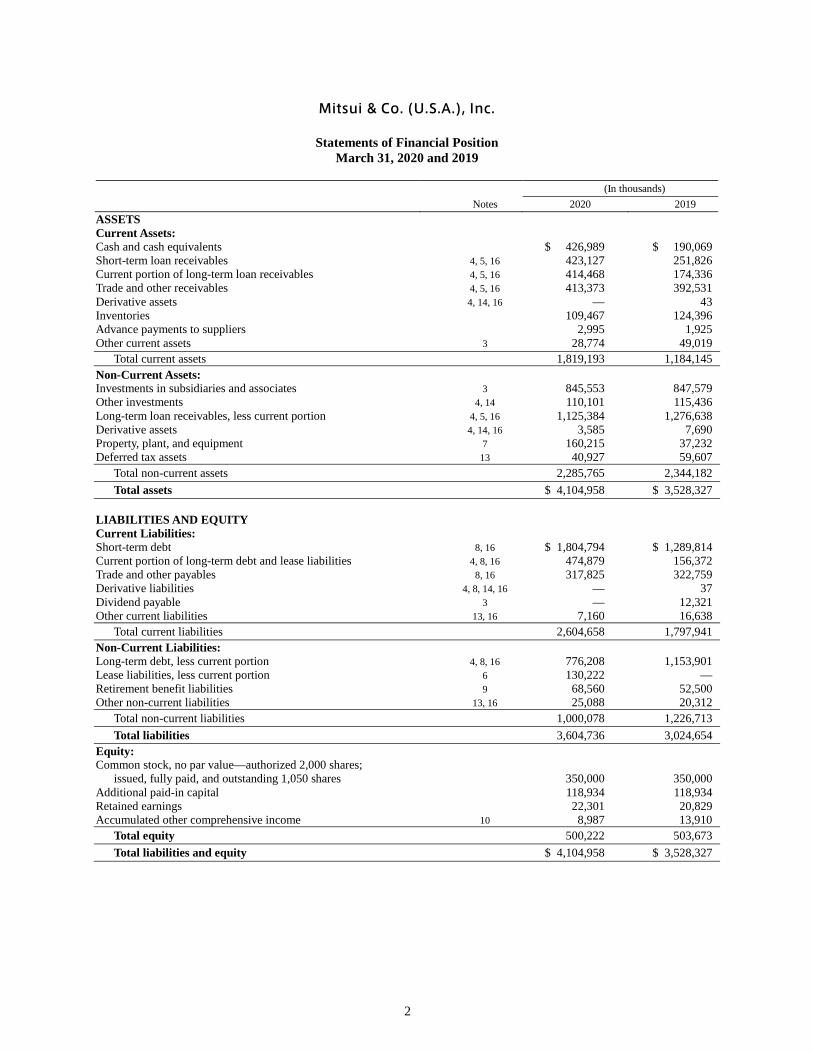
Mitsui & Co. (U.S.A.), Inc.
Statements of Financial Position March 31, 2020 and 2019
(In thousands) Notes 2020 2019 ASSETS Current Assets: Cash and cash equivalents $ 426,989 $ 190,069 Short-term loan receivables 4, 5, 16 423,127 251,826 Current portion of long-term loan receivables 4, 5, 16 414,468 174,336 Trade and other receivables 4, 5, 16 413,373 392,531 Derivative assets 4, 14, 16 — 43 Inventories 109,467 124,396 Advance payments to suppliers 2,995 1,925 Other current assets 3 28,774 49,019 Total current assets 1,819,193 1,184,145 Non-Current Assets: Investments in subsidiaries and associates 3 845,553 847,579 Other investments 4, 14 110,101 115,436 Long-term loan receivables, less current portion 4, 5, 16 1,125,384 1,276,638 Derivative assets 4, 14, 16 3,585 7,690 Property, plant, and equipment 7 160,215 37,232 Deferred tax assets 13 40,927 59,607 Total non-current assets 2,285,765 2,344,182 Total assets $ 4,104,958 $ 3,528,327 LIABILITIES AND EQUITY Current Liabilities: Short-term debt 8, 16 $ 1,804,794 $ 1,289,814 Current portion of long-term debt and lease liabilities 4, 8, 16 474,879 156,372 Trade and other payables 8, 16 317,825 322,759 Derivative liabilities 4, 8, 14, 16 — 37 Dividend payable 3 — 12,321 Other current liabilities 13, 16 7,160 16,638 Total current liabilities 2,604,658 1,797,941 Non-Current Liabilities: Long-term debt, less current portion 4, 8, 16 776,208 1,153,901 Lease liabilities, less current portion 6 130,222 — Retirement benefit liabilities 9 68,560 52,500 Other non-current liabilities 13, 16 25,088 20,312 Total non-current liabilities 1,000,078 1,226,713 Total liabilities 3,604,736 3,024,654 Equity: Common stock, no par value—authorized 2,000 shares; issued, fully paid, and outstanding 1,050 shares 350,000 350,000 Additional paid-in capital 118,934 118,934 Retained earnings 22,301 20,829 Accumulated other comprehensive income 10 8,987 13,910 Total equity 500,222 503,673 Total liabilities and equity $ 4,104,958 $ 3,528,327
3
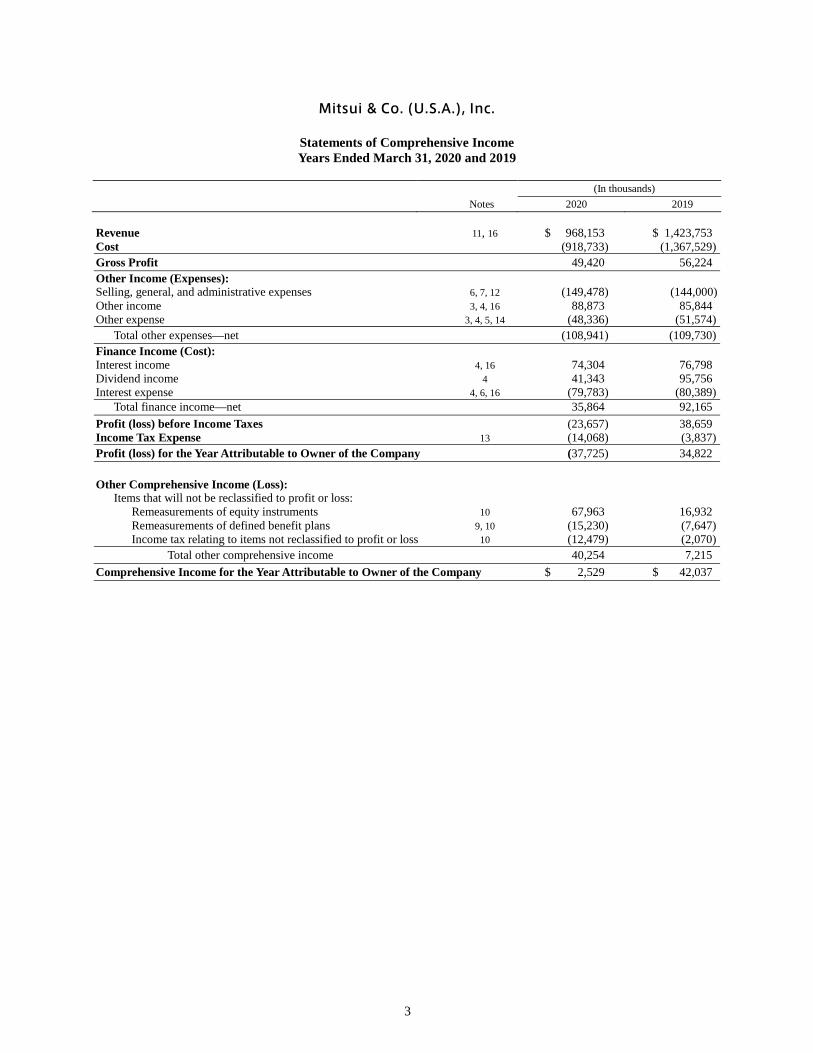
Mitsui & Co. (U.S.A.), Inc.
Statements of Comprehensive Income Years Ended March 31, 2020 and 2019
(In thousands) Notes 2020 2019 Revenue 11, 16 $ 968,153 $ 1,423,753 Cost (918,733) (1,367,529) Gross Profit 49,420 56,224 Other Income (Expenses): Selling, general, and administrative expenses 6, 7, 12 (149,478) (144,000) Other income 3, 4, 16 88,873 85,844 Other expense 3, 4, 5, 14 (48,336) (51,574) Total other expenses—net (108,941) (109,730) Finance Income (Cost): Interest income 4, 16 74,304 76,798 Dividend income 4 41,343 95,756 Interest expense 4, 6, 16 (79,783) (80,389) Total finance income—net 35,864 92,165 Profit (loss) before Income Taxes (23,657) 38,659 Income Tax Expense 13 (14,068) (3,837) Profit (loss) for the Year Attributable to Owner of the Company (37,725) 34,822 Other Comprehensive Income (Loss): Items that will not be reclassified to profit or loss: Remeasurements of equity instruments 10 67,963 16,932 Remeasurements of defined benefit plans 9, 10 (15,230) (7,647) Income tax relating to items not reclassified to profit or loss 10 (12,479) (2,070) Total other comprehensive income 40,254 7,215 Comprehensive Income for the Year Attributable to Owner of the Company $ 2,529 $ 42,037
4
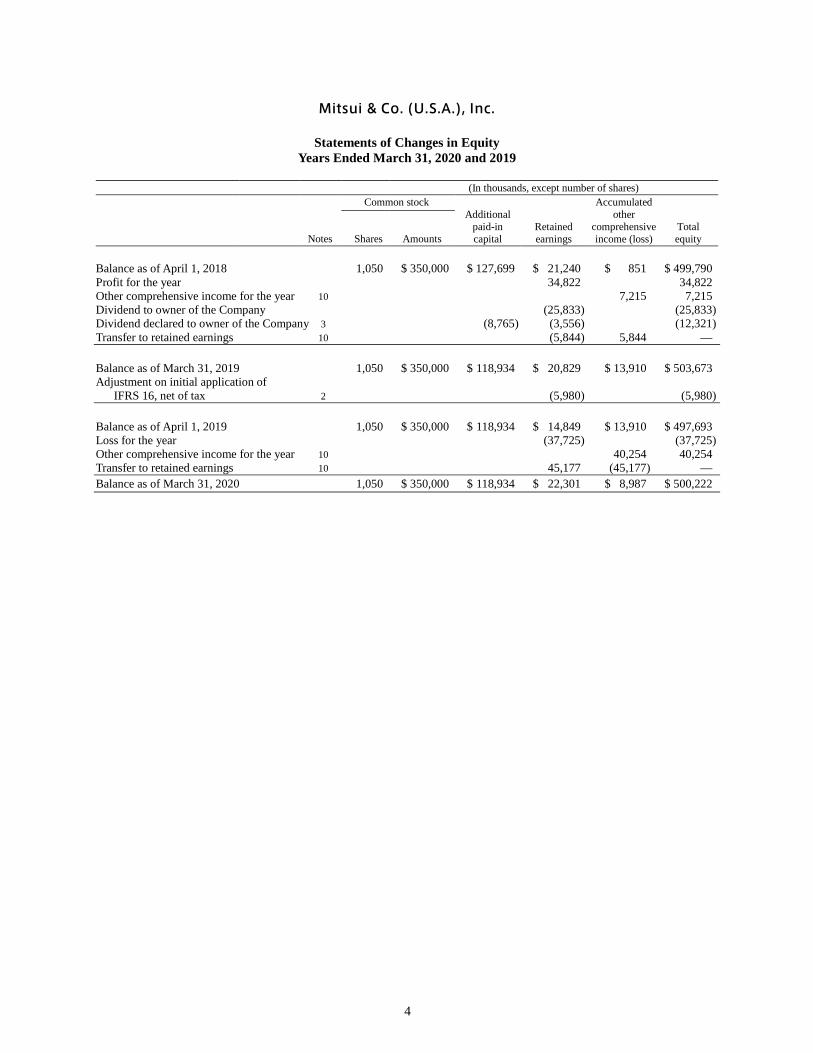
Mitsui & Co. (U.S.A.), Inc.
Statements of Changes in Equity Years Ended March 31, 2020 and 2019
(In thousands, except number of shares)
Common stock Additional
paid-in capital
Retained earnings
Accumulated other
comprehensive income (loss)
Total equity
Notes Shares Amounts
Balance as of April 1, 2018 1,050 $ 350,000 $ 127,699 $ 21,240 $ 851 $ 499,790 Profit for the year 34,822 34,822 Other comprehensive income for the year 10 7,215 7,215 Dividend to owner of the Company (25,833) (25,833) Dividend declared to owner of the Company 3 (8,765) (3,556) (12,321) Transfer to retained earnings 10 (5,844) 5,844 — Balance as of March 31, 2019 1,050 $ 350,000 $ 118,934 $ 20,829 $ 13,910 $ 503,673 Adjustment on initial application of IFRS 16, net of tax 2 (5,980) (5,980) Balance as of April 1, 2019 1,050 $ 350,000 $ 118,934 $ 14,849 $ 13,910 $ 497,693 Loss for the year (37,725) (37,725) Other comprehensive income for the year 10 40,254 40,254 Transfer to retained earnings 10 45,177 (45,177) — Balance as of March 31, 2020 1,050 $ 350,000 $ 118,934 $ 22,301 $ 8,987 $ 500,222
5
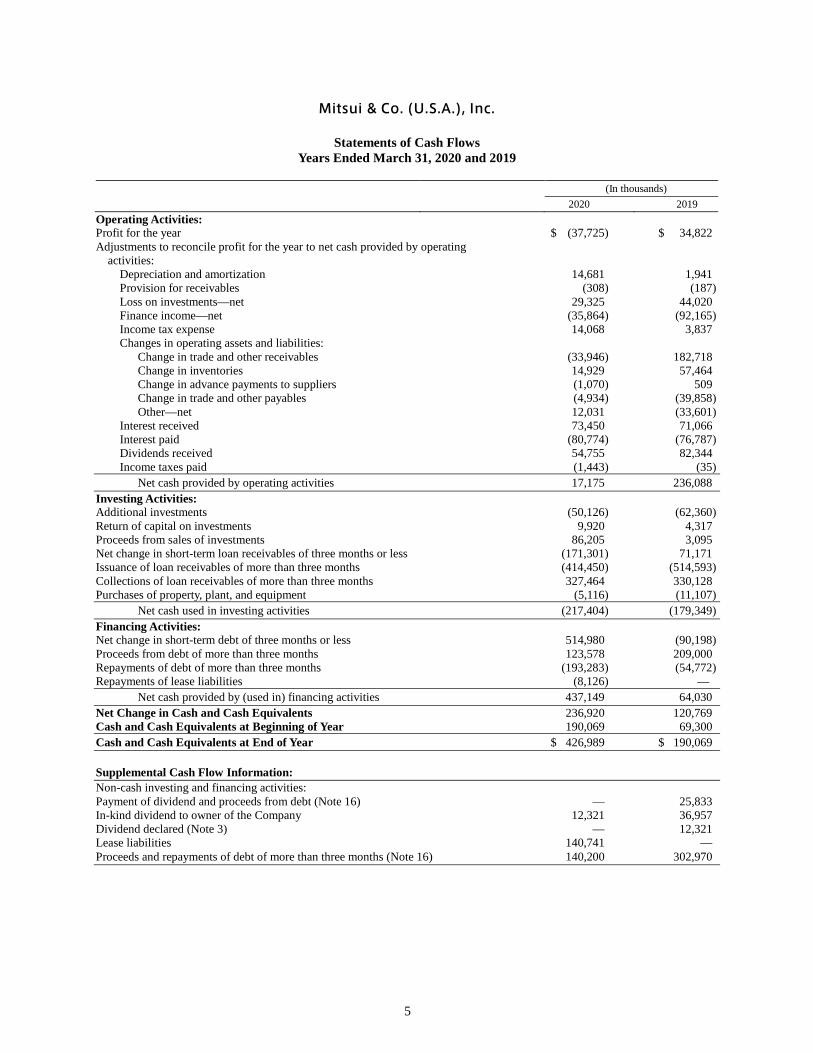
Mitsui & Co. (U.S.A.), Inc.
Statements of Cash Flows Years Ended March 31, 2020 and 2019
(In thousands) 2020 2019 Operating Activities: Profit for the year $ (37,725) $ 34,822 Adjustments to reconcile profit for the year to net cash provided by operating activities: Depreciation and amortization 14,681 1,941 Provision for receivables (308) (187) Loss on investments—net 29,325 44,020 Finance income—net (35,864) (92,165) Income tax expense 14,068 3,837 Changes in operating assets and liabilities: Change in trade and other receivables (33,946) 182,718 Change in inventories 14,929 57,464 Change in advance payments to suppliers (1,070) 509 Change in trade and other payables (4,934) (39,858) Other—net 12,031 (33,601) Interest received 73,450 71,066 Interest paid (80,774) (76,787) Dividends received 54,755 82,344 Income taxes paid (1,443) (35) Net cash provided by operating activities 17,175 236,088 Investing Activities: Additional investments (50,126) (62,360) Return of capital on investments 9,920 4,317 Proceeds from sales of investments 86,205 3,095 Net change in short-term loan receivables of three months or less (171,301) 71,171 Issuance of loan receivables of more than three months (414,450) (514,593) Collections of loan receivables of more than three months 327,464 330,128 Purchases of property, plant, and equipment (5,116) (11,107) Net cash used in investing activities (217,404) (179,349) Financing Activities: Net change in short-term debt of three months or less 514,980 (90,198) Proceeds from debt of more than three months 123,578 209,000 Repayments of debt of more than three months (193,283) (54,772) Repayments of lease liabilities (8,126) — Net cash provided by (used in) financing activities 437,149 64,030 Net Change in Cash and Cash Equivalents 236,920 120,769 Cash and Cash Equivalents at Beginning of Year 190,069 69,300 Cash and Cash Equivalents at End of Year $ 426,989 $ 190,069 Supplemental Cash Flow Information: Non-cash investing and financing activities: Payment of dividend and proceeds from debt (Note 16) — 25,833 In-kind dividend to owner of the Company 12,321 36,957 Dividend declared (Note 3) — 12,321 Lease liabilities 140,741 — Proceeds and repayments of debt of more than three months (Note 16) 140,200 302,970
Mitsui & Co. (U.S.A.), Inc. Notes to Financial Statements as of and for the Years Ended March 31, 2020 and 2019 (In thousands, except where otherwise noted)
6
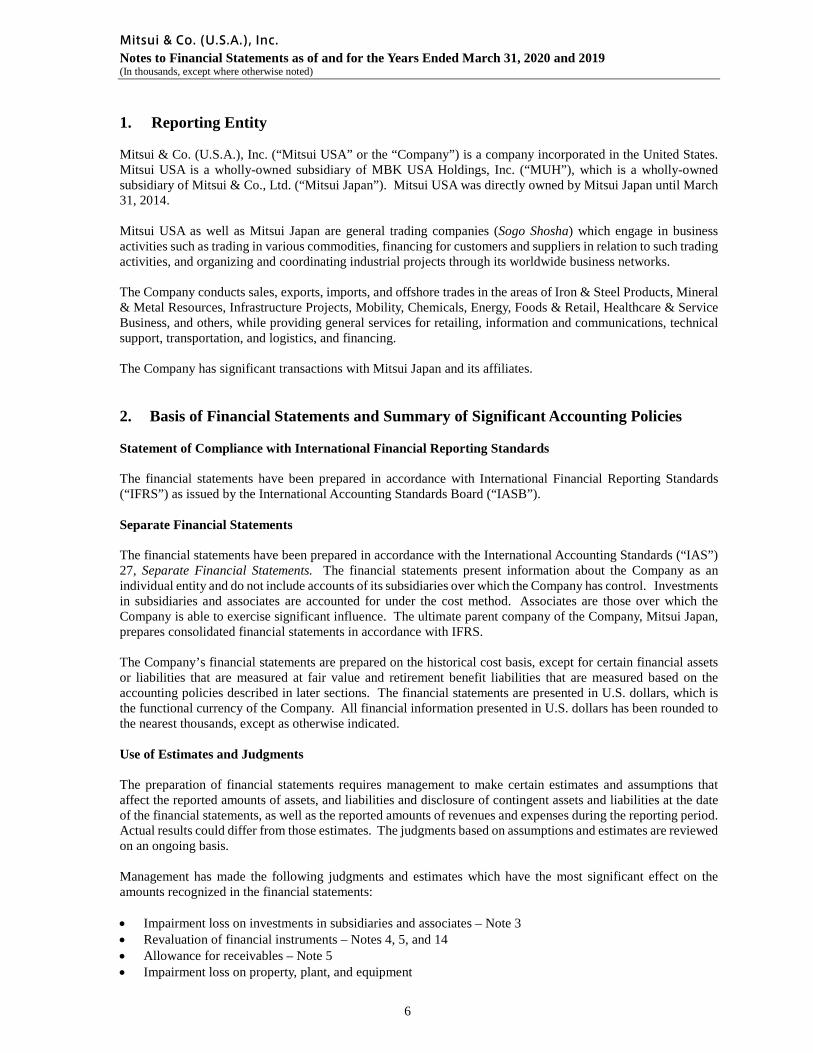
1. Reporting Entity Mitsui & Co. (U.S.A.), Inc. (“Mitsui USA” or the “Company”) is a company incorporated in the United States. Mitsui USA is a wholly-owned subsidiary of MBK USA Holdings, Inc. (“MUH”), which is a wholly-owned subsidiary of Mitsui & Co., Ltd. (“Mitsui Japan”). Mitsui USA was directly owned by Mitsui Japan until March 31, 2014. Mitsui USA as well as Mitsui Japan are general trading companies (Sogo Shosha) which engage in business activities such as trading in various commodities, financing for customers and suppliers in relation to such trading activities, and organizing and coordinating industrial projects through its worldwide business networks. The Company conducts sales, exports, imports, and offshore trades in the areas of Iron & Steel Products, Mineral & Metal Resources, Infrastructure Projects, Mobility, Chemicals, Energy, Foods & Retail, Healthcare & Service Business, and others, while providing general services for retailing, information and communications, technical support, transportation, and logistics, and financing. The Company has significant transactions with Mitsui Japan and its affiliates.
2. Basis of Financial Statements and Summary of Significant Accounting Policies Statement of Compliance with International Financial Reporting Standards The financial statements have been prepared in accordance with International Financial Reporting Standards (“IFRS”) as issued by the International Accounting Standards Board (“IASB”). Separate Financial Statements The financial statements have been prepared in accordance with the International Accounting Standards (“IAS”) 27, Separate Financial Statements. The financial statements present information about the Company as an individual entity and do not include accounts of its subsidiaries over which the Company has control. Investments in subsidiaries and associates are accounted for under the cost method. Associates are those over which the Company is able to exercise significant influence. The ultimate parent company of the Company, Mitsui Japan, prepares consolidated financial statements in accordance with IFRS. The Company’s financial statements are prepared on the historical cost basis, except for certain financial assets or liabilities that are measured at fair value and retirement benefit liabilities that are measured based on the accounting policies described in later sections. The financial statements are presented in U.S. dollars, which is the functional currency of the Company. All financial information presented in U.S. dollars has been rounded to the nearest thousands, except as otherwise indicated. Use of Estimates and Judgments The preparation of financial statements requires management to make certain estimates and assumptions that affect the reported amounts of assets, and liabilities and disclosure of contingent assets and liabilities at the date of the financial statements, as well as the reported amounts of revenues and expenses during the reporting period. Actual results could differ from those estimates. The judgments based on assumptions and estimates are reviewed on an ongoing basis. Management has made the following judgments and estimates which have the most significant effect on the amounts recognized in the financial statements: • Impairment loss on investments in subsidiaries and associates – Note 3 • Revaluation of financial instruments – Notes 4, 5, and 14 • Allowance for receivables – Note 5 • Impairment loss on property, plant, and equipment
Mitsui & Co. (U.S.A.), Inc. Notes to Financial Statements as of and for the Years Ended March 31, 2020 and 2019 (In thousands, except where otherwise noted)
7
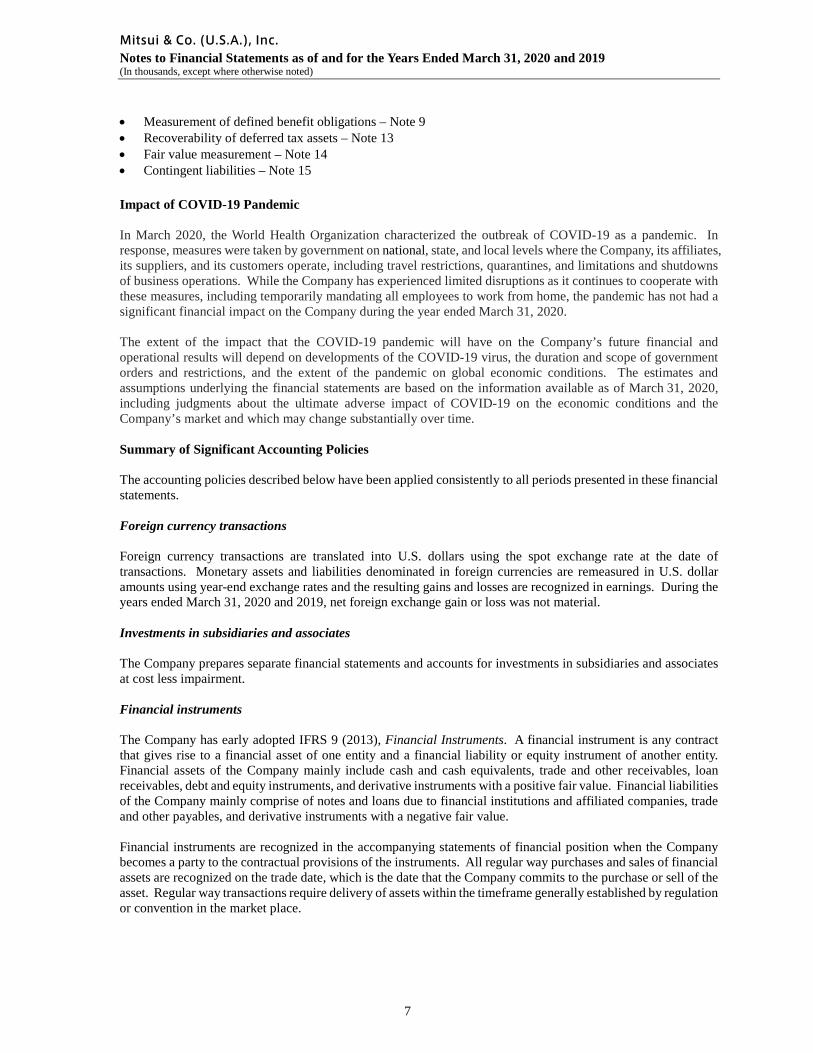
• Measurement of defined benefit obligations – Note 9 • Recoverability of deferred tax assets – Note 13 • Fair value measurement – Note 14 • Contingent liabilities – Note 15
Impact of COVID-19 Pandemic In March 2020, the World Health Organization characterized the outbreak of COVID-19 as a pandemic. In response, measures were taken by government on national, state, and local levels where the Company, its affiliates, its suppliers, and its customers operate, including travel restrictions, quarantines, and limitations and shutdowns of business operations. While the Company has experienced limited disruptions as it continues to cooperate with these measures, including temporarily mandating all employees to work from home, the pandemic has not had a significant financial impact on the Company during the year ended March 31, 2020.
The extent of the impact that the COVID-19 pandemic will have on the Company’s future financial and operational results will depend on developments of the COVID-19 virus, the duration and scope of government orders and restrictions, and the extent of the pandemic on global economic conditions. The estimates and assumptions underlying the financial statements are based on the information available as of March 31, 2020, including judgments about the ultimate adverse impact of COVID-19 on the economic conditions and the Company’s market and which may change substantially over time. Summary of Significant Accounting Policies The accounting policies described below have been applied consistently to all periods presented in these financial statements. Foreign currency transactions Foreign currency transactions are translated into U.S. dollars using the spot exchange rate at the date of transactions. Monetary assets and liabilities denominated in foreign currencies are remeasured in U.S. dollar amounts using year-end exchange rates and the resulting gains and losses are recognized in earnings. During the years ended March 31, 2020 and 2019, net foreign exchange gain or loss was not material. Investments in subsidiaries and associates The Company prepares separate financial statements and accounts for investments in subsidiaries and associates at cost less impairment.
Financial instruments The Company has early adopted IFRS 9 (2013), Financial Instruments. A financial instrument is any contract that gives rise to a financial asset of one entity and a financial liability or equity instrument of another entity. Financial assets of the Company mainly include cash and cash equivalents, trade and other receivables, loan receivables, debt and equity instruments, and derivative instruments with a positive fair value. Financial liabilities of the Company mainly comprise of notes and loans due to financial institutions and affiliated companies, trade and other payables, and derivative instruments with a negative fair value. Financial instruments are recognized in the accompanying statements of financial position when the Company becomes a party to the contractual provisions of the instruments. All regular way purchases and sales of financial assets are recognized on the trade date, which is the date that the Company commits to the purchase or sell of the asset. Regular way transactions require delivery of assets within the timeframe generally established by regulation or convention in the market place.
Mitsui & Co. (U.S.A.), Inc. Notes to Financial Statements as of and for the Years Ended March 31, 2020 and 2019 (In thousands, except where otherwise noted)
8
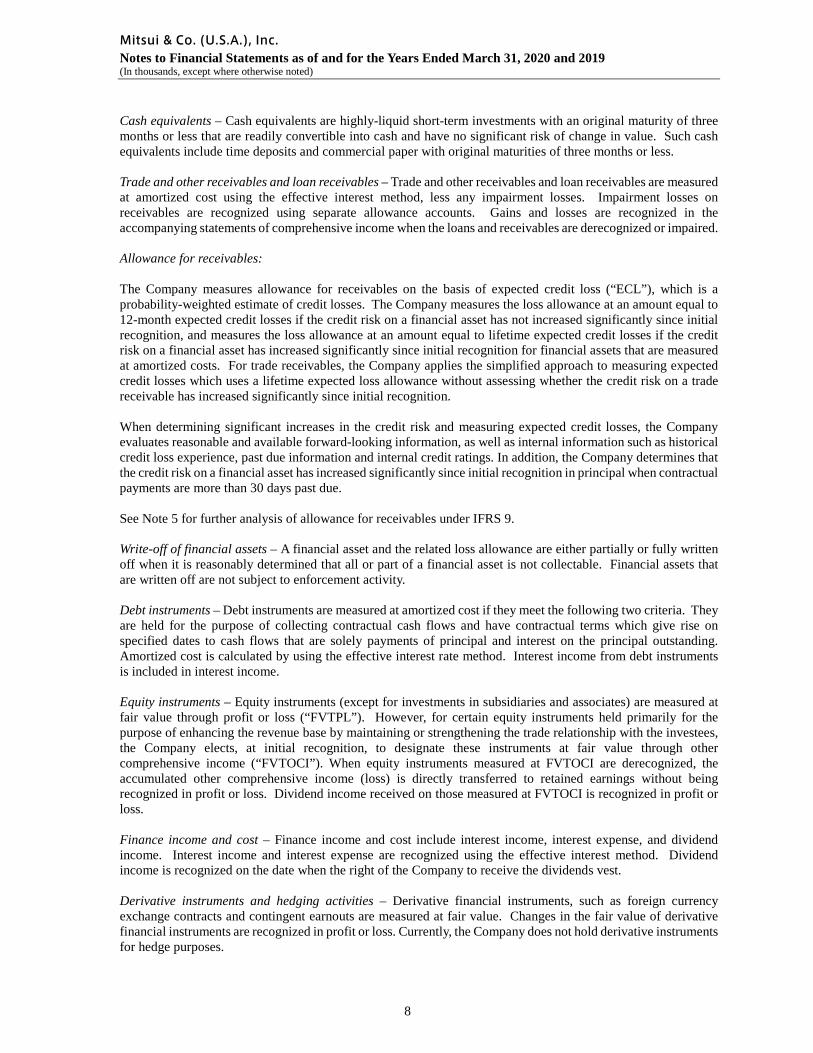
Cash equivalents – Cash equivalents are highly-liquid short-term investments with an original maturity of three months or less that are readily convertible into cash and have no significant risk of change in value. Such cash equivalents include time deposits and commercial paper with original maturities of three months or less. Trade and other receivables and loan receivables – Trade and other receivables and loan receivables are measured at amortized cost using the effective interest method, less any impairment losses. Impairment losses on receivables are recognized using separate allowance accounts. Gains and losses are recognized in the accompanying statements of comprehensive income when the loans and receivables are derecognized or impaired. Allowance for receivables: The Company measures allowance for receivables on the basis of expected credit loss (“ECL”), which is a probability-weighted estimate of credit losses. The Company measures the loss allowance at an amount equal to 12-month expected credit losses if the credit risk on a financial asset has not increased significantly since initial recognition, and measures the loss allowance at an amount equal to lifetime expected credit losses if the credit risk on a financial asset has increased significantly since initial recognition for financial assets that are measured at amortized costs. For trade receivables, the Company applies the simplified approach to measuring expected credit losses which uses a lifetime expected loss allowance without assessing whether the credit risk on a trade receivable has increased significantly since initial recognition. When determining significant increases in the credit risk and measuring expected credit losses, the Company evaluates reasonable and available forward-looking information, as well as internal information such as historical credit loss experience, past due information and internal credit ratings. In addition, the Company determines that the credit risk on a financial asset has increased significantly since initial recognition in principal when contractual payments are more than 30 days past due. See Note 5 for further analysis of allowance for receivables under IFRS 9. Write-off of financial assets – A financial asset and the related loss allowance are either partially or fully written off when it is reasonably determined that all or part of a financial asset is not collectable. Financial assets that are written off are not subject to enforcement activity. Debt instruments – Debt instruments are measured at amortized cost if they meet the following two criteria. They are held for the purpose of collecting contractual cash flows and have contractual terms which give rise on specified dates to cash flows that are solely payments of principal and interest on the principal outstanding. Amortized cost is calculated by using the effective interest rate method. Interest income from debt instruments is included in interest income. Equity instruments – Equity instruments (except for investments in subsidiaries and associates) are measured at fair value through profit or loss (“FVTPL”). However, for certain equity instruments held primarily for the purpose of enhancing the revenue base by maintaining or strengthening the trade relationship with the investees, the Company elects, at initial recognition, to designate these instruments at fair value through other comprehensive income (“FVTOCI”). When equity instruments measured at FVTOCI are derecognized, the accumulated other comprehensive income (loss) is directly transferred to retained earnings without being recognized in profit or loss. Dividend income received on those measured at FVTOCI is recognized in profit or loss.
Finance income and cost – Finance income and cost include interest income, interest expense, and dividend income. Interest income and interest expense are recognized using the effective interest method. Dividend income is recognized on the date when the right of the Company to receive the dividends vest. Derivative instruments and hedging activities – Derivative financial instruments, such as foreign currency exchange contracts and contingent earnouts are measured at fair value. Changes in the fair value of derivative financial instruments are recognized in profit or loss. Currently, the Company does not hold derivative instruments for hedge purposes.
Mitsui & Co. (U.S.A.), Inc. Notes to Financial Statements as of and for the Years Ended March 31, 2020 and 2019 (In thousands, except where otherwise noted)
9
Trade and other payable and debt – Trade and other payables and debt are measured at amortized cost. Offsetting financial assets and financial liabilities – Financial assets and financial liabilities are offset and the net amount is presented in the accompanying statements of financial position when, and only when, the Company currently has a legally enforceable right to set-off the recognized amounts and intends either to settle on a net basis, or to realize the asset and settle the liability simultaneously. Lease The Company adopted IFRS 16, Leases, effective April 1, 2019. The Company applied IFRS 16 using the modified retrospective approach, under which the cumulative effect of initial application is recognized in retained earnings at April 1, 2019. Accordingly, all prior year information is presented in accordance with the previous accounting policies. See below for policies applicable from and before April 1, 2019 and the impact on the transition. Policy applicable from April 1, 2019 i. As a lessee The Company recognizes a right-of-use asset and a lease liability at the lease commencement date. The right-of-use asset is initially measured at cost, which comprises the initial amount of the lease liability adjusted for any lease payments made at or before the commencement date, plus any initial direct costs incurred and an estimate of costs to dismantle and remove the underlying asset or to restore the underlying asset or the site on which it is located, less any lease incentives received. The right-of-use asset is subsequently depreciated using the straight-line method from the commencement date to the end of the lease term, unless the lease transfers ownership of the underlying asset to the Company by the end of the lease term or the cost of the right-of-use asset reflects that the Company will exercise a purchase option. In that case the right-of-use asset will be depreciated over the useful life of the underlying asset, which is determined on the same basis as those of property and equipment. In addition, the right-of-use asset is periodically reduced by impairment losses, if any, and adjusted for certain remeasurements of the lease liability. The lease liability is initially measured at the present value of the lease payments that are not paid at the commencement date, discounted using the interest rate implicit in the lease or, if that rate cannot be readily determined, the Company’s incremental borrowing rate. Generally, the Company uses its incremental borrowing rate as the discount rate. Lease payments included in the measurement of the lease liability comprise of fixed payments, lease payments in an optional renewal period if the Company is reasonably certain to exercise an extension option, and penalties for early termination of a lease unless the Company is reasonably certain not to terminate early. The Company determines its incremental borrowing rate by obtaining interest rates from various external financing sources and makes certain adjustments to reflect the terms of the lease and type of the asset leased. The Company presents right-of-use assets that do not meet the definition of investment property in ‘property, plant and equipment’ in the statement of financial position. Short-term leases and leases of low-value assets
The Company has elected not to recognize right-of-use assets and lease liabilities for leases of low-value assets and short-term leases. The Company recognizes the lease payments associated with these leases as an expense on a straight-line basis over the lease term. ii. As a lessor When the Company is an intermediate lessor, it accounts for its interests in the head lease and the sub-lease separately. It assesses the lease classification of a sub-lease with reference to the right-of-use asset arising from
Mitsui & Co. (U.S.A.), Inc. Notes to Financial Statements as of and for the Years Ended March 31, 2020 and 2019 (In thousands, except where otherwise noted)
10
the head lease, not with reference to the underlying asset. If a head lease is a short-term lease to which the Company applies the exemption described above, then it classifies the sub-lease as an operating lease. If an arrangement contains lease and non-lease components, then the Company applies IFRS 15, Revenue from Contracts with Customers, to allocate the consideration in the contract. The Company recognizes lease payments received under operating leases as other income on a straight-line basis over the lease term. Lease during the year ended March 31, 2019
The Company as lessee – Lease expenses on operating leases are recognized over the respective lease terms on a straight-line basis. The Company as lessor – The Company recognized lease payments received under operating leases as income on a straight-line basis over the lease term as part of revenue. Impact on transition On transition to IFRS 16, the Company elected to apply the practical expedient to grandfather the assessment of which transactions are leases. The Company applied IFRS 16 only to contracts that were previously identified as leases. Contracts that were not identified as leases under the previous accounting policies were not reassessed for whether there is a lease under IFRS 16. Therefore, the definition of a lease under IFRS 16 was applied only to contracts entered into or changed on or after April 1, 2019. On transition, lease liabilities were measured at the present value of the remaining lease payments, discounted at the Company’s incremental borrowing rate as at April 1, 2019. Right-of-use assets are measured at their carrying amount as if IFRS 16 had been applied since the commencement date, discounted using the Company’s incremental borrowing rate at the date of initial application. The Company has tested its right-of-use assets for impairment on the date of transition and has concluded that there is no indication that the right-of-use assets are impaired. The Company used a number of practical expedients when applying IFRS 16 to leases previously classified as operating leases under the previous accounting policy. In particular, the Company:
• did not recognize right-of-use assets and liabilities for leases for which the lease term ends within 12 months of the date of initial application;
• did not recognize right-of-use assets and liabilities for leases of low value assets; • excluded initial direct costs from the measurement of the right-of-use asset at the date of initial
application; • used a single discount rate to a portfolio of leases with reasonably similar characteristics; and • used hindsight when determining the lease term.
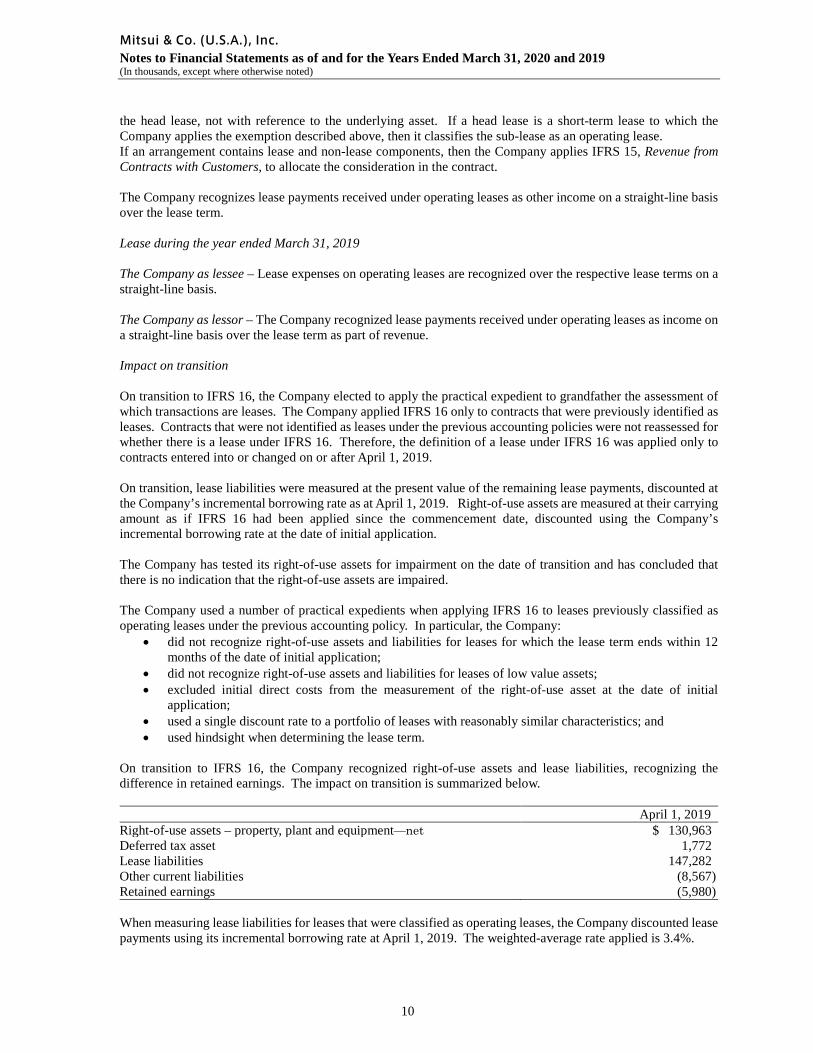
On transition to IFRS 16, the Company recognized right-of-use assets and lease liabilities, recognizing the difference in retained earnings. The impact on transition is summarized below. April 1, 2019 Right-of-use assets – property, plant and equipment—net $ 130,963 Deferred tax asset 1,772 Lease liabilities 147,282 Other current liabilities (8,567) Retained earnings (5,980) When measuring lease liabilities for leases that were classified as operating leases, the Company discounted lease payments using its incremental borrowing rate at April 1, 2019. The weighted-average rate applied is 3.4%.
Mitsui & Co. (U.S.A.), Inc. Notes to Financial Statements as of and for the Years Ended March 31, 2020 and 2019 (In thousands, except where otherwise noted)
11
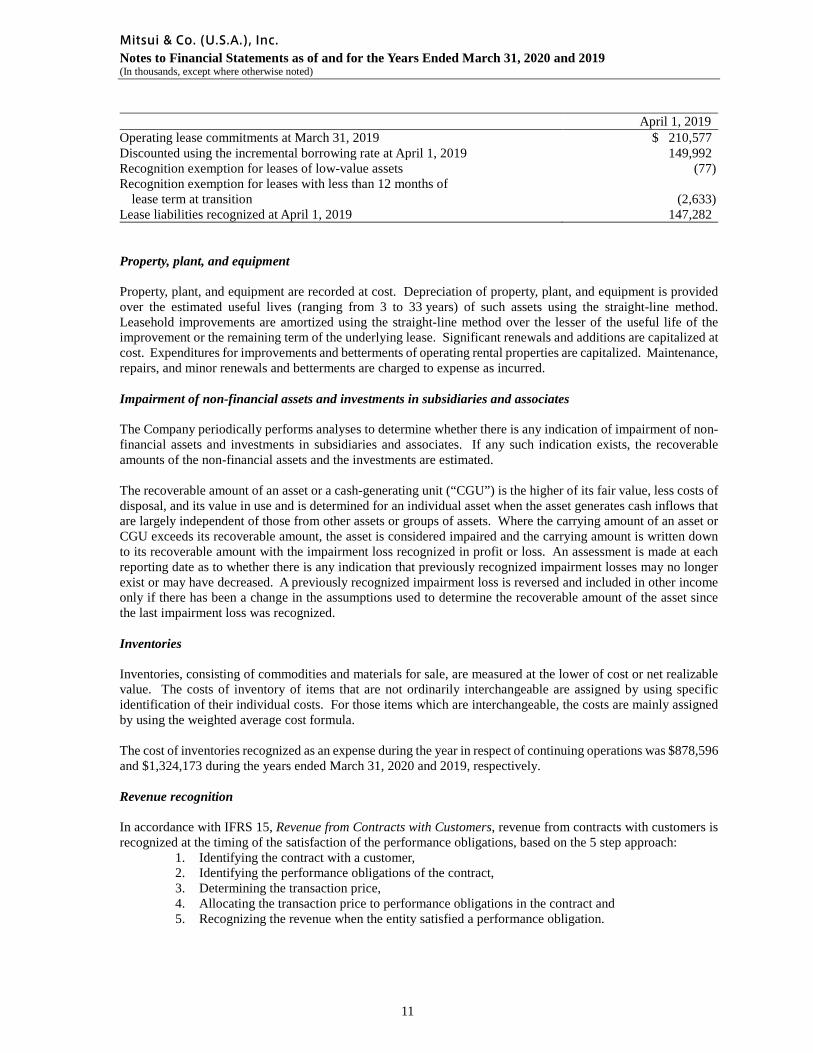
April 1, 2019 Operating lease commitments at March 31, 2019 $ 210,577 Discounted using the incremental borrowing rate at April 1, 2019 149,992 Recognition exemption for leases of low-value assets (77) Recognition exemption for leases with less than 12 months of lease term at transition
(2,633)
Lease liabilities recognized at April 1, 2019 147,282 Property, plant, and equipment Property, plant, and equipment are recorded at cost. Depreciation of property, plant, and equipment is provided over the estimated useful lives (ranging from 3 to 33 years) of such assets using the straight-line method. Leasehold improvements are amortized using the straight-line method over the lesser of the useful life of the improvement or the remaining term of the underlying lease. Significant renewals and additions are capitalized at cost. Expenditures for improvements and betterments of operating rental properties are capitalized. Maintenance, repairs, and minor renewals and betterments are charged to expense as incurred. Impairment of non-financial assets and investments in subsidiaries and associates The Company periodically performs analyses to determine whether there is any indication of impairment of non-financial assets and investments in subsidiaries and associates. If any such indication exists, the recoverable amounts of the non-financial assets and the investments are estimated. The recoverable amount of an asset or a cash-generating unit (“CGU”) is the higher of its fair value, less costs of disposal, and its value in use and is determined for an individual asset when the asset generates cash inflows that are largely independent of those from other assets or groups of assets. Where the carrying amount of an asset or CGU exceeds its recoverable amount, the asset is considered impaired and the carrying amount is written down to its recoverable amount with the impairment loss recognized in profit or loss. An assessment is made at each reporting date as to whether there is any indication that previously recognized impairment losses may no longer exist or may have decreased. A previously recognized impairment loss is reversed and included in other income only if there has been a change in the assumptions used to determine the recoverable amount of the asset since the last impairment loss was recognized. Inventories Inventories, consisting of commodities and materials for sale, are measured at the lower of cost or net realizable value. The costs of inventory of items that are not ordinarily interchangeable are assigned by using specific identification of their individual costs. For those items which are interchangeable, the costs are mainly assigned by using the weighted average cost formula. The cost of inventories recognized as an expense during the year in respect of continuing operations was $878,596 and $1,324,173 during the years ended March 31, 2020 and 2019, respectively. Revenue recognition In accordance with IFRS 15, Revenue from Contracts with Customers, revenue from contracts with customers is recognized at the timing of the satisfaction of the performance obligations, based on the 5 step approach:
1. Identifying the contract with a customer, 2. Identifying the performance obligations of the contract, 3. Determining the transaction price, 4. Allocating the transaction price to performance obligations in the contract and 5. Recognizing the revenue when the entity satisfied a performance obligation.
Mitsui & Co. (U.S.A.), Inc. Notes to Financial Statements as of and for the Years Ended March 31, 2020 and 2019 (In thousands, except where otherwise noted)
12
Upon the identification of the performance obligations of the contract, the Company determines whether the Company is a principal or an agent in the transactions. If the nature of its promise is a performance obligation to provide specified goods or services as a principal, revenue is recognized in gross amounts. If the nature of its promise is a performance obligation as an agent to arrange goods or services provided by another party, revenue is recognized at the amount of any fees or net of sales and purchase prices.
The Company satisfies a performance obligation and recognizes revenue for all of its transactions at a point in time when control of the goods passes to the customers. This can be at the time of dispatch, delivery, or upon customer acceptance, depending on individual customer terms for domestic transactions, or determined by incoterms for international transactions. Invoices are generated at that point in time and are usually due within 30 or 60 days. No discounts or returns are normally offered in the Company’s contracts with customers. Employee benefits The cost of providing benefits under the defined benefit plans is determined using the projected unit credit method, which attributes entitlement to benefits to the current period (to determine current service cost) and to the current and prior periods (to determine the present value of defined benefit obligations) and is based on actuarial advice. Past service costs are recognized immediately as part of the current service cost. When a plan amendment, settlement (eliminating all obligations for benefits already accrued), or a curtailment (reducing future obligations as a result of a significant reduction in the plan membership or a reduction in future entitlement) occurs, the obligations and related plan assets are remeasured using current actuarial assumptions and the resulting gain or loss recognized in earnings during the period in which the plan amendment, settlement, or curtailment occurs. The interest element of the defined benefit cost represents the change in present value of plan obligations resulting from the passage of time, and is determined by applying the discount rate to the opening present value of the benefit obligations, taking into account material changes in the obligations during the year. The expected return on plan assets is based on a long-term market return assumption that is automatically set equal to the discount rate used to value the benefit obligations, and then adjusted for the effect on the fair value of plan assets of contributions received and benefits paid during the year. All components of net pension cost are presented as a single net amount and included in selling, general, and administrative expenses in the accompanying statements of comprehensive income. The remeasurements of defined benefit plans are recognized in other comprehensive income (loss) and are transferred immediately to retained earnings. Retirement benefit liabilities in the accompanying statements of financial position comprise the total of the present value of the defined benefit obligations, less the fair value of plan assets out of which the obligations are to be settled directly. The Company and certain participating affiliated companies share the costs of the defined benefit pension plan. See Note 9 for further discussion. The Company also has defined contribution plans. Payments to defined contribution plans are recognized as an expense when employees have rendered service. Income taxes The Company records income taxes based on IAS 12, Income Taxes. Income taxes comprise current taxes and deferred taxes. Income tax expense is calculated based on profit before income taxes. Deferred income taxes reflect the impact of temporary differences between assets and liabilities recognized for financial reporting purposes and their tax bases, tax loss carryforwards, and tax credit carryforwards. These deferred income taxes are measured using the currently enacted or substantively enacted tax rates in effect for the year in which the temporary differences, tax loss carryforwards, or tax credit carryforwards are expected to reverse. Deferred tax assets are recognized only with respect to unused tax losses, unused tax credits, and deductible temporary differences where it is probable to reduce future taxable income. The recoverability of deferred tax
Mitsui & Co. (U.S.A.), Inc. Notes to Financial Statements as of and for the Years Ended March 31, 2020 and 2019 (In thousands, except where otherwise noted)
13
assets is reviewed at the end of each period and the Company reduces the carrying amount of a deferred tax asset to the extent that it is no longer probable that sufficient taxable profit will be available to allow the benefit of part or all of that deferred tax asset to be utilized. Deferred tax liabilities arising from taxable temporary differences concerning investments in subsidiaries and associates are recognized unless the Company is able to control the timing of the reversal of the temporary differences and it is probable that the temporary difference will not reverse in the foreseeable future. From April 1, 2014, the Company joined the MUH federal consolidated tax group, and the Company’s operations are included in the consolidated federal income tax return of MUH. The Company records its current and deferred income tax provision as if it were a separate taxable entity. The Company includes in its income tax provision the tax effect of profits and losses of partnerships and limited liability companies that do not have a tax sharing agreement with the Company. The Company recognizes uncertain tax positions in income taxes in the financial statements when it is probable that an economic outflow would occur if the tax positions were examined and challenged by tax authorities. Provisions Provisions are recognized when the Company has a present obligation (legal or constructive) as a result of a past event, it is probable that outflows of resources embodying economic benefits will be required to settle the obligation, and the reliable estimates of the amount of the obligation can be made. Provisions are measured as the best estimate of the amount of expenditure required to settle the present obligation at the end of the reporting period. If the effect of the time value of money is material, provisions are discounted to their present value using a pre-tax rate that reflects current market assessments of the time value of money and the risks specific to the liability. The unwinding of the discount is recognized as finance costs. Financial guarantees
A financial guarantee contract is a contract that requires the Company to make specified payments to reimburse the holder for a loss it incurs because a specified debtor fails to make payment when due. Financial guarantee contracts are initially recognized at fair value and are subsequently measured at the greater of the best estimate of the likely outflow and the amount initially recognized less, where appropriate, cumulative amortization.
New Accounting Standards
In January 2020, the IASB issued Classification of Liabilities as Current or Non-Current (Amendments to IAS 1) providing a more general approach to the classification of liabilities under IAS 1 based on the contractual arrangements in place at the reporting date. The amendments are effective for the Company from the fiscal year beginning April 1, 2022, with earlier application permitted. The Company is currently evaluating the impact of adoption of these amendments on its financial statements.
Mitsui & Co. (U.S.A.), Inc. Notes to Financial Statements as of and for the Years Ended March 31, 2020 and 2019 (In thousands, except where otherwise noted)
14
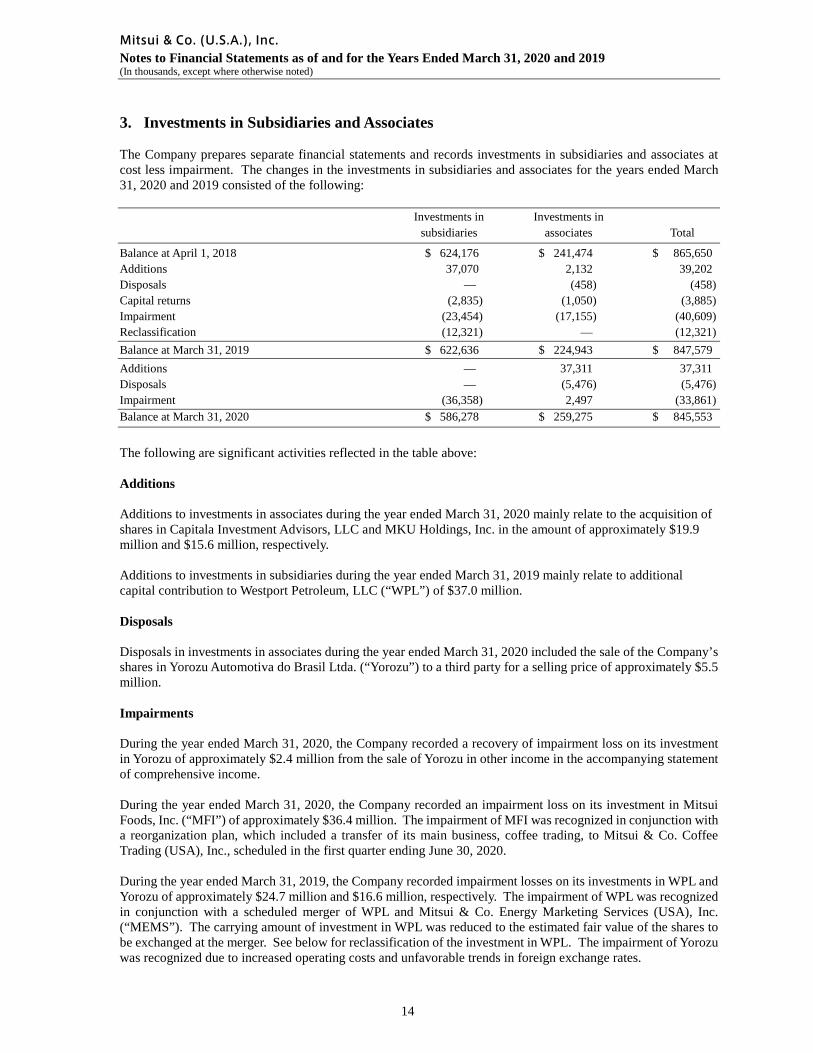
3. Investments in Subsidiaries and Associates The Company prepares separate financial statements and records investments in subsidiaries and associates at cost less impairment. The changes in the investments in subsidiaries and associates for the years ended March 31, 2020 and 2019 consisted of the following: Investments in Investments in subsidiaries associates Total
Balance at April 1, 2018 $ 624,176 $ 241,474 $ 865,650 Additions 37,070 2,132 39,202 Disposals — (458) (458) Capital returns (2,835) (1,050) (3,885) Impairment (23,454) (17,155) (40,609) Reclassification (12,321) — (12,321) Balance at March 31, 2019 $ 622,636 $ 224,943 $ 847,579 Additions — 37,311 37,311 Disposals — (5,476) (5,476) Impairment (36,358) 2,497 (33,861) Balance at March 31, 2020 $ 586,278 $ 259,275 $ 845,553
The following are significant activities reflected in the table above: Additions Additions to investments in associates during the year ended March 31, 2020 mainly relate to the acquisition of shares in Capitala Investment Advisors, LLC and MKU Holdings, Inc. in the amount of approximately $19.9 million and $15.6 million, respectively. Additions to investments in subsidiaries during the year ended March 31, 2019 mainly relate to additional capital contribution to Westport Petroleum, LLC (“WPL”) of $37.0 million. Disposals
Disposals in investments in associates during the year ended March 31, 2020 included the sale of the Company’s shares in Yorozu Automotiva do Brasil Ltda. (“Yorozu”) to a third party for a selling price of approximately $5.5 million. Impairments During the year ended March 31, 2020, the Company recorded a recovery of impairment loss on its investment in Yorozu of approximately $2.4 million from the sale of Yorozu in other income in the accompanying statement of comprehensive income. During the year ended March 31, 2020, the Company recorded an impairment loss on its investment in Mitsui Foods, Inc. (“MFI”) of approximately $36.4 million. The impairment of MFI was recognized in conjunction with a reorganization plan, which included a transfer of its main business, coffee trading, to Mitsui & Co. Coffee Trading (USA), Inc., scheduled in the first quarter ending June 30, 2020. During the year ended March 31, 2019, the Company recorded impairment losses on its investments in WPL and Yorozu of approximately $24.7 million and $16.6 million, respectively. The impairment of WPL was recognized in conjunction with a scheduled merger of WPL and Mitsui & Co. Energy Marketing Services (USA), Inc. (“MEMS”). The carrying amount of investment in WPL was reduced to the estimated fair value of the shares to be exchanged at the merger. See below for reclassification of the investment in WPL. The impairment of Yorozu was recognized due to increased operating costs and unfavorable trends in foreign exchange rates.
Mitsui & Co. (U.S.A.), Inc. Notes to Financial Statements as of and for the Years Ended March 31, 2020 and 2019 (In thousands, except where otherwise noted)
15
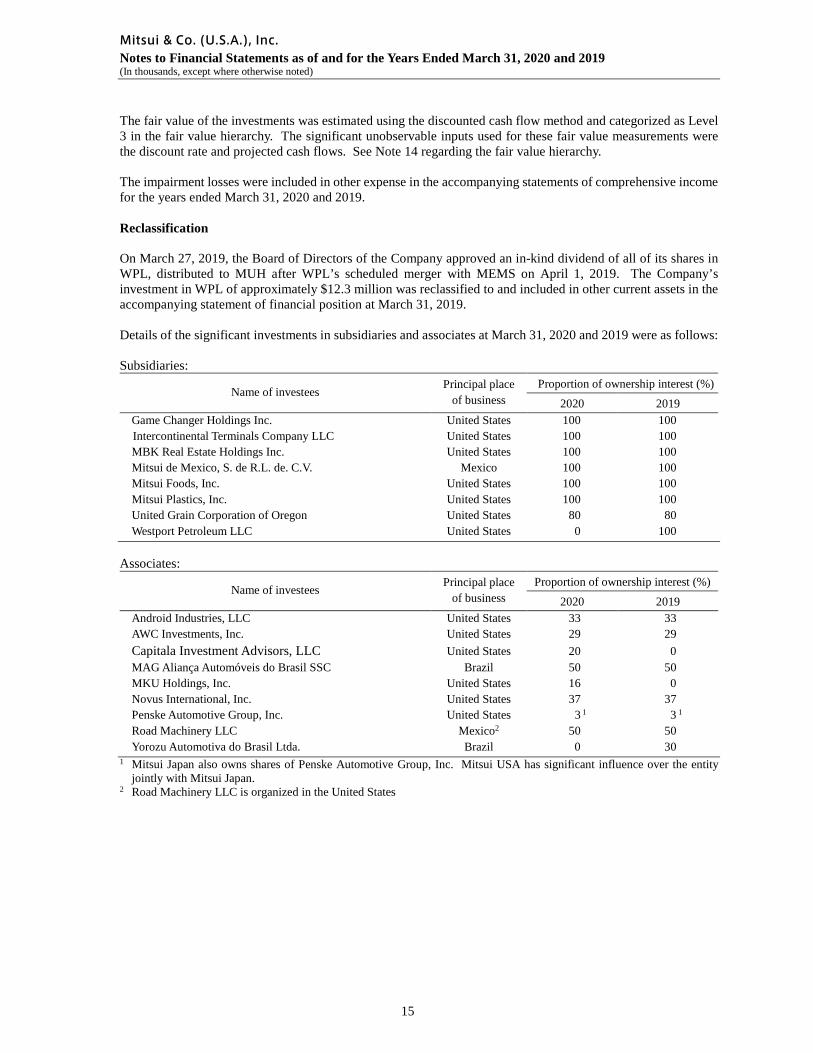
The fair value of the investments was estimated using the discounted cash flow method and categorized as Level 3 in the fair value hierarchy. The significant unobservable inputs used for these fair value measurements were the discount rate and projected cash flows. See Note 14 regarding the fair value hierarchy. The impairment losses were included in other expense in the accompanying statements of comprehensive income for the years ended March 31, 2020 and 2019. Reclassification On March 27, 2019, the Board of Directors of the Company approved an in-kind dividend of all of its shares in WPL, distributed to MUH after WPL’s scheduled merger with MEMS on April 1, 2019. The Company’s investment in WPL of approximately $12.3 million was reclassified to and included in other current assets in the accompanying statement of financial position at March 31, 2019. Details of the significant investments in subsidiaries and associates at March 31, 2020 and 2019 were as follows: Subsidiaries:
Name of investees Principal place
of business Proportion of ownership interest (%)
2020 2019 Game Changer Holdings Inc. United States 100 100 Intercontinental Terminals Company LLC United States 100 100 MBK Real Estate Holdings Inc. United States 100 100 Mitsui de Mexico, S. de R.L. de. C.V. Mexico 100 100 Mitsui Foods, Inc. United States 100 100 Mitsui Plastics, Inc. United States 100 100 United Grain Corporation of Oregon United States 80 80 Westport Petroleum LLC United States 0 100
Associates:
Name of investees Principal place of business
Proportion of ownership interest (%) 2020 2019
Android Industries, LLC United States 33 33 AWC Investments, Inc. United States 29 29 Capitala Investment Advisors, LLC United States 20 0 MAG Aliança Automóveis do Brasil SSC Brazil 50 50 MKU Holdings, Inc. United States 16 0 Novus International, Inc. United States 37 37 Penske Automotive Group, Inc. United States 3 1 3 1 Road Machinery LLC Mexico2 50 50 Yorozu Automotiva do Brasil Ltda. Brazil 0 30
1 Mitsui Japan also owns shares of Penske Automotive Group, Inc. Mitsui USA has significant influence over the entity jointly with Mitsui Japan.
2 Road Machinery LLC is organized in the United States
Mitsui & Co. (U.S.A.), Inc. Notes to Financial Statements as of and for the Years Ended March 31, 2020 and 2019 (In thousands, except where otherwise noted)
16
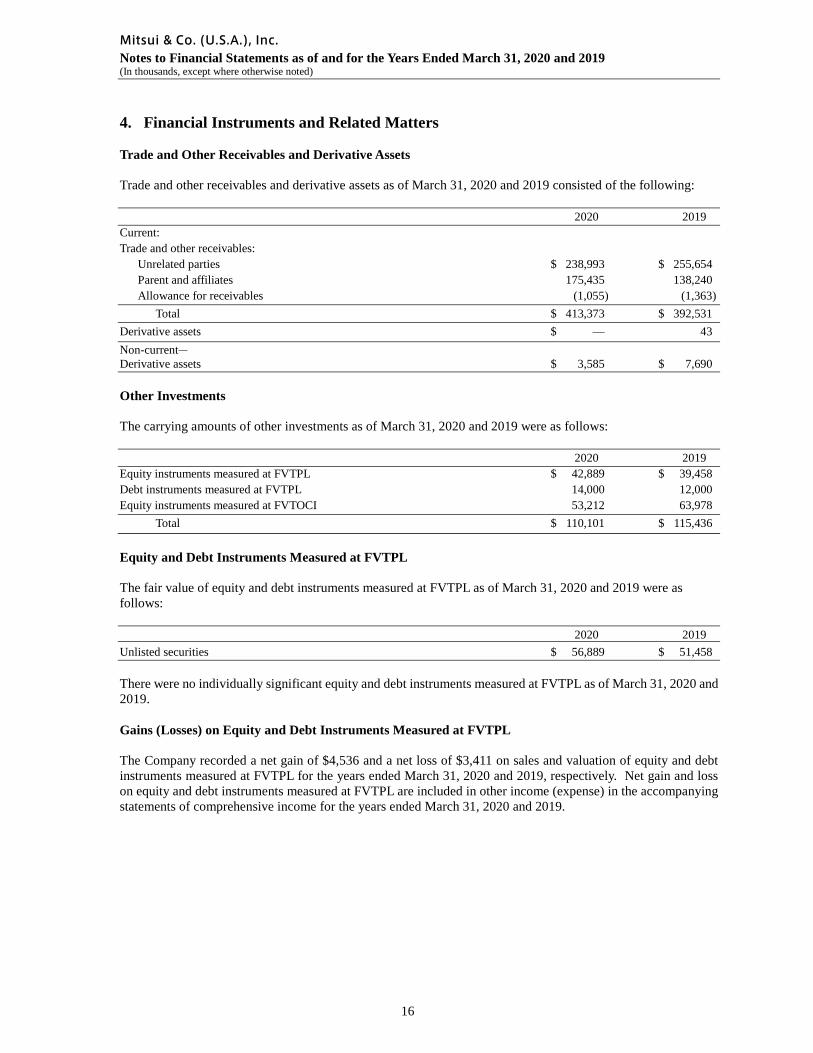
4. Financial Instruments and Related Matters Trade and Other Receivables and Derivative Assets Trade and other receivables and derivative assets as of March 31, 2020 and 2019 consisted of the following: 2020 2019 Current: Trade and other receivables: Unrelated parties $ 238,993 $ 255,654 Parent and affiliates 175,435 138,240
Allowance for receivables (1,055) (1,363) Total $ 413,373 $ 392,531 Derivative assets $ — 43 Non-current― Derivative assets $ 3,585 $ 7,690 Other Investments The carrying amounts of other investments as of March 31, 2020 and 2019 were as follows: 2020 2019 Equity instruments measured at FVTPL $ 42,889 $ 39,458 Debt instruments measured at FVTPL 14,000 12,000 Equity instruments measured at FVTOCI 53,212 63,978 Total $ 110,101 $ 115,436
Equity and Debt Instruments Measured at FVTPL The fair value of equity and debt instruments measured at FVTPL as of March 31, 2020 and 2019 were as follows: 2020 2019 Unlisted securities $ 56,889 $ 51,458
There were no individually significant equity and debt instruments measured at FVTPL as of March 31, 2020 and 2019. Gains (Losses) on Equity and Debt Instruments Measured at FVTPL
The Company recorded a net gain of $4,536 and a net loss of $3,411 on sales and valuation of equity and debt instruments measured at FVTPL for the years ended March 31, 2020 and 2019, respectively. Net gain and loss on equity and debt instruments measured at FVTPL are included in other income (expense) in the accompanying statements of comprehensive income for the years ended March 31, 2020 and 2019.
Mitsui & Co. (U.S.A.), Inc. Notes to Financial Statements as of and for the Years Ended March 31, 2020 and 2019 (In thousands, except where otherwise noted)
17
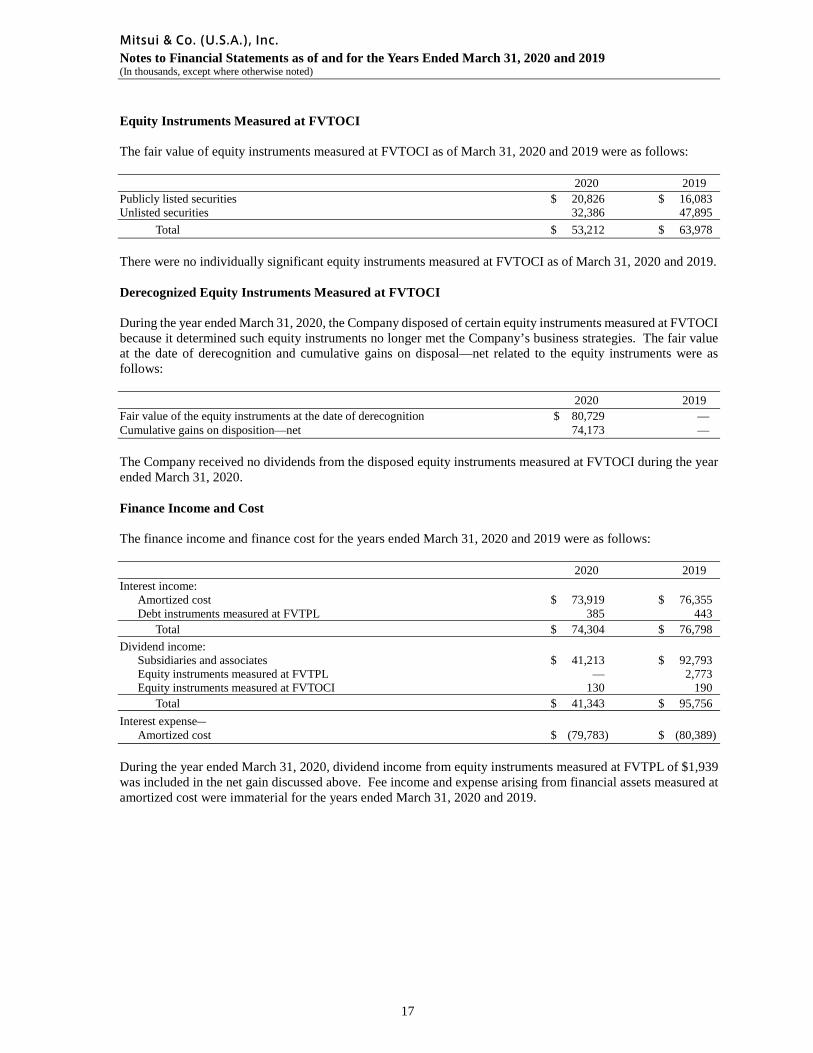
Equity Instruments Measured at FVTOCI The fair value of equity instruments measured at FVTOCI as of March 31, 2020 and 2019 were as follows: 2020 2019 Publicly listed securities $ 20,826 $ 16,083 Unlisted securities 32,386 47,895 Total $ 53,212 $ 63,978
There were no individually significant equity instruments measured at FVTOCI as of March 31, 2020 and 2019. Derecognized Equity Instruments Measured at FVTOCI During the year ended March 31, 2020, the Company disposed of certain equity instruments measured at FVTOCI because it determined such equity instruments no longer met the Company’s business strategies. The fair value at the date of derecognition and cumulative gains on disposal—net related to the equity instruments were as follows: 2020 2019 Fair value of the equity instruments at the date of derecognition $ 80,729 — Cumulative gains on disposition—net 74,173 —
The Company received no dividends from the disposed equity instruments measured at FVTOCI during the year ended March 31, 2020. Finance Income and Cost
The finance income and finance cost for the years ended March 31, 2020 and 2019 were as follows: 2020 2019 Interest income:
Amortized cost $ 73,919 $ 76,355 Debt instruments measured at FVTPL 385 443
Total $ 74,304 $ 76,798 Dividend income: Subsidiaries and associates $ 41,213 $ 92,793 Equity instruments measured at FVTPL — 2,773 Equity instruments measured at FVTOCI 130 190 Total $ 41,343 $ 95,756 Interest expense― Amortized cost $ (79,783) $ (80,389) During the year ended March 31, 2020, dividend income from equity instruments measured at FVTPL of $1,939 was included in the net gain discussed above. Fee income and expense arising from financial assets measured at amortized cost were immaterial for the years ended March 31, 2020 and 2019.
Mitsui & Co. (U.S.A.), Inc. Notes to Financial Statements as of and for the Years Ended March 31, 2020 and 2019 (In thousands, except where otherwise noted)
18
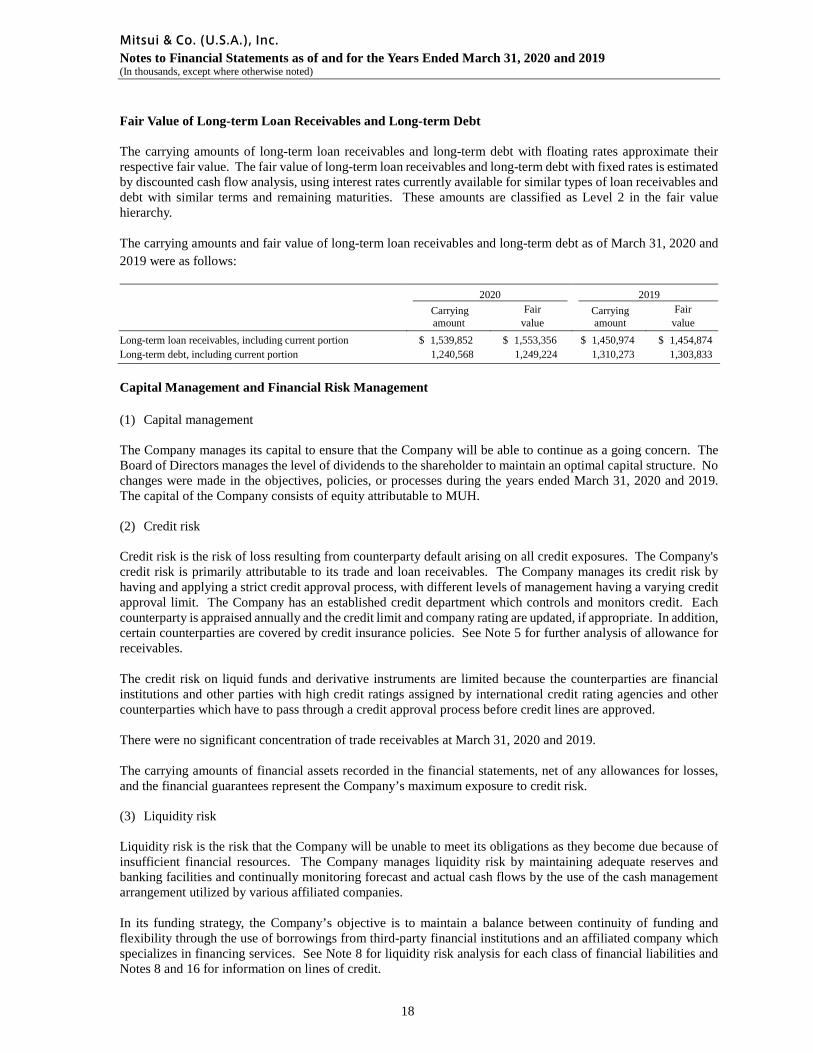
Fair Value of Long-term Loan Receivables and Long-term Debt The carrying amounts of long-term loan receivables and long-term debt with floating rates approximate their respective fair value. The fair value of long-term loan receivables and long-term debt with fixed rates is estimated by discounted cash flow analysis, using interest rates currently available for similar types of loan receivables and debt with similar terms and remaining maturities. These amounts are classified as Level 2 in the fair value hierarchy. The carrying amounts and fair value of long-term loan receivables and long-term debt as of March 31, 2020 and 2019 were as follows:
2020 2019
Carrying amount
Fair value
Carrying amount
Fair value
Long-term loan receivables, including current portion $ 1,539,852 $ 1,553,356 $ 1,450,974 $ 1,454,874 Long-term debt, including current portion 1,240,568 1,249,224 1,310,273 1,303,833
Capital Management and Financial Risk Management (1) Capital management The Company manages its capital to ensure that the Company will be able to continue as a going concern. The Board of Directors manages the level of dividends to the shareholder to maintain an optimal capital structure. No changes were made in the objectives, policies, or processes during the years ended March 31, 2020 and 2019. The capital of the Company consists of equity attributable to MUH. (2) Credit risk Credit risk is the risk of loss resulting from counterparty default arising on all credit exposures. The Company's credit risk is primarily attributable to its trade and loan receivables. The Company manages its credit risk by having and applying a strict credit approval process, with different levels of management having a varying credit approval limit. The Company has an established credit department which controls and monitors credit. Each counterparty is appraised annually and the credit limit and company rating are updated, if appropriate. In addition, certain counterparties are covered by credit insurance policies. See Note 5 for further analysis of allowance for receivables. The credit risk on liquid funds and derivative instruments are limited because the counterparties are financial institutions and other parties with high credit ratings assigned by international credit rating agencies and other counterparties which have to pass through a credit approval process before credit lines are approved. There were no significant concentration of trade receivables at March 31, 2020 and 2019. The carrying amounts of financial assets recorded in the financial statements, net of any allowances for losses, and the financial guarantees represent the Company’s maximum exposure to credit risk. (3) Liquidity risk Liquidity risk is the risk that the Company will be unable to meet its obligations as they become due because of insufficient financial resources. The Company manages liquidity risk by maintaining adequate reserves and banking facilities and continually monitoring forecast and actual cash flows by the use of the cash management arrangement utilized by various affiliated companies. In its funding strategy, the Company’s objective is to maintain a balance between continuity of funding and flexibility through the use of borrowings from third-party financial institutions and an affiliated company which specializes in financing services. See Note 8 for liquidity risk analysis for each class of financial liabilities and Notes 8 and 16 for information on lines of credit.
Mitsui & Co. (U.S.A.), Inc. Notes to Financial Statements as of and for the Years Ended March 31, 2020 and 2019 (In thousands, except where otherwise noted)
19
(4) Interest rate risk The Company is exposed to interest rate risk arising from floating-rate assets and liabilities. An increase in interest rates may adversely affect its operating results. The impact on profit before income taxes assuming a 1% rise in interest rates is a lower profit of approximately $6.2 million and $7.0 million for the years ended March 31, 2020 and 2019, respectively. This sensitivity analysis is calculated by multiplying the net amounts of floating-rate financial assets and liabilities as of March 31, 2020 and 2019 by 1%, without considering future changes in the balance, the effect of exchange rate fluctuations, or the diversification effect of the timing of refinancing/interest rate revisions of floating-rate debts and assuming that all other variables are constant. The instruments that are included in the sensitivity analysis include floating-rate interest-bearing loan receivables and debt, fixed-rate interest-bearing loan receivables and debt, and cash and cash equivalents.
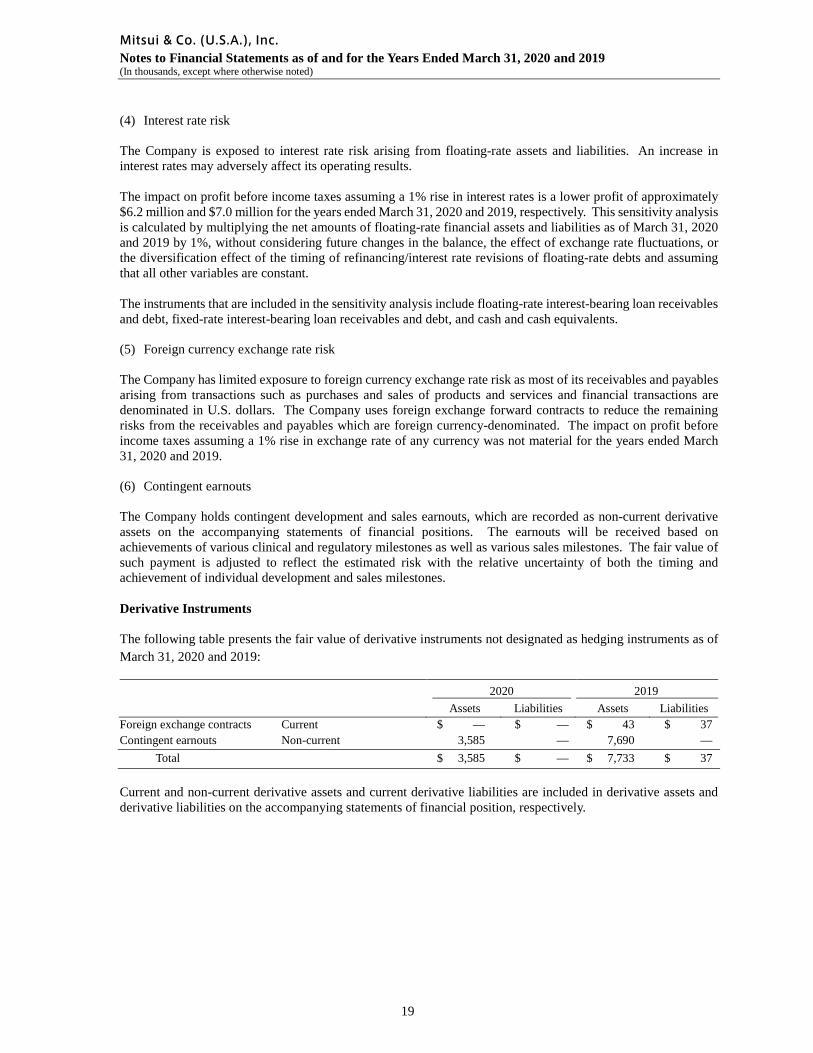
(5) Foreign currency exchange rate risk The Company has limited exposure to foreign currency exchange rate risk as most of its receivables and payables arising from transactions such as purchases and sales of products and services and financial transactions are denominated in U.S. dollars. The Company uses foreign exchange forward contracts to reduce the remaining risks from the receivables and payables which are foreign currency-denominated. The impact on profit before income taxes assuming a 1% rise in exchange rate of any currency was not material for the years ended March 31, 2020 and 2019. (6) Contingent earnouts The Company holds contingent development and sales earnouts, which are recorded as non-current derivative assets on the accompanying statements of financial positions. The earnouts will be received based on achievements of various clinical and regulatory milestones as well as various sales milestones. The fair value of such payment is adjusted to reflect the estimated risk with the relative uncertainty of both the timing and achievement of individual development and sales milestones. Derivative Instruments The following table presents the fair value of derivative instruments not designated as hedging instruments as of March 31, 2020 and 2019:
2020 2019 Assets Liabilities Assets Liabilities
Foreign exchange contracts Current $ — $ — $ 43 $ 37 Contingent earnouts Non-current 3,585 — 7,690 — Total $ 3,585 $ — $ 7,733 $ 37
Current and non-current derivative assets and current derivative liabilities are included in derivative assets and derivative liabilities on the accompanying statements of financial position, respectively.
Mitsui & Co. (U.S.A.), Inc. Notes to Financial Statements as of and for the Years Ended March 31, 2020 and 2019 (In thousands, except where otherwise noted)
20
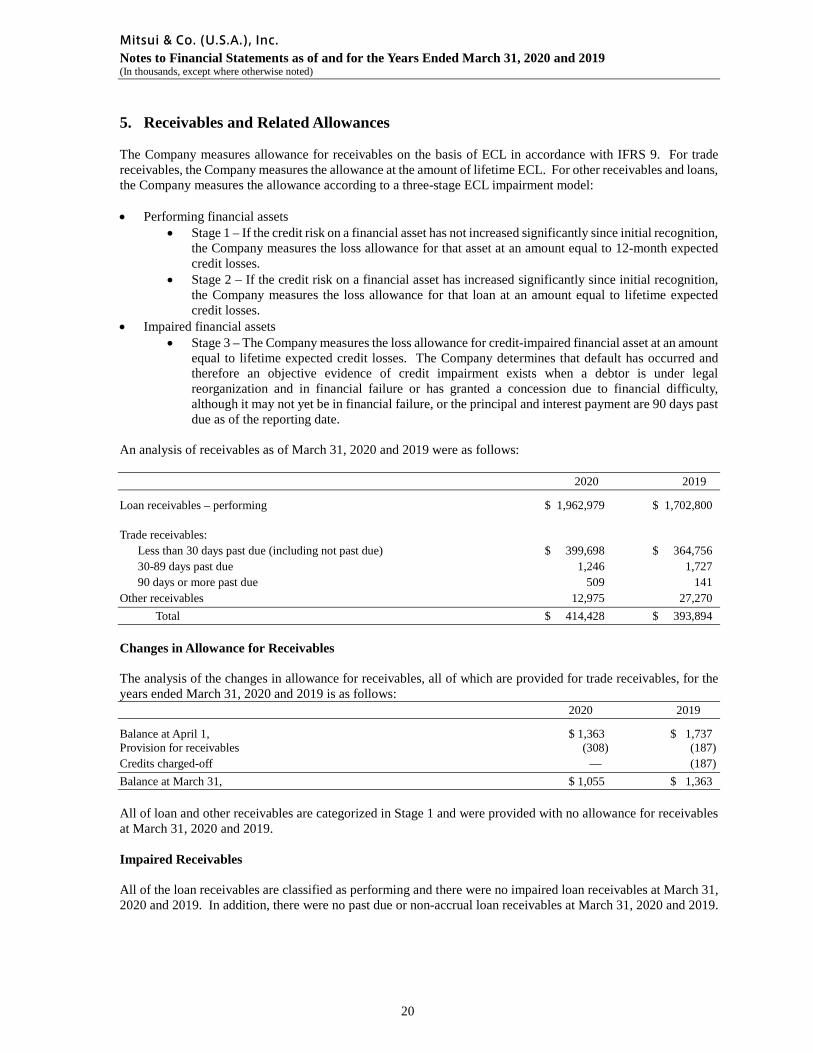
5. Receivables and Related Allowances The Company measures allowance for receivables on the basis of ECL in accordance with IFRS 9. For trade receivables, the Company measures the allowance at the amount of lifetime ECL. For other receivables and loans, the Company measures the allowance according to a three-stage ECL impairment model: • Performing financial assets
• Stage 1 – If the credit risk on a financial asset has not increased significantly since initial recognition, the Company measures the loss allowance for that asset at an amount equal to 12-month expected credit losses.
• Stage 2 – If the credit risk on a financial asset has increased significantly since initial recognition, the Company measures the loss allowance for that loan at an amount equal to lifetime expected credit losses.
• Impaired financial assets • Stage 3 – The Company measures the loss allowance for credit-impaired financial asset at an amount
equal to lifetime expected credit losses. The Company determines that default has occurred and therefore an objective evidence of credit impairment exists when a debtor is under legal reorganization and in financial failure or has granted a concession due to financial difficulty, although it may not yet be in financial failure, or the principal and interest payment are 90 days past due as of the reporting date.
An analysis of receivables as of March 31, 2020 and 2019 were as follows: 2020 2019
Loan receivables – performing $ 1,962,979 $ 1,702,800 Trade receivables: Less than 30 days past due (including not past due) $ 399,698 $ 364,756 30-89 days past due 1,246 1,727 90 days or more past due 509 141 Other receivables 12,975 27,270 Total $ 414,428 $ 393,894 Changes in Allowance for Receivables The analysis of the changes in allowance for receivables, all of which are provided for trade receivables, for the years ended March 31, 2020 and 2019 is as follows: 2020 2019
Balance at April 1, $ 1,363 $ 1,737 Provision for receivables (308) (187) Credits charged-off — (187) Balance at March 31, $ 1,055 $ 1,363 All of loan and other receivables are categorized in Stage 1 and were provided with no allowance for receivables at March 31, 2020 and 2019. Impaired Receivables All of the loan receivables are classified as performing and there were no impaired loan receivables at March 31, 2020 and 2019. In addition, there were no past due or non-accrual loan receivables at March 31, 2020 and 2019.
Mitsui & Co. (U.S.A.), Inc. Notes to Financial Statements as of and for the Years Ended March 31, 2020 and 2019 (In thousands, except where otherwise noted)
21
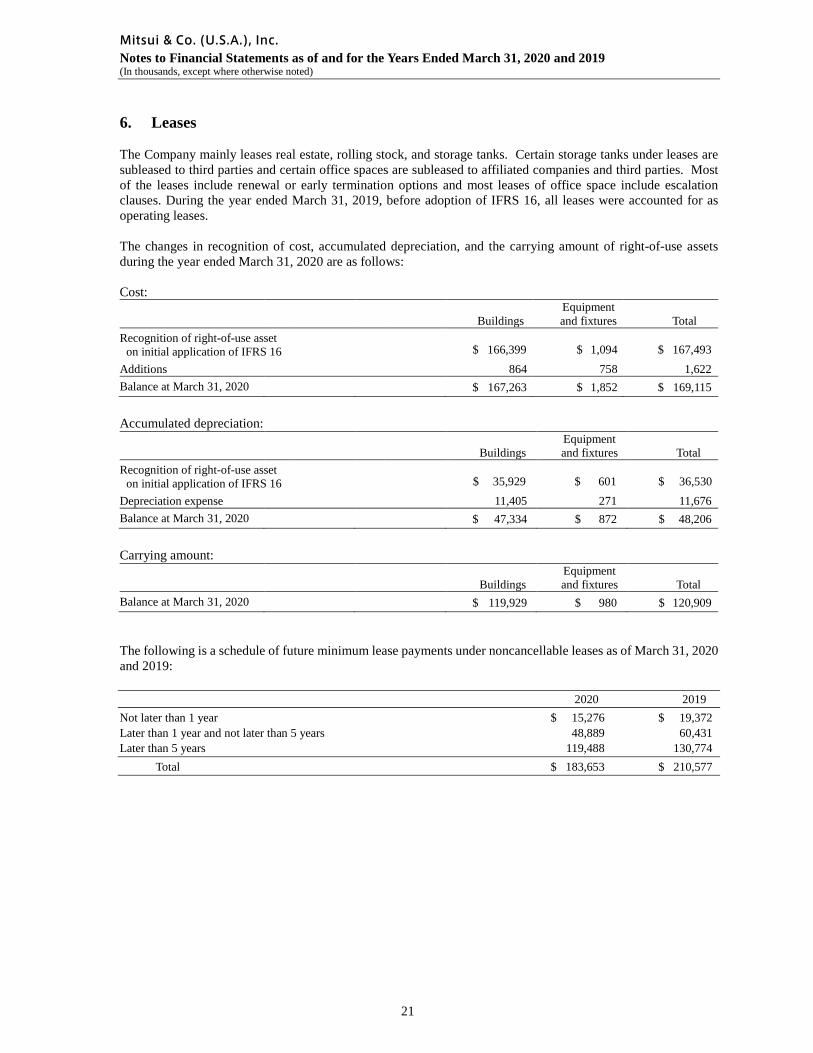
6. Leases The Company mainly leases real estate, rolling stock, and storage tanks. Certain storage tanks under leases are subleased to third parties and certain office spaces are subleased to affiliated companies and third parties. Most of the leases include renewal or early termination options and most leases of office space include escalation clauses. During the year ended March 31, 2019, before adoption of IFRS 16, all leases were accounted for as operating leases. The changes in recognition of cost, accumulated depreciation, and the carrying amount of right-of-use assets during the year ended March 31, 2020 are as follows:
Cost:
Buildings Equipment and fixtures Total
Recognition of right-of-use asset a on initial application of IFRS 16 $ 166,399 $ 1,094 $ 167,493
Additions 864 758 1,622 Balance at March 31, 2020 $ 167,263 $ 1,852 $ 169,115
Accumulated depreciation:
Buildings Equipment and fixtures Total
Recognition of right-of-use asset on initial application of IFRS 16 $ 35,929 $ 601 $ 36,530 Depreciation expense 11,405 271 11,676 Balance at March 31, 2020 $ 47,334 $ 872 $ 48,206
Carrying amount:
Buildings Equipment and fixtures Total
Balance at March 31, 2020 $ 119,929 $ 980 $ 120,909 The following is a schedule of future minimum lease payments under noncancellable leases as of March 31, 2020 and 2019:
2020 2019 Not later than 1 year $ 15,276 $ 19,372 Later than 1 year and not later than 5 years 48,889 60,431 Later than 5 years 119,488 130,774 Total $ 183,653 $ 210,577
Mitsui & Co. (U.S.A.), Inc. Notes to Financial Statements as of and for the Years Ended March 31, 2020 and 2019 (In thousands, except where otherwise noted)
22
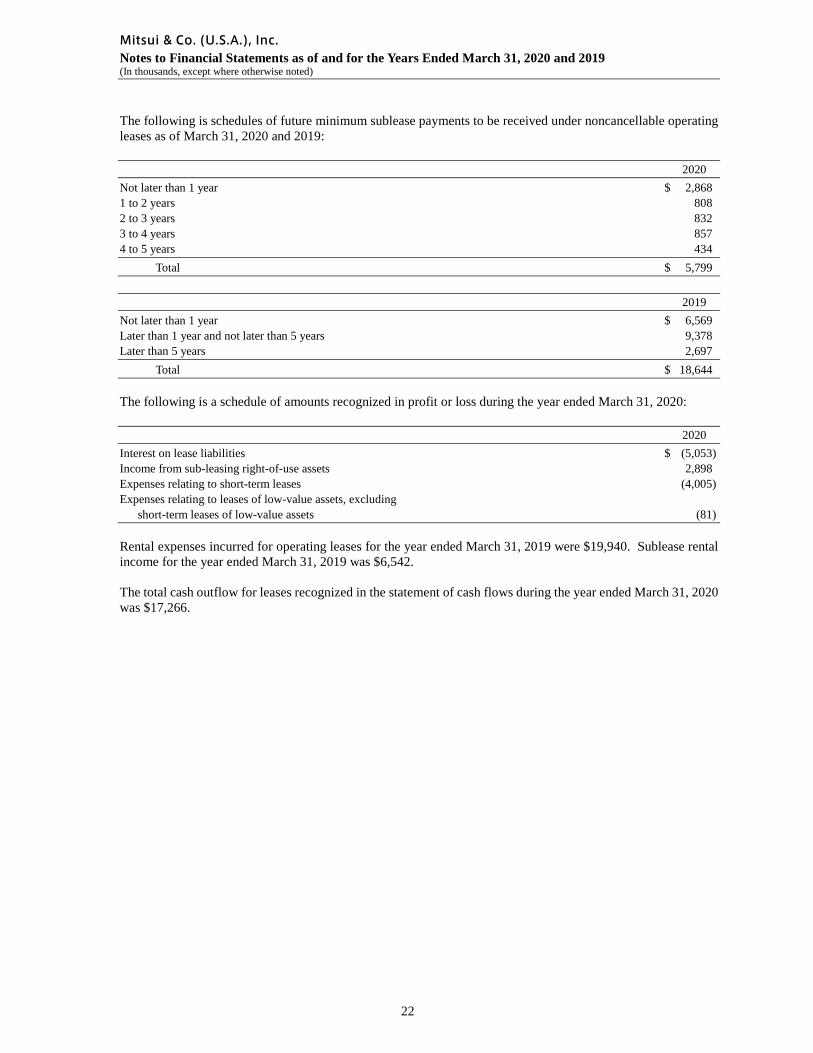
The following is schedules of future minimum sublease payments to be received under noncancellable operating leases as of March 31, 2020 and 2019:
2020 Not later than 1 year $ 2,868 1 to 2 years 808 2 to 3 years 832 3 to 4 years 857 4 to 5 years 434 Total $ 5,799
2019 Not later than 1 year $ 6,569 Later than 1 year and not later than 5 years 9,378 Later than 5 years 2,697 Total $ 18,644
The following is a schedule of amounts recognized in profit or loss during the year ended March 31, 2020:
2020 Interest on lease liabilities $ (5,053) Income from sub-leasing right-of-use assets 2,898 Expenses relating to short-term leases (4,005) Expenses relating to leases of low-value assets, excluding short-term leases of low-value assets (81)
Rental expenses incurred for operating leases for the year ended March 31, 2019 were $19,940. Sublease rental income for the year ended March 31, 2019 was $6,542.
The total cash outflow for leases recognized in the statement of cash flows during the year ended March 31, 2020 was $17,266.
Mitsui & Co. (U.S.A.), Inc. Notes to Financial Statements as of and for the Years Ended March 31, 2020 and 2019 (In thousands, except where otherwise noted)
23
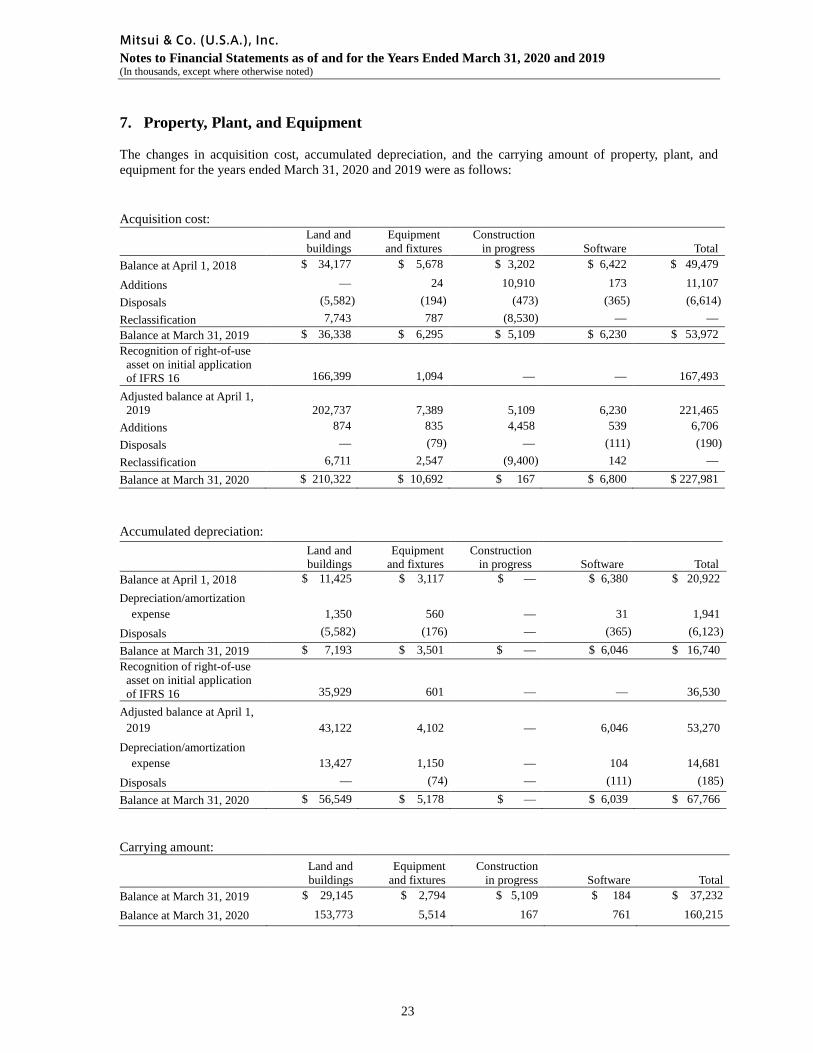
7. Property, Plant, and Equipment
The changes in acquisition cost, accumulated depreciation, and the carrying amount of property, plant, and equipment for the years ended March 31, 2020 and 2019 were as follows: Acquisition cost: Land and
buildings Equipment and fixtures
Construction in progress Software Total
Balance at April 1, 2018 $ 34,177 $ 5,678 $ 3,202 $ 6,422 $ 49,479
Additions — 24 10,910 173 11,107 Disposals (5,582) (194) (473) (365) (6,614) Reclassification 7,743 787 (8,530) — — Balance at March 31, 2019 $ 36,338 $ 6,295 $ 5,109 $ 6,230 $ 53,972 Recognition of right-of-use asset on initial application of IFRS 16 166,399 1,094 — — 167,493
Adjusted balance at April 1, 2019 202,737
7,389
5,109
6,230
221,465
Additions 874 835 4,458 539 6,706 Disposals — (79) — (111) (190) Reclassification 6,711 2,547 (9,400) 142 — Balance at March 31, 2020 $ 210,322 $ 10,692 $ 167 $ 6,800 $ 227,981
Accumulated depreciation:
Land and buildings
Equipment and fixtures
Construction in progress Software Total
Balance at April 1, 2018 $ 11,425 $ 3,117 $ — $ 6,380 $ 20,922 Depreciation/amortization
expense 1,350 560 — 31 1,941 Disposals (5,582) (176) — (365) (6,123) Balance at March 31, 2019 $ 7,193 $ 3,501 $ — $ 6,046 $ 16,740 Recognition of right-of-use asset on initial application of IFRS 16 35,929 601 — — 36,530
Adjusted balance at April 1, 2019 43,122 4,102 — 6,046 53,270 Depreciation/amortization
expense 13,427 1,150 — 104 14,681 Disposals — (74) — (111) (185) Balance at March 31, 2020 $ 56,549 $ 5,178 $ — $ 6,039 $ 67,766 Carrying amount:
Land and buildings
Equipment and fixtures
Construction in progress Software Total
Balance at March 31, 2019 $ 29,145 $ 2,794 $ 5,109 $ 184 $ 37,232
Balance at March 31, 2020 153,773 5,514 167 761 160,215
Mitsui & Co. (U.S.A.), Inc. Notes to Financial Statements as of and for the Years Ended March 31, 2020 and 2019 (In thousands, except where otherwise noted)
24
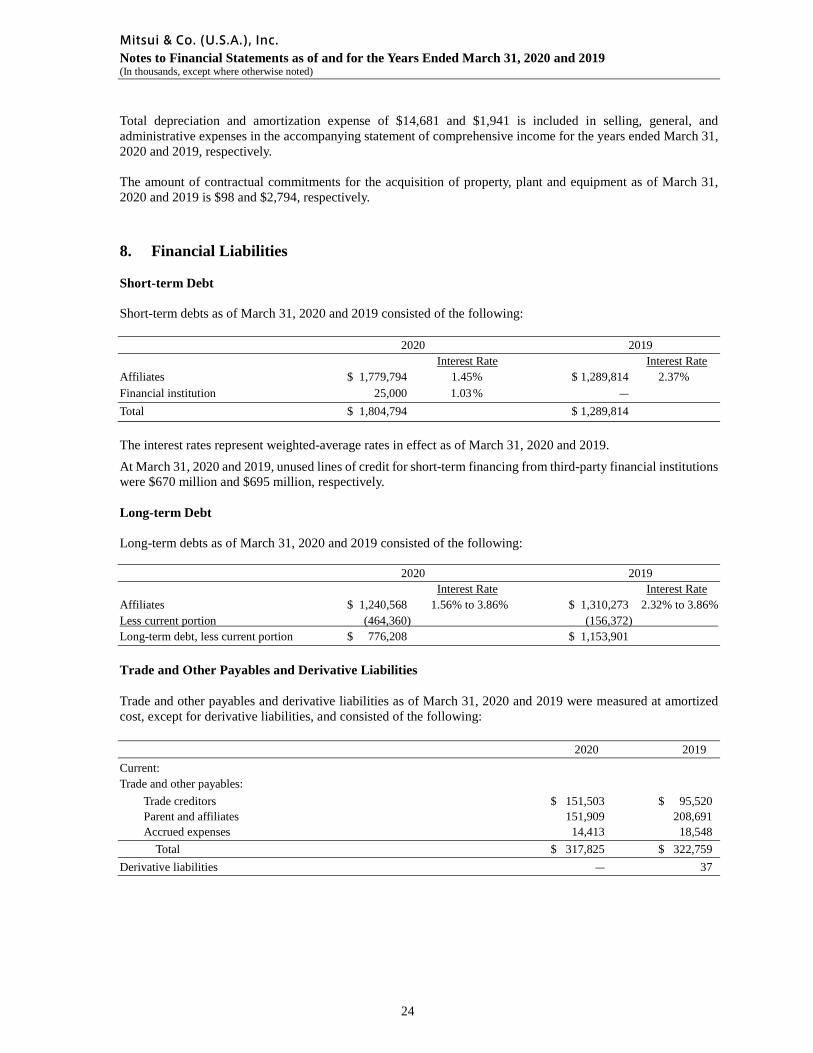
Total depreciation and amortization expense of $14,681 and $1,941 is included in selling, general, and administrative expenses in the accompanying statement of comprehensive income for the years ended March 31, 2020 and 2019, respectively.
The amount of contractual commitments for the acquisition of property, plant and equipment as of March 31, 2020 and 2019 is $98 and $2,794, respectively.
8. Financial Liabilities Short-term Debt Short-term debts as of March 31, 2020 and 2019 consisted of the following: 2020 2019
Interest Rate Interest Rate Affiliates $ 1,779,794 1.45% $ 1,289,814 2.37% Financial institution 25,000 1.03 % ― Total $ 1,804,794 $ 1,289,814 The interest rates represent weighted-average rates in effect as of March 31, 2020 and 2019.
At March 31, 2020 and 2019, unused lines of credit for short-term financing from third-party financial institutions were $670 million and $695 million, respectively. Long-term Debt
Long-term debts as of March 31, 2020 and 2019 consisted of the following: 2020 2019
Interest Rate Interest Rate Affiliates $ 1,240,568 1.56% to 3.86% $ 1,310,273 2.32% to 3.86% Less current portion (464,360) (156,372) Long-term debt, less current portion $ 776,208 $ 1,153,901
Trade and Other Payables and Derivative Liabilities
Trade and other payables and derivative liabilities as of March 31, 2020 and 2019 were measured at amortized cost, except for derivative liabilities, and consisted of the following: 2020 2019 Current: Trade and other payables:
Trade creditors $ 151,503 $ 95,520 Parent and affiliates 151,909 208,691 Accrued expenses 14,413 18,548
Total $ 317,825 $ 322,759 Derivative liabilities ― 37
Mitsui & Co. (U.S.A.), Inc. Notes to Financial Statements as of and for the Years Ended March 31, 2020 and 2019 (In thousands, except where otherwise noted)
25
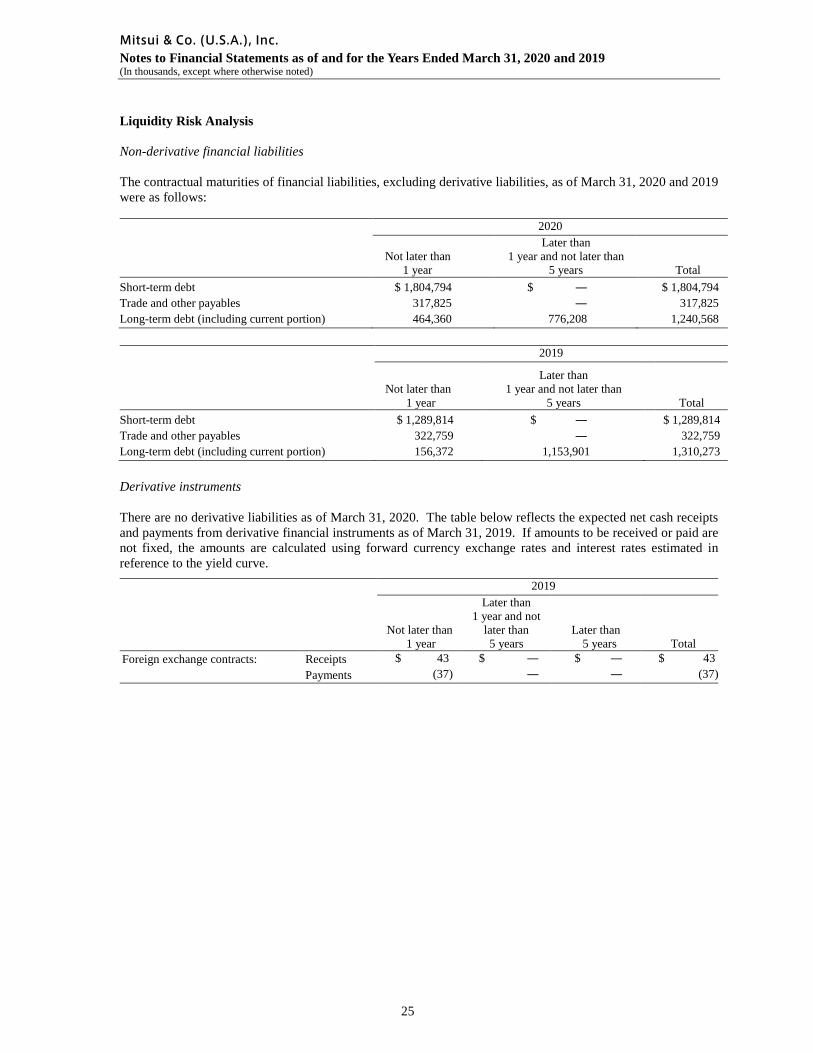
Liquidity Risk Analysis Non-derivative financial liabilities The contractual maturities of financial liabilities, excluding derivative liabilities, as of March 31, 2020 and 2019 were as follows:
2020
Not later than 1 year
Later than 1 year and not later than
5 years Total Short-term debt $ 1,804,794 $ ― $ 1,804,794 Trade and other payables 317,825 ― 317,825 Long-term debt (including current portion) 464,360 776,208 1,240,568
2019
Not later than 1 year
Later than 1 year and not later than
5 years Total Short-term debt $ 1,289,814 $ ― $ 1,289,814 Trade and other payables 322,759 ― 322,759 Long-term debt (including current portion) 156,372 1,153,901 1,310,273
Derivative instruments
There are no derivative liabilities as of March 31, 2020. The table below reflects the expected net cash receipts and payments from derivative financial instruments as of March 31, 2019. If amounts to be received or paid are not fixed, the amounts are calculated using forward currency exchange rates and interest rates estimated in reference to the yield curve. 2019
Not later than 1 year
Later than 1 year and not
later than 5 years
Later than 5 years Total
Foreign exchange contracts:
Receipts $ 43 $ ― $ ― $ 43 Payments (37) ― ― (37)
Mitsui & Co. (U.S.A.), Inc. Notes to Financial Statements as of and for the Years Ended March 31, 2020 and 2019 (In thousands, except where otherwise noted)
26
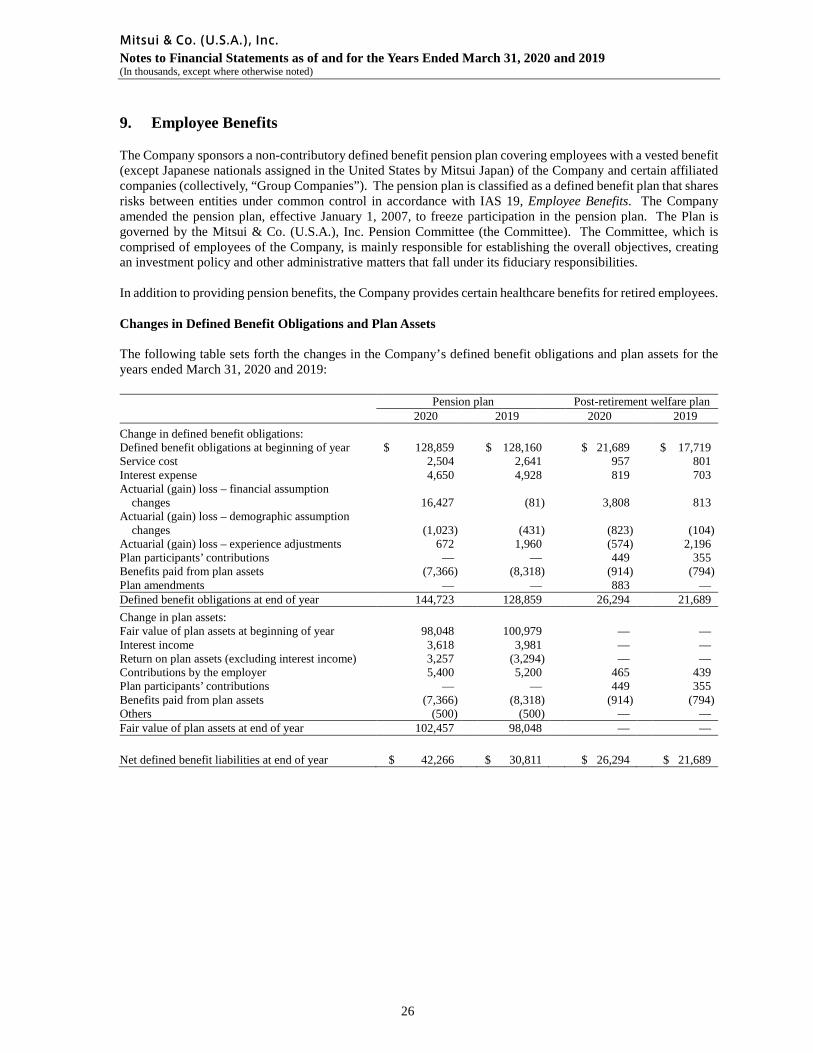
9. Employee Benefits
The Company sponsors a non-contributory defined benefit pension plan covering employees with a vested benefit (except Japanese nationals assigned in the United States by Mitsui Japan) of the Company and certain affiliated companies (collectively, “Group Companies”). The pension plan is classified as a defined benefit plan that shares risks between entities under common control in accordance with IAS 19, Employee Benefits. The Company amended the pension plan, effective January 1, 2007, to freeze participation in the pension plan. The Plan is governed by the Mitsui & Co. (U.S.A.), Inc. Pension Committee (the Committee). The Committee, which is comprised of employees of the Company, is mainly responsible for establishing the overall objectives, creating an investment policy and other administrative matters that fall under its fiduciary responsibilities.
In addition to providing pension benefits, the Company provides certain healthcare benefits for retired employees. Changes in Defined Benefit Obligations and Plan Assets The following table sets forth the changes in the Company’s defined benefit obligations and plan assets for the years ended March 31, 2020 and 2019:
Pension plan Post-retirement welfare plan 2020 2019 2020 2019
Change in defined benefit obligations: Defined benefit obligations at beginning of year $ 128,859 $ 128,160 $ 21,689 $ 17,719 Service cost 2,504 2,641 957 801 Interest expense 4,650 4,928 819 703 Actuarial (gain) loss – financial assumption
changes 16,427 (81) 3,808 813 Actuarial (gain) loss – demographic assumption
changes (1,023) (431) (823) (104) Actuarial (gain) loss – experience adjustments 672 1,960 (574) 2,196 Plan participants’ contributions — — 449 355 Benefits paid from plan assets (7,366) (8,318) (914) (794) Plan amendments — — 883 — Defined benefit obligations at end of year 144,723 128,859 26,294 21,689 Change in plan assets: Fair value of plan assets at beginning of year 98,048 100,979 — — Interest income 3,618 3,981 — — Return on plan assets (excluding interest income) 3,257 (3,294) — — Contributions by the employer 5,400 5,200 465 439 Plan participants’ contributions — — 449 355 Benefits paid from plan assets (7,366) (8,318) (914) (794) Others (500) (500) — — Fair value of plan assets at end of year 102,457 98,048 — — Net defined benefit liabilities at end of year $ 42,266 $ 30,811 $ 26,294 $ 21,689
Mitsui & Co. (U.S.A.), Inc. Notes to Financial Statements as of and for the Years Ended March 31, 2020 and 2019 (In thousands, except where otherwise noted)
27
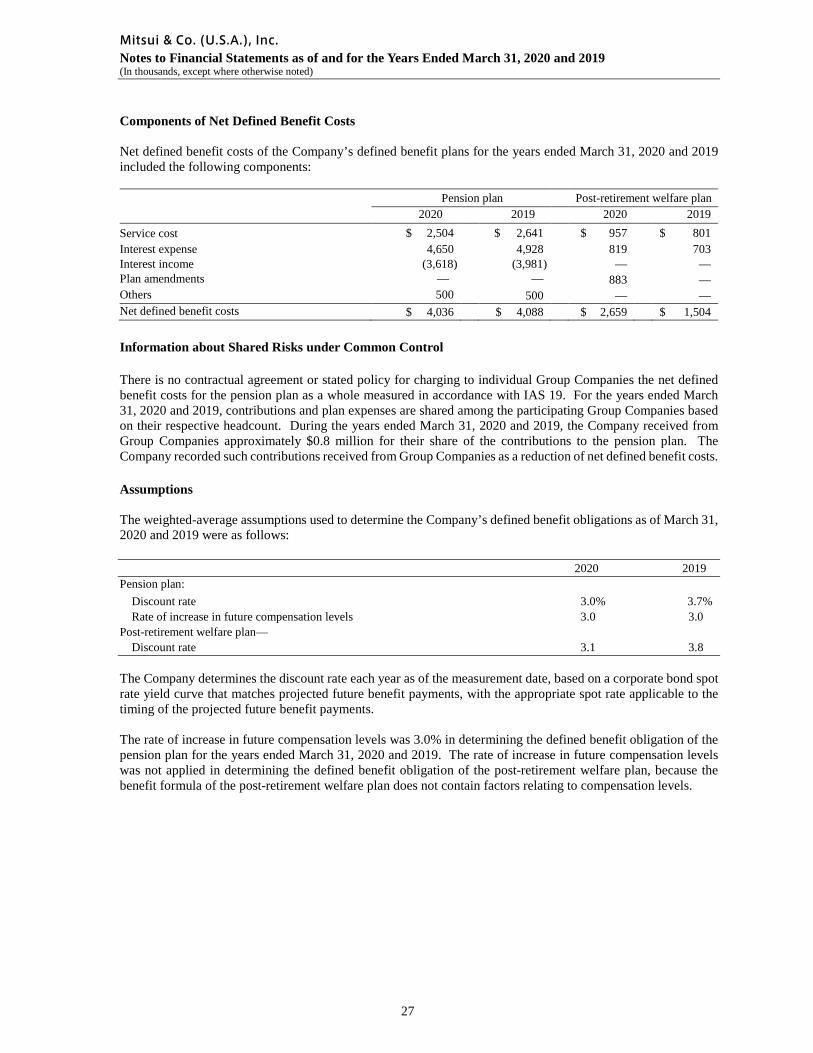
Components of Net Defined Benefit Costs
Net defined benefit costs of the Company’s defined benefit plans for the years ended March 31, 2020 and 2019 included the following components:
Pension plan Post-retirement welfare plan 2020 2019 2020 2019 Service cost $ 2,504 $ 2,641 $ 957 $ 801 Interest expense 4,650 4,928 819 703 Interest income (3,618) (3,981) — — Plan amendments — — 883 — Others 500 500 — — Net defined benefit costs $ 4,036 $ 4,088 $ 2,659 $ 1,504 Information about Shared Risks under Common Control There is no contractual agreement or stated policy for charging to individual Group Companies the net defined benefit costs for the pension plan as a whole measured in accordance with IAS 19. For the years ended March 31, 2020 and 2019, contributions and plan expenses are shared among the participating Group Companies based on their respective headcount. During the years ended March 31, 2020 and 2019, the Company received from Group Companies approximately $0.8 million for their share of the contributions to the pension plan. The Company recorded such contributions received from Group Companies as a reduction of net defined benefit costs.
Assumptions The weighted-average assumptions used to determine the Company’s defined benefit obligations as of March 31, 2020 and 2019 were as follows: 2020 2019 Pension plan:
Discount rate 3.0% 3.7% Rate of increase in future compensation levels 3.0 3.0
Post-retirement welfare plan— Discount rate 3.1 3.8
The Company determines the discount rate each year as of the measurement date, based on a corporate bond spot rate yield curve that matches projected future benefit payments, with the appropriate spot rate applicable to the timing of the projected future benefit payments. The rate of increase in future compensation levels was 3.0% in determining the defined benefit obligation of the pension plan for the years ended March 31, 2020 and 2019. The rate of increase in future compensation levels was not applied in determining the defined benefit obligation of the post-retirement welfare plan, because the benefit formula of the post-retirement welfare plan does not contain factors relating to compensation levels.
Mitsui & Co. (U.S.A.), Inc. Notes to Financial Statements as of and for the Years Ended March 31, 2020 and 2019 (In thousands, except where otherwise noted)
28
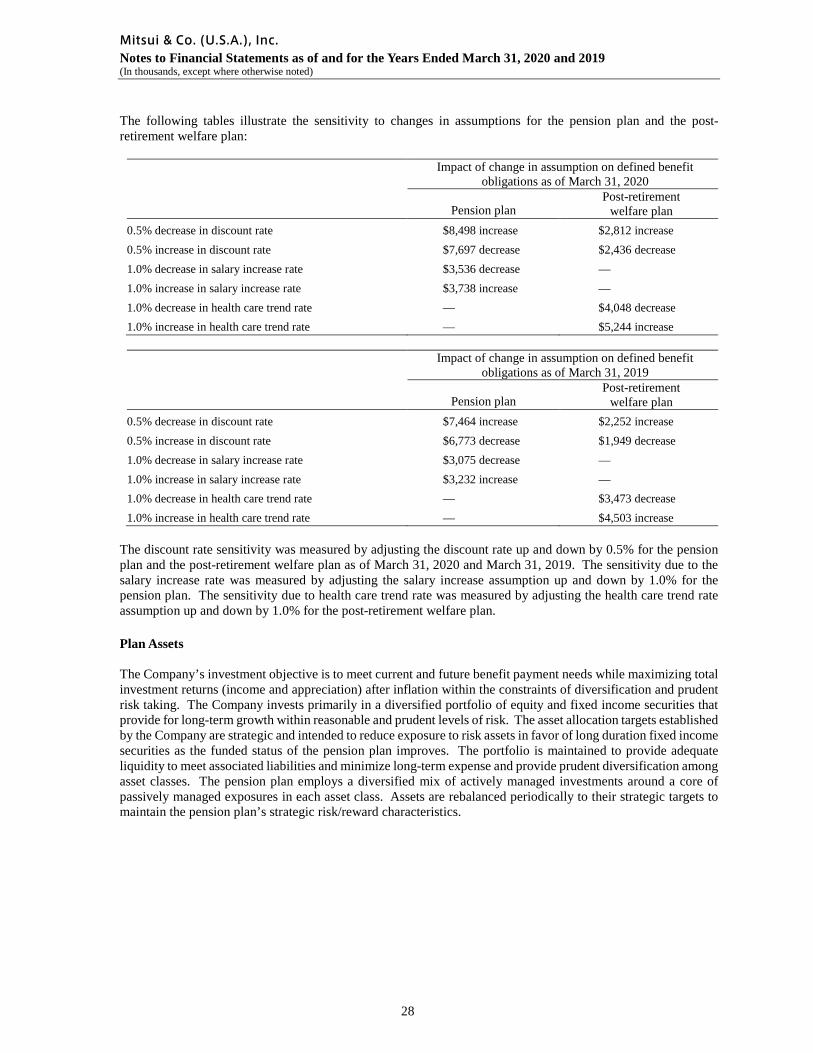
The following tables illustrate the sensitivity to changes in assumptions for the pension plan and the post-retirement welfare plan:
Impact of change in assumption on defined benefit obligations as of March 31, 2020
Pension plan
Post-retirement welfare plan
0.5% decrease in discount rate $8,498 increase $2,812 increase 0.5% increase in discount rate $7,697 decrease $2,436 decrease 1.0% decrease in salary increase rate $3,536 decrease — 1.0% increase in salary increase rate $3,738 increase — 1.0% decrease in health care trend rate — $4,048 decrease 1.0% increase in health care trend rate — $5,244 increase
Impact of change in assumption on defined benefit
obligations as of March 31, 2019
Pension plan Post-retirement
welfare plan 0.5% decrease in discount rate $7,464 increase $2,252 increase 0.5% increase in discount rate $6,773 decrease $1,949 decrease 1.0% decrease in salary increase rate $3,075 decrease — 1.0% increase in salary increase rate $3,232 increase — 1.0% decrease in health care trend rate — $3,473 decrease 1.0% increase in health care trend rate — $4,503 increase
The discount rate sensitivity was measured by adjusting the discount rate up and down by 0.5% for the pension plan and the post-retirement welfare plan as of March 31, 2020 and March 31, 2019. The sensitivity due to the salary increase rate was measured by adjusting the salary increase assumption up and down by 1.0% for the pension plan. The sensitivity due to health care trend rate was measured by adjusting the health care trend rate assumption up and down by 1.0% for the post-retirement welfare plan.
Plan Assets The Company’s investment objective is to meet current and future benefit payment needs while maximizing total investment returns (income and appreciation) after inflation within the constraints of diversification and prudent risk taking. The Company invests primarily in a diversified portfolio of equity and fixed income securities that provide for long-term growth within reasonable and prudent levels of risk. The asset allocation targets established by the Company are strategic and intended to reduce exposure to risk assets in favor of long duration fixed income securities as the funded status of the pension plan improves. The portfolio is maintained to provide adequate liquidity to meet associated liabilities and minimize long-term expense and provide prudent diversification among asset classes. The pension plan employs a diversified mix of actively managed investments around a core of passively managed exposures in each asset class. Assets are rebalanced periodically to their strategic targets to maintain the pension plan’s strategic risk/reward characteristics.
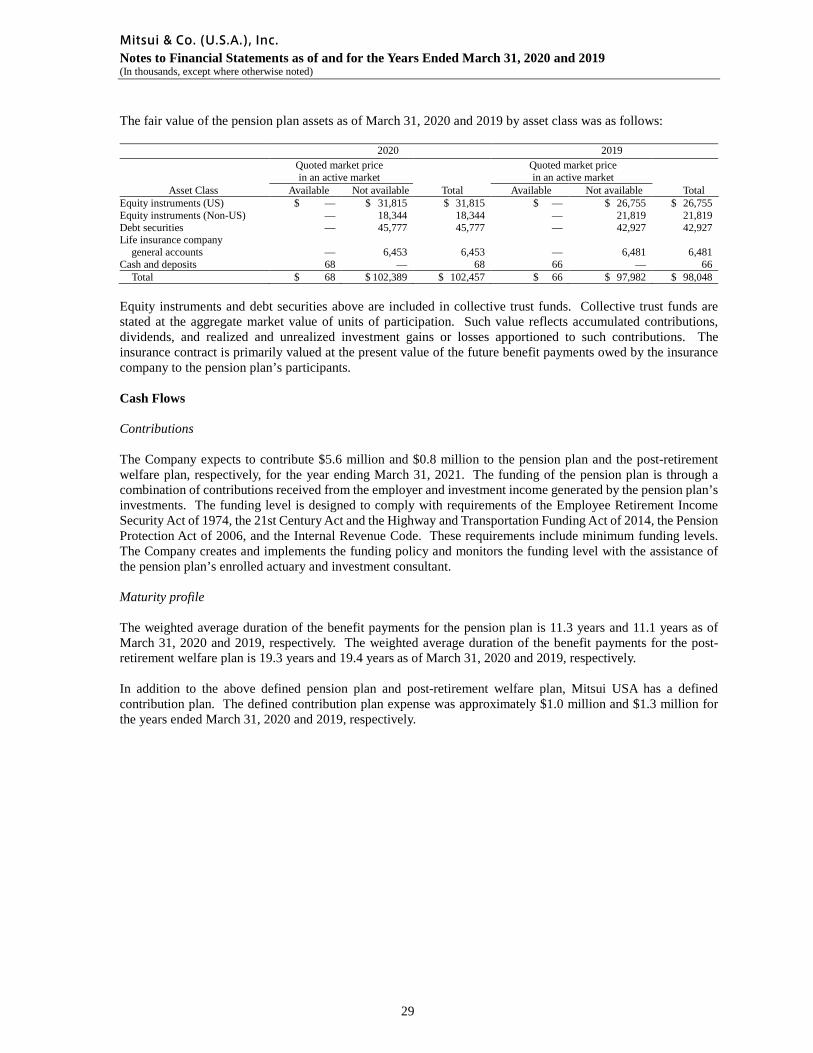
Mitsui & Co. (U.S.A.), Inc. Notes to Financial Statements as of and for the Years Ended March 31, 2020 and 2019 (In thousands, except where otherwise noted)
29
The fair value of the pension plan assets as of March 31, 2020 and 2019 by asset class was as follows:
2020 2019
Asset Class
Quoted market price in an active market
Quoted market price in an active market
Available Not available Total Available Not available Total Equity instruments (US) $ — $ 31,815 $ 31,815 $ — $ 26,755 $ 26,755 Equity instruments (Non-US) — 18,344 18,344 — 21,819 21,819 Debt securities — 45,777 45,777 — 42,927 42,927 Life insurance company general accounts — 6,453 6,453 — 6,481 6,481 Cash and deposits 68 — 68 66 — 66
Total $ 68 $ 102,389 $ 102,457 $ 66 $ 97,982 $ 98,048
Equity instruments and debt securities above are included in collective trust funds. Collective trust funds are stated at the aggregate market value of units of participation. Such value reflects accumulated contributions, dividends, and realized and unrealized investment gains or losses apportioned to such contributions. The insurance contract is primarily valued at the present value of the future benefit payments owed by the insurance company to the pension plan’s participants. Cash Flows Contributions The Company expects to contribute $5.6 million and $0.8 million to the pension plan and the post-retirement welfare plan, respectively, for the year ending March 31, 2021. The funding of the pension plan is through a combination of contributions received from the employer and investment income generated by the pension plan’s investments. The funding level is designed to comply with requirements of the Employee Retirement Income Security Act of 1974, the 21st Century Act and the Highway and Transportation Funding Act of 2014, the Pension Protection Act of 2006, and the Internal Revenue Code. These requirements include minimum funding levels. The Company creates and implements the funding policy and monitors the funding level with the assistance of the pension plan’s enrolled actuary and investment consultant. Maturity profile The weighted average duration of the benefit payments for the pension plan is 11.3 years and 11.1 years as of March 31, 2020 and 2019, respectively. The weighted average duration of the benefit payments for the post-retirement welfare plan is 19.3 years and 19.4 years as of March 31, 2020 and 2019, respectively. In addition to the above defined pension plan and post-retirement welfare plan, Mitsui USA has a defined contribution plan. The defined contribution plan expense was approximately $1.0 million and $1.3 million for the years ended March 31, 2020 and 2019, respectively.
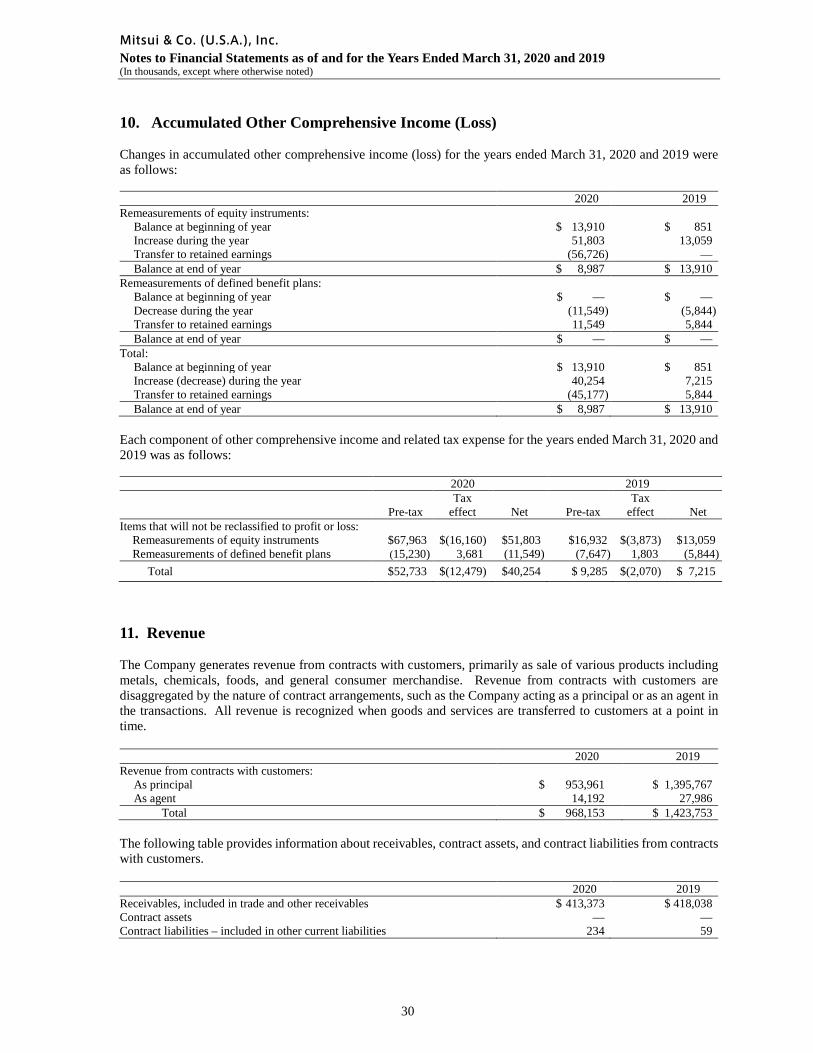
Mitsui & Co. (U.S.A.), Inc. Notes to Financial Statements as of and for the Years Ended March 31, 2020 and 2019 (In thousands, except where otherwise noted)
30
10. Accumulated Other Comprehensive Income (Loss) Changes in accumulated other comprehensive income (loss) for the years ended March 31, 2020 and 2019 were as follows: 2020 2019 Remeasurements of equity instruments:
Balance at beginning of year $ 13,910 $ 851 Increase during the year 51,803 13,059 Transfer to retained earnings (56,726) — Balance at end of year $ 8,987 $ 13,910
Remeasurements of defined benefit plans: Balance at beginning of year $ — $ — Decrease during the year (11,549) (5,844) Transfer to retained earnings 11,549 5,844 Balance at end of year $ — $ —
Total: Balance at beginning of year $ 13,910 $ 851 Increase (decrease) during the year 40,254 7,215 Transfer to retained earnings (45,177) 5,844 Balance at end of year $ 8,987 $ 13,910
Each component of other comprehensive income and related tax expense for the years ended March 31, 2020 and 2019 was as follows: 2020 2019
Pre-tax Tax
effect Net Pre-tax Tax
effect Net Items that will not be reclassified to profit or loss:
Remeasurements of equity instruments $67,963 $(16,160) $51,803 $16,932 $(3,873) $13,059 Remeasurements of defined benefit plans (15,230) 3,681 (11,549) (7,647) 1,803 (5,844)
Total $52,733 $(12,479) $40,254 $ 9,285 $(2,070) $ 7,215
11. Revenue The Company generates revenue from contracts with customers, primarily as sale of various products including metals, chemicals, foods, and general consumer merchandise. Revenue from contracts with customers are disaggregated by the nature of contract arrangements, such as the Company acting as a principal or as an agent in the transactions. All revenue is recognized when goods and services are transferred to customers at a point in time. 2020 2019 Revenue from contracts with customers:
As principal $ 953,961 $ 1,395,767 As agent 14,192 27,986
Total $ 968,153 $ 1,423,753 The following table provides information about receivables, contract assets, and contract liabilities from contracts with customers.
2020 2019 Receivables, included in trade and other receivables $ 413,373 $ 418,038 Contract assets — — Contract liabilities – included in other current liabilities 234 59
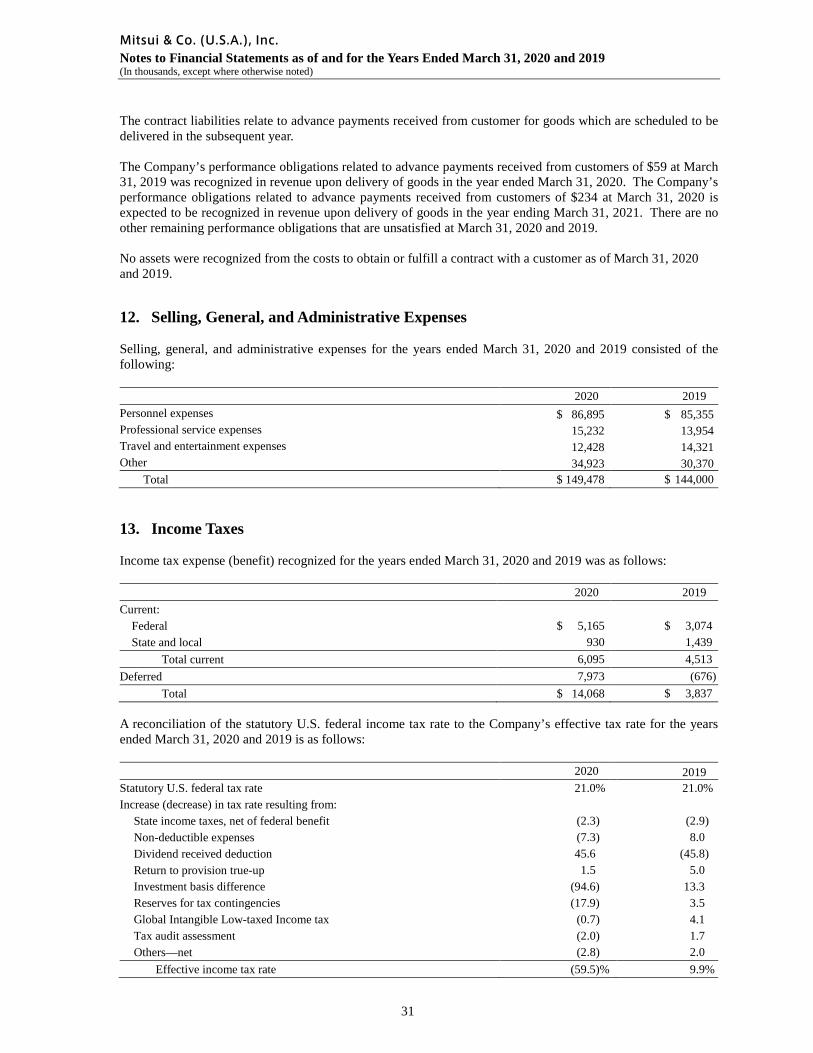
Mitsui & Co. (U.S.A.), Inc. Notes to Financial Statements as of and for the Years Ended March 31, 2020 and 2019 (In thousands, except where otherwise noted)
31
The contract liabilities relate to advance payments received from customer for goods which are scheduled to be delivered in the subsequent year. The Company’s performance obligations related to advance payments received from customers of $59 at March 31, 2019 was recognized in revenue upon delivery of goods in the year ended March 31, 2020. The Company’s performance obligations related to advance payments received from customers of $234 at March 31, 2020 is expected to be recognized in revenue upon delivery of goods in the year ending March 31, 2021. There are no other remaining performance obligations that are unsatisfied at March 31, 2020 and 2019.
No assets were recognized from the costs to obtain or fulfill a contract with a customer as of March 31, 2020 and 2019. 12. Selling, General, and Administrative Expenses Selling, general, and administrative expenses for the years ended March 31, 2020 and 2019 consisted of the following: 2020 2019 Personnel expenses $ 86,895 $ 85,355 Professional service expenses 15,232 13,954 Travel and entertainment expenses 12,428 14,321 Other 34,923 30,370
Total $ 149,478 $ 144,000
13. Income Taxes Income tax expense (benefit) recognized for the years ended March 31, 2020 and 2019 was as follows:
2020 2019 Current:
Federal $ 5,165 $ 3,074 State and local 930 1,439
Total current 6,095 4,513 Deferred 7,973 (676)
Total $ 14,068 $ 3,837
A reconciliation of the statutory U.S. federal income tax rate to the Company’s effective tax rate for the years ended March 31, 2020 and 2019 is as follows:
2020 2019
Statutory U.S. federal tax rate 21.0% 21.0% Increase (decrease) in tax rate resulting from:
State income taxes, net of federal benefit (2.3) (2.9) Non-deductible expenses (7.3) 8.0 Dividend received deduction 45.6 (45.8) Return to provision true-up 1.5 5.0 Investment basis difference (94.6) 13.3 Reserves for tax contingencies (17.9) 3.5 Global Intangible Low-taxed Income tax (0.7) 4.1 Tax audit assessment (2.0) 1.7 Others—net (2.8) 2.0
Effective income tax rate (59.5)% 9.9%
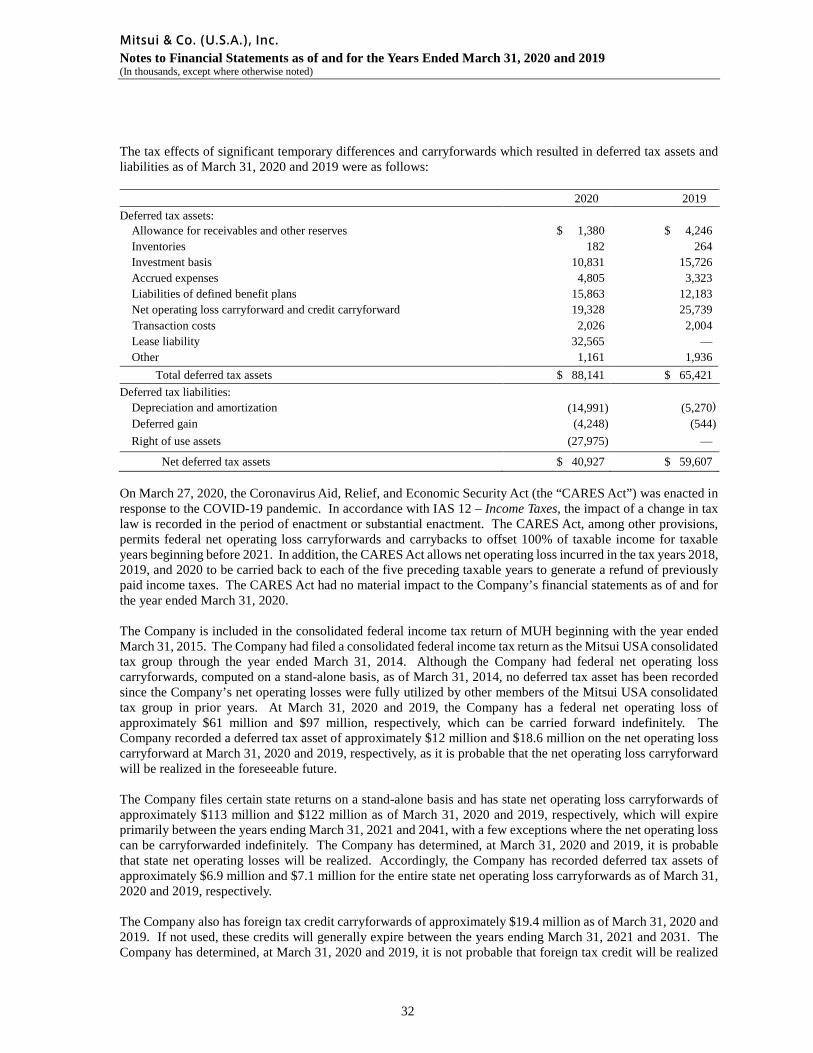
Mitsui & Co. (U.S.A.), Inc. Notes to Financial Statements as of and for the Years Ended March 31, 2020 and 2019 (In thousands, except where otherwise noted)
32
The tax effects of significant temporary differences and carryforwards which resulted in deferred tax assets and liabilities as of March 31, 2020 and 2019 were as follows:
2020 2019
Deferred tax assets: Allowance for receivables and other reserves $ 1,380 $ 4,246 Inventories 182 264 Investment basis 10,831 15,726 Accrued expenses 4,805 3,323 Liabilities of defined benefit plans 15,863 12,183 Net operating loss carryforward and credit carryforward 19,328 25,739 Transaction costs 2,026 2,004 Lease liability 32,565 — Other 1,161 1,936
Total deferred tax assets $ 88,141 $ 65,421 Deferred tax liabilities:
Depreciation and amortization (14,991) (5,270) Deferred gain (4,248) (544) Right of use assets (27,975) —
Net deferred tax assets $ 40,927 $ 59,607
On March 27, 2020, the Coronavirus Aid, Relief, and Economic Security Act (the “CARES Act”) was enacted in response to the COVID-19 pandemic. In accordance with IAS 12 – Income Taxes, the impact of a change in tax law is recorded in the period of enactment or substantial enactment. The CARES Act, among other provisions, permits federal net operating loss carryforwards and carrybacks to offset 100% of taxable income for taxable years beginning before 2021. In addition, the CARES Act allows net operating loss incurred in the tax years 2018, 2019, and 2020 to be carried back to each of the five preceding taxable years to generate a refund of previously paid income taxes. The CARES Act had no material impact to the Company’s financial statements as of and for the year ended March 31, 2020. The Company is included in the consolidated federal income tax return of MUH beginning with the year ended March 31, 2015. The Company had filed a consolidated federal income tax return as the Mitsui USA consolidated tax group through the year ended March 31, 2014. Although the Company had federal net operating loss carryforwards, computed on a stand-alone basis, as of March 31, 2014, no deferred tax asset has been recorded since the Company’s net operating losses were fully utilized by other members of the Mitsui USA consolidated tax group in prior years. At March 31, 2020 and 2019, the Company has a federal net operating loss of approximately $61 million and $97 million, respectively, which can be carried forward indefinitely. The Company recorded a deferred tax asset of approximately $12 million and $18.6 million on the net operating loss carryforward at March 31, 2020 and 2019, respectively, as it is probable that the net operating loss carryforward will be realized in the foreseeable future. The Company files certain state returns on a stand-alone basis and has state net operating loss carryforwards of approximately $113 million and $122 million as of March 31, 2020 and 2019, respectively, which will expire primarily between the years ending March 31, 2021 and 2041, with a few exceptions where the net operating loss can be carryforwarded indefinitely. The Company has determined, at March 31, 2020 and 2019, it is probable that state net operating losses will be realized. Accordingly, the Company has recorded deferred tax assets of approximately $6.9 million and $7.1 million for the entire state net operating loss carryforwards as of March 31, 2020 and 2019, respectively. The Company also has foreign tax credit carryforwards of approximately $19.4 million as of March 31, 2020 and 2019. If not used, these credits will generally expire between the years ending March 31, 2021 and 2031. The Company has determined, at March 31, 2020 and 2019, it is not probable that foreign tax credit will be realized
Mitsui & Co. (U.S.A.), Inc. Notes to Financial Statements as of and for the Years Ended March 31, 2020 and 2019 (In thousands, except where otherwise noted)
33
in the foreseeable future. Accordingly, the Company has not recorded the deferred tax assets related to the foreign tax credit carryforwards as of March 31, 2020 and 2019. The carrying amount of deferred tax assets is reviewed at each reporting period date and adjusted to reflect changes in the Company’s assessment that it is probable that all or part of the deferred tax assets will be realized.
The Company had a liability for uncertain tax positions of approximately $19 million and $14 million, respectively as of March 31, 2020 and 2019 including interest and penalties of approximately $1.2 million for both years. These amounts are reported in other non-current liabilities in the accompanying statements of financial position. The Company recognizes unrecognized tax benefits and the related interest and penalties as a component of income tax expense (benefit). The Company is subject to income taxes in the U.S. and withholding taxes in various foreign jurisdictions. With a few exceptions, the Company is no longer subject to U.S. federal, state, local, and foreign income tax examinations for years ended before March 31, 2017.
14. Fair Value Measurement IFRS 13, Fair Value Measurement, defines fair value as the price that would be received to sell an asset or paid to transfer a liability in an orderly transaction between market participants at the measurement date. IFRS 13 establishes the fair value hierarchy that may be used to measure fair value, which is provided as follows: Level 1: Quoted prices (unadjusted) in active markets for identical assets or liabilities. Level 2: Inputs, other than quoted prices included within Level 1, that are observable for the asset or liability,
either directly or indirectly. Level 2 inputs include the following:
- Quoted prices for similar assets or liabilities in active markets - Quoted prices for identical or similar assets or liabilities in markets that are not active - Inputs other than quoted prices that are observable for the asset or liability - Inputs that are derived principally from or corroborated by observable market data by correlation or
other means. Level 3: Unobservable inputs for the asset or liability. The Company recognizes transfers of assets or liabilities between levels of the fair value hierarchy when the transfers occur.
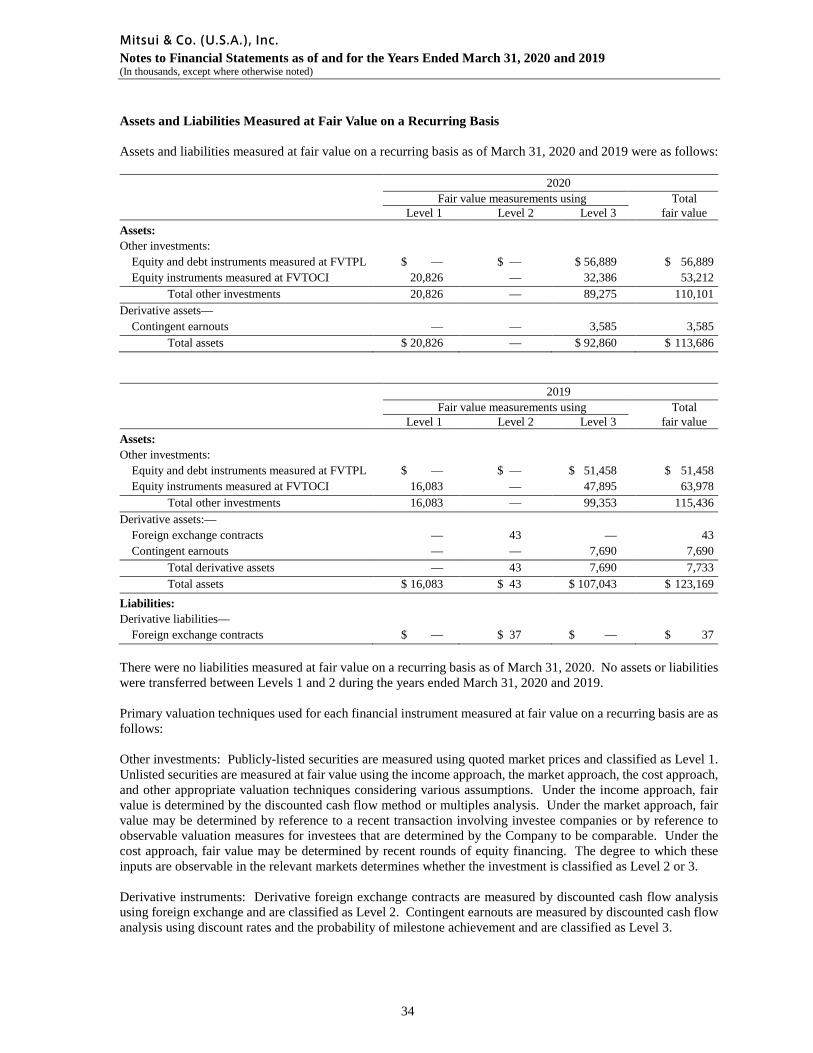
Mitsui & Co. (U.S.A.), Inc. Notes to Financial Statements as of and for the Years Ended March 31, 2020 and 2019 (In thousands, except where otherwise noted)
34
Assets and Liabilities Measured at Fair Value on a Recurring Basis Assets and liabilities measured at fair value on a recurring basis as of March 31, 2020 and 2019 were as follows: 2020 Fair value measurements using Total Level 1 Level 2 Level 3 fair value Assets: Other investments:
Equity and debt instruments measured at FVTPL $ — $ — $ 56,889 $ 56,889 Equity instruments measured at FVTOCI 20,826 — 32,386 53,212
Total other investments 20,826 — 89,275 110,101 Derivative assets—
Contingent earnouts — — 3,585 3,585 Total assets $ 20,826 — $ 92,860 $ 113,686
2019 Fair value measurements using Total Level 1 Level 2 Level 3 fair value Assets: Other investments:
Equity and debt instruments measured at FVTPL $ — $ — $ 51,458 $ 51,458 Equity instruments measured at FVTOCI 16,083 — 47,895 63,978
Total other investments 16,083 — 99,353 115,436 Derivative assets:—
Foreign exchange contracts — 43 — 43 Contingent earnouts — — 7,690 7,690
Total derivative assets — 43 7,690 7,733 Total assets $ 16,083 $ 43 $ 107,043 $ 123,169
Liabilities: Derivative liabilities—
Foreign exchange contracts $ — $ 37 $ — $ 37 There were no liabilities measured at fair value on a recurring basis as of March 31, 2020. No assets or liabilities were transferred between Levels 1 and 2 during the years ended March 31, 2020 and 2019. Primary valuation techniques used for each financial instrument measured at fair value on a recurring basis are as follows: Other investments: Publicly-listed securities are measured using quoted market prices and classified as Level 1. Unlisted securities are measured at fair value using the income approach, the market approach, the cost approach, and other appropriate valuation techniques considering various assumptions. Under the income approach, fair value is determined by the discounted cash flow method or multiples analysis. Under the market approach, fair value may be determined by reference to a recent transaction involving investee companies or by reference to observable valuation measures for investees that are determined by the Company to be comparable. Under the cost approach, fair value may be determined by recent rounds of equity financing. The degree to which these inputs are observable in the relevant markets determines whether the investment is classified as Level 2 or 3. Derivative instruments: Derivative foreign exchange contracts are measured by discounted cash flow analysis using foreign exchange and are classified as Level 2. Contingent earnouts are measured by discounted cash flow analysis using discount rates and the probability of milestone achievement and are classified as Level 3.
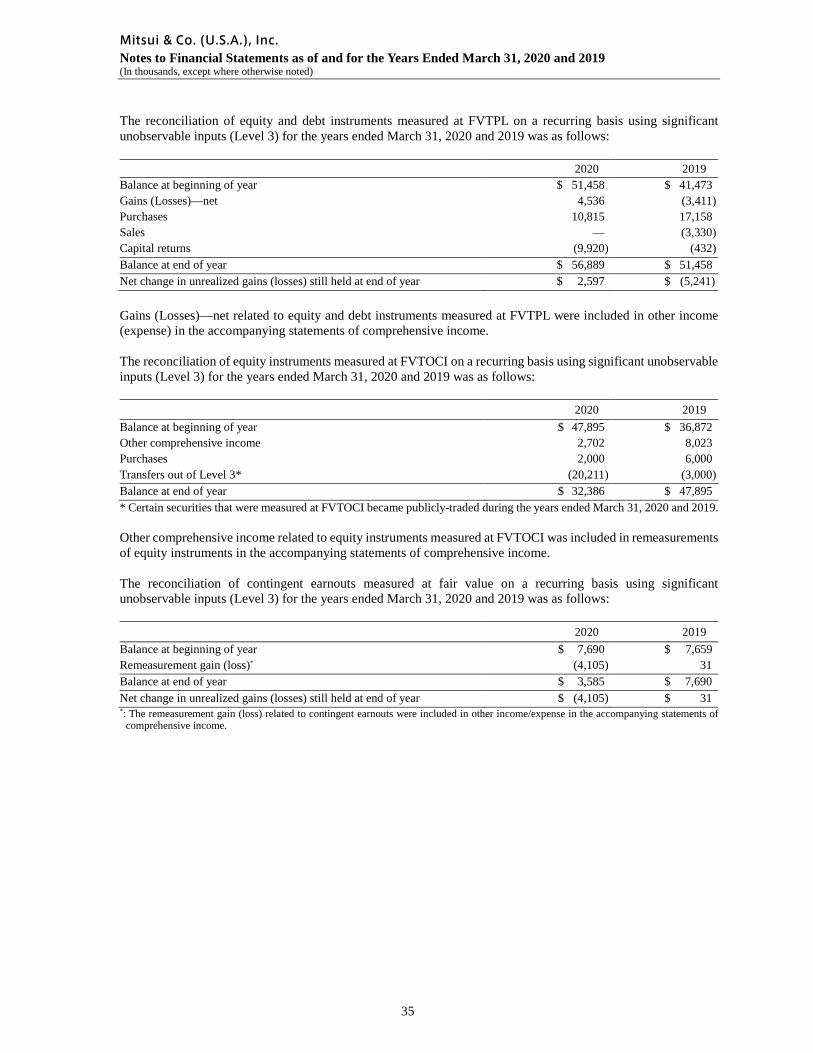
Mitsui & Co. (U.S.A.), Inc. Notes to Financial Statements as of and for the Years Ended March 31, 2020 and 2019 (In thousands, except where otherwise noted)
35
The reconciliation of equity and debt instruments measured at FVTPL on a recurring basis using significant unobservable inputs (Level 3) for the years ended March 31, 2020 and 2019 was as follows:
2020 2019
Balance at beginning of year $ 51,458 $ 41,473 Gains (Losses)—net 4,536 (3,411) Purchases 10,815 17,158 Sales — (3,330) Capital returns (9,920) (432) Balance at end of year $ 56,889 $ 51,458 Net change in unrealized gains (losses) still held at end of year $ 2,597 $ (5,241) Gains (Losses)—net related to equity and debt instruments measured at FVTPL were included in other income (expense) in the accompanying statements of comprehensive income. The reconciliation of equity instruments measured at FVTOCI on a recurring basis using significant unobservable inputs (Level 3) for the years ended March 31, 2020 and 2019 was as follows:
2020 2019 Balance at beginning of year $ 47,895 $ 36,872 Other comprehensive income 2,702 8,023 Purchases 2,000 6,000 Transfers out of Level 3* (20,211) (3,000) Balance at end of year $ 32,386 $ 47,895 * Certain securities that were measured at FVTOCI became publicly-traded during the years ended March 31, 2020 and 2019. Other comprehensive income related to equity instruments measured at FVTOCI was included in remeasurements of equity instruments in the accompanying statements of comprehensive income. The reconciliation of contingent earnouts measured at fair value on a recurring basis using significant unobservable inputs (Level 3) for the years ended March 31, 2020 and 2019 was as follows:
2020 2019 Balance at beginning of year $ 7,690 $ 7,659 Remeasurement gain (loss)* (4,105) 31 Balance at end of year $ 3,585 $ 7,690 Net change in unrealized gains (losses) still held at end of year $ (4,105) $ 31 *: The remeasurement gain (loss) related to contingent earnouts were included in other income/expense in the accompanying statements of
comprehensive income.
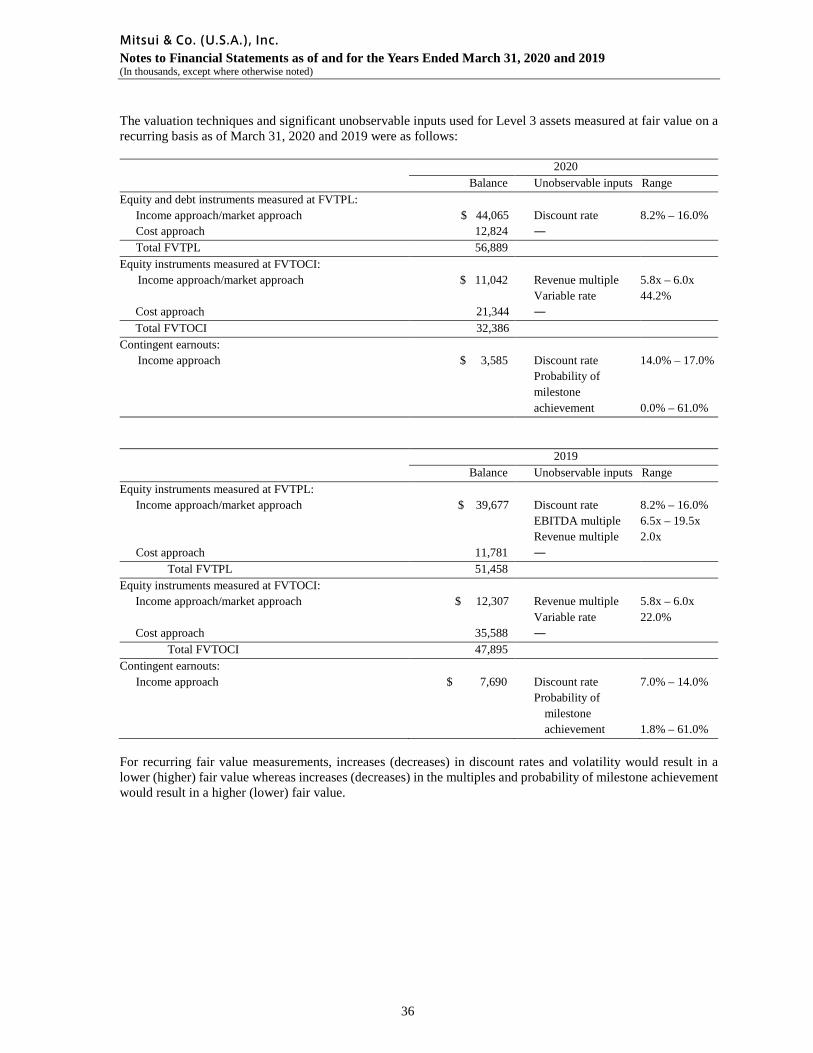
Mitsui & Co. (U.S.A.), Inc. Notes to Financial Statements as of and for the Years Ended March 31, 2020 and 2019 (In thousands, except where otherwise noted)
36
The valuation techniques and significant unobservable inputs used for Level 3 assets measured at fair value on a recurring basis as of March 31, 2020 and 2019 were as follows: 2020 Balance Unobservable inputs Range Equity and debt instruments measured at FVTPL:
Income approach/market approach $ 44,065 Discount rate 8.2% – 16.0% Cost approach 12,824 ― Total FVTPL 56,889
Equity instruments measured at FVTOCI: Income approach/market approach $ 11,042 Revenue multiple 5.8x – 6.0x
Variable rate 44.2% Cost approach 21,344 ― Total FVTOCI 32,386
Contingent earnouts: Income approach $ 3,585 Discount rate 14.0% – 17.0%
Probability of milestone achievement 0.0% – 61.0%
2019 Balance Unobservable inputs Range Equity instruments measured at FVTPL:
Income approach/market approach $ 39,677 Discount rate 8.2% – 16.0% EBITDA multiple 6.5x – 19.5x Revenue multiple 2.0x Cost approach 11,781 ―
Total FVTPL 51,458 Equity instruments measured at FVTOCI:
Income approach/market approach $ 12,307 Revenue multiple 5.8x – 6.0x Variable rate 22.0% Cost approach 35,588 ―
Total FVTOCI 47,895 Contingent earnouts:
Income approach $ 7,690 Discount rate 7.0% – 14.0%
Probability of milestone achievement 1.8% – 61.0%
For recurring fair value measurements, increases (decreases) in discount rates and volatility would result in a lower (higher) fair value whereas increases (decreases) in the multiples and probability of milestone achievement would result in a higher (lower) fair value.
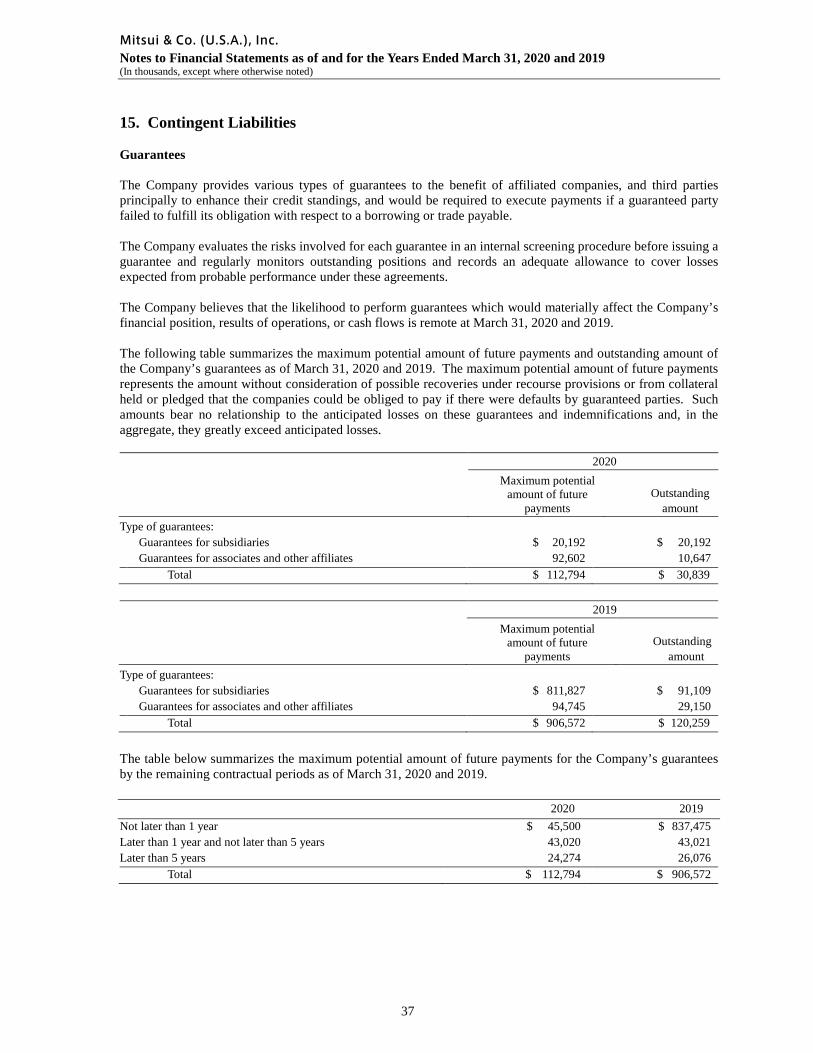
Mitsui & Co. (U.S.A.), Inc. Notes to Financial Statements as of and for the Years Ended March 31, 2020 and 2019 (In thousands, except where otherwise noted)
37
15. Contingent Liabilities Guarantees The Company provides various types of guarantees to the benefit of affiliated companies, and third parties principally to enhance their credit standings, and would be required to execute payments if a guaranteed party failed to fulfill its obligation with respect to a borrowing or trade payable. The Company evaluates the risks involved for each guarantee in an internal screening procedure before issuing a guarantee and regularly monitors outstanding positions and records an adequate allowance to cover losses expected from probable performance under these agreements. The Company believes that the likelihood to perform guarantees which would materially affect the Company’s financial position, results of operations, or cash flows is remote at March 31, 2020 and 2019. The following table summarizes the maximum potential amount of future payments and outstanding amount of the Company’s guarantees as of March 31, 2020 and 2019. The maximum potential amount of future payments represents the amount without consideration of possible recoveries under recourse provisions or from collateral held or pledged that the companies could be obliged to pay if there were defaults by guaranteed parties. Such amounts bear no relationship to the anticipated losses on these guarantees and indemnifications and, in the aggregate, they greatly exceed anticipated losses.
2020
Maximum potential amount of future
payments Outstanding
amount Type of guarantees:
Guarantees for subsidiaries $ 20,192 $ 20,192 Guarantees for associates and other affiliates 92,602 10,647
Total $ 112,794 $ 30,839
2019
Maximum potential amount of future
payments Outstanding
amount Type of guarantees:
Guarantees for subsidiaries $ 811,827 $ 91,109 Guarantees for associates and other affiliates 94,745 29,150
Total $ 906,572 $ 120,259 The table below summarizes the maximum potential amount of future payments for the Company’s guarantees by the remaining contractual periods as of March 31, 2020 and 2019. 2020 2019 Not later than 1 year $ 45,500 $ 837,475 Later than 1 year and not later than 5 years 43,020 43,021 Later than 5 years 24,274 26,076
Total $ 112,794 $ 906,572
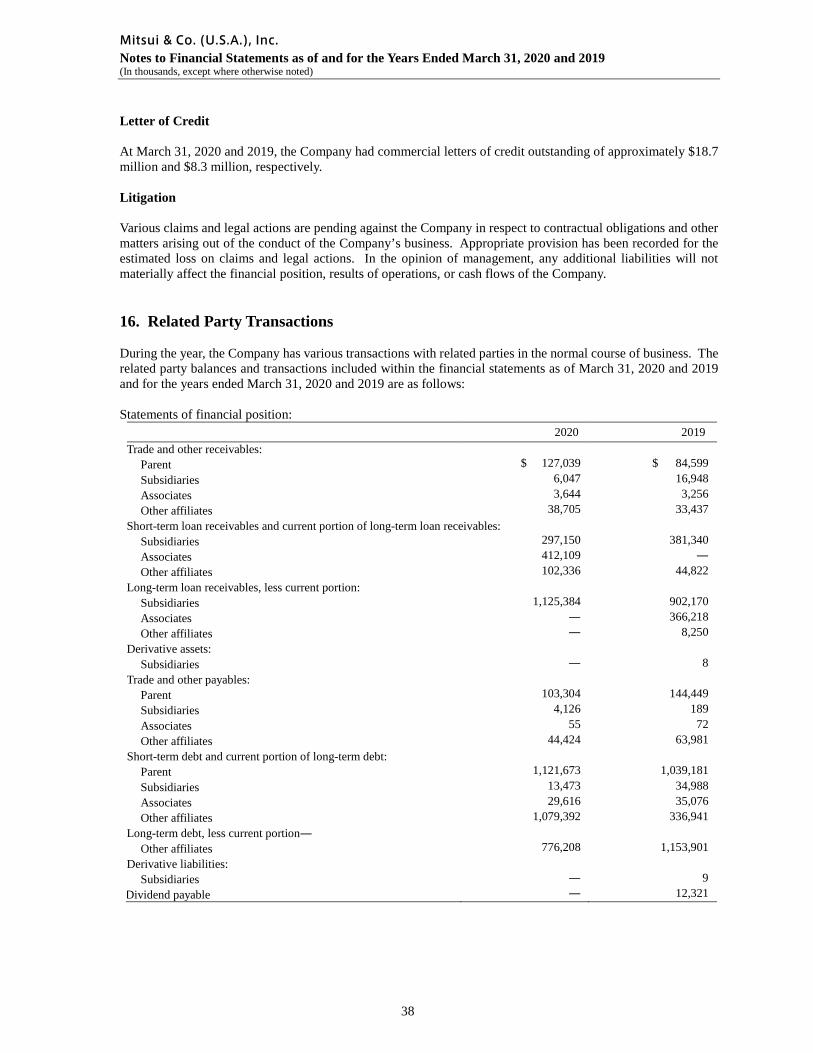
Mitsui & Co. (U.S.A.), Inc. Notes to Financial Statements as of and for the Years Ended March 31, 2020 and 2019 (In thousands, except where otherwise noted)
38
Letter of Credit At March 31, 2020 and 2019, the Company had commercial letters of credit outstanding of approximately $18.7 million and $8.3 million, respectively. Litigation Various claims and legal actions are pending against the Company in respect to contractual obligations and other matters arising out of the conduct of the Company’s business. Appropriate provision has been recorded for the estimated loss on claims and legal actions. In the opinion of management, any additional liabilities will not materially affect the financial position, results of operations, or cash flows of the Company. 16. Related Party Transactions During the year, the Company has various transactions with related parties in the normal course of business. The related party balances and transactions included within the financial statements as of March 31, 2020 and 2019 and for the years ended March 31, 2020 and 2019 are as follows: Statements of financial position:
2020 2019 Trade and other receivables:
Parent $ 127,039 $ 84,599 Subsidiaries 6,047 16,948 Associates 3,644 3,256 Other affiliates 38,705 33,437
Short-term loan receivables and current portion of long-term loan receivables: Subsidiaries 297,150 381,340 Associates 412,109 ― Other affiliates 102,336 44,822
Long-term loan receivables, less current portion: Subsidiaries 1,125,384 902,170 Associates ― 366,218 Other affiliates ― 8,250
Derivative assets: Subsidiaries ― 8
Trade and other payables: Parent 103,304 144,449 Subsidiaries 4,126 189 Associates 55 72 Other affiliates 44,424 63,981
Short-term debt and current portion of long-term debt: Parent 1,121,673 1,039,181 Subsidiaries 13,473 34,988 Associates 29,616 35,076 Other affiliates 1,079,392 336,941
Long-term debt, less current portion― Other affiliates 776,208 1,153,901
Derivative liabilities: Subsidiaries ― 9
Dividend payable ― 12,321
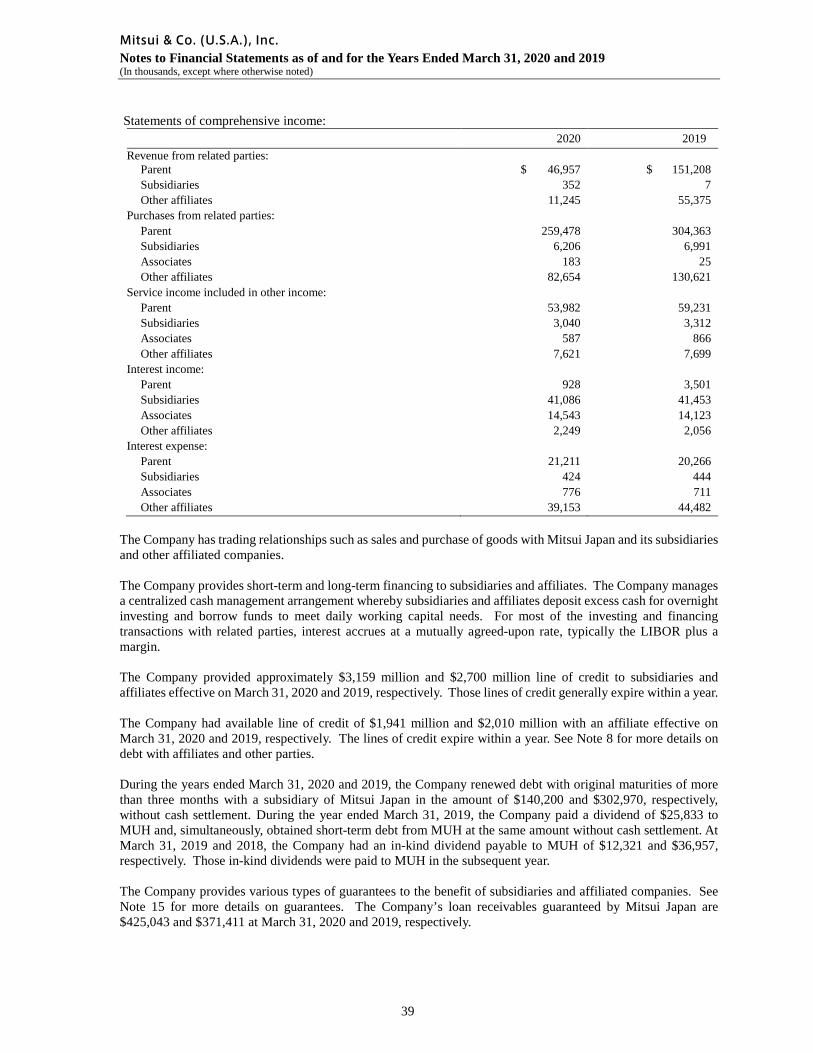
Mitsui & Co. (U.S.A.), Inc. Notes to Financial Statements as of and for the Years Ended March 31, 2020 and 2019 (In thousands, except where otherwise noted)
39
Statements of comprehensive income: 2020 2019
Revenue from related parties: Parent $ 46,957 $ 151,208 Subsidiaries 352 7 Other affiliates 11,245 55,375
Purchases from related parties: Parent 259,478 304,363 Subsidiaries 6,206 6,991 Associates 183 25 Other affiliates 82,654 130,621
Service income included in other income: Parent 53,982 59,231 Subsidiaries 3,040 3,312 Associates 587 866 Other affiliates 7,621 7,699
Interest income: Parent 928 3,501 Subsidiaries 41,086 41,453 Associates 14,543 14,123 Other affiliates 2,249 2,056
Interest expense: Parent 21,211 20,266 Subsidiaries 424 444 Associates 776 711 Other affiliates 39,153 44,482
The Company has trading relationships such as sales and purchase of goods with Mitsui Japan and its subsidiaries and other affiliated companies. The Company provides short-term and long-term financing to subsidiaries and affiliates. The Company manages a centralized cash management arrangement whereby subsidiaries and affiliates deposit excess cash for overnight investing and borrow funds to meet daily working capital needs. For most of the investing and financing transactions with related parties, interest accrues at a mutually agreed-upon rate, typically the LIBOR plus a margin. The Company provided approximately $3,159 million and $2,700 million line of credit to subsidiaries and affiliates effective on March 31, 2020 and 2019, respectively. Those lines of credit generally expire within a year. The Company had available line of credit of $1,941 million and $2,010 million with an affiliate effective on March 31, 2020 and 2019, respectively. The lines of credit expire within a year. See Note 8 for more details on debt with affiliates and other parties. During the years ended March 31, 2020 and 2019, the Company renewed debt with original maturities of more than three months with a subsidiary of Mitsui Japan in the amount of $140,200 and $302,970, respectively, without cash settlement. During the year ended March 31, 2019, the Company paid a dividend of $25,833 to MUH and, simultaneously, obtained short-term debt from MUH at the same amount without cash settlement. At March 31, 2019 and 2018, the Company had an in-kind dividend payable to MUH of $12,321 and $36,957, respectively. Those in-kind dividends were paid to MUH in the subsequent year. The Company provides various types of guarantees to the benefit of subsidiaries and affiliated companies. See Note 15 for more details on guarantees. The Company’s loan receivables guaranteed by Mitsui Japan are $425,043 and $371,411 at March 31, 2020 and 2019, respectively.
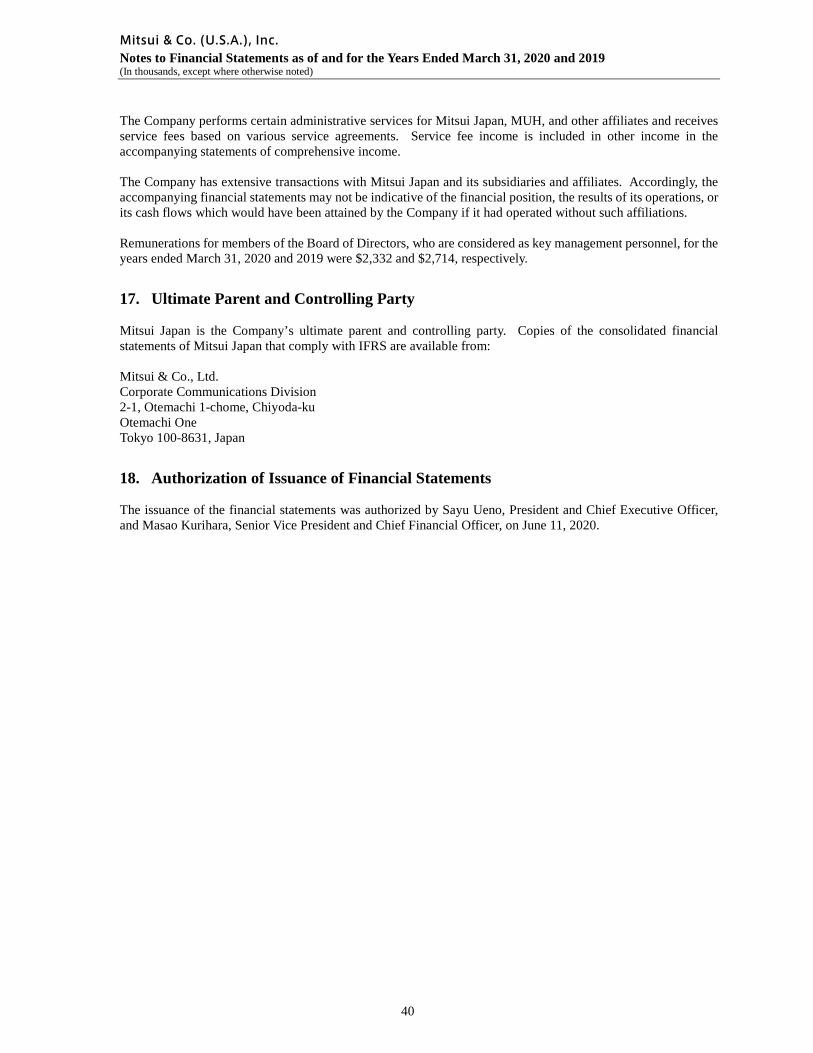
Mitsui & Co. (U.S.A.), Inc. Notes to Financial Statements as of and for the Years Ended March 31, 2020 and 2019 (In thousands, except where otherwise noted)
40
The Company performs certain administrative services for Mitsui Japan, MUH, and other affiliates and receives service fees based on various service agreements. Service fee income is included in other income in the accompanying statements of comprehensive income. The Company has extensive transactions with Mitsui Japan and its subsidiaries and affiliates. Accordingly, the accompanying financial statements may not be indicative of the financial position, the results of its operations, or its cash flows which would have been attained by the Company if it had operated without such affiliations. Remunerations for members of the Board of Directors, who are considered as key management personnel, for the years ended March 31, 2020 and 2019 were $2,332 and $2,714, respectively.
17. Ultimate Parent and Controlling Party
Mitsui Japan is the Company’s ultimate parent and controlling party. Copies of the consolidated financial statements of Mitsui Japan that comply with IFRS are available from: Mitsui & Co., Ltd. Corporate Communications Division 2-1, Otemachi 1-chome, Chiyoda-ku Otemachi One Tokyo 100-8631, Japan
18. Authorization of Issuance of Financial Statements
The issuance of the financial statements was authorized by Sayu Ueno, President and Chief Executive Officer, and Masao Kurihara, Senior Vice President and Chief Financial Officer, on June 11, 2020.
Office Directory
NEW YORK—Headquarters 200 Park Avenue New York, NY 10166 212-878-4000 212-878-4800-Fax
CHICAGO 200 East Randolph Drive Suite 5200 Chicago, IL 60601 312-540-4000 312-540-4026-Fax
CLEVELAND 4125 Highlander Parkway Suite 220 Richfield, OH 44286 330-659-2920 330-659-3196-Fax
HOUSTON 1300 Post Oak Blvd. Suite 1700 Houston, TX 77056 713-236-6100 713-236-6134-Fax
LOS ANGELES 350 South Grand Avenue Suite 3900 Los Angeles, CA 90071 213-896-1100 213-688-1138-Fax Our Home Page on the Internet: http://www.mitsui.com
NASHVILLE 555 Marriott Drive Suite 450 Nashville, TN 37214 615-885-5318 615-885-5483-Fax SEATTLE 1201 Third Avenue Suite 1560 Seattle, WA 98101 206-223-5604 206-223-5651-Fax
SILICON VALLEY 535 Middlefield Road Suite 100 Menlo Park, CA 94025 650-234-5000 650-234-5029-Fax
WASHINGTON, D.C. 750 17th Street, N.W. Suite 400 Washington, D.C. 20006 202-861-0660 202-861-0437-Fax

Mitsui & Co. (U.S.A.), Inc. 200 Park Avenue New York, New York 10166