Mitsubishi Logisnext Co., Ltd.
32
[Number of Speakers] 4 Masanori Kagami Chairman of the Board Takashi Kubo President and CEO Takatoshi Uno Executive Officer, CFO, Head of Corporate Finance and Accounting Headquarters, and Division Head, General Manager, Corporate Finance Planning Division Katsutoshi Yuasa Member of the Executive Team, Division Head, General Manager, Corporate Strategy and Planning office Mitsubishi Logisnext Co., Ltd. Financial Results Briefing for the Fiscal Year Ended March 2021 May 27, 2021
Transcript of Mitsubishi Logisnext Co., Ltd.

[Number of Speakers] 4
Masanori Kagami Chairman of the Board
Takashi Kubo President and CEO
Takatoshi Uno Executive Officer, CFO, Head of Corporate
Finance and Accounting Headquarters, and
Division Head, General Manager, Corporate
Finance Planning Division
Katsutoshi Yuasa Member of the Executive Team, Division
Head, General Manager, Corporate Strategy
and Planning office
Mitsubishi Logisnext Co., Ltd. Financial Results Briefing for the Fiscal Year Ended March 2021
May 27, 2021

Presentation
Moderator: Thank you for waiting. As the time has come, we will now begin the briefing on Mitsubishi Logisnext’s financial results for the fiscal year ended March 31, 2021.
Thank you very much for taking time out of your busy schedule to participate in our financial results briefing.
Today, we would like to present an overview of our financial results for the fiscal year ended March 31, 2021, and our management policy for the fiscal year ending March 2022 FY2021.
Today, Mr. Uno, CFO and Head of Corporate Finance and Accounting Headquarters, will provide an overview of the financial results for the fiscal year ended March 31, 2021, and Mr. Kubo, President and CEO, will explain the management policy for FY2021.
We will now move on to an overview of the financial results for the fiscal year ended March 31, 2021. Mr. Uno, please.
Uno: I am Uno of Mitsubishi Logisnext. Thank you very much for joining us today for our financial results briefing. Today's presentation will consist of 2 parts, the first half of which will be an overview of our financial results by me, and the second half of which will be an explanation of our management policy for FY2021 by President Kubo.

As for the market environment surrounding our company, both domestic and overseas markets bottomed out in the first quarter of last fiscal year and are gradually recovering from the COVID-19 crisis. With the spread of the new coronavirus infection as it is, the initial impact in Japan was relatively minor, but there was a major downside impact overseas. However, the recovery in Europe and the United States since September has been very strong.
Even in Japan, where the economic recovery and the recovery of the forklift market have been slow, the economy has recovered to the level of the same period of the previous year in the third and fourth quarters.
As for the summary of our consolidated business results under these circumstances, net sales declined by 12.8% YoY, as sales did not recover in line with the recovery in orders, partly due to the lead time from order receipt to production and shipment. Operating income before amortization of goodwill decreased by 40%, although the impact of the large decrease in sales was expected to be covered by fixed cost reductions and other measures.

The above table is the income statement. Net sales were JPY391.5 billion, operating income before amortization of goodwill was JPY10.990 billion, and operating income after amortization of goodwill was JPY1.590 billion, which was down 81.1% compared to the same period of the previous year.
As in the previous fiscal year ended March 2020, extraordinary losses were recorded, resulting in a final loss of JPY2.68 billion, the second consecutive fiscal year in which a net loss was recorded.
As for the significant loss items, please refer to the summary of financial results. These include the loss on the closure of the Hefei plant in China, one-time expenses incurred in connection with the reduction of personnel at global bases caused by COVID-19, and the liquidation of the defined benefit pension plan of a US subsidiary.

I will explain the situation by region. From this page onward, operating income before amortization of goodwill will be referred to as operating income.
Page 5 shows the status of net sales and operating income by region. As shown in the upper figure, while domestic sales decreased by JPY10.5 billion, or 6%, overseas sales decreased by JPY46.9 billion, or approximately 17%, which is a significant decrease.
As a result, operating income decreased by 33% in the domestic business and by 46% in the overseas business, as shown in the lower figure, with a particularly large decrease in the overseas business.

Page 6 shows the sales by region in comparison to the previous year, divided into the first half shown in blue and the second half shown in beige.
It is expressed by 4 regions: Japan, Americas, Europe, and Asia/China. You can see that compared to Japan, each region overseas saw a larger decline in sales. On the other hand, the recovery in sales from the first half to the second half was larger overseas.
However, I think some additional explanation is needed for the Americas. As for sales in the Americas, sales of Equipment Depot, which was acquired in July 2019, are not included at all in the first half of the fiscal year ended March 2020. Since the Company changed its fiscal year end in the middle of the fiscal year, sales for the 9 months from July to March were recorded together in the second half of the fiscal year ended March 2020. As a result, the comparison of the first half and second half of the fiscal year in the Americas is irregular, but after correcting for this factor, the Americas is showing a solid recovery from the first half to the second half of the fiscal year, despite a YoY decline in sales.

Page 7 shows a waterfall chart of which regions experienced the decline in sales, after excluding the impact of foreign exchange rates.
Orders recovered in the second half of the fiscal year, but their contribution to sales was delayed due to lead times, and as you can see, sales declined in all regions. Equipment Depot's full-year consolidated contribution for the fiscal year under review was JPY9.86 billion, which is shown in the middle of the chart, but without it, sales would be down 15% from the previous year. We believe that this was the actual decrease in revenue.

Page 8 shows the increase/decrease in operating income, this time a decrease, by factor.
As mentioned on page 7, sales decreased by JPY57.4 billion. The decrease in sales was accompanied by a decrease in gross profit of JPY15.5 billion, as well as the impact of discounted sales in a market with excess supply capacity in the COVID-19 pandemic.
In response to this, we worked to reduce expenses throughout the year at all of our bases and covered JPY7.4 billion, but in the end, we were forced to reduce operating income by JPY7.34 billion, or 40%.

Page 9 shows the major changes in the consolidated balance sheet. Total assets decreased by JPY10.1 billion due to the decrease in working capital and the amortization of goodwill assets amid the decrease in sales.
On the other hand, as for net assets, which is the capital account, although we recorded a net loss, thanks to an increase in foreign currency translation adjustments and other factors, the capital adequacy ratio, which has been an issue for our company, reached 15%, almost the same level as at the end of March 2020.

Page 10 shows the status of cash flow.
Operating cash flow decreased by JPY8.52 billion compared to the previous fiscal year, but free cash flow was positive JPY11.01 billion due to restrained capital investment in the investment cash flow.
As you can see in the white letters in the gray frame at the bottom of page 10, the free cash flow for the previous fiscal year was negative JPY6.95 billion. However, in the previous fiscal year, we made an investment in the acquisition of Equipment Depot, which I mentioned earlier, so if we exclude that, free cash flow in the previous fiscal year ended March 2020 would have been positive JPY17 billion.
This decreased to JPY11 billion in the fiscal year ended March 2021. In the middle of the waterfall chart, you see an increase in short-term loans receivable of JPY4.39 billion, which is indicated by the orange bar. This represents the amount deposited into the global cash pooling account of our parent company, Mitsubishi Heavy Industries. In other words, if we exclude the expenditure for the deposit of surplus funds, we were able to obtain a free cash flow of about JPY15 billion in real terms. We believe that this was our ability to generate free cash flow for the fiscal year ended March 31, 2021.

This is the earnings forecast for the fiscal year ending March 31, 2022, which is the current fiscal year.
Based on the assumption that the economy and the market will not fully recover from the effects of the new coronavirus infection and that the situation will remain truly unpredictable, sales will increase by 9.8% to JPY430 billion compared to the fiscal year ended March 31, 2021. Operating income before amortization of goodwill is expected to increase by 27.4% to JPY14 billion.
As amortization of goodwill will continue to be recorded, operating income and net income will be only JPY5 billion and JPY1 billion, respectively, but we are aiming for a steady recovery.
We plan to maintain our dividend at JPY8 per share, based on our policy of balancing the enhancement of our dividend with internal reserves for the establishment of our corporate foundation.

Page 12 shows the increase in operating income from the fiscal year ended March 31, 2021 to the fiscal year ending March 31, 2022, in the form of a waterfall chart by factor.
Gross profit is expected to increase by JPY11.5 billion due to the increase in sales. We will increase it by measures for price improvement. However, the soaring cost of materials, especially steel materials, is an issue that we are currently facing. In addition, we are aiming for an operating income of JPY14 billion, taking into account the impact of rising transportation costs, mainly in marine transportation, and the increase in expenses associated with the increase in sales related to the recovery of corporate activities despite the COVID-19 pandemic.

Capital investment and R&D expenses are shown on page 15.
In the fiscal year ended March 2021, which is shown in the middle of the bar graph, both capital expenditures and R&D expenses were reduced due to COVID-19. From here, it is expected to recover to the level of previous years in the fiscal year ending March 2022.
In terms of capital investment, we will carefully monitor and control demand for the yellow-colored forklift trucks for lease and rental, which we call investment in equipment vehicles.
This concludes my presentation of the financial results and the outlook for the current fiscal year.

Moderator: Thank you very much. We would now like to move on to the explanation of our management policy for FY2021. President Kubo, please.
Kubo: I am Kubo from Mitsubishi Logisnext. Now, I will explain the management policy for FY2021, but before that, I would like to make a few words.
Once again, thank you very much for attending today's briefing on our financial results and management policy. As explained by CFO Uno, our business performance deteriorated significantly in the first half of the last fiscal year because of the various restrictions on our activities under the spread of the new coronavirus infection, which caused great concern to everyone. However, our order received has returned along with the market recovery in the second half of the year. Thanks to your support, we were able to achieve profitability in both operating income and ordinary income for the full year.
We have positioned this important first year of our medium-term management plan, which was announced in November last year, as a phase for starting and building the foundation of our business. We will steadily implement and achieve our management plan for this fiscal year. As a comprehensive manufacturer of logistics equipment that supports the social infrastructure, the entire Group will do its utmost to meet the expectations of our customers.

I would now like to explain our management policy for FY2021.
First of all, here are the actual global shipments in the forklift market from FY2017 to FY2020 and the forecast for FY2021.
Please see the graph by region. In Japan, the Americas, Europe, and APAC, the impact of COVID-19 resulted in a drop in volume in all of these areas in FY2020 compared to the previous year.
On the other hand, in China on the lower left, the country that quickly recovered from COVID-19, shipment volume increased significantly. In the global market for FY2020, the expansion of the Chinese market contributed to a 16.8% YoY increase in shipments to 1,695,000 units. However, if we exclude China, the impact of COVID-19 is still significant, resulting in a YoY decrease of 3.8% to 975,000 units.

You see quarterly changes of global orders received in FY2019 and FY2020.
Note that small self-propelled electric lifts, Class III, are excluded here.
The bar graph above shows the quarterly global order volume excluding China. The graph below shows the number of orders received in China. In China, the impact of COVID-19 has been minimal, and the number of units bottomed out in the fourth quarter of FY2019 and has been increasing rapidly since then.
In FY2020, the Chinese market has shown quarterly growth of plus 40% to 100% compared to the previous year, indicating that economic activity has fully recovered.
On the other hand, on a global basis, excluding China, orders have bottomed out in the first quarter of FY2020 and are now steadily recovering. By region, Japan's growth is moderate, but in the fourth quarter of FY2020, orders in the Americas, Europe, and APAC doubled from the first quarter of FY2020. In the midst of this increase in demand, we recognize that the most important thing is to ensure that we receive orders.

This slide summarizes the market outlook for FY2021 and the steps to be taken by each region.
Due to the effects of COVID-19, the statistical data for FY2020 has fluctuated, so the comparison is made with FY2019.
First, Japan. The impact of COVID-19 will remain, and we will focus on maintaining our market share in the face of the expected slight decrease compared to FY2019.
In the Americas, the market is expected to expand as economic activity continues to normalize. In addition to various sales activities, we will strengthen our solution sales activities.
The market in Europe will expand slightly, with Class III expected to increase on the back of growth in ecommerce. We will strengthen sales measures focusing on battery-powered vehicles.
In China, the market is expected to grow significantly, especially with the increase in Class III due to the expansion of the ecommerce market, as well as the trend toward battery-powered vehicles. We will aim to increase sales by introducing new models.
In APAC, we expect sales to return to the FY2019 level, although there are differences between countries, and we will work to increase sales with the new battery-powered vehicles introduced last year.
I would like to reiterate the outline of our medium-term management plan, which was announced in November last year.
First of all, we have named this mid-term plan Logisnext SolutionS 2023, or LS23 for short, as we affectionately call it in our company.
The capital “S” at the end of SolutionS expresses our desire for 2 solutions: one to solve our customers’ logistics problems and the other to solve our internal problems and foster a new corporate culture.
In our medium-term management plan, we have defined 3 basic strategies as the pillars: building up business resilience, accelerating growth strategy, and further developing our global and regional branding strategies.
These 3 strategies are based on our corporate philosophy of “moving the world forward as the leading provider of innovative logistics and material handling solutions.”

Let me explain the 3 basic strategies in a little more detail.
First and foremost, to prepare for the uncertainties of the future, we will further strengthen our existing businesses, centered on forklift, to improve profitability, steadily integrate operations, improve fixed and variable costs while working toward completion, and strengthen our corporate resilience. This is the first strategy in our medium-term management plan to strengthen our corporate resilience.
Next, from the perspective of ESG management for customers responding to a decarbonized society and labor shortage, we will expand and enhance our solutions business to respond to the acceleration of the shift to battery-powered vehicles and the sophistication of logistics systems through automation, autonomy and the use of digital transformation. In the area of sales networks, we will formulate strategies for each region globally and promote reorganization and reinforcement. For example, in Japan and the Americas, we will aim to generate profits from the downstream business of after-sales service and used car sales by strengthening our direct sales network. In order to achieve this, product development that captures market needs is essential. The second basic strategy is to promote growth strategies in these new growth areas.
And the third is to improve brand power. In addition to the brand strategy initiatives in each market, we will use the enhancement of the Logisnext brand power, along with the increased recognition of Logisnext itself, which is named after the Company, to foster a sense of unity and corporate culture among the employees of the Group companies and to raise morale. The third basic strategy is to develop this brand enhancement both internally and externally.

I would like to explain our management policy for FY2021.
FY2021 is an important first year of our mid-term plan, and we have positioned it as the start-up and foundation building phase. In order to achieve sales of JPY500 billion and an operating income margin of 6% in FY2023, we will continue our efforts to date, as well as clarify our 3 basic strategies and the path to implementation.
In this context, we believe that we need to place particular priority on strengthening our corporate resilience and building a stable financial base for the future, so that we can respond quickly and appropriately to changes in the business environment.

I would like to start by explaining our growth strategy for the ML Group.
ALESIS, the first new model of battery-powered forklift after the merger, which was released in November 2019, won the Good Design Award and the 50th IDEA Machine Industrial Design Award in 2020. The stylish exterior design, visibility from the driver's seat, and ease of operation were highly evaluated, and we are confident that this has led to the enhancement of the brand power of ALESIS and, by extension, Logisnext, as well as the strengthening of our sales capabilities.

The second initiative for growth is the development of advanced technologies.
As for the development of advanced technologies, to give you a concrete example, as you may have seen in the video explaining our mid-term plan posted on our website, we have jointly developed AGF SynX-Vehicle based on the SigmaSynX concept of Mitsubishi Heavy Industries, Ltd. at the Logistics Test Center in the Takasago district of the Mitsubishi Heavy Industries Research & Innovation Center.
In terms of safety, a forklift man detection system, which constantly monitors the surroundings of the vehicle with multiple cameras and uses AI functions to alert the operator of approaching people to ensure safety on the job site, is scheduled to go on sale in the near future as an option for large forklifts.

The third initiative for growth is automation technology.
Please see this diagram, which is very detailed. Our products, which support container cargo handling at port terminals around the world, are divided into handling vehicles and terminal management systems, providing solutions in terms of both hardware and software.
Recently, there has been a demand for smart work in the entire cycle of construction, maintenance and operation of ports and harbors, utilizing AI and IoT. In response to this growing trend of smart work, we have developed a new function that combines remote monitoring, transfer cranes, RTG, and systems incorporating IoT, AI, etc.
By analyzing the accumulated data, we will aim to further improve the operational efficiency of port terminals.
Today, the Company and Mitsubishi Heavy Industries jointly announced a carbon-neutral initiative to reduce CO2 emissions at ports, as part of the energy transition initiative of the MHI Group. Please see the press release later.
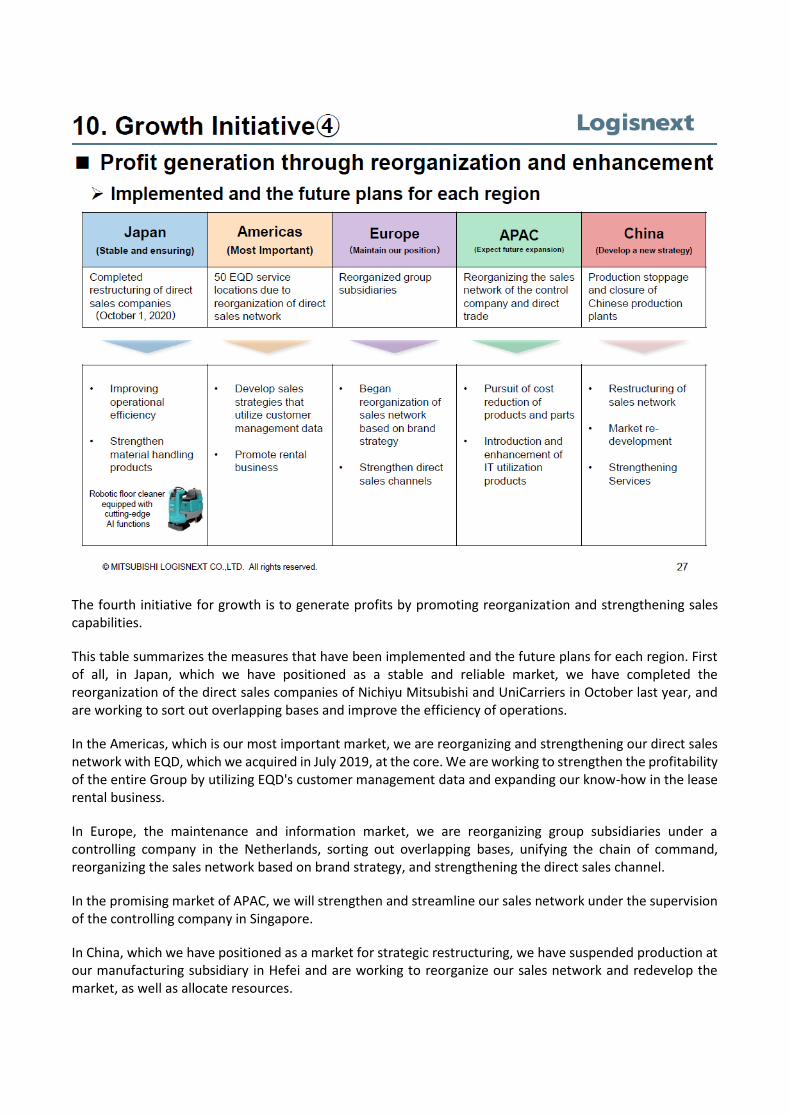
The fourth initiative for growth is to generate profits by promoting reorganization and strengthening sales capabilities.
This table summarizes the measures that have been implemented and the future plans for each region. First of all, in Japan, which we have positioned as a stable and reliable market, we have completed the reorganization of the direct sales companies of Nichiyu Mitsubishi and UniCarriers in October last year, and are working to sort out overlapping bases and improve the efficiency of operations.
In the Americas, which is our most important market, we are reorganizing and strengthening our direct sales network with EQD, which we acquired in July 2019, at the core. We are working to strengthen the profitability of the entire Group by utilizing EQD's customer management data and expanding our know-how in the lease rental business.
In Europe, the maintenance and information market, we are reorganizing group subsidiaries under a controlling company in the Netherlands, sorting out overlapping bases, unifying the chain of command, reorganizing the sales network based on brand strategy, and strengthening the direct sales channel.
In the promising market of APAC, we will strengthen and streamline our sales network under the supervision of the controlling company in Singapore.
In China, which we have positioned as a market for strategic restructuring, we have suspended production at our manufacturing subsidiary in Hefei and are working to reorganize our sales network and redevelop the market, as well as allocate resources.
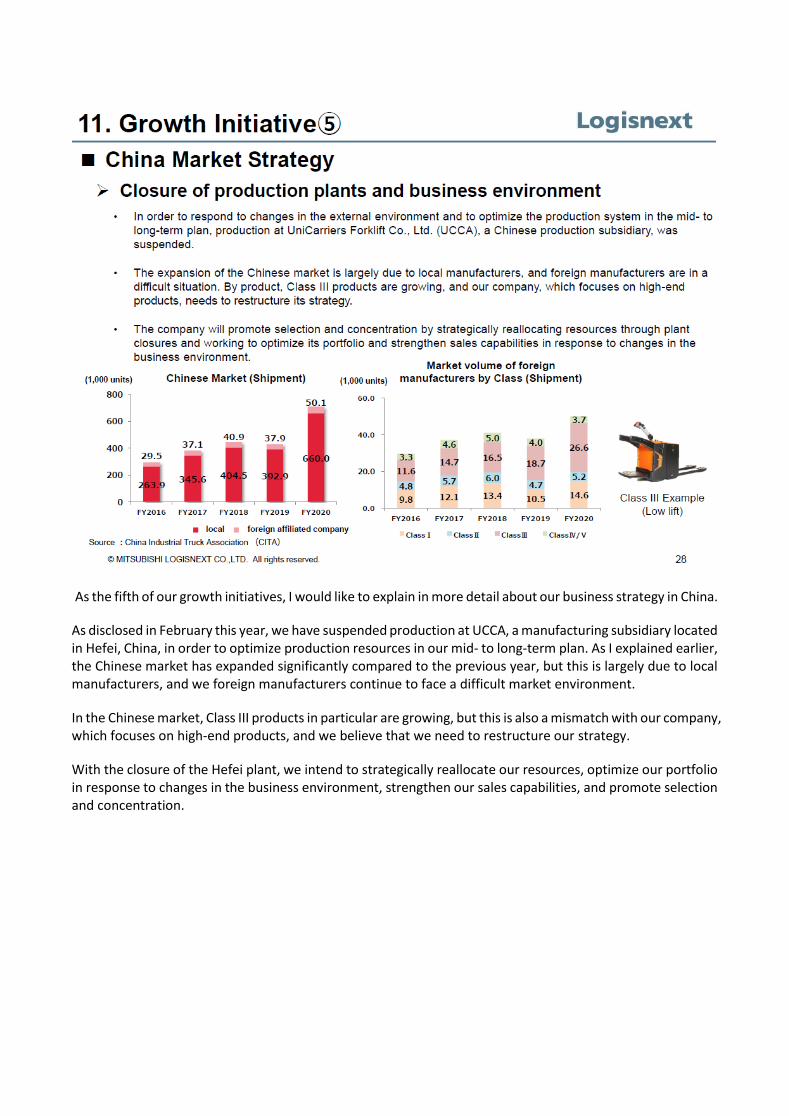
As the fifth of our growth initiatives, I would like to explain in more detail about our business strategy in China.
As disclosed in February this year, we have suspended production at UCCA, a manufacturing subsidiary located in Hefei, China, in order to optimize production resources in our mid- to long-term plan. As I explained earlier, the Chinese market has expanded significantly compared to the previous year, but this is largely due to local manufacturers, and we foreign manufacturers continue to face a difficult market environment.
In the Chinese market, Class III products in particular are growing, but this is also a mismatch with our company, which focuses on high-end products, and we believe that we need to restructure our strategy.
With the closure of the Hefei plant, we intend to strategically reallocate our resources, optimize our portfolio in response to changes in the business environment, strengthen our sales capabilities, and promote selection and concentration.

As the sixth growth initiative, I would like to discuss the logistics solutions market in the Americas.
As one of the measures to expand the logistics solutions business, we are expanding sales of warehouse models and AGVs in the US. We call this the EQ Solution. The US market for logistics solutions will become more diversified and accept small lot orders.. In addition, with the expansion of the ecommerce market and the increase in the number of small warehouses and 3PL businesses, the market is expected to grow to USD24.1 billion by 2025, and with an average annual growth rate of nearly 10%, we believe it is a very promising market.
As the market for logistics solutions expands, EQ Solution will add warehousing models and AGVs designed by MLFI, our Finnish manufacturing subsidiary, to EQD's sales lineup and introduce high value-added products to capture the demand for solutions.

As the seventh of our growth initiatives, I would like to explain the SDGs.
In order for the Group to develop sustainably together with society, we have formulated a new basic policy for the SDGs based on our management policy and corporate philosophy. We have identified 14 materiality items in light of our ESG activities, considering their importance as our business and the interest of and impact on our stakeholders. We will particularly focus on the 8 SDGs related to this.
In December last year, the Mitsubishi Logisnext SDGs Report was posted on our website. Please take time to review that later.

Last but not least, I would like to explain the eighth growth initiative, which is to improve our brand power.
Our brand pyramid consists of our company name, Mitsubishi Logisnext, at the top and our corporate brand, Logisnext, below it. In order to promote the Logisnext brand, we have been changing the names of our domestic sales companies and overseas subsidiaries to Logisnext-branded companies.
As for category brands, we will continue to use brands that have been in use for a long time and have penetrated the market, but we will promote brand division along with the reorganization of our sales network.
To summarize our brand strategy, for category brands, we will fully utilize brands with high name recognition in each region and product lineup. As for our corporate brand, Logisnext, we have already launched a project that includes mid-level and younger employees to develop strategies for inner and outer branding, and we will continue to work on raising awareness.
This concludes my explanation of the financial results and management policy. Thank you very much for your attention.
Moderator: Thank you very much. This concludes the explanation of the materials.

Question & Answer
Moderator: We will now move on to the question and answer session.
Now, if you have any questions, please ask them.
<Q1> Q1: I am Shitamori from Mitsubishi UFJ Trust and Banking Corporation. Thank you for your help. I would like to ask for 3 points.
First, on page 11, we have a list of the business forecasts for the current fiscal year, and there is a slight gap between the 20% growth in sales volume and the 10% increase in sales. Do you think that services other than the main unit will not grow much, or do you think that the average unit price will decrease due to changes in the product mix? This is the first point.
Uno: As you pointed out, basically, the main reason for the increase in sales in the fiscal year ended March 2021 and the fiscal year ending March 2022 is the increase in sales volume.
It is difficult to answer the question of how to set the unit price per unit, since the model mix from region to region. The average unit price of battery-powered cars is JPY1.5 million or JPY2 million, and the average unit price of engine cars is about JPY500,000 higher than that.
We are naturally expecting the increase in revenue from services. In terms of service, we believe that if the number of vehicles used by customers in the market increases as a result of steadily increasing new vehicle sales, service revenue will increase in proportion to the cumulative increase in the number of vehicles under management, as we call it.
In particular, looking back at the fiscal year ended March 31, 2021, the first quarter was a time of lockdown in many countries, regions, and cities under the spread of the new coronavirus infection. If the customer's forklift is not in operation, repairs and replacement parts are not sold. In addition, at locations where we sell directly to customers, we cannot provide inspection services unless our service personnel are able to visit the customers, so service income dropped significantly in the first quarter of last fiscal year. We expect a recovery from that.
However, if you look at the consolidated net sales of 400 billion yen and 430 billion yen, the main reason for the increase in sales is the increase in new car sales. Please understand that this is because of the product mix and regional mix.
Q1: I understand. Secondly, in your plan for the current fiscal year, on page 12, you have given us the factors behind the increase and decrease in operating income. Could you explain a little bit about how the integration synergies will be reflected in the results for the current fiscal year?
Uno: I understand that when you say integration, you are referring to the integration of Nichiyu Mitsubishi and UniCarriers. We hope that we can reduce fixed costs by consolidating and eliminating bases. The most representative example of this is Japan. As you know, we reorganized and integrated the former UniCarriers sales companies in Japan and the former Nichiyu Mitsubishi sales companies on October 1 last year and are now operating under a new structure.
However, as far as the immediate effect of consolidation and elimination of bases is concerned, we need to have service factory functions and other functions to repair customers’ forklifts at our bases. Even if we are

to consolidate, there are factors and reasons that prevent us from immediately securing a site and establishing a new integration base. We are trying to trace the effects over multiple years.
In the US and Europe, as well as in Asia, we have integrated 2 systems of operation into one. In order to integrate our operations, we have had to unify our systems. In that sense, in terms of fixed costs, I think that the system investment will slightly offset the reduction in personnel and various operational expenses that will result from the integration. Now, I mentioned a little bit on the expenditure side.
Now, on the sales side, we are naturally expecting a lot. In terms of consolidating the sales structure, we expect to be able to approach large customers in the US and Europe, as well as in Japan, who purchase intensively, with a large and broad product lineup and a powerful approach. In this way, we expect to be able to make a powerful approach.
We are also introducing a new model called ALESIS developed after the integration in Japan. Although we cannot immediately introduce 2, 3, or 4 new models, we will steadily introduce such integrated models to the market over several years. We are expecting sales growth in these areas.
Now let's talk about how much this is. To be honest, most of our earnings forecast for the fiscal year ending March 2022 is based on revenue growth based on the extent to which the market will recover. I would like you to understand that we are unable to explain such figures.
Q1: I understand. The third and final point. On page 25, you talked about making products autonomous and intelligent. The type of business of the target customers in this area. I would like to know if there are any particular areas that you would like to market to.
Also, how long will it take for these products to generate sales, and will there be a reasonable demand for them in the near future? Will it take a long time, maybe 5 years? Can you tell us a little bit about the time frame in which you think demand for these products will emerge? This is the last one.
Kagami: This time, we introduced 2 systems: “ΣSynX” and “Automatic Human Detection System of Forklift”.
First, "ΣSynX" is not an actual product, but a name for a development method. Specifically, once a hypothesis has been formulated, a prototype is produced first, and then the hypothesis is tested and verified. As an example, the photo above is a prototype of an unmanned forklift truck, which has not yet been commercialized. When it is commercialized, our target market will be large-scale distribution warehouses and mass-production warehouses of manufacturers. Again, since we have not yet commercialized the system, we believe it will take some time before it becomes effective for management.
The other photo shows "Automatic Human Detection System of Forklift", which is almost ready for commercialization and is scheduled to go on sale in the near future. Our target market is customers who are highly safety conscious and use multiple large forklifts and port cargo handling equipment. Since large forklifts have many blind spots due to their large size, we believe that this product will be effective in preventing accidents. Since it takes a considerable amount of time for the product to be delivered, we expect it to be effective for business management from the end of the current fiscal year to the next fiscal year at the earliest.
Q1: I understand very well. Thank you very much. That is all.
<Q2> Q2: I would like to ask you 2 simple questions.
With the recent decarbonization trend, do you feel that there is a tailwind in demand for battery-powered vehicles? At the same time, is there a growing sense of headwind against engine cars? This is the first point.

Kubo: The use of electric vehicles has been going on for a long time due to environmental concerns, and in recent years, the use of electric vehicles has been increasing worldwide due to decarbonization. This varies from region to region, but the global market for electric vehicles is now 60% to 70%, and our sales ratio of electric vehicles is also increasing to about 60%.
Especially in Europe, the ratio of electric vehicles has already exceeded 80%, and in China, where regulations are becoming much stricter, the ratio of electric vehicles is expected to be 50% to 60%.
Q2: On the other hand, if that is the case, is the demand for engine cars facing a headwind more and more?
Kubo: This is an unavoidable trend in the world. However, there are still some characteristics of engine vehicles in terms of performance, as cargo handling can only be provided by engine vehicles. There are some industries with heavy products and where operation is difficult. We would sell engine cars to those areas. However, we are going to differentiate our efforts to supply engines with low environmental impact.
Q2: Understood. If this story continues in the future, the decline in the unit price that Mr. Uno explained earlier, which is based on calculations, will probably be influenced by the product mix, but will this continue every year? One is whether this will continue every year, and the other is whether we should be prepared for additional restructuring or other burdens in assets related to engine vehicles.
Kubo: In terms of profitability, engine cars are certainly more profitable, even in the downstream business. However, in terms of profit, we are trying to expand our business downstream by increasing direct sales of electric vehicles. We are planning to expand such efforts in various parts of the world.
As for assets, we are currently working on the production of electric vehicles at plants that produce engine vehicles. We have also started to mix engine and electric vehicles on the same line to improve efficiency, and we actually have such plants.
Therefore, we will continue to use engine vehicles in the future, but we are now working on engine vehicles that will reduce the burden on the environment.
Q2: Understood. Have you factored in any extraordinary losses in your budget this year? The range between pre-tax and net income is quite large.
Uno: Since the amortization of goodwill assets in the narrow sense cannot be taxed, our P/L has the characteristic of making the tax burden appear larger than it really is. As for extraordinary losses, as you can clearly see from the financial statements for the current fiscal year and the previous fiscal year ending March 2020, our judgment is that we have exhausted them in the process of proceeding with the integrated PMI.
Q2: Understood. Thank you very much. That is all.
Kagami: I would like to give a supplementary explanation on the unit price of forklift engine vehicles and battery-powered vehicles. As you know, the lineup of engine vehicles ranges from small vehicles of 1 to 2 tons to large vehicles of over 30 tons, and the unit price ranges from 1 million yen to tens of millions of yen. On the other hand, battery-powered cars are medium-sized cars ranging from 1 to 2 tons up to 6 tons at the most, and the volume zone is 2.5 tons, and sales of medium-sized cars are very small. Therefore, the average unit price per vehicle tends to be higher for engine cars. However, the unit price of battery-powered cars is almost 1.5 times higher than that of engine cars when compared with the same tonnage. Based on the above, we believe that if the shift to battery-powered medium- and heavy-duty vehicles continues, we will not be disadvantaged in terms of sales.
Q2: In that sense, the average unit price might be as you say. The next point will be how to increase downstream business in the battery field. Do I understand that correctly?

Kagami: Downstream business is also forming for battery-powered vehicles, but I dare say that we need to address the fact that there are not enough reach types (stand-up type). Also, maintenance needs to be addressed.
Q2: Yes. Very clear. Thank you very much.
<Q3> Sawada: In your plan for this fiscal year, you have indicated that you will raise prices and improve costs in response to the JPY2.8 billion increase in material costs and JPY1.86 billion increase in freight costs. Please tell us about your measures.
Uno: This will be handled on an area-by-area basis. As for the impact of soaring material costs, for example, looking at the situation of steel materials, while prices have risen significantly in China and the US, they have not yet risen that much in Japan. There is a difference in price between regions, so we would like to consider this on an area-by-area basis.
For example, I cannot say what we will do for the US market this time because there are some things that have not been decided yet. To give you an example from the past, when the Trump tariffs raised costs in the US, not only for forklift manufacturers, but also for many other manufacturing industries, we in the US, as well as other companies and other industries, were able to pass on the increased costs to our customers and distributors without too much stress. I think it is clear that the American market is such a market.
I also think that there has been this trend in Europe in the past as well. So is the fare as well. Will we pass on the fare increase to the surcharge as well, or will we raise the price itself? This will depend on our sales plan, sales strategy, and how many units we want to sell first, but we will take appropriate measures.
Q3: Thank you very much. In your plan for the current fiscal year, for example, is it included in the increase in gross profit due to the increase in sales? Or is it something that will not happen this year but will come in next year or later? Or have you not included it?
Uno: I believe you are talking about the document on page 12. The sales price improvement will be JPY2 billion, and it would be good if the total of the material cost hike and freight increase were same as the sales price improvement, but this is not the case. We have factored in our response to such cost increases in the sales price improvement.
Q3: Can we expect that this is due to a time lag and that you will be able to generate more profit?
Uno: Well, I know we cannot cover everything. Another factor is the time lag between the sales price improvement and the profit generation.
Sawada: I understand very well. Thank you.
Moderator: As the time has expired, this concludes the financial results briefing of Mitsubishi Logisnext.
Thank you very much for taking time out of your busy schedule to join us today.