Mitochondrial Variability as a Source of Extrinsic...
14
Mitochondrial Variability as a Source of Extrinsic Cellular Noise Iain G. Johnston 1,2 , Bernadett Gaal 1,3 , Ricardo Pires das Neves 4,5 , Tariq Enver 3 , Francisco J. Iborra 6 *, Nick S. Jones 1,2,7 * 1 Department of Physics, Clarendon Laboratory, Oxford, United Kingdom, 2 Oxford Centre for Integrative Systems Biology, Department of Biochemistry, Oxford, United Kingdom, 3 UCL Cancer Institute, University College London, London, United Kingdom, 4 Center for Neuroscience and Cell Biology, University of Coimbra, Coimbra, Portugal, 5 Biomaterials and Stem Cell-based Therapeutics Group and Biocant – Center of Innovation and Biotechnology, Cantanhede, Portugal, 6 Department of Molecular and Cellular Biology, Centro Nacional de Biotecnologı ´a, Consejo Superior de Investigaciones Cientı ´ficas, Madrid, Spain, 7 Department of Mathematics, Imperial College London, London, United Kingdom Abstract We present a study investigating the role of mitochondrial variability in generating noise in eukaryotic cells. Noise in cellular physiology plays an important role in many fundamental cellular processes, including transcription, translation, stem cell differentiation and response to medication, but the specific random influences that affect these processes have yet to be clearly elucidated. Here we present a mechanism by which variability in mitochondrial volume and functionality, along with cell cycle dynamics, is linked to variability in transcription rate and hence has a profound effect on downstream cellular processes. Our model mechanism is supported by an appreciable volume of recent experimental evidence, and we present the results of several new experiments with which our model is also consistent. We find that noise due to mitochondrial variability can sometimes dominate over other extrinsic noise sources (such as cell cycle asynchronicity) and can significantly affect large-scale observable properties such as cell cycle length and gene expression levels. We also explore two recent regulatory network-based models for stem cell differentiation, and find that extrinsic noise in transcription rate causes appreciable variability in the behaviour of these model systems. These results suggest that mitochondrial and transcriptional variability may be an important mechanism influencing a large variety of cellular processes and properties. Citation: Johnston IG, Gaal B, Pires das Neves R, Enver T, Iborra FJ, et al. (2012) Mitochondrial Variability as a Source of Extrinsic Cellular Noise. PLoS Comput Biol 8(3): e1002416. doi:10.1371/journal.pcbi.1002416 Editor: Jason M. Haugh, North Carolina State University, United States of America Received August 2, 2011; Accepted January 20, 2012; Published March 8, 2012 Copyright: ß 2012 Johnston et al. This is an open-access article distributed under the terms of the Creative Commons Attribution License, which permits unrestricted use, distribution, and reproduction in any medium, provided the original author and source are credited. Funding: The study was funded through BBSRC grant number BBD0201901. The funders had no role in study design, data collection and analysis, decision to publish, or preparation of the manuscript. Competing Interests: The authors have declared that no competing interests exist. * E-mail: [email protected] (FJI); [email protected] (NSJ) Introduction Stochastic influences significantly affect a multitude of processes in cellular biology [1–5]. Understanding the sources of this randomness within and between cells is a central current challenge in quantitative biology. Noise has been found to affect processes including stem cell fate decisions [6], bet-hedging in bacterial phenotypes [7,8], cancer development [9], and responses to apoptosis-inducing factors [10,11]. In this paper, we consider how mitochondria may constitute a significant source of this cellular noise. Noise in cellular processes may result from sources intrinsic to the gene in question (those responsible for differences in the expression levels of genes under identical regulation in the same cell) or extrinsic sources (those responsible for cell-to-cell variation in genes under identical regulation in a population). Both intrinsic and extrinsic noise sources contribute to the overall noise observed in, for example, transcription rates and protein expression levels [12]. The interplay between intrinsic and extrinsic noise can be characterised with elegant experimental techniques such as dual reporter measurements [3], in which the expression levels of two proteins are measured within cells and within a population, but subtleties exist in disambiguating intrinsic and extrinsic contribu- tions to noise levels [13]. Some studies have found the contribution of extrinsic factors to overall noise levels to be stronger in eukaryotes [14,15] than prokaryotes [3], although others debate this interpre- tation [16]. To investigate these influences, several mathematical models for the emergence of intrinsic and extrinsic cellular noise have been introduced and explored [12,17–24]. In addition, recent studies have investigated, both experimentally and theoretically, the architecture of extrinsic noise and its causal factors [14–16,19,25– 27], though substantial uncertainty surrounds the importance of individual contributions (such as variability in cell cycle stage and cellular volume) to extrinsic noise [28]. Huh and Paulsson recently argued that uneven segregration of cellular constituents at mitosis can contribute significantly to cell- to-cell differences in levels of cellular components and proteins in a population, focusing on stochasticity in protein inheritance between sister cells [29,30]. We focus on a specific instance of this phenomenon: cell-to-cell variability in the mitochondrial content of cells. An experimental study performed by das Neves et al. identified uneven partitioning of mitochondria at mitosis as being a possibly significant source of extrinsic noise in eukaryotes [31], supporting recent theoretical ideas [30]. Mitochondria have been found to display remarkably complex behaviour interwoven with cellular processes [32–34] and to display significant heterogeneity within cells [31,35–37]. Mitochondrial influences PLoS Computational Biology | www.ploscompbiol.org 1 March 2012 | Volume 8 | Issue 3 | e1002416
Transcript of Mitochondrial Variability as a Source of Extrinsic...

Mitochondrial Variability as a Source of Extrinsic CellularNoiseIain G. Johnston1,2, Bernadett Gaal1,3, Ricardo Pires das Neves4,5, Tariq Enver3, Francisco J. Iborra6*,
Nick S. Jones1,2,7*
1 Department of Physics, Clarendon Laboratory, Oxford, United Kingdom, 2 Oxford Centre for Integrative Systems Biology, Department of Biochemistry, Oxford, United
Kingdom, 3 UCL Cancer Institute, University College London, London, United Kingdom, 4 Center for Neuroscience and Cell Biology, University of Coimbra, Coimbra,
Portugal, 5 Biomaterials and Stem Cell-based Therapeutics Group and Biocant – Center of Innovation and Biotechnology, Cantanhede, Portugal, 6 Department of
Molecular and Cellular Biology, Centro Nacional de Biotecnologıa, Consejo Superior de Investigaciones Cientıficas, Madrid, Spain, 7 Department of Mathematics, Imperial
College London, London, United Kingdom
Abstract
We present a study investigating the role of mitochondrial variability in generating noise in eukaryotic cells. Noise in cellularphysiology plays an important role in many fundamental cellular processes, including transcription, translation, stem celldifferentiation and response to medication, but the specific random influences that affect these processes have yet to beclearly elucidated. Here we present a mechanism by which variability in mitochondrial volume and functionality, along withcell cycle dynamics, is linked to variability in transcription rate and hence has a profound effect on downstream cellularprocesses. Our model mechanism is supported by an appreciable volume of recent experimental evidence, and we presentthe results of several new experiments with which our model is also consistent. We find that noise due to mitochondrialvariability can sometimes dominate over other extrinsic noise sources (such as cell cycle asynchronicity) and cansignificantly affect large-scale observable properties such as cell cycle length and gene expression levels. We also exploretwo recent regulatory network-based models for stem cell differentiation, and find that extrinsic noise in transcription ratecauses appreciable variability in the behaviour of these model systems. These results suggest that mitochondrial andtranscriptional variability may be an important mechanism influencing a large variety of cellular processes and properties.
Citation: Johnston IG, Gaal B, Pires das Neves R, Enver T, Iborra FJ, et al. (2012) Mitochondrial Variability as a Source of Extrinsic Cellular Noise. PLoS ComputBiol 8(3): e1002416. doi:10.1371/journal.pcbi.1002416
Editor: Jason M. Haugh, North Carolina State University, United States of America
Received August 2, 2011; Accepted January 20, 2012; Published March 8, 2012
Copyright: � 2012 Johnston et al. This is an open-access article distributed under the terms of the Creative Commons Attribution License, which permitsunrestricted use, distribution, and reproduction in any medium, provided the original author and source are credited.
Funding: The study was funded through BBSRC grant number BBD0201901. The funders had no role in study design, data collection and analysis, decision topublish, or preparation of the manuscript.
Competing Interests: The authors have declared that no competing interests exist.
* E-mail: [email protected] (FJI); [email protected] (NSJ)
Introduction
Stochastic influences significantly affect a multitude of processes in
cellular biology [1–5]. Understanding the sources of this randomness
within and between cells is a central current challenge in quantitative
biology. Noise has been found to affect processes including stem cell
fate decisions [6], bet-hedging in bacterial phenotypes [7,8], cancer
development [9], and responses to apoptosis-inducing factors
[10,11]. In this paper, we consider how mitochondria may constitute
a significant source of this cellular noise.
Noise in cellular processes may result from sources intrinsic to the
gene in question (those responsible for differences in the expression
levels of genes under identical regulation in the same cell) or
extrinsic sources (those responsible for cell-to-cell variation in genes
under identical regulation in a population). Both intrinsic and
extrinsic noise sources contribute to the overall noise observed in,
for example, transcription rates and protein expression levels [12].
The interplay between intrinsic and extrinsic noise can be
characterised with elegant experimental techniques such as dual
reporter measurements [3], in which the expression levels of two
proteins are measured within cells and within a population, but
subtleties exist in disambiguating intrinsic and extrinsic contribu-
tions to noise levels [13]. Some studies have found the contribution
of extrinsic factors to overall noise levels to be stronger in eukaryotes
[14,15] than prokaryotes [3], although others debate this interpre-
tation [16]. To investigate these influences, several mathematical
models for the emergence of intrinsic and extrinsic cellular noise
have been introduced and explored [12,17–24]. In addition, recent
studies have investigated, both experimentally and theoretically, the
architecture of extrinsic noise and its causal factors [14–16,19,25–
27], though substantial uncertainty surrounds the importance of
individual contributions (such as variability in cell cycle stage and
cellular volume) to extrinsic noise [28].
Huh and Paulsson recently argued that uneven segregration of
cellular constituents at mitosis can contribute significantly to cell-
to-cell differences in levels of cellular components and proteins in a
population, focusing on stochasticity in protein inheritance
between sister cells [29,30]. We focus on a specific instance of
this phenomenon: cell-to-cell variability in the mitochondrial
content of cells. An experimental study performed by das Neves
et al. identified uneven partitioning of mitochondria at mitosis as
being a possibly significant source of extrinsic noise in eukaryotes
[31], supporting recent theoretical ideas [30]. Mitochondria have
been found to display remarkably complex behaviour interwoven
with cellular processes [32–34] and to display significant
heterogeneity within cells [31,35–37]. Mitochondrial influences
PLoS Computational Biology | www.ploscompbiol.org 1 March 2012 | Volume 8 | Issue 3 | e1002416

on processes including stem cell differentation [38] and cell cycle
progression [39–41] have recently been observed.
das Neves et al. [31] observe a wide spread of mitochondrial
masses in a population of cells, illustrating extrinsic variability in
organelle distribution. Mitochondrial functionality has also been
observed to vary between cells [34,35,42–44]. das Neves et al. also
observed a link between mitochondrial mass and membrane
potential and cellular ATP levels, and found transcription rate to
be a function of ATP concentration. In addition, the modulation
of mitochondrial functionality, through anti- and pro-oxidant
treatments, was found to alter cell-to-cell variability in transcrip-
tion rates, with anti-oxidants significantly reducing variability and
pro-oxidants increasing variability. These results suggest that cell-
to-cell heterogeneity in mitochondrial mass and functionality may
propagate into extrinsic noise in transcription rate, and thence-
forth processes further downstream, but the quantitative links
behind these processes remain unclear. We introduce a simple
approach, consistent with a range of experimental observations,
that quantitatively connects all these features and predicts the
downstream physiological influence of mitochondrial variability.
Shahrezaei et al. [45] have recently shown that extrinsic noise can
influence levels of intrinsic noise, as cell-to-cell variability in the rates
of processes such as transcription and translation affect the intrinsic
dynamics of gene expression. In addition, they provided an
extension to standard stochastic simulation techniques to allow this
variability in the production rates of chemical species to be
accurately simulated – a problem that has been approached
using different techniques in previous studies [46,47]. However,
this theoretical study did not attempt to characterise the physio-
logical causes of this extrinsic noise – an important consideration in
assessing the ubiquity and consequences of cellular noise. Our
proposal that cell-to-cell mitochondrial variability provides a
significant source of extrinsic noise in transcription addresses these
causes, and we show that extrinsic noise resulting from mitochon-
drial variability could significantly influence intrinsic noise in gene
expression.
This paper will proceed as follows. We first introduce one of the
simplest possible mathematical models for variation in mitochon-
drial mass and functionality during and between cell cycles, and
show that it is consistent with a wide range of experimental data,
both from the literature and newly reported here, and allows
analytical treatment. Our model includes stochastic segregation of
mitochondria at mitosis and functional differences in mitochondria
between cells, and contains a simple dynamic description of the time
evolution of cellular volume and mitochondrial mass through the
cell cycle. To our knowledge it is the first model of its kind which
links mitochondrial mass and function to the cell cycle and gene
expression. We relate mitochondrial properties to the production of
ATP in the cell, which in turn affects transcription rates: hence,
variability in mitochondrial properties causes downstream variabil-
ity in transcription. Next, we incorporate the behaviour produced
by our model into a common framework for cellular noise, and
show that extrinsic noise due to variation in ½ATP� can have a
profound effect on gene expression levels, dominating over intrinsic
noise. We then demonstrate the cell physiological implications of
energy variability by showing how mitochondrial variability may
affect stem cell differentation. Finally, we discuss how our model
relates to recent work characterising sources of extrinsic noise, and
suggest experiments to allow more refined models.
Results
In this section, we first describe the approach we use to model
mitochondrial variability in a population of cells. Next, we compare
recent experimental data from Ref. [31] (demonstrating transcrip-
tion rate variability in a range of cell types and exploring cellular
variability in detail in HeLa cells) to the predictions of our model
and demonstrate that a good agreement exists across a wide range of
experiments. We then report new experimental results of relevance
to the study of mitochondrial variability and show that these too
largely agree with the predictions from our simple model. This set of
successful comparisons suggests that our model is capable of
producing quantitatively sound estimates of the levels of noise
associated with mitochondrial sources of variability. Motivated by
these results, we next show how our model allows a quantitative link
to be formed between mitochondrial variability and variability in
transcription rate in cells. We explore this link by investigating the
predictions that our model makes concerning noise in models of
gene expression levels, and in models of stem cell differentiation
pathways. We find that the mitochondrial sources of variability from
our model could provide a substantial contribution to noise levels in
mRNA and protein levels within the cell, and can influence stem cell
differentiation in a manner that depends upon the symmetry of the
regulatory interactions that drive differentiation.
ModelWhile the heterogeneity of mitochondria has been observed
experimentally and connected to variability in processes like
transcription [31] and stem cell differentiation [38], the mecha-
nisms by which mitochondrial variability influences other cellular
processes has not been elucidated clearly. Here, we describe a
simple model which formalises these links, and note that it is
consistent with recent experimental results concerning mitochon-
drial heterogeneity (and variability in connected cellular features)
[31]. The simplicity of our model means that analytic expressions
can be derived for many quantities of interest, facilitating a more
complete and intuitive understanding of the modelled biological
connections. We will then use this model to investigate more
specific questions regarding the links between mitochondrial
variability and transcription rate and stem cell differentiation.
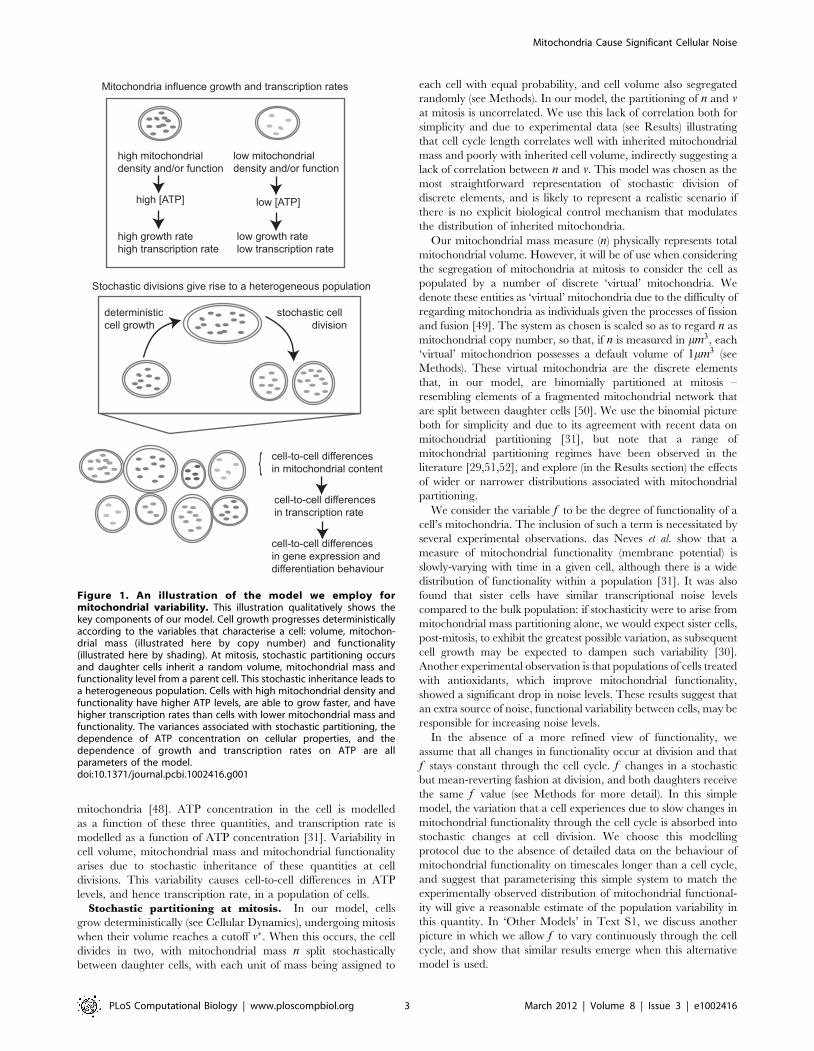
The central concept behind our model is illustrated in Fig. 1.
Individual cells are characterised by three key variables: the
volume of the cell (v); the amount of mitochondrial mass in the cell
(n); and the degree of mitochondrial functionality (f ). This last
quantity, f , represents a coarse-grained measure of the efficiency
of mitochondria within a cell – a factor which may be affected, for
example, by the levels of reactive oxygen species (ROS),
mitochondrial membrane potential, variability in mitochondrial
protein complex abundance, and genetic differences between
Author Summary
Cellular variability has been found to play a major role indiverse and important phenomena, including stem celldifferentiation and drug resistance, but the sources of thisvariability have yet to be satisfactorily explained. Wepropose a mechanism, supported by a substantial numberof recent and new experiments, by which cell-to-celldifferences in both the number and functionality ofmitochondria – the organelles responsible for energyproduction in eukaryotes – leads to variability in transcrip-tion rate between cells and may hence be a significantsource of cellular noise in many downstream processes. Weillustrate the downstream effect of mitochondrial variabilitythrough simulated studies of protein expression and stemcell differentiation, and suggest possible experimentalapproaches to further elucidate this mechanism.
Mitochondria Cause Significant Cellular Noise
PLoS Computational Biology | www.ploscompbiol.org 2 March 2012 | Volume 8 | Issue 3 | e1002416
mitochondria [48]. ATP concentration in the cell is modelled
as a function of these three quantities, and transcription rate is
modelled as a function of ATP concentration [31]. Variability in
cell volume, mitochondrial mass and mitochondrial functionality
arises due to stochastic inheritance of these quantities at cell
divisions. This variability causes cell-to-cell differences in ATP
levels, and hence transcription rate, in a population of cells.
Stochastic partitioning at mitosis. In our model, cells
grow deterministically (see Cellular Dynamics), undergoing mitosis
when their volume reaches a cutoff v�. When this occurs, the cell
divides in two, with mitochondrial mass n split stochastically
between daughter cells, with each unit of mass being assigned to
each cell with equal probability, and cell volume also segregated
randomly (see Methods). In our model, the partitioning of n and v
at mitosis is uncorrelated. We use this lack of correlation both for
simplicity and due to experimental data (see Results) illustrating
that cell cycle length correlates well with inherited mitochondrial
mass and poorly with inherited cell volume, indirectly suggesting a
lack of correlation between n and v. This model was chosen as the
most straightforward representation of stochastic division of
discrete elements, and is likely to represent a realistic scenario if
there is no explicit biological control mechanism that modulates
the distribution of inherited mitochondria.
Our mitochondrial mass measure (n) physically represents total
mitochondrial volume. However, it will be of use when considering
the segregation of mitochondria at mitosis to consider the cell as
populated by a number of discrete ‘virtual’ mitochondria. We
denote these entities as ‘virtual’ mitochondria due to the difficulty of
regarding mitochondria as individuals given the processes of fission
and fusion [49]. The system as chosen is scaled so as to regard n as
mitochondrial copy number, so that, if n is measured in mm3, each
‘virtual’ mitochondrion possesses a default volume of 1mm3 (see
Methods). These virtual mitochondria are the discrete elements
that, in our model, are binomially partitioned at mitosis –
resembling elements of a fragmented mitochondrial network that
are split between daughter cells [50]. We use the binomial picture
both for simplicity and due to its agreement with recent data on
mitochondrial partitioning [31], but note that a range of
mitochondrial partitioning regimes have been observed in the
literature [29,51,52], and explore (in the Results section) the effects
of wider or narrower distributions associated with mitochondrial
partitioning.
We consider the variable f to be the degree of functionality of a
cell’s mitochondria. The inclusion of such a term is necessitated by
several experimental observations. das Neves et al. show that a
measure of mitochondrial functionality (membrane potential) is
slowly-varying with time in a given cell, although there is a wide
distribution of functionality within a population [31]. It was also
found that sister cells have similar transcriptional noise levels
compared to the bulk population: if stochasticity were to arise from
mitochondrial mass partitioning alone, we would expect sister cells,
post-mitosis, to exhibit the greatest possible variation, as subsequent
cell growth may be expected to dampen such variability [30].
Another experimental observation is that populations of cells treated
with antioxidants, which improve mitochondrial functionality,
showed a significant drop in noise levels. These results suggest that
an extra source of noise, functional variability between cells, may be
responsible for increasing noise levels.
In the absence of a more refined view of functionality, we
assume that all changes in functionality occur at division and that
f stays constant through the cell cycle. f changes in a stochastic
but mean-reverting fashion at division, and both daughters receive
the same f value (see Methods for more detail). In this simple
model, the variation that a cell experiences due to slow changes in
mitochondrial functionality through the cell cycle is absorbed into
stochastic changes at cell division. We choose this modelling
protocol due to the absence of detailed data on the behaviour of
mitochondrial functionality on timescales longer than a cell cycle,
and suggest that parameterising this simple system to match the
experimentally observed distribution of mitochondrial functional-
ity will give a reasonable estimate of the population variability in
this quantity. In ‘Other Models’ in Text S1, we discuss another
picture in which we allow f to vary continuously through the cell
cycle, and show that similar results emerge when this alternative
model is used.
Figure 1. An illustration of the model we employ formitochondrial variability. This illustration qualitatively shows thekey components of our model. Cell growth progresses deterministicallyaccording to the variables that characterise a cell: volume, mitochon-drial mass (illustrated here by copy number) and functionality(illustrated here by shading). At mitosis, stochastic partitioning occursand daughter cells inherit a random volume, mitochondrial mass andfunctionality level from a parent cell. This stochastic inheritance leads toa heterogeneous population. Cells with high mitochondrial density andfunctionality have higher ATP levels, are able to grow faster, and havehigher transcription rates than cells with lower mitochondrial mass andfunctionality. The variances associated with stochastic partitioning, thedependence of ATP concentration on cellular properties, and thedependence of growth and transcription rates on ATP are allparameters of the model.doi:10.1371/journal.pcbi.1002416.g001
Mitochondria Cause Significant Cellular Noise
PLoS Computational Biology | www.ploscompbiol.org 3 March 2012 | Volume 8 | Issue 3 | e1002416
In this study, we will consider the oxidative state of a cell as a
key mediator of its functionality f . Recent experimental data has
shown that treating cells with pro- or anti-oxidants strongly affects
the statistics of transcription rate variability in a population [31].
Within our model, the effects of such chemical treatments on the
oxidative state of cells can straightforwardly be captured by
varying the parameters associated with functional inheritance (see
Methods).
½ATP� and transcription rate. We are interested in the
time evolution of ½ATP� as a potential stochastic influence on
downstream processes. Ref. [31] found ATP levels in the cell to be
proportional to mitochondrial mass (n) and membrane potential (a
factor that may be absorbed into our measure of ‘mitochondrial
function’ f ), motivating our choice of expression for ATP
concentration:
½ATP�~ cnf
v: ð1Þ
In this expression, c is a constant of proportionality linking the
quantities within our model to a biological ATP concentration,
and the meaning of the variable f now becomes apparent as a
scalar multiple relating mitochondrial density to ½ATP�. We note
that other choices for the form of ½ATP�, including ODEs, are
possible, and explore some alternatives in ‘Other Models’ (Text
S1). das Neves et al. also show a link between the total transcription
rate l in a cell (measured through bromo-uridine incorporation
across the whole nucleus) and ½ATP�, a sigmoidal curve, which we
approximate (see ‘Parameterisation of l’ in Text S1) with
l~s1zs2 tan{1 s3½ATP�zs4ð Þ: ð2Þ
das Neves et al. record a change in the structure of this sigmoid
curve in experiments where cellular chromatin is artifically
decondensed. In these situations, the sigmoidal response of l to
½ATP� becomes a hyperbolic curve, with a sharp, continuous
increase of l with ½ATP� at low ½ATP�. This change may reflect the
necessity of remodelling chromatin – a process that requires ATP –
for the transcription process. Chromatin remodelling has been noted
by several studies [15,16,22] to play an important role in mRNA
synthesis noise and hence downstream noise in gene expression.
Rather than attempting to model this influence explicitly, we use the
experimentally-determined form for l(½ATP�) to capture the overall
dependence of transcription rate (including chromatin effects) on
½ATP�.To summarise, in our model, transcription rate depends
sigmoidally on ATP concentration – a relationship elucidated
and quantified in recent experiments [31]. ATP concentration in
turn depends linearly on the mitochondrial mass and functionality
level of a cell and also on the cell volume. Cells with many, highly
functional mitochondria will have higher levels of ATP and hence
higher transcription rates than those with smaller, less functional
mitochondrial populations.
Cellular dynamics. Our model for cell cycle dynamics consists
of equations governing the time evolution of the key quantities
volume, mitochondrial mass, and mitochondrial functionality. In the
light of a recent study [53], and as cell cycle models often assume the
exponential growth picture, we expect an exponential form for cell
volume growth: _vv!vF (v,n,f ). Here, F (v,n,f ) is a function
expressing the dependence of volume growth rate on other
parameters.
We suggest that ATP concentration (½ATP�) plays a key role in
powering growth of the cell, so cells with higher ATP levels have
higher growth rates associated with cell volume and mitochondrial
mass. This link postulates that biosynthesis rates are generally, like
transcription, a function of ATP concentration. We note that
although ATP concentration has been suggested [31] as a possible
mechanism linking mitochondria and transcription rate, and some
evidence supports this link, it may be the case that a different
factor provides the causal mechanism, and ATP concentration is
correlated with this underlying factor. For example, ROS, which
adversely affect many cellular processes (including provoking a
decrease in transcription rates [31]), may be an alternative to ATP,
or a combination of ATP and ROS levels may act to determine
transcription rate.
Numerous historical studies, both in HeLa cells [54] and other
tissue types [55–60] have found that the density r of mitochondrial
mass (also called mitochondrial volume density) within cells of a
given tissue type is consistent between generations and within
populations. This consistency suggests that the time evolution of
mitochondrial mass should be (a) coupled with the time evolution of
volume and (b) of a form that allows damping of the inherent
stochasticity at mitosis. In addition to these features, it is presumably
reasonable to assume that mitochondrial growth is dependent on
available ½ATP� (due to the required protein synthesis). We suggest a
model that captures these required dependencies and incorporates
mean-reversion, given by the dynamic equations:
_vv~af rv ð3Þ
_nn~bf rv, ð4Þ
where r~n=v.
We note that this simple model does not distinguish between
volume growth rates at different times in the cell cycle, but yields a
smooth exponential growth in cell size throughout the cell cycle.
We work in this picture for simplicity and generality, but note that
a more sophisticated model would include a more detailed
description of cell growth as another potential source of variability
between cells.
The model’s dynamics result (see Methods) in a convergence in
mitochondrial density with time to a value b=a.
Model parameterisation. Values for the parameters in our
model were chosen (see Methods) to match a subset of experimental
data, illustrated in Fig. 2.
Our simple model is sufficient to approximate a large setof experimental data
Here we list a set of comparisons between predictions from our
model and experimental studies. Unless stated otherwise, we will
use experimental data from the study of das Neves et al. [31], using
the protocol ‘NX’ to refer to data in Fig. X of that study.
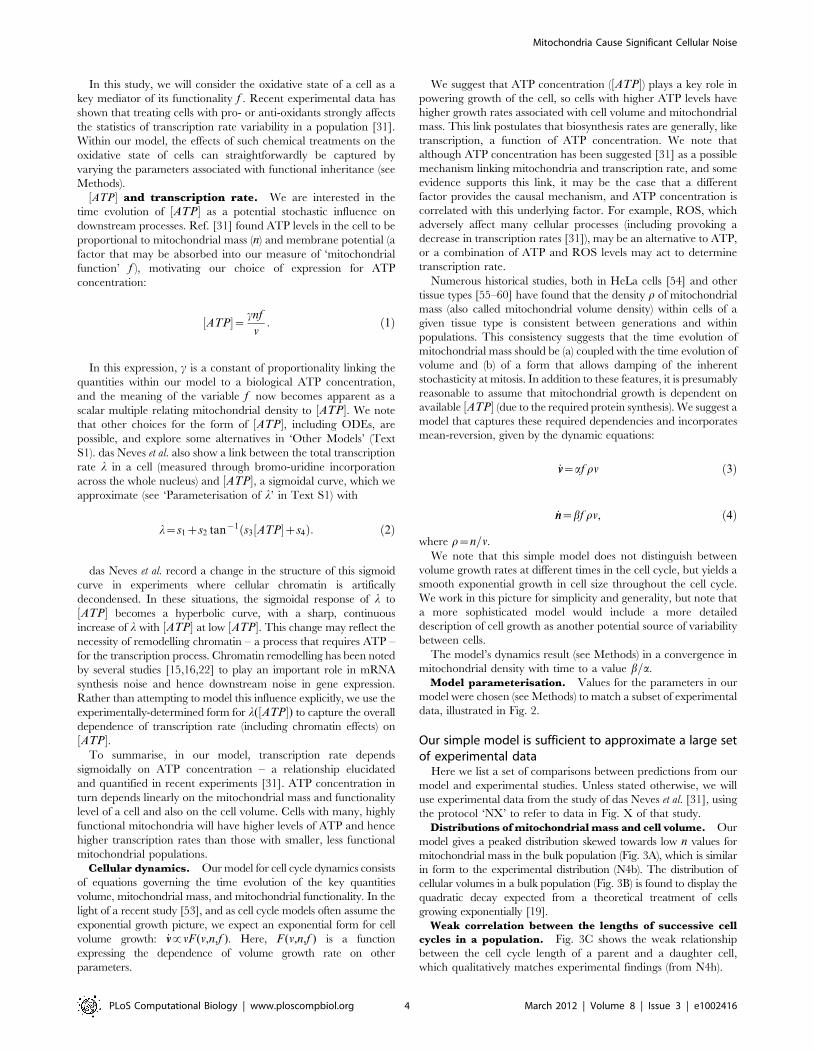
Distributions of mitochondrial mass and cell volume. Our
model gives a peaked distribution skewed towards low n values for
mitochondrial mass in the bulk population (Fig. 3A), which is similar
in form to the experimental distribution (N4b). The distribution of
cellular volumes in a bulk population (Fig. 3B) is found to display the
quadratic decay expected from a theoretical treatment of cells
growing exponentially [19].
Weak correlation between the lengths of successive cell
cycles in a population. Fig. 3C shows the weak relationship
between the cell cycle length of a parent and a daughter cell,
which qualitatively matches experimental findings (from N4h).
Mitochondria Cause Significant Cellular Noise
PLoS Computational Biology | www.ploscompbiol.org 4 March 2012 | Volume 8 | Issue 3 | e1002416

Mitochondrial mass at birth is a better predictor of cell
cycle length than cell volume at birth. Figs. 3D and 3E
illustrate the correlations between cell cycle length and a cell’s birth
values of n and v respectively. The correlation between birth
mitochondrial mass and cell cycle length was strong (R2~0:69,
compared to the experimental value of 0.78) compared to the
correlation between birth cell volume and cell cycle length
(R2~0:22, experimental value 0.22). The same correlation
behaviour is observed in experiments (from N4e and N4f) which
are shown for comparison.
Transcription rate noise with cell cycle stage. We
modelled progression through the cell cycle stages by assigning
stages according to the volume v of a cell. We assign cells with
0:5v�ƒvv0:7v� to G1, 0:7v�ƒvv0:95v� to S, and 0:95v�ƒvvv�
to G2 stages, to approximate the proportion of total cell cycle length
that HeLa cells are observed to spend in each stage [61].
Transcription rate noise was found to stay relatively constant
(around 0.4) when population subsets at different positions in the cell
cycle were measured (see Fig. 3F), as observed in experiments (NS1).
Correlation between mitochondrial mass and cell
volume. Our model predicts a strong correlation between cell
volume v and mitochondrial mass n (Fig. 3G). This result contrasts
with the weak correlation observed, using forward scatter in flow
cytometry to measure volume, by das Neves et al. (N3a) (we
confirmed these experimental results in this study – data not
shown). However, many historic studies have found a much
stronger connection between mitochondrial mass and cellular
volume. The mitochondrial density r~n=v, also referred to as
mitochondrial volume density, has been found to exhibit low
standard deviation (between 0.01 and 0.15 of the mean) in many
different mammalian tissue types [54–60] and amounts of mtDNA
have been found to display similarly low variability [55,62]. These
results contrast with the extremely high variability in
mitochondrial volume density observed by das Neves et al. (the
noise level estimated from the data is around 0.32), but we note
that flow cytometry data (while useful for providing approximate
orderings of cells by volume) may not be capable of providing the
absolute volume measurements which are required to refute the
low variability in r observed in many other studies.
Distribution of transcription rate per unit volume. Fig. 3H
shows the distribution of transcription rate per unit nuclear volume
(in our model, nuclear volume is taken as proportion to cell volume) in
the bulk population. This result follows a similar peaked distribution
to that found experimentally (N1a).
Others. We also note some qualitative features of our model: an
increase in transcription rate with ATP levels is observed (trivially due
to the functional form of l), which is also observed experimentally
(N3g). We also observe an increase in transcription rate per unit
volume with total mitochondrial functionality (nf in our model),
found experimentally (N3d). Fig. 4 shows illustrative time series of the
dynamic variables involved in simulation of our model.
New experimental results are also consistent with thismodel
In Fig. 3, we also present new experimental results pertaining to
our model. These new experiments were designed to characterise
two additional features of cells in a population: a measure of the
total level of mitochondrial function within cells and the modulation
of cell cycle lengths by changing the oxidative state of the cell. The
total level of mitochondrial function is experimentally measured
using the intensity of signal from CMXRos, a dye that stains
mitochondria and accumulates according to membrane-potential,
integrated over a whole cell (see Methods). This signal reports on the
integrated membrane potential across the entire cell, combining
measures of mitochondrial mass and functionality. The population
distribution of this quantity is of interest in exploring the link
between mitochondrial mass and functionality between cells.
The modulation of cell cycle length with cellular oxidative state
was investigated by observing the distribution of cell cycle lengths
in a control population of cells and in populations of cells after
anti-oxidant (dithiothretiol) or pro-oxidant (diamide) treatments
(see Methods). Our model incorporates oxidative status by
modulating the mean level of mitochondrial functionality, so
mitochondria function more readily in an environment with low
oxidative stress than one with high oxidative stress. As mitochon-
drial functionality is tied in our model, through growth rate, to cell
cycle length, we would expect cell cycle lengths to decrease upon
anti-oxidant treatment and increase upon pro-oxidant treatment.
Distribution of mitochondrial functionality. Fig. 3I shows
the distribution of total mitochondrial functionality in a population
of cells. In our model, this distribution is just the distribution of the
quantity nf , and in experiments, we measure the total membrane
potential within a cell (see Methods). The predicted and
experimentally observed distributions share a skewed form with
similar variances.
Cell cycle lengths in different oxidative conditions. In
Fig. 3J we show the mean and standard deviation of cell cycle
lengths in a control population, and upon treatment with anti- and
pro-oxidants (see Methods). In our simulations, these treatments
are modelled by changing the value of fc, affecting the mean
functionality of mitochondria (see Table 1). It is observed that
treatment with anti-oxidants reduces cell cycle lengths, and
treatment with pro-oxidants increases cell cycle lengths. In our
model, this behaviour emerges from the dependence of the rate of
volume growth on ½ATP�, and the increased ½ATP� levels resulting
from mitochondria with higher functionality.
Mitochondrial mass and membrane potential. We also
observed a linear correlation between total mitochondrial mass
(measured with MitoGreen) and total mitochondrial membrane
potential (measured with CMXRos) in experiments performed
Figure 2. The set of data used to parameterise our model.Experimental data shown in blue, fitted simulated data shown in red. A.Ratio of larger cell volume to smaller cell volume between sisters atbirth. B. Ratio of larger mitochondrial mass to smaller mitochondrialmass between sisters at birth. C. Mean and standard deviation of thecell cycle length in a population of cells. D. Noise levels in transcriptionrate in (C)ontrol, (A)ntioxidant-treated and (P)ro-oxidant-treated popu-lations, and between (S)ister cells. Two other experimental values, notpictured, that were used to parameterise our model are a maximum cellvolume of 2500mm3 (for consistency with Ref. [53]) and a mean ATPconcentration of 900mM (from Ref. [70]).doi:10.1371/journal.pcbi.1002416.g002
Mitochondria Cause Significant Cellular Noise
PLoS Computational Biology | www.ploscompbiol.org 5 March 2012 | Volume 8 | Issue 3 | e1002416
with both dyes (see Methods and ‘Mitochondrial Membrane
Potential’ in Text S1). This linear correlation emerges from our
model due to our representation of total mitochondrial functionality
as the product of a functional measure f with mitochondrial mass n.
The observed correlation provides qualitative support for this
representation.
Summary of comparisons between experimental resultsand model predictions
It can be seen that several key experimental results require the
inclusion of terms relating to mitochondrial variability for an
explanation. In a situation without considerable mitochondrial
influence on cellular variability, it may be expected that variability
in cell cycle position among a population of unsynchronised cells may
be a dominant source of noise. Physical distributions subject to such
cell cycle noise would be expected to show a variance corresponding
to an approximately twofold range, as this is the maximum difference
in size between two unsynchronised cells. However, several results
display data that varies over a considerably wider range than a factor
of two, indicating that a factor other than cell cycle variability may be
responsible. Most straightforwardly, Figs. 3A and 3I demonstrate
pronounced cell-to-cell variability in the mass and functionality of
mitochondrial populations. The distribution of transcription rate in
Fig. 3I similarly shows a wide range of values.
Figs. 3D and 3E demonstrate the observed fact that mitochon-
drial inheritance at birth is a better predictor of cell cycle length
than volume inheritance: an effect that relies on the presence of
mitochondrial variability and mitochondrial influence on cellular
growth. The variability in cell cycle length observed by modulating
the oxidative state of the cell in Fig. 3J suggests that a source of
variability that is sensitive to oxidative effects strongly affects cell
cycle lengths. We believe that these results support the hypothesis
that mitochondrial variability provides a significant contribution to
the variability in distributions of the cellular properties we consider.
The correspondence between experimental data and the
simulated behaviour of our model suggests that, although we
have chosen simple functional forms in our model, the resulting
Figure 3. Our simple model is consistent with experimental probes of mitochondrial and cellular variability. Comparison between ourmodel (red) and experimental data (blue), following discussion in the Main Text. Experimental data from das Neves et al. [31]. A. Distribution ofmitochondrial mass n in an unsynchronised population of cells. B. Distribution of cell volume v in an unsynchronised population of cells. C.Comparison of the lengths of cell cycles between generations: Gen 1 is the parent cell, Gen 2 the daughter. Cell cycle lengths are only weaklycorrelated. D. Relationship between the ratio of mitochondrial masses at birth against ratio of cell cycle lengths for sister pairs. E. Relationshipbetween the ratio of cellular volumes at birth and the ratio of cell cycle lengths for sister pairs, showing a weaker correlation than D. F. Transcriptionrate noise gl in subsets of the population in G1 , S, and G2 phases (see Main Text). G. Mitochondrial mass n and cell volume v are strongly correlated inour model. Some experimental evidence is contradictory (see Main Text). H. Distribution of transcription rate per unit volume l=v. Newexperimental data (see Methods). I. Distribution of total mitochondrial functionality (nf in our model, CMXRos readings from experiments). J.Mean and standard deviation of cell cycle lengths in (A)nti-oxidant-treated, (C)ontrol, and (P)ro-oxidant-treated populations. Experimentalhistograms, originally presented in arbitrary units, have been scaled to match the mean value of the simulated data.doi:10.1371/journal.pcbi.1002416.g003
Mitochondria Cause Significant Cellular Noise
PLoS Computational Biology | www.ploscompbiol.org 6 March 2012 | Volume 8 | Issue 3 | e1002416

behaviour is biologically relevant. However, we note here that our
model was constructed from a phenomenological philosophy, with
the intention of using experimental results to construct a plausible
coarse-grained explanation for the influence of mitochondrial
variability on extrinsic noise in general and transcription rate in
particular: we were aware of all data from Ref. [31] when we were
choosing the structure of our model though we only used a subset
of available data to parameterise it. Our goal was to introduce a
simplified but consistent mathematical summary of the data and to
use this to motivate further experiments. To this end, we suggest a
set of experiments in ‘Potential Experiments for Refinement’ (Text
S1) that would support or contribute to further development of this
model. We also note that many potential refinements could be
made to our model and suggest several other functional forms in
‘Other Models’ (Text S1).
Noise in transcription rate depends on noise inmitochondrial segregation and functionality
We are now in a position to explore the dependence of the level
of noise in transcription rate on the stochasticity in mitochondrial
mass and function, and subsequent stochasticity in ½ATP�. To
investigate the contribution of mitochondrial variability to
transcription rate noise, we performed simulations of our model
while varying s2f , the variance associated with the inheritance of
mitochondrial functionality, and s2n, the variance associated with
inheritance of mitochondrial mass. s2n here gives the variance of
the distribution by which mitochondrial mass is partitioned, and
varying it under the assumption of binomial partitioning
corresponds to changing the mitochondrial makeup of the cell:
lower s2n corresponds to more mitochondrial elements, each with
smaller volume, while higher s2n corresponds to fewer, larger
mitochondrial elements, which are partitioned binomially at
mitosis (see Methods).
In Fig. 5, the functional dependence of gl on mitochondrial
variability (s2n and s2
f ) is shown from simulations. These results
show that, for our model, the transcription rate noise is made up of
significant contributions from both mitochondrial segregation and
functionality. We also performed simulations where sv, the
variability arising from uneven volume partitioning, was set to
zero, and where cells were sampled at the same position in their
cell cycle, removing different ages as a source of variability. As
Fig. 5 shows, the removal of these sources of variability has little
impact on the overall transcription rate noise level. These results
lead us to suggest that mitochondrial sources of variability provide
a strong contribution to cell-to-cell variability in transcription rate.
This argument is supported by an approximate analytic treatment
of the sources of error in transcription rate within our model (see
‘Estimating Noise Contributions’ in Text S1).
Mitochondrial variability can dominate noise in mRNAand protein expression
Having constructed and parameterised a model for mitochon-
drial variability and its effect on transcription in the cell, we now
investigate the connection between these factors and downstream
Figure 4. Illustration of the dynamics of our model. Exampletime series of l (transcription rate), f (mitochondrial functionality), n(mitochondrial mass) and v (cell volume), as a cell grows and dividesrepeatedly in our model.doi:10.1371/journal.pcbi.1002416.g004
Table 1. Parameters and values employed in our model.
Parameter Description Value Motivation
fa f memory term 0.5 Fit parameter – chosen to give a mean functionality of 1
f 0c
Sets mean functionality (control) 0.5 Fit parameter – chosen to give a mean functionality of 1
v� Volume for mitosis (scale) 2500mm3 Fixed for consistency with maximum volume in Ref. [53]
cProportionality between
nf
vand ½ATP� 39000mMmm3 Fixed for consistency with mean ATP levels in Ref. [70]
sv v standard deviation at mitosis 90mm3 Fixed by volume segregation data in Ref. [31]
f (1,{1)c
Set mean functionality (with anti-oxidant and pro-oxidantrespectively)
(0.69, 0.09) Fixed by transcription rate noise levels in Ref. [31]
s1,2,3,4 Fitting parameters for relationship between ½ATP� and l 51.2, 44.7, 0:00288mM{1 , {1:9 Fixed by functional form of l in Ref. [31]
a v growth rate 0:92hr{1 Chosen through optimisation – constrained by mean cellcycle length in Ref. [31].
b n growth rate 0:022hr{1 Fixed ratio with a through mitochondrial segregationdata in Ref. [31]
sf f standard deviation at mitosis 0.34 Chosen through optimisation – constrained throughtranscription rate noise and cell cycle length variability inRef. [31]
For further information see ‘Parameterisation of l(t)’ and ‘Fitting Other Parameters’ in Text S1.doi:10.1371/journal.pcbi.1002416.t001
Mitochondria Cause Significant Cellular Noise
PLoS Computational Biology | www.ploscompbiol.org 7 March 2012 | Volume 8 | Issue 3 | e1002416

quantities: mRNA expression levels, and then (through further
extension) protein expression levels. Noise in protein expression
levels directly affects many cellular properties, as this noise causes
cell-to-cell differences in the functional machinery available to
perform cellular processes. Here we will investigate the influence
of the mitochondrial variability suggested by the parameterisation
of our model from experimental data on existing models for
mRNA and protein expression. We connect our findings with the
substantial existing body of literature on this topic in the
Discussion section.
The production of mRNA and protein within a cell is often
modelled using a master equation approach, addressing the
probability of observing a given number of molecules at a given
time. This analytical framework lends itself to the inclusion of our
results for time-varying transcription rate (see Methods). Numer-
ically, several studies have proposed techniques for incorporating
time-varying rates in chemical kinetic systems [46,47]: we use
Shahrezaei et al.’s modification [45] to the Gillespie simulation
method [63] to simulate our model system. This protocol allows us
to investigate the relative importance of intrinsic contributions
(resulting in differences in expression levels between identical
genes within a single cell) and extrinsic contributions (resulting in
differences in expression between identical genes in different cells
in a population).
Fig. 6 shows the increase in mRNA expression (from a level of
zero at the start of the simulation) from our analytic approach
incorporating changing transcription rate, and in simulations run
using (see Methods) a parameter set from Raj et al. [16], in two
scenarios: one involving only intrinsic noise effects (no noise due to
mitochondrial variability) and one involving extrinsic noise in
transcription rate due to mitochondrial mass, functionality, and cell
volume variability, of the magnitudes found through parameterising
our model with experimental data. It can be seen that mitochondrial
variability leads to a large increase in the total noise in mRNA
expression levels: without extrinsic factors, the noise in mRNA
expression at a given time (t~8:3 hours) was gm^0:04, whereas
gm^0:40 with extrinsic factors. We note that the means for the
intrinsic and extrinsic noise cases differ: this result is due to the
nonlinear dependence of transcription rate on ATP concentration, so
that ½ATP� distributions with the same mean but different variances
may yield transcription rate distributions with different means.
We can also perform simulations on the more complicated system
involving protein production (see ‘mRNA & Protein Levels’ in Text
S1). With values from Raj et al. [16] for protein degradation and
translation rate (see Methods), this approach allows us to simulate
dual reporter experiments, where the expression of two distinct but
identically regulated protein-encoding genes is measured. Each
protein was translated from a different mRNA strand, so these
simulations tracked four quantities: the expression levels of the two
mRNAs and the two proteins. Simulations were performed on
synchronised and asynchronous cells, and with sn,sf set to their
model values and set to zero. In these simulations, mRNA molecules
and proteins were also distributed binomially between daughter
cells at mitosis (see Methods).
Dual reporter simulations performed with the parameterisation
chosen from Raj et al. [16] yield very low values for the magnitude
of intrinsic noise. This low intrinsic noise was found to be due to
the high copy number of proteins resulting from the parameter-
isation. To explore noise in systems with lower expression levels,
we lowered the copy number of proteins by increasing the rates of
mRNA and protein degradation (see Methods). Fig. 7 shows the
resulting expression levels in two proteins with and without various
sources of extrinsic noise, at the two different degradation rate
protocols. These results show that, in our model, mitochondrial
variability dominates the noise in protein expression levels. The
spread of protein levels with mitochondrial and volume variability
is much greater than the two-fold range achieved through cell
cycle variability alone. Fig. 7 also illustrates that cells with higher
mitochondrial mass and functionality generally have higher
protein expression levels, though inheritance noise makes this
correlation weaker.
In our model, we find that energy variability arising through
mitochondrial stochasticity is the dominant source of variability in
Figure 5. Variability in mitochondrial mass and functionalitycan both contribute to noise in transcription rate. Effects ofchanging variability in mitochondrial mass inheritance (sn) andfunctionality (sf ) on overall transcription rate noise gl . This contour plotshows the value of gl for a given combination of sn,sf . More stochasticityassociated with inheritance of mitochondrial properties leads to highertranscription rate noise, and stochasticity in both mass and functionalinheritance plays an important role in transcription rate noise. Contourlines on the bottom surface mark different values of gl . The ‘X’ markdenotes the default parameterisation of our model. Other contour linesshow that this relationship remains essentially identical when variabilitydue to cell cycle stage and volume inheritance is removed, suggestingthat sn and sf are the key sources of transcription rate noise.doi:10.1371/journal.pcbi.1002416.g005
Figure 6. Mitochondrial variability contributes strongly tonoise in mRNA levels. Analytic and modified Gillespie simulationresults for time evolution of mRNA levels with and withoutmitochondrial and volume variability. Bars show the mean and standarddeviation of the corresponding distribution at a given time. Red (z)give simulated results without inherited variability. Black (�) giveanalytic results without inherited variability. Blue (|) give simulatedresults with mitochondrial and volume variability, displaying muchgreater variance in mRNA expression. Bars are slightly offset in the x-direction for clarity. The inset shows two example time series for bothsimulated cases.doi:10.1371/journal.pcbi.1002416.g006
Mitochondria Cause Significant Cellular Noise
PLoS Computational Biology | www.ploscompbiol.org 8 March 2012 | Volume 8 | Issue 3 | e1002416

transcription rate, mRNA and protein expression levels. However,
we note that the causal factors of stochasticity in mRNA and
protein levels within the cell are significantly more complicated
than the simple transcriptional model presented above. The rates
of many of the processes involved in more extended models are
functions of many factors which our model does not include. The
inclusion of these complicating terms rapidly makes an analytic
description of the model impossible. However, we note that
stochastic simulation techniques may be used to explore the
behaviour of complex model given estimates for the functional
dependence of process rates on extrinsic variables [45].
We also note that several studies have observed a decrease in
intrinsic noise at higher levels of protein expression [15,27]. We do
observe such a decrease, though in the default parameterisation
the magnitude of this effect is very small owing to the consistently
low intrinsic noise levels.
Mitochondrial noise, by modulating transcription rate,can affect stem cell differentiation
As an illustrative application of our model, demonstrating its
physiological relevance, we consider how, through the extrinsic
effects of [ATP] on protein levels, a link between mitochondrial
content and stem cell differentiation behaviour may arise.
Differentiation dynamics in stem cells have often been modelled
as the result of expression asymmetries in lineage regulation genes
that interact in a regulatory network [64–67], but the initial
sources of this expression variability have not been clearly
elucidated and are a topic of active debate. Here we show that
transcription rate variability resulting from mitochondrial vari-
ability can affect the dynamics of expression of such control genes.
Experimentally, a link between stem cell differentiation and
mitochondria was suggested by a recent study in mouse embryonic
stem cells [38], showing that pluripotent cells with low mitochon-
drial membrane potential had higher in vitro differentiation
propensity, whereas those with higher membrane potential
remained undifferentiated and formed large teratomas.
We explore two recent models for the cell fate decision between
erythroid and myeloid cell fates directed by the cross-antagonistic
master lineage regulators GATA1 and PU.1. One model, by
Huang et al. [68], consists of a symmetric coupled ODE system for
the expression levels of these two genes, including cross-repression
and self-activation term (see Methods). Another model, by
Chickarmane et al. [69], contains a similar but asymmetric ODE
model, expanded to include interactions with a postulated third
species which is promoted by GATA1 and represses PU.1. The
Chickarmane et al. model also includes external signalling terms
which may act to promote GATA1 and PU.1, and repress the
third species. In these models, cell states are defined by the relative
levels of expression of these genes, such that undifferentiated cells
have comparable levels of each transcription factor, while the two
differentiated cell types correspond to a state with high levels of
one factor and low levels of the other. The interactions between
the genes are parameterised by variables such as self-activation
and cross-repression rates (see Methods). The phase space for both
these models comprises three attractor basins, corresponding to
the progenitor cell type and two differentiated cell types.
Within the Huang model, at low protein expression levels,
smaller perturbations are required to shift attractor basins than at
high expression levels – a feature consistent across a large range of
parameterisations. Varying the parameterisation of the model
(modelling differentiation-inducing signalling) changes the struc-
ture of these basins, so that the central undifferentiated basin
becomes more or less stable to subsequent perturbation. We vary
the default parameterisation of the model in an attempt to assess
the effect of changes in transcription and translation rates (see
Methods). We find that when the parameters related to the rate of
production of proteins are low, the central, undifferentiated state is
less stable than when they are high (see Fig. 8A), with a smaller
volume of phase space leading to the undifferentiated basin.
Within the Chickarmane model, a different effect is observed.
As before, we investigated the volume of phase space correspond-
ing to the basin representing the undifferentiated state. We used a
nonzero value for the external signalling term promoting PU.1
and explored the system at different transcription rates (see
Methods). We found that increasing the transcription rate led to a
decrease in the range of values of the external interaction which
supported a stable undifferentiated state (see Fig. 8B). This
decrease in the stability of the undifferentiated state arose from a
smaller volume of phase space leading to the undifferentiated basin
as transcription rate increased, with more phase space occupied by
the GATA1 basin. This result contrasts with the increased stability
of the Huang model at high transcription rate, due to the
importance of the third species (the expression of which is
dependent on transcription rate): at high transcription rate, the
increased strength of the combined effect of self-activating GATA1
Figure 7. Effects of mitochondrial variability dominate proteinexpression variability in our model. Dual reporter simulation withdifferent sources of noise in our protein expression simulations. All plotsexcept (E) are normalised so that the highest protein expression level inthe cell population is 1. Red (diamonds) show results from Raj et al.’sdefault parameterisation [16] used to model transcription, translationand degradation (see Methods). Blue (triangles) show results from thisparameter set with degradation rates increased 100-fold. Protein levelsare shown from population of (A) unsynchronised cells with mitochon-drial and volume variability, (B) synchronised cells with mitochondrialand volume variability, (C) unsynchronised cells with no mitochondrialor volume variability, and (D) synchronised cells with no mitochondrialor volume variability. (E) Mean protein expression levels in the defaultparameterisation of Raj et al. with the product of mitochondrial massand function nf , in the system corresponding to (A). (F) The equivalentplot of (A) with translation rates independent of ½ATP�.doi:10.1371/journal.pcbi.1002416.g007
Mitochondria Cause Significant Cellular Noise
PLoS Computational Biology | www.ploscompbiol.org 9 March 2012 | Volume 8 | Issue 3 | e1002416

and production of the third species shifts the basin structure
strongly towards GATA1.
These results suggest that cell-to-cell variability in mitochondrial
mass and function may, through induced variability in transcrip-
tion rate, have a significant effect on the stability of bipotent cells.
If differentiation dynamics are asymmetric and involve an
intermediate species (as in the Chickarmane model), we find that
high transcription rate destabilises the undifferentiated state. This
destabilisation may be viewed as a result of the increased sensitivity
of the system to perturbations: the asymmetric regulatory
architecture means that a small increase in GATA1 will be
quickly amplified at high transcription rate, as more GATA1 and
X are quickly produced. If differentiation dynamics are symmetric
and do not involve another species (as in the Huang model), high
transcription rates increase the width of the basin corresponding
to the undifferentiated state, acting to stabilise this state. This
stabilisation is due to the increased robustness to perturbations
afforded by the high production rate of both species at high
transcription rate: without asymmetric interactions, the higher
expression level of both genes makes the system less responsive to
small perturbations. The results that emerge from this symmetric
case gives results that are qualitatively comparable to an
experimental study [38] in which more cells with higher total
mitochondrial membrane potential remained undifferentiated,
suggesting that high mitochondrial performance stabilises the
undifferentiated state.
Another, higher-order effect may conceivably play a role in
both situations: several studies have found that, at high protein
abundance levels (which may result from high transcription rates),
intrinsic noise levels in protein expression decrease. While the
parameterisation of our dual reporter studies is such that these
effects are small, the fact that less noise is expected at higher
protein expression levels suggests a third mechanism by which
high mitochondrial content may stabilise pluripotent cells. The
contrasting results highlight the potential of experimental
investigation of the effects of global transcription rate on the
stability of multipotent states to inform of additional qualitative
behaviors that models of lineage decision should be expected to
exhibit.
Discussion
We have introduced a crude mathematical model for the effects
of stochasticity in mitochondrial segregation and functionality on
transcription rate in cells. Our model, while simple enough to
allow some analytic treatment, reproduces a good number of
experimentally observed features concerning the interplay of
mitochondrial properties and transcription rate. We analyse our
model and find that mitochondria provide extrinsic noise
contributions to transcription both through their uneven segrega-
tion at mitosis and through variability in their functionality.
We note that, in addition to requiring variability in the amount
of mitochondrial mass, an adequate fit to our data required us to
consider variability in the function of mitochondria. This connects
with the wealth of recent experimental and theoretical interest
regarding the causes and control of heterogeneity of mitochondrial
function [34,35,42,44] and strengthens the case for the broad
physiological relevance of functional variability.
We incorporate our results for mitochondrial-sourced extrinsic
noise into existing models for mRNA and protein production, and
show that mitochondrial noise can lead to significant variability
between cells in a population. We also suggest that transcriptional
variability resulting from mitochondrial noise may affect stem cell
differentation, and illustrate this result with an analysis of two
recent regulatory network-based models for stem cell differentia-
tion. We find that the quantitative effect of transcription rate
variability on stem cell differentiation depends on the architecture
of the regulatory network under consideration.
Several recent studies have investigated the interplay between
other possible sources of extrinsic noise in various organisms.
Before concluding, we will discuss connections to this body of
literature. The recent study by Huh and Paulsson [29] found that
variability in protein levels due to uneven inheritance at mitosis
might explain a body of experimental data that was previously
assumed to result from noise in the protein production process. A
mathematical study by Rausenberger and Kollmann [21] also
investigated the effects of inheritance stochasticity on cellular
noise. Our work bears significant parallels to these ideas, in that we
postulate uneven inheritance of mitochondria to be a substantial
contributing factor to noise in all cellular processes that require
ATP, including the mechanisms of protein production. Our
philosophy also mirrors part of the work of Huh and Paulsson in
that our model considers a subset of cellular properties (in our
case, mitochondrial partitioning and functionality, and cell
volume) to provide all stochastic influences, with all other cellular
properties evolving deterministically.
The possible role of ATP as the proxy through which
mitochondrial variability affects other cellular processes ties in
with an early prediction of Raser and O’Shea [14] who suggested
that the dominance of extrinsic noise in expression variability
Figure 8. Transcription rate affects the stability of model stemcell systems. In both diagrams, curves delineate the boundary of theattractor basin corresponding to the undifferentiated cell state. Red(solid) to black (dotted) lines show the basin structure as transcriptionrate l increases through the given values. (A) The structure of theundifferentiated attractor basin in the Huang model given differenttranscription parameters, showing the widening of the stableundifferentiated region at high transcription rate. (B) The structure ofthe undifferentiated attractor basin in the Chickarmane model, showinga decrease in undifferentiated basin size as transcription rate increases.The activation-repression structure of both models is illustrated – in (B),external terms representing the activation of GATA1 and X exist but areset to zero in our analysis to allow PU.1 to be expressed under someconditions.doi:10.1371/journal.pcbi.1002416.g008
Mitochondria Cause Significant Cellular Noise
PLoS Computational Biology | www.ploscompbiol.org 10 March 2012 | Volume 8 | Issue 3 | e1002416

across a wide range of proteins could result from fluctuations in a
factor that affects expression for all genes. ATP, being required for
the processes of transcription and translation, meets this criterion.
Shahrezaei et al. [45] illustrate the fact that extrinsic noise can
influence intrinsic noise, through the former’s effects on the rate
constants involved in the latter. This influence plays an important
role in our model, where extrinsic variability of mitochondrial
properties influences the synthesis rates of mRNA and protein
through their dependence on ½ATP�. The ubiquity of ATP as an
energy currency within the cell suggests that the rates of other
intrinsic processes may be affected by the extrinsic variability we
describe.
The link between the process of transcription and noise in
protein expression levels that we explore in the last section of this
paper is related to the findings of Blake et al. [22] who found that
protein expression noise depends on transcription efficiency. In
our model, the modulation of transcription rate by noisy ½ATP�has downstream effects on protein noise levels.
Sigal et al. [26], in a study of expression levels over a range of
proteins, find cell cycle stage to be a significant contributor to
extrinsic noise in protein abundance. Volfson et al. [19] used a
mathematical framework to similarly identify population dynam-
ics, and upstream transcription factors, as key extrinsic contrib-
utors to cellular noise. Our model is compatible with these results,
as cells at different cell cycle stages will have had different protein
expression histories over their lifetimes. However, we anticipate
that mitochondrial variability will also provide a significant
contribution to protein expression noise, through modulation of
upstream processes.
An in-depth study by Newman et al. in yeast cells [15] found a
variety of protein-specific differences in expression noise according
to transcription mode and protein function. Our model does not
capture protein expression noise in this level of detail. The study of
Newman et al. also characterised the contribution of intrinsic and
extrinsic factors to total noise levels as a function of protein
abundance. They found that while total expression noise did not
scale with protein abundance, noise levels decreased with
abundance when extrinsic factors were controlled for: suggesting
that extrinsic factors were responsible for maintaining total noise
levels as abundance increased. This suggestion that extrinsic noise
increases in strength with protein abundance is captured in our
protein level simulations.
A study by Bar-Even et al., also in yeast cells [27], found intrinsic
noise to be a substantial contributor to total noise, especially for
proteins at intermediate abundance levels, with intrinsic contri-
butions becoming less significant as expression levels increase (a
similar result to Newman et al.). In this and several of the other
studies above [15,22], fluctuations in mRNA number were
postulated to be the most important source of noise in protein
expression levels. Our model suggests that, through the link
between mitochondrial properties and transcription rate, mito-
chondrial variability strongly influences this important noise
source and thus may be an important fundamental source of
stochasticity in cellular biology.
Raj et al. [16] studied noise in mRNA expression in detail in
mammalian cells (one of few studies to do so), and identified
intrinsic effects as the dominant factors. Their study found that
genes located in close proximity to each other displayed
synchronised expression, while the expression of genes that were
physically separate was unsynchronised, suggesting that local
rather than global effects determine the expression levels of genes.
While this study demonstrated that intrinsic effects significantly
contribute to total noise in some cases, it was not explicitly shown
that the magnitude of these effects outweighed extrinsic effects.
Our results are compatible with this view that intrinsic noise plays
an important role in gene expression, but we suggest that extrinsic
noise due to energy variability may also be an important
contributor to overall noise levels.
We do not attempt to capture these mRNA processes explicitly:
rather, we take transcription rate to be a function of ½ATP� as
found in experiments [31]. However, we note the result that the
measured functional form of this relationship changes in
experiments in which chromatin was decondensed. This result
suggests that the functional form of transcription rate with ½ATP�allows us to capture some effects of the ATP-dependent chromatin
remodelling process.
ConclusionsWe find, through a phenomenological model constructed to
reproduce recent data on mitochondrial and ATP variability, that
stochastic inheritance of mitochondria at mitosis and variability in
mitochondrial function may be important sources of noise in
transcription. By extension, these factors may contribute signifi-
cantly to noise in protein expression further downstream. We have
proposed experimental tests to refine our model and demonstrate
its application in existing models for mRNA and protein
production and stem cell differentation, and discussed how these
findings integrate into the current understanding of extrinsic noise
in cellular biology. In particular, what our paper suggests is the
need for multimodal single cell experiments through time (and
through division) investigating coarse-grained measures of energy
status, cellular volume, mitochondrial mass, and global rates of
transcription and translation. Cellular variability is of central
physiological importance but we suggest that to understand this we
must elucidate the relationships between certain core variables,
including the relationship between the machinery of expression
and degradation and the energy status of the cell.
Methods
Parameterisation of our model from experimental dataWe used a subset of available experimental data (shown in Fig. 2)
to choose numerical values for our key parameters. Some
parameter values were fixed, in the sense that maximising the
agreement between predictions from our model and a single
experimental study allowed an optimal value to be chosen
straightforwardly (si,sv, and the ratio b=a were parameterised
by data from Ref. [31] (respectively the sigmoidal relationship
between ½ATP� and transcription rate, the variance associated
with volume partitioning, and the variance associated with
mitochondrial partitioning), v� by the maximal cell volume
observed in data from Ref. [53], and c by comparing the mean
properties of simulated cells to mean ATP levels reported in a
population of HeLa cells in Ref. [70]). Other parameters
influenced a range of predictions and values for these parameters
were chosen by optimising the fit to experimental data across the
set of results that they influenced (see ‘Fitting Other Parameters’ in
Text S1).
Table 1 summarises the parameters and values employed in our
model.
Model specifics. In the following we provide details of our
model. The key equations specifying the key dynamics of cells in
our model are given by Eqns. 1–4. The coupled ODEs in our
model admit an analytic solution by simple integration:
v(t)~v0zn0a
b(exp(bft){1), ð5Þ
Mitochondria Cause Significant Cellular Noise
PLoS Computational Biology | www.ploscompbiol.org 11 March 2012 | Volume 8 | Issue 3 | e1002416

n(t)~n0exp(bft), ð6Þ
The reader will note that a variety of models for mitochondrial
and volume growth will yield similar forms. In addition, other
functional forms for the level of ATP may be suggested. A selection
of these alternative forms are explored in ‘Other Models’ in Text
S1. Within this model, at mitosis,
v1~Nv�
2,sv
� �ð7Þ
n1~Nn
2,
ffiffiffin
4
r� �, ð8Þ
where N (m,s) is a normal distribution with mean m and variance
s2, and v2~v{v1, n2~n{n1 determine the daughter volumes
v1,v2 and mitochondrial masses n1,n2. The variances of the
mitochondrial distribution is chosen to represent a binomial
distribution (B(n,p)^N (np,ffiffiffiffiffiffiffiffiffiffiffiffiffiffiffiffiffiffinp(1{p)
p), with p~
1
2, for high n).
The variance of the volume distribution is chosen to match
experimental data on volume partitioning.
Functionality evolves through changes at mitosis events, which
follow an AR(1) process. A daughter cell’s functionality f D is
determined from its parent’s functionality f P:
f D~faf PzfczN (0,sf ) ð9ÞUpon mitosis, both daughter cells inherit the same f D value,
drawn from Eqn. 9. Once chosen, a cell’s functionality remains
constant throughout one cell cycle. We can model treatment with
anti- and pro-oxidants by respectively increasing and decreasing
fc, raising or lowering the mean functionality of mitochondria.
With sf ~0:3, there is a very small but finite chance that cells will
inherit zero (or lower) functionality. To avoid this unphysical case,
we impose a cutoff of 0:01 on mitochondrial functionality. Values
under this cutoff are resampled from Eqn. 9. Another model,
where f varies continuously within a cell cycle, is considered in
‘Other Models’ in Text S1.
Virtual mitochondriaIn our model, the standard deviation in mitochondrial mass at
mitosis is a function of the number of virtual mitochondria in the cell,
sn~
ffiffiffin
4
r, from binomial partitioning. We can vary the number of
virtual mitochondria in the cell while keeping the total mitochondrial
volume constant, by changing the volume assigned to an individual
virtual mitochondrion. Let an individual virtual mitochondria have
volumevn
N, and let there be N virtual mitochondria in a cell. The
total mitochondrial volume is vn, and the mean inherited
mitochondrial volume is half of this. The standard deviation in
virtual mitochondrial number from a binomial distribution of the
virtual mitochondria is
ffiffiffiffiffiN
4
r, so the standard deviation of
mitochondrial volume is2vnffiffiffiffiffi
Np . A standard deviation of sn then
corresponds to N~4v2
n
s2n
virtual mitochondria per cell.
Cell dynamics simulationsTo simulate a population of cells, we used a simple Euler
method to solve the dynamic equations. A population of
N~10000 cells was simulated. When mitosis occurred, a random
cell from the population was chosen for replacement by the new
cell. To measure distributions, this procedure was continued until
the distributions stabilised. To measure sister-sister and between-
generation correlations, a list of relationships between cells was
maintained, with sister pairs only sampled when both sisters
underwent an entire cell cycle without replacement. We note that
this removal of randomly-chosen cells may potentially introduce
artefacts into the results, as the constant probability of cell removal
means that the probability of a cell surviving to a certain age is
decreasing. We checked our results with a different simulation
protocol: running the system and allowing exponential growth up
to 106 cells, with no removal. The resulting distributions were
indistinguishable from the first protocol, showing that the removal
rate is low enough so that the statistics are not affected.
mRNA & protein expression simulationsFor the simple system illustrating mRNA expression levels
alone, cells were simulated using the modification of Shahrezaei
et al.’s [45] to the Gillespie simulation method [63] in two
scenarios: one involving only intrinsic noise (sn~sv~sf ~0) and
one involving extrinsic noise due to mitochondrial mass,
functionality, and cell volume variability. In both cases, the initial
copy number of mRNA molecules was set to zero, to illustrate
differences in the dynamics of the system: transcription started at
the birth of the cell, and there were no effects from mRNA
inheritance. In the intrinsic noise experiments, a population of
cells were simulated from identical initial conditions, with their
n,v,f values set to the means of those variables obtained from
simulations. The variability in mRNA expression levels in these
cells was therefore solely due to intrinsic noise. For the extrinsic
noise simulations, mRNA expression was simulated in the
heterogeneous population of cells that resulted from dynamic
simulation. An ensemble of 2500 cells was analysed for both cases
and the mRNA content at each timestep recorded.
To simulate the more complicated systems and investigate
inheritance effects, we coupled the Shahrezaei et al. simulation
protocol with the simple ODE solver so that simulation of a popu-
lation of cells growing and producing mRNA and protein involved
the following algorithm. 1) Use the ODE solver to calculate a cell’s
time of mitosis and the time series of volume and transcription rate
throughout the cell lifetime. 2) Use Shahrezaei et al.’s method to
compute the time behaviour of mRNA and protein levels given these
time series for production rates. 3) Create daughter cells with noisy
partitioning of volume, mitochondrial mass (binomial) and function-
ality (AR(1)), and mRNA and protein copy numbers (binomial).
After Raj et al. [16], we employ the following model values for
birth (l) and death (j) rates of mRNA (m) and protein (n): SlmT~
0:06s{1, SlnT~0:007s{1,jm~7|10{5s{1,jn~1:1|10{5s{1.
In the case of birth rates, we used these mean values to scale the
l(½ATP�) curves from das Neves et al. [31] so that the mean ½ATP�level observed in a population gave the mean SlT values from Raj
et al. (see ‘mRNA & Protein Levels’ in Text S1). We also ran
experiments with the degradation rates increased 100-fold:
jm~7|10{3s{1, jn~1:1|10{3s{1, to explore the behaviour
of the system at lower expression levels.
ExperimentsCMXRos labelling was done according to manufacturer
(invitrogen) instructions, cells were incubated with the probe
(75 nM) for 15 min. at 37 C and washed with warm PBS.
For the dual dye experiments, cells were loaded simultaneously
with CMXRos and MitoTracker Green FM dye (Molecular
Probes) for 20 min and after a brief PBS rinse fixed in PBS with
4% paraformaldehyde.
Mitochondria Cause Significant Cellular Noise
PLoS Computational Biology | www.ploscompbiol.org 12 March 2012 | Volume 8 | Issue 3 | e1002416

Cell cycle length experiments were done by growing cells in the
presence of media alone or containing either the anti-oxidant
Dithiothreitol (250 microM DTT) or the pro-oxidant Diamide (50
microM). Cell cycle length was measured as the time interval
between two mitotic events in a single cell, analysed by live cell
imaging using the Cell IQ platform and image analysis software
(Chipman Tech.).
In the flow cytometry experiments, tripsinised Hela cells were
washed and incubated with 20 nM MitoTracker Green FM dye
(Molecular Probes) in medium at 37 C for 15 min, and then washed.
Cells were analyzed using flow cytometry (Dako CyAn ADP).
Master equationsLet us consider the master equation for the transcription
process, describing the probability of observing the system with mmRNAs at time t:
LPm
Lt~l(t)Pm{1zj(mz1)Pmz1{(l(t)zjm)Pm, ð10Þ
where Pm is the probability of observing m mRNAs at a given time
t, l(t) is transcription rate, and j is an mRNA degradation rate.
Using a linear approximation for l(t) (see ‘Parameterisation of
l(t)’ in Text S1), we can solve this by using a generating function
approach (see ‘mRNA & Protein Levels’ in Text S1). The mean,
variance, and probability distribution of mRNA copy number at
arbitrary time are given by:
mm~(a3z1)m0{1ea1za2 (a1za1a3zm0) ð11Þ
s2m~(a3z1)m0 ea1za2 a1za2
1zm0
a3z1
�
| 1z2a1zm0{1
a3z1
� �{(a3z1)m0z2
|ea1za2 (a1za1a3zm0)2)
ð12Þ
Pm~am0{m
3 ea2m0!
m!(m0{m)!1F1({m; m0{mz1;{a1a3) ð13Þ
where 1F1 is the Kummer confluent hypergeometric function,
a1~1
jczbt{ce{jtz
b
j(e{jt{1)
� �, a2~{m0tj{a1 and a3~
ejt{1.
Stem cell modelThe progenitor cell differentation model of Huang et al. [68]
consists of the following equations for the evolution of protein
expression levels x1 (GATA1) and x2 (PU.1):
dx1
dt~a1
xn1
hna1zxn
1
zb1hn
b1
hnb1zxn
2
{k1x1 ð14Þ
dx2
dt~a2
xn2
hna2zxn
2
zb2hn
b2
hnb2zxn
1
{k2x2 ð15Þ
In this parameter set, a variables are self-activation rates, b
variables are cross-repression rates, k are decay rates, and h and ncontrol the functional form of these processes. Huang et al. show that
altering these parameters changes the structure of the corresponding
attractor landscape, so that the central undifferentiated attractor
basin changes in size, affecting the predisposition of the system to
differentiate. This landscape change gives a ‘priming’ of the system
such that the effect of subsequent asymmetries may vary. In this
study, we vary the landscape by symmetrically varying a and b, the
parameters associated with activation and repression, from the
default parameterisation ai~bi~ki~1,n~4,hai~hbi~0:5 for
i~1,2. Specifically, we modulated a and b with a multiplicative
factor l: a?la,b?lb. We draw the connection between higher
values of a and b and higher transcription and translation rates, as
the rate of production of chemical species is increased by an increase
in these parameters.
The model of Chickarmane et al. [69] involves a relationshup
between three dynamic variables:
d½G�dt
~a1Aza2½G�
1zb1Azb2½G�zb3½G�½P�{c1½G� ð16Þ
d½P�dt
~d1Bzd2½P�
1zE1BzE2½P�zE3½G�½P�zE4½G�½X �{c2½P� ð17Þ
d½X �dt
~f1½G�
1zg1½G�zg2C{c3½X � ð18Þ
where ½G�,½P�,½X � are the concentrations of GATA1, PU.1 and a
postulated chemical species X respectively. A,B,C are external
signalling factors: A and B promote GATA1 and PU.1 respectively,
and C represses X. Other variables take default values a1~
b1~d1~E1~b3~E3~1, a2~b2~d2~E2~0:25, E4~0:13, c1~
c2~c3~0:01, f1~g1~0:01, g2~10. To vary transcription rates,
we modulate a,d and f terms with a multiplicative factor which we
take to be proportional to transcription rate l. We used B~0:5 with
A~C~0, allowing an external signal that promotes PU.1, to
promote stability of the undifferentiated state.
Supporting Information
Text S1 Supplementary PDF document containing mathematical
details of our model and alternative approaches to modelling the
effects of mitochondrial variability.
(PDF)
Acknowledgments
The authors wish to thank Sumeet Agarwal, Maria Domingo-Sananes,
Bela Novak and Vahid Shahrezaei for their valuable comments.
Author Contributions
Conceived and designed the experiments: IGJ BG RPdN FJI NSJ.
Performed the experiments: IGJ BG RPdN FJI NSJ. Analyzed the data:
IGJ BG RPdN FJI NSJ. Contributed reagents/materials/analysis tools:
IGJ TE FJI NSJ. Wrote the paper: IGJ BG NSJ.
References
1. McAdams HH, Arkin A (1997) Stochastic mechanisms in gene expression. Proc
Natl Acad Sci U S A 94: 814–819.
2. Altschuler S, Wu L (2010) Cellular Heterogeneity: Do Differences Make a
Difference? Cell 141: 559–563.
3. Elowitz MB, Levine AJ, Siggia ED, Swain PS (2002) Stochastic gene expression
in a single cell. Science 297: 1183–1186.
4. Kærn M, Elston TC, Blake WJ, Collins JJ (2005) Stochasticity in gene
expression: from theories to phenotypes. Nat Rev Genet 6: 451–464.
Mitochondria Cause Significant Cellular Noise
PLoS Computational Biology | www.ploscompbiol.org 13 March 2012 | Volume 8 | Issue 3 | e1002416

5. Raj A, van Oudenaarden A (2008) Nature, nurture, or chance: stochastic gene
expression and its consequences. Cell 135: 216–226.6. Chang H, Hemberg M, Barahona M, Ingber D, Huang S (2008) Transcrip-
tome-wide noise controls lineage choice in mammalian progenitor cells. Nature
453: 544–547.7. Fraser D, Kærn M (2009) A chance at survival: gene expression noise and
phenotypic diversification strategies. Mol Microbiol 71: 1333–1340.8. Kussell E, Kishony R, Balaban N, Leibler S (2005) Bacterial persistence: a
model of survival in changing environments. Genetics 169: 1807.
9. Brock A, Chang H, Huang S (2009) Non-genetic heterogeneity – a mutation-independent driving force for the somatic evolution of tumours. Nat Rev Genet
10: 336–342.10. Bastiaens P (2009) Systems biology: when it is time to die. Nature 459: 334–335.
11. Spencer S, Gaudet S, Albeck J, Burke J, Sorger P (2009) Non-genetic origins ofcell-to-cell variability in TRAIL-induced apoptosis. Nature 459: 428–432.
12. Swain P, Elowitz M, Siggia E (2002) Intrinsic and extrinsic contributions to
stochasticity in gene expression. Proc Natl Acad Sci U S A 99: 12795.13. Hilfinger A, Paulsson J (2011) Separating intrinsic from extrinsic uctuations in
dynamic biological systems. Proc Natl Acad Sci U S A 108: 12167.14. Raser JM, O’Shea EK (2004) Control of stochasticity in eukaryotic gene
expression. Science 304: 1811–1814.
15. Newman JRS, Ghaemmaghami S, Ihmels J, Breslow DK, Noble M, et al. (2006)Single-cell proteomic analysis of S. cerevisiae reveals the architecture of
biological noise. Nature 441: 840–846.16. Raj A, Peskin CS, Tranchina D, Vargas DY, Tyagi S (2006) Stochastic mRNA
synthesis in mammalian cells. PLoS Biol 4: e309.17. Paulsson J (2005) Models of stochastic gene expression. Phys Life Rev 2:
157–175.
18. Paulsson J (2004) Summing up the noise in gene networks. Nature 427: 415–418.19. Volfson D, Marciniak J, Blake WJ, Ostroff N, Tsimring LS, et al. (2005) Origins
of extrinsic variability in eukaryotic gene expression. Nature 439: 861–864.20. Bruggeman F, Bluthgen N, Westerhoff H (2009) Noise management by
molecular networks. PLoS Comp Biol 5: 1183–1186.
21. Rausenberger J, Kollmann M (2008) Quantifying origins of cell-to-cell variationsin gene expression. Biophys J 95: 4523–4528.
22. Blake WJ, Kærn M, Cantor CR, Collins JJ (2003) Noise in eukaryotic geneexpression. Nature 422: 633–637.
23. Dobrzynski M, Bruggeman FJ (2009) Elongation dynamics shape burstytranscription and translation. Proc Natl Acad Sci U S A 106: 2583–2588.
24. Thattai M, Van Oudenaarden A (2001) Intrinsic noise in gene regulatory
networks. Proc Natl Acad Sci U S A 98: 8614.25. Sigal A, Milo R, Cohen A, Geva-Zatorsky N, Klein Y, et al. (2006) Variability
and memory of protein levels in human cells. Nature 444: 643–646.26. Sigal A, Milo R, Cohen A, Geva-Zatorsky N, Klein Y, et al. (2006) Dynamic
proteomics in individual human cells uncovers widespread cell-cycle dependence
of nuclear proteins. Nature Methods 3: 525–531.27. Bar-Even A, Paulsson J, Maheshri N, Carmi M, O’Shea E, et al. (2006) Noise in
protein expression scales with natural protein abundance. Nature Genetics 38:636–643.
28. Kaufmann B, van Oudenaarden A (2007) Stochastic gene expression: fromsingle molecules to the proteome. Curr Opin Gen Dev 17: 107–112.
29. Huh D, Paulsson J (2010) Non-genetic heterogeneity from stochastic partitioning
at cell division. Nat Genetics 43: 95–102.30. Huh D, Paulsson J (2011) Random partitioning of molecules at cell division.
Proc Natl Acad Sci U S A 108: 15004.31. das Neves RP, Jones NS, Andreu L, Gupta R, Enver T, et al. (2010) Connecting
Variability in Global Transcription Rate to Mitochondrial Variability. PLoS
Biol 8: 451–464.32. McBride H, Neuspiel M, Wasiak S (2006) Mitochondria: more than just a
powerhouse. Curr Biol 16: R551–R560.33. Chan D (2006) Mitochondria: dynamic organelles in disease, aging, and
development. Cell 125: 1241–1252.
34. Twig G, Hyde B, Shirihai O (2008) Mitochondrial fusion, fission and autophagyas a quality control axis: the bioenergetic view. Biochim Biophys Acta 1777:
1092–1097.35. Collins TJ, Berridge MJ, Lipp P, Bootman MD (2002) Mitochondria are
morphologically and functionally heterogeneous within cells. EMBO J 21:1616–1627.
36. Buckman JF, Reynolds IJ (2001) Spontaneous changes in mitochondrial
membrane potential in cultured neurons. J Neurosci 21: 5054–5065.37. O’Reilly CM, Fogarty KE, Drummond RM, Tuft RA, Walsh JV (2003)
Quantitative analysis of spontaneous mitochondrial depolarizations. Biophys J85: 3350–3357.
38. Schieke SM, Ma M, Cao L, McCoy JP, Liu C, et al. (2008) Mitochondrial
metabolism modulates differentiation and teratoma formation capacity in mouseembryonic stem cells. J Biol Chem 283: 28506–28512.
39. Mitra K, Wunder C, Roysam B, Lin G, Lippincott-Schwartz J (2009) A
hyperfused mitochondrial state achieved at G1–S regulates cyclin E buildup and
entry into S phase. Proc Natl Acad Sci U S A 106: 11960–11965.
40. Mandal S, Guptan P, Owusu-Ansah E, Banerjee U (2005) Mitochondrialregulation of cell cycle progression during development as revealed by the
tenured mutation in Drosophila. Dev Cell 9: 843–854.
41. Owusu-Ansah E, Yavari A, Mandal S, Banerjee U (2008) Distinct mitochondrialretrograde signals control the G1-S cell cycle checkpoint. Nat Genet 40:
356–361.
42. Kuznetsov A, Troppmair J, Sucher R, Hermann M, Saks V, et al. (2006)
Mitochondrial subpopulations and heterogeneity revealed by confocal imaging:Possible physiological role? Biochim Biophys Acta 1757: 686–691.
43. Cossarizza A, Ceccarelli D, Masini A (1996) Functional heterogeneity of an
isolated mitochondrial population revealed by cytouorometric analysis at the
single organelle level. Exp Cell Res 222: 84–94.
44. Mouli P, Twig G, Shirihai O (2009) Frequency and selectivity of mitochondrialfusion are key to its quality maintenance function. Biophys J 96: 3509–3518.
45. Shahrezaei V, Ollivier JF, Swain PS (2008) Colored extrinsic uctuations and
stochastic gene expression. Mol Syst Biol 4: 1–9.
46. Jansen APJ (1995) Monte carlo simulations of chemical reactions on a surfacewith time-dependent reaction-rate constants. Comp Phys Comm 86: 1.
47. Haseltine E, Rawlings J (2002) Approximate simulation of coupled fast and slow
reactions for stochastic chemical kinetics. J Chem Phys 117: 6959.
48. Lane N (2006) Mitochondrial disease: powerhouse of disease. Nature 440:
600–602.
49. Scott I, Youle R (2010) Mitochondrial fission and fusion. Essays Biochem 47:85–98.
50. Martınez-Diez M, Santamarıa G, Ortega A, Cuezva J (2006) Biogenesis and
dynamics of mitochondria during the cell cycle: significance of 3 utrs. PLoS One
1: e107.
51. Wilson E (1916) The distribution of the chondriosomes to the spermatozoa inscorpions. Proc Natl Acad Sci U S A 2: 321.
52. Wilson E (1931) The distribution of sperm-forming materials in scorpions.
J Morphol 52: 429–483.
53. Tzur A, Kafri R, LeBleu VS, Lahav G, Kirschner MW (2009) Cell growth andsize homeostasis in proliferating animal cells. Science 325: 167–171.
54. Posakony J, England J, Attardi G (1977) Mitochondrial growth and division
during the cell cycle in HeLa cells. J Cell Biol 74: 468–491.
55. Veltri K, Espiritu M, Singh G (1990) Distinct genomic copy number in
mitochondria of different mammalian organs. J Cell Physio 143: 160–164.
56. Herbener G (1976) A morphometric study of age-dependent changes inmitochondrial populations of mouse liver and heart. J Geront 31: 8.
57. Mathieu O, Krauer R, Hoppeler H, Gehr P, Lindstedt S, et al. (1981) Design of
the mammalian respiratory system. VII. Scaling mitochondrial volume inskeletal muscle to body mass. Respir Physio 44: 113–128.
58. Suarez R, Lighton J, Brown G, Mathieu-Costello O (1991) Mitochondrialrespiration in hummingbird ight muscles. Proc Natl Acad Sci U S A 88: 4870.
59. Hoppeler H, Lindstedt S, Claassen H, Taylor C, Mathieu O, et al. (1984)
Scaling mitochondrial volume in heart to body mass. Respir Physio 55:131–137.
60. Robin E, Wong R (1988) Mitochondrial DNA molecules and virtual number of
mitochondria per cell in mammalian cells. J Cell Physio 136: 507–513.
61. Kumei Y, Nakajima T, Sato A, Kamata N, Enomoto S (1989) Reduction of G1
phase duration and enhancement of c-myc gene expression in HeLa cells athypergravity. J Cell Sci 93: 221–226.
62. Bogenhagen D, Clayton D (1974) The number of mitochondrial deoxyribonu-
cleic acid genomes in mouse L and human HeLa cells. J Biol Chem 249: 7991.
63. Gillespie D (1977) Exact stochastic simulation of coupled chemical reactions.J Phys Chem 81: 2340–2361.
64. Enver T, Pera M, Peterson C, Andrews P (2009) Stem cell states, fates, and the
rules of attraction. Cell Stem Cell 4: 387–397.
65. MacArthur B, Ma’ayan A, Lemischka I (2009) Systems biology of stem cell fate
and cellular reprogramming. Nat Rev Mol Cell Biol 10: 672–681.
66. Muller F, Laurent L, Kostka D, Ulitsky I, Williams R, et al. (2008) Regulatorynetworks define phenotypic classes of human stem cell lines. Nature 455:
401–405.
67. Graf T, Stadtfeld M (2008) Heterogeneity of embryonic and adult stem cells.
Cell Stem Cell 3: 480–483.
68. Huang S, Guo YP, May G, Enver T (2007) Bifurcation dynamics in lineage-commitment in bipotent progenitor cells. Dev Biol 305: 695–713.
69. Chickarmane V, Enver T, Peterson C (2009) Computational modeling of the
hematopoietic erythroid-myeloid switch reveals insights into cooperativity,priming, and irreversibility. PLoS Comput Biol 5: e1000268.
70. Wang R, Tao L, Trumbore M, Berger S (1997) Turnover of the acyl phosphates
of human and murine prothymosin a in vivo. J Biol Chem 272: 26405.
Mitochondria Cause Significant Cellular Noise
PLoS Computational Biology | www.ploscompbiol.org 14 March 2012 | Volume 8 | Issue 3 | e1002416