Mitochondrial Proteome Heterogeneity between Tissuesfrom ... · Mitochondrial Proteome...
64
1 Mitochondrial Proteome Heterogeneity between Tissues from the Vegetative and Reproductive Stages of Arabidopsis thaliana Development Chun Pong Lee#, Holger Eubel^, Cory Solheim, A. Harvey Millar* ARC Centre of Excellence in Plant Energy Biology & Centre for Comparative Analysis of Biomolecular Networks, M316, The University of Western Australia, 35 Stirling Highway, Crawley WA 6009 Australia. Running title: Arabidopsis mitochondrial heterogeneity *Corresponding author: A. Harvey Millar ARC Centre of Excellence in Plant Energy Biology 4th Floor MCS Building M316 University of Western Australia 35 Stirling Highway Crawley 6009 WA , Australia Tel: +61 8 6488 7245 Fax: +61 8 6488 4401 e-mail: [email protected] #current address: Centre for Organismal Studies, Ruprecht Karl Universität Heidelberg, Heidelberg, Germany. ^current address: Institute for Plant Genetics, Leibniz Universität Hannover, Hannover, Germany
Transcript of Mitochondrial Proteome Heterogeneity between Tissuesfrom ... · Mitochondrial Proteome...
1
Mitochondrial Proteome Heterogeneity between Tissues from the Vegetative and
Reproductive Stages of Arabidopsis thaliana Development
Chun Pong Lee#, Holger Eubel^, Cory Solheim, A. Harvey Millar*
ARC Centre of Excellence in Plant Energy Biology & Centre for Comparative Analysis of
Biomolecular Networks, M316, The University of Western Australia, 35 Stirling Highway,
Crawley WA 6009 Australia.
Running title: Arabidopsis mitochondrial heterogeneity
*Corresponding author: A. Harvey Millar
ARC Centre of Excellence in Plant Energy Biology
4th Floor MCS Building M316
University of Western Australia
35 Stirling Highway
Crawley 6009 WA , Australia
Tel: +61 8 6488 7245
Fax: +61 8 6488 4401
e-mail: [email protected]
#current address: Centre for Organismal Studies, Ruprecht Karl Universität Heidelberg,
Heidelberg, Germany. ^current address: Institute for Plant Genetics, Leibniz Universität
Hannover, Hannover, Germany
2
Abstract
Specialisation of the mitochondrial proteome in Arabidopsis has the potential to
underlie the roles of these organelles at different developmental timepoints and in specific
organs, however most research to date has been limited to studies of mitochondrial
composition from a few vegetative tissue types. To provide further insight into the extent of
mitochondrial heterogeneity in Arabidopsis, mitochondria isolated from six organ/cell types:
leaf, root, cell culture, flower, bolt stem and silique were analysed. Of the 286 protein spots
on a 2-D gel of the mitochondrial proteome, the abundance of 237 spots were significantly
varied between different samples. Identification of these spots revealed a non-redundant set
of 83 proteins which were differentially expressed between organ/cell types, the protein
identification information can be analysed in an integrated manner in an interactive fashion
online. A number of mitochondrial protein spots were identified as being derived from the
same genes in Arabidopsis, but differed in their pI, indicating organ-specific variation in the
post-translational modifications, or in their MW, suggesting differences in truncated
mitochondrial products accumulating in different tissues. Comparisons of the proteomic data
for the major isoforms with microarray analysis showed a positive correlation between
mRNA and mitochondrial protein abundance and 60-90% concordance between changes in
protein and transcript abundance. These analyses demonstrate that, while mitochondrial
proteins are controlled transcriptionally by the nucleus, post-transcriptional regulation and/or
post-translational modifications play a vital role in modulating the state or regulation of
proteins in key biochemical pathways in plant mitochondria for specific functions. The
integration of protein abundance and protein modification data with respiratory
measurements, enzyme assays and transcript datasets has allowed the identification of organ-
enhanced differences in central carbon and amino acid metabolism pathways and provides
ranked lists of mitochondrial proteins that are strongly transcriptionally regulated vs those
3
whose abundance or activity is strongly influenced by a variety of post-transcriptional
processes.
Introduction
Plant mitochondria are best-known for their role in ATP generation in cells through
the combined action of the TCA cycle and the oxidative phosphorylation (OXPHOS)
complexes. The expression of the genes encoding mitochondrial respiratory components has
been shown to be co-regulated in various vegetative and reproductive organs indicating
coordinated biogenesis of the machinery of these organelles 1-6.
However, many reports have also described the specific roles of mitochondria in
particular plant tissues and during different types of metabolism, the differential expression
of mitochondrial components between tissue types, and tissue-specific phenotypes of
mutations affecting mitochondrial processes. For example, glycine-dependent respiration and
inactivation of mitochondrial pyruvate dehydrogenase complex (PDC) are found specifically
in photosynthetic tissues 7, 8. The loss of mitochondrial complex I, uncoupling proteins or
specific TCA cycle enzymes alters photosynthetic efficiency 9-13. The nuclear-encoded
components of mitochondria, such as nda1 and nda2, aox, shm1, and gdcP, show rapid
transcriptional response to light/dark transition and large changes in diurnal transcript pool
sizes 14-17. Root, leaf and flower phenotypes occur due to specific mitochondrial gene
function losses 18-20. Promoter studies also suggest that site II motifs in the proximal promoter
regions of genes for mitochondrial components may play important roles in displaying organ-
specific, metabolic, environmental and developmental responses 3, 21.
These differences are likely expressed as heterogeneity in mitochondrial composition
across plant organs, tissues and cell types. A number of early reports attempted to display and
identify spatially expressed mitochondrial proteins in spinach 22, sugar beet 23, potato 24, pea
4 25, wheat 26 and maize 27 by gel electrophoresis. However, limited genetic information of the
investigated organisms and the lack of automated algorithms for quantifying these differences
hampered early efforts to further investigate and identify these changing components.
The first analyses of the mitochondrial proteome linked to extensive protein
identification in different plant organs was reported for pea 28. Using a 2-D gel
electrophoresis approach, Bardel et al. 28 were able to identify the enzymes that were
selectively more abundant in the mitochondria purified from a particular organ, such as
glycine decarboxylase complex (GDC) and serine hydroxymethyltransferase (SHMT) in
green leaves, formate dehydrogenase (FDH) and cysteine synthase in roots and heat shock
protein (HSP)-22 in seeds. The mitochondrial proteome of the model plant Arabidopsis has
been investigated in cell cultures vs shoots and roots vs shoots grown under a standard set of
conditions 29-33. Binary comparisons between these tissue types have revealed that proteome
differences underlie changes in enzymatic functions of mitochondria 32, 33 but only vegetative
tissues or undifferentiated tissues have been studied to date. In contrast, the mitochondrial
proteomes from a wider range of organs have been more extensively studied in mammalian
models such as mouse 34, 35 and rat 36, 37. Using a combination of proteomic and genetic
approaches, these authors have identified tissue specific mitochondrial proteins, characterised
changes in substrate choice for mitochondria in different tissues and even identified genes
associated with diseases caused by the deficiency of Complex I in mammals 35.
One of the common anomalies found in 2-D gel analysis of mitochondrial proteomes
is the presence of significantly abundant, discrete protein spots that represent truncated
protein products tens of kDa smaller than the mature protein. It is relatively unlikely that
these represent alternative splice variants or truncated translation products. These most likely
arise either from site specific cleavage by enzymatic or physical mechanisms and
accumulation of the cleavage product, or stable degradation intermediates that accumulate
5
during more incremental degradation processes. Accumulation of specific mitochondrial
truncation products has been observed during oxidative stress 38, 39, but are also found in
mitochondrial isolations from different plants 28 and plant cell cultures 40, 41. Binary
comparisons show differences in the abundance of these products in mitochondria from
different tissues 32, 33, but it has not been possible to determine if there is any specificity to
these observations or correlations between the truncated products observed.
Here, we report a comparative analysis of mitochondrial protein composition from
three reproductive phase and three vegetative phase tissue types of Arabidopsis using an
integration of protein and transcript information. Comparisons aimed firstly to determine if
specific metabolism and stress defence pathways were transcriptionally regulated for
specialisation of the mitochondrial proteome in different cellular environments. Secondly, it
aimed to find differences between mitochondrial energy metabolism in vegetative and
reproductive tissues. Thirdly, it sought to determine if patterns of stable post-translationally
modified and truncated protein products found in plant mitochondria could be linked to tissue
origin.
Materials and Methods
Arabidopsis cell culture, hydroponic culture and growth on soil
For this study, the representative Arabidopsis cells/organs at the vegetative phase of
development include heterotrophic cell culture and shoot and root derived from hydroponic
culture. Arabidopsis cell suspension (ecotype Landsberg erecta) was cultured in growth
medium (1x Murashige & Skoog medium without vitamins, 3% sucrose, 0.5 mg/l
naphthaleneacetic acid, 0.05 mg/l kinetin, pH 5.8) for seven days according to Lee et al. 33.
Conditions for the three-week old hydroponic culture were adapted from Schlesier et al. 42
6
with modifications as outlined previously 33, sterile root and shoot material from three-week
old plants in culture was harvested for mitochondrial isolations. In order to collect the major
organs that develop during the reproductive phase of growth, Arabidopsis plants were grown
on soil mix containing compost, perlite and vermiculite (in ratio of 3:1:1) at 22oC under 16-h
light/8-h dark photoperiod. To improve germination rate and synchrony, trays containing
sowed seeds were transferred to a cold (4oC) dark room for 2-3 days for stratification. After
45-50 days, only siliques, stems and open flowers from soil-grown plants were collected for
further analysis.
Isolation of mitochondria
Isolation of mitochondria from hydroponic shoot and cell culture was carried out using the
method modified from Millar et al. 30 as outlined in Lee et al. 33. Mitochondria from flowers,
stems and siliques from soil-grown plants, and roots from hydroponic cultures were isolated
using a method described previously 44 with slight modifications. Briefly, plant materials
were ground with a pre-cooled mortar and pestle in 50 ml of grinding medium (0.45 M
mannitol, 50 mM tetra-sodium pyrophosphate, 0.5% [w/v] PVP, 0.5% [w/v] BSA, 2 mM
EGTA, 20 mM cysteine, pH 8.0, one Complete Protease Inhibitor Cocktail Tablet (Roche,
Dee Why, Australia) per 100 ml). The mixture of medium and plant materials was then
further homogenized using a Polytron blender (Kinematica, Kriens, Switzerland). The
resulting homogenate was centrifuged at 1500 x g for 5 min. The supernatant of crude
organelles was carefully layered over a 7 ml discontinuous PercollTM density gradient
consisting of 18% (2 ml) over 23% (3 ml) and 40% (2 ml) PercollTM solution in mannitol
wash buffer. The gradient was then centrifuged at 40 000 x g for 45 min. The mitochondrial
band, seen as a brownish band at the 23%-40% interface, was recovered with a flat-bottomed
needle, concentrated after dilution by 24 000 x g for 10 min. Total protein concentrations in
7
mitochondria-enriched fractions were estimated according to Bradford 45, using the
Coomassie® Plus Protein Assay Reagent (Pierce, Rockford, USA).
Gel electrophoresis
One-dimensional SDS polyacrylamide gel electrophoresis (1D-SDS-PAGE) was
performed according to the protocol of Laemmli 46. For IEF-SDS-PAGE, mitochondrial
protein samples (500-1000 µg) were acetone extracted and pellets resuspended in 450 µl IEF
rehydration solution (8 M urea, 2% [w/v] CHAPS, 0.5% [v/v] IPG-buffer pI 3-10, 18 mM
DTT, small amount of bromophenolblue). Rehydration and isoelectric focusing of proteins on
a 24 cm, pI 3-10 nonlinear immobilized pH gradient strip (GE Healthcare, Sydney, Australia)
was then carried out using an IPGphor 3 (GE Healthcare, Sydney, Australia). Second
dimension gels were assembled and underwent electrophoresis in the Ettan DALTsix gel tank
(GE Healthcare, Sydney, Australia). BN/SDS-PAGE was performed as previously described
in Schagger 47. A 2-D differential in-gel electrophoresis (DIGE) was performed using a
randomized experimental design (Supplementary Table S2) to minimize gel-to-gel variation
and preferential CyDye labelling 43. All samples and replicates were incorporated into one
experiment. To achieve randomized design of sample labelling, at least one of the replicates
from each biological sample was labelled with a different CyDye and no repeats for the Cy3-
Cy5 combination within the experiment were allowed. Conditions for 2-D DIGE and image
analysis were outlined previously in Lee et al. 33. The abundance data of all the selected
protein spots were extracted from the DeCyder software package (GE Healthcare) through
the XML Toolbox and the raw Cy3 or Cy5 expression data were then normalized against Cy2
values. The Cy2-adjusted Cy3 or Cy5 values are hereafter referred to as “normalized protein
abundance”. A representative Coomassie image is linked to protein identification data and
can be studied in an interactive fashion at the GelMap 48 database (http://gelmap.de/124).
8
Total plant protein extraction, western blotting and immunodetection
Approximately 100-200 mg of tissue was homogenized in liquid N2 and shaken vigorously in
1 ml of extraction buffer (1 x PBS, 1 mM EDTA and protease inhibitor) for 5 min. at 4oC.
Samples were then centrifuged at 2000 x g for 5 min at 4oC to remove large debris and used
for SDS-PAGE. Proteins were transferred from polyacrylamide gels onto HybondTM-C extra
nitrocellulose blotting membrane (GE Healthcare, Sydney, Australia) using a Hoefer
Semiphor semi-dry blotting unit (GE Healthcare, Sydney, Australia). Following 1 hour
blocking with 1% blocking solution (Roche, Dee Why, Australia), membranes were
incubated with antibodies raised against porin (1:10 000 dilution in TBS-Tween) provided by
Dr Tom Elthon (Nebraska), for two hours. Washed membranes were then incubated in a
horseradish peroxidase-conjugated secondary antibody (1:15 000 dilution in TBS-Tween) for
1 hour with gentle rocking. The membrane was incubated for a few minutes with detection
solution from BM Chemiluminescence Blotting Substrate (POD) kit (Roche, Dee Why,
Australia) and the intensities of the chemiluminescence signals were quantified using Image
QuantTLTM software 7 (GE Healthcare, Sydney, Australia).
Tandem mass spectrometry and identification of protein spots
Peptide extraction by in-gel digestion – In-gel digestion of selected gel spots was performed
according to Taylor et al. 39
Liquid chromatography (LC)-electrospray-ionization (ESI)-IonTRAP - Samples were
resuspended in 5% [v/v] acetonitrile and 0.1% [v/v] formic acid. Peptides were loaded onto
self packed Microsorb (Varian Inc., Mulgrave, Australia) C18 (5μm, 100Å) reverse phase
columns (0.5 x 50 mm) using an Agilent Technologies 1100 series capillary liquid
9
chromatography system and eluted into a XCT Ultra IonTrap mass spectrometer with an ESI
source equipped with a low flow nebuliser in positive mode and controlled by Chemstation
(Agilent Technologies, Forest Hill, Australia) and MSD Trap Control version 6.0 (Build
38.15) software (Bruker Daltonics, Preston, Australia). Peptides were eluted from the C18
reverse phase column at 10 μl/min using a 9 minute acetonitrile gradient (5 – 80% [v/v]) in
0.1% [v/v] formic acid at a regulated temperature of 50°C. The method used for initial ion
detection utilized a mass range of 200 – 1400 m/z with scan mode set to Standard (8100 m/z
per sec) and a Ion Charge Control (ICC) conditions set at 250 000 µA and three averages
taken per scan. Smart mode parameter settings were employed using a Target of 800 m/z, a
Compound Stability factor of 90%, a Trap Drive Level of 80% and Optimize set to Normal.
Ions were selected for MS/MS after reaching an intensity of 80 000 cps and two precursor
ions were selected from the initial MS scan. MS/MS conditions employed SmartFrag for ion
fragmentation, a scan range of 70 - 2200 m/z using an average of three scans, the exclusion of
singly charged ions option and ICC conditions set to 200 000 µA in Ultra scan mode (26 000
m/z per sec). Resulting MS/MS spectra were exported from the DataAnalysis for LC/MSD
Trap version 3.3 (Build 149) software package (Bruker Daltonics, Preston, Australia) using
default parameters for AutoMS(n) and compound Export. Results were queried against an in-
house Arabidopsis database comprising ATH1.pep (release 9) from The Arabidopsis
Information Resource (TAIR) and the Arabidopsis mitochondrial and plastid protein sets
(combined database contained a total of 30 700 protein sequences with 12 656 682 residues)
using the Mascot search engine version 2.1.04 and utilizing error tolerances of ± 1.2 Da for
MS and ± 0.6 Da for MS/MS, ‘Max Missed Cleavages’ set to 1, with variable modifications
of Oxidation (M) and Carboxymethyl (C), instrument set to ESI-TRAP and peptide charge set
at 2+ and 3+. ATH1.pep is a non-redundant database with systematically named protein
10
sequences based on Arabidopsis genome sequencing and annotation. Results were filtered
using ‘Standard scoring’, ‘Max. number of hits’ set to “AUTO” and ‘Ions score cut-off’ at 27.
Matrix-assisted laser desorption/ionization (MALDI)-time-of-flight (TOF)/TOF MS/MS
Samples were resuspended in TA solution (acetonitile: 0.1% trifloroacetic acid [1:2]) and
equal volume of TA containing saturating concentration of α-cyano-4-hydroxycinnamic. The
mixture was spotted and dried on a polished stainless steel target plate (Bruker Daltonics).
MALDI-TOF/TOF MS/MS data were collected using an Ultraflex III TOF/TOF (Bruker
Daltonics) equipped with a LIFT-MS/MS component controlled by the FlexControl software
package (version 3.0 Build 173). Calibration of the instrument was performed using Peptide
Calibration Standard II (Bruker Daltonics) over the mass range of 700-4000 Da. In the MS
mode, the peptide mass fingerprint (PMF) of a sample was obtained by positive reflectron
mode with accelerating voltage limited to 29.5 kV. Following MS acquisition, each spectrum
was automatically submitted to the Biotools software package (version 3.1 Build 2.22; Bruker
Daltonics) for PMF searching in Mascot. For samples that were identified by PMF, a
maximum of 20 precursor ions were selected for further analysis in LIFT-MS/MS mode. The
accelerating voltage of the collision cell (ion source 1) and the LIFT cell were limited to 8 kV
and 19 kV respectively, allowing masses to be analysed in the reflectron with high sensitivity.
For each MS/MS spectrum, 250 laser shots were recorded for the parent signal and 800 laser
shots were recorded for the fragment signal. The MS- and MS/MS spectra were automatically
processed by smoothing, baseline subtraction, noise filtering and peak assignment in the
FlexAnalysis software (version 3.0 Build 92; Bruker Daltonics). Following MS/MS
acquisition, the combined PMF and MS/MS spectra were automatically submitted to Mascot
search engine by Biotools for protein identification and were queried against an in-house
Arabidopsis database comprising ATH1.pep (release 9) from The Arabidopsis Information
11
Resource (TAIR) and the Arabidopsis mitochondrial and plastid protein sets (combined
database contained a total of 30 700 protein sequences with 12 656 682 residues). Criteria for
protein identification by Mascot search engine included: error tolerances of ± 0.5 Da for MS
and ± 0.5 Da for MS/MS, ‘Max Missed Cleavages’ set to 1, with variable modifications of
Oxidation (M) and Carbamidomethyl (C), instrument set to MALDI-TOF/TOF and peptide
charge set at 1+. Results were filtered using ‘Standard scoring’, ‘Max. number of hits’ set to
“AUTO” and ‘Ions score cut-off’ at 27.
Validation of protein matches by bioinformatics and statistical strategies - A protein match
was automatically validated only when at least two unique peptides both showing an ion
score higher than 38 (Mascot defined significance threshold p≤ 0.05) were present. For
proteins identified by a significant peptide having a score above the significance threshold,
only the spectrum of the significant peptide was thoroughly inspected to fulfill the criteria
before accepting as a match: (i) each peak corresponding to a fragmented ion was clearly
above base-line background noise, (ii) a series of at least four continuous y or b ions were
observed, (iii) peptides did not match to any sequences in trypsin or any commonly known
contaminants. For proteins identified only by multiple peptides with each ion scored above
the homology threshold (usually between 27 and 37), every single MS/MS spectra were
thoroughly checked. When all the criteria were met, the final protein score must exceed 37 or
the match would be rejected. In order to estimate the false-positive rate (FPR) of our protein
identification strategy, a single concatenated mgf file, generated by MASCAT (Agilent
Technologies) and comprised of all the MS/MS output data, was then used to search against
TAIR9 (target), reversed (decoy) and randomized TAIR9 (decoy) Arabidopsis databases
using the above search strategy. The false-positive rate in target-decoy searches was found to
be 3-4% for peptides with ion scores > 27, which was calculated using the equation described
12
previously 49. Protein isoforms that were identified by the same set of peptides are both
assigned as protein matches. When proteins of different families were identified in a gel spot,
a reference map of the Arabidopsis mitochondrial proteome 40 was used to identify the most
probable match, taking into account the number of peptides with ion scores >38 and the
quality of the delta mass for each peptide. For protein matches with only one unique peptide,
the peptide sequence was searched against a non-redundant protein database in NCBI
BLASTP (taxonomy was limited to Arabidopsis) to ensure no other proteins shared exactly
the same peptide sequence.
Isolation of plant total RNA and ATH1 microarray analysis
Approximately 100 mg of Arabidopsis leaves, stems, roots, flowers or cells were ground to a
fine powder with a mortar and pestle pre-cooled in liquid N2. Total RNA of these tissues was
isolated using the RNeasy Plant Mini kit (QIAGEN) as described by the manufacturer’s
instructions. An on-column treatment of total RNA sample with RNase-free DNaseI
(QIAGEN) during the isolation procedure and a second treatment with Ambion TURBO
DNase (Applied Biosystems) after RNA isolation were performed to ensure complete
removal of contaminating DNA. Isolation of total RNA from Arabidopsis siliques was
performed using the Plant RNA Isolation Kit and Aid (Ambion, Foster City, CA, USA).
Quality and quantity of total RNA and subsequent microarray analysis using Affymetrix
GeneChip Arabidopsis ATH1 Genome Arrays (catalog no. 900386, Affymetrix, Santa Clara,
CA, USA) were performed as previously described 33. CEL files generated were further
analysed using Avadis analysis software (version 4.3; Strand life Sciences, Carlsbad, CA,
USA). Data were normalized using MAS5 algorithm and subjected to log2 transformation.
“Absent” probe sets were filtered out before averaging three biological replicates to get the
13
expression value and false discovery rate (FDR)-adjusted p-values (t-test and/or one-way
ANOVA).
Data Analysis
Analysis of truncated, modified and major protein spot sets - Truncated products derived
from polypeptide chain breaks or degradation processes usually appear as low molecular
weight protein spots on the gel that do not match to their theoretical molecular weight of the
intact protein. These proteins spots were assigned as “truncated” in Supplementary Table
S3. For the identification of the spots of major/active proteins on the gel, the intensity of the
Coomassie stain and the fluorophor stain should be higher than other spots with varying pI. If
the molecular mass and the staining intensity of two or more protein spots are similar, the
assignment of a major protein spot may require previous experimental evidence. For example,
pyruvate dehydrogenase E1α subunit appeared as two protein spots, but Spot 159 showed a
more acidic pI than Spot 165 (Supplementary Figure S2). It was previously shown that the
activity of PDC could be reduced by the phosphorylation of the E1α subunit and
phosphorylated E1α has a more acidic pI on gels 8, 50, 51. Thus the more basic protein spot
should contain the non-phosphorylated and active form of PDC and therefore can be assigned
as the major protein spot on the gel. Finally, when there had been no literature evidence on
any post-translational modifications of a given protein, the protein spot with the highest
Mascot protein score and/or sequence coverage was chosen as the major spot for that protein.
In Supplementary Table S3, the major spots were assigned as “major” and the protein spots
with the same molecular mass but different pI to the major spots were identified as
“modified”. These groups of modified and degraded protein spots for each AGI can also be
viewed in an interactive fashion using the selection tools at the GelMap database
(http://gelmap.de/124).
14
Porin based calculation of mitochondrial mass on a tissue basis - Signals were detected and
their intensities were quantified, resulting in the recognition of a band of approximately 30
kDa in all organs but with slight differences in intensities (Supplementary Figure S4a). The
membrane blots were stained by Ponceau S before immunoblot analysis to confirm that
similar amounts of protein were loaded in each protein lane (data not shown). The most
intense porin signal was detected in the cell culture sample, whereas the amount of porin in
stem was the lowest amongst all the organs studied. A western blot analysis of porin in the
mitochondria (1 μg) isolated from different organs was performed in parallel
(Supplementary Figure S4b). The signals for porin in the mitochondria from different
organs mostly resembled the abundance change observed for Porin 1 in the DIGE experiment
(Supplementary Figure S2, Spot 217 (major) and 215 (modified)), with the exception of
siliques in which the highest band intensity was detected, possibly due to the high basic pI of
porin in siliques which may not be detected in the pI range (3-10) used in this study. To allow
cross-comparison between the band intensity detected in the plant extracts and mitochondrial
samples, a control experiment was performed for each organ where the amount of porin in the
total protein extract was compared against the mitochondrial sample and a mixture of
mitochondria and total protein extract (Supplementary Figure S4c). In most organs analysed,
the sum of the porin signals in the mitochondrial sample and total protein extract is
approximately equal to the band intensity detected in the mixture of both samples. Hence,
there was no differential suppression of porin immunoreactivity in different tissues. From
these results, it is possible to calculate the relative amount of mitochondrial protein in each
organ.
15
Statistical analysis - Unless stated otherwise, all data obtained from experiments were
expressed as mean ± standard error of the mean from at least three independent experiments.
Pearson correlation coefficients and statistical significances (Student’s t-test or one-way
ANOVA) were evaluated using Microsoft Excel or statistical software package R (version
2.6.1).
In order to compare the relative abundance of identified mitochondrial proteins across six
different tissues, normalized protein abundance calculated from data obtained through the
DeCyder™ software package (GE Healthcare) was first transformed by dividing each of the
normalized protein abundances across six different tissues by the maximum abundance for
that particular protein. Heat map of protein abundance was generated using the TIGR
MultiExperiment Viewer 52, with clustering methods set to Euclidean distance and average
linkage.
Before proteome-proteome, transcriptome-transcriptome and protein-transcript correlation
analyses were conducted, normalized log2-transformed expression data which can be found
in both microarray and DIGE analyses (i.e. all mitochondrial components which were
identified on our reference 2-D gel) were extracted and transformed. Data transformation was
carried out as follows: First, protein or transcript abundance of a given gene in a specific
organ was transformed relative to the mean of all extracted expression values in each organ.
Second, the transformed protein or transcript value of a given gene was further normalized
against the average abundances of the same gene across six other organs. Assuming protein-
transcript correlation follows a linear regression model, Pearson correlation coefficient was
used to determine the relationship between two different sets of data (e.g. transcript and
protein level) using the following equation:
16
where σ is the standard deviation, x is the mean of a set of variables and n is the total
number of datasets. To ascertain that the existence of the protein-transcript correlation, if any,
did not occur by chance, the p-value of ρx,y (r-value) for each gene is determined from
permutation test. To compute this value, we permuted the transcript level for each gene
randomly across tissues and determined r-value from the resulting protein-transcript pairs.
We repeated this procedure for a total of 720 times and the p-value was one minus the
proportion of r-values generated from the permutated data that are larger than the true data.
Alternatively, the significance of the Pearson’s r-value was estimated using a less robust
method of T-distribution, which was determined using the following equation:
Results and Discussion
Integration of vegetative mitochondrial proteome differences
We have previously published in-depth analyses of the shoot: root and shoot:cell
culture mitochondrial datasets 32, 33. The third comparison, root:cell culture, provides an
integrated analysis of the differences observed across all two-way comparisons
(Supplementary Figure S1). In total, 46 protein spots were reproducibly changed in
abundance by two-fold between pairs of root and cell culture mitochondrial samples (p < 0.05,
n=3). This brings a total of 185 differentially abundant protein spots across the three sets of
tissue comparisons (Supplementary Table S1).
Integration of the three sets of differentially abundant proteins revealed that only 6 of
the 90 non-redundant proteins identified to change were found to be significantly different in
17
all three comparisons, while a further 29 proteins changed in at least two of the three
comparisons (Figure 1A). The six proteins showing significantly different levels in each
tissue are spread widely in mitochondrial metabolism without a clear link (Figure 1A). When
the fold change in abundance of each spot was considered, it was evident that nearly 40% of
the changing protein spots altered less than 2.5-fold in the comparisons, while ~20% of the
protein spots changed had 6-fold or greater changes (Figure 1B). The proteins changing in
abundance were from most of the major functional categories that constitute the
mitochondrial proteome (Figure 1B), but a distinct bias towards proteins involved in
photorespiration were noted in those that changed more than 6-fold in abundance.
When the correlations in abundant changes between mitochondrial proteins and their
encoded transcripts in Arabidopsis shoot, root and cell culture comparison pairs were
assessed, we found that the majority (76%) of plotted data were clustered within quadrants II
and III (Figure 1C) with Pearson correlation coefficients ranging from 0.33 to 0.53 (p <
0.0001). These indicate that mRNA and protein abundance ratios in each comparison pair are
positively and weakly to moderately correlated. Only 24% of the genes fall into quadrants I
and IV, which indicates discordant changes in transcript and protein abundance. This subset
includes a range of components involved in the TCA cycle, stress defense and also branched-
chain amino acid catabolism.
Within these data, 28 of the 186 changes in abundance were protein spots that were
substantially smaller than the MW of the expected mature protein. These truncated proteins
were typically low in abundance and were found differentially between the vegetative tissues
(Supplementary Table S1) but no clear patterns in their presence or abundance between
tissues were noted.
Isolation of mitochondria from six different organs
18
To broaden our understanding of mitochondrial heterogeneity, we selected three new
organs for analysis derived from after the transition from the vegetative to the reproductive
phase of Arabidopsis growth. The bolt stem arising from the apical meristem after ~5 weeks
of vegetative growth and representing the first major tissue derived from the reproductive
stage of Arabidopsis growth, and also siliques and flowers arising from this bolt stem. Each
Arabidopsis plant produces one or several bolt stems and can develop ~50-100 flowers which
will develop into siliques and later produce seeds. In order to obtain the optimal amount of
flowers for purifying mitochondria, the time at which plants are harvested is critical. We
chose 45-50 days after the initial seed germination (Stage 6.3-6.9 described by Boyes et al.
53), where at least 30-50% of the total flowers that could be developed by each plant during
its life cycle were either opened or had developed into siliques. At any given time during
these growth stages, approximately 10-20 flowers, 10-30 siliques and 1-3 stem bolts could be
harvested per plant.
It is difficult to obtain all necessary materials for this study grown on soil. For
example, it is nearly impossible to obtain Arabidopsis roots in sufficient abundance from soil-
grown plants and extremely hard to remove bacterial contamination from such protocols.
Older leaf material from Arabidopsis is also hard to extract intact mitochondria from. Thus,
we also employed hydroponic culture which would allow us to collect sufficient root and leaf
material to purify relatively high quality and quantity mitochondria. About 10 g of roots
tissues per mitochondrial preparation was also collected directly from 21-day old hydroponic
culture. The abundances of the collected tissues were 20-50-fold less than the amount of leaf
tissue that could be harvested from the same quantity of plants.
However, at least 50 g of plant material is required in order to obtain sufficient
quantity of highly purified (two-Percoll gradient purified) mitochondrial proteins for 2-D gel
analysis. To isolate mitochondria from minimal available tissues in this wider set of organs,
19
the procedure developed for isolating mitochondria from germinating rice embryos was
employed 44, which was previously modified from our method for isolations from
Arabidopsis cell culture 54. Three independent biological replicates of mitochondria were
isolated from three independent cultivations for all six tissues, yielding a total of 18
independently prepared mitochondrial samples.
Proteomic survey of plant mitochondria from different organs
A differential 2-D (DIGE) IEF/SDS-PAGE experiment of mitochondria isolated from
different cells/organs was performed using a randomized experimental design
(Supplementary Table S2, Materials and Methods). A total of nine gels were run and
scanned to obtain the fluorophor signals in each sample. As shown in the gel pictures derived
from the TyphoonTM scanner (GE Healthcare) in Figure 2, mitochondria isolated from
various organs showed overall similar protein composition with a few protein spots which are
distinctly different between one or more gels, indicative of tissue-selective changes. All nine
CyDye images were then simultaneously analysed using DeCyder quantitation software (GE
Healthcare). Protein spots that reproducibly changed in abundance with one-way ANOVA F
< 0.05 were picked as significantly altered spots for further analysis. A total of 474 out of
1024 protein spots detected in the analysis were found to be significantly altered in
abundance across six different organs. Normalized protein abundance for each protein spot
were extracted and calculated as described in the Materials and Methods.
A representative Cy2 image was then matched against a Coomassie-stained
preparative gel, prepared by combining an equal amount of proteins from all six independent
samples (Supplementary Figure 2). This resulted in 286 abundant protein spots that were
able to be identified in both fluorescent- and Coomassie-stained gels. Among these spots,
there are 14 protein spots which were not significantly altered in spot abundance in the
20
quantitative analysis but which were highly abundant on the 2-D gel map as reference points.
These protein spots were positively analysed by MALDI-MS/MS or IonTRAP and the
identities and normalized abundance of the proteins summarized in Supplementary Table
S3A. These data are also accessible through the GelMap database (http://gelmap.de/124).
Although the analysis from 2-D (DIGE) IEF/SDS–PAGE resolved a limited number
of hydrophobic proteins, we have previously shown, by 2-D (DIGE) blue-native PAGE, that
very little difference was observed in the mitochondrial membrane proteomes of cell culture,
shoot and root 32, 33 (Supplementary Figure S1B). In our hands most of these changes in
membrane proteins occur at the post-translational level and thus their abundance were not
investigated further here, although future study of such differences could be undertaken to
extend this analysis.
In total, proteins corresponding to 237 of the 286 spots which were significantly
different in protein abundance amongst various plant organs belong to or are functionally
associated with energy metabolism and TCA cycle, photorespiration and amino acid
metabolism (Supplementary Table S3E).
Only 22 protein spots (9.3% of the total spots identified) were previously found to be
contaminants in mitochondrial samples from other parts of the cell, based on our previous
analyses 55 as well as studies from previous fluorescent protein localization and proteomic
analyses. To assess the degree of contamination in mitochondria isolated from each
organ/cell, we compared spot fluorescence intensity of the contaminants against all the
proteins detected on a 2-D DIGE gel. As shown in Supplementary Table S3F, it was
estimated that about 3.5-7.9% and 0.8-1.7% of the total spot intensity was derived from
proteins of plastids and peroxisomes origin respectively. The analysis also highlights that
different proteins from peroxisomes and plastids have very varied levels in mitochondrial
21
preparations from different tissues. It also shows that the mitochondrial samples were 90-
93% of mitochondrial origin by protein abundance from across the tissues.
Analysis of quantified differences between plant mitochondrial proteomes from
vegetative and reproductive phases
To more broadly compare these vegetative proteomes to those of bolt stems, flowers
and siliques, a hierarchical clustering approach was undertaken using the TIGR
MultiExperiment Viewer (TMeV 52). Hierarchical clustering connects similar genes
iteratively based on the similarity of expression patterns, and has been commonly used for
analysing large-scale microarray data. Clustering of the entire set of 286 proteins that were
confidently identified by MS/MS revealed several interesting clusters of proteins with similar
expression patterns (Supplementary Figure S3). These clusters included components that
are highly abundant in cell culture (Cluster 2), root (Cluster 7), leaf (Cluster 4), green tissues
(Cluster 5), non-photosynthetic organs (Cluster 3) and tissues consist of rapidly dividing cells
(cell culture and flower, Cluster 1), or proteins that are enriched during the early stages of
plant development (21-day old plants, Cluster 6), and the development of inflorescence,
flower and seed (from 5-7 week old plants, Cluster 8). As seen in Supplementary Table
S3A (and online in the Gelmap representation of the data) a single protein can appear as
multiple spots on the 2-D gel. This is due to post-translational modifications or truncation of
proteins which led to changes in the overall isoelectric charge and/or molecular weight of
spots.
In order to further examine the organ heterogeneity of the mitochondrial proteome,
we first assembled a non-redundant set of proteins found on the 2-D gel by determining
which gel spot contained the major form of a given protein, and which ones were modified or
truncated proteins (as outlined in Materials and Methods). Using these criteria for spot
22
assignment, we were able to identify 97 non-redundant major proteins, 103 modified proteins,
64 degradation products, and 22 contaminants on the 2-D gel that changed in abundance in at
least one tissue. Among 97 non-redundant major proteins, 83 of them were significantly
altered in abundance (14 others were most abundant proteins on the 2-D gel that served as
reference points).
Using the non-redundant set of 97 abundant proteins identified from the 2-D gel, we
then assessed the degree of similarity between the mitochondrial proteomes from different
organs. A Pearson correlation coefficient was determined for each pairwise comparison using
only the averaged and normalized abundance of the “major” set of proteins (Figure 3).
Interestingly, pairwise comparison of the correlation values (Supplementary Table S5)
showed that the root mitochondrial proteome showed modest similarity with mitochondria
from any other organ (r ≤ 0.05). In contrast, bolt stem and flower mitochondrial proteomes
showed a much higher degree of similarity with the silique mitochondrial proteome amongst
all the pairwise comparisons performed, with the highest r-values of 0.35 and 0.49 for bolt
stem and flower respectively. This may indicate that their mitochondrial proteomes are
maintained by similar developmental stage-dependent transcriptional or post-transcriptional
mechanisms. The correlation coefficients in other pairs of comparisons ranged from -0.59
between cell culture and silique mitochondrial proteome to 0.21 between flower and stem
mitochondrial proteome. The lack of strong correlations between the proteomes of vegetative
and reproductive tissues indicates the difference in mitochondrial composition in these organ
types.
Proteins enhanced in mitochondria from reproductive phase tissues – The proteins more
abundant in flower mitochondria are an eclectic mix of functions. We found cases of isoform
swapping between vegetative and reproductive tissues. Both malate dehydrogenase isoforms
23
were most abundant in leaf mitochondria (Figure 3), suggesting that the mitochondrial role
of supplying malate for mediation of photosynthesis and respiration in the light is specifically
enhanced in leaf. Subunit 1 of malate dehydrogenase (MDH1) is at least 30% more abundant
in flower than in root and cell culture mitochondria, whereas MDH2 was more abundant in
mitochondria from root than reproductive tissues. Thus, it can be speculated that MDH1
could play a role in energy metabolism in the mitochondria of floral organs. The isoform 1 of
the glycine decarboxylase P-protein (GDC-P1, At4g33010) is most abundant in leaf
mitochondria, indicating that it plays a crucial role in photorespiration-dependent glycine
cleavage in mitochondria. In comparison, the abundance of isoform 2 of the GDC-P (GDC-
P2, At2g26080) was found to be at least 40% more abundant in mitochondria from tissues of
reproductive phase than of vegetative phase (Figure 3). Previous analysis of P-protein
knockouts shows that the two isoforms are functionally redundant in mitochondria 56, but it
remains unclear whether they have different functional roles during development. Since
GDC-P2 appears to be preferentially accumulated in non-photosynthetic tissues 56, this
isoform may function to provide essential precursors for C1 metabolism, which is required
for the biosynthesis of metabolites vital to energy-demanding tissue development during
reproductive phase, such as purines and thymidylates 57.
The 23kDa-(TYKY) subunit of complex I (At1g79010) was identified on 2-D
DIGE/IEF/SDS-PAGE to be at least two-fold more abundant in flower mitochondria than in
the mitochondria isolated from vegetative phase tissues (Figure 3). In human, the nuclear
gene encoding the TYKY-subunit of complex I is highly expressed in tissues with high
energy demand, and the mutation of this component can lead to a deficiency in Complex I 58.
While differences in the amount several respiratory subunits were also detected on IEF/SDS-
PAGE in pairwise comparisons of vegetative tissues, BN/SDS-PAGE showed no significant
differences in assembled supercomplexes or their individual components 32, 33
24
(Supplementary Figure S1B). It is not certain whether an increase in TYKY subunit in the
matrix (or soluble compartments) reflects the state of assembly of complex I and/or energy
demand in the cell during reproductive phase.
We also found several proteins involved in amino acid metabolism which are
increased in abundance during the reproductive phase. For example, the abundance of one of
the arginase isoforms (ARG2, At4g08870) was more abundant in both the flower and silique
mitochondria than in any other organs (Figure 3). Interestingly, the other arginase isoform
(ARG1, At4g08900, Figure 3) was more abundant in the leaf and cell culture than flower and
silique mitochondria. Alanine aminotransferase (At1g17290) was also found to be generally
higher in abundance in mitochondria from reproductive tissues (Figure 3).
At least a 30% higher in the abundance of NADPH-dependent thioredoxin reductase
(At4g35460, identified as NTRB 59) in flower mitochondria was observed when compared to
other organs (Figure 4, Supplementary Table S3B). This protein has been shown to be the
major isoform of NTR in mitochondria 60 and has been previously postulated to play an
important role in cell proliferation, seed development and pollen fitness 61.
The glycine-rich RNA-binding protein (GRP2, At4g13850) is at least 20% more
abundant in the mitochondria from flower than other organs (Figure 3, Supplementary
Table S3B). While the main function of this protein in mitochondrial gene expression
remains unclear, it has been proposed that this enzyme mediates post-transcriptional
processes such as RNA editing and transcript stability 62. The abundance of adenylate kinase
(At5g50370) in the flower is similar to cell culture (both of which have a high energy
requirement for rapid cell division), but it is higher than in all other organs.
Differential abundance of heat shock and stress defense proteins – A total of six known heat
shock proteins or molecular chaperones were found to vary in abundance across the six
25
Arabidopsis organs examined. HSP60/10 and co-chaperone grpE proteins identified by the
MS/MS analysis are most abundant in cell culture mitochondria (Figure 3). Prohibitin 3, a
membrane chaperone, is more abundant in the leaf and root mitochondria than the silique,
flower, cell culture and stem mitochondria, consistent with expression analysis of prohibitin
using green fluorescence protein-glucuronidase fusion protein in various Arabidopsis tissues
63. Interestingly, while the most abundant protein spot of HSP70-1 (At4g37910) is almost
equally abundant in leaf, root and flower (less than 15% differences in spot abundance), most
of the pI-shifted modified protein spots were higher in abundance in flower mitochondria
(Supplementary Figure S2, Supplementary Table S3B and C). Also, the abundance of
another isoform of HSP70-2 (At5g09590) is more abundant in energy-demanding flower,
root and cell culture mitochondria than in organelles from other organs. Together, these data
may suggest that HSP70 could play a different role in protein import and maintaining the
mitochondrial proteome in flowers than in other organs.
Seven proteins with putative roles in stress response were identified to be
differentially regulated in the six organs investigated (Figure 3). The amount of
peroxiredoxin (PRXIIF, At3g06050), manganese superoxide dismutase (MnSOD) and
glutaredoxin were higher in mitochondria isolated from the leaf than any other organ, while
the dual-targeted ascorbate peroxidase was most abundant in root mitochondria followed by
flower mitochondria. Thioredoxin reductase and aldehyde dehydrogenase were most
abundant in flower mitochondria.
Comparison of protein abundance and enzyme/pathway activity across mitochondrial
proteomes of vegetative tissues.
This combined DIGE experiment allowed us to directly compare the abundance of key
components across the three vegetative tissues with enzyme and respiratory pathway activity
26
measurements made previously 32, 33 (Figure 4). Notably, there was good correlation between
protein abundance and activity for glycine, formate, pyruvate, citrate and malate oxidizing
pathways, but correlations for glutamate, aconitase, and succinyl-CoA utilizing steps were
very dependent on which isoform of an enzyme was used to correlate with the activity data.
The 6-10 fold differences in glycine- and formate-dependent respiration rates clearly
followed protein abundance changes of 2 to 90-fold for subunits of these enzymes. More
subtle changes of 20-40% in NADH-, succinate-, glutamate and malate+pyruvate-dependent
respiration, either failed to be predicted by protein abundance changes or did not have
differential protein abundances recorded from the DIGE analysis. Clearly, mitochondria from
each tissue had its own substrates of choice, based on maximal catalytic activities. Within the
first half of the TCA cycle, citrate synthase and aconitase activities were highest in cell
culture, which was consistent with the relative abundance of at least one isoform of these
enzymes from the DIGE analysis. In the second half of the TCA cycle the main difference
was in succinyl-CoA ligase activity which was two-fold higher in root mitochondria. Much of
the second half of the TCA cycle was more abundant in shoot mitochondria on a protein basis,
but this was not reflected in the maximal activity of many of these enzymes (Figure 4).
Comparison of protein abundance and transcript abundance across the six tissues
We found that several mitochondrial proteins obtained from our DIGE experiment
showed similar tissue-specific transcription pattern in Genevestigator 64 as well as in a
number of published data, such as subunits of GDC-P protein 56, TYKY-subunit of Complex
I 65, arginases 66 and heat shock proteins or molecular chaperones 67. Given that we have only
surveyed 97 out of predicted ~2000 proteins in mitochondria 68, we want to ascertain the
specific categories of mitochondrial proteins in which differences in abundance across
vegetative and reproductive tissue types can or cannot be predicted based on transcript data
27
alone. Thus, in order to determine the relationship between transcription and translation in
each organ and across various organs on a gene-by-gene basis, we performed measurements
of the global changes in transcript levels using the Affymetrix GeneChips with RNA samples
prepared from the same material used for isolation of mitochondria. Microarray experiments
were undertaken in triplicate for each organ. After normalization, analysis of the data
revealed that the correlation between the replicates for each organ was greater than 0.95.
Probe sets were included only when they were called "present" in at least 25 array GeneChips,
resulting in a final set of 14581 gene products for further analysis.
Several studies have shown that the number of mitochondria is typically higher in the
reproductive organs. Mitochondria are more abundant in the gametophyte cells than in other
cell types 69, the yield of mitochondrial proteins is higher from pollen than in other vegetative
organs 70, and the abundance of b/c1 complex in tobacco flowers is higher due to the higher
number of mitochondria per cell in floral organs than in photosynthetic leaf tissues 71. While
the microarray analysis measures the global transcript abundance in the cell, our DIGE
experiment quantifies protein changes on the basis of equal amounts of total mitochondrial
proteins. In order to enable the direct comparison between transcript and protein levels of the
mitochondrial components, we normalized the protein abundance values to provide an
estimation of mitochondrial protein with respect to the total quantity of cellular proteins using
antibodies against porin in total cell extracts (Supplementary Figure S4, and Materials and
Methods for details). These data indicated that cell culture has the highest ratio of
mitochondria per total cellular protein mass, followed by the flower; whereas the relative
amounts of mitochondria to total cellular protein mass from the bolt stem and silique are
quite low.
After the abundance of mitochondrial proteins identified by MS was normalized with
respect to the total cellular content, these data were then paired with their corresponding
28
normalized transcript abundance from ATH1 arrays for further analysis. We performed a
parametric correlation analysis of the global protein and transcript abundance in different
organs (Supplementary Table S6). Using the Pearson correlation method, the two lowest
correlation coefficients of 0.14 and 0.38 were obtained for flower and silique respectively,
indicating little or no positive correlation between the abundance of transcripts and proteins
for the mitochondrial components in these organs. The low correlation between protein and
transcript accumulation in flower and silique but higher similarity between these proteomes
(Supplementary Tables S5, S6) may suggest that the mitochondrial proteome in these
organs may be primarily regulated at the post-transcriptional, translational and/or post-
translational level and maintained by similar mechanisms. In other organs, the correlation
coefficients generally range from 0.46 to 0.66, indicating the relationships between the level
of mRNA and protein for mitochondrial components in the leaf, root, cell culture and stem
were mildly and positively correlated. This indicates that the protein abundance in these
organs can be controlled post-transcriptionally and/or post-translationally, while a number of
the mitochondrial proteins may be maintained primarily by transcript abundance.
However, this analysis does not define whether specific mitochondrial components
are commonly controlled at the transcriptional level. To determine this, we performed a
Pearson correlation analysis on the protein level and corresponding transcript abundance
across six organs for each of the 97 non-redundant proteins of the set of mitochondrial
components (Figure 5A). To infer the strength of the relationship between gene products,
three classes of genes were defined based on the correlation coefficient and permutation test-
derived p-value cut-offs proposed by Kislinger et al. 72: (i) genes that have r > 0.66
(permutation test-calculated confidence interval >95% or p-value less than 0.05) were
classified as “inliers”, which showed a strong positive linear relationship; (ii) genes with r <
0.33 were classifed as “outliers”, which exhibited no or negative linear relationship and (iii)
29
genes with intermediate correlation (0.33 ≤ r ≤ 0.66) were classified as “midliers”, which
showed some positive linear relationship (“mild positive” correlation) but the p-values were
not significant (i.e. permutation test-calculated confidence interval <95% or p > 0.05). Thus,
the genes in the “inlier” and “midlier” categories can be said to be concordant, whereas the
“outlier” genes are significantly discordant.
With this approach, 26 pairs of the microarray and protein data were considered to be
highly concordant and 34 pairs of the gene products belong to the “midlier” category. The
“inlier” group includes six proteins in the TCA cycle, four respiratory chain components
including ATP synthases and seven proteins associated with photorespiration. Also, 37
mitochondrial components were found to be significantly discordant (38%). To define which
mitochondrial functional categories were significantly concordant or discordant, we
considered the proportion of the genes which were “inliers”, “midliers” or “outliers” in each
functional category (Figure 5B). Of the known functional categories identified, over 75% of
the components in the photorespiratory pathway showed significantly strong positive linear
relationship between protein and transcript abundance, while less than 45% of the pairs of
gene products in other functional categories showed significantly strong positive linear
relationship. Interestingly, the abundance of protein and transcript of 75% of the components
associated with stress response detected in our study were strongly discordant. Of all these
antioxidant defense proteins, the only one with a mild correlation between transcript and
protein abundance was peroxiredoxin. In contrast, other proteins in the same functional
category appeared to be most abundant in flower mitochondria but showed strong negative
correlations between transcript abundance and protein abundance. The apparent negative
correlation with ATP synthase alpha subunit is probably evidence that the use of the probe
sets for mitochondrial genome components in ATH1 arrays with priming with oligoDT is
problematic due to differential polyadenylation of the mitochondrial transcript pool. Several
30
proteins in the outlier category are dual- or multi-targeted proteins, such as thioredoxin
reductase 60 and aconitase (data not shown). Thus, the lack of concordance of these proteins
might indicate the correlation between cellular transcript level and steady state protein
abundance in one location. Overall, the results may indicate that photorespiration could be
regulated directly by the transcription of the nuclear genes, while components involved in
mitochondrial stress defence could be controlled post-translationally and that the metabolic
machinery involves both transcriptional and post-translational regulation.
The mitochondrial proteins in various mouse organs have been shown to exhibit
insignificant concordant to somewhat discordant correlation with mRNA level relative to the
whole cellular proteome, indicating that a significant number of the mitochondrial proteins
are controlled post-transcriptionally72. At present, it is difficult to pinpoint the exact
mechanisms that accounts for the lack of mRNA and protein abundance across tissues for
each gene due to difficulties in applying transcription and translation inhibitors in vivo.
Differences between relative abundance of acidic modification products and the tissue
of origin
A significant number of the low abundant proteins that were very differentially
abundant in mitochondria (Supplementary Figure S3) were protein spots with a shifted
isoelectric point but the same molecular mass as the major mitochondrial proteins. By
grouping these into protein spots that were shifted in the acidic and basic direction from the
major protein spot, we could identify that acidic shifted variants accumulated preferentially in
mitochondria isolated from reproductive tissues. The protein spots for each AGI can be
selected when viewing the data at www.gelmap.de/124. Figure 6 shows heat maps of the
major groups of acidic (A) and basic (B) shifted modified proteins alongside the relative
abundance of the major protein spots. In most cases the major protein represented over 90%
31
of the protein’s abundance, but each spot’s maximum abundance was set to 1 in order to
show the trend in abundances across tissues. In some cases of acidic shift, such as aconitase 2
and 3, the degree of shift was associated with the relative abundance in stem bolt and flower
mitochondria.
Specific truncation products accumulate in reproductive and vegetative tissues
To compare the abundance of truncated products, they were grouped into sets based
on the protein they matched to, and the sets of proteins with a significant number of distinct
products were individually clustered across tissue types. The five proteins with the highest
number of additional products were ATP synthase beta subunit (At5g08670), glycine
decarboxylase P subunits (At4g33010, At2g26000) glycine decarboxylase T (At1g11860)
and aconitase (At2g05710). In heat maps of the abundances of these different gels spots, a
clear divide is evident between the abundance of degradation products in the reproductive
tissues and the vegetative tissues (Figure 7). This was very apparent in the almost complete
distinction of degradation products in the two groups of tissues in ATP synthase beta subunit
(At5g08670), GDC P subunit At2g26080, GDC T At1g11860 and aconitase 2 (At1g05710),
but was still apparent with particular protein products in GDC P At4g33010. This shows that
these often observed truncated products are consistently present in Arabidopsis mitochondria
in a tissue specific manner.
Concluding remarks
In this study, we have conducted a comprehensive analysis of the mitochondrial
proteome in the major reproductive and vegetative tissue types, as well as explored its link
with transcription and post-translational modifications which may together have a profound
effect on mitochondrial functions during development. The mitochondrial proteome of
32
Arabidopsis is relatively robust, with a distinct and recognisable 2-D PAGE pattern evident
across all the organs/systems analysed (Figure 2). In-depth MS analysis of the proteins also
showed that there were no truly organ-specific mitochondrial proteins amongst the top ~200
proteins. Photorespiratory proteins were the most differentially abundant, but could still be
found at low levels in non-photosynthetic tissues. Correlation of protein and transcript
abundance in pairwise comparisons showed that a range of factors were operating in the
regulation of protein abundance (Figure 1C). Correlation of protein:transcript pairing across
all six tissues identified the subset of mitochondrial proteins that were well correlated with
their transcripts (r > 0.66) (Figure 5). Notably these included enzymes for which protein
abundance also correlated well with maximal enzyme activity, such as formate
dehydrogenase, aconitase (isoform 2) and glycine decarboxylase (Figure 4). However, in
other cases there was a strong negative correlation between protein abundance and transcript
abundance that was reiterated across tissues, most notably for NAD-malic enzyme, aldehyde
dehydrogenase and thioredoxin reductase. It is hard to predict the activity of enzymatic steps
from protein abundance when multiple isoforms of a protein exist. This still left many
mitochondrial proteins for which protein abundance was only moderately correlated with
transcript, highlighting the continued need for in depth protein based analysis of
mitochondrial composition amongst tissues.
The mitochondrial proteins have been shown to exhibit insignificant concordant to
somewhat discordant correlation with mRNA level relative to the whole cellular proteome in
multicellular organisms, indicating that a significant number of the mitochondrial proteins are
controlled post-transcriptionally and/or post-translationally 72, 73. Analyses of cases where
multiple protein spots matched to the same protein showed that both the abundance of post-
translationally modified proteins (Figure 6) and of truncated proteins (Figure 7) was not
random, but had tissue specific characteristics. Surveying the association of these
33
modifications with specific tissues provides an impetus and a framework to pursue the
identification of the importance of these post-translational processes on mitochondrial
function in specific organs.
Considering central carbon metabolism as an example, we can now integrate the
information gained from the experiments conducted here to show the complex patterns of
regulation that are emerging (Figure 8). Central carbon metabolism shows the elevation of a
section of TCA cycle and amino acid catabolism in dark-grown tissues, and the elevation of
the other half of the TCA cycle and photorespiratory linked processes in light grown tissues
as expected. In the detail it is apparent that many steps (GDH, S-CoA, MDH, Aco, GDC-T,
GDC-P, E1β, LPD, ARG) are encoded by two genes that often differ in their abundance
profile but also in their degree of correlation between transcript and protein levels and their
profile of truncation/modification. This adds a further complexity to understanding
heterogeneity of mitochondria between tissues and we are yet to understand the broader
significance and basis of these modifications.
34
References
1. Smart, C. J.; Monegar, F.; Leaver, C. J., Cell-specific regulation of gene expression in
mitochondria during anther development in sunflower. Plant Cell 1994, 6, 811-825.
2. Ribichich, K. F.; Tioni, M. F.; Chan, R. L.; Gonzalez, D. H., Cell-type-specific
expression of plant cytochrome c mRNA in developing flowers and roots. Plant Physiology
2001, 125, 1603-1610.
3. Gonzalez, D. H.; Welchen, E.; Attallah, C. V.; Comelli, R. N.; Mufarrege, E. F.,
Transcriptional coordination of the biogenesis of the oxidative phosphorylation machinery in
plants. Plant Journal 2007, 51, 105-116.
4. Zabaleta, E.; Heiser, V.; Grohmann, L.; Brennicke, A., Promoters of nuclear-encoded
respiratory chain complex I genes from Arabidopsis thaliana contain a region essential for
anther/pollen-specific expression. Plant Journal 1998, 15, 49-59.
5. Narsai, R.; Howell, K. A.; Carroll, A.; Ivanova, A.; Millar, A. H.; Whelan, J.,
Defining core metabolic and transcriptomic responses to oxygen availability in rice embryos
and young seedlings. Plant Physiology 2009, 151, 306-322.
6. Howell, K. A.; Narsai, R.; Carroll, A.; Ivanova, A.; Lohse, M.; Usadel, B.; Millar, A.
H.; Whelan, J., Mapping metabolic and transcript temporal switches during germination in
rice highlights specific transcription factors and the role of RNA instability in the
germination process. Plant Physiology 2009, 149, 961-980.
7. Douce, R.; Bourguignon, J.; Neuburger, M.; Rebeille, F., The glycine decarboxylase
system: a fascinating complex. Trends in Plant Science 2001, 6, 167-176.
35
8. Tovar-Mendez, A.; Miernyk, J. A.; Randall, D. D., Regulation of pyruvate
dehydrogenase complex activity in plant cells. European Journal of Biochemistry 2003, 270,
1043-1049.
9. Dutilleul, C.; Driscoll, S.; Cornic, G.; De Paepe, R.; Foyer, C. H.; Noctor, G.,
Functional mitochondrial complex I is required by tobacco leaves for optimal photosynthetic
performance in photorespiratory conditions and during transients. Plant Physiology 2003, 131,
264-275.
10. Sweetlove, L. J.; Lytovchenko, A.; Morgan, M.; Nunes-Nesi, A.; Taylor, N. L.;
Baxter, C. J.; Eickmeier, I.; Fernie, A. R., Mitochondrial uncoupling protein is required for
efficient photosynthesis. Proceedings of the National Academy of Sciences of the United
States of America 2006, 103, 19587-19592.
11. Carrari, F.; Nunes-Nesi, A.; Gibon, Y.; Lytovchenko, A.; Loureiro, M. E.; Fernie, A.
R., Reduced expression of aconitase results in an enhanced rate of photosynthesis and marked
shifts in carbon partitioning in illuminated leaves of wild species tomato. Plant Physiology
2003, 133, 1322-1335.
12. Nunes-Nesi, A.; Carrari, F.; Lytovchenko, A.; Smith, A. M.; Loureiro, M. E.;
Ratcliffe, R. G.; Sweetlove, L. J.; Fernie, A. R., Enhanced photosynthetic performance and
growth as a consequence of decreasing mitochondrial malate dehydrogenase activity in
transgenic tomato plants. Plant Physiology 2005, 137, 611-22.
13. Nunes-Nesi, A.; Carrari, F.; Gibon, Y.; Sulpice, R.; Lytovchenko, A.; Fisahn, J.;
Graham, J.; Ratcliffe, R. G.; Sweetlove, L. J.; Fernie, A. R., Deficiency of mitochondrial
fumarase activity in tomato plants impairs photosynthesis via an effect on stomatal function.
Plant Journal 2007, 50, 1093-106.
14. Michalecka, A. M.; Svensson, A. S.; Johansson, F. I.; Agius, S. C.; Johanson, U.;
Brennicke, A.; Binder, S.; Rasmusson, A. G., Arabidopsis genes encoding mitochondrial type
36
II NAD(P)H dehydrogenases have different evolutionary origin and show distinct responses
to light. Plant Physiology 2003, 133, 642-652.
15. McClung, C. R.; Hsu, M.; Painter, J. E.; Gagne, J. M.; Karlsberg, S. D.; Salome, P. A.,
Integrated temporal regulation of the photorespiratory pathway. Circadian regulation of two
Arabidopsis genes encoding serine hydroxymethyltransferase. Plant Physiology 2000, 123,
381-391.
16. Svensson, A. S.; Rasmusson, A. G., Light-dependent gene expression for proteins in
the respiratory chain of potato leaves. Plant Journal 2001, 28, 73-82.
17. Turner, S. R.; Hellens, R.; Ireland, R.; Ellis, N.; Rawsthorne, S., The organization and
expression of the gene encoding the mitochondrial glycine decarboxylase complex and serine
hydroxymethyltransferase in pea (Pisum sativum). Molecular & General Genetics 1993, 236,
402-408.
18. Quint, M.; Barkawi, L. S.; Fan, K.-T.; Cohen, J. D.; Gray, W. M., Arabidopsis IAR4
Modulates auxin response by regulating auxin homeostasis. Plant Physiology 2009, 150, 748-
758.
19. Phillips, M. A.; D'Auria, J. C.; Gershenzon, J.; Pichersky, E., The Arabidopsis
thaliana type I isopentenyl diphosphate isomerases are targeted to multiple subcellular
compartments and have overlapping functions in isoprenoid biosynthesis. Plant Cell 2008, 20,
677-696.
20. de Longevialle, A. F.; Meyer, E. H.; Andres, C.; Taylor, N. L.; Lurin, C.; Millar, A.
H.; Small, I. D., The pentatricopeptide repeat gene OTP43 is required for trans-splicing of the
mitochondrial nad1 intron 1 in Arabidopsis thaliana. Plant Cell 2007, 19, 3256-3265.
21. Welchen, E.; Gonzalez, D. H., Overexpression of elements recognized by TCP-
domain transcription factors in the upstream regions of nuclear genes encoding components
37
of the mitochondrial oxidative phosphorylation machinery. Plant Physiology 2006, 141, 540-
545.
22. Scahlstrom, S.; Ericson, I., Comparative electrophoretic studies of polypeptides in
leaf, petiole and root mitochondria from spinach. Physiologia Plantarum 1984, 61, 45-50.
23. Lind, C.; Hallden, C.; Moller, I. M., Protein synthesis in mitochondria purified from
roots, leaves and flowers of sugar beet. Physiologia Plantarum 1991, 83, 7-16.
24. Colas des Francs-Small, C.; Ambard-Bretteville, F.; Darpas, A.; Sallantin, M.; Huet,
J.-C.; Pernollet, J.-C.; Remy, R., Variation of the polypeptide composition of mitochondria
isolated from different potato tissues. Plant Physiology 1992, 98, 273-278.
25. Remy, R.; Ambard-Bretteville, F.; Colas des Francs, C., Analysis by two-dimensional
gel electrophoresis of the polypeptide composition of pea mitochondria isolated from
different tissues. Electrophoresis 1987, 8, 528-532.
26. Rios, R.; de Buyser, J.; Henry, Y.; Ambard-Bretteville, F.; Remy, R., Two-
dimensional electrophoretic comparison of mitochondrial polypeptides from different wheat
(Triticum aestivum L.) tissues. Plant Science 1991, 76, 159-166.
27. Newton, K. J.; Walbot, V., Maize mitochondria synthesize organ-specific
polypeptides. Proceedings of the National Academy of Sciences of the United States of
America 1985, 82, 6879-6883.
28. Bardel, J.; Louwagie, M.; Jaquinod, M.; Jourdain, A.; Luche, S.; Rabilloud, T.;
Macherel, D.; Garin, J.; Bourguignon, J., A survey of the plant mitochondrial proteome in
relation to development. Proteomics 2002, 2, 880-898.
29. Kruft, V.; Eubel, H.; Jaensch, L.; Werhahn, W.; Braun, H.-P., Proteomic approach to
identify novel mitochondrial proteins in Arabidopsis. Plant Physiology 2001, 127, 1694-1710.
30. Millar, A. H.; Sweatlove, L. J.; Giege, P.; Leaver, C. J., Analysis of the Arabidopsis
mitochondrial proteome. Plant Physiology 2001, 127, 1711-1727.
38
31. Heazlewood, J. L.; Tonti-Filippini, J. S.; Gout, A. M.; Day, D. A.; Whelan, J.; Millar,
A. H., Experimental analysis of the Arabidopsis mitochondrial proteome highlights signaling
and regulatory components, provides assessment of targeting prediction programs, and
indicates plant-specific mitochondrial proteins. Plant Cell 2004, 16, 241-256.
32. Lee, C. P.; Eubel, H.; O'Toole, N.; Millar, A. H., Combining proteomics of root and
shoot mitochondria and transcript analysis to define constitutive and variable components in
plant mitochondria. Phytochemistry 2011, 72, 1092-1108.
33. Lee, C. P.; Eubel, H.; O'Toole, N.; Millar, A. H., Heterogeneity of the mitochondrial
proteome for photosynthetic and non-photosynthetic Arabidopsis metabolism. Molecular &
Cellular Proteomics 2008, 7, 1297-1316.
34. Mootha, V. K.; Bunkenborg, J.; Olsen, J. V.; Hjerrild, M.; Wisniewski, J. R.; Stahl, E.;
Bolouri, M. S.; Ray, H. N.; Sihag, S.; Kamal, M.; Patterson, N.; Lander, E. S.; Mann, M.,
Integrated analysis of protein composition, tissue diversity, and gene regulation in mouse
mitochondria. Cell 2003, 115, 629-640.
35. Pagliarini, D. J.; Calvo, S. E.; Chang, B.; Sheth, S. A.; Vafai, S. B.; Ong, S. E.;
Walford, G. A.; Sugiana, C.; Boneh, A.; Chen, W. K.; Hill, D. E.; Vidal, M.; Evans, J. G.;
Thorburn, D. R.; Carr, S. A.; Mootha, V. K., A mitochondrial protein compendium elucidates
complex I disease biology. Cell 2008, 134, 112-123.
36. Forner, F.; Foster, L. J.; Campanaro, S.; Valle, G.; Mann, M., Quantitative proteomic
comparison of rat mitochondria from muscle, heart, and liver. Molecular & Cellular
Proteomics 2006, 5, 608-19.
37. Reifschneider, N. H.; Goto, S.; Nakamoto, H.; Takahashi, R.; Sugawa, M.; Dencher,
N. A.; Krause, F., Defining the mitochondrial proteomes from five rat organs in a
physiologically significant context using 2D blue-native/SDS-PAGE. Journal of Proteome
Research 2006, 5, 1117-32.
39
38. Sweetlove, L. J.; Heazlewood, J. L.; Herald, V.; Holtzapffel, R.; Day, D. A.; Leaver,
C. J.; Millar, A. H., The impact of oxidative stress on Arabidopsis mitochondria. Plant
Journal 2002, 32, 891-904.
39. Taylor, N. L.; Heazlewood, J. L.; Day, D. A.; Millar, A. H., Differential impact of
environmental stresses on the pea mitochondrial proteome. Molecular & Cellular Proteomics
2005, 4, 1122-1133.
40. Taylor, N. L.; Heazlewood, J. L.; Millar, A. H., The Arabidopsis thaliana 2-D gel
mitochondrial proteome: Refining the value of reference maps for assessing protein
abundance, contaminants and post-translational modifications. Proteomics 2011, 11, 1720-
1733.
41. Kruft, V.; Eubel, H.; Jaensch, L.; Werhahn, W.; Braun, H.-P., Proteomic approach to
identify novel mitochondrial proteins in Arabidopsis. Plant Physiology 2001, 127, 1694-1710.
42. Schlesier, B.; Breton, F.; Mock, H.-P., A hydroponic culture system for growing
Arabidopsis thaliana plantlets under sterile conditions. Plant Molecular Biology Reporter
2003, 21, 449-456.
43. Lee, C. P.; Eubel, H.; Millar, A. H., Diurnal changes in mitochondrial function reveal
daily optimization of light and dark respiratory metabolism in Arabidopsis. Molecular &
Cellular Proteomics 2010, 9, 2125-2139.
44. Howell, K. A.; Millar, A. H.; Whelan, J., Ordered assembly of mitochondria during
rice germination begins with promitochondrial structures rich in components of the protein
import apparatus. Plant Molecular Biology 2006, 60, 201-223.
45. Bradford, M., A rapid and sensitive method for the quantitation of a microgram
quantities of protein utilizing the principles pf protein-dye binding. Analytical Biochemistry
1976, 72, 248-254.
40
46. Laemmli, U. K., Cleavage of structural proteins during assembly of head of
bacteriophage-T4. Nature 1970, 227, 680-685.
47. Schägger, H.; Pfeiffer, K., Supercomplexes in the respiratory chains of yeast and
mammalian mitochondria. EMBO Journal 2000, 19, 1777-1783.
48. Klodmann, J.; Senkler, M.; Rode, C.; Braun, H. P., The protein complex proteome of
plant mitochondria. Plant Physiology 2011, 157, 587-598.
49. Elias, J. E.; Gygi, S. P., Target-decoy search strategy for increased confidence in
large-scale protein identifications by mass spectrometry. Nature Methods 2007, 4, 207-214.
50. Bykova, N. V.; Egsgaard, H.; Moller, I. M., Identification of 14 new phosphoproteins
involved in important plant mitochondrial processes. FEBS Letters 2003, 540, 141-146.
51. Budde, R. J.; Randall, D. D., Pea leaf mitochondrial pyruvate dehydrogenase complex
is inactivated in vivo in a light-dependent manner. Proceedings of the National Academy of
Sciences of the United States of America 1990, 87, 673-676.
52. Saeed, A. I.; Sharov, V.; White, J.; Li, J.; Liang, W.; Bhagabati, N.; Braisted, J.;
Klapa, M.; Currier, T.; Thiagarajan, M.; Sturn, A.; Snuffin, M.; Rezantsev, A.; Popov, D.;
Ryltsov, A.; Kostukovich, E.; Borisovsky, I.; Liu, Z.; Vinsavich, A.; Trush, V.; Quackenbush,
J., TM4: a free, open-source system for microarray data management and analysis.
Biotechniques 2003, 34, 374-378.
53. Boyes, D. C.; Zayed, A. M.; Ascenzi, R.; McCaskill, A. J.; Hoffman, N. E.; Davis, K.
R.; Gorlach, J., Growth stage-based phenotypic analysis of Arabidopsis: A model for high
throughput functional genomics in plants. Plant Cell 2001, 13, 1499-1510.
54. Millar, A. H.; Liddell, A.; Leaver, C. J., Isolation and subfractionation of
mitochondria from plants. Methods in Cell Biology 2001, 65, 53-74.
41
55. Eubel, H.; Lee, C. P.; Kuo, J.; Meyer, E. H.; Taylor, N. L.; Millar, A. H., Free-flow
electrophoresis for purification of plant mitochondria by surface charge. The Plant Journal
2007, 52, 583-594.
56. Engel, N.; van den Daele, K.; Kolukisaoglu, U.; Morgenthal, K.; Weckwerth, W.;
Parnik, T.; Keerberg, O.; Bauwe, H., Deletion of glycine decarboxylase in Arabidopsis is
lethal under nonphotorespiratory conditions. Plant Physiology 2007, 144, 1328-1335.
57. Hanson, A. D.; Roje, S., One-carbon metabolism in higher plants. Annual Review of
Plant Physiology and Plant Molecular Biology 2001, 52, 119-137.
58. Loeffen, J.; Smeitink, J.; Triepels, R.; Smeets, R.; Schuelke, M.; Sengers, R.; Trijbels,
F.; Hamel, B.; Mullaart, R.; van den Heuvel, L., The first nuclear-encoded Complex I
mutation in a patient with Leigh Syndrome. American journal of human genetics 1998, 63,
1598-1608.
59. Laloi, C.; Rayapuram, N.; Chartier, Y.; Grienenberger, J. M.; Bonnard, G.; Meyer, Y.,
Identification and characterization of a mitochondrial thioredoxin system in plants.
Proceedings of the National Academy of Sciences of the United States of America 2001, 98,
14144-14149.
60. Reichheld, J. P.; Meyer, E.; Khafif, M.; Bonnard, G.; Meyer, Y., AtNTRB is the
major mitochondrial thioredoxin reductase in Arabidopsis thaliana. FEBS Letters 2005, 579,
337-342.
61. Reichheld, J. P.; Khafif, M.; Riondet, C.; Droux, M.; Bonnard, G.; Meyer, Y.,
Inactivation of thioredoxin reductases reveals a complex interplay between thioredoxin and
glutathione pathways in Arabidopsis development. Plant Cell 2007, 19, 1851-1865.
62. Vermel, M.; Guermann, B.; Delage, L.; Grienenberger, J. M.; Marechal-Drouard, L.;
Gualberto, J. M., A family of RRM-type RNA-binding proteins specific to plant
42
mitochondria. Proceedings of the National Academy of Sciences of the United States of
America 2002, 99, 5866-5871.
63. Van Aken, O.; Pecenkova, T.; van de Cotte, B.; De Rycke, R.; Eeckhout, D.; Fromm,
H.; De Jaeger, G.; Witters, E.; Beemster, G. T. S.; Inze, D.; Van Breusegem, F.,
Mitochondrial type-I prohibitins of Arabidopsis thaliana are required for supporting
proficient meristem development. Plant Journal 2007, 52, 850-864.
64. Zimmermann, P.; Hirsch-Hoffmann, M.; Hennig, L.; Grusissem, W., Genevestigator.
Arabidopsis microarray database and analysis toolbox. Bioinformatics 2004, 136, 2621-2632.
65. Schmidt-Bleek, K.; Heiser, V.; Thieck, O.; Brennicke, A.; Grohmann, L., The 28.5-
kDa iron sulfur protein of mitochondrial complex I is encoded in the nucleus in plants.
Molecular & General Genetics 1997, 253, 448-454.
66. Chen, H.; McCaig, B. C.; Melotto, M.; He, S. Y.; Howe, G. A., Regulation of plant
arginase by wounding, jasmonate, and the phytotoxin coronatine. Journal of Biological
Chemistry 2004, 279, 45998-46007.
67. Huang, J.; Struck, F.; Matzinger, D. F.; Levings, C. S., Flower-enhanced expression
of a nuclear-encoded mitochondrial respiratory orotein is associated with changes in
mitochondrion number. Plant Cell 1994, 6, 439-448.
68. Millar, A. H.; Whelan, J.; Small, I., Recent surprises in protein targeting to
mitochondria and plastids. Current Opinion in Plant Biology 2006, 9, 610-615.
69. Lee, S. L. J.; Warmke, H. E., Organelle Size and Number in Fertile and T-
Cytoplasmic Male-Sterile Corn. American Journal of Botany 1979, 66, 141-148.
70. De Paepe, R.; Forchioni, A.; Chetrit, P.; Vedel, F., Specific Mitochondrial Proteins in
Pollen - Presence of an Additional Atp Synthase Beta-Subunit. Proceedings of the National
Academy of Sciences of the United States of America 1993, 90, 5934-5938.
43
71. Huang, J.; Struck, F.; Matzinger, D. F.; Levings, C. S., Flower-enhanced expression
of a nuclear-encoded mitochondrial respiratory protein is associated with changes in
mitochondrion number. Plant Cell 1994, 6, 439-448.
72. Kislinger, T.; Cox, B.; Kannan, A.; Chung, C.; Hu, P. Z.; Ignatchenko, A.; Scott, M.
S.; Gramolini, A. O.; Morris, Q.; Hallett, M. T.; Rossant, J.; Hughes, T. R.; Frey, B.; Emili,
A., Global survey of organ and organelle protein expression in mouse: Combined proteomic
and transcriptomic profiling. Cell 2006, 125, 173-186.
73. Cox, B.; Kislinger, T.; Wigle, D. A.; Kannan, A.; Brown, K.; Okubo, T.; Hogan, B.;
Jurisica, I.; Frey, B.; Rossant, J.; Emili, A., Integrated proteomic and transcriptomic profiling
of mouse lung development and Nmyc target genes. Molecular Systems Biology 2007, 3, 109.
44
Figures
Figure 1. Integration of the changes in mitochondrial protein abundance between
vegetative tissues in Arabidopsis. (A) Venn diagram showing the number of mitochondrial
proteins that were changed in abundance by more than two-fold (p < 0.05) in shoot vs cell
culture (blue), shoot vs root (green) and root vs cell culture (red) comparisons. Six proteins
which are consistently altered in abundance in all three comparisons are listed below the
Venn diagram. (B) Bar graph illustrating the distribution of all differentially abundant protein
spots found in the three pairwise comparisons in relation to fold-change range of all. The pie
charts represent the proportion of proteins from each functional category that changes in
abundance by two- to six-fold (left) or more than six-fold (right) Abbreviations: aamet, amino
acid metabolism; cmet, carbon metabolism; etc, electron transport chain; hsp, heat shock
proteins and chaperones; other, other proteins,; photo, photorespiration; redox, stress
response; RNA, transcription. (C) Protein abundance ratio of mitochondrial components
between shoot and cell culture samples (blue diamond), shoot and root samples (green
triangle) and cell culture and root samples (red square) (y-axis) was plotted against the
transcript abundance ratio for the same components (x-axis) in log10 scale (n = 165).
Figure 2. The 2-D gel maps of mitochondria isolated from various plant organs. The 2-D
gel patterns of the mitochondrial proteins in green leaf, bolt stem, flower, silique, root, and
cell culture from Arabidopsis were compared and their representative gels are shown above.
Proteins were prepared from PercollTM gradient purified mitochondria and separated by 2-D
(DIGE) IEF/SDS-PAGE. Proteins (50 μg from each sample) were separated according to
their isoelectric point in the first dimension and by molecular weight (using SDS-PAGE) in
the second dimension. Samples were either labelled with Cy3 or Cy5 with Cy2 as an internal
45
standard mixture of all the mitochondrial samples. All gel pictures were derived from the
TyphoonTM Gel Scanner and analysed with the DeCyderTM software package.
Figure 3. Hierarchical clustering of the protein abundance of the major mitochondrial
proteins. The total of 97 mitochondrial proteins was selected based on their 2-D gel position,
previous literature evidence and MS/MS data (see Materials and Methods details). Each set of
protein was transformed relative to the highest Cy3/Cy5 to Cy2 ratio across tissues and the
total protein sets were then independently clustered. The heat map colour gradient range is
shown at the top. Asterisks (*) indicate proteins which are higher in abundance in
reproductive organs, particularly in flowers, than in vegetative organs/cells. Carets (^) denote
organ-enhanced heat-shock and stress-response proteins in mitochondria.
Figure 4. Protein abundance and enzyme activities of primary metabolic steps in
mitochondria from vegetative tissues in Arabidopsis. Normalized protein abundance for
all the “major” mitochondrial proteins (refer to the text and Figure 3) in the respiratory chain
(A) and TCA cycle (B) is displayed as heat maps in the following order (from left to right):
cell culture, shoot and root. The heat map colour gradient range is shown at the bottom (same
range as Figure 3). Maximal enzyme catalytic activity or substrate-dependent respiration rate
of the selected steps of the respiratory chain and TCA cycle are shown as bar graphs, with
data for cell culture, shoot and root are represented by blue, green and red bar respectively. In
(B), using experimental and previously published data, enzymes highlighted in green were
elevated in abundance or activity in shoot mitochondria, those in blue and red were higher in
root and cell culture respectively, while those in grey were not determined due to insufficient
data. Abbreviations: 2-OGDH, 2-oxoglutarate dehydrogenase; ACON, aconitase; AlaAT,
alanine aminotransferase; AspAT, aspartate aminotransferase; CS, citrate synthase; ETFQO,
46
electron transfer flavoprotein-ubiquinone oxidoreductase; ExND, external NADH
dehydrogenases; GDH, glutamate dehydrogenase; CI, complex I; CII, complex II, succinate
dehydrogenase; CIII, complex III, CIV, complex IV; cyt c, cytochrome c; FUM, fumarase;
IDH, isocitrate dehydrogenase; MDH, malate dehydrogenase; NAD-ME, NAD-dependent
malic enzyme; S-CoA ligase, succinyl-CoA ligase, SDH, complex II, succinate
dehydrogenase;
Figure 5. Concordance between mRNA and protein abundance on a gene-by-gene basis.
(A) The abundances of 97 mitochondrial proteins obtained from the DIGE experiment were
normalized to the cellular protein level and compared against the corresponding transcript
levels measured by microarray. The heat map shows the protein level (P) alongside with
transcript abundance (T) in each tissue. The strength of correlation between mRNA and
protein level was defined using the following statistical parameters: “inliers”, highly
correlated (concordant) gene products with a significant permutation test-calculated p-value;
“midliers”, gene products that did not a have significant permutation test-calculated p-value
but had an r-value greater than or equal to 0.33; and “outliers”, uncorrelated (discordant) gene
products. The heat map was sorted in descending order, with components with the highest
positive r-value shown at the top and the most significantly uncorrelated proteins identified at
the bottom. The graph showing the r-value determined for each pair of gene products across
six organs is provided at the far right of the heat map. (B) Histogram showing the proportion
of mitochondrial components from each functional category that was found to be inlier (blue),
midlier (white) or outlier (grey). The number of mitochondrial components in each functional
category is shown at the top of the histogram.
47
Figure 6. Relative abundance of acidic and basic protein modifications in vegetative and
floral organ mitochondria. Heat map of relative abundance for “modified” proteins spots
grouped into specific protein sets. These protein spots have the same molecular mass as the
major mitochondrial proteins but with a shifted isoelectric point. More specifically, acidic
proteins spots (A) and basic protein spots (B) shifted to a lower and higher pI, respectively,
relative to the position of the “major” proteins on the 2-D gel map (Supplementary Figure S2).
The heat map colour gradient range is the same as in Figure 3. Numbers within the brackets
correspond to spot numbers in Supplementary Figure S2 and Supplementary Table S3.
Figure 7. Relative abundance of stable truncated protein products for major
mitochondrial proteins in vegetative and floral organ mitochondria. Heat map of relative
abundance for truncated protein spots. Truncated protein products appear as low molecular
weight protein spots on the gel that do not match to their theoretical molecular weight of the
intact protein (Supplementary Figure S2). Only five proteins with the highest number of
truncated products are shown here (see Supplementary Table S3 for other truncated products).
The heat map colour gradient range is the same as in Figure 3. Numbers within the brackets
correspond to spot numbers in Supplementary Figure S2 and Supplementary Table S3.
Figure 8. Scheme illustrating patterns of differential protein expression, protein-
transcript correlation and post-translational modification in mitochondrial primary
metabolism across six organs/cells. Enzymes in italics are framed according to their
concordance with their corresponding transcript data: inlier (rectangle), midlier (rounded
rectangle), outlier (hexagon) or no matched data (ellipse). The color(s) within each frame
represents protein which exhibits a higher abundance in cell culture (light-brown), shoot
48
(green), root (dark-brown), stem (light-green), flower (dark-blue) and/or silique (blue).
Proteins with no apparent significant changes and/or were not identified on the 2-D gel are in
fallow. Post-translationally “modified” or “truncated” proteins are tagged with a symbol
or respectively. Abbreviations: BCAT, branched-chain amino acid aminotransferase; E-
CoAH, enoyl-CoA hydratase; GABA, γ-hydroxybutyric acid; OGDC, 2-oxoglutarate
dehydrogenase complex; PDC, pyruvate dehydrogenase complex; SAT, serine
acetyltransferase; SSA, succinic semialdehyde; THF, tetrahydrofolate. For other enzyme
abbreviations, refer to Supplementary Table S3B for their full name and corresponding AGI
accession number.
49
Supporting Information Available: This material is available free of charge via the
internet at http://pubs.acs.org
Supplementary Files:
Supplementary Figure S1.Representative images of the root:cell culture DIGE analyses
Supplementary Figure S2. A Coomassie-stained preparative gel showing all the
mitochondrial proteins that are present in all six plant organs analysed in this study.
Supplementary Figure S3. Clustering of the entire set of 251 proteins that were confidently
identified by MS/MS revealed several interesting clusters of proteins with similar expression
patterns.
Supplementary Figure S4. Total quantity of mitochondria on a cellular protein basis using
antibodies to porin in total cell extract western blots.
Supplementary Table S1. Proteins from mitochondrial samples found to vary in abundance
(ratio>2, p<0.05) in pairwise comparisons between shoot, cell culture and root samples..
Supplementary Table S2 Randomized experimental design of differential 2-D (DIGE)
IEF/SDS-PAGE experiment for tissue samples.
Supplementary Table S3. 286 abundant proteins analysed by MALDI-MS/MS or IonTRAP
and the identities and normalized abundance of each protein and assessment of truncation,
modification and contamination.
50
Supplementary Table S4. Combined transcript and protein data for the analysis of protein vs
transcript concordance on gene-by-gene basis
Supplementary Table S5. Pairwise comparison of the correlation values between
mitochondrial proteomes of different tissues.
Supplementary Table S6. Parametric correlation analysis of the global protein and transcript
abundance in different tissues.
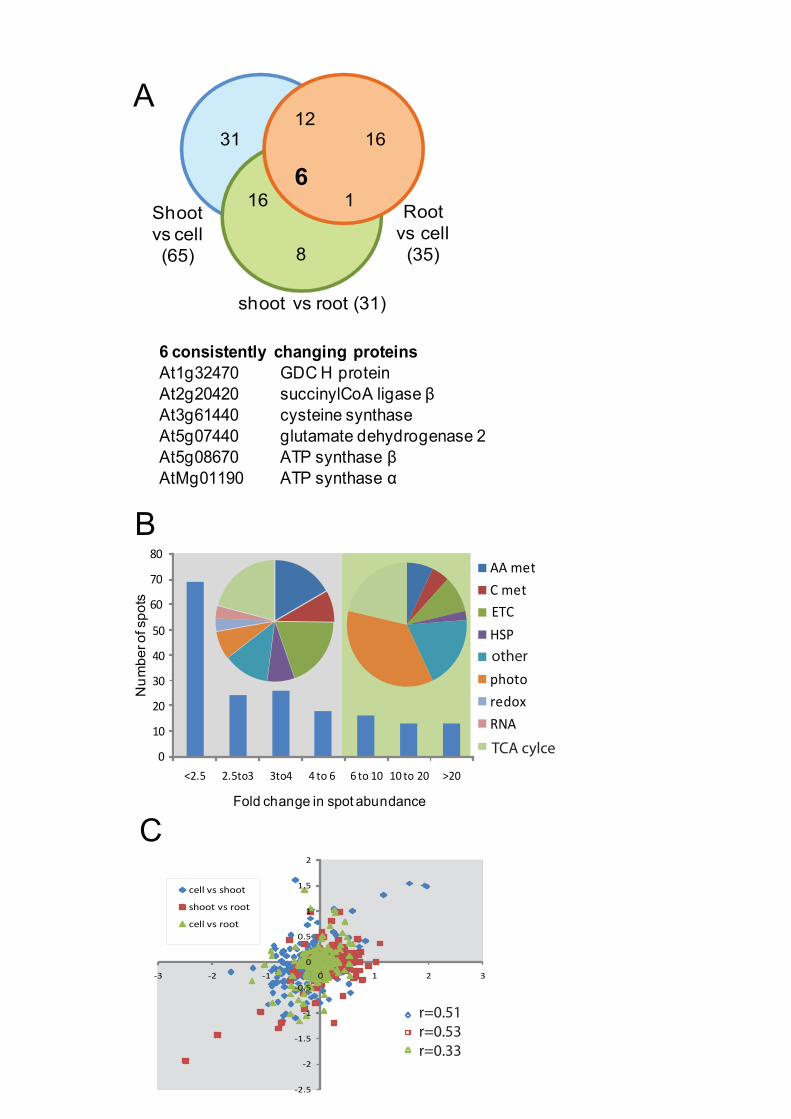
-2.5
-2
-1.5
-1
-0.5
0
0.5
1
1.5
2
-3 -2 -1 0 1 2 3
cell vs shoot
shoot vs root
cell vs root
A
B
Shootvs cell(65)
Rootvs cell
(35)
shoot vs root (31)
16
8
31
6116
12
6 consistently changing proteinsAt1g32470 GDC H proteinAt2g20420 succinylCoA ligase βAt3g61440 cysteine synthaseAt5g07440 glutamate dehydrogenase 2At5g08670 ATP synthase βAtMg01190 ATP synthase α
C
0
10
20
30
40
50
60
70
80
<2.5 2.5to3 3to4 4 to 6 6 to 10 10 to 20 >20
Fold change in spot abundance
Num
ber o
f spo
ts
AA metC metETCHSP
photoredoxRNA
other
r=0.51r=0.53r=0.33
TCA cylce
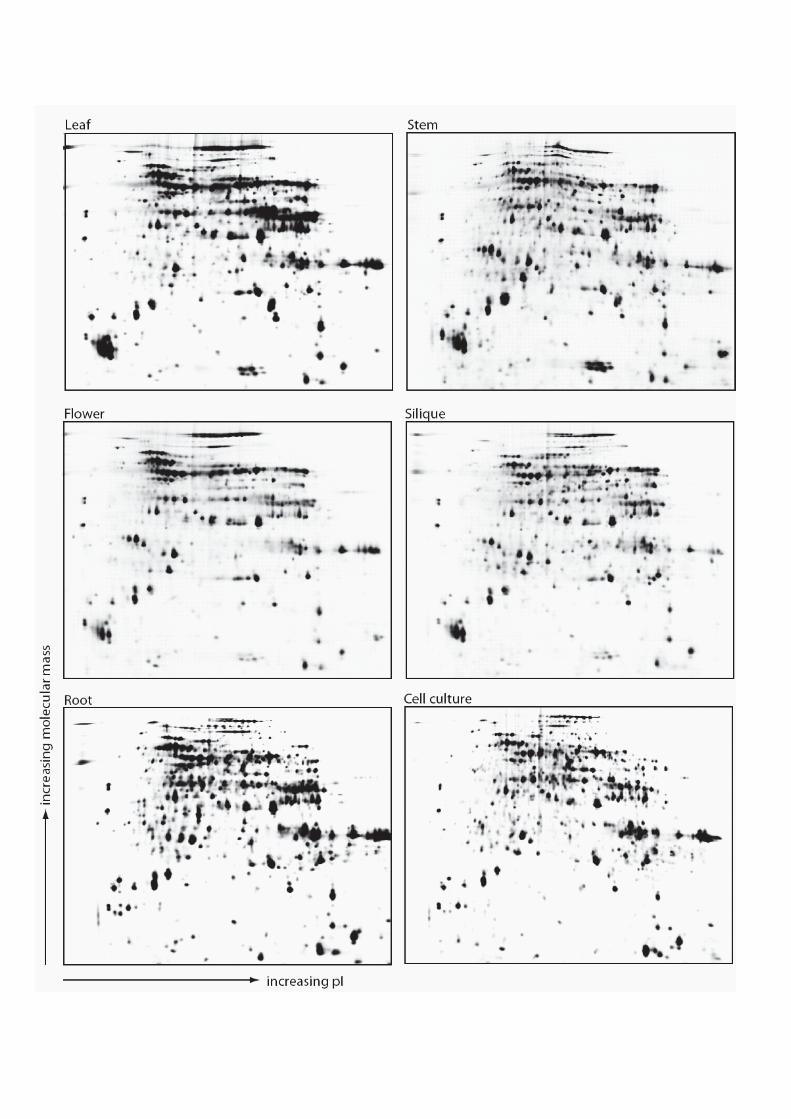
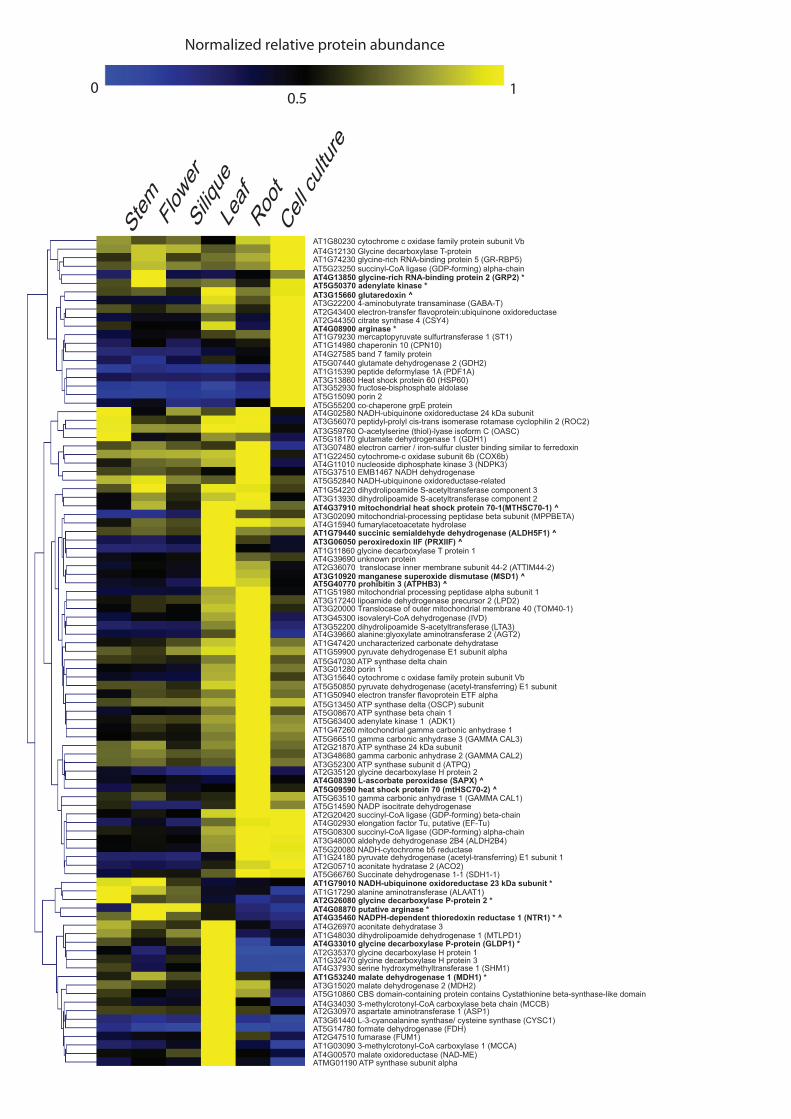
Stem Fl
ower
Silique
Leaf
Root
Cell c
ulture
0 10.5
Normalized relative protein abundance
AT1G22450 cytochrome-c oxidase subunit 6b (COX6b)
AT4G12130 Glycine decarboxylase T-proteinAT1G74230 glycine-rich RNA-binding protein 5 (GR-RBP5)
AT4G08870 putative arginase *AT4G35460 NADPH-dependent thioredoxin reductase 1 (NTR1) * ^
AT1G79010 NADH-ubiquinone oxidoreductase 23 kDa subunit *AT1G17290 alanine aminotransferase (ALAAT1)AT2G26080 glycine decarboxylase P-protein 2 *
AT2G35370 glycine decarboxylase H protein 1
AT4G37930 serine hydroxymethyltransferase 1 (SHM1)AT1G32470 glycine decarboxylase H protein 3
AT1G48030 dihydrolipoamide dehydrogenase 1 (MTLPD1)AT4G33010 glycine decarboxylase P-protein (GLDP1) *
AT1G53240 malate dehydrogenase 1 (MDH1) *
AT5G10860 CBS domain-containing protein contains Cystathionine beta-synthase-like domainAT3G15020 malate dehydrogenase 2 (MDH2)
AT4G34030 3-methylcrotonyl-CoA carboxylase beta chain (MCCB)
AT5G14780 formate dehydrogenase (FDH)AT3G61440 L-3-cyanoalanine synthase/ cysteine synthase (CYSC1)AT2G30970 aspartate aminotransferase 1 (ASP1)
ATMG01190 ATP synthase subunit alpha
AT1G03090 3-methylcrotonyl-CoA carboxylase 1 (MCCA)AT4G00570 malate oxidoreductase (NAD-ME)
AT2G47510 fumarase (FUM1)
AT3G07480 electron carrier / iron-sulfur cluster binding similar to ferredoxin
AT4G11010 nucleoside diphosphate kinase 3 (NDPK3)
AT5G52840 NADH-ubiquinone oxidoreductase-related
AT3G59760 O-acetylserine (thiol)-lyase isoform C (OASC)AT3G56070 peptidyl-prolyl cis-trans isomerase rotamase cyclophilin 2 (ROC2)
AT5G18170 glutamate dehydrogenase 1 (GDH1)
AT3G15660 glutaredoxin ^AT3G22200 4-aminobutyrate transaminase (GABA-T)
AT4G08900 arginase *AT2G44350 citrate synthase 4 (CSY4)AT2G43400 electron-transfer flavoprotein:ubiquinone oxidoreductase
AT5G55200 co-chaperone grpE protein
AT1G14980 chaperonin 10 (CPN10)AT4G27585 band 7 family protein
AT1G15390 peptide deformylase 1A (PDF1A)
AT5G15090 porin 2
AT3G13860 Heat shock protein 60 (HSP60)AT3G52930 fructose-bisphosphate aldolase
AT1G79230 mercaptopyruvate sulfurtransferase 1 (ST1)
AT5G07440 glutamate dehydrogenase 2 (GDH2)
AT1G24180 pyruvate dehydrogenase (acetyl-transferring) E1 subunit 1AT2G05710 aconitate hydratase 2 (ACO2)AT5G66760 Succinate dehydrogenase 1-1 (SDH1-1)
AT2G20420 succinyl-CoA ligase (GDP-forming) beta-chainAT4G02930 elongation factor Tu, putative (EF-Tu)
AT3G48000 aldehyde dehydrogenase 2B4 (ALDH2B4)AT5G20080 NADH-cytochrome b5 reductase
AT5G08300 succinyl-CoA ligase (GDP-forming) alpha-chain
AT3G02090 mitochondrial-processing peptidase beta subunit (MPPBETA)AT4G15940 fumarylacetoacetate hydrolase
AT2G36070 translocase inner membrane subunit 44-2 (ATTIM44-2)AT3G10920 manganese superoxide dismutase (MSD1) ^AT5G40770 prohibitin 3 (ATPHB3) ^
AT1G79440 succinic semialdehyde dehydrogenase (ALDH5F1) ^AT3G06050 peroxiredoxin IIF (PRXIIF) ^AT1G11860 glycine decarboxylase T protein 1
AT3G13930 dihydrolipoamide S-acetyltransferase component 2AT4G37910 mitochondrial heat shock protein 70-1(MTHSC70-1) ^
AT1G54220 dihydrolipoamide S-acetyltransferase component 3
AT5G09590 heat shock protein 70 (mtHSC70-2) ^AT4G08390 L-ascorbate peroxidase (SAPX) ^AT2G35120 glycine decarboxylase H protein 2
AT2G21870 ATP synthase 24 kDa subunit
AT4G39660 alanine:glyoxylate aminotransferase 2 (AGT2)
AT3G45300 isovaleryl-CoA dehydrogenase (IVD)AT3G52200 dihydrolipoamide S-acetyltransferase (LTA3)
AT1G50940 electron transfer flavoprotein ETF alpha
AT5G63400 adenylate kinase 1 (ADK1)AT5G08670 ATP synthase beta chain 1
AT5G66510 gamma carbonic anhydrase 3 (GAMMA CAL3)AT1G47260 mitochondrial gamma carbonic anhydrase 1
AT5G50850 pyruvate dehydrogenase (acetyl-transferring) E1 subunit
AT1G80230 cytochrome c oxidase family protein subunit Vb
AT1G51980 mitochondrial processing peptidase alpha subunit 1
AT5G47030 ATP synthase delta chain
AT4G13850 glycine-rich RNA-binding protein 2 (GRP2) *AT5G50370 adenylate kinase *
AT4G02580 NADH-ubiquinone oxidoreductase 24 kDa subunit
AT5G23250 succinyl-CoA ligase (GDP-forming) alpha-chain
AT5G37510 EMB1467 NADH dehydrogenase
AT4G39690 unknown protein
AT3G17240 lipoamide dehydrogenase precursor 2 (LPD2)AT3G20000 Translocase of outer mitochondrial membrane 40 (TOM40-1)
AT1G47420 uncharacterized carbonate dehydratase AT1G59900 pyruvate dehydrogenase E1 subunit alpha
AT3G15640 cytochrome c oxidase family protein subunit VbAT3G01280 porin 1
AT5G13450 ATP synthase delta (OSCP) subunit
AT3G48680 gamma carbonic anhydrase 2 (GAMMA CAL2)AT3G52300 ATP synthase subunit d (ATPQ)
AT5G63510 gamma carbonic anhydrase 1 (GAMMA CAL1)AT5G14590 NADP isocitrate dehydrogenase
AT4G26970 aconitate dehydratase 3
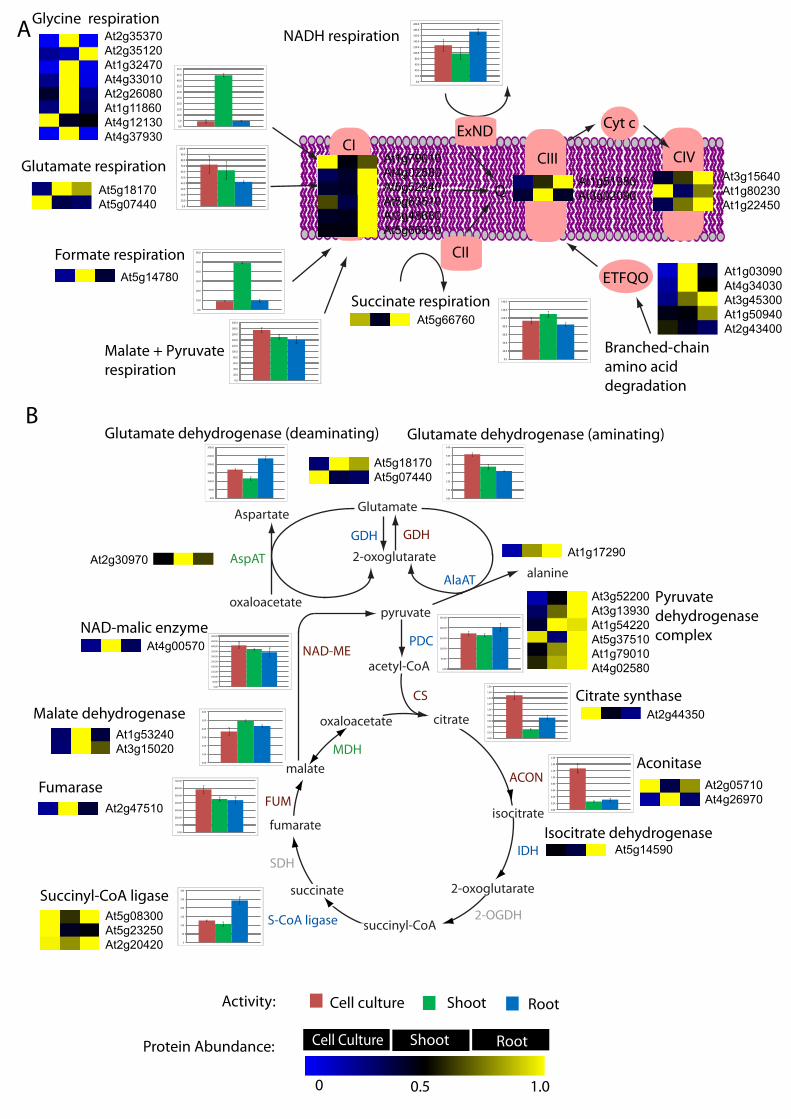
0.00
0.20
0.40
0.60
0.80
1.00
1.20
1.40
1.60
Aconitase
0.00
0.20
0.40
0.60
0.80
1.00
1.20
1.40
1.60
1.80
Citrate synthase
0.00
50.00
100.00
150.00
200.00
250.00
Pyruvate dehydrogenasecomplex
0.00
100.00
200.00
300.00
400.00
500.00
600.00
700.00
Fumarase
0
50
100
150
200
250
300
Succinyl-CoA ligase
0.00
1.00
2.00
3.00
4.00
5.00
6.00Malate dehydrogenase
Cell culture Shoot Root
Glutamate dehydrogenase (aminating)Glutamate dehydrogenase (deaminating)
0.00
1.00
2.00
3.00
4.00
5.00
6.00
0.00
50.00
100.00
150.00
200.00
250.00
300.00
350.00
400.00
450.00
500.00
NAD-malic enzyme
0.00
50.00
100.00
150.00
200.00
250.00
300.00
0.0
10.0
20.0
30.0
40.0
50.0
60.0
70.0
80.0
90.0
100.0
Glutamate respiration
0.0
20.0
40.0
60.0
80.0
100.0
120.0
140.0
160.0
180.0
200.0
NADH respiration
0.0
5.0
10.0
15.0
20.0
25.0
30.0
35.0
40.0
45.0
50.0
Glycine respiration
0.0
10.0
20.0
30.0
40.0
50.0
60.0Formate respiration
0.0
20.0
40.0
60.0
80.0
100.0
120.0
140.0
160.0
180.0
200.0
Malate + Pyruvaterespiration
0.0
20.0
40.0
60.0
80.0
100.0
120.0
140.0Succinate respiration
citrate
isocitrate
2-oxoglutarate
succinyl-CoA
oxaloacetate
malate
fumarate
succinate
pyruvate
acetyl-CoA
PDC
Glutamate
2-oxoglutarate alanineAlaAT
S-CoA ligase
ACON
2-OGDH
MDH
FUM
GDH
CI
CII
CIII CIV
Q
A
B
0 0.5 1.0
Activity:
Protein Abundance: Cell Culture Shoot Root
At5g18170At5g07440
At4g00570
At1g53240At3g15020
At2g47510
At5g08300At5g23250At2g20420
At5g14590
At2g05710At4g26970
At2g44350
At3g52200At3g13930At1g54220At5g37510At1g79010At4g02580
At5g66760
At1g51980At3g02090
At3g15640At1g80230At1g22450
At1g79010At4g02580At5g52840At5g63510At3g48680At5g66510
At5g14780
At5g18170At5g07440
At2g35370At2g35120At1g32470At4g33010At2g26080At1g11860At4g12130At4g37930
Isocitrate dehydrogenase
ExND
oxaloacetate
Aspartate
AspAT
CS
IDHSDH
NAD-ME
At1g17290
Cyt c
ETFQO
Branched-chain amino acid degradation
GDH
At1g03090At4g34030At3g45300At1g50940At2g43400
At2g30970
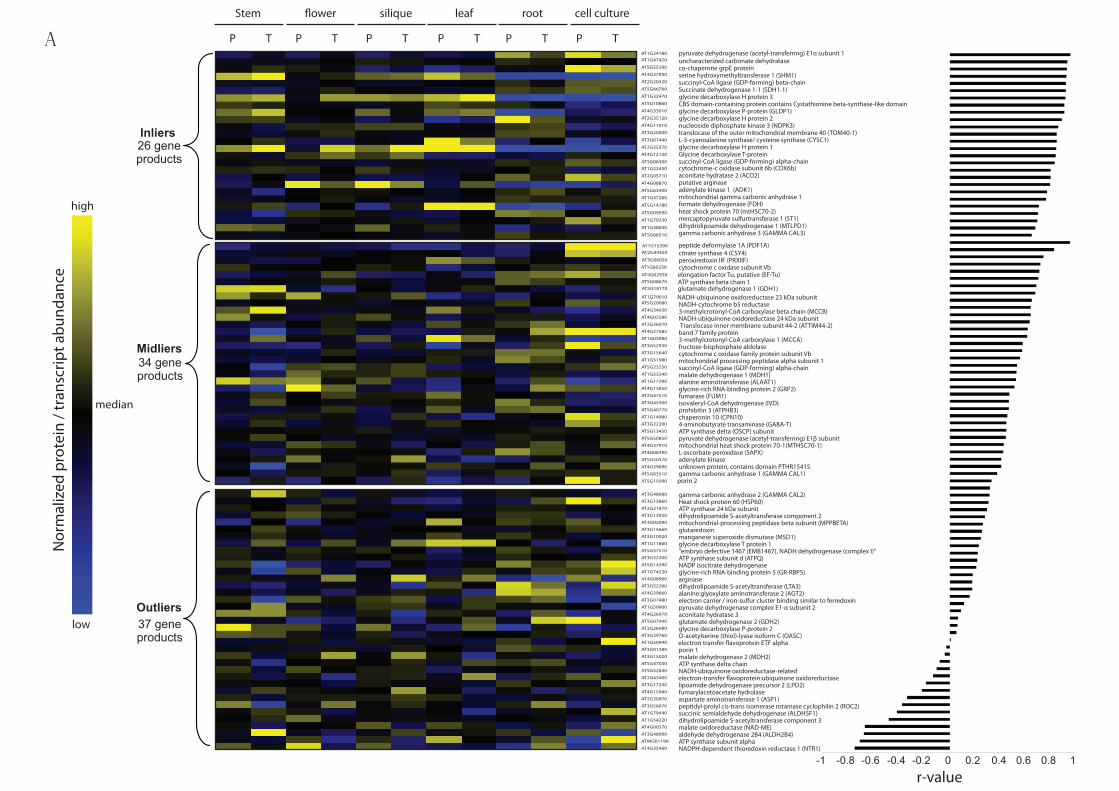
Stem cell culturesilique leaf root
P T P T P T P T P T P T
high
low
Nor
mal
ized
pro
tein
/ tr
ansc
ript a
bund
ance
median
gamma carbonic anhydrase 2 (GAMMA CAL2)Heat shock protein 60 (HSP60)ATP synthase 24 kDa subunitdihydrolipoamide S-acetyltransferase component 2mitochondrial-processing peptidase beta subunit (MPPBETA)glutaredoxinmanganese superoxide dismutase (MSD1)glycine decarboxylase T protein 1"embryo defective 1467 (EMB1467), NADH dehydrogenase (complex I)"ATP synthase subunit d (ATPQ)NADP isocitrate dehydrogenaseglycine-rich RNA-binding protein 5 (GR-RBP5)arginasedihydrolipoamide S-acetyltransferase (LTA3)alanine:glyoxylate aminotransferase 2 (AGT2)electron carrier / iron-sulfur cluster binding similar to ferredoxinpyruvate dehydrogenase complex E1-α subunit 2aconitate hydratase 3glutamate dehydrogenase 2 (GDH2)glycine decarboxylase P-protein 2O-acetylserine (thiol)-lyase isoform C (OASC)
porin 1malate dehydrogenase 2 (MDH2)ATP synthase delta chainNADH-ubiquinone oxidoreductase-related
lipoamide dehydrogenase precursor 2 (LPD2)fumarylacetoacetate hydrolaseaspartate aminotransferase 1 (ASP1)peptidyl-prolyl cis-trans isomerase rotamase cyclophilin 2 (ROC2)succinic semialdehyde dehydrogenase (ALDH5F1)dihydrolipoamide S-acetyltransferase component 3malate oxidoreductase (NAD-ME)aldehyde dehydrogenase 2B4 (ALDH2B4)ATP synthase subunit alphaNADPH-dependent thioredoxin reductase 1 (NTR1)
Outliers
Inliers
37 gene products
26 gene products
pyruvate dehydrogenase (acetyl-transferring) E1α subunit 1
peptide deformylase 1A (PDF1A)
uncharacterized carbonate dehydrataseco-chaperone grpE proteinserine hydroxymethyltransferase 1 (SHM1)succinyl-CoA ligase (GDP-forming) beta-chainSuccinate dehydrogenase 1-1 (SDH1-1)glycine decarboxylase H protein 3CBS domain-containing protein contains Cystathionine beta-synthase-like domainglycine decarboxylase P-protein (GLDP1)glycine decarboxylase H protein 2nucleoside diphosphate kinase 3 (NDPK3)translocase of the outer mitochondrial membrane 40 (TOM40-1)L-3-cyanoalanine synthase/ cysteine synthase (CYSC1)glycine decarboxylase H protein 1Glycine decarboxylase T-proteinsuccinyl-CoA ligase (GDP-forming) alpha-chain
citrate synthase 4 (CSY4)
cytochrome-c oxidase subunit 6b (COX6b)aconitate hydratase 2 (ACO2)putative arginaseadenylate kinase 1 (ADK1)mitochondrial gamma carbonic anhydrase 1
peroxiredoxin IIF (PRXIIF)cytochrome c oxidase subunit Vbelongation factor Tu, putative (EF-Tu)
formate dehydrogenase (FDH)
ATP synthase beta chain 1
heat shock protein 70 (mtHSC70-2)mercaptopyruvate sulfurtransferase 1 (ST1)
glutamate dehydrogenase 1 (GDH1)NADH-ubiquinone oxidoreductase 23 kDa subunit
dihydrolipoamide dehydrogenase 1 (MTLPD1)gamma carbonic anhydrase 3 (GAMMA CAL3)
NADH-cytochrome b5 reductase3-methylcrotonyl-CoA carboxylase beta chain (MCCB)NADH-ubiquinone oxidoreductase 24 kDa subunit Translocase inner membrane subunit 44-2 (ATTIM44-2)band 7 family protein3-methylcrotonyl-CoA carboxylase 1 (MCCA)fructose-bisphosphate aldolasecytochrome c oxidase family protein subunit Vbmitochondrial processing peptidase alpha subunit 1succinyl-CoA ligase (GDP-forming) alpha-chainmalate dehydrogenase 1 (MDH1)alanine aminotransferase (ALAAT1)glycine-rich RNA-binding protein 2 (GRP2)fumarase (FUM1)isovaleryl-CoA dehydrogenase (IVD)prohibitin 3 (ATPHB3)chaperonin 10 (CPN10)4-aminobutyrate transaminase (GABA-T)ATP synthase delta (OSCP) subunitpyruvate dehydrogenase (acetyl-transferring) E1β subunitmitochondrial heat shock protein 70-1(MTHSC70-1)L-ascorbate peroxidase (SAPX)adenylate kinaseunknown protein, contains domain PTHR15415gamma carbonic anhydrase 1 (GAMMA CAL1)
porin 2
Midliers34 gene products
r-value-1 10.80.60.40.20-0.2-0.8 -0.6 -0.4
AT1G24180
AT1G15390
AT1G47420
AT5G55200
AT4G37930
AT2G20420
AT5G66760
AT1G32470
AT5G10860
AT4G33010
AT2G35120
AT4G11010
AT3G20000
AT3G61440
AT2G35370
AT4G12130
AT5G08300
AT2G44350
AT1G22450
AT2G05710
AT4G08870
AT5G63400
AT1G47260
AT3G06050
AT1G80230
AT4G02930
AT5G14780
AT5G08670
AT5G09590
AT1G79230
AT5G18170
AT1G79010
AT1G48030
AT5G66510
AT5G20080
AT4G34030
AT4G02580
AT2G36070
AT4G27585
AT1G03090
AT3G52930
AT3G15640
AT1G51980
AT5G23250
AT1G53240
AT1G17290
AT4G13850
AT2G47510
AT3G45300
AT5G40770
AT1G14980
AT3G22200
AT5G13450
AT5G50850
AT4G37910
AT4G08390
AT5G50370
AT4G39690
AT5G63510
AT5G15090
AT3G48680
AT3G13860
AT2G21870
AT3G13930
AT3G02090
AT3G15660
AT3G10920
AT1G11860
AT5G37510
AT3G52300
AT5G14590
AT1G74230
AT4G08900
AT3G52200
AT4G39660
AT3G07480
AT1G59900
AT4G26970
AT5G07440
AT2G26080
AT3G59760
AT1G50940
AT3G01280
AT3G15020
AT5G47030
AT5G52840
AT2G43400
AT3G17240
AT4G15940
AT2G30970
AT3G56070
AT1G79440
AT1G54220
AT4G00570
AT3G48000
ATMG01190
AT4G35460
A
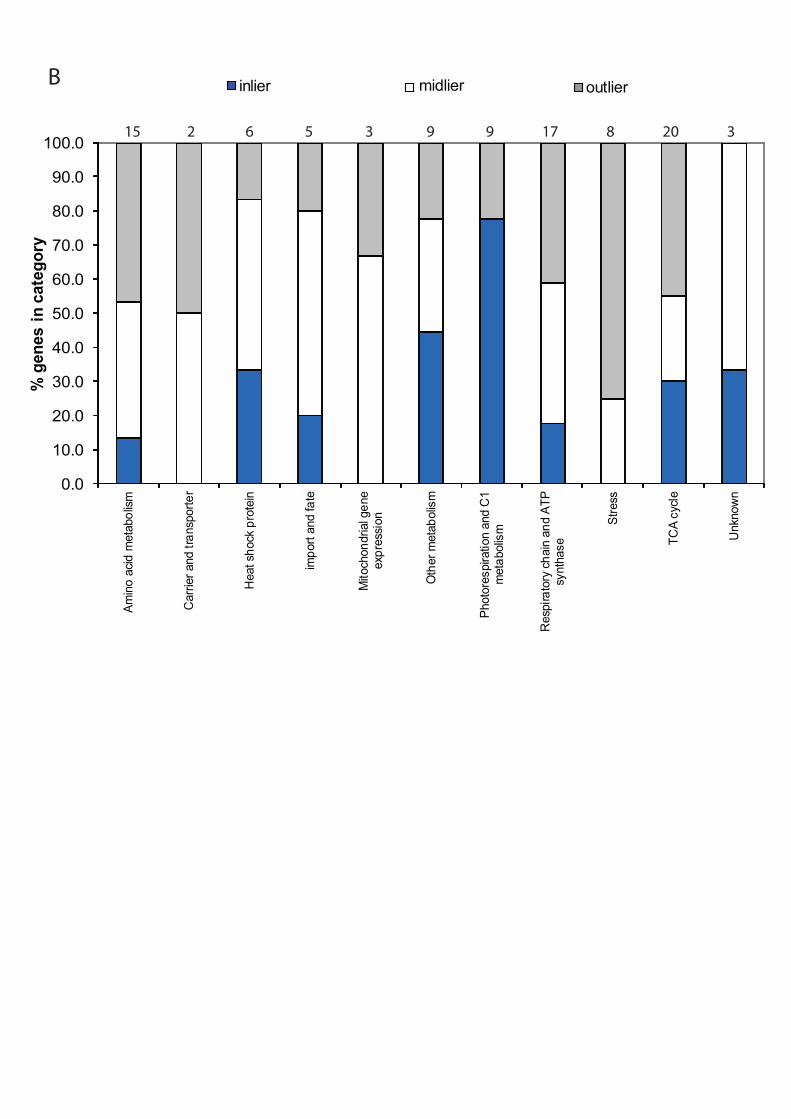
inlier midlier outlier
15 2 6 5 3 9 9 17 8 20 3
0.0
10.0
20.0
30.0
40.0
50.0
60.0
70.0
80.0
90.0
100.0Am
ino
acid
met
abol
ism
Car
rier a
nd tr
ansp
orte
r
Hea
t sho
ck p
rote
in
impo
rt an
d fa
te
Mito
chon
dria
l gen
eex
pres
sion
Oth
er m
etab
olis
m
Phot
ores
pira
tion
and
C1
met
abol
ism
Res
pira
tory
cha
in a
nd A
TPsy
ntha
se
Stre
ss
TCA
cycl
e
Unk
now
n
% g
enes
in c
ateg
ory
B
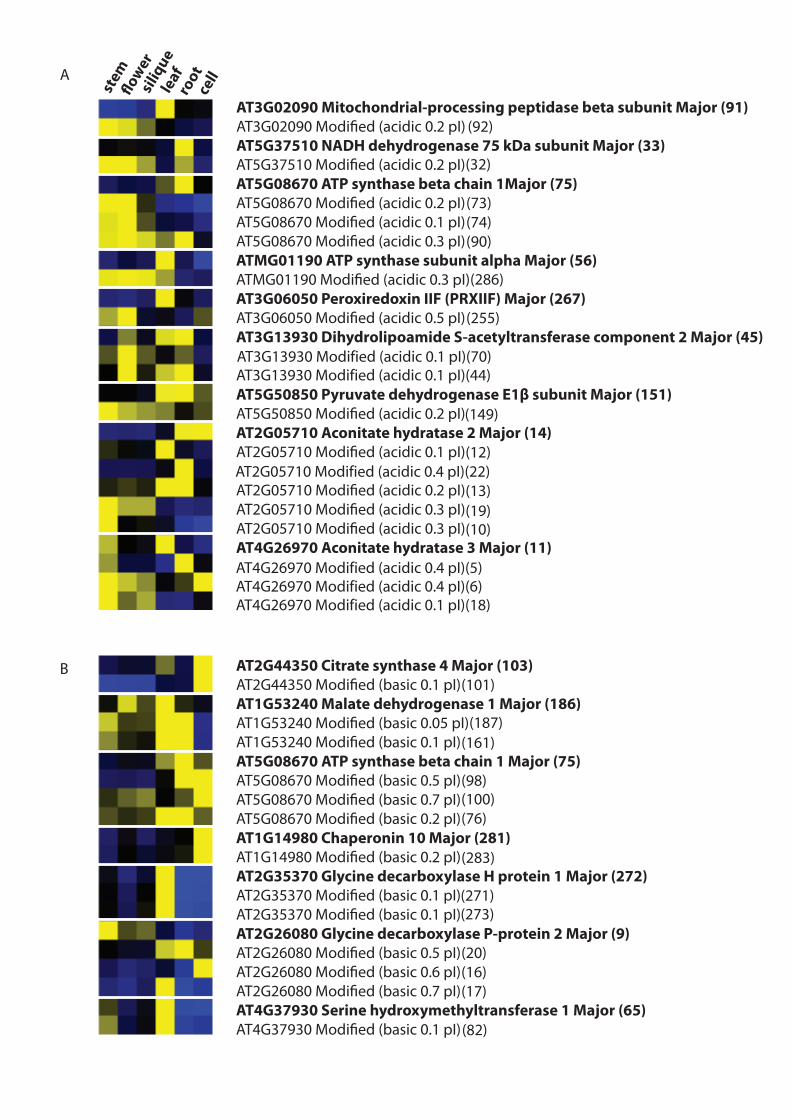
AT4G26970 Modified (acidic 0.1 pI)(18)AT4G26970 Modified (acidic 0.4 pI)(6)AT4G26970 Modified (acidic 0.4 pI)(5)
AT2G05710 Modified (acidic 0.4 pI)(22)
AT3G13930 Modified (acidic 0.1 pI)(44) AT3G13930 Modified (acidic 0.1 pI)(70)
AT3G02090 Mitochondrial-processing peptidase beta subunit Major (91)
AT5G37510 NADH dehydrogenase 75 kDa subunit Major (33)
AT5G08670 ATP synthase beta chain 1Major (75)
ATMG01190 ATP synthase subunit alpha Major (56)
AT3G06050 Peroxiredoxin IIF (PRXIIF) Major (267)
AT3G13930 Dihydrolipoamide S-acetyltransferase component 2 Major (45)
AT5G50850 Pyruvate dehydrogenase E1β subunit Major (151)
AT2G05710 Aconitate hydratase 2 Major (14)
AT4G26970 Aconitate hydratase 3 Major (11)
AT2G44350 Citrate synthase 4 Major (103)
AT1G53240 Malate dehydrogenase 1 Major (186)
AT5G08670 ATP synthase beta chain 1 Major (75)
AT1G14980 Chaperonin 10 Major (281)
AT2G35370 Glycine decarboxylase H protein 1 Major (272)
AT2G26080 Glycine decarboxylase P-protein 2 Major (9)
AT4G37930 Serine hydroxymethyltransferase 1 Major (65)
A
B
(92)
(32)
(73) (74) (90)
(286)
(255)
(149)
(12)
(19)(10)
(13)
(101)
(161)(187)
(98)(100)(76)
(283)
(271)(273)
(20)(16)(17)
(82)
stem
siliq
uero
ot
leaf
cell
�ower
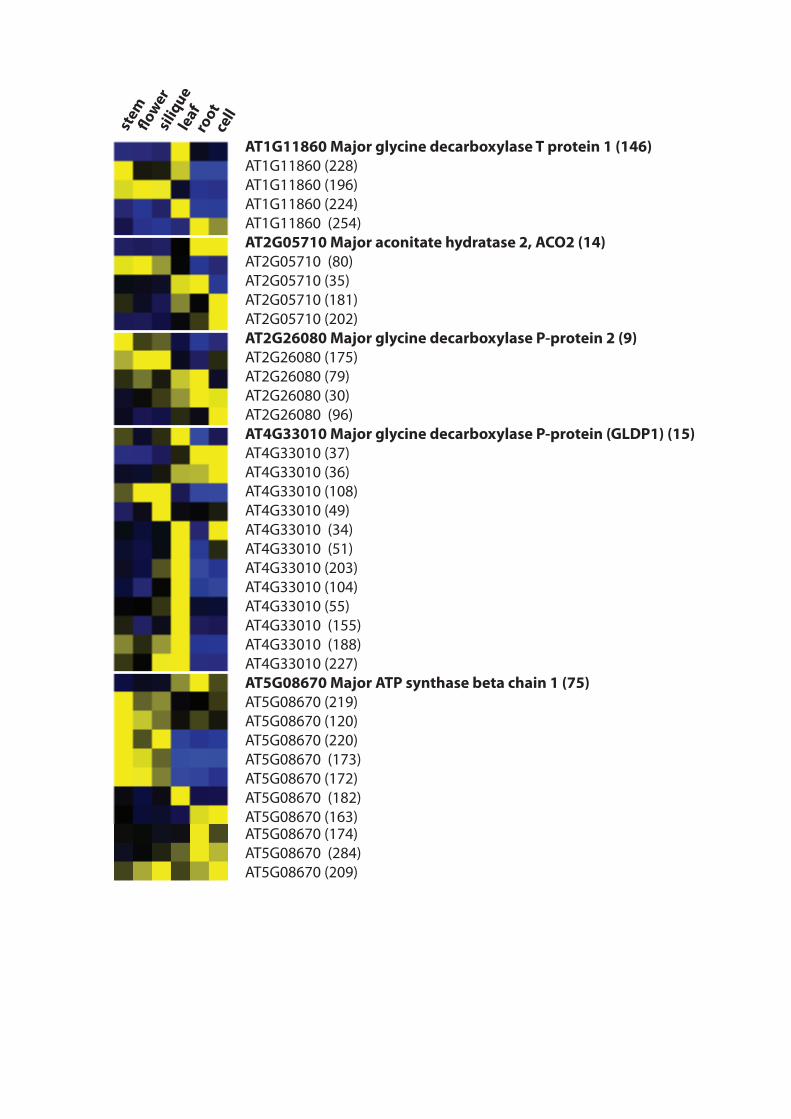
AT1G11860 Major glycine decarboxylase T protein 1 (146)AT1G11860 (228)AT1G11860 (196)AT1G11860 (224)AT1G11860 (254)AT2G05710 Major aconitate hydratase 2, ACO2 (14)AT2G05710 (80)AT2G05710 (35)AT2G05710 (181)AT2G05710 (202)AT2G26080 Major glycine decarboxylase P-protein 2 (9)AT2G26080 (175)AT2G26080 (79)AT2G26080 (30)AT2G26080 (96)AT4G33010 Major glycine decarboxylase P-protein (GLDP1) (15)AT4G33010 (37)AT4G33010 (36)AT4G33010 (108)AT4G33010 (49)AT4G33010 (34)AT4G33010 (51)AT4G33010 (203)AT4G33010 (104)AT4G33010 (55)AT4G33010 (155)AT4G33010 (188)AT4G33010 (227)AT5G08670 Major ATP synthase beta chain 1 (75)AT5G08670 (219)AT5G08670 (120)AT5G08670 (220)AT5G08670 (173)AT5G08670 (172)AT5G08670 (182)AT5G08670 (163)AT5G08670 (174)AT5G08670 (284)AT5G08670 (209)
stem
siliq
uero
ot
leaf
cell
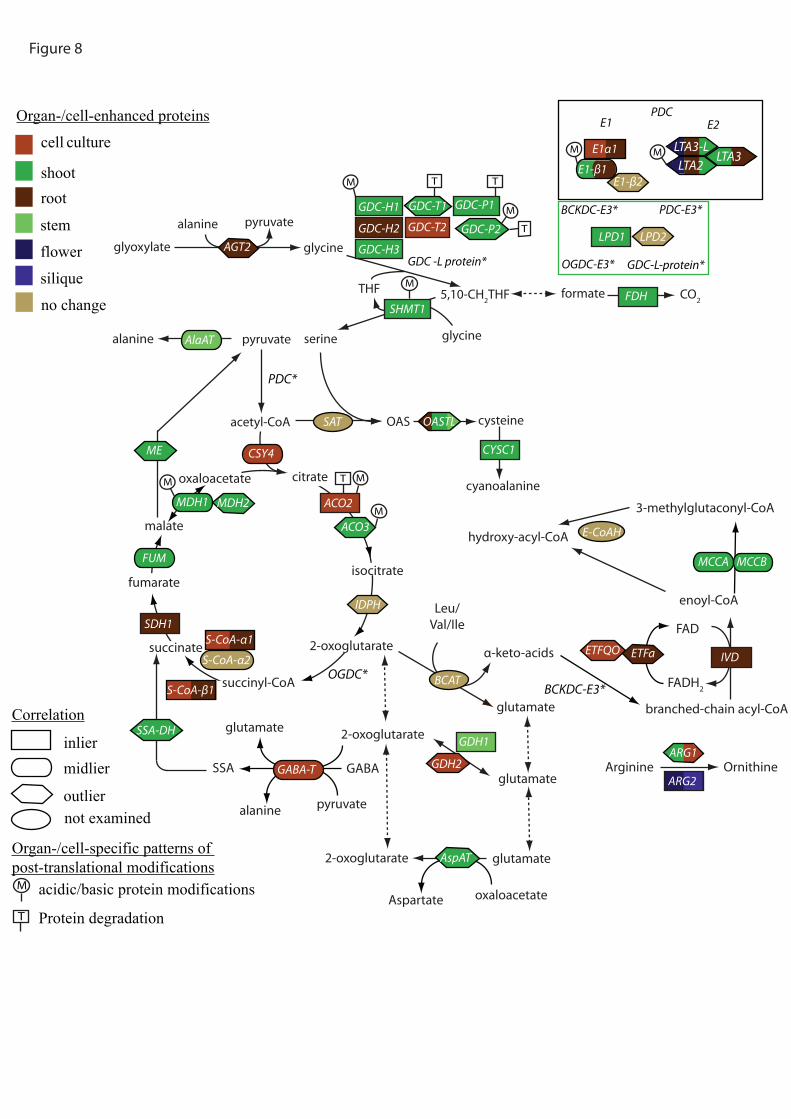
glycinepyruvate
acetyl-CoA
glycine
5,10-CH2THF
serine
THF
OAS cysteine
cyanoalanine
formate CO2
pyruvate
glyoxylate
alanine
citrate
isocitrate
2-oxoglutarate
succinyl-CoA
oxaloacetate
malate
fumarate
succinate
Aspartate
alanine
oxaloacetate
glutamate
Leu/Val/Ile
GABASSA
2-oxoglutarate glutamate
α-keto-acids
glutamate
pyruvatealanine
branched-chain acyl-CoA
enoyl-CoA
FAD
FADH2
hydroxy-acyl-CoA
3-methylglutaconyl-CoA
glutamate2-oxoglutarate
FDHSHMT1
OASTL
CYSC1
ACO2
ETFQO
GDH1
IVD
SDH1
PDC*
BCKDC-E3*OGDC*
Arginine OrnithineARG1
ARG2
AGT2
AlaAT
ME
SAT
CSY4
MDH1 MDH2
ACO3
BCAT
E-CoAH
FUM
SSA-DH
GABA-T GDH2
AspAT
ETFa
MCCA MCCB
IDPH
PDC
BCKDC-E3*
OGDC-E3*
S-CoA-α2
S-CoA-α1
S-CoA-β1
LTA3-LLTA2
L-protein*
E1
GDC -L protein*
LTA3
E2
GDC-
E1α1
E1-β1E1-β2
PDC-E3*
LPD1 LPD2GDC-H3
GDC-P1
GDC-H2
GDC-H1
GDC-T2
GDC-T1
GDC-P2
M
M
M
M M
M M
M
T T
T
T
shootroot
cell
flower
silique
stem
no change
Organ-/cell-enhanced proteins
inliermidlier
outliernot examined
Correlation
acidic/basic protein modifications
Organ-/cell-specific patterns of post-translational modifications
Protein degradationT
M
culture
Figure 8
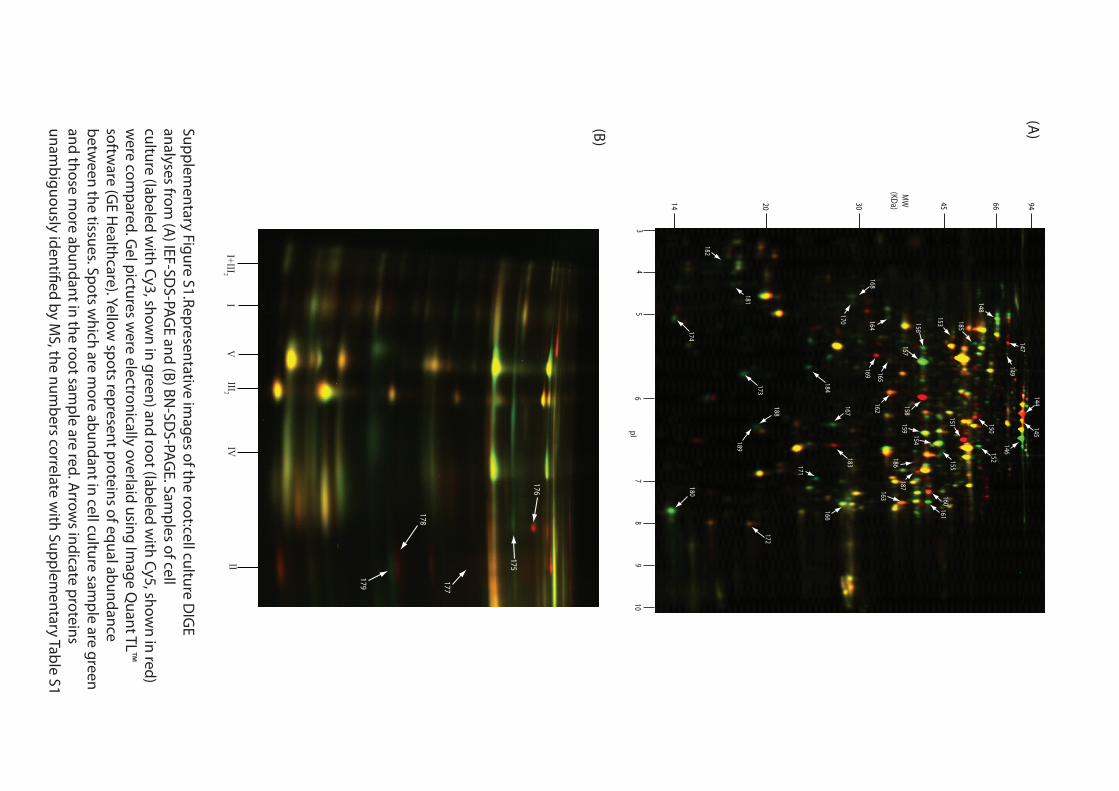
Supplementary Figure S1.Representative im
ages of the root:cell culture DIG
Eanalyses from
(A) IEF-SD
S-PAGE and (B) BN
-SDS-PAG
E. Samples of cell
culture (labeled with Cy3, show
n in green) and root (labeled with Cy5, show
n in red)w
ere compared. G
el pictures were electronically overlaid using Im
age Quant TL™
software (G
E Healthcare). Yellow
spots represent proteins of equal abundancebetw
een the tissues. Spots which are m
ore abundant in cell culture sample are green
and those more abundant in the root sam
ple are red. Arrow
s indicate proteins
(A)(B
)
34
56
78
910
946645302014
pI
MW
(KDa)
144145
146
147
148
149
150
151
152
153
154
155
156
157158
159
160161
162163
164165
166
167
168169
170
171
172173
174180
181
182
183
184
185
186187
188
189
I+III2I
VIII2
IVII
179
176
177
178
175

Su
pp
lemen
tary
Fig
ure S
2. A
Coom
assie
-stain
ed
prep
ara
tive g
el show
ing a
ll the
mito
cho
nd
rial p
rotein
s that a
re presen
t in a
ll six p
lan
t org
an
s an
aly
sed in
this stu
dy.
Equal am
ount o
f pro
teins fro
m all m
itoch
ondrial sam
ples an
d rep
licates purified
from
Perco
ll TM
grad
ient cen
trifugatio
ns w
ere com
bin
ed an
d sep
arated b
y 2
D-g
el electrophoresis.
Arro
ws in
dicate p
rotein
s iden
tified b
y M
AL
DI-T
OF
/TO
F, th
e num
bers co
rrelate with
Su
pp
lemen
tary
Tab
le S3.
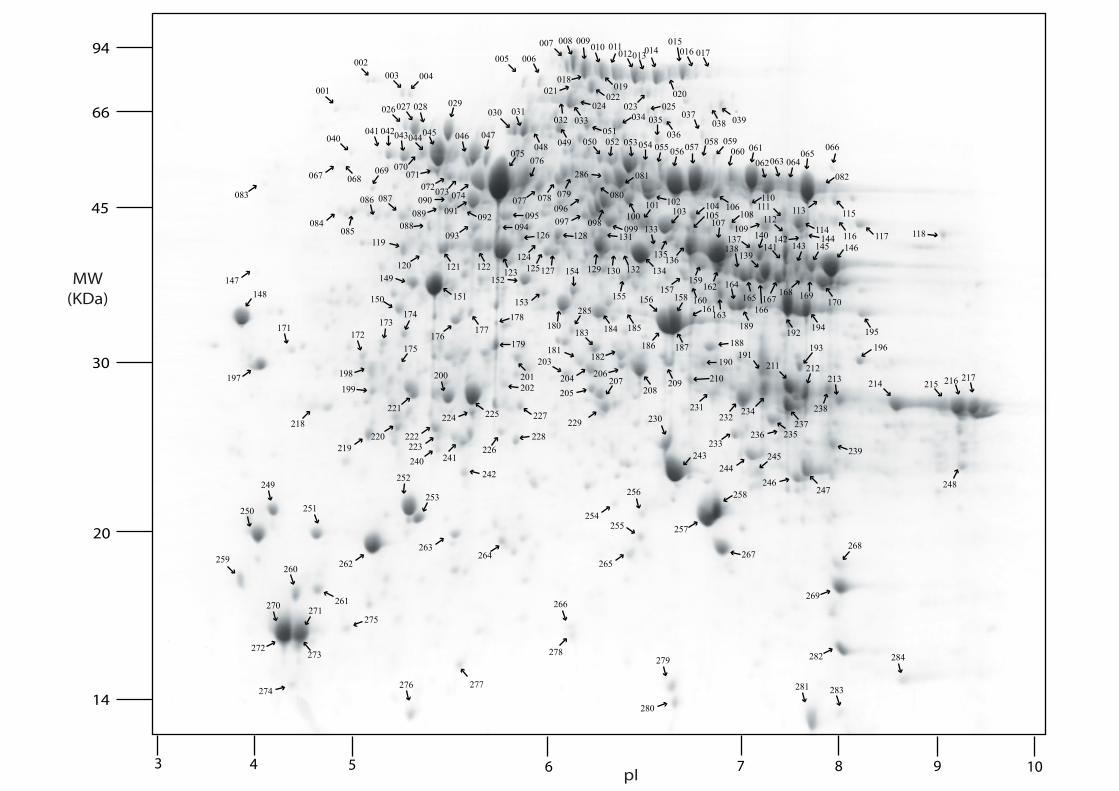
3 4 5 6 7 8 9 10
94
66
45
30
20
14
pI
MW(KDa)
007 008 009
018
010 011
019
012013014
020
015016 017
001
002003 004
026027 028
044
029
041 042043 045
071072073
046 047
074
075
091086 087
088
120 121 122
094
150
176177
178
179
089090
172173
198
175
199200 201
202
171
241226
227
242
253249
250
259
270
272
271
273
275
276
260
224218
264
266
278279
280
281 283
282
269
268
284
267
258
257
256
243
246247
245
236
230
180
130
205
203181
183
208
231232
237
211 212213 214 215 216 217
248
186 187
156 158161
129
155
134
157159
163189
164
153
154
184 185 192 194 195
127
048
032 033024
021022
034023
036038 039
078 079
097
050 052 053054 055 057 061
062063 064065
066
082
080
098099
101103
136
104102100
081
106
107108
109 114
111
140146
170
145
169
143
168
083
124
040
067 068069
084085
147148
197
149
151
119
174
221 225
228
263
251
261
262
252
219220 222
223240
255
265
254
229
207206
182
204
152123
093
095
076
096
128
077
030 031
005 006
049051
056
135
162165
139
167
141
112
166
113 115
116 117 118138
142 144
191
234
193 196
238
239
235233
244
188
190
210
105
070
092
274277
125
131
132
133126
209
160
035025
058 059060
037
110
137
285
286
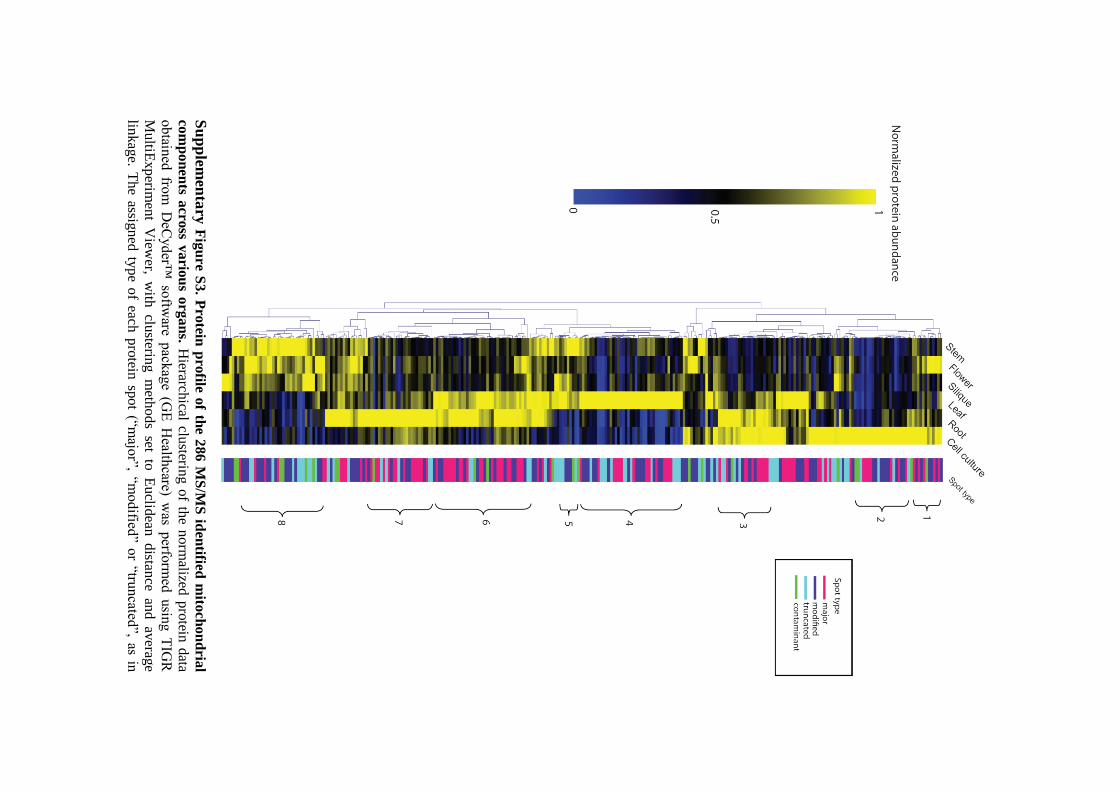
S
up
plem
enta
ry F
igu
re S3
. Pro
tein p
rofile o
f the 2
86
MS
/MS
iden
tified m
itoch
on
dria
l
com
pon
ents a
cross v
ario
us o
rga
ns. H
ierarchical clu
stering o
f the n
orm
alized p
rotein
data
obtain
ed fro
m D
eCyd
er™ so
ftware p
ackag
e (GE
Health
care) was p
erform
ed usin
g T
IGR
MultiE
xperim
ent
View
er, w
ith clu
stering m
ethods
set to
E
uclid
ean distan
ce an
d av
erage
linkag
e. Th
e assign
ed ty
pe o
f each p
rotein
spot (“m
ajor”, “m
odified
” or “tru
ncated
”, as in
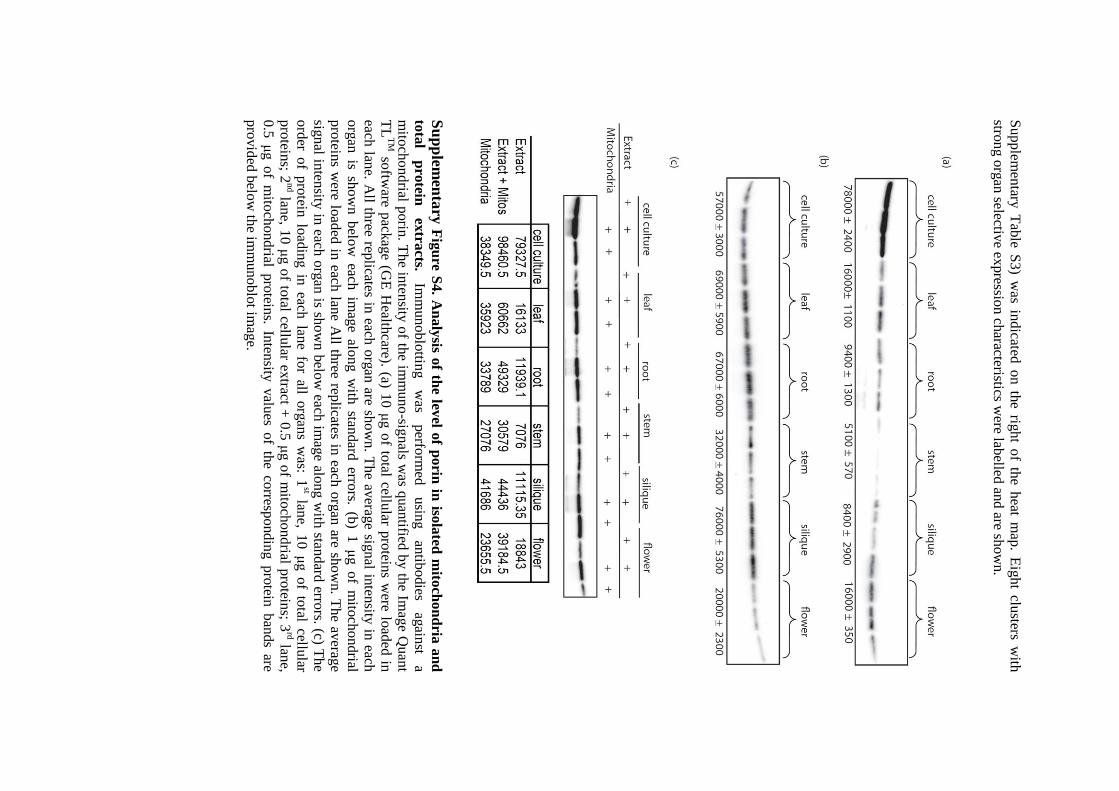
Supplem
entary
Tab
le S3
) was in
dicated
on th
e right o
f the h
eat map
. Eig
ht clu
sters with
strong o
rgan
selective ex
pressio
n ch
aracteristics were lab
elled an
d are sh
ow
n.
S
up
plem
enta
ry F
igu
re S4. A
na
lysis o
f the lev
el of p
orin
in iso
lated
mito
chon
dria
an
d
tota
l p
rotein
ex
tracts.
Imm
un
ob
lottin
g
was
perfo
rmed
usin
g
antib
odies
again
st a
mito
chon
drial p
orin
. Th
e inten
sity o
f the im
muno
-signals w
as quan
tified b
y th
e Imag
e Quan
t
TL
TM
softw
are pack
age (G
E H
ealthcare). (a) 1
0 μ
g o
f total cellu
lar pro
teins w
ere load
ed in
each lan
e. All th
ree replicates in
each o
rgan
are show
n. T
he av
erage sig
nal in
tensity
in each
org
an is
sho
wn b
elow
each
im
age
along w
ith stan
dard
errors.
(b)
1 μ
g of
mito
chondrial
pro
teins w
ere load
ed in
each lan
e A
ll three rep
licates in each
org
an are sh
ow
n. T
he av
erage
signal in
tensity
in each
org
an is sh
ow
n b
elow
each im
age alo
ng w
ith stan
dard
errors. (c) T
he
ord
er of p
rotein
load
ing in
each lan
e for all o
rgan
s was: 1
st lane, 1
0 μ
g o
f total cellu
lar
pro
teins; 2
nd lan
e, 10
μg o
f total cellu
lar extract +
0.5
μg o
f mito
chondrial p
rotein
s; 3rd lan
e,
0.5
μg o
f mito
cho
nd
rial pro
teins. In
tensity
valu
es of th
e corresp
ondin
g p
rotein
ban
ds are
pro
vid
ed b
elow
the im
mu
no
blo
t imag
e.